Submitted:
06 March 2026
Posted:
09 March 2026
You are already at the latest version
Abstract
Hypochlorous acid (HClO) is widely used as a low-cost and effective disinfectant; however, its instability under heat and light necessitates simple and reliable monitoring methods. Herein, we report a morphology-evolving thin-film colorimetric sensor that enables intuitive visual detection of HClO through simultaneous color and pattern transitions. The sensor integrates two polymer films with distinct charge-state response behaviors, patterned into X-shaped and circular geometries on a single substrate. Upon exposure to HClO, chlorine-induced modification of amide and amine groups alters the surface charge states, thereby switching the adsorption preference for anionic and cationic dyes. This mechanism results in a pronounced transformation from a blue X-shaped motif to a red circular pattern, enabling direct visual discrimination of HClO concentrations. Quantitative analysis of RGB values and diffuse-reflectance UV–vis spectra confirmed semi-quantitative detection in the sub-millimolar to low millimolar range. The sensor further demonstrated practical applicability by tracking photodecomposition of a commercial disinfectant. This work demonstrates pattern-coupled colorimetric sensing as a straightforward, user-friendly approach for HClO monitoring.
Keywords:
hypochlorous acid
; hypochlorite
; thin film
; colorimetric
; pattern change
; dye
1. Introduction
The COVID-19 pandemic has heightened global awareness of the risks posed by infectious diseases. Even in the post-pandemic era, the importance of preparedness against a broad range of viral and bacterial infections remains widely recognized. Disinfection of potentially contaminated surfaces—such as hands, doorknobs, and tabletops—is among the most effective measures for interrupting transmission pathways [1]. Hypochlorous acid and hypochlorite (HClO) have been reported to exhibit potent antiviral and antimicrobial activity against diverse viruses and bacteria [2,3,4,5]. Because HClO can be generated simply through the electrolysis of sodium chloride, it represents a low-cost and scalable alternative to conventional alcohol-based disinfectants [6]. Additional advantages include its low allergenicity and its efficacy against alcohol-resistant pathogens such as norovirus [7,8]. However, HClO readily decomposes, particularly at elevated temperatures and upon light exposure, necessitating regular monitoring of its concentration to ensure disinfection efficacy [9,10].
In household settings, HClO concentration is commonly measured using test strips based on the DPD method, in which N,N-diethyl-p-phenylenediamine (DPD) is oxidized to produce a characteristic pink coloration [11]. While widely used, the DPD method has a significant limitation: subtle changes in color intensity are difficult to distinguish visually. The reaction product is typically a pale pink hue, and the incremental differences between concentration levels are often ambiguous, especially in turbid samples or for users with color-vision deficiencies [12]. Moreover, the DPD method is vulnerable to interference from other oxidizing agents, potentially resulting in false-positive readings [13]. The reagent itself also undergoes degradation upon exposure to oxygen, light, or humidity, requiring careful handling and storage to maintain accuracy [14]. These drawbacks highlight the need for alternative sensing strategies that provide clear, easily interpretable color changes without relying on enzyme-based reactions.
Our research group previously developed thin-film-based colorimetric sensing platforms that exhibit exceptionally clear color transitions [15,16,17,18,19,20]. More recently, we have developed a method for conjugating lactic acid-responsive polymers to cotton fabric using photomasks and stencils of various shapes, and have succeeded in creating a fabric sensor that allows changes in the pattern to be visually and intuitively observed [21]. These systems operate through a straightforward mechanism: reaction with a target analyte alters the charge state of the polymer, which in turn modulates the adsorption of ionic dyes on the film surface. The fabrication process is simple, does not require complex organic syntheses, and offers broad freedom in the selection of dyes. We hypothesized that this sensing principle could be adapted for HClO detection. Furthermore, we anticipated that patterning two thin-film chemistries with different charge-state response behaviors—each in a distinct geometric motif on the same substrate and each selectively stained with a different dye—would enable simultaneous color and pattern changes upon exposure to HClO.
Colorimetric sensors based solely on color intensity changes are generally suitable for quantitative measurements, as their responses can be readily digitized through spectroscopic or image-based analysis. However, such systems typically require strictly controlled illumination conditions to maintain accuracy, since variability in lighting represents a major source of measurement error in AI-based visual sensing [22]. Under fluctuating illumination, quantitative reliability can deteriorate significantly. In contrast, sensors that exhibit both color and pattern changes provide enhanced visual detectability and user accessibility, as pattern recognition relies primarily on geometric and contrast-based features rather than absolute spectral information [23]. Consequently, color–pattern dual-mode sensors are inherently more robust against illumination variations and may offer greater reliability in practical, real-world environments, whereas color-only sensors remain advantageous for precise quantification under well-controlled conditions.
In this work, we present a dual-mode colorimetric sensor for HClO that achieves simultaneous color and pattern transitions by integrating two differently responsive polymer films patterned on a single substrate. This design provides naked-eye readout with improved robustness against illumination variations, while still allowing semi-quantitative analysis via RGB or spectroscopic methods.
2. Materials and Methods
2.1. Reagents and Materials
The chemical structures of the monomers and anionic dyes are presented in Scheme 1 and Scheme 2, respectively. The primary amine monomer (N-(3-aminopropyl)methacrylamide hydrochloride, 1), acrylamide (2), crosslinker (N,N’-methylenebisacrylamide, 4), initiator (2,2'-Azobis(2-methylpropionamidine) dihydrochloride, AAPH), Dimethyl sulfoxide (DMSO), and sodium hypochlorite pentahydrate (NaClO·5H2O) were purchased from FUJIFILM Wako Pure Chemicals (Osaka, Japan). N,N-dimethylacrylamide (3), Fastgreen FCF (FG), and Safranin T (SF) were purchased from Tokyo Chemical Industry (Tokyo, Japan). The reagents for preparing the buffer solutions [2-{4-(2-hydroxyethyl)-1-piperazinyl}ethanesulfonic acid (HEPES)] were purchased from Dojindo Laboratories (Kumamoto, Japan). All chemicals were purchased as reagent grade and used as received, without further purification. A slide glass (MAS coat, SMAS-01) was obtained from Matsunami Glass Industry (Osaka, Japan). The surface of the slide is modified with hydrophilic amino groups.
2.2. Fabrication of Hypochlorous Acid-Responsive Thin Films
An outline of the sample preparation process is illustrated in Scheme 3. Two monomer solutions were prepared with compositions listed in Table 1. As the first step, the monomer solution for circular pattern was poured onto the surface of the slide glass using a micropipette (80 μL) and covered with an acrylic plate. Polymerization was conducted by irradiating the sandwiched monomer solution with UV light (365 nm) using a handy UV lamp LUV-6 (AS ONE, Japan) equipped with a 6 W discharge tube at 20–25 °C for 1 h. To avoid oxygen interference, the procedure was conducted in a glove box under nitrogen atmosphere. After removing the acrylic plate from the slide glass, the resulting thin films were washed with water for 10 min and air-dried. As the second step, the monomer solution for X-shaped pattern was poured onto the surface of the slide glass using a micropipette (65 μL) and covered with an acrylic plate. Polymerization was carried out in the same manner as in the first step. After removing the acrylic plate from the slide glass, the resulting thin films were washed with 10 mM sodium carbonate solution and water for 10 min each, and air-dried.
2.3. Preparation of Hypochlorous Acid Solution
First, a sodium hypochlorite stock solution (ca. 100 mM) was prepared by dissolving NaClO·5H2O in water. The accurate concentration of hypochlorite in the stock solutions was determined by measuring absorbance at 292 nm (A292) of a solution diluted 100 times with water using the following equation (1):
where ε represents the molar absorptivity of hypochlorite, and a value of 357 M-1 cm-1 was used in this study [24].
[NaClO] = (A292 / ε) × 105
Subsequently, a slightly acidic hypochlorous acid (HClO) solution was prepared by neutralizing hypochlorite with 0.9 equivalent of HCl as follows. The required amount of sodium hypochlorite stock solution and 90 μL of 1 M hydrochloric acid were taken into a 10 mL volumetric flask and diluted with water. The required amount of the stock solution was adjusted so that the total concentration of HClO after dilution was 10 mM. When measuring the sensor response to HClO, this solution was diluted with water appropriately to a predetermined HClO concentration.
2.4. Response to Hypochlorous Acid
The sensor was immersed in 30 mL of aqueous solutions containing HClO (0–3 mM) at 25 °C for 10 min. Subsequently, the sensor was washed with water and air-dried. The dried sensor was then immersed in aqueous dye solutions at 25 °C for 5–60 min. The dye solution contained 20 μM FG, 200 μM SF, and 10 mM HEPES (pH 7.4). After washing with water and drying in air, sample photographs were taken and the ultraviolet-visible (UV-vis) absorption spectra of the thin films were measured by the diffuse-reflection method at normal incidence using an integrated sphere. RGB values were obtained from the sample photographs using the RGB value acquisition software “IRO-DORI [25].”
2.5. Apparatus
The aqueous solutions were prepared with purified distilled water using a Yamato WG202 system. The pH values were determined using a Metrohm 827 pH lab. The photographs of the samples were captured using a Nikon COOLPIX P310 digital camera. UV-Vis absorption spectra were obtained using a JASCO V-650 spectrophotometer equipped with an integrating sphere (ISV-722).
3. Results
3.1. Color and Pattern Changes Induced by HClO
The sensor was stained with a dye solution containing Fast Green (FG, blue) and Safranin T (SF, red) (Figure 1). Before exposure to HClO, a blue X-shaped pattern gradually emerged on the sensor surface with increasing staining time, while the circular region remained nearly colorless. After immersion in HClO solution followed by dye staining, the coloration pattern changed markedly: the blue X-shaped pattern weakened or disappeared, and a red circular pattern became visible.
To quantitatively evaluate the response, RGB values were extracted from sample photographs and plotted as a function of staining time (Figure 2). In the circular area, only minor changes in RGB values were observed prior to HClO exposure, whereas substantial decreases in the G and B values were observed after HClO treatment, corresponding to red coloration. In contrast, the X-shaped region exhibited a pronounced change in the R value before HClO exposure but showed little variation after HClO treatment. These results indicate that HClO exposure induces distinct and measurable changes in the optical properties of each patterned region.
3.2. Dependence of Sensor Response on HClO Concentration
The concentration-dependent response of the sensor to HClO was investigated (Figure 3). In the absence of HClO, only the blue X-shaped pattern was observed. As the HClO concentration increased, the X-shaped pattern gradually faded and nearly disappeared at 1 mM. Simultaneously, a red circular pattern emerged and intensified with increasing HClO concentration, becoming faintly visible even at 0.2 mM. At higher concentrations, only a dark red circular pattern remained. These clearly observable transitions enabled visual discrimination of HClO concentration.
RGB values for both patterned regions were plotted against HClO concentration (Figure 4). In the circular area, all RGB values were approximately 200 at zero HClO concentration, consistent with a nearly colorless appearance. With increasing HClO concentration, the red coloration intensified, leading to significant decreases in the G and B values. In the X-shaped region, the R value was initially low due to blue coloration, but increased progressively as the blue color faded. At sufficiently high HClO concentrations, both regions became nearly colorless or uniformly red, and RGB values approached similar magnitudes.
Diffuse-reflectance UV–vis spectra were further measured to obtain more quantitative information (Figure 5). The absorption peak around 500 nm in the circular region increased with increasing HClO concentration, whereas the peak around 630 nm in the X-shaped region decreased correspondingly. Calibration plots constructed from these absorbance values demonstrated a concentration-dependent response, indicating that HClO levels can be estimated based on optical measurements.
3.3. Monitoring Decomposition of a Commercial Disinfectant
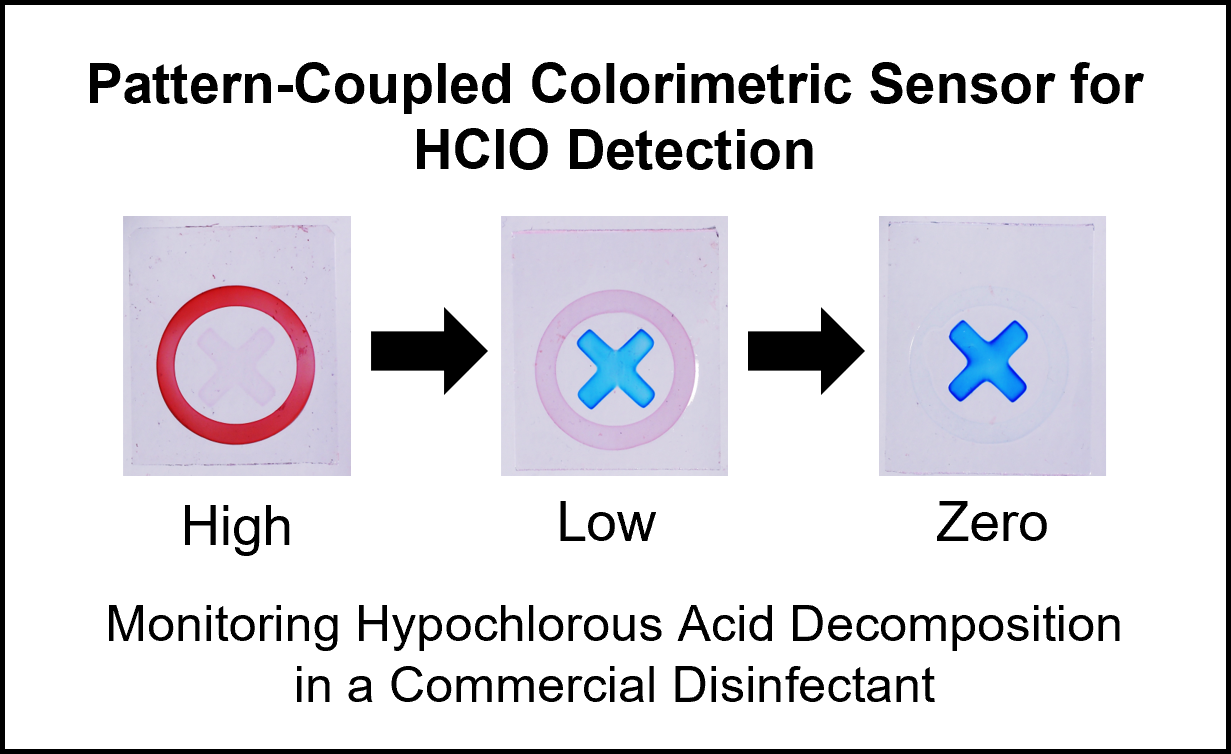
To evaluate practical applicability, the sensor was applied to a commercially available disinfectant (Figure 6). Upon exposure to the fresh disinfectant solution, a red circular pattern appeared, indicating a high HClO concentration. The disinfectant was then transferred to a transparent glass bottle and irradiated with 365 nm UV light at 25 °C under stirring to accelerate HClO decomposition.
After 24 h of UV irradiation, the red circular pattern weakened and a pale blue X-shaped pattern became visible. After 96 h, a marked blue X-shaped pattern was observed, indicating near-complete loss of HClO. According to the product label, the initial available chlorine concentration was 200 ppm (approximately 3 mM HClO), consistent with the sensor response observed in Figure 3. After 24 h, the response corresponded approximately to 0.2–0.5 mM HClO, and after 96 h the signal indicated near-zero concentration. These results demonstrate that the sensor can visually track HClO degradation in practical disinfectant samples.
4. Discussion
The observed color and pattern transitions originate from HClO-induced modulation of the surface charge states of the two polymer films (Scheme 4). The X-shaped region was fabricated using cationic monomers and is initially positively charged, enabling electrostatic adsorption of the anionic dye (FG). In contrast, the circular region was composed of neutral monomers and exhibited minimal interaction with either dye prior to HClO exposure.
Upon treatment with HClO, chemical modification of functional groups alters the charge states in each region. In the circular region (amide-rich), HClO reacts with amide groups to form N-chloramides [26,27], which exhibit markedly increased acidity [28], thereby facilitating deprotonation at neutral pH. This generates negative charges that preferentially adsorb the cationic Safranin T, resulting in red coloration. In the X-shaped region (amine/ammonium-rich), formation of chloramines reduces the basicity of the nitrogen sites [29,30,31]. This diminishes positive charge density and thereby suppressing adsorption of the anionic Fast Green FCF and leading to the loss of blue coloration.
This complementary charge-state switching mechanism enables the dual-mode response in which one pattern fades while the other emerges. Compared with conventional color-only systems, this coupled color–pattern transition enhances visual contrast and improves interpretability. Furthermore, because the sensing response involves geometric pattern inversion rather than solely intensity variation, the platform may provide improved robustness in practical imaging environments where illumination conditions are not strictly controlled.
Overall, the combination of selective charge modulation, dual-dye staining, and patterned film architecture underlies the dramatic morphology-evolving response observed in this study and supports the utility of this approach for practical HClO monitoring.
5. Conclusions
In this study, we developed a thin-film–based colorimetric sensors capable of detecting hypochlorous acid through simultaneous color and pattern transitions. By integrating two polymer films with distinct charge-state response behaviors on a single substrate and staining them with complementary ionic dyes, the sensor exhibited a pronounced transformation from a blue X-shaped motif to a red circular pattern upon exposure to HClO. This dual-mode response originates from HClO-induced modulation of polymer charge states—namely, chloramide formation in the circular region and chloramine formation in the X-shaped region—which governs the selective adsorption of anionic and cationic dyes. Quantitative evaluation using RGB analysis and diffuse-reflectance UV–vis spectroscopy confirmed semi-quantitative detection of HClO within a practical concentration range.
The sensor further demonstrated applicability in monitoring the photodecomposition of a commercially available disinfectant, clearly visualizing the decline in available chlorine under UV irradiation. Beyond its naked-eye readability, the color–pattern dual-mode strategy offers intrinsic robustness against illumination variability, a major source of error in AI-based image analysis of conventional colorimetric systems. By combining geometric pattern recognition with chromatic information, this platform balances quantitative capability with practical reliability, highlighting its potential for real-world, on-site chemical sensing applications.
Author Contributions
Conceptualization, Y.K.; methodology, Y.K.; investigation, Y.K., T.K. and E.S.; data curation, T.K. and E.S.; writing—original draft preparation, Y.K.; writing—review and editing, Y.K.; supervision, Y.K.; project administration, Y.K.; funding acquisition, Y.K. All authors have read and agreed to the published version of the manuscript.
Funding
This work was supported by Adaptable and Seamless Technology transfer Program through Target-driven R&D (A-STEP) from Japan Science and Technology Agency (JST) Grant Number JPMJTT20JJ.
Data Availability Statement
The data presented in this study are available from the corresponding author upon reasonable request.
Conflicts of Interest
The authors declare no conflicts of interest.
Abbreviations
The following abbreviations are used in this manuscript:
| AAPH | 2,2'-Azobis(2-methylpropionamidine) dihydrochloride |
| DMSO | Dimethyl sulfoxide |
| DPD | N,N-diethyl-p-phenylenediamine |
| FG | Fastgreen FCF |
| HClO | Hypochlorous acid |
| HEPES | 2-{4-(2-hydroxyethyl)-1-piperazinyl}ethanesulfonic acid |
| NaClO | Sodium hypochlorite |
| RGB | Red–Green–Blue |
| SF | Safranin T |
| UV-vis | Ultraviolet-visible |
References
- World Health Organization. Cleaning and Disinfection of Environmental Surfaces in the Context of COVID-19: Interim Guidance; WHO: Geneva, Switzerland, 2020. Available online: https://www.who.int/publications/i/item/cleaning-and-disinfection-of-environmental-surfaces-inthe-context-of-covid-19.
- Block, M.S.; Rowan, B.G. Hypochlorous acid: A review. J. Oral Maxillofac. Surg. 2020, 78, 1461–1466. [CrossRef]
- Zhang, Y.; Huang, H.H.; Ma, L.Z.; Masuda, Y.; Honjoh, K.; Miyamoto, T. Inactivation of mixed Escherichia coli O157:H7 biofilms on lettuce by bacteriophage in combination with slightly acidic hypochlorous water and mild heat treatment. Food Microbiol. 2022, 104, 104010. [CrossRef]
- Kampf, G.; Todt, D.; Pfaender, S.; Steinmann, E. J. Hosp. Infect. 104 2020, 246–251. [CrossRef]
- Hatanaka, N.; Yasugi, M.; Sato, T.; Mukamoto, M.; Yamasaki, S. J. Appl. Microbiol. 132 2022, 1496–1502. [CrossRef]
- Kameda, T.; Oka, S.; Igawa, J.; Sakamoto, M.; Terada, K. Dent. Mater. J. 41 2022, 167–183. [CrossRef]
- Lin, Q.; Lim, J.Y.C.; Xue, K.; Yew, P.Y.M.; Owh, C.; Chee, P.L.; Loh, X.J. VIEW 1 2020, e16. [CrossRef]
- Chiu, S.; Skura, B.; Petric, M.; McIntyre, L.; Gamage, B.; Isaac-Renton, J. Am. J. Infect. Control 43 2015, 1208–1212. [CrossRef]
- Busch, M.; Simic, N.; Ahlberg, E. Phys. Chem. Chem. Phys. 21 2019, 19342–19348. [CrossRef]
- Adam, L.C.; Fabian, I.; Suzuki, K.; Gordon, G. Inorg. Chem. 31 1992, 3534–3541. [CrossRef]
- Moberg, L.; Karlberg, B. An improved N,N′-diethyl-p-phenylenediamine (DPD) method for the determination of free chlorine based on multiple wavelength detection. Anal. Chim. Acta 407 2000, 127–133. [CrossRef]
- Li, P.; Furuta, T.; Kobayashi, T. Micro-particles as interfering substances in colorimetric residual chlorine measurement. Ecotoxicol. Environ. Saf. 207 2021, 111279. [CrossRef]
- Spon, R. Do you really have a free chlorine residual? Opflow 34 2008, 24–27. [CrossRef]
- Li, P.; Yoshimura, T.; Furuta, T.; Yanagawa, T.; Shiozaki, K.; Kobayashi, T. Sunlight-caused interference in outdoor N,N-diethyl-p-phenylenediamine colorimetric measurement for residual chlorine and solution for on-site work. Ecotoxicol. Environ. Saf. 169 2019, 640–644. [CrossRef]
- Iwami, Y.; Yokozawa, T.; Takayoshi, W.; Kanekiyo, Y. Multicolor saccharide-sensing chips based on boronic acid-containing thin films showing stepwise release and binding of dyes. Talanta 85 2011, 829–833. [CrossRef]
- Iwami, Y.; Yamamoto, H.; Kanekiyo, Y. Multicolor saccharide-analysis sensor arrays based on boronic acid-containing thin films combined with various anionic dyes. Chem. Lett. 42 2013, 1214–1216. [CrossRef]
- Takayoshi, W.; Imajo, M.; Iijima, M.; Suzuki, M.; Yamamoto, H.; Kanekiyo, Y. Multicolor saccharide-sensing chips created via layer-by-layer adsorption of boronic acid-containing polymers. Sens. Actuators B Chem. 192 2014, 776–781. [CrossRef]
- Iwami, Y.; Yokozawa, T.; Yamamoto, H.; Kanekiyo, Y. Boronic acid-based thin films that show saccharide-responsive multicolor changes. J. Appl. Polym. Sci. 132 2015, 42679. [CrossRef]
- Kanekiyo, Y.; Mitani, Y.; Suda, M.; Aoki, H.; Minai, H. Development of formaldehyde gas sensor that exhibits distinct color changes. Sens. Mater. 32 2020, 1101–1109. [CrossRef]
- Nakahashi, H.; Takeshima, K.; Matsubara, S.; Kanekiyo, Y. Distinct color changes in hydrogen peroxide-responsive thin films consisting of boronic acid-containing polymers. Dyes Pigments 218 2023, 111450. [CrossRef]
- Kanekiyo, Y.; Sato, R.; Sakai, E. Pattern changes in cotton fabrics functionalized with lactate-responsive polymers. Dyes Pigments 245 2026, 113251. [CrossRef]
- Zhang, Y.; Hu, C.; Lu, X. IL-GAN: Illumination-invariant representation learning for single sample face recognition. J. Vis. Commun. Image Represent. 59 2019, 501–513. [CrossRef]
- Lowe, D.G. Distinctive image features from scale-invariant keypoints. Int. J. Comput. Vis. 60 2004, 91–110. [CrossRef]
- Lee, K.; Lim, J.; Lee, D.; Kim, S.; Ahn, H. Evaluation of mixed oxidants generated by an electrochemical method. Desalin. Water Treat. 2 2009, 1–5. [CrossRef]
- Irodori. FreeSoft-100. Available online: https://freesoft-100.com/download/irodori/.
- Jensen, J.S.; Lam, Y.-F.; Helz, G.R. Role of amide nitrogen in water chlorination: Proton NMR evidence. Environ. Sci. Technol. 33 1999, 3568–3573. [CrossRef]
- Zhang, T.; von Gunten, U. Chlorination of amides: Kinetics and mechanisms of formation of N-chloramides and their reactions with phenolic compounds. Water Res. 242 2023, 120131. [CrossRef]
- Menard, H.; Lessard, J. Acidities of some N-haloamides (ZCONHX) in water and ethanol–water mixtures at 25 °C. J. Chem. Eng. Data 23 1978, 64–65.
- Na, C.; Olson, T.M. Relative reactivity of amino acids with chlorine in mixtures. Environ. Sci. Technol. 41 2007, 3220–3225. [CrossRef]
- Tarade, T.; Vrček, V. Reactivity of amines with hypochlorous acid: Computational study of steric, electronic, and medium effects. Int. J. Quantum Chem. 113 2013, 881–890. [CrossRef]
- Trogolo, D.; Arey, J.S. Equilibria and speciation of chloramines, bromamines, and bromochloramines in water. Environ. Sci. Technol. 51 2017, 128–140. [CrossRef]
Scheme 1.
Chemical structures of the monomers used for fabrication of the thin-film sensor.

Scheme 2.
Chemical structures of the anionic and cationic dyes used for sensor coloration.

Scheme 3.
Schematic illustration of the fabrication process of the dual-pattern thin-film sensor (dimensions in mm).
Scheme 3.
Schematic illustration of the fabrication process of the dual-pattern thin-film sensor (dimensions in mm).

Figure 1.
Visual color changes of the sensor before (top) and after (bottom) immersion in 2 mM HClO solution for 10 min, followed by dye staining.
Figure 1.
Visual color changes of the sensor before (top) and after (bottom) immersion in 2 mM HClO solution for 10 min, followed by dye staining.

Figure 2.
Changes in RGB values of the sensor before (top) and after (bottom) immersion in 2 mM HClO solution for 10 min, followed by dye staining. Left: circular area; right: X-shaped area.
Figure 2.
Changes in RGB values of the sensor before (top) and after (bottom) immersion in 2 mM HClO solution for 10 min, followed by dye staining. Left: circular area; right: X-shaped area.

Figure 3.
Concentration-dependent pattern and color changes of the sensor after immersion in HClO solutions (0–3 mM) for 10 min, followed by dye staining for 15 min.
Figure 3.
Concentration-dependent pattern and color changes of the sensor after immersion in HClO solutions (0–3 mM) for 10 min, followed by dye staining for 15 min.

Figure 4.
Relationship between RGB values and HClO concentration. Left: circular area; right: X-shaped area.
Figure 4.
Relationship between RGB values and HClO concentration. Left: circular area; right: X-shaped area.

Figure 5.
Diffuse-reflectance UV–vis spectral changes of (top) the circular area and (bottom) the X-shaped area as a function of HClO concentration.
Figure 5.
Diffuse-reflectance UV–vis spectral changes of (top) the circular area and (bottom) the X-shaped area as a function of HClO concentration.

Figure 6.
Monitoring of HClO decomposition in a commercially available disinfectant under UV irradiation (365 nm). The sensor response was recorded after 0, 24, and 96 h of irradiation.
Figure 6.
Monitoring of HClO decomposition in a commercially available disinfectant under UV irradiation (365 nm). The sensor response was recorded after 0, 24, and 96 h of irradiation.

Scheme 4.
Proposed reaction mechanisms of the polymer films with HClO in each patterned area, showing chloramide formation in the circular region and chloramine formation in the X-shaped region.
Scheme 4.
Proposed reaction mechanisms of the polymer films with HClO in each patterned area, showing chloramide formation in the circular region and chloramine formation in the X-shaped region.


Table 1.
Monomer compositions.1.
| Pattern area | [Monomer] / mM | |||
| 1 | 2 | 3 | 4 | |
| Circle | 0 | 950 | 0 | 75 |
| X-shape | 40 | 0 | 910 | 100 |
1 Initiator: AAPH (50 mM), solvent: H2O/DMSO = 1:1 (v/v).
Disclaimer/Publisher’s Note: The statements, opinions and data contained in all publications are solely those of the individual author(s) and contributor(s) and not of MDPI and/or the editor(s). MDPI and/or the editor(s) disclaim responsibility for any injury to people or property resulting from any ideas, methods, instructions or products referred to in the content. |
© 2026 by the authors. Licensee MDPI, Basel, Switzerland. This article is an open access article distributed under the terms and conditions of the Creative Commons Attribution (CC BY) license (http://creativecommons.org/licenses/by/4.0/).
Copyright: This open access article is published under a Creative Commons CC BY 4.0 license, which permit the free download, distribution, and reuse, provided that the author and preprint are cited in any reuse.


