
Submitted:
18 October 2024
Posted:
22 October 2024
You are already at the latest version
Abstract
Methylene blue is a cationic organic dye found in wastewater, groundwater, and surface water, due to industrial release in the environment. This emerging pollutant is very persistent and, depending on the doses, can harm human and environmental health. In this work, a Surface Plasmon Resonance Biosensor using a BK7 prism with a coating of 3 nm chromium and 50 nm of gold in the Kretschmann configuration was developed for the detection of methylene blue, using for the first time, laccases immobilized on a gold surface as bio-receptors for this organic dye. The enzyme immobilization through carbodiimide bonds, using EDC/NHS crosslinkers, and allowed to analyze samples with minimal preparation. The method was validated, achieving a LOD of 4.61 mg L-1 and LOQ of 15.37 mg L-1, a working range from 0-100 mg L-1, and a R2=0.9614 in a real-time analysis. A sample of rainwater spiked with methylene blue was analyzed, and a recovery of 122.46 ± 4.41% was obtained.
Keywords:
laccases
; Surface Plasmon Resonance
; methylene blue
; biosensor
; emerging pollutant
1. Introduction
Methylene blue is an organic dye. [1] frequently released in wastewater from textile, paint, paper, and plastic industries [2], and a large volume of methylene blue dye-containing wastewater is discharged into groundwater and surface water [3]. Even this dye has been used as a treatment for diseases like malaria and methemoglobinemia, antidepressant, and as a cardioprotective agent. [4], depending on the doses, methylene blue can have both medical beneficial or harmful effects: if the doses of methylene blue exceed 5 mg/kg, the monoamine oxidate inhibitory characteristics of methylene blue dye can induce fatal serotonin toxicity in humans, apart from being a threat to fauna in aquatic ecosystems. Also, it has been reported to be teratogenic and embryotoxic, according to studies in angelfish and rats, respectively. Furthermore, can induce cyanosis, tissue necrosis, Heinz body formation, vomiting, jaundice, shock, and enhanced heartbeat rate [3].
Methylene blue is a very persistent cationic dye. [3], is an organic chloride salt (molecular formula: C16H18ClN3S) having 3,7-bis(dimethylamino)phenothiazin-5-ium as the counterion, and has corrosive and irritant characteristics [4]. Figure 1 shows the chemical structure of methylene blue.
There are conventional techniques for the detection of this dye using HPLC and UV-vis techniques: Ong et al. measured methylene blue concentrations with a UV-Vis spectrophotometer at λmax of 661 nm and analyzed samples with concentrations from 100 to 1350 mg/L [5]. In another study, Khan et al. quantified methylene blue from environmental samples with a methodology based on solid–phase extraction (SPE) and ultra-performance liquid chromatography-tandem mass spectrometry (UPLC–MS/MS). The authors achieved a Limit of Detection (LOD) of 0.1 ng/mL and a Limit of Quantification (LOQ) of 0.4 ng/mL. [6]. On the other hand, Fito et al. also quantified the dye with a UV–Visible spectrophotometer at a wavelength of 668 nm, in samples with initial concentrations of 100, 150, and 200 mg/L [7]. As can be seen, among the conventional techniques, the UPLC-MS/MS technique could analyze the lower concentrations of methylene blue and needed a previous extraction process to achieve a lower LOD.
In recent years, new alternatives have been tried for the detection and quantification of methylene blue. For example, Kaya et al. studied the binding kinetics of the dye on monolayer graphene using the technique of Surface Plasmon Resonance (SPR), by analyzing samples with a concentration of 1 μM [8]. In another study, Sadrolhosseini et al. carried out the quantification of methylene blue and methylene orange using SPR, using NiCo-Layered Double Hydroxide, achieving LOD of 0.005 ppm. [9]. In other work, Sofani et al. used Localized Surface Plasmon Resonance (LSPR) Au Nanorods with diameters of 20, 40, 60, and 80 nm, achieving sensitivities of 103,40523 RIU/nm, 156,46238 RIU/nm, 228,02452 RIU/nm, and 272,10904 RIU/nm, respectively. [10].
The combination of enzymes and SPR has been demonstrated to be efficient for the detection of different analytes, with advantages such as high sensitivity, real-time response, and fast analysis [11], as same as low matrix interference effects [12]. In an enzyme-based SPR biosensor, it is important to use an enzyme able to react with the analyte. Laccases are oxidoreductases, belonging to the multinuclear copper-containing oxidases and catalyze the monoelectronic oxidation of substrates using molecular oxygen and producing water as the only by-product, thus, can be considered as an “eco-friendly” enzyme [13]. Laccases catalyze the monoelectronic oxidation of substrates at the expense of molecular oxygen, and thus, can act over functional groups like OH- [14]. Although laccases can be monomeric, dimeric or tetrameric glycoproteins, they all have four copper atoms and have three types of copper: the Type 1 copper (T1Cu) is responsible for the oxidation of substrate and also responsible for the blue color of enzyme, have strong electronic absorbance around 610nm and electro-paramagnetic resonance (EPR) detectable, type 2 copper (T2Cu) is colorless it is also EPR detectable and type 3 copper (T3Cu) gives a weak absorbance near the UV spectrum (330nm)[15]. Laccases catalyze the oxidation reaction for various aromatic compounds (predominantly phenols) and are produced by fungi, bacteria, archaebacteria, and higher plants [16]. Also, laccases can oxidize a variety of non-aromatic and non-phenolic hydrogen donors via a mechanism involving radicals [15], as same as benzenethiols, diamines, and aromatic amines [17].
In this case, laccases have demonstrated their ability to react with methylene blue: for example, Dahlena et al. used the mentioned enzymes for the degradation of methylene blue, with the addition of 0.014 U/mL fungal laccases from Trichoderma asperellum LBKURCC1, with a decreasing of 69% of the 50 ppm solution color, working in acidic conditions (pH 5.5) [17]. In another study, Forootanfar et al. used fungal laccases from Aspergillus oryzae, Trametes versicolor, and Paraconiothyrium variabile, at pH 4.5: the laccases from P. variabile were the most efficient which decolorized bromophenol blue (100%), coomassie brilliant blue (91%), panseu-S (56%), Rimazol brilliant blue R (RBBR; 47%), Congo red (18.5%), and methylene blue (21.3%) after 3 h incubation. [18]. Laccases have been used not only for dye decoloration but also for the detection of emerging pollutants: in previous studies, our teamwork has used laccases from Rhus vernificera in SPR biosensors for the detection of emerging pollutants such as chlorophene with LODs suitable for the use in environmental samples. [12].
In this work, we propose a new enzymatic-SPR biosensor for the detection of methylene blue, using laccases from Rhus vernicifera to detect the emerging pollutant methylene blue. This is the first time the laccases are used in an SPR-enzymatic biosensor for the detection of methylene blue.
2. Results and Discussion
2.1. Functionalization of the thin Chromium-Gold Film and Immobilization of the Laccases
As mentioned before, the chip with thin gold chromium-gold film was functionalized with alkanethiols before the immobilization process, and was installed in the SPR equipment, and reflectance spectra were obtained by angular sweep, from 30-80º, it was carried out with both air and water. In Figure 2 can be seen the shift of the resonance angle was caused by a refractive index change when the angular sweep was carried out with air and water. The fixed working angle was selected in the middle of the slope of the resonance angle of the water (71.5º), which is the angle with the highest sensitivity. Both immobilization and calibration curves were carried out at a fixed angle. The estimated thickness of the film was 50 nm for gold and 3 nm for chromium.
After the functionalization with alkanethiols, the laccases were immobilized using 1-ethyl-3-(3-dimethylaminopropyl) carbodiimide hydrochloride/n-hydroxysuccinimide (EDC/NHS). In the Figure 3 is shown the real-time immobilization process. After the addition of each reagent, an increase in the reflectance can be seen, then, the signal starts to decrease when the surface is washed, and then, the signal gets stable (can be seen as a flat zone) when all the non-bound molecules are gone and only the molecules that are attached to the surfaces remain, obtaining a new higher baseline.
2.2. Calibration Curve
After the fixed angle was selected at 71.5º, stocks with different concentrations of methylene blue were analyzed by SPR, and a calibration curve was carried out. The calibration curve is shown in Figure 4 and the analytical parameters can be seen in Table 1. In Figure 4 can be seen an increase in the reflectance as the concentration increases, as a result of the interaction between the laccases and the analyte. Then, a flat section appears when the maximum reflectance is achieved, and the signal was stable. After that, the signal decreased when the biosensor was washed with NaOH 40 mM and water, and the analyte was separated from the bio-receptor.
2.3. Analysis of Samples, Analytical Parameters, and Validation of the Method
As can be seen, the calibration curve of the method had a linear fit (R2=0.9614), a LOD of 4.61 mg L-1, and a LOQ of 15.37 mg L-1. A spiked sample of rainwater was analyzed to evaluate the matrix effects. A recovery percentage of 122.46 ± 4.41 was achieved. These recovery percentage indicates the existence of matrix effects due to the combined effect of all components of the sample [21], in this case, an environmental sample. However, the recovery percentage was close to the acceptable recovery percentage of 70-120% [20], considering the complexity of the matrix of the sample. The physical-chemical characteristics of the rainwater can be seen in Table 2. On the other hand, the matrix effect could be reduced by using a different enzyme, to find an enzyme with a higher selectivity in further studies. The LOD was higher than the UPLC–MS/MS technique of Khan et al. [6], but, unlike the aforementioned study, in this work, the sample had not a previous concentration. The LOD could be lower, through a previous concentration of the sample, for example, by using a solid-phase extraction (SPE), a sample clean-up, and a pre-concentration technique for the effective extraction of the desired compound from complex matrices [21]. Even when many of the physical and chemical analyzed parameters of the water were lower than the LOD (see Table 2) and the total hardness was low[24], the rainwater can contain many other pollutants, since is an important natural source of water pollution, dissolving the pollutants from the air, such as oxides of sulfur and nitrogen in rainwater, and brings down the entrained particulate matter with it[25]. Also, the air can have other pollutants like volatile organic compounds (VOCs) and polycyclic aromatic hydrocarbons (PAHs), as same as microorganisms such as respiratory viruses[26], fungal spores [27], bacteria [28], and bioaerosols like pollen[28]. Despite the complexity of the matrix, the working range was comparable with the Fito et al. study: they analyzed samples with an initial concentration of methylene blue of 100, 150, and 200 mg L-1, using UV-vis spectrophotometer as a detector, and monitored its degradation, achieving a 99.99% of elimination [7]. Also, other conditions could be modified to improve characteristics such as selectivity, for example, a different buffer or immobilization protocol [22].
3. Materials and Methods
All the reagents used in this work were purchased from Sigma-AldrichTM unless otherwise specified. The rainwater samples were provided by the Laboratory of Biotechnological Processes of the Biotechnology and Nanotechnology Research Center (CIBYN) from the Autonomous University of Nuevo León, Mexico.
The pH of the rainwater sample was determined using a multiparameter probe (WTW Multi 350i) and other parameters such as total hardness, free chlorine, iron, copper, lead, nitrate, nitrite, MPS, total chlorine, fluoride, cyanuric acid, ammonia chloride, bromine, total alkalinity and carbonate were measured, using an Umlecoa® Drinking Water Test Strips.
3.1. Functionalization of the thin Chromium-Gold Film and Immobilization of the Laccases
A chip of glass covered with a thin chromium-gold film was used. The thin chromium-gold film deposition by thermal evaporation process was based on the work of Luna-Moreno and collaborators. [19].
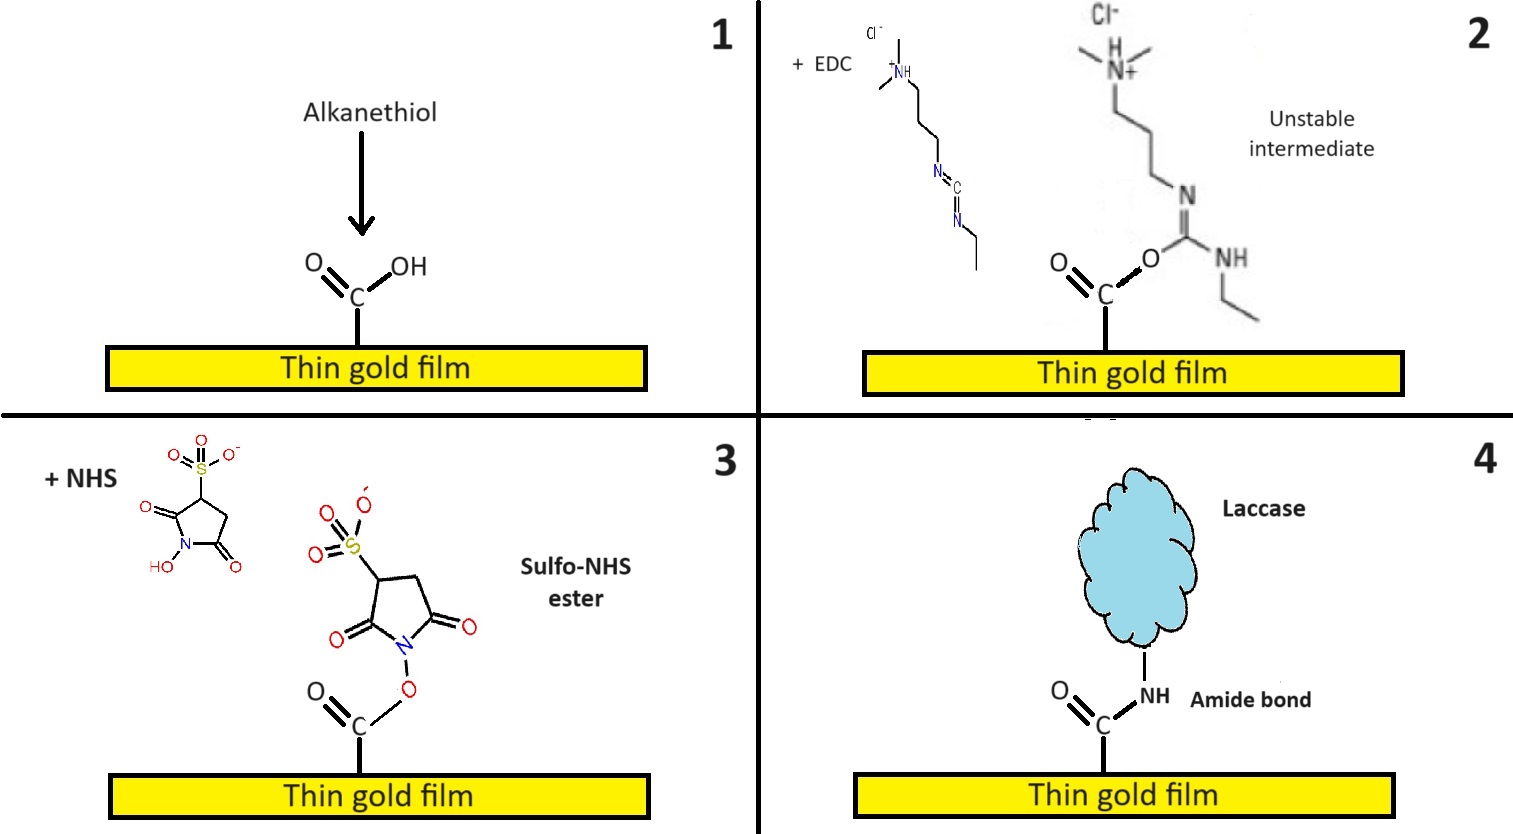
The enzyme immobilization was carried out following the methodology from previous works. [19,20]. The first step was functionalization: the chip with thin chromium-gold film was washed with acetone and ethanol (30 s in each) and air-dried. Next, it was immersed for 12 h at room temperature in a solution of MHDA: MUD alkanethiols (250 μM in ethanol). After 12 hours, the chip was rinsed with absolute ethanol and was mounted with a BK7 prism and SPR equipment, leaving free carboxyl groups of the alkanethiols. Then, angular sweeps from 30 to 80º were done with air and water and a fixed angle was selected in the middle of the slope of the resonance angle, which is the angle with the highest sensitivity. In the next steps of the process, we worked with a flow of 0.2 mL/min. After that, 700µL of solution of the EDC/NHS crosslinkers (0.2 M/0.05 M) in MES buffer (100 mM, 500 mM NaCl, pH 5) was added, forming carbodiimide esters, followed by a wash with bi-distilled water,and 700µL of laccases solution (500 mg L-1) was added, creating amide bonds between the amino acids of the enzymes and the terminal carboxyl group of the alkanethiols. In the final step, an ethanolamine solution (1 M, pH 8.5) was added and bound to the carboxyl groups that remained free, avoiding nonspecific unions. The immobilization process is shown in Figure 5.
The immobilization process was monitored using SPR equipment, and the experimental conditions of the SPR apparatus in this study were the same as those reported in a previous study. [20] and all the measurements were carried out at a fixed angle, selected with a previous scan of 30-80°. The working angle located at the midpoint of the slope of the plasmon angle was selected, because it´s the point with the highest sensitivity.
3.2. Calibration Curve and Analysis of Samples
Stocks with different concentrations of methylene blue in buffer MES 0.1M pH 5.0 to find the working range of the method. Then, a calibration curve was prepared with stock solutions of methylene blue, in buffer MES 0.1M, pH 5.0, at different concentrations: 0 ppm, 20 ppm, 30 ppm, 50 ppm, and 60 ppm, and were analyzed by SPR with a flow rate of 0.2 mL min-1. A NaOH 40 mM solution was injected and a wash with bi-distilled water was carried out after injecting all the samples to regenerate the biosensor and prepare it for the next sample. Both calibration stocks and samples were analyzed with the same conditions and methodology. The graphics were made with the OriginPro® program, version 2024b.
3.3. Analytical parameters, and validation of the method.
The analytical parameters of the method, such as the equation of the line, the correlation coefficient (R), LOD, and LOQ were obtained.
The Limit of Detection (LOD) was calculated as equation 1:
LOD=3∗SDb/m
Where “SDb” is the standard deviation of the blank of the curve and “m” is the slope of the equation of the line.
The Limit of Quantification (LOQ) was calculated as equation 2:
LOQ=10∗SDb/m
Where “SDb” is the standard deviation of the blank of the curve and “m” is the slope of the equation of the line.
The spiked sample was prepared with a final concentration of 30 ppm. The spiked samples were analyzed as same as the stocks of the calibration curves, to determine the % of recovery.
4. Conclusions
Methylene blue is an emerging pollutant that can produce harmful effects on the environment and human health. In this work, a new SPR-laccase biosensor was used for the first time to detect the colorant methylene blue, achieving a LOD of 4.61 mg L-1 and a LOQ of 15.37 mg L-1 and a good linear fix (R2=0.9614). A spiked sample of rainwater was analyzed and a recovery percentage of 122.46 ± 4.41%. These results lay the foundations for the development of new enzymatic biosensors for the detection and monitoring of dyes through the SPR technique. More studies are needed to improve the selectivity and sensitivity of the technique for the quantification of methylene blue by SPR-enzymatic techniques.
Author Contributions
ASA, GEQV, and DLM carried out the conceptualization. GEQV planned and performed the methodology. GEQV and ORQ used the software for the data analysis. GEQV carried out the validation. ASA, GEQV, and DLM carried out the formal analysis. GEQV carried out the investigation. ASA, MMRD, and DLM provided resources for the project; GEQV and ORQ performed the data curation. ASA and GEQV wrote the original draft. GEQV, ASA, DLM, ORQ, MMRD, JFVC, and ASS contributed to writing, reviewing and editing. ASA and DLM supervised the project. DLM administrated the project. All authors have read and approved the final manuscript.
Funding
This research was funded by the Consejo Nacional de Humanidades, Ciencias y Tecnologías (CONAHCYT), through the program “Estancias Posdoctorales por México”, CVU 740156.
Data Availability Statement
All the included figures, tables, and data in this paper are original and available, provided you give appropriate credit to the original author(s) and the source, provide a link to the Creative Commons license, and indicate if changes were made.
Conflicts of Interest
The authors declare no conflicts of interest.
References
- R. Sivakumar and N. Y. Lee, ‘Adsorptive removal of organic pollutant methylene blue using polysaccharide-based composite hydrogels’, Chemosphere, vol. 286, p. 131890, 2022.
- M. Hassanpour, H. Safardoust-Hojaghan, and M. Salavati-Niasari, ‘Degradation of methylene blue and Rhodamine B as water pollutants via green synthesized Co3O4/ZnO nanocomposite’, J Mol Liq, vol. 229, pp. 293–299, 2017. [CrossRef]
- P. O. Oladoye, T. O. Ajiboye, E. O. Omotola, and O. J. Oyewola, ‘Methylene blue dye: Toxicity and potential elimination technology from wastewater’, Results in Engineering, vol. 16, no. August, p. 100678, 2022. [CrossRef]
- Pubchem, ‘Methylene blue’, Compound Summary. Accessed: May 10, 2024. [Online]. Available: https://pubchem.ncbi.nlm.nih.gov/compound/Methylene-Blue.
- S. A. Ong, E. Toorisaka, M. Hirata, and T. Hano, ‘Treatment of methylene blue-containing wastewater using microorganisms supported on granular activated carbon under packed column operation’, Environ Chem Lett, vol. 5, no. 2, pp. 95–99, 2007. [CrossRef]
- M. R. Khan, M. A. Khan, Z. A. Alothman, I. H. Alsohaimi, M. Naushad, and N. H. Al-Shaalan, ‘Quantitative Determination of Methylene Blue in Environmental Samples by Solid Phase Extraction and Ultra Performance Liquid Chromatography-Tandem Mass Spectrometry: A Green Approach.’, RSC Adv, vol. 4, no. 64, pp. 34037–34044, 2014.
- J. Fito et al., ‘Adsorption of methylene blue from textile industrial wastewater using activated carbon developed from Rumex abyssinicus plant’, Sci Rep, vol. 13, no. 1, pp. 1–17, 2023. [CrossRef]
- N. S. Kaya, A. Yadav, M. Wehrhold, L. Zuccaro, and K. Balasubramanian, ‘Binding kinetics of methylene blue on monolayer graphene investigated by multiparameter surface plasmon resonance’, ACS Omega, vol. 3, no. 7, pp. 7133–7140, 2018.
- R. Sadrolhosseini, E. Ghasemi, A. Pirkarimi, S. M. Hamidi, and R. T. Ghahrizjani, ‘Highly sensitive surface plasmon resonance sensor for detection of Methylene Blue and Methylene Orange dyes using NiCo-Layered Double Hydroxide’, Opt Commun, vol. 529, p. 129057, 2023.
- M. Sofani, M. S. M. Kuddah, M. H. Putra, and D. Djuhana, ‘Sensitivity of Localized Surface Plasmon Resonance (LSPR) Au Nanorod with Methylene Blue Medium Using Boundary Element Method Simulation’, in IOP Conference Series: Materials Science and Engineering, IOP Publishing, 2019, p. 12014.
- Z. Zhou, Z. Yang, L. Xia, and H. Zhang, ‘Construction of an enzyme-based all-fiber SPR biosensor for detection of enantiomers’, Biosens Bioelectron, vol. 198, p. 113836, 2022.
- G. E. Quintanilla-Villanueva, D. Luna-Moreno, E. A. Blanco-Gámez, J. M. Rodríguez-Delgado, J. F. Villarreal-Chiu, and M. M. Rodríguez-Delgado, ‘A Novel Enzyme-Based SPR Strategy for Detection of the Antimicrobial Agent Chlorophene’, Biosensors (Basel), vol. 11, no. 2, p. 43, 2021. [CrossRef]
- S. Riva, ‘Laccases: blue enzymes for green chemistry’, Trends Biotechnol, vol. 24, no. 5, pp. 219–226, 2006.
- M. A. Dettori et al., ‘Synthesis and studies of the inhibitory effect of hydroxylated phenylpropanoids and biphenols derivatives on tyrosinase and laccase enzymes’, Molecules, vol. 25, no. 11, Jun. 2020. [CrossRef]
- R. Chandra and P. Chowdhary, ‘Environmental Science Processes & Impacts Properties of bacterial laccases and their application in bioremediation of industrial wastes’, Environmental Sciences: Processes Impacts, pp. 326–342, 2015. [CrossRef]
- J. Ali et al., ‘Exploiting Microbial Enzymes for Augmenting Crop Production’, in Enzymes in Food Biotechnology, M. Kuddus, Ed., Academic Press, 2019, ch. 29, pp. 503–519.
- M. Dahlena et al., ‘Preliminary Kinetic Studies on the Degradation of the Textile Dye Methyl Blue by Trichoderma asperellum LBKURCC1 Laccase without Mediators’, AIP Conf Proc, vol. 2638, no. August, 2022. [CrossRef]
- H. Forootanfar et al., ‘Synthetic dye decolorization by three sources of fungal laccase’, J Environ Health Sci Eng, vol. 9, no. 1, pp. 1–10, 2012.
- D. Luna-Moreno et al., ‘Early detection of the fungal banana black sigatoka pathogen Pseudocercospora fijiensis by an SPR immunosensor method’, Sensors (Switzerland), vol. 19, no. 3, pp. 1–12, 2019. [CrossRef]
- G. E. Quintanilla-Villanueva, D. Luna-Moreno, E. A. Blanco-Gámez, J. M. Rodríguez-Delgado, J. F. Villarreal-Chiu, and M. M. Rodríguez-Delgado, ‘A Novel Enzyme-Based SPR Strategy for Detection of the Antimicrobial Agent Chlorophene’, Biosensors (Basel), vol. 11, no. 2, p. 43, 2021. [CrossRef]
- IUPAC, ‘Matrix effect’, Gold Book. Accessed: Aug. 18, 2024. [Online]. Available: https://goldbook.iupac.org/terms/view/M03759#:~:text=(in%20analytical%20chemistry)%20The%20combined,is%20referred%20to%20as%20interference.
- E. A. Schoenau, ‘Elements of method design’, in ACS Symposium Series, vol. 1300, American Chemical Society, 2019, pp. 3–16. [CrossRef]
- S. Büyüktiryaki, R. Keçili, and C. M. Hussain, ‘Functionalized nanomaterials in dispersive solid phase extraction: advances & prospects’, TrAC Trends in Analytical Chemistry, vol. 127, p. 115893, 2020.
- USGS, ‘Hardness of Water’, Water Science School.
- J. Singh, P. Yadav, A. K. Pal, and V. Mishra, ‘Water pollutants: Origin and status’, Sensors in water pollutants monitoring: Role of material, pp. 5–20, 2020.
- J. L. Domingo and J. Rovira, ‘Effects of air pollutants on the transmission and severity of respiratory viral infections’, Environ Res, vol. 187, p. 109650, 2020.
- S. Roy and S. Gupta Bhattacharya, ‘Airborne fungal spore concentration in an industrial township: distribution and relation with meteorological parameters’, Aerobiologia (Bologna), vol. 36, no. 4, pp. 575–587, 2020.
- J. Gong, J. Qi, E. Beibei, Y. Yin, and D. Gao, ‘Concentration, viability and size distribution of bacteria in atmospheric bioaerosols under different types of pollution’, Environmental Pollution, vol. 257, p. 113485, 2020.
- J. F. Kornecki et al., ‘Influence of phosphate anions on the stability of immobilized enzymes. Effect of enzyme nature, immobilization protocol, and inactivation conditions’, Process Biochemistry, vol. 95, pp. 288–296, 2020.
Figure 1.
Chemical structure of methylene blue.
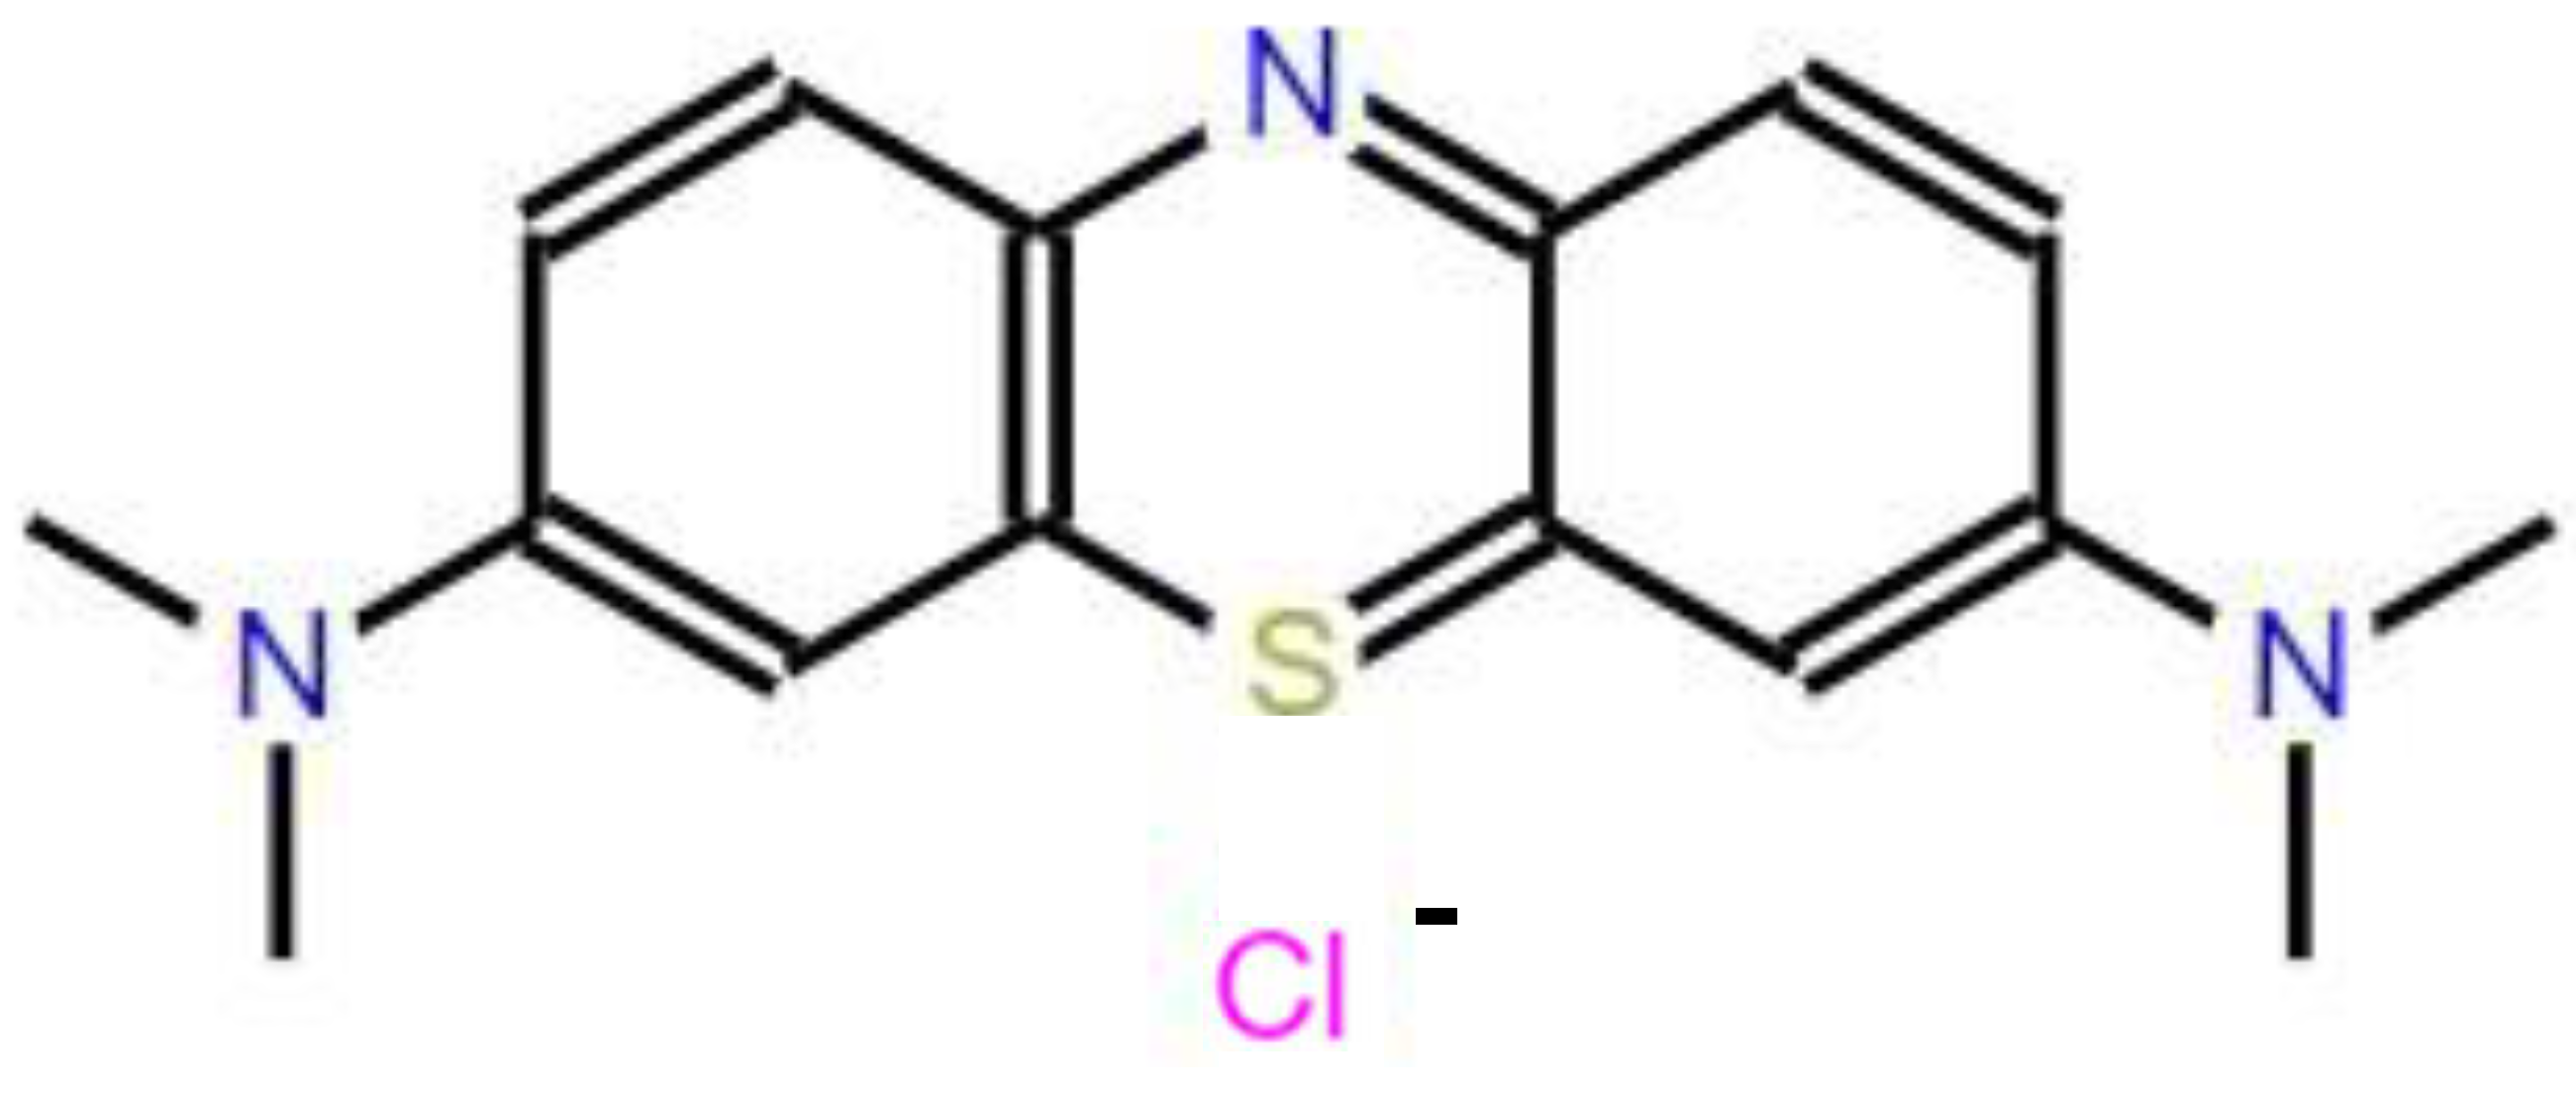
Figure 2.
Reflectance spectra obtained by angular sweep.
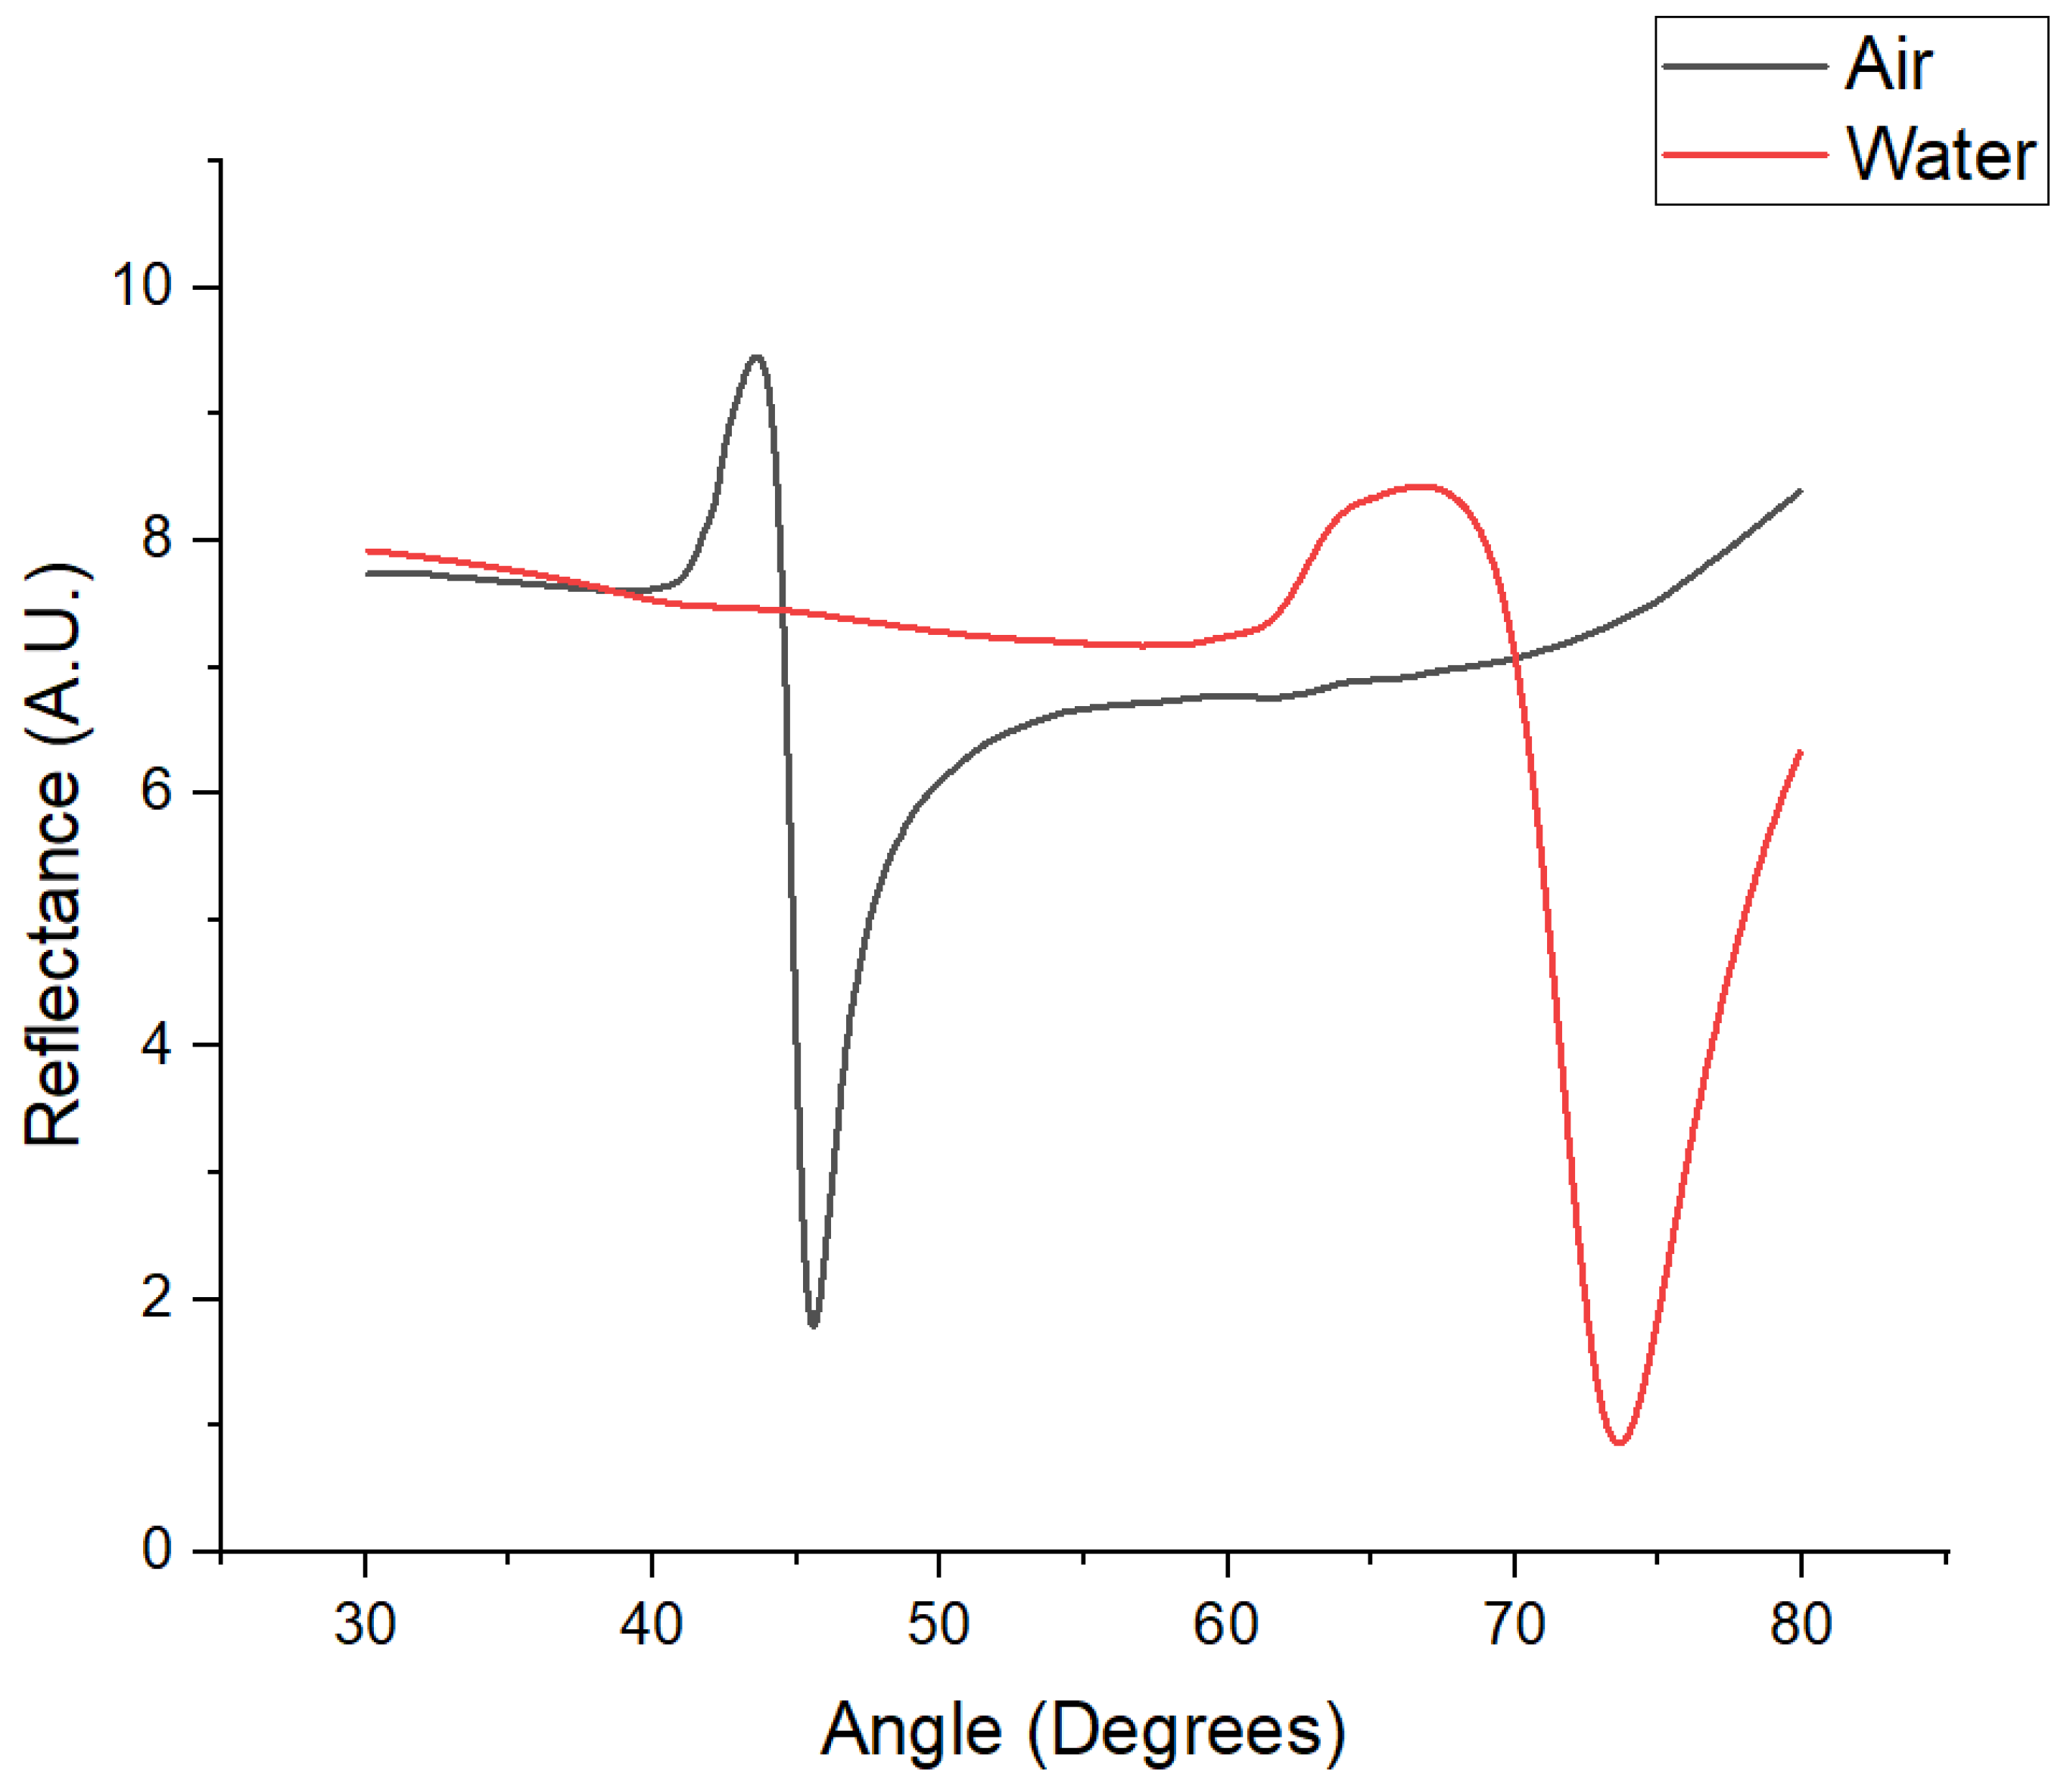
Figure 3.
Immobilization process of laccases from Rhus vernicifera in real-time by SPR.
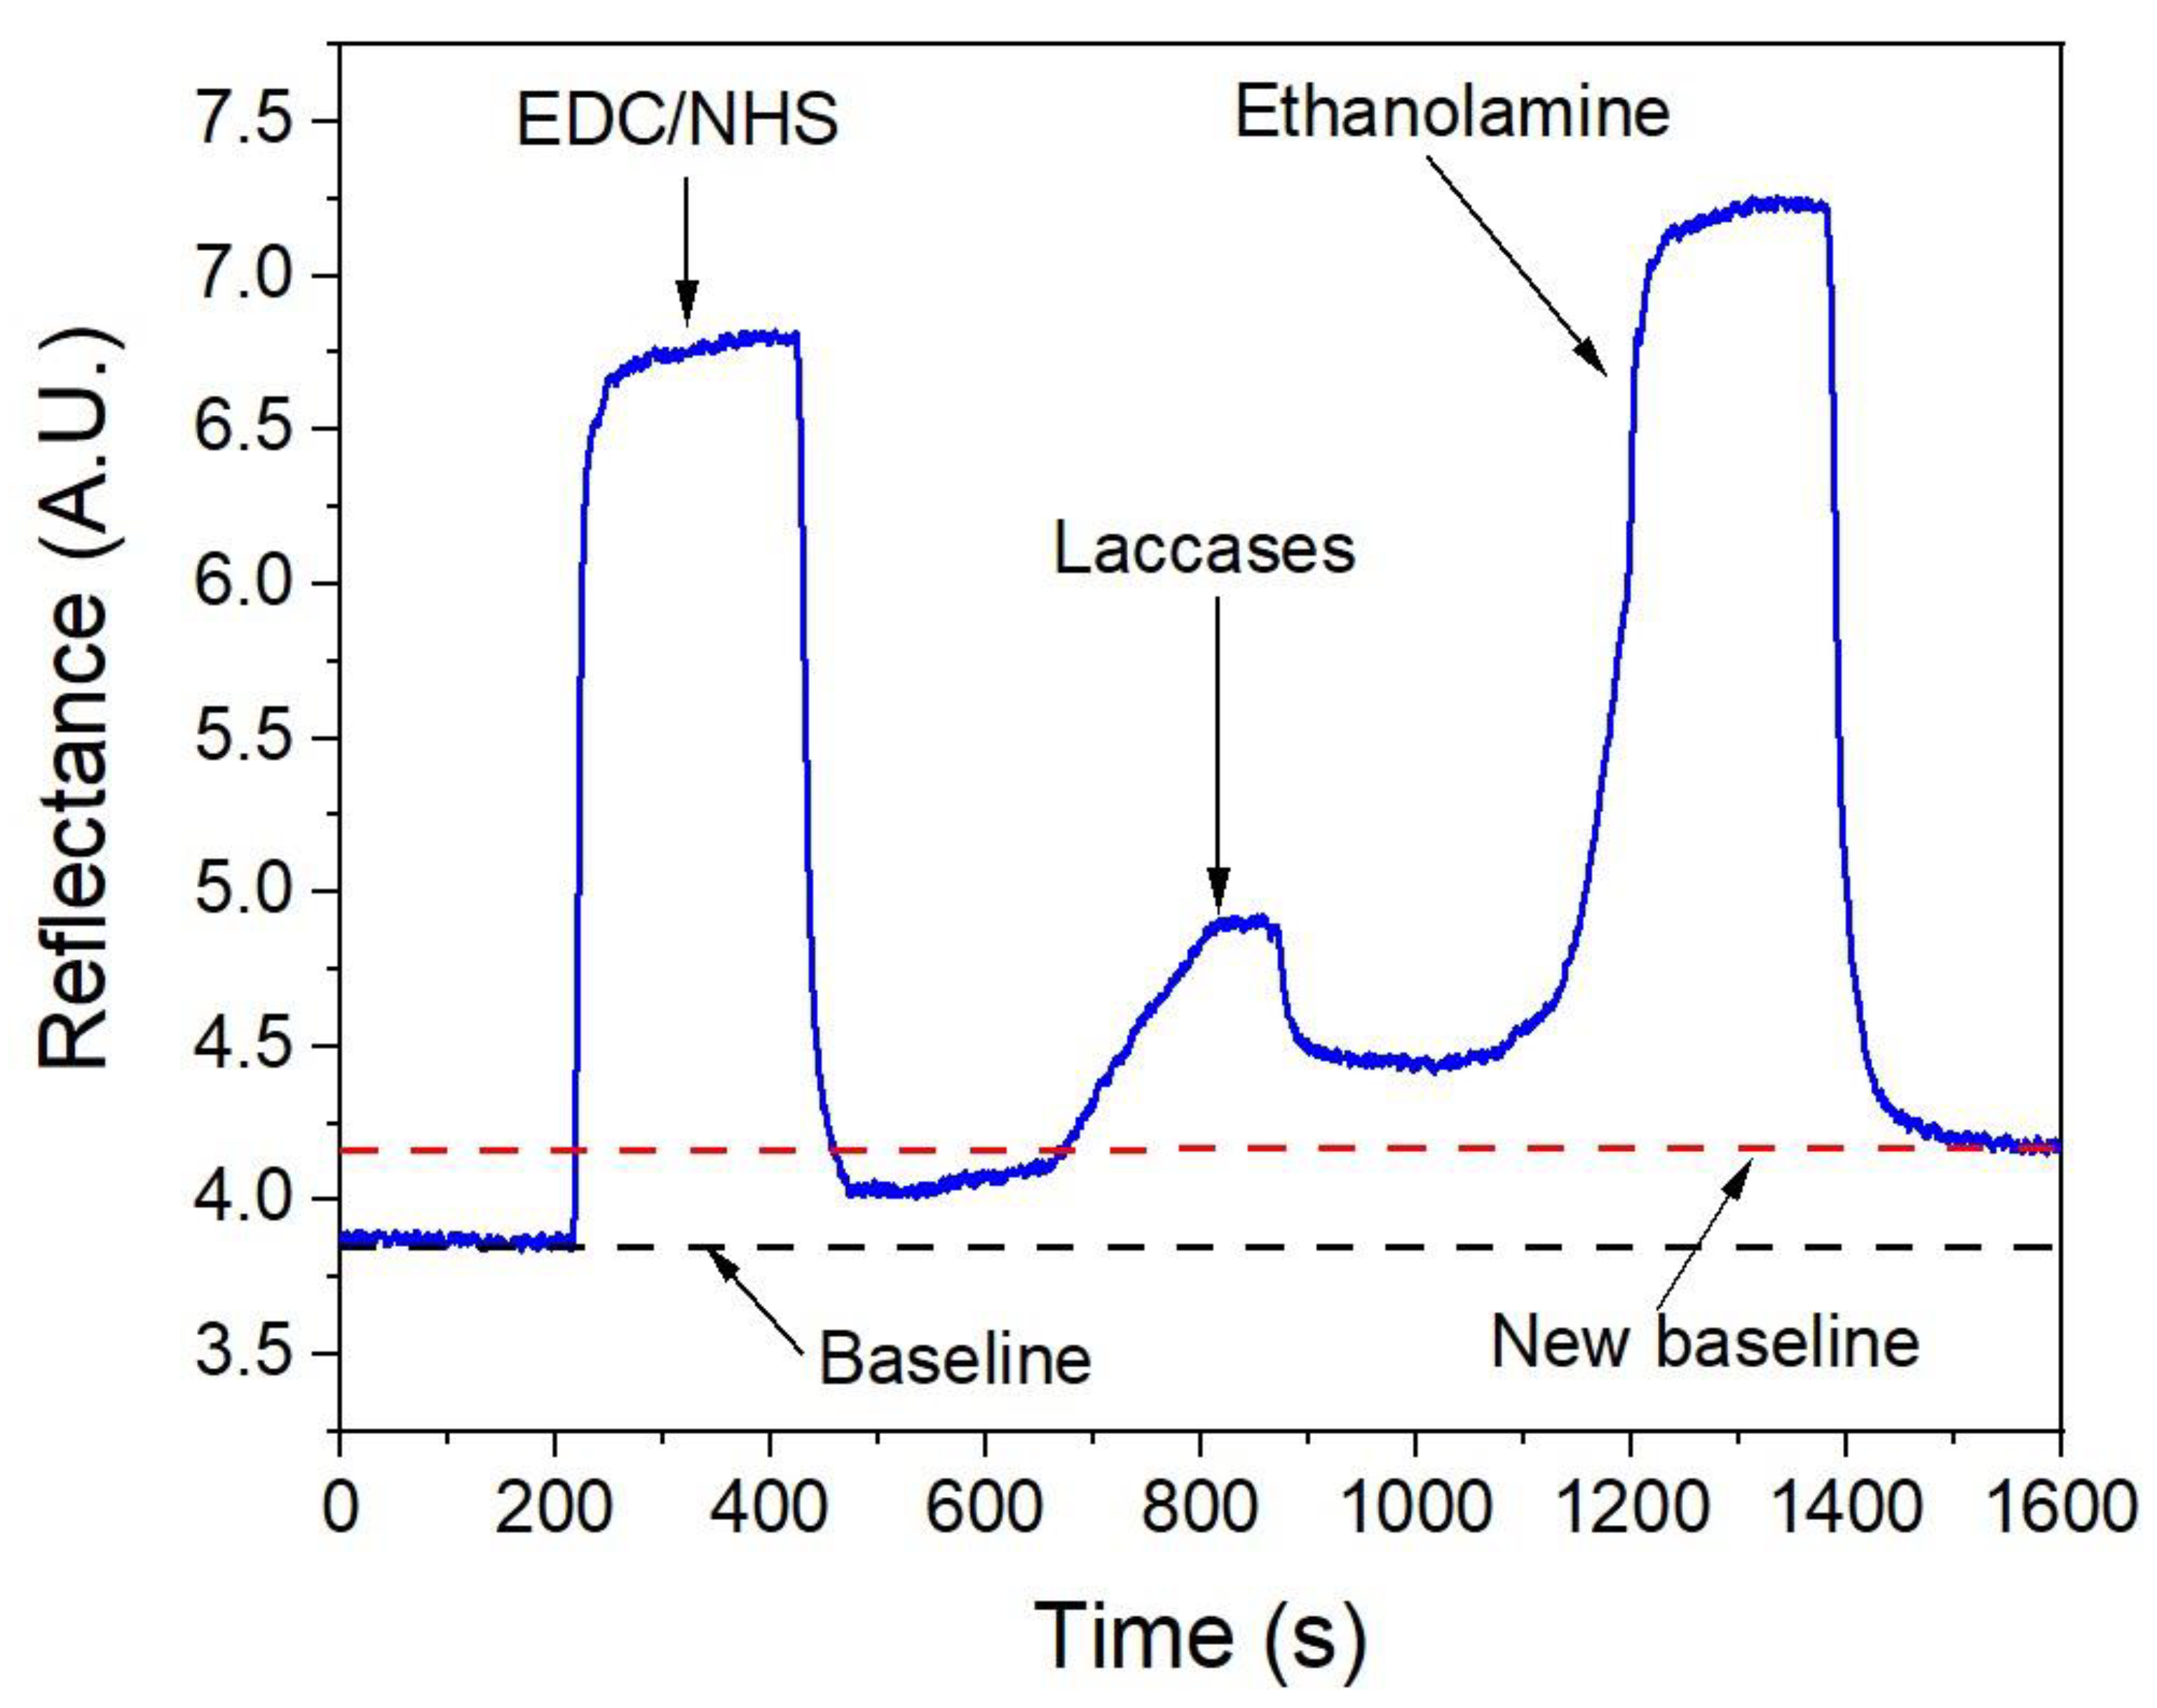
Figure 4.
Calibration curve of methylene blue.
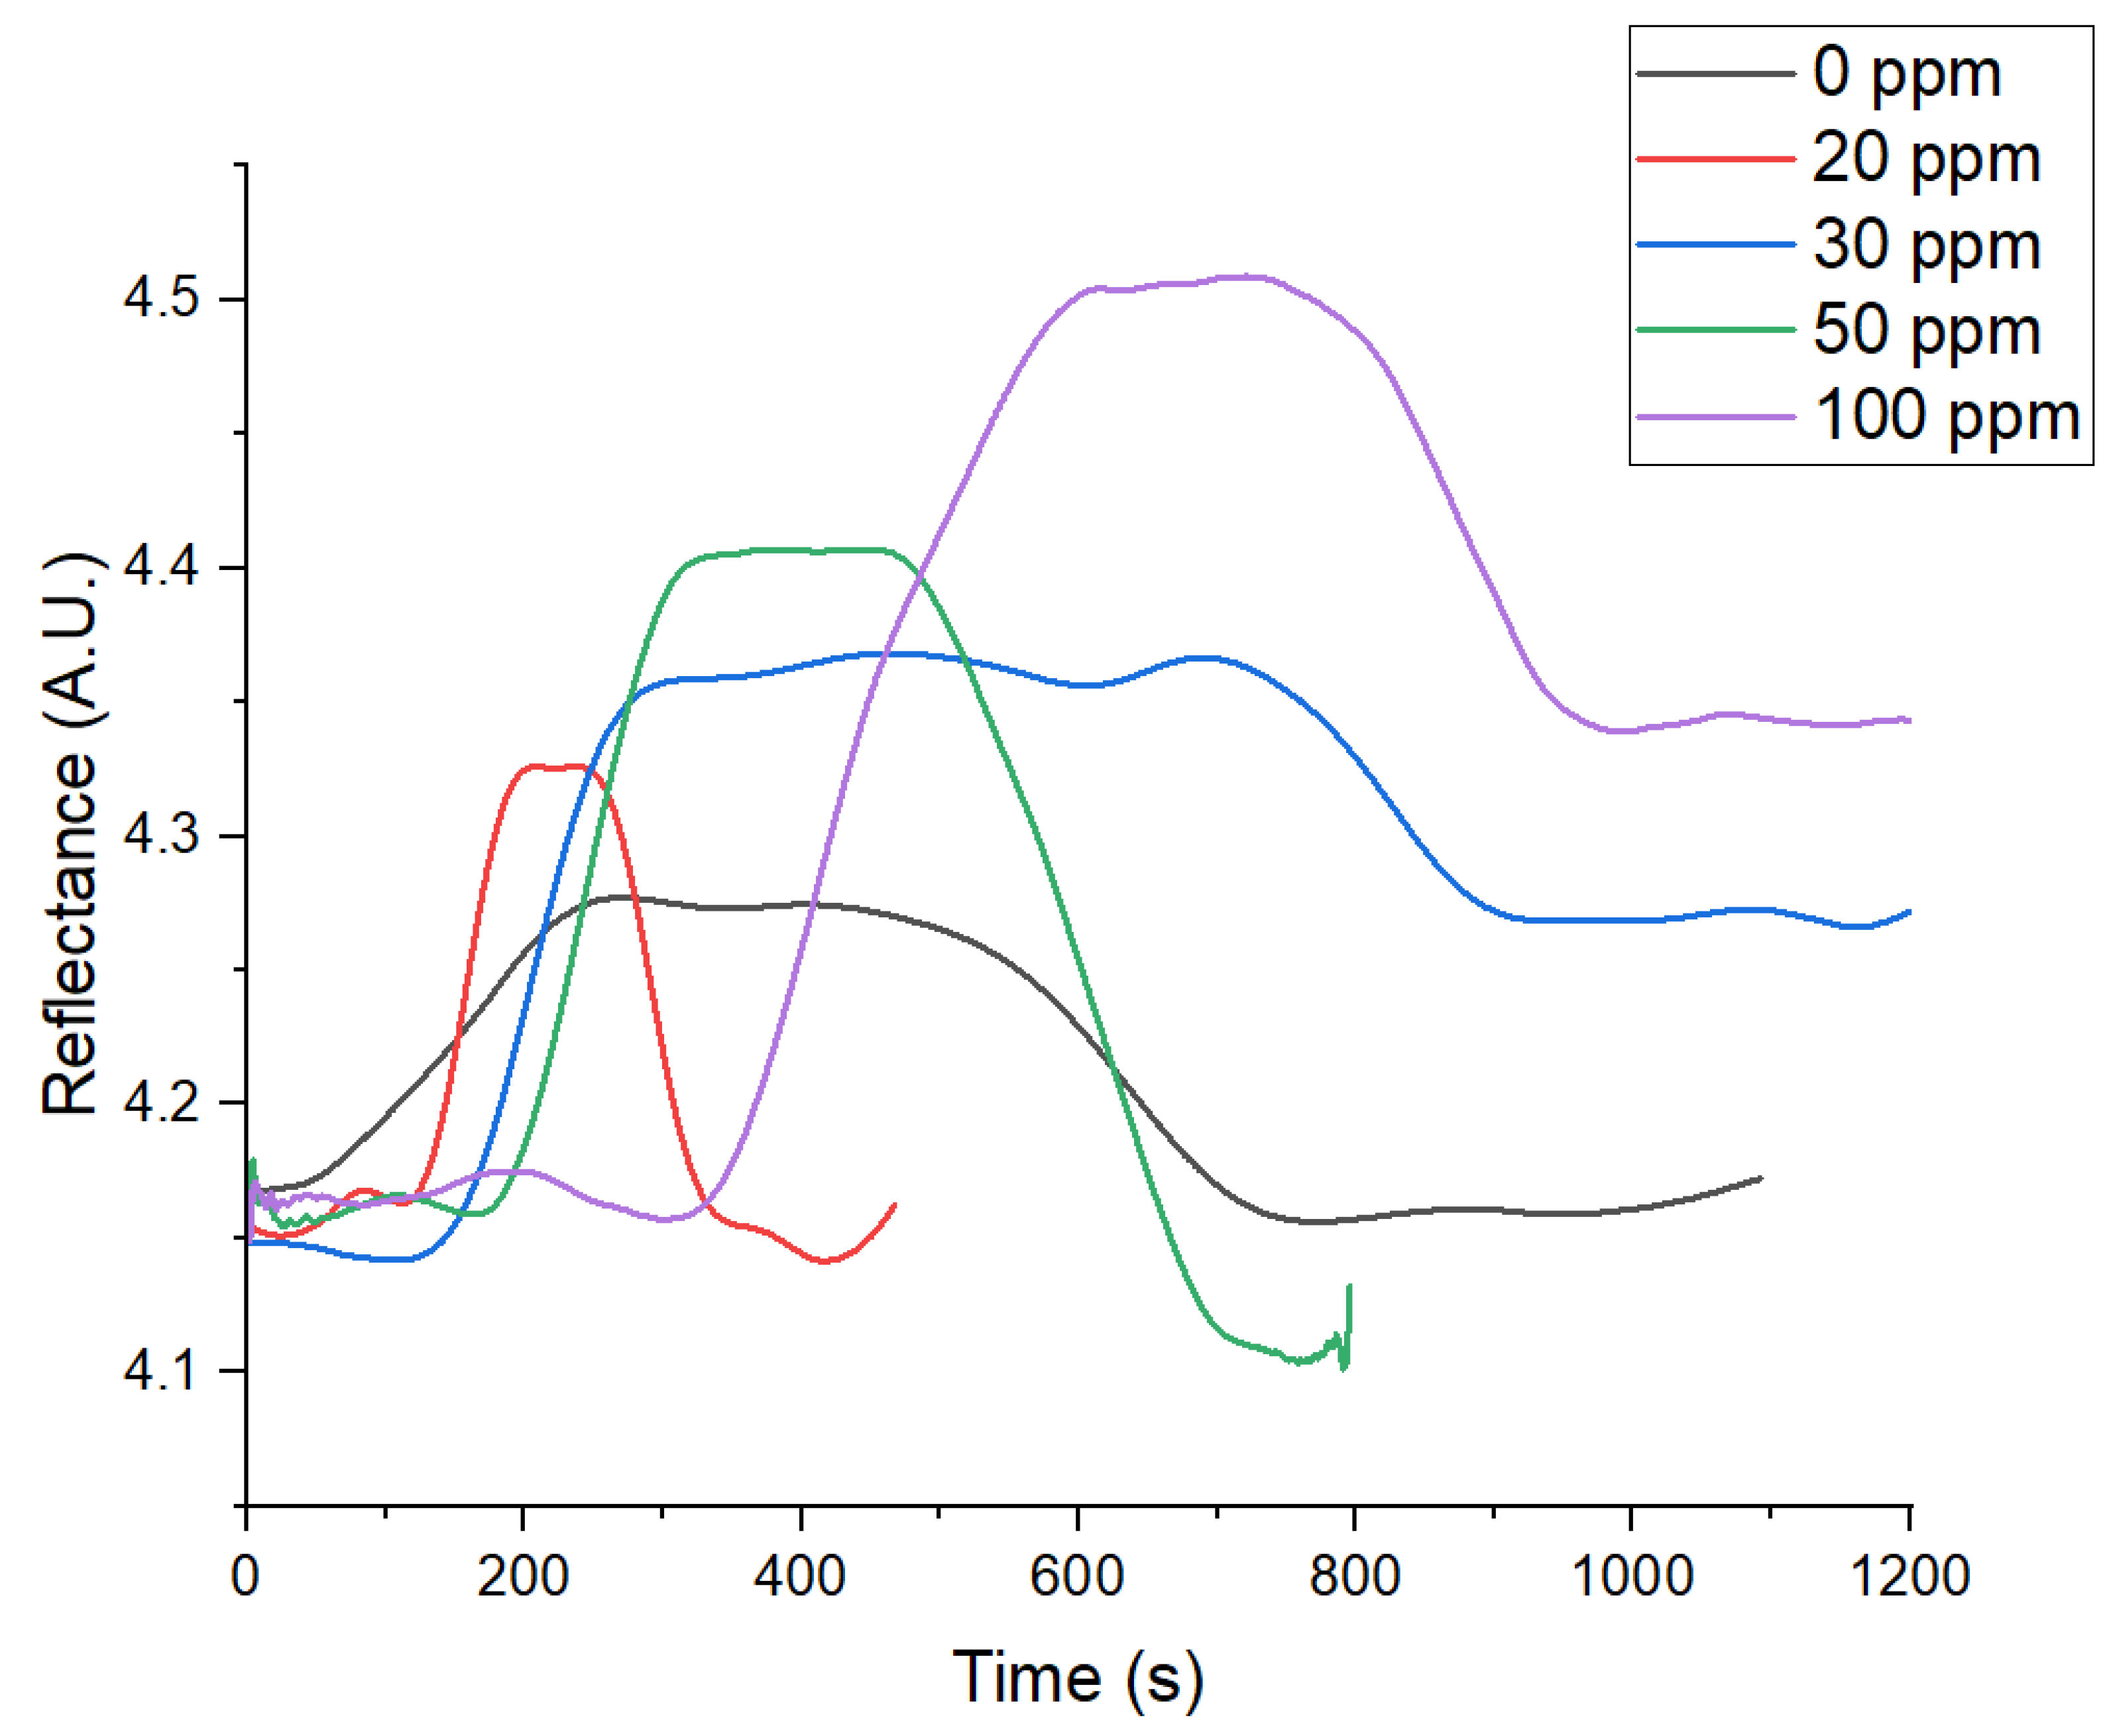
Figure 5.
Immobilization process of laccases.
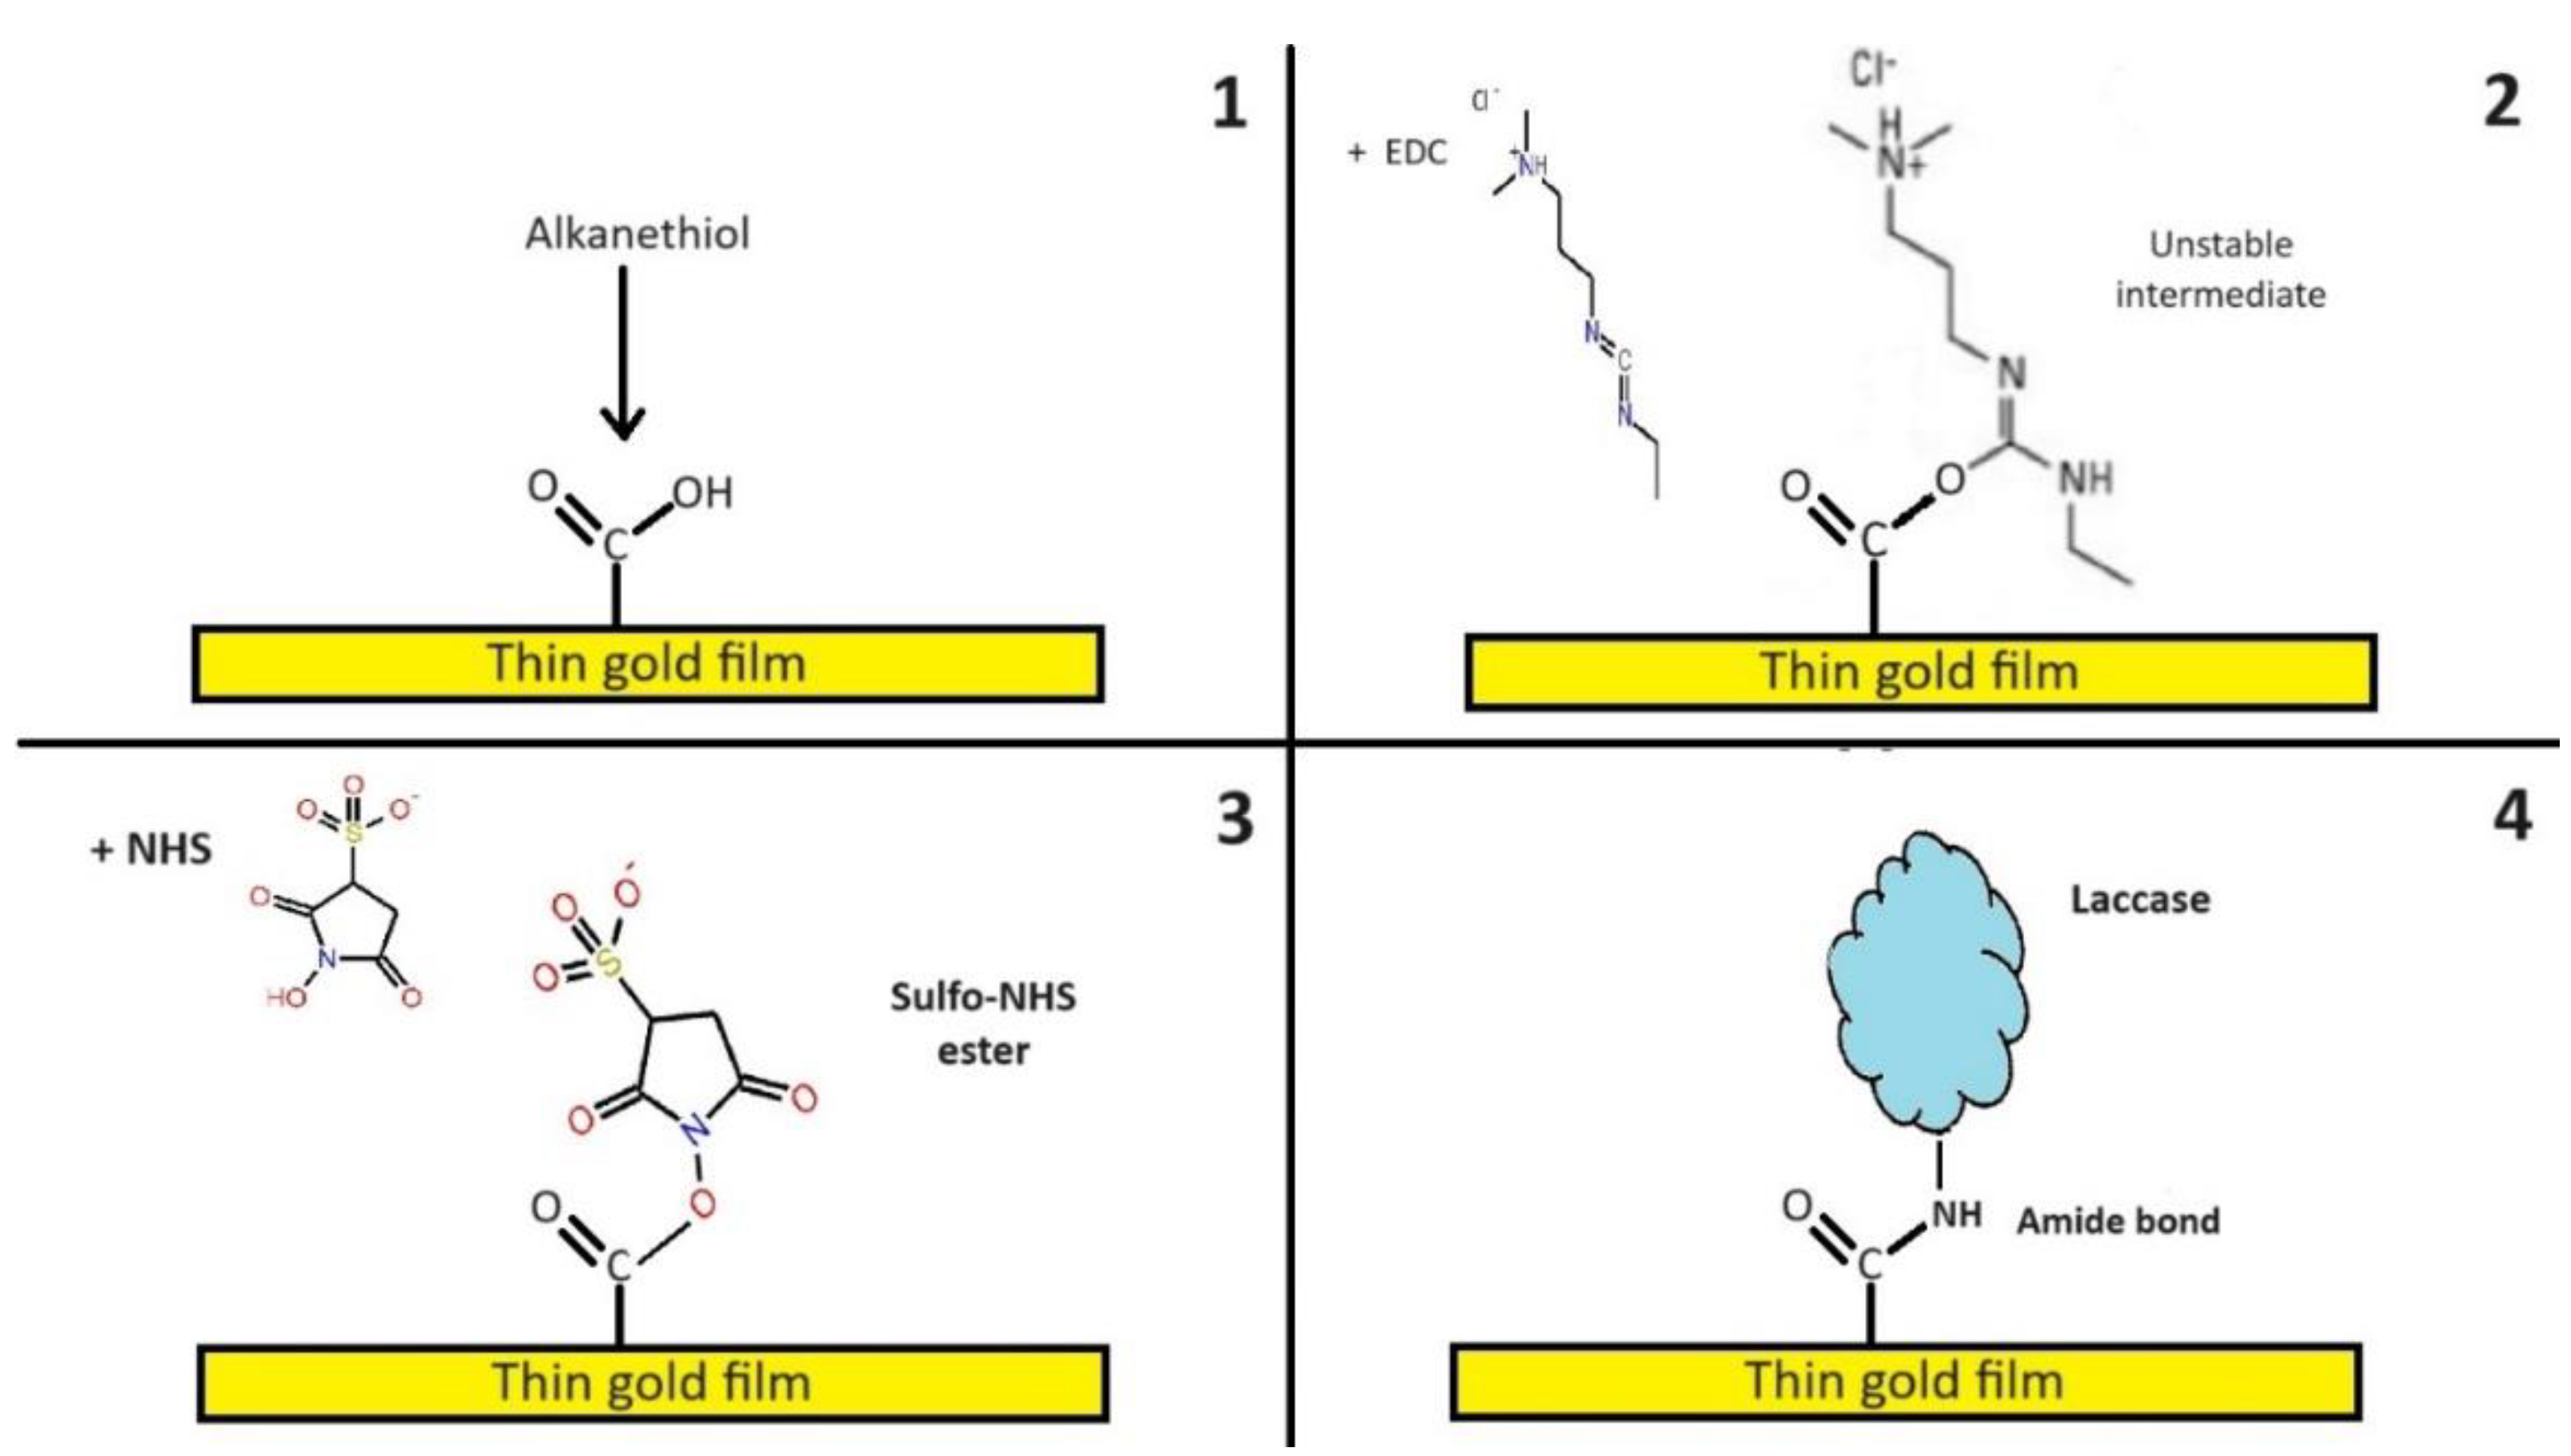

Table 1.
Analytical parameters of the method (n=2).
| LOD | 4.61 mg L-1 |
| LOQ | 15.37 mg L-1 |
| Working range | 0-100 mg L-1 |
| R2 | 0.9614 |
| % of recovery | 122.46± 4.41. |
Table 2.
Physical and chemical characteristics of the rainwater sample (n=2).
| Parameter | Concentration | Parameter | Concentration |
|---|---|---|---|
| Total hardness | 25 mg/L | Total chlorine | < LOD |
| Free chlorine | < LOD | Fluoride | < LOD |
| Iron | < LOD | Cyanuric acid | < LOD |
| Copper | < LOD | Ammonia chloride | 5 mg/L |
| Lead | < LOD | Bromine | 0.5 mg/L |
| Nitrate | < LOD | Total alkalinity | < LOD |
| Nitrite | < LOD | Carbonate | < LOD |
| Monopersulfate | < LOD | pH | 6.4 |
< LOD = Lower than the limit of detection.
Disclaimer/Publisher’s Note: The statements, opinions and data contained in all publications are solely those of the individual author(s) and contributor(s) and not of MDPI and/or the editor(s). MDPI and/or the editor(s) disclaim responsibility for any injury to people or property resulting from any ideas, methods, instructions or products referred to in the content. |
© 2024 by the authors. Licensee MDPI, Basel, Switzerland. This article is an open access article distributed under the terms and conditions of the Creative Commons Attribution (CC BY) license (http://creativecommons.org/licenses/by/4.0/).
Copyright: This open access article is published under a Creative Commons CC BY 4.0 license, which permit the free download, distribution, and reuse, provided that the author and preprint are cited in any reuse.


