Preprint
Article

This version is not peer-reviewed.

Correlation Between Theoretical Permanganate Index Method and Electrochemical Responses of Cyclic Voltammetry for the Detection of Organic Matter

Submitted:

02 March 2026

Posted:

03 March 2026

You are already at the latest version

Abstract
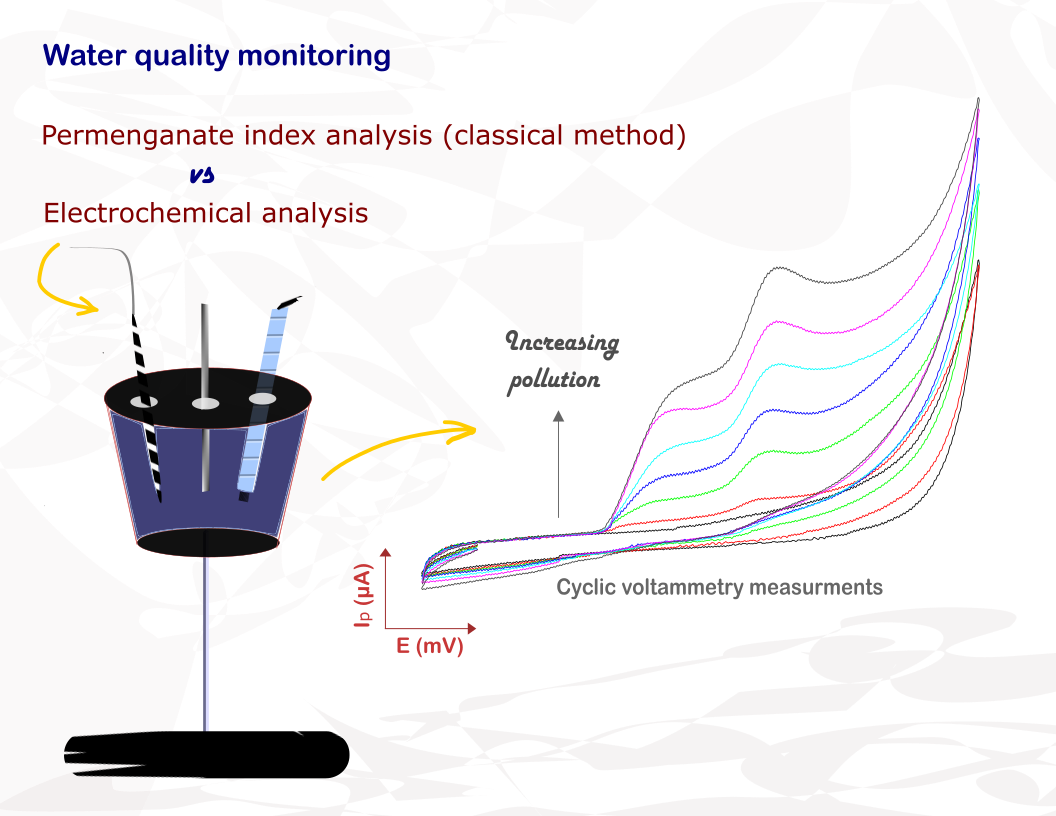
Water pollution is one of the most critical societal, environmental challenges and remains a persisting problem worldwide. The origin of this pollution is diverse while organic matter occupies a significant portion originating from different sources. This creates major environmental and health risks, requiring reliable and sensitive analytical tools for effective monitoring. The permanganate index stands as a conventional assessment method for organic pollution, but it demonstrates compound non-specificity toward compounds and limited sensitivity to various contaminant structures. This research introduces cyclic voltammetry as a standalone electrochemical method which provides sensitive detection and characterization of organic oxidizing compounds. Six organic compounds including gallic acid, phenol, oxalic acid, ascorbic acid, salicylic acid and p-benzoquinone were used as model compounds and studied in aqueous media. These compounds were analyzed individually, in single-compound mode, to characterize its redox behavior and to identify the voltammetric peaks. Subsequently, a multi-compound analysis was studied to check for the validity of the concept in a more complex matrix. Notably, a strong linear correlation was observed between the measured charge and the theoretical permanganate index, highlighting the quantitative reliability of the electrochemical method. Comparing the obtained results with the permanganate index method confirmed the superiority of cyclic voltammetry in terms of response time and detection capability. The outcomes demonstrate that cyclic voltammetry functions as a robust alternative to the classical chemical oxidation method for environmental water assessment.
Keywords: 
;  ;  ;  

1. Introduction

Environmental pollution occurs when substances or energy enter the natural environment accidentally or intentionally in amounts or forms that create negative impacts on ecological systems and human wellness [1,2]. Particularly, chemical substances such as heavy metals, pesticides and industrial solvents negatively affect the ecosystem and their effects depend on their concentration, persistence, and toxicity levels [3,4]. Organic matter constitutes a significant portion originating from different sources (agricultural and industrial waste discharges) and represents a significant issue among different pollution types [5]. These pollutants can be categorized into two main types including biodegradable organic materials such as manure and sewage sludge, and secondly persistent organic pollutants which include phenolic pollutants, organochlorines like DDT and polychlorinated biphenyls (PCBs), etc. The persistence and accumulation of these compounds in organisms, combined with their long-term toxicity at minimal concentrations make them particularly hazardous [6].
In recent years, the combined effects of increasing demand for high-quality water due to rapid population growth and climate change (reduced rainfall and increasing dryness) have accelerated the degradation of water resources [7,8]. These challenges highlight the need for advanced monitoring systems to ensure high-quality water and sustainable resource management [9,10]. It becomes of high importance to preserve the water availability and its quality to ensure the water security.
To evaluate environmental pollution in aqueous systems caused by organic pollutants, both physicochemical and biological measurements are typically used. Key parameters for this assessment include biochemical oxygen demand (BOD) and chemical oxygen demand (COD), which measure the presence of biodegradable and oxidizable organic matter [11]. Elevated BOD/COD ratios indicate high levels of organic pollutants, which can lead to oxygen depletion and harm aquatic organisms [11,12]. Total organic carbon (TOC) is another important indicator of organic pollution levels measuring the amount of carbon present in organic compounds in water samples [13]. Additionally, permanganate index a typical measure used as a standard approach to determine the oxidizable portion of organic matter as well as nitrogen and phosphorus concentrations which are key indicators of eutrophication potential and overall water quality [14].
Traditional methods for assessing organic pollution in aquatic environments, such as the permanganate index, remain popular due to their ease of application and economic viability [15,16]. This method uses potassium permanganate to oxidize organic matter in an acidic medium, estimating the oxidizable fraction of organic and readily oxidable compounds [17]. However, the widespread use of this method has several major limitations that need to be considered [18]. The method lacks molecular specificity, as it indiscriminately oxidizes both biodegradable and refractory compounds, while underestimating the total organic load compared to more comprehensive measurements. Furthermore, the method does not allow for the measurement of the toxicity of detected pollutants or their ecological impact. Environmental monitoring requires more advanced analytical strategies that are sensitive, selective, and integrated [19].
In this context, cyclic voltammetry is proposed as a promising electrochemical technique for detecting organic pollutants [20]. It offers several advantages over classical methods, including improved analytical precision, increased speed, reduced use of chemical reagents, and enable the identification and differentiation of various organic compounds based on their unique redox behavior. In this study, we present a cyclic voltammetry-based method, highlighting its benefits for detecting oxidizable organic matter, a proof-of-concept is developed to demonstrate its feasibility and compare its performance with the traditional permanganate index method.

2. Materials and Method

2.1. Chemicals and Solutions

Phenol (C₆H₅OH, CAS No. 108-95-2, ref. FE0480, purity ≥ 99⁒) was purchased from Scharlau. Ascorbic acid (C₆H₈O₆, CAS No. 50-81-7, ref. 440063N, purity ≥ 99⁒), salicylic acid (C₇H₆O₃, CAS No. 69-72-7, ref. 300384B, purity ≥ 99%, GPR grade), and oxalic acid (H₂C₂O₄, CAS No. 144-62-7, ref. 294234U, purity ≥ 99.5 ⁒, GPR grade) were purchased from GPR™. p-benzoquinone (C6​H4​O2, CAS No. 106-51-4, ref. B10358, purity ≥ 98⁒) was purchased from Sigma-Aldrich®. Gallic acid monohydrate (C₇H₆O₅, CAS No. 5995-86-8, ref. GRM233, purity ≥ 98⁒) was purchased from Himedia. These compounds were chosen for their environmental relevance and their electrochemical behavior as electroactive species. These chemicals were employed as organic pollutants models to evaluate the sensitivity, selectivity, and applicability of the electrochemical method described this study. Sodium oxalate (C2O4Na2, CAS No. 62-76-0, ref. 10258, purity ≥ 99%) and potassium permanganate (KMnO4, CAS No. 7722-64-7, ref. 29644, purity ≥ 99%) were respectively purchased from GPR™ and AnalaR® and used for the determination of experimental permanganate index. All reagents used in this study were of analytical grade and employed without any further purification.
Cyclic voltammetry measurements were performed in acidified aqueous medium (pH = 2), with a supporting electrolyte composed of sodium sulfate anhydrous (Na2SO4, CAS No. 7757-82-6, ref. GRM1037, purity ≥ 99⁒) purchased from Himedia®, adjusted at 0.1 mol/l to maintain stable ionic strength. The pH of the solutions was adjusted using sulfuric acid (H2SO4, CAS No. 7664-93-9, ref. 20700.323, purity of 95%). Importantly, the working medium (Na2SO4 at pH = 2) was chosen to align our experimental conditions with those of the permanganate index test, traditionally performed in an acidic medium [21]. This similarity enhances the relevance of the observed correlation between our electrochemical response and the permanganate index. Stock solutions of the six selected organic compounds were prepared at a concentration of 25 mmol/l. All the prepared solutions were stored in dark to prevent photodegradation of light-sensitive compounds.

2.2. Electrochemical Instrument and Setup

A potentiostat (AUTOLAB, PGSTAT 204) purchased from Metrohm®, operates with Nova 2.1 software was used to control the experiments and data processing. Cyclic voltammetry experiments were conducted using a conventional three-electrode cell (purchased also from Metrohm, ref. 61414010). The setup consists of a graphite working electrode (diameter of 2 mm corresponding to a surface area of 3.14 mm2), a platinum counter electrode (surface area of 25 mm2), and an Ag/AgCl reference electrode (KCl, 3M) purchased from Radiometer analytical (ref. CL111, RD1015TSA). Prior to each measurement, the graphite working electrode was polished using successive 2000 and 4000 CW-grit abrasive papers then rinsed with distilled water. Traditionally, the 2000-grit polishing set (approx. P2500) is used for surface refining and preparing the electrode surface for final polishing stage. This allows to renew electrode active sites by removing polymerized products while the 4000-grit polishing set (approx. P4000) is used to achieve a mirror-like, scratch free and highly polished surface finishing. This ensures a clean and reproducible electrode surface (by generating a consistent surface area following each polishing step) ideal for electrochemical experiments. All measurements were performed at room temperature (Figure S1).
Cyclic voltammograms were recorded within a potential window ranging from − 0.5 V to + 1.8 V, using a scan rate of 0.1 V.s-1. These parameters were selected to enable precise characterization of the electrochemical responses, taking also into account the solvent window in the working acidified aqueous medium.

2.3. Electrochemical Data Processing

The electrochemical charge (Q) expressed in coulomb or ampere-seconds (A.s), represents the quantity of electrons transferred during the electrochemical reaction. By definition, the charge is directly proportional to the number of electrons transferred (n) according to the fundamental relationship of Faraday’s law [22]:
Q = n × F × N
where: n is number of electrons transferred per molecule in the electrode reaction;
F is the Faraday constant, the charge per mole of electrons and;
N is number of moles of the electroactive species
After recording the cyclic voltammograms, the surface area was determined by integrating the current with respect to time (Q = ʃ i dt). This current arises from the oxidation or the reduction reactions occurring at the electrode surface, which inherently involve electron transfer processes. Therefore, integrating the area under the CV peak allows for a quantitative estimation of the molecules actually oxidized or reduced, reflecting the true electrochemical kinetics of the reaction.
To find the electrochemical charge using the potentiostat (AUTOLAB, PGSTAT 204), this mathematically corresponds to the area under the faradaic current curve on the voltammogram expressed in ampere/volt (A.V-1) multiplied by the scan rate (V.s-1) to yield the net charge in coulomb. This approach was systematically applied to each compound investigated in this study.
To proceed with the surface area determination, an analysis command of peak search was added for each voltammogram which allows manual location of the oxidation and/or the reduction peak(s). For non-uniform peaks, a baseline correction step was applied, which is an essential step in quantitative cyclic voltammetry analysis. This method involves defining a baseline, which can be a mathematical function (e.g.; exponential mode), under the peak of interest. The contribution of this baseline is then subtracted from the total current, thereby eliminating the effects of background currents and significantly improves the accuracy and reproducibility of the results.

2.4. Theoretical Determination of Permanganate Index

The theoretical determination of permanganate index is achieved by establishing the relative redox equations for each compound to deduce the overall equation and to determine the specific stoichiometry of permanganate. In an acid medium, permanganate ions typically accept 5 electrons (common reduction equation):
MnO₄ + 8 H+ + 5 e → Mn2+ + 4 H2​O
The organic matter is oxidized according to its specific equations, which allows for the determination of the molar ratio and the conversion factor to oxygen. The conversion factor is calculated by considering the oxygen reduction equation:
O2 + 4 H+ + 4 e→ 2 H2​O
The stoichiometric ratio is based on the number of electrons transferred in the reduction reactions. Comparing between permanganate (accepts 5 e) and oxygen (accepts 4 e), a conversion factor (f) is used as follows: f = 5/4 = 1.25
Multiplying the molar mass of O2 (32 g/mol) by the conversion factors gives: 32 * 1.25 = 40. This value 40 represents the equivalent mass of oxygen corresponding to the number of electrons transferred per mole of permanganate. It serves as a conversion factor to express the amount of oxidizable matter in terms of equivalents oxygen demand.
In this section, the theoretical permanganate index is calculated for each studied compound following the stoichiometric principles of oxidation by potassium permanganate. Following the overall redox equation, the theoretical permanganate index (expressed in mg O2 / L) is calculated by multiplying the concentration by the total number of transferred electrons ration and by a conversion factor of 40 as follows:
PI (theoretical) = C * n * 40
where:
C is the concentration of oxidable compound (in mol/L)
n a is ratio (number of electrons transferred in the oxidation equation divided by 5)
40 is a conversion factor (equivalent molar mass of oxygen)
  • Ascorbic acid (C₆H₈O₆)
Oxidation equation: C₆H₈O₆ → C₆H₆O₆ + 2 H+ + 2 e
Number of electrons transferred: 2 electrons per mole of ascorbic acid
Overall redox equation: 5 C₆H₈O₆+ 2 MnO₄ + 6 H +→ 5 C₆H₈O₆ + 2 Mn2+ + 8 H2​O
Coefficient: 2/5 = 0.4
PI (theo) = Cascorbic acid * 0.4 * 40
2.
Salicylic acid (C₇H₆O₃)
Oxidation equation: C₇H₆O₃ → C₇H₄O₃ + 2 H+ + 2 e
Number of electrons transferred: 2 electrons per mole of salicylic acid
Coefficient: 2/5 = 0.4
Overall redox equation: 5 C₇H₆O₃ + 2 MnO₄ + 6 H+→ 5 C₇H₄O₃ + 2 Mn2+ + 8 H2​O
PI (theo) = Csalicylic acid * 0.4 * 40
3.
p-benzoquinone (C6​H4​O2)
Oxidation equation: C6​H4​O2​ + 2 H2​O → C6​H6​O4 + 2 H+ + 2 e
Number of electrons transferred: 2 electrons per mole of benzoquinone
Coefficient: 2/5 = 0.4
Overall redox equation: 5 C6​H4​O2 ​+ 2 MnO4​ + 16 H+ + 10 H2​O → 5 C6​H6​O2 + 2 Mn2+ + 10 H+ + 8 H2​O
PI (theo) = Cbenzoquinone * 0.4 * 40
4.
Phenol (C₆H₅OH)
Oxidation equation: C₆H₅OH + H2O → C₆H₄O₂ + 4 H+ + 4 e
Number of electrons transferred: 4 electrons per mole of phenol
Coefficient: 4/5 = 0.4
Overall redox equation: 5 C₆H₅OH + 4 MnO₄- + 12 H+ → 5 C₆H₄O₂ + 4 Mn2+ +11 H2​O
PI (theo) = Cphenol * 0.8 * 40
5.
Gallic acid (C₇H₆O₅)
Oxidation equation: C₇H₆O₅ → C₇H₂O₅ + 4 H+ + 3 e
Number of electrons transferred: 3 electrons per mole of gallic acid
Coefficient: 3/5 = 0.6
Overall redox equation: 5 C₇H₆O₅ + 3 MnO₄ + 9 H+ → 5 C₇H3O₅ + 3 Mn2+ + 12 H2​O
PI (theo) = Cgallic acid * 0.6 * 40
6.
Oxalic acid (H₂C₂O₄)
Oxidation equation: H₂C₂O₄ → 2CO₂ + 2 H+ + 2 e
Number of electrons transferred: 2 electrons per mole of oxalic acid
Coefficient: 2/5 = 0.4
Overall redox equation: 5 H₂C₂O₄ + 2 MnO₄ + 6 H+ → 10 CO₂ + 2 Mn2+ + 8 H2​O
PI 0. * 40
Table S1 summarizes the key characteristics of each organic compounds investigated in this study. For each compound, the molecular formula, the balanced redox reaction under acidic conditions, the total number of electrons transferred during complete oxidation, and the theoretical permanganate index expressed in mg O2 / L were determined based on standard stoichiometric principals.
To remember, our approach consists of establishing a rigorous stoichiometric link between the CV measurements and the theoretical PI. This represents an essential preliminary step to validate the methodology prior comparison with the experimental permanganate index, which is subject to kinetic constraints. The objective of the present study was precisely to establish this fundamental stoichiometric correspondence, providing a proof-of-concept that confirms the feasibility and conceptual validity of the CV-based approach.

3. Results and Discussion

Cyclic voltammetry is a fundamental electrochemical technique for studying the redox properties of chemical species [23,24]. The latter was employed for the analysis of many compounds in single-mode configuration where only one target compound is analyzed but also used for the multi-species analysis under specific experimental conditions. Our approach aims to compare the capability of the electrochemical method (cyclic voltammetry) to quantify oxidizable organic matter against a standard chemical reference (the permanganate index method). To proceed, six compounds were chosen as model species based on their electrochemical activities and their environmental relevance. First, each compound was investigated alone to assess its electrochemical behavior followed by the investigation of a mixture of compounds in a multi-species configuration. This allows to assess the electrochemical response in a more complex matrix (sample-like matrix).
This section is divided into two parts: the first part focuses on the electrochemical characterization of the single-compound analysis (p-benzoquinone, ascorbic acid, gallic acid, oxalic acid, phenol and salicylic acid) using cyclic voltammetry to determine its oxidation behavior, peak characteristics, and concentration-dependent charge response. The second part addresses the electrochemical response in multi-compounds analysis mode. To simulate more complex matrices and assess potential peak overlaps or interferences, mixtures containing three to six compounds were analyzed under the same experimental conditions.

3.1. Single Compound Analysis

In this section, each compound between the list of the selected six species for this study (ascorbic acid, salicylic acid, p-benzoquinone, phenol, gallic acid, and oxalic acid) was separately studied by cyclic voltammetry. This allows to characterize their redox behavior by measuring the current response induced by the application of linear varying potentials. For each measurement cycle, systematic identification of the peak characteristics was performed using advanced peak current methods. These peaks provide essential information on the redox behavior (oxidation and/or reduction peak position, peaks current, peak area, start and end base, etc.). This approach aims to compare the capability of the electrochemical method to quantify oxidizable organic matter against a standard chemical reference method.
First, p-benzoquinone was studied by cyclic voltammetry at a scan rate of 0.1 V.s-1 over a potential range of - 0.4 V to + 1.2 V vs Ag/AgCl. This compound was selected for electrochemical analysis because of its significant electrochemical behavior (well-defined redox-behavior) [25] and its relevance as contaminant of environmental concern [26,27]. The obtained cyclic voltammograms are presented at Figure 1. The electrochemical behavior of benzoquinone was systematically investigated using cyclic voltammetry over a concentration range of 1 mM to 9 mM in order to evaluate the reversibility of its redox process. The recorded voltammograms exhibit a well-defined anodic peak for the oxidation process, with a peak current intensity (Ip, ox) that increases linearly with p-BQ concentration, from 5.52×10⁻⁶ A at 1 mM to 3.27 ×10⁻⁵ A at 9 mM (Figure S2). Importantly, the anodic peak position (Ep, ox) also shows a clear increase with increasing concentration, ranging from 0,58 V to 0.66 V, accompanied by a small positive shift (approx. + 80 mV).
For the cathodic scan, the reduction peak current intensity (Ip, red) similarly increases in magnitude, from - 9.71×10⁻⁶ A to - 5.50×10⁻⁵A, with the peak position (Ep, red) slightly shifting towards more negative values (approx. - 90 mV), from 0.065V to - 0.025V, as the concentration increases. This consistent trend indicates that the peak potential for reduction is also concentration-dependent, exhibiting a small shift typical for a quasi-reversible system [28].
The relatively moderate separation between the anodic and cathodic peak potentials, combined with the linear dependency of peak currents on the concentration, confirms that the benzoquinone redox couple exhibits a quasi-reversible behavior under the experimental conditions employed, such a response is characteristic of semi-fast electron transfer process, where electron exchange at the transfer process, where electrode-solution interface occurs with minimal but measurable kinetic limitations. These results are in accordance with prior studies, where it is well-described that the redox process of benzoquinone is independent of the scan rate by studying (Ip1/2) which confirms the quasi-reversibility behavior of benzoquinone [29,30].
On the other hand, this section aims to evaluate the electrochemical behavior of p-benzoquinone by correlating between the electrochemical charge measured by cyclic voltammetry and the theoretical permanganate index (expressed in mg O2 / L). For instance, PItheo values were calculated based on the added p-BQ concentration as described in the experimental section. Figure 2 (a and b) illustrates the graphs showing the variation of the electrochemical charge versus the theoretical permanganate index for both oxidation and reduction processes. These graphs exhibit a clear linear relation between Q and PItheo. The high coefficient of determination (R2 = 0.992), for both processes) demonstrates a strong correlation between the electrochemical measurements and the corresponding theoretical permanganate index. This result demonstrates that the proposed electrochemical approach can effectively monitor the concentration of oxidizable compounds in aqueous samples containing p-BQ or similar electrochemically reversible species, validating the approach for both oxidation and reduction processes.
In this section, ascorbic acid was also examined separately to assess its electrochemical behavior and to correlate its electrochemical measurements to the classical chemical method responses [27]. Ascorbic acid is a well-characterized reducing agent, commonly present in aqueous environmental and biological systems [31]. Its inclusion in this study serves to further validate the applicability and performance of the voltammetric method.
Cyclic voltametric measurements were performed within a potential window ranging from – 0.4 V to + 1.4 V vs Ag/AgCl, at a scan rate of 0.1 V.s-1. A series of concentrations from 1 mM to 10 mM was analyzed. The obtained voltammograms exhibit a progressive increase in anodic peak current intensity (Ipa) with increasing concentration (Figure S3), along with a shift in the oxidation peak potential (Epa) from + 0.55 V to + 0.78 V. This shift toward more positive potentials at higher concentrations is indicative of kinetic changes at the electrode interface, potentially associated with increased surface interactions or diffusional limitations (Figure 3a). The electrochemical behavior of ascorbic acid clearly indicates an irreversible oxidation mechanism with moderately-fast electron transfer, as evidenced by the absence of a cathodic peak and the unidirectional nature of the redox process. These findings about the irreversibility profile of ascorbic acid are consistent with already published studies, where the effect of scan rates on the oxidation peak confirms that the electroanalysis of ascorbic is under diffusion control [32,33].
Furthermore, a clear linear correlation was established between the measured anodic charge (in coulombs) and the theoretical permanganate index (mg O2 / L), as illustrated in (Figure 3b). This strong correlation (R2 = 0.991) confirms that the electrochemical response of ascorbic acid accurately reflects its contribution to the overall oxidizable organic load. These findings demonstrate that the applied voltammetric method is valid and reliable for the quantitative estimation of oxidizable organic matter contributed by reducing agents such as ascorbic acid, and that it represents a promising alternative to conventional chemical methods such as the permanganate index.
To continue the investigation of single compounds analysis, gallic acid was selected due to its well-established antioxidant capacity and its tri-hydroxylated phenolic structure, which renders it highly susceptible to oxidation [34]. Gallic acid is widely recognized as a model compound in antioxidant research and is frequently employed as a standard in electrochemical studies of polyphenolic systems, owing to its simple, well-characterized redox behavior.
Cyclic voltammetry experiments were performed using the same graphite working electrode (after polishing). The electrochemical scans were carried out within a potential window ranging from – 0.1 V to + 1.2 V vs Ag/AgCl at a scan rate of 0.1 V.s-1. Gallic acid solutions were tested at concentration from 1 mM to 10 mM. The resulting voltammograms exhibit a single, well-defined anodic peak, whose position displays a slight positive shift with increasing concentration (Figure 4a). At 1 mM, the anodic peak was located at approximately + 0.66 V, while at 10 mM, it shifts marginally to + 0.67 V. Nevertheless, this shift is extremely small (approx. 10 mV) and can mostly attributed to well-known electrochemical artifacts (minor fluctuations in potential of the reference electrode Ag/AgCl, iR-drop, or capacitive charge of electrical double layer) rather than to a genuine concentration-dependent modification of the oxidation potential. The absence of a cathodic peak and the small anodic shift indicate that the redox process is irreversible. This observation aligns with the established literature, where reported results imply that the anodic reaction is diffusion-controlled under mild conditions [35,36]. A clear increase in peak current intensity was observed with the increasing concentration (Figure S4), suggesting a linear and diffusion-controlled redox process. The proportional correlation between signal intensity and analyte concentration confirms the quantitative nature of the system under the applied condition.
To further assess the validity of the proposed methodology, the anodic charge (determined by peak integration multiplied by the scan rate) was compared to the theoretical permanganate index, which estimates the compound’s oxidative capacity based on stoichiometric considerations. A strong linear correlation was also obtained between the experimental charge values and the theoretical permanganate index, with a coefficient of correlation R2 = 0.991 (Figure 4b). This correlation underscores the reliability of cyclic voltammetry as a quantitative approach for evaluating the redox activity of organic compounds alternatively for chemical reference oxidation.
Moreover, oxalic acid was selected as a model compound for its well-documented electrochemical behavior and its relevance as a reducing agent in both biological and environmental redox system [37]. Its simple structure, water solubility, and established reactivity toward strong oxidants render it particularly suitable for method validation and comparative electrochemical studies.
Cyclic voltammetry was carried out using a graphite electrode in the potential range of + 0.4 V to + 1.8 V vs Ag/AgCl, at a scan rate of 0.1 V.s-1. The concentration of oxalic acid was varied between 1 mM and 7 mM. These experimental parameters were optimized to ensure peak definition, minimize capacitive currents, and maintain consistent electrochemical response across the tested range. Voltammograms exhibit a well-defined anodic oxidation peak, the peak potential (Epa) of which gradually increased from +1.44 V at 1 mM to +1.49 V at 7 mM (Figure 5a), suggesting a concentration-dependent shift likely due to increased electrode polarization and mass transport limitations at higher concentration. Concurrently, the peak current intensity (Ipa) exhibits a marked increase, ranging from 4.99 ×10⁻⁶ A at 1 mM to 6.91×10⁻⁵ A at 7 mM (Figure S5), consistent with a diffusion-controlled oxidation process. The voltametric profiles and the absence of a concentration cathodic peak in the reverse scan and the dependence of the scan rate indicate an irreversible electrochemical mechanism. These observations are aligned with already published articles where it was reported that oxalic acid shows irreversible electrooxidation process [38].
Quantitative analysis of the anodic charge, obtained by integrating the area under the oxidation peak multiplied by the scan rate, reveals a strong linear correlation with the theoretical permanganate index assigned to the oxalic acid. The corresponding plot illustrates this correlation displayed a well-defined linear relationship (Figure 5b), characterized by a high regression coefficient (R2 = 0.996). This strong agreement between the experimental and the theoretical values confirms the robustness of the electrochemical approach and validates its use a quantitative tool for assessing the redox behavior of individual oxidizable compounds.
Furthermore, phenol was selected due to its simple aromatic structure bearing a hydroxyl group. This makes it a relevant representative for assessing oxidative behavior under voltammetric condition [39]. Cyclic voltammetry was also employed to examine its electrochemical properties under consistent experimental parameters applied across all tested analytes.
The measurements were carried out at a scan rate of 0.1 V. s-1 over a potential window ranging from - 0.1 V to +1.6 V versus Ag/AgCl. The concentration of phenol was varied from 0.25 mM to 2.25 mM (Figure 6a). This concentration range was deliberately chosen based preliminary observations indicating that higher concentration let to rapid saturation of the oxidative current, compromising linearity. Thus, lower concentrations were selected to better explore the current-concentration relationship. For instance, phenolic compounds are known to generate quinone products, which polymerize on the electrode surface and lead to electrode fouling. This results in electrode passivation, reducing the performance of electrochemical process which may also reach complete blocking of electrode’s active site. To anticipate polymerization and electrode fouling, the graphite carbon-based electrode was mechanically polished prior to each measurement to prevents electrode passivation and regenerate fresh active site, followed by rinsing with distilled water to remove residual deposits [40,41]. The resulting voltammograms exhibit a single, well-defined anodic peak whose potential shifted slightly with increasing concentration. At 0.25 mM, the anodic peak appears at approximately + 0.97 V, progressively shifting to + 1.07 V at 2.25 mM. This positive shift in peak potential with concentration is characteristic of an irreversible electron transfer process, likely influenced by adsorptive or coupling reactions occurring at the electrode surface. The anodic peak current increased notably with phenol concentration. Specifically, the peak current intensity roses from 2.88×10⁻⁶ A at 0.25 mM to 2.27×10⁻⁵ A at 2.25 mM, indicating good sensitivity of the system to phenol concentration (Figure S6).
The electrochemical behavior of phenol was confirmed to be irreversible, as evidenced by the absence of a corresponding cathodic peak in the reverse scan and the observed shift in anodic potential. This irreversibility suggests a fast electron transfer that is not followed by a reversible redox couple, consistent with known oxidative mechanisms of phenol involving follow-up chemical reactions such as polymerization or dimerization on the electrode surface [42,43]. This behavior is typically reported in the literature suggesting that the absence of a corresponding reduction peak confirms the irreversibility of electrochemical oxidation process [44].
Finally, a correlation analysis between the experimentally obtained anodic charge and the theoretical permanganate oxidation index was performed. The analysis reveals a strong linear relationship, with a regression coefficient of R2 = 0.996 (Figure 6b). This high degree of correlation validates the electrochemical approach as a reliable and sensitive indirect method for assessing the oxidizing capacity of organic compounds. Overall, the findings confirm the robustness and the relevance of this methodology for comparative redox evaluation across different species.
Moreover, salicylic acid was selected as the last model compound due to its phenolic structure and its relevance in both environmental and biomedical contexts, which justify a deeper investigation of its electrochemical behavior [45,46]. This compound is also known for its well-documented anodic reactivity, making it a suitable candidate for voltametric analysis under the chosen experimental conditions.
The investigation was conducted using cyclic voltammetry, with a scan rate of 0.1 V. s-1 and potential window ranging from 0 to + 1.8 V versus Ag/AgCl. This range was chosen to encompass the complete anodic oxidation process without compromising signal stability or introducing secondary oxidation reactions at higher potentials. The examined concentration range extends from 0.25 mM to 2.25 mM. However, above 1.75 mM, a saturation phenomenon in the electrochemical response was observed, likely due to mass transport limitations or surface crowding effects at the electrode interface. This limitation was previously reported in the literature the anodic oxidation of salicylic acid on a carbon electrode shows carbon saturation at high concentration, consistent with surface coverage limitations [47,48]. Consequently, higher concentrations were excluded from quantitative analysis to maintain signal linearity. The resulting voltammograms displayed a single anodic peak, with a slight potential shift depending on the concentration. At 0.25 mM, the oxidation peak was observed at approximately +1.11 V, gradually shifting to + 1.14 V at 1.75 mM (Figure 7a). This small positive shift in peak potential is indicative of an irreversible process, suggesting the oxidation reaction is not accompanied by a corresponding reduction within the scanned potential range. The peak current intensity increases proportionally with concentration, ranging from 8.93×10⁻⁷ A at 0.25 mM to 3.69×10⁻⁵ A at 1.75 mM (Figure S7). This behavior is characteristic of a fast, diffusion-controlled electron transfer process. The absence of a cathodic peak during the reverse scan further supports the irreversible nature of the electrochemical system as already reported in the literature [49]. Due to this behavior (fast electron transfer), peak search integration for electrochemical charge quantification was challenging, particularly at low concentration. To address this limitation, baseline correction was applied manually to enable more accurate integration of the anodic peaks.
Finally, a good linear correlation coefficient (R2 = 0.994) was established between the electrochemical charge and the theoretical permanganate index (Figure 7b), validating the reliability of this electrochemical approach. This correlation confirms again that the anodic oxidation of salicylic acid can be effectively used as a proxy for its oxidizable potential, demonstrating the robustness and applicability of the developed method for quantitative analysis.

3.2. Multiple Compounds Analysis

After validating the concept of the proposed detection strategy for the analysis of organic oxidizing matters by electrochemistry on a single basis compound, a multi-compound analysis was investigated to check for the validity of the concept in a more complex matrix. It is well-known that the simultaneous detection of multiple species is always challenging and encounters interfering problem [50,51]. These conditions simulate complex environmental sample where many phenomena are expected to occur such as peaks overlap or merging especially if the investigated compounds have close or similar redox potentials [52], shifts in peaks potentials, electrode surface competition and diffusional interference [53]. For these reasons, the six compounds were primary divided into two groups and studied by cyclic voltammetry prior to studying a mixture composed of the six compounds together.
First, gallic acid, phenol, and oxalic acid were added together as a mixture in the electrochemical cell and investigated using the graphite carbon-based electrode. This mixture was chosen based on the initial oxidation potential for each compound as obtained in the below results (single compound analysis), which were respectively of + 0.42 V, + 0.88 V, and + 1.33 V. This allows to understand the electrochemical behavior of the oxidizing species that have different starting oxidizing potentials. The voltammograms were recorded within a potential window ranging from – 0.4 V to + 1.8 V vs Ag/AgCl, at a scan rate of 0.1 V.s-1 (Figure 8a). As shown, the electrochemical signal (current intensity) increases with the concentration of the mixture increasing (Figure S8). No separated peaks were identified, instead a single anodic curve was observed featuring two peaks appearing at + 0.65 V and + 1.0 V. To better understand this behavior, the corresponding charge for each measurement was measured after using the method of the baseline correction. This methodology is a critical step in voltammetry, as an inappropriate baseline can introduce non-faradaic contribution (capacitive current, background drift, etc.) that bias the integrated peak area [54]. To minimize this effect, we applied a manual baseline correction using a polynomial fitting approach, defined locally at the minimum between peaks or along a linear background segment depending on the experimental configuration, thereby ensuring an enhanced and precise methodology for the peak’s integration. The obtained charges are plotted versus the calculated theoretical permanganate index (found from the sum of concentrations of each compound added in the mixture). As illustrated, Figure 8b shows a linear relationship with a high correlation coefficient (R2 = 0.997). These results demonstrate a strong correlation between the electrochemical anodic charge of the oxidizing compounds in a multi-compound mode analysis and their corresponding theoretical permanganate index, thereby validating the effectiveness of the detection strategy in a more complex matrix.
After, a second mixture containing ascorbic acid, salicylic acid and p-benzoquinone was prepared and investigated. This mixture was particularly more complex since it contains a quasi-reversible compound (p-BP) which make the curve integration more challenging. For instance, the initial oxidation potential for each compound were respectively of + 0.30 V, + 1.0V and + 0.4V, which cover a wide potential range. The voltammograms were also registered within a potential window ranging from – 0.4 V to + 1.8 V vs Ag/AgCl, at a scan rate of 0.1 V.s-1. Figure 9a shows the electrochemical signal response (current intensity) versus the potential (voltammograms). As illustrated, the current increases with the concentration of the mixture increasing (Figure S9). Contrarily to the first mixture where only one single anodic curve was observed, a single anodic curve was observed featuring two peaks appearing at + 0.65 V and + 1.14 V in addition to a single cathodic curve appearing at approx. 0 V, for the second mixture. The latter can be attributed to the presence of p-BP in the mixture that shows a reversible behavior including this cathodic peak. Moreover, Figure 9b shows the variation of the charge associated with the anodic current and the calculated theoretical permanganate index. As shown, a linear relationship can be deduced which demonstrates a good correlation between the electrochemical anodic charge of the oxidizing compounds in a multi-compound mode analysis and their corresponding theoretical permanganate index.
Finally, to assess the electrochemical response in a real complex matrix, all the compounds investigated in this study (gallic acid, phenol, oxalic acid, ascorbic acid, salicylic acid and p-benzoquinone) were mixed together and analyzed by cyclic voltammetry. The same experimental conditions were applied (a potential window ranging from – 0.4 V to + 1.8 V vs Ag/AgCl, and scan rate of 0.1 V.s-1), sodium sulfate was added as a supporting electrode at the concentration of 0.1M and the pH was adjusted at 2. The resulting voltammograms are presented in Figure 10a. As illustrated, the current intensity increases with the increasing mixture concentration (Figure S10). This typical behavior confirms that a conventional electrochemical response of cyclic voltammetry response is observed, even in the presence of a mixture compounds. Additionally, a graph showing the variation of the electrochemical anodic charge versus the calculated theoretical permanganate index (found from the sum of the concentration of each compound added to the mixture) was plotted (Figure 10b). To remember, the corresponding charge was measured after a baseline correction for each measurement. This data processing is a critical step to guarantee an enhanced and precise methodology for the peak’s integration, where the solvent oxidation wall is remarkably visible at the extreme positive potential limit of scans (E ≥ 1.2V vs Ag/AgCl at the graphite electrode material). As shown (Figure 10b), a linear relationship with a very good correlation coefficient (R2 = 0.996) was obtained for the function Q vs PItheo. This demonstrates again the existing of the correlation between the anodic electrochemical charge and the theoretical PI, even in a complex matrix. For instance, in a multicomponent matrix where several analytes exhibit partially or completely overlapping oxidation potentials, the integrated charge primarily reflects the cumulative contribution of all oxidizable species rather than compound-specific information [50,55,56]. The excellent agreement with the permanganate index confirms that methodology effectively captures the total oxidizable load of the system, which is particularly relevant for applications related to organic pollution assessment. Thus, the water quality determination through the conventional permanganate index method could be replaced by the electrochemical methodology where the organic part of the water pollution can be effectively analyzed by electrochemistry.
These findings align with the principles of multiparametric analysis in cyclic voltammetry, where multiple electrochemical responses can be deconvoluted or correlated with physicochemical properties. In this case, the anodic charge serves as a quantitative electrochemical parameter reflective of the oxidizable content in the sample. Although only one electrochemical parameter (Q) was explored here, the framework opens the possibility for applying full multiparametric or chemometric analysis to environmental or complex matrices in future studies.

4. Conclusions

This study aimed to compare the capability of the electrochemical method to quantify oxidizable organic matter against a standard chemical reference (method of chemical oxidation by permanganate). The procedure was intended to validate the consistency between the experimental data obtained by voltammetric analysis and the calculated theoretical values, thereby ensuring the reliability of the analytical protocol employed. Six organic compounds (gallic acid, phenol, oxalic acid, ascorbic acid, salicylic acid and p-benzoquinone) were studied by cyclic voltammetry. First, the compounds were analyzed individually, in single-compound mode, to characterize its redox behavior and to identify the voltammetric peaks. Subsequently, a multi-compound analysis was studied to check for the validity of the concept in a more complex matrix. All the analytes exhibited irreversible anodic processes, except for p-BQ, which displayed a quasi-reversible redox profile. Notably, a very good linear correlation was observed between the measured charge and the theoretical permanganate index, highlighting the quantitative reliability of the electrochemical method. These results can be considered proof-of-concept demonstrating the feasibility of detecting and quantifying permanganate index values associated with organic matter through electrochemical analysis. This method provides insight into a more rapid, less time-consuming and less-chemically intensive approach. Although only one electrochemical parameter (charge) was explored here, the framework opens the possibility for applying full multiparametric or chemometric analysis to environmental or complex matrices in future studies.

Supplementary Materials

The following supporting information can be downloaded at the website of this paper posted on Preprints.org.

Funding

This research has recently received public fund from the Lebanese University, Doctoral School for Sciences and Technology Grant. The authors solely thank the evaluating committee who approved funding and to pursuit this work.

Declaration of interest

The authors declare no conflict of interest. Author Ayman Chmayssem is the founder of the company Electrochemistry Consulting & Services (E2CS). The remaining authors declare that the research was conducted in the absence of any commercial or financial relationships that could be construed as potential conflicts of interest.

Abbreviation list:

PI: Permanganate index
BOD: Biological or biochemical oxygen demand
COD: Chemical oxygen demand
TOC: Total organic carbon
WE: Working electrode
RE: Reference electrode
CE: Counter electrode
CV: Cyclic voltammetry
Q: Electrochemical charge
p-BQ: p-benzoquinone

References

  1. M. Gavrilescu, K. Demnerová, J. Aamand, S. Agathos, and F. Fava, “Emerging pollutants in the environment: present and future challenges in biomonitoring, ecological risks and bioremediation,” N Biotechnol, vol. 32, no. 1, pp. 147–156, Jan. 2015, doi: 10.1016/j.nbt.2014.01.001. [CrossRef]
  2. Q. Zhou, J. Zhang, J. Fu, J. Shi, and G. Jiang, “Biomonitoring: An appealing tool for assessment of metal pollution in the aquatic ecosystem,” Anal Chim Acta, vol. 606, no. 2, pp. 135–150, Jan. 2008, doi: 10.1016/j.aca.2007.11.018. [CrossRef]
  3. K. S. Egorova and V. P. Ananikov, “Toxicity of Metal Compounds: Knowledge and Myths,” Organometallics, vol. 36, no. 21, pp. 4071–4090, Nov. 2017, doi: 10.1021/acs.organomet.7b00605. [CrossRef]
  4. Z. Kyselova, “Toxicological aspects of the use of phenolic compounds in disease prevention,” Interdiscip Toxicol, vol. 4, no. 4, pp. 173–183, Dec. 2011, doi: 10.2478/v10102-011-0027-5. [CrossRef]
  5. Y. Wen, G. Schoups, and N. van de Giesen, “Organic pollution of rivers: Combined threats of urbanization, livestock farming and global climate change,” Sci Rep, vol. 7, no. 1, p. 43289, Feb. 2017, doi: 10.1038/srep43289. [CrossRef]
  6. K. C. Jones and P. de Voogt, “Persistent organic pollutants (POPs): state of the science,” Environmental Pollution, vol. 100, no. 1–3, pp. 209–221, 1999, doi: 10.1016/S0269-7491(99)00098-6. [CrossRef]
  7. Y. Wen, G. Schoups, and N. van de Giesen, “Organic pollution of rivers: Combined threats of urbanization, livestock farming and global climate change,” Sci Rep, vol. 7, no. 1, p. 43289, Feb. 2017, doi: 10.1038/srep43289. [CrossRef]
  8. Y. Wen, G. Schoups, and N. van de Giesen, “Organic pollution of rivers: Combined threats of urbanization, livestock farming and global climate change,” Sci Rep, vol. 7, no. 1, p. 43289, Feb. 2017, doi: 10.1038/srep43289. [CrossRef]
  9. M. M. Mekonnen and A. Y. Hoekstra, “Four billion people facing severe water scarcity,” Sci Adv, vol. 2, no. 2, Feb. 2016, doi: 10.1126/sciadv.1500323. [CrossRef]
  10. J. Karpińska and U. Kotowska, “Removal of Organic Pollution in the Water Environment,” Water (Basel), vol. 11, no. 10, p. 2017, Sep. 2019, doi: 10.3390/w11102017. [CrossRef]
  11. A. Chmayssem, “Développement d’un procédé électrochimique et de capteurs associés pour le traitement de perturbateurs endocriniens phénoliques dans les eaux,” 2023. [Online]. Available: https://theses.hal.science/tel-04085829.
  12. J. Du et al., “Linking Water Quality Indicators in Stable Reservoir Ecosystems: Correlation Analysis and Ecohydrological Implications,” Water (Basel), vol. 16, no. 24, p. 3600, Dec. 2024, doi: 10.3390/w16243600. [CrossRef]
  13. A. Matilainen, M. Vepsäläinen, and M. Sillanpää, “Natural organic matter removal by coagulation during drinking water treatment: A review,” Adv Colloid Interface Sci, vol. 159, no. 2, pp. 189–197, Sep. 2010, doi: 10.1016/j.cis.2010.06.007. [CrossRef]
  14. W.-Q. Xie and Y.-X. Gong, “Measurement of permanganate index in environmental water via indirect phase-conversion strategy.,” J Chromatogr A, vol. 1728, p. 464987, Aug. 2024, doi: 10.1016/j.chroma.2024.464987. [CrossRef]
  15. J. R. Laszakovits, A. Kerr, and A. A. MacKay, “Permanganate Oxidation of Organic Contaminants and Model Compounds.,” Environ Sci Technol, vol. 56, no. 8, pp. 4728–4748, Apr. 2022, doi: 10.1021/acs.est.1c03621. [CrossRef]
  16. W.-Q. Xie and Y.-X. Gong, “Measurement of permanganate index in environmental water via indirect phase-conversion strategy,” J Chromatogr A, vol. 1728, p. 464987, Aug. 2024, doi: 10.1016/j.chroma.2024.464987. [CrossRef]
  17. J. Li et al., “Oxidative transformation of emerging organic contaminants by aqueous permanganate: Kinetics, products, toxicity changes, and effects of manganese products,” Water Res, vol. 203, p. 117513, Sep. 2021, doi: 10.1016/j.watres.2021.117513. [CrossRef]
  18. S. Jianxun and M. Haiqiong, “Comparative analysis of domestic and foreign standards for permanganate index determination,” Discover Chemistry, vol. 2, no. 1, p. 51, Mar. 2025, doi: 10.1007/s44371-025-00129-8. [CrossRef]
  19. C. Kumunda, A. S. Adekunle, B. B. Mamba, N. W. Hlongwa, and T. T. I. Nkambule, “Electrochemical Detection of Environmental Pollutants Based on Graphene Derivatives: A Review,” Front Mater, vol. 7, Feb. 2021, doi: 10.3389/fmats.2020.616787. [CrossRef]
  20. A. S. Pavitt and P. G. Tratnyek, “Electrochemical characterization of natural organic matter by direct voltammetry in an aprotic solvent,” Environ Sci Process Impacts, vol. 21, no. 10, pp. 1664–1683, 2019, doi: 10.1039/C9EM00313D. [CrossRef]
  21. Z. Pang, Y. Cai, W. Xiong, J. Xiao, and J. Zou, “A spectrophotometric method for measuring permanganate index (CODMn) by N,N-diethyl-p-phenylenediamine (DPD),” Chemosphere, vol. 266, p. 128936, Mar. 2021, doi: 10.1016/j.chemosphere.2020.128936. [CrossRef]
  22. Allen J. Bard and Larry R. Faulkner, Electrochemical Methods: Fundamentals and Applications, 2nd Ed., no. 12. 2001.
  23. V. Climent and J. M. Feliu, “Cyclic Voltammetry,” in Encyclopedia of Interfacial Chemistry, Elsevier, 2018, pp. 48–74. doi: 10.1016/B978-0-12-409547-2.10764-4. [CrossRef]
  24. M. Antuch, “Theoretical approach to the elliptic cyclic voltammetry of diffusionless redox couples,” Journal of Electroanalytical Chemistry, vol. 995, p. 119294, Oct. 2025, doi: 10.1016/j.jelechem.2025.119294. [CrossRef]
  25. H. Masoumi, S. Khazalpour, and M. Jamshidi, “Electrochemical study of 2-amino-5-mercapto-1,3,4-thiadiazole in the absence and presence of p -benzoquinone: an efficient strategy for the electrosynthesis of new 1,3,4-thiadiazole derivatives,” RSC Adv, vol. 13, no. 5, pp. 3083–3094, 2023, doi: 10.1039/D2RA07250E. [CrossRef]
  26. W. Tang et al., “Formation of highly toxic p-benzoquinones byproducts during ozonation of cresols,” Journal of Environmental Sciences, vol. 154, pp. 495–508, Aug. 2025, doi: 10.1016/j.jes.2024.08.034. [CrossRef]
  27. N. R. Nicomel, L. Y. Li, B. A. Mohamed, and S. S. Ramim, “Adsorption of p-benzoquinone at low concentrations from aqueous media using biosolid-based activated carbon,” J Environ Manage, vol. 316, p. 115263, Aug. 2022, doi: 10.1016/j.jenvman.2022.115263. [CrossRef]
  28. P. S. Guin, S. Das, and P. C. Mandal, “Electrochemical Reduction of Quinones in Different Media: A Review,” International Journal of Electrochemistry, vol. 2011, pp. 1–22, 2011, doi: 10.4061/2011/816202. [CrossRef]
  29. P. S. Guin, S. Das, and P. C. Mandal, “Electrochemical Reduction of Quinones in Different Media: A Review,” International Journal of Electrochemistry, vol. 2011, pp. 1–22, 2011, doi: 10.4061/2011/816202. [CrossRef]
  30. F. Leitão, D. Galrito, L. C. Branco, H. Cruz, and P. S. Branco, “Electrochemical Studies of Benzoquinone, Hydrobenzoquinone, Diphenoquinone and Hydrodiphenoquinone-Based Compounds,” Electrochemical Science Advances, vol. 5, no. 5, Oct. 2025, doi: 10.1002/elsa.70006. [CrossRef]
  31. A. M. Pisoschi, A. Pop, A. I. Serban, and C. Fafaneata, “Electrochemical methods for ascorbic acid determination,” Electrochim Acta, vol. 121, pp. 443–460, Mar. 2014, doi: 10.1016/j.electacta.2013.12.127. [CrossRef]
  32. K. S. Ngai, W. T. Tan, Z. Zainal, R. M. Zawawi, and M. Zidan, “Voltammetry Detection of Ascorbic Acid at Glassy Carbon Electrode Modified by Single-Walled Carbon Nanotube/Zinc Oxide,” Int J Electrochem Sci, vol. 8, no. 8, pp. 10557–10567, Aug. 2013, doi: 10.1016/S1452-3981(23)13131-2. [CrossRef]
  33. S. Choi et al., “Redox-Transition from Irreversible to Reversible Vitamin C by Pore Confinement in Microporous Carbon Network,” ACS Appl Mater Interfaces, vol. 14, no. 32, pp. 36557–36569, Aug. 2022, doi: 10.1021/acsami.2c07719. [CrossRef]
  34. R. Abdel-Hamid and E. F. Newair, “Adsorptive stripping voltammetric determination of gallic acid using an electrochemical sensor based on polyepinephrine/glassy carbon electrode and its determination in black tea sample,” Journal of Electroanalytical Chemistry, vol. 704, pp. 32–37, Sep. 2013, doi: 10.1016/j.jelechem.2013.06.006. [CrossRef]
  35. R. M. L. M. Sandrini, B. G. da Silva, and C. A. Angelucci, “Electrochemical Quantification of Gallic Acid: The Role of Voltammetric Parameter Optimization via Multivariate Experimental Design,” Electroanalysis, vol. 37, no. 8, Aug. 2025, doi: 10.1002/elan.70033. [CrossRef]
  36. S. I. Ekonomou, O. Doran, A. Crew, and J. P. Hart, “Electrochemical Behaviour of the Antioxidant Gallic Acid Using a Low-Cost Screen-Printed Carbon Sensor and Its Exploitation for Banana Wine Analysis,” Foods, vol. 14, no. 23, p. 4070, Nov. 2025, doi: 10.3390/foods14234070. [CrossRef]
  37. F. Manea et al., “Electrochemical Oxidation and Determination of Oxalic Acid at an Exfoliated Graphite-Polystyrene Composite Electrode,” Sensors, vol. 7, pp. 615–627, 2007, [Online]. Available: www.mdpi.org/sensors.
  38. F. Manea et al., “Electrochemical Oxidation and Determination of Oxalic Acid at an Exfoliated Graphite-Polystyrene Composite Electrode,” Sensors, vol. 7, no. 4, pp. 615–627, Apr. 2007, doi: 10.3390/s7040615. [CrossRef]
  39. M. D. Baravkar and B. L. V. Prasad, “Selective electro-oxidation of phenol to 1,4-hydroquinone employing carbonaceous electrodes: surface modification is the key,” New Journal of Chemistry, vol. 46, no. 5, pp. 2518–2525, 2022, doi: 10.1039/D1NJ04640C. [CrossRef]
  40. A. Chmayssem and D. Hauchard, “New detection method for alkylphenol traces in water based on an integrated electrochemical cell sensor,” Revue des Sciences de l’Eau, vol. 28, no. 1, pp. 35–40, 2015, doi: 10.7202/1030005ar. [CrossRef]
  41. N. Belhadj Tahar and A. Savall, “Electropolymerization of phenol on a vitreous carbon electrode in alkaline aqueous solution at different temperatures,” Electrochim Acta, vol. 55, no. 2, pp. 465–469, Dec. 2009, doi: 10.1016/j.electacta.2009.08.040. [CrossRef]
  42. A. Chmayssem and D. Hauchard, “Direct ultra-trace detection of alkylphenols in water using a cavity carbon-paste microelectrode sensor,” Desalination Water Treat, vol. 83, 2017, doi: 10.5004/dwt.2017.20740. [CrossRef]
  43. L. Kiss, F. Kovács, H. Li, A. Kiss, and S. Kunsági-Máté, “Electrochemical polymerization of phenol on platinum and glassy carbon electrodes in mesityl oxide,” Chem Phys Lett, vol. 754, p. 137642, Sep. 2020, doi: 10.1016/j.cplett.2020.137642. [CrossRef]
  44. J. Kaur, R. Malik, and D. Gangwar, “A Reliable Cyclic Voltammetry Technique for the Degradation of Salicylaldehyde: Electrode Kinetics,” Nature Environment and Pollution Technology, vol. 20, no. 5, Dec. 2021, doi: 10.46488/NEPT.2021.v20i05.012. [CrossRef]
  45. Y. Luo et al., “Effects of low concentration of gallic acid on the growth and microcystin production of Microcystis aeruginosa,” Science of The Total Environment, vol. 916, p. 169765, Mar. 2024, doi: 10.1016/j.scitotenv.2023.169765. [CrossRef]
  46. A. Kumar, N. Alami-Mejjati, M. Bouvet, and R. Meunier-Prest, “Electrochemical oxidation of gallic acid: A reexamination of the reaction mechanism in aqueous medium,” Electrochim Acta, vol. 460, p. 142622, Aug. 2023, doi: 10.1016/j.electacta.2023.142622. [CrossRef]
  47. A. Iacob, F. Manea, J. Schoonman, and N. Vaszilcsin, “Voltammetric/amperometric detection of salicylic acid in water on carbon nanotubes-epoxy composite electrodes,” 2015, pp. 543–553. doi: 10.2495/SD150481. [CrossRef]
  48. D. Evans, J. P. Hart, and G. Rees, “Voltammetric behaviour of salicylic acid at a glassy carbon electrode and its determination in serum using liquid chromatography with amperometric detection,” Analyst, vol. 116, no. 8, p. 803, 1991, doi: 10.1039/an9911600803. [CrossRef]
  49. A. Torriero, “Voltammetric determination of salicylic acid in pharmaceuticals formulations of acetylsalicylic acid,” Talanta, vol. 62, no. 2, pp. 247–254, Feb. 2004, doi: 10.1016/j.talanta.2003.07.005. [CrossRef]
  50. A. Chmayssem et al., “Development of a multiparametric (bio)sensing platform for continuous monitoring of stress metabolites,” Talanta, vol. 229, 2021, doi: 10.1016/j.talanta.2021.122275. [CrossRef]
  51. A. Chmayssem et al., “Characterization of the Impact of Classical Cell-culture Media on the Response of Electrochemical Sensors,” Electroanalysis, vol. 34, no. 7, 2022, doi: 10.1002/elan.202100534. [CrossRef]
  52. M. Palys, “The separation of overlapping peaks in cyclic voltammetry by means of semi-differential transformation,” Talanta, vol. 38, no. 7, pp. 723–733, Jul. 1991, doi: 10.1016/0039-9140(91)80192-3. [CrossRef]
  53. T. R. Garrick et al., “Quantifying Volume Change in Porous Electrodes via the Multi-Species, Multi-Reaction Model,” J Electrochem Soc, vol. 170, no. 6, p. 060548, Jun. 2023, doi: 10.1149/1945-7111/acdf8b. [CrossRef]
  54. M. Kowalcze and M. Jakubowska, “Multivariate approach in voltammetric identification and simultaneous determination of eugenol, carvacrol, and thymol on boron-doped diamond electrode,” Monatshefte für Chemie - Chemical Monthly, vol. 150, no. 6, pp. 991–1002, Jun. 2019, doi: 10.1007/s00706-019-02394-7. [CrossRef]
  55. A. M. Fenton Jr. and F. R. Brushett, “Using voltammetry augmented with physics-based modeling and Bayesian hypothesis testing to identify analytes in electrolyte solutions,” Journal of Electroanalytical Chemistry, vol. 904, p. 115751, Jan. 2022, doi: 10.1016/j.jelechem.2021.115751. [CrossRef]
  56. R. B. Keithley, R. Mark Wightman, and M. L. Heien, “Multivariate concentration determination using principal component regression with residual analysis,” TrAC Trends in Analytical Chemistry, vol. 28, no. 9, pp. 1127–1136, Oct. 2009, doi: 10.1016/j.trac.2009.07.002. [CrossRef]
Figure 1. Cyclic voltammetry analysis of p-BQ: oxidation and reduction peak detection at a scan rate of 0.1 V.s-1 for a concentration ranging from 0 to 9 mM, between - 0.4 and + 1.2 V vs Ag/AgCl, Na2SO4 0.1 mol.l-1.
Preprints 201187 g001
Figure 2. Graphs showing the variation of the electrochemical charge vs. the theoretical permanganate index for oxidation and reduction processes of p-benzoquinone.
Preprints 201187 g002
Figure 3. (a) Electrochemical oxidation profile of ascorbic acid obtained by cyclic voltammetry at various concentration (0 – 10 mM) recorded at a scan rate of 0.1 V.s-1, between - 0.4 and + 1.4 V vs Ag/AgCl, Na2SO4 0.1 mol.l-1 and (b) Graph showing the variation of the electrochemical charge vs. the theoretical permanganate index for the oxidation process of ascorbic acid.
Preprints 201187 g003
Figure 4. (a) Electrochemical oxidation profile of gallic acid by cyclic voltammetry at various concentration (0 – 10 mM) recorded at a scan rate of 0.1 V.s-1, between - 0.1 and + 1.4 V vs Ag/AgCl, Na2SO4 0.1 mol.l-1 and (b) Graph showing the variation of the electrochemical anodic charge vs the theoretical permanganate index for gallic acid.
Preprints 201187 g004
Figure 5. (a) Cyclic voltammograms of oxalic acid at various concentration (0 – 7 mM) recorded at a scan rate of 0.1 V.s 1, between + 0.4 and + 1.8 V vs Ag/AgCl, Na2SO4 0.1 mol.l-1 and (b) Graph showing a linear relation between the experimentally determined anodic charge of oxalic acid and its theoretical permanganate reactivity index.
Preprints 201187 g005
Figure 6. (a) Cyclic voltammograms of phenol at various concentration (0 – 2.25 mM) recorded at a scan rate of 0.1 V. s 1, between - 0.1 and + 1.6 V vs Ag/AgCl, Na2SO4 0.1 mol.l-1 and (b) Graph showing a linear relation between the experimentally determined anodic charge of phenol and its theoretical permanganate reactivity index.
Preprints 201187 g006
Figure 7. (a) Cyclic voltammograms of phenol at various concentration (0 – 1.75 mM) recorded at a scan rate of 0.1 V. s 1, between 0 and + 1.8 V vs Ag/AgCl, Na2SO4 0.1 mol.l-1 and (b) Graph showing a linear relation between the experimentally determined anodic charge of salicylic acid and its theoretical permanganate reactivity index.
Preprints 201187 g007
Figure 8. (a) Cyclic voltammograms of phenol, gallic acid, oxalic acid at various concentration (0 – 7 mM) recorded at a scan rate of 0.1 V. s 1, between - 0.4 and + 1.8 V vs Ag/AgCl, Na2SO4 0.1 mol.l-1 and (b) Graph showing a linear relation between the experimentally determined anodic charge of phenol, gallic acid, oxalic acid and its theoretical permanganate reactivity index.
Preprints 201187 g008
Figure 9. (a) Cyclic voltammograms of salicylic acid, ascorbic acid, p-BQ at various concentration (0 – 7mM) recorded at a scan rate of 0.1 V. s 1, between - 0.4 and + 1.8 V vs Ag/AgCl, Na2SO4 0.1 mol.l-1 and (b) Graph showing a linear relation between the experimentally determined anodic charge of salicylic acid, ascorbic acid, p-BQ and its theoretical permanganate reactivity index.
Preprints 201187 g009
Figure 10. (a) Cyclic voltammograms of salicylic acid, ascorbic acid, p-BQ, phenol, gallic acid, oxalic acid at various concentration (0 – 6.4 mM) recorded at a scan rate of 0.1 V. s 1, between - 0.4 and + 1.8 V vs Ag/AgCl, Na2SO4 0.1 mol.l-1 and (b) Graph showing a linear relation between the experimentally determined anodic charge of salicylic acid, ascorbic acid, p-BQ, phenol, gallic acid, oxalic acid, and its theoretical permanganate reactivity index.
Preprints 201187 g010
Disclaimer/Publisher’s Note: The statements, opinions and data contained in all publications are solely those of the individual author(s) and contributor(s) and not of MDPI and/or the editor(s). MDPI and/or the editor(s) disclaim responsibility for any injury to people or property resulting from any ideas, methods, instructions or products referred to in the content.
Copyright: This open access article is published under a Creative Commons CC BY 4.0 license, which permit the free download, distribution, and reuse, provided that the author and preprint are cited in any reuse.
Prerpints.org logo

Preprints.org is a free preprint server supported by MDPI in Basel, Switzerland.

Subscribe

Disclaimer

Terms of Use

Privacy Policy

Privacy Settings

© 2026 MDPI (Basel, Switzerland) unless otherwise stated