
Submitted:
20 February 2026
Posted:
26 February 2026
You are already at the latest version
Abstract
Background: High dietary salt intake has been implicated in immune-mediated inflam-matory diseases; however, its impact on allergic contact dermatitis (ACD) remains unclear. This study examined whether dietary salt exposure during the sensitization phase influ-ences the severity of DNFB-induced ACD in mice. Methods: Female C57BL/6N mice were fed a normal diet (ND) or an 8% high-salt diet (HSD). In a subset, salt intake was normal-ized prior to sensitization (HSD→ND). ACD was induced using a DNFB sensitization and challenge protocol. Ear swelling was quantified using incremental area under the curve (iAUC). Histological analyses and measurements of plasma and skin sodium were per-formed. Results: HSD-fed mice showed greater ear swelling and higher iAUC than ND controls, accompanied by enhanced inflammatory cell infiltration. Skin sodium levels dif-fered among groups, with higher levels in HSD-fed mice compared with the HSD→ND group. Normalization of salt intake prior to sensitization attenuated disease severity. Spearman analyses indicated that total sodium intake and plasma potassium levels were associated with inflammatory severity. Conclusions: Dietary salt exposure during immune sensitization exacerbated experimental ACD and was associated with systemic electrolyte alterations. These findings suggest that sodium exposure during immune activation may influence allergic skin inflammation.
Keywords:
allergic contact dermatitis
; high-salt diet
; electrolytes
; inflammation
; dietary salt
1. Introduction
Excessive dietary salt intake is recognized as a major nutritional risk factor for cardiovascular and metabolic diseases, and global sodium consumption remains above the World Health Organization recommendation of less than 5 g of salt per day in many populations [1,2]. Beyond its cardiovascular impact, accumulating evidence indicates that dietary salt modulates immune function and inflammatory signaling pathways, influencing both innate and adaptive immune responses [3,4,5]. These findings suggest that sodium intake may contribute to immune-mediated disorders beyond traditional hemodynamic mechanisms.
Recent advances have demonstrated that sodium can accumulate in peripheral tissues, particularly in the skin, independently of plasma sodium concentration [6,7,8]. Clinical and translational studies further support the physiological and pathological relevance of cutaneous sodium storage in inflammatory conditions [7]. Experimental models have also shown that high-salt diet exacerbates inflammatory skin disorders such as imiquimod-induced dermatitis, implicating sodium in the regulation of cutaneous immune responses [9]. This tissue-specific sodium accumulation challenges traditional concepts of systemic sodium homeostasis and suggests that local sodium microenvironments may shape immune activation within the skin.
Allergic contact dermatitis (ACD) is a T cell–mediated inflammatory disease initiated during the sensitization phase, in which antigen presentation and immune priming occur within the cutaneous microenvironment [10]. Although dietary factors are increasingly recognized as modulators of immune responses, their role in contact hypersensitivity remains insufficiently defined. High-salt conditions have been shown to promote pathogenic T-cell polarization and aggravate certain inflammatory skin diseases [3,9]. However, the impact of dietary salt exposure during the sensitization phase of ACD has not been directly examined. Given that immune activation is locally regulated in the skin, dietary factors capable of modifying tissue conditions—such as sodium accumulation—may influence the magnitude of allergic responses. Determining whether salt exposure during immune priming affects disease severity, and whether such effects are reversible through dietary modification, may provide insight into the potential relevance of nutritional factors in contact hypersensitivity.
In the present study, we hypothesized that high dietary salt exposure during the sensitization phase would exacerbate DNFB-induced allergic contact dermatitis and that normalization of salt intake prior to sensitization would attenuate disease severity. To test this hypothesis, we evaluated ear swelling responses, histological inflammation, and sodium and potassium concentrations in plasma and skin tissues.
2. Materials and Methods
2.1. Animals and Protocol
Three-week-old female C57BL/6N mice were obtained from CLEA Japan and housed under a 12-h light/dark cycle (lights on at 08:00) with free access to food and water. After one week of acclimatization, mice were randomly assigned to three groups (n = 6 per group): normal diet (ND), high-salt diet (HSD), and a dietary normalization group (HSD→ND). The HSD was prepared by supplementing the basal CE-2 diet (CLEA Japan, Tokyo, Japan) with 8% sodium chloride. Specifically, 80 g/kg of the basal diet was replaced with 80 g/kg sodium chloride to yield a total of 1000 g/kg diet. Thus, control and experimental diets were matched in total weight and basal composition, differing only in sodium chloride supplementation. The 8% NaCl concentration was selected to establish a robust salt-loading condition. Previous studies have demonstrated that similar high-salt diets (8% NaCl) induce tissue sodium accumulation in the skin and modulate immune responses in C57BL/6 mice [11,12]. Mice were maintained on their assigned diets throughout the experimental period unless otherwise indicated. In the HSD→ND group, mice were initially fed HSD and subsequently switched to ND prior to DNFB sensitization. All procedures were approved by the Kobe Gakuin University Animal Experimentation Committee (approval nos. 24-21 and 25-26).
2.2 DNFB-Induced Allergic Contact Dermatitis Model
Allergic contact dermatitis (ACD) was induced using a 2,4-dinitrofluorobenzene (DNFB, Nacalai Tesque, Kyoto, Japan) protocol based on our previous report [13], with modifications in the sensitization and elicitation schedule as described below. On day 9, mice were sensitized by topical application of 50 μL of 0.5% DNFB (acetone:olive oil, 3:1) to the shaved abdominal skin. On day 14, elicitation was performed by applying 20 μL of 0.2% DNFB to the right ear, while vehicle alone was applied to the left ear as an internal control. Ear thickness was measured at 0, 1, 6, and 24 h post-challenge using a spring-loaded digital caliper (Mitutoyo, Kawasaki, Japan). The incremental area under the curve (iAUC) was calculated using the trapezoidal rule to quantify cumulative swelling responses. A schematic overview of the experimental timeline is shown in Figure 1a.
2.3 Histological Analysis and Cell Count
Auricular skin samples were fixed in 4% neutral buffered paraformaldehyde, embedded in Technovit🄬7100 (KULZER GmbH, Hanau, Germany), sectioned at 10 μm, and stained with hematoxylin and eosin. The sections were observed under the Primo Star 3 microscope (Carl Zeiss Microscopy GmbH, Jena, Germany). For quantitative analysis, a fixed-area region of interest was defined within the dermis, explicitly excluding the epidermis. Nuclei within this standardized dermal area were manually identified and counted using ImageJ software (NIH, Bethesda, MD).
2.4 Sodium and Potassium Measurement in Plasma and Skin
The concentrations of sodium and potassium in plasma and skin were measured using an atomic absorption spectrophotometer (ZA-3000, Hitachi High-Tech Science, Japan). For skin analysis, dorsal back skin samples were shaved and weighed to determine wet weight. Samples were subjected to oxidative digestion with 30% hydrogen peroxide (Nacalai Tesque) by autoclaving at 121 °C for 15 min. The digested lysates were subsequently diluted with 1 mol/L nitric acid (Nacalai Tesque) prior to measurement. Tissue sodium quantification was performed based on previously described approaches for assessing skin sodium accumulation, with minor modifications [8,12]. For plasma analysis, samples were diluted with 1 mol/L nitric acid and measured as previously described [14]. Calibration curves were generated using certified sodium and potassium standard solutions (Nacalai Tesque). Measurements were performed in duplicate, and values were normalized to tissue wet weight or plasma volume.
2.5 Statistical Analyses
Data are presented as box-and-whisker plots showing individual values, with group means indicated by diamond symbols. Sample size was determined based on preliminary data indicating a large effect size. Statistical comparisons among groups were performed using one-way analysis of variance (ANOVA), followed by Tukey’s post hoc test. Statistical analyses were conducted using JASP (version 0.95.1; University of Amsterdam, Amsterdam, The Netherlands). A p value < 0.05 was considered statistically significant. To examine associations between dietary sodium exposure, electrolyte levels, and inflammatory indices, correlation analyses were performed using Spearman’s rank correlation coefficient. Correlation coefficients (ρ) and corresponding p values are reported.
3. Results
3.1. Dietary Sodium Exposure and Metabolic Parameters During the Experimental Period
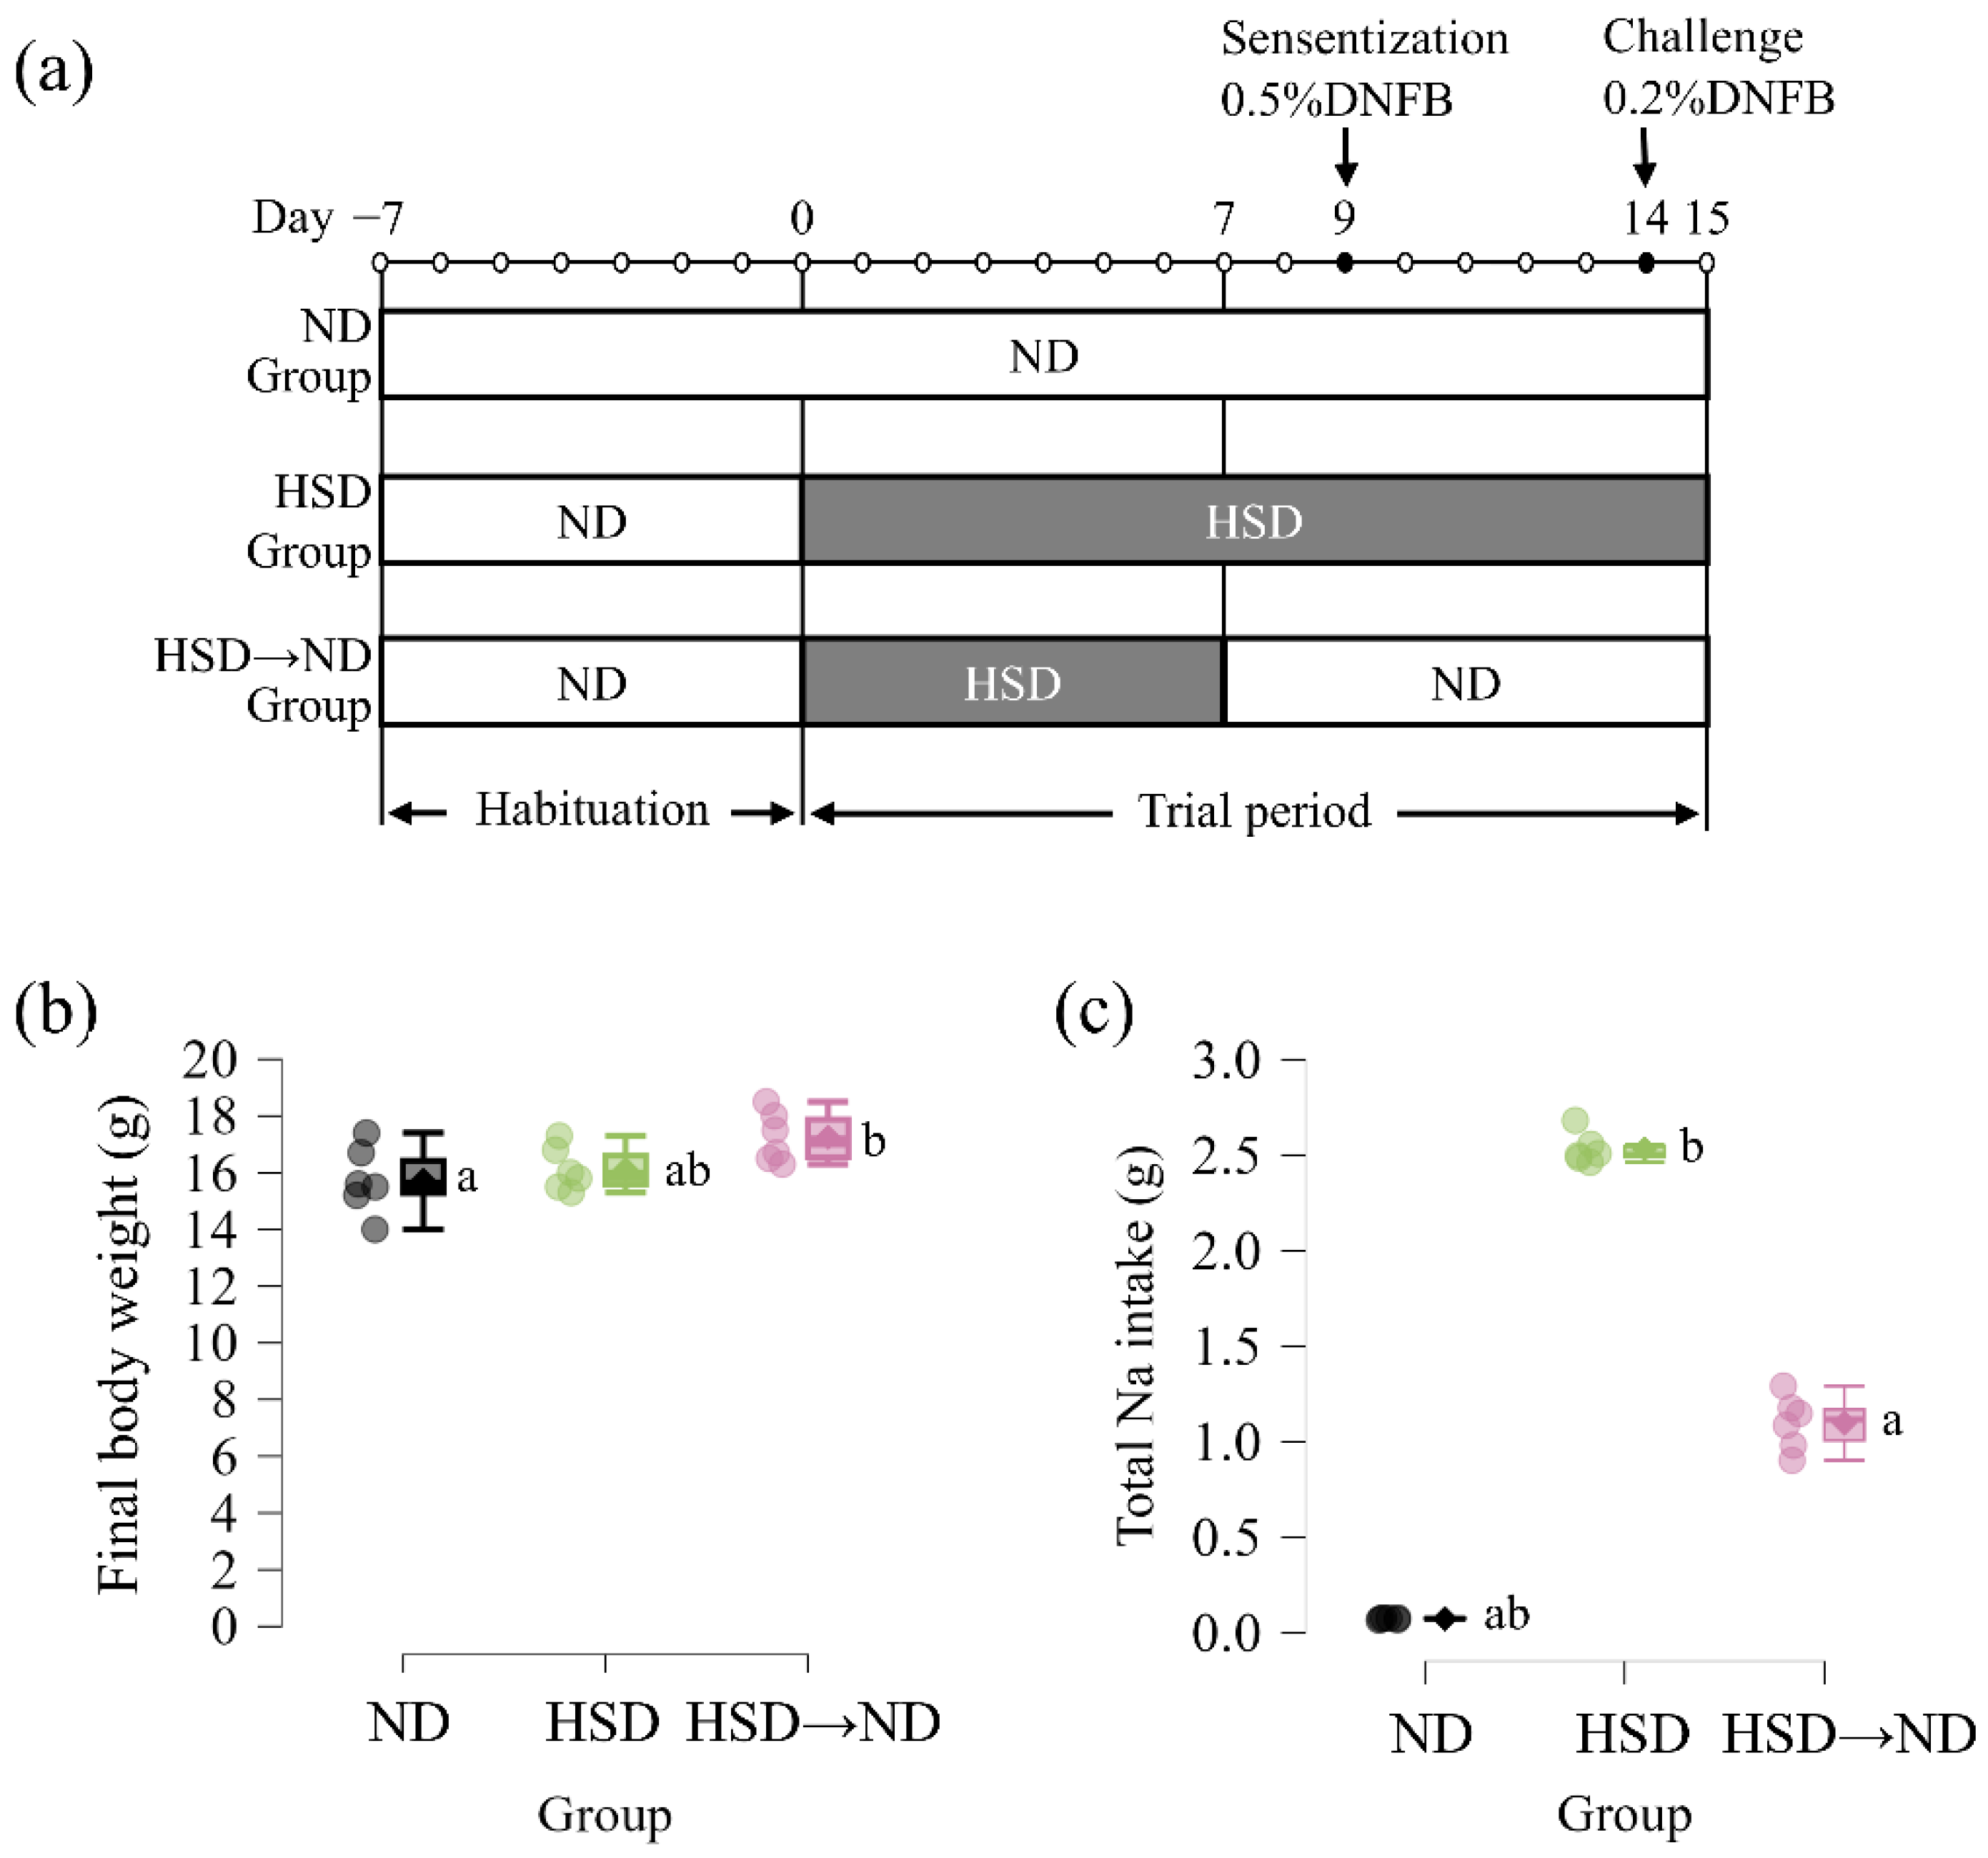
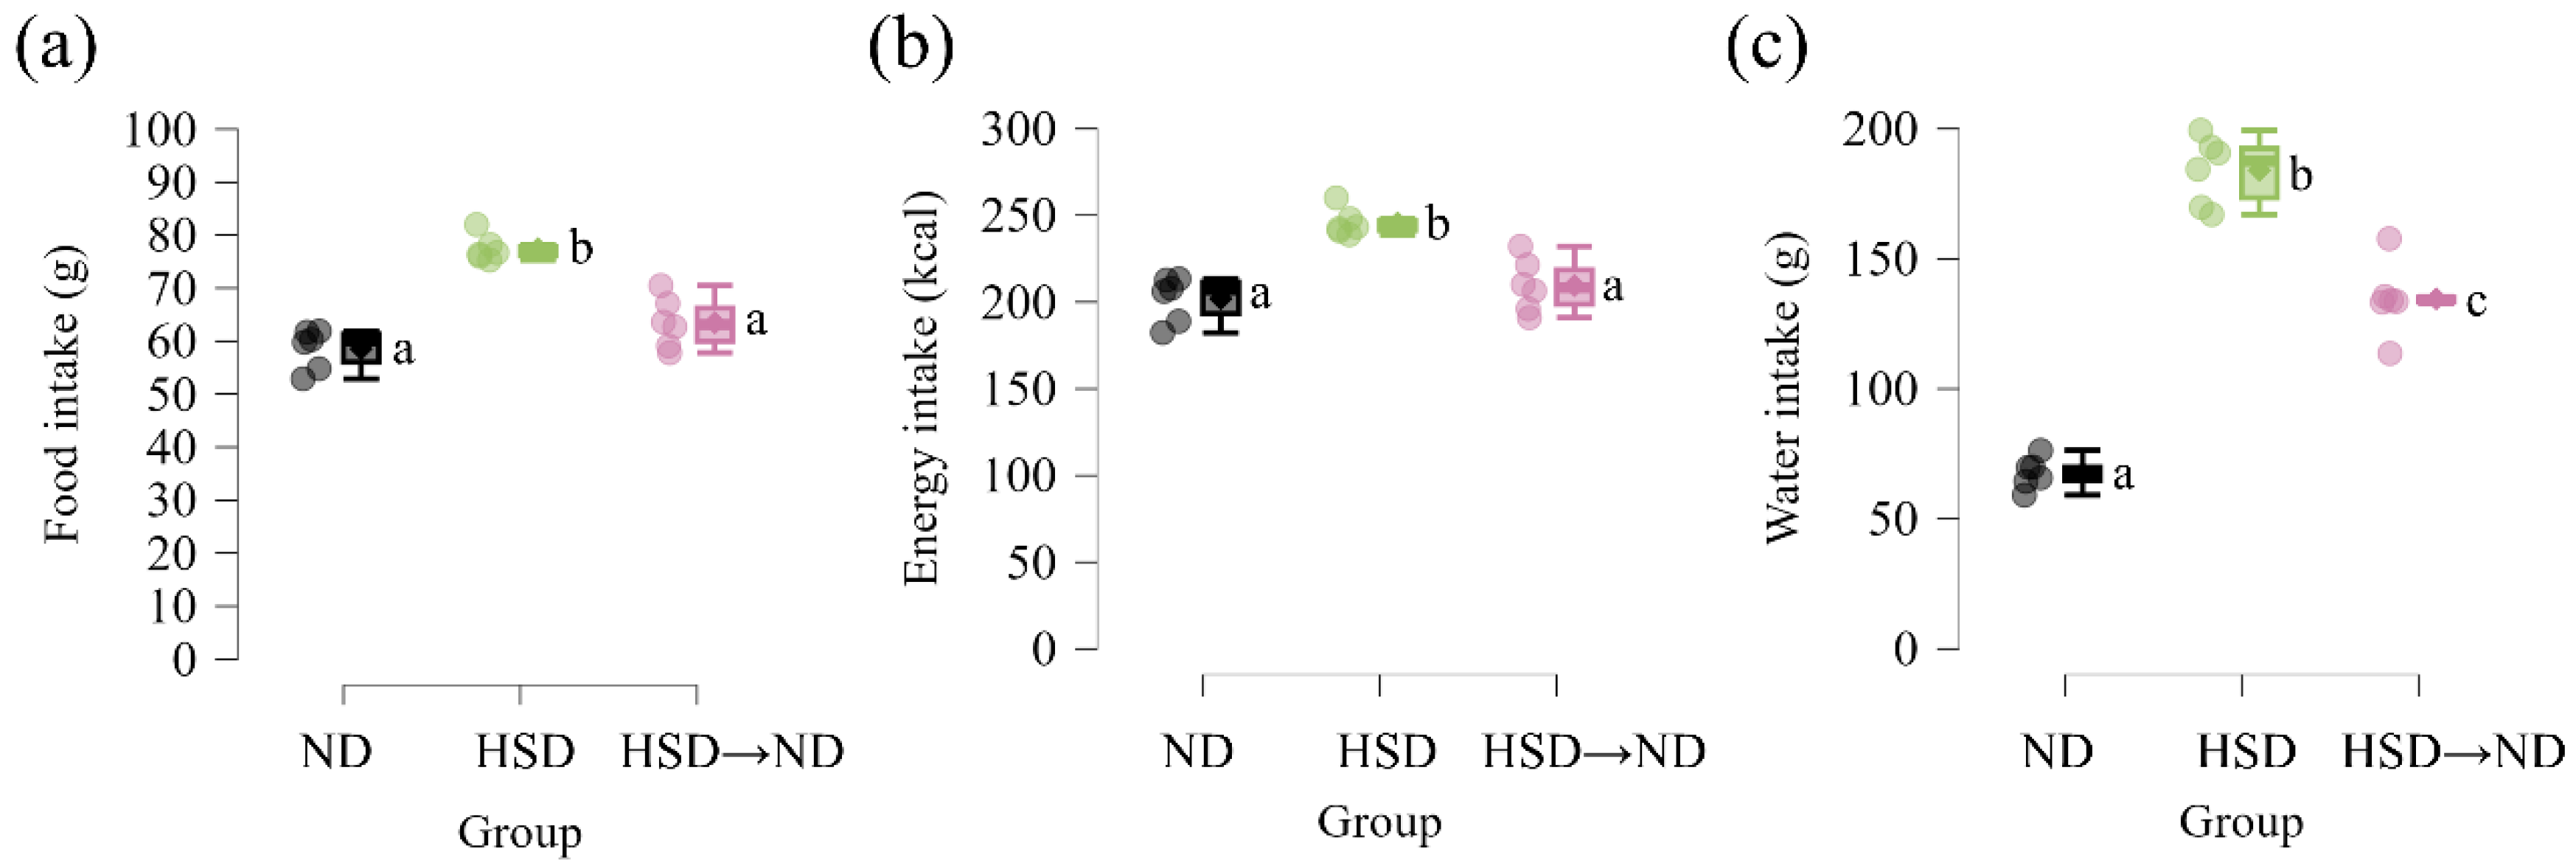
Figure 1a illustrates the experimental design and timing of the dietary intervention. Mice were maintained on either a normal diet (ND) or a high-salt diet (HSD). In a subset of animals, the dietary sodium content was normalized prior to sensitization (HSD→ND), allowing the evaluation of sodium exposure during the sensitization phase. Total food intake and total energy intake were significantly higher in HSD-fed mice compared with both ND and HSD→ND groups (Supplementary Figure S1a,b). Final body weight did not differ between ND and HSD groups. Although the HSD→ND group showed a modest increase in body weight compared with ND controls, body weight was not different between HSD and HSD→ND mice (Figure 1b). Importantly, high-salt feeding itself did not induce significant weight gain relative to ND. Consistent with the dietary manipulation, total sodium intake from day 0 to day 15 differed significantly among all groups, being highest in HSD-fed mice, lowest in ND controls, and intermediate in the HSD→ND group (Figure 1c). Water intake was also significantly increased under high-salt conditions (Supplementary Figure S1c), reflecting physiological adaptation to increased sodium load. Collectively, these findings confirm effective modulation of dietary sodium exposure under conditions in which body weight remained comparable among groups.
Figure 1.
Experimental design and dietary sodium exposure during the study period. (a) Experimental design. After a 7-day habituation period on a normal diet (ND), mice were assigned to ND, high-salt diet (HSD), or HSD followed by normalization to ND prior to sensitization (HSD→ND). The dietary intervention began on day 0. In the HSD→ND group, diet was switched back to ND on day 7. Sensitization with 0.5% DNFB was performed on day 9, followed by ear challenge with 0.2% DNFB on day 14. Mice were euthanized on day 15. (b) Final body weight at the end of the experimental period (day 15). (c) Total sodium intake from day 0 to day 15. Data are presented as individual values with group means (n = 6 per group). Statistical comparisons were performed using one-way ANOVA followed by Tukey’s post hoc test. Groups with different letters indicate statistically significant differences (p < 0.05).
Scheme S1.
Dietary intake parameters during the experimental period. (a) Total food intake from day 0 to day 15. (b) Total energy intake from day 0 to day 15. (c) Total water intake from day 0 to day 15. Data are presented as mean ± SD. Different letters indicate statistically significant differences among groups (p < 0.05). Statistical significance was determined by one-way ANOVA followed by Tukey’s multiple comparison test.
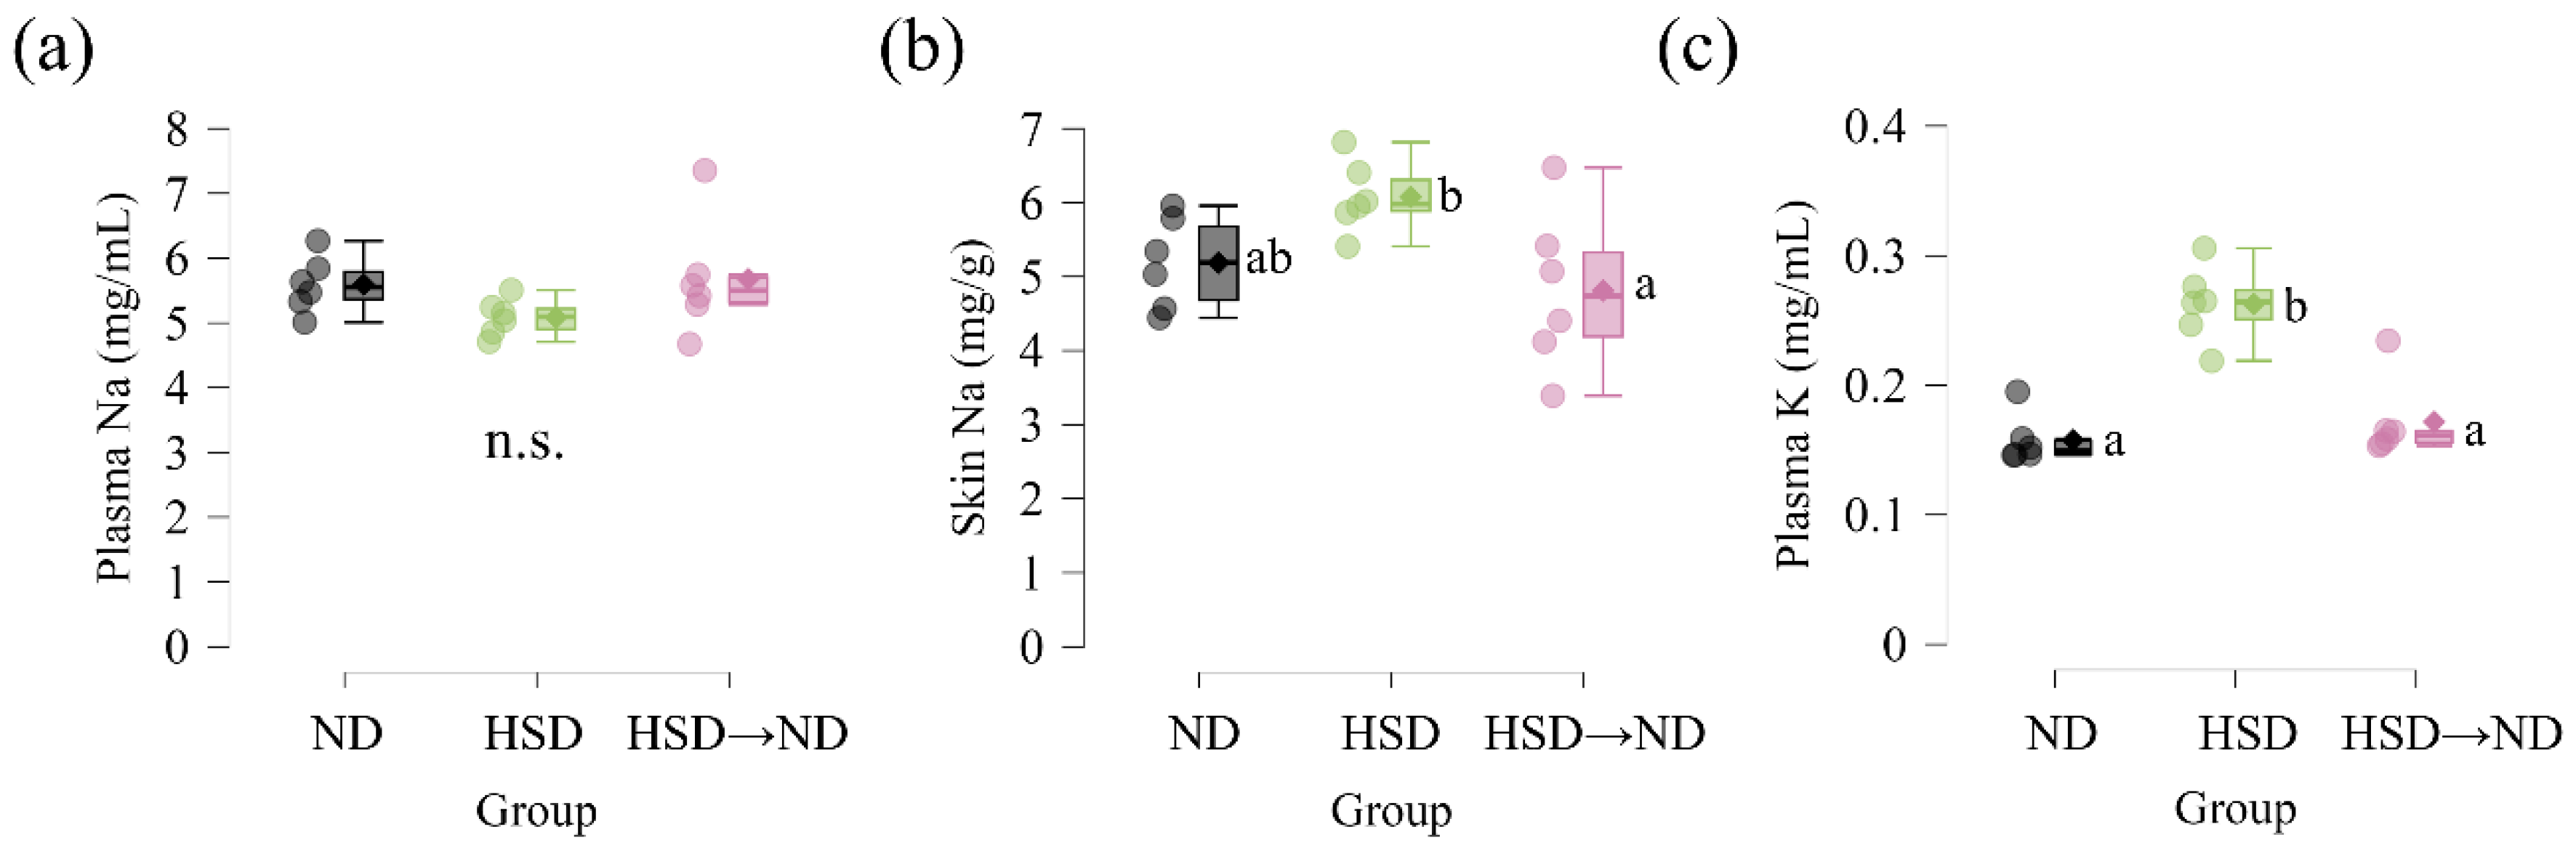
3.2. Dietary Sodium Exposure Is Associated with Differential Cutaneous Sodium Levels Without Affecting Plasma Sodium Concentration
To evaluate whether dietary sodium manipulation influenced systemic and tissue electrolyte levels, plasma and skin sodium concentrations were measured at the end of the experimental period. Plasma sodium concentrations did not differ significantly among ND, HSD, and HSD→ND groups (Figure 2a). In contrast, sodium concentration in dorsal back skin differed among groups (Figure 2b). Post hoc analysis revealed that the HSD→ND group showed lower sodium levels than the HSD group, whereas no significant difference was observed between ND and HSD groups. Plasma potassium concentrations also differed among groups, with significantly higher levels observed in HSD-fed mice compared with both ND controls and the HSD→ND group (Figure 2c). These findings indicate that dietary sodium manipulation was associated with differential cutaneous sodium levels and systemic potassium alterations, while plasma sodium concentration remained stable.
3.3. Allergic Inflammation Is Enhanced Under High-Salt Exposure
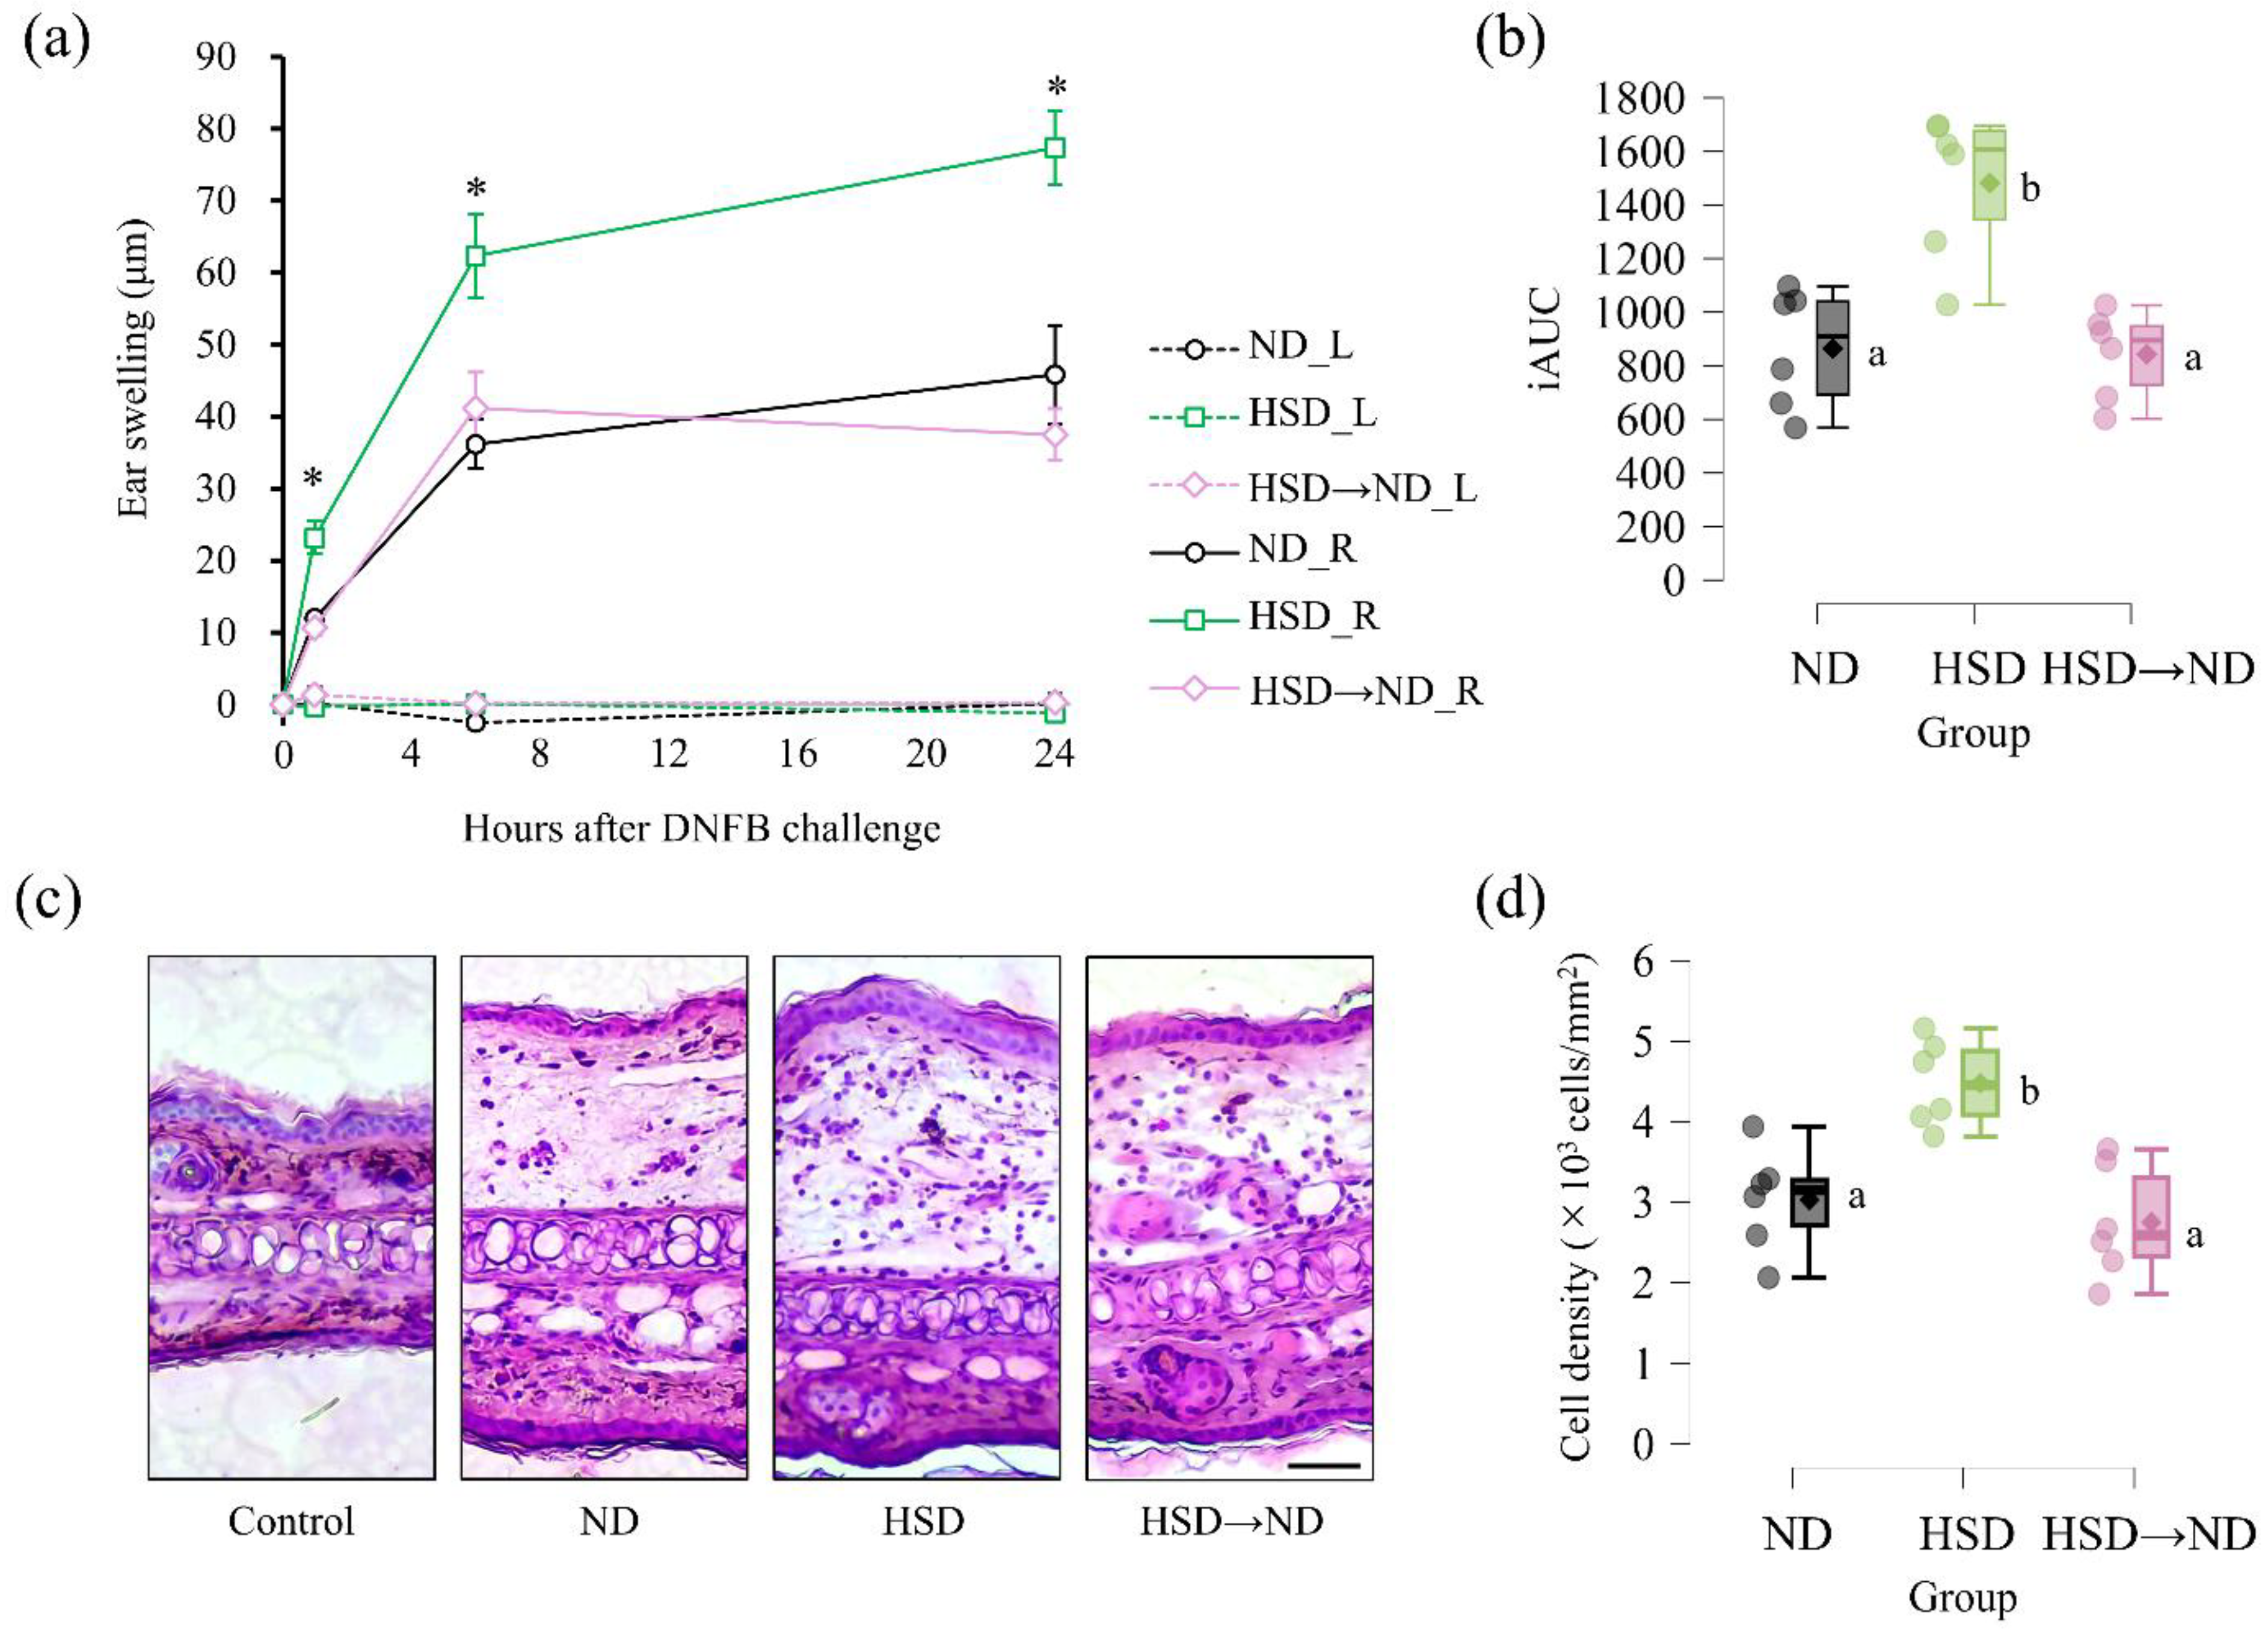
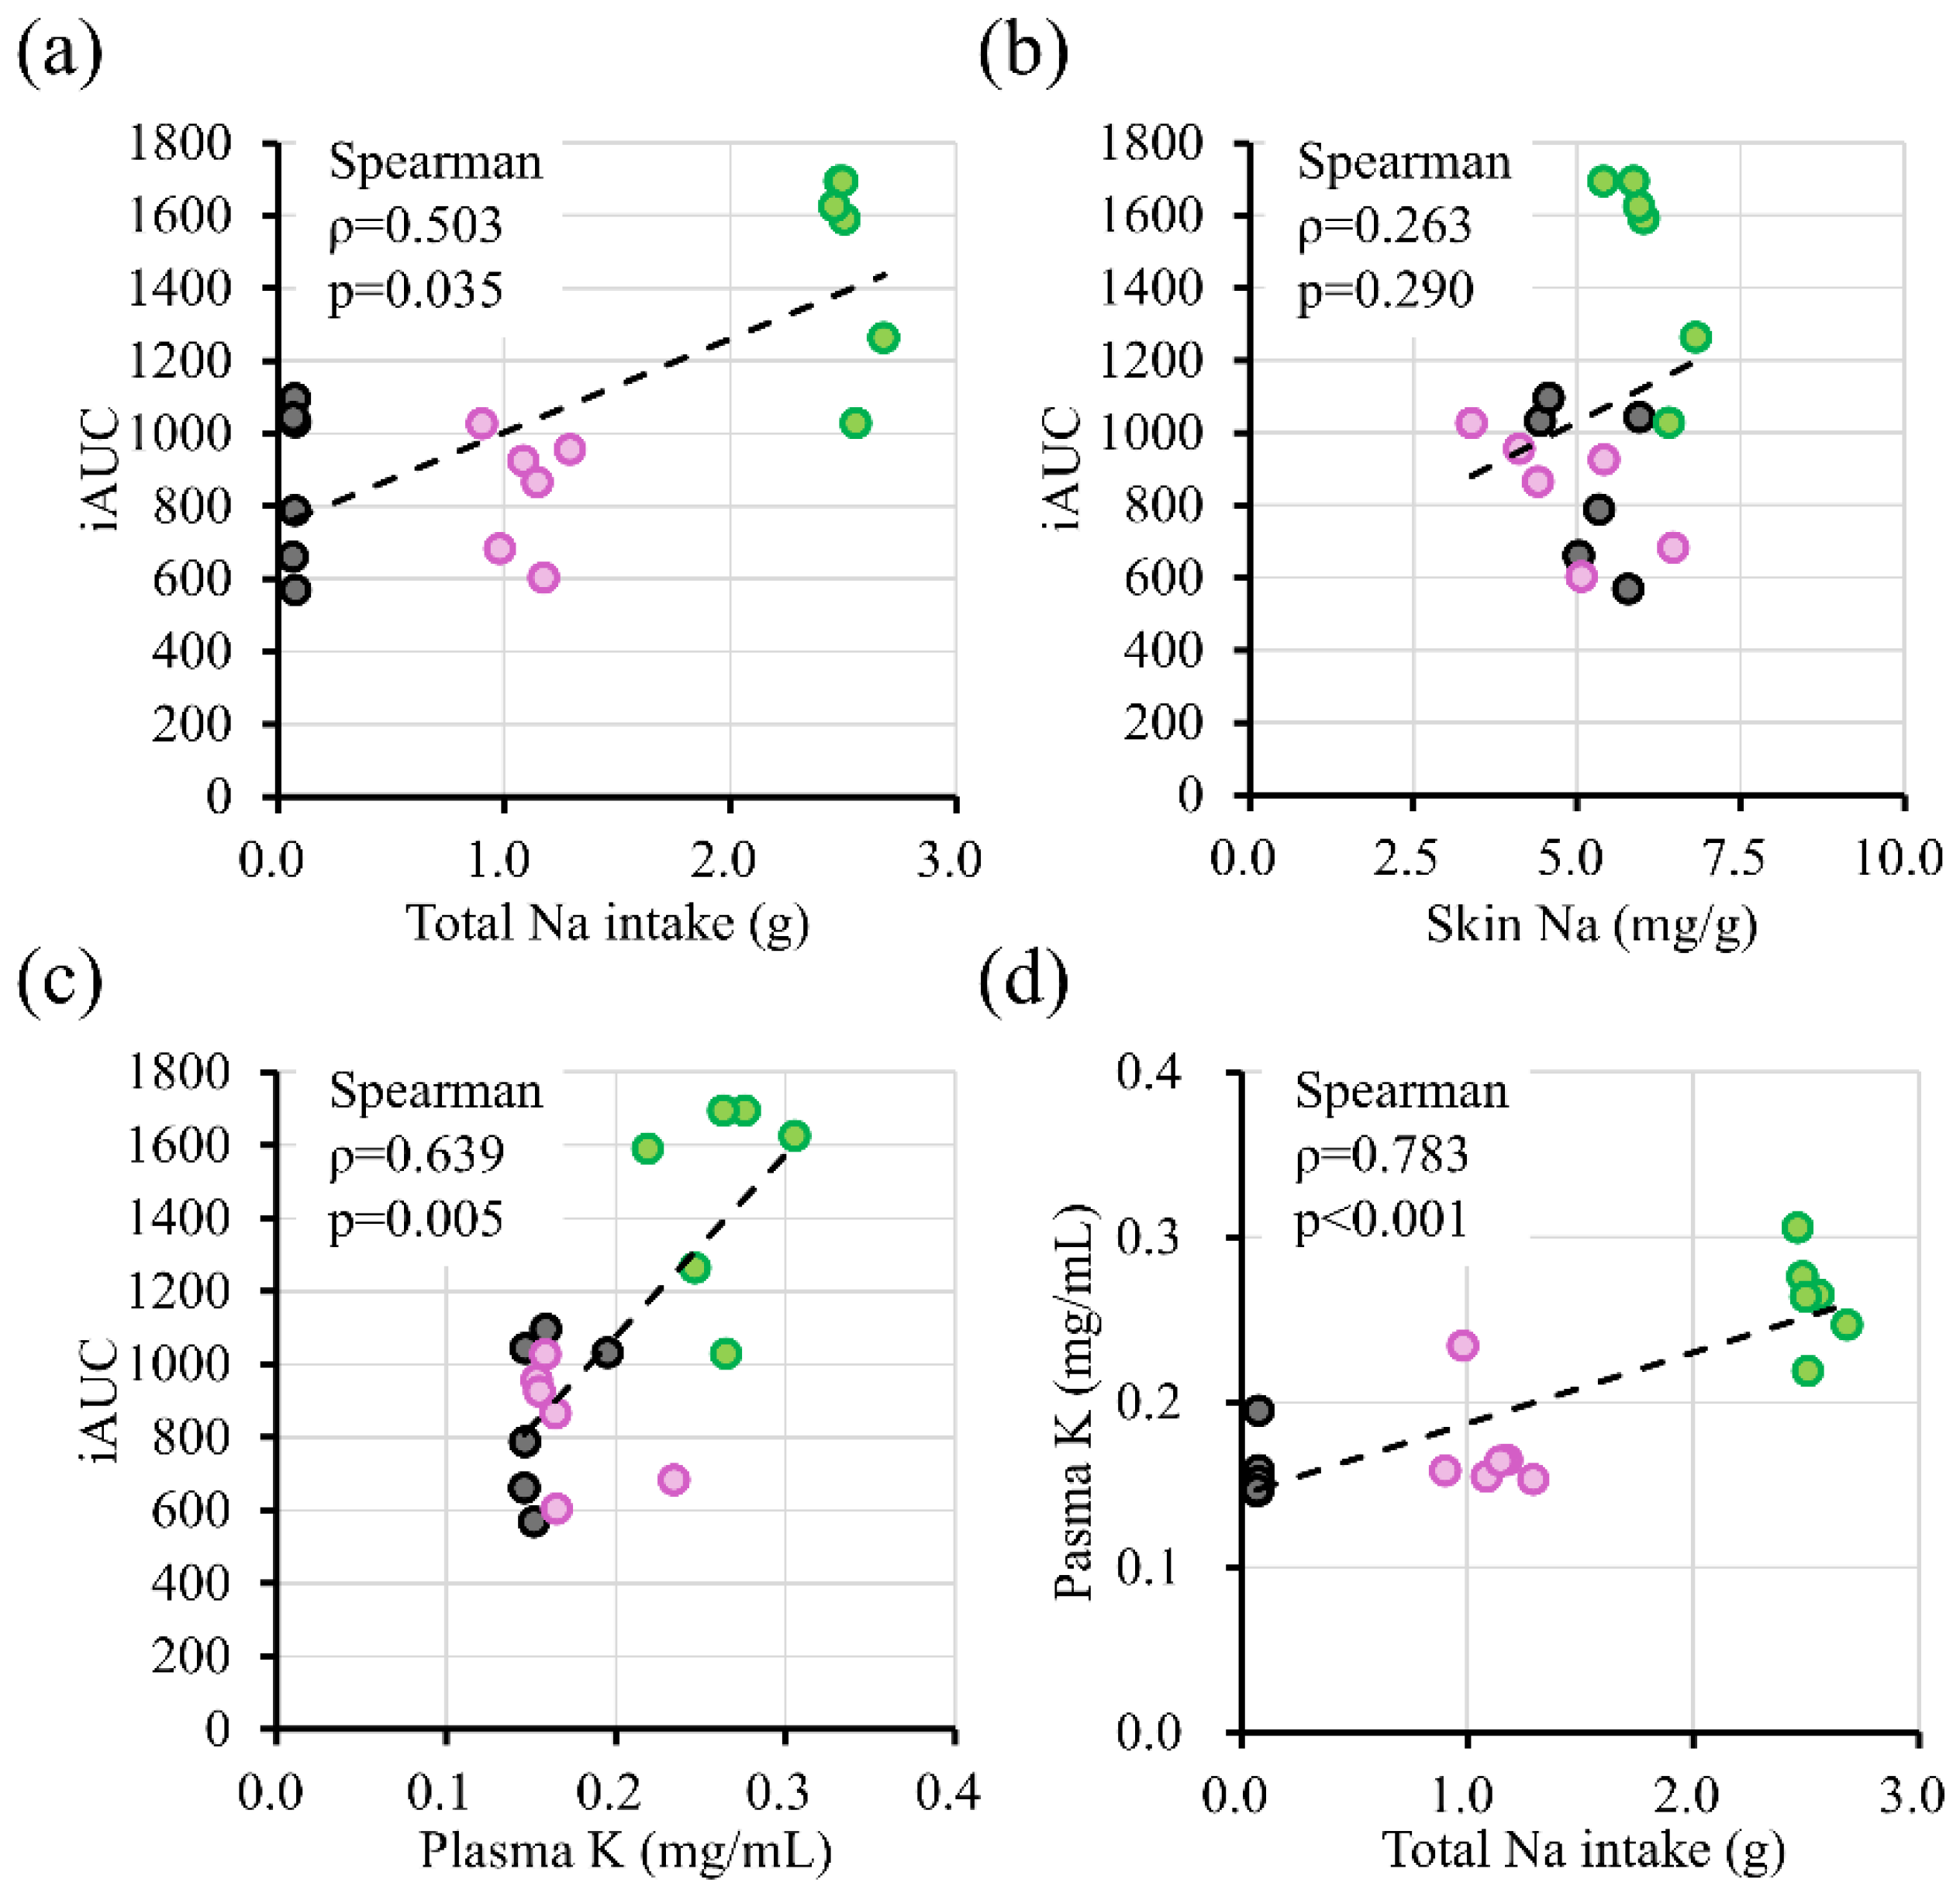
Having characterized systemic and cutaneous electrolyte status under different dietary sodium conditions (Figure 2), we next evaluated whether these differences were associated with altered allergic responses following DNFB challenge. To induce allergic contact dermatitis, DNFB was applied to the right ear after prior sensitization (Figure 1a). Time-course analysis demonstrated that ear thickness in the challenged right ear increased significantly following DNFB application, with HSD-fed mice exhibiting greater swelling than ND controls at 1, 6, and 24 h post-challenge (Figure 3a). Swelling in the HSD→ND group was comparable to ND controls and significantly lower than in the HSD group throughout the observation period. In contrast, no significant changes in ear thickness were observed in the non-challenged left ear in any group during the entire measurement period (Figure 3a). Cumulative swelling responses, quantified as iAUC, were significantly elevated in HSD-fed mice compared with ND controls (Figure 3b). In contrast, iAUC values in the HSD→ND group were comparable to ND controls and significantly lower than those in the HSD group. Representative hematoxylin and eosin–stained sections of challenged auricular skin tissue are shown in Figure 3c. Increased thickening and inflammatory cell infiltration were apparent in HSD-fed mice compared with ND controls, whereas these changes appeared attenuated in the HSD→ND group. Consistent with these observations, quantitative analysis of nuclear density in auricular tissue sections revealed a significant increase in HSD-fed mice compared with ND controls, while nuclear density in the HSD→ND group was comparable to ND controls and significantly lower than that in the HSD group (Figure 3d). To further examine the relationship between dietary salt exposure and inflammatory severity, correlation analyses were performed (Supplementary Figure S2). Spearman analysis demonstrated that total sodium intake was moderately associated with cumulative ear swelling (ρ = 0.503, p = 0.035), whereas plasma potassium levels showed stronger correlations with iAUC (ρ = 0.639, p = 0.005). Plasma potassium was strongly correlated with total sodium intake (ρ = 0.783, p < 0.001). In contrast, skin sodium concentration was not significantly correlated with iAUC (ρ = 0.263, p = 0.29).
Figure 3.
Allergic inflammatory responses following DNFB challenge. (a) Time course of ear swelling following DNFB challenge. Ear thickness was measured at 0, 1, 6, and 24 h post-challenge. (b) Incremental area under the curve (iAUC) of ear swelling responses. (c) Representative hematoxylin and eosin–stained sections of ear tissue. Control indicates vehicle-treated tissue. ND, HSD, and HSD→ND represent DNFB-treated groups. Scale bar = 50 μm. (d) Quantification of nuclear density (×10³ cells/mm²) in dorsal ear tissue. Data are presented as individual values with group means (n = 6 per group). Groups with different letters indicate statistically significant differences (p < 0.05).
Scheme S2.
Correlations between dietary sodium exposure, plasma potassium, and allergic inflammatory responses. (a) Association between total sodium intake during the experimental period and cumulative ear swelling responses (incremental area under the curve, iAUC). (b) Association between skin sodium concentration and cumulative ear swelling (iAUC). (c) Association between plasma potassium concentration and iAUC. (d) Association between total sodium intake and plasma potassium concentration. Each dot represents an individual mouse (n = 18). Gray circles indicate the normal diet (ND) group, pink circles indicate the high-salt diet followed by normalization (HSD→ND) group, and green circles indicate the high-salt diet (HSD) group. Spearman correlation coefficients (ρ) and corresponding p values are indicated in each panel. Linear regression lines are shown for visualization purposes.
4. Discussion
The present study demonstrates that high dietary salt exposure during the sensitization phase exacerbated DNFB-induced allergic contact dermatitis, as evidenced by increased ear swelling and iAUC values. In contrast, normalization of salt intake prior to sensitization attenuated disease severity. These effects were accompanied by numerically higher sodium levels in skin tissue, despite unchanged plasma sodium concentrations, consistent with the concept of tissue-specific sodium storage independent of systemic hypernatremia [8,12,15]. Correlation analyses further indicated that overall salt exposure and associated systemic electrolyte alterations were more closely related to the magnitude of allergic inflammation than tissue sodium concentration alone.
Our findings align with accumulating evidence that dietary salt and electrolyte imbalance modulate both innate and adaptive immune responses [3,4,5]. While earlier work established sodium-driven Th17 polarization [16], subsequent studies have demonstrated that sodium can accumulate in peripheral tissues such as the skin and influence immune cell function [8,12,17]. Although the difference did not reach statistical significance, cutaneous sodium levels were numerically higher in HSD-fed mice than in ND controls (Figure 2b). Because ACD severity is determined during sensitization through antigen presentation and T-cell priming within the skin [10], these observations raise the possibility that even modest alterations in the local electrolyte environment during this period may contribute to changes in immune priming and subsequent inflammatory responses. Moreover, the stronger association observed between plasma potassium levels and inflammatory indices (Supplementary Figure S2) suggests that immune modulation during high-salt exposure may involve coordinated alterations in the broader electrolyte milieu rather than sodium concentration alone. Although high-salt diet has been shown to exacerbate other inflammatory skin conditions, such as imiquimod-induced dermatitis [9], its role during the sensitization phase of ACD has not been directly examined. The present findings therefore address this gap and suggest that dietary sodium exposure may influence immune priming in contact hypersensitivity. More broadly, emerging evidence indicates that contact hypersensitivity is sensitive to systemic metabolic and nutritional states. For example, high sucrose intake has been reported to exacerbate DNFB-induced dermatitis [14], and high-fat diet has been shown to enhance contact hypersensitivity reactions in mice [18,19]. Collectively, these observations support the concept that dietary composition can modulate the magnitude of contact hypersensitivity responses.
Importantly, this study indicates that the enhancement of ACD severity observed under high-salt conditions depends on sodium exposure during sensitization. Mice exposed to high dietary salt but returned to a normal diet prior to DNFB sensitization exhibited ear swelling and iAUC responses comparable to ND controls (Figure 3). These findings suggest that high-salt–associated exacerbation of contact hypersensitivity is not sustained in the absence of continued sodium exposure during immune priming. Given the widespread prevalence of excessive sodium intake worldwide [1,20], dietary normalization may represent a modifiable factor influencing contact hypersensitivity severity.
Several limitations should be acknowledged. First, the 8% NaCl diet used in this study represents an experimental salt-loading model designed to induce measurable tissue sodium accumulation rather than to replicate typical human dietary intake. Although this concentration substantially exceeds average human sodium consumption, plasma sodium concentrations remained stable (Figure 2a), indicating preserved systemic sodium homeostasis. Similar high-salt formulations have been employed experimentally to induce cutaneous sodium accumulation and immune modulation in C57BL/6 mice [8,12]. Nonetheless, the supraphysiological salt content limits direct extrapolation to human dietary conditions. Second, total food and energy intake were higher in the HSD group compared with controls (Supplementary Figure S1a, b). Although body weight did not differ significantly between ND and HSD groups (Figure 1b), we cannot completely exclude the possibility that increased caloric intake contributed to the enhanced allergic response. However, the attenuation of ACD severity following normalization of dietary salt intake—despite persistently moderate differences in food consumption—argues against a purely caloric mechanism. Future studies employing pair-feeding or isocaloric dietary designs will be necessary to distinguish the independent effects of sodium from total energy intake. In addition, mechanistic pathways linking electrolyte alterations to enhanced allergic inflammation were not directly investigated, and the contribution of specific T-cell subsets was not examined. Further mechanistic and translational studies are warranted.
5. Conclusions
In conclusion, dietary salt exposure during immune sensitization aggravated DNFB-induced allergic contact dermatitis and was associated with enhanced allergic inflammation accompanied by systemic electrolyte alterations. The attenuation of disease severity following dietary normalization suggests that sodium intake may represent a modifiable nutritional factor influencing inflammatory skin conditions.
Supplementary Materials
The following supporting information can be downloaded at: https://www.mdpi.com/article/doi/s1, Supplementary Figure S1: Dietary intake parameters during the experimental period.; Supplementary Figure S2: Correlations between dietary sodium exposure, plasma potassium, and allergic inflammatory responses.
Author Contributions
Conceptualization, Y.Y.; Methodology, Y.Y.; Validation, Y.Y.; Formal Analysis, Y.Y. and A.F.; Investigation, Y.Y. and A.F.; Data Curation, Y.Y.; Writing – Original Draft Preparation, A.F and Y.Y.; Writing – Review & Editing, Y.Y.; Visualization, Y.Y.; Supervision, Y.Y.; Project Administration, Y.Y.; Funding Acquisition, Y.Y.; all authors have read and agreed to the published version of the manuscript.
Funding
This work was supported by JSPS KAKENHI [grant numbers 22K11738 and 25K14927].
Institutional Review Board Statement
All animal experiments were approved by the Kobe Gakuin University Animal Experimentation Committee (animal experimentation certificate no. 24-21 [approval date: April 1, 2024] and no. 25-26 [approval date: April 1, 2025]), and were conducted in accordance with institutional and national guidelines.
Informed Consent Statement
Not applicable.
Data Availability Statement
Raw data supporting the conclusions of this study are available upon request from the authors.
Conflicts of Interest
The authors declare no conflict of interest. The sponsors had no role in the design, execution, interpretation, or writing of the study.
Abbreviations
The following abbreviations are used in this manuscript:
| ACD | Allergic contact dermatitis |
| ANOVA | Analysis of variance |
| DNFB | 2,4-Dinitrofluorobenzene |
| HSD | High-salt diet |
| HSD→ND | High-salt diet followed by normalization to normal diet |
| iAUC | Incremental area under the curve |
| ND | Normal diet |
References
- World Health, O. Guideline: Sodium intake for adults and children; World Health Organization: Geneva, 2012. [Google Scholar]
- Collaborators, G.B.D.R.F. Global burden of 87 risk factors in 204 countries and territories, 1990-2019: a systematic analysis for the Global Burden of Disease Study 2019. Lancet 2020, 396, 1223–1249. [Google Scholar] [CrossRef] [PubMed]
- Jobin, K.; Muller, D.N.; Jantsch, J.; Kurts, C. Sodium and its manifold impact on our immune system. Trends Immunol 2021, 42, 469–479. [Google Scholar] [CrossRef] [PubMed]
- Li, X.; Alu, A.; Wei, Y.; Wei, X.; Luo, M. The modulatory effect of high salt on immune cells and related diseases. Cell Prolif 2022, 55, e13250. [Google Scholar] [CrossRef] [PubMed]
- Miyauchi, H.; Geisberger, S.; Luft, F.C.; Wilck, N.; Stegbauer, J.; Wiig, H.; Dechend, R.; Jantsch, J.; Kleinewietfeld, M.; Kempa, S.; et al. Sodium as an Important Regulator of Immunometabolism. Hypertension 2024, 81, 426–435. [Google Scholar] [CrossRef] [PubMed]
- Linder, B.A.; Mehrer, J.D.; Bunsawat, K. Salty skin: Where excess sodium goes for a rendezvous. J Physiol 2022, 600, 3025–3027. [Google Scholar] [CrossRef] [PubMed]
- Sulyok, E.; Farkas, B.; Nagy, B.; Varnagy, A.; Kovacs, K.; Bodis, J. Tissue Sodium Accumulation: Pathophysiology and Clinical Implications. Antioxidants (Basel) 2022, 11. [Google Scholar] [CrossRef] [PubMed]
- Wiig, H.; Schroder, A.; Neuhofer, W.; Jantsch, J.; Kopp, C.; Karlsen, T.V.; Boschmann, M.; Goss, J.; Bry, M.; Rakova, N.; et al. Immune cells control skin lymphatic electrolyte homeostasis and blood pressure. J Clin Invest 2013, 123, 2803–2815. [Google Scholar] [CrossRef] [PubMed]
- Pajtok, C.; Veres-Szekely, A.; Agocs, R.; Szebeni, B.; Dobosy, P.; Nemeth, I.; Vereb, Z.; Kemeny, L.; Szabo, A.J.; Vannay, A.; et al. High salt diet impairs dermal tissue remodeling in a mouse model of IMQ induced dermatitis. PLoS One 2021, 16, e0258502. [Google Scholar] [CrossRef] [PubMed]
- Martin, S.F. Allergic contact dermatitis: xenoinflammation of the skin. Curr Opin Immunol 2012, 24, 720–729. [Google Scholar] [CrossRef] [PubMed]
- Ferguson, J.F.; Aden, L.A.; Barbaro, N.R.; Van Beusecum, J.P.; Xiao, L.; Simmons, A.J.; Warden, C.; Pasic, L.; Himmel, L.E.; Washington, M.K.; et al. High dietary salt-induced dendritic cell activation underlies microbial dysbiosis-associated hypertension. JCI Insight 2019, 5. [Google Scholar] [CrossRef]
- Machnik, A.; Neuhofer, W.; Jantsch, J.; Dahlmann, A.; Tammela, T.; Machura, K.; Park, J.K.; Beck, F.X.; Muller, D.N.; Derer, W.; et al. Macrophages regulate salt-dependent volume and blood pressure by a vascular endothelial growth factor-C-dependent buffering mechanism. Nat Med 2009, 15, 545–552. [Google Scholar] [CrossRef] [PubMed]
- Yoshimura, Y.; Takahashi, M. Effects of Triacetin on AMPK Activation and Immune Responses in Allergic Contact Dermatitis. Allergies 2024, 4, 254–267. [Google Scholar] [CrossRef]
- Fujii, A.; Kimura, R.; Mori, A.; Yoshimura, Y. Sucrose Solution Ingestion Exacerbates Dinitrofluorobenzene-Induced Allergic Contact Dermatitis in Rats. Nutrients 2024, 16. [Google Scholar] [CrossRef] [PubMed]
- Chattopadhyay, A.; Tully, J.; Shan, J.; Sheikh, S.; Ohliger, M.; Gordon, J.W.; Mauro, T.; Abuabara, K. Sodium in the skin: a summary of the physiology and a scoping review of disease associations. Clin Exp Dermatol 2023, 48, 733–743. [Google Scholar] [CrossRef] [PubMed]
- Kleinewietfeld, M.; Manzel, A.; Titze, J.; Kvakan, H.; Yosef, N.; Linker, R.A.; Muller, D.N.; Hafler, D.A. Sodium chloride drives autoimmune disease by the induction of pathogenic TH17 cells. Nature 2013, 496, 518–522. [Google Scholar] [CrossRef] [PubMed]
- Jantsch, J.; Schatz, V.; Friedrich, D.; Schroder, A.; Kopp, C.; Siegert, I.; Maronna, A.; Wendelborn, D.; Linz, P.; Binger, K.J.; et al. Cutaneous Na+ storage strengthens the antimicrobial barrier function of the skin and boosts macrophage-driven host defense. Cell Metab 2015, 21, 493–501. [Google Scholar] [CrossRef] [PubMed]
- Ruhl-Muth, A.C.; Maler, M.D.; Esser, P.R.; Martin, S.F. Feeding of a fat-enriched diet causes the loss of resistance to contact hypersensitivity. Contact Dermatitis 2021, 85, 398–406. [Google Scholar] [CrossRef] [PubMed]
- Majewska-Szczepanik, M.; Kowalczyk, P.; Marcinska, K.; Strzepa, A.; Lis, G.J.; Wong, F.S.; Szczepanik, M.; Wen, L. Obesity aggravates contact hypersensitivity reaction in mice. Contact Dermatitis 2022, 87, 28–39. [Google Scholar] [CrossRef] [PubMed]
- Powles, J.; Fahimi, S.; Micha, R.; Khatibzadeh, S.; Shi, P.; Ezzati, M.; Engell, R.E.; Lim, S.S.; Danaei, G.; Mozaffarian, D.; et al. Global, regional and national sodium intakes in 1990 and 2010: a systematic analysis of 24 h urinary sodium excretion and dietary surveys worldwide. BMJ Open 2013, 3, e003733. [Google Scholar] [CrossRef] [PubMed]
Figure 2.
Systemic and cutaneous electrolyte levels following dietary sodium manipulation. (a) Plasma sodium concentration. (b) Skin sodium concentration normalized to wet weight. (c) Plasma potassium concentration. Data are presented as individual values with group means (n = 6 per group). Groups with different letters indicate statistically significant differences (p < 0.05). n.s., not significant.
Disclaimer/Publisher’s Note: The statements, opinions and data contained in all publications are solely those of the individual author(s) and contributor(s) and not of MDPI and/or the editor(s). MDPI and/or the editor(s) disclaim responsibility for any injury to people or property resulting from any ideas, methods, instructions or products referred to in the content. |
© 2026 by the authors. Licensee MDPI, Basel, Switzerland. This article is an open access article distributed under the terms and conditions of the Creative Commons Attribution (CC BY) license (http://creativecommons.org/licenses/by/4.0/).
Copyright: This open access article is published under a Creative Commons CC BY 4.0 license, which permit the free download, distribution, and reuse, provided that the author and preprint are cited in any reuse.


