Submitted:
10 February 2026
Posted:
11 February 2026
You are already at the latest version
Abstract
Speed management plays a critical role in road safety; however, conventional speed limits are determined based on geometry and traffic characteristics, with limited consideration of pavement structural condition and surface distress. This study proposes an integrated mechanistic–quantitative framework that links pavement distress and road safety indicators to the selection of speed limits. A flexible pavement section on Highway No. 80 in Iraq is analyzed as a case study. Mechanistic pavement analysis using KENPAVE is employed to estimate critical strains based on field traffic data and Equivalent Single Axle Loads (ESAL). The rate of failure is estimated by comparing the ESAL and the allowable load repetitions. Safety-related constraints are then derived to quantify hydroplaning risk, braking performance through stopping sight distance, and the vertical shock criterion. The results indicate that the existing pavement structure is marginal, with a high probability of fatigue failure and sensitivity to rutting under traffic growth. The integrated safety analysis yields a critical wet-weather speed of approximately 67–70 km/h, while localized settlements exceeding 10 mm require speed reductions to 50–60 km/h to maintain vehicle stability. The proposed framework demonstrates that pavement condition directly influences safe speed and provides a rational basis for safety-oriented speed management.

Keywords:
critical strain
; ESAL
; fatigue cracking
; hydroplaning speed
; rutting
; stopping sight distance
; vertical shock speed
; wet pavement
1. Introduction
Road safety has been a major concern for road users, road designers, traffic operators, and transport planners. This issue is particularly evident on rural roads, where heavy traffic and increased freight transport are noticeable [1]. In parallel, speed management has been identified as an important contributing factor to road safety [2,3]. Determining the speed limit is commonly based on road geometric characteristics and functional classification, with limited consideration of pavement structural condition, despite the clear effects of pavement distress and deformation on vehicle operating conditions [4]. However, pavement distress and deformation affect road safety by directly affecting vehicle stability, braking performance, and the risk of hydroplaning. These factors have been identified among the most contributing factors in road risk assessment and analysis studies [5]. Recent research confirmed high run-off and head-on crash risk linked to road condition and skid resistance, and demonstrated that it can upgrade the level of road safety [6,7]. For example, roughness causes sudden vertical accelerations that negatively affect vehicle stability, especially heavy vehicles [8]. Skid resistance and water accumulation are reduced by surface polishing and rutting, leading to increased hydroplaning and longer stopping distances under wet conditions [9]. When speed limits are not adjusted for these conditions, drivers may operate at the posted speed limit but not at a safe speed. Checn et al. (2017) [10] presented crash frequency models for three levels of crash severity and five levels of road surface condition, using a multivariate random-parameters negative binomial model. They found that, for pavements in poor condition, the surface condition variable has a significant random parameter in the crash model that is normally distributed; higher roughness increases the expected crash frequency.
Alhasan et al. (2018)[11] investigated the effect of traffic volume, posted speed limits, skid numbers, ride qualities (IRI), and rut depths (RD) on crash frequency for one mile roadway in Iowa using negative binomial regression models. The findings showed a significant impact of pavement skid resistance on crash frequency and severity, especially at higher speeds. Integrating safety management into the pavement management system will optimize the performance of the highway network.
Tahir et al. (2022) [12] examined safety performance following changes in pavement performance indicators, including the International Roughness Index (IRI), rutting, and cracking, on selected roads in Bahawalpur, Punjab, Pakistan. They suggested setting boundaries of performance indicators, which can be used to evaluate the need for rehabilitation; these values are IRI = 1.75-2 m/Km, rutting =9 – 10 mm, and Pavement Condition Rating (PCR)=75-80.
Mkwata and Chong (2022) [13] provided an overview of the relationship between safety performance measures and pavement surface conditions, including roughness, rutting, and skid resistance. The findings showed the significant role of pavement surface conditions on road safety. The direct effect of pavement distress on ride comfort and the indirect effect on driver distraction, leading to a loss of vehicle control and consequently increased road risk. The effect was more pronounced during rainy weather and at night. When the rut depth exceeds 23.5 mm and the IRI exceeds 3.2 m/km, the probability of crashes increases. However, the skid resistance threshold value was inconclusive due to the absence of a uniform global methodology. These results may be valuable for engineers during pavement design, maintenance, and safety improvement.
Zhang et al. (2022) [14] proposed a methodology to simulate and assess the impact of unbalanced water-filled rutting on driving stability, with a special focus on the vehicle’s lateral dynamic stability. The results showed that the unbalanced water depths in the left- and right-hand ruts led to different friction levels and uncontrolled driving along the roadway. This is most likely to cause fatal crashes when the vehicle speed exceeds 80 km/h and the rut width exceeds 0.7 m. When a vehicle’s lateral offset exceeds 1.025 mm, vehicles may run into the adjacent lane and cause conflicts. The risk of a lane change will be more severe when the vehicle’s lateral acceleration exceeds 0.4, and when rutting width and length increase.
Shyaa and Abd Rahma (2022) [15] showed that an invisible rut cannot catch the driver unaware, leading to loss of control. The maximum risk of a crash was found to occur at 3mm rut depth on dry road surfaces and at 6mm rut depth on wet road surfaces. Also, the risk of a rut-related crash was found to increase by 20% to 30% on wet road surfaces in comparison to dry surfaces.
Wang et al. (2024) [16] developed safety performance function (SPF) models to relate the international roughness index (IRI), a measure of pavement roughness, to observed crash frequencies for two-lane rural roadways in Pennsylvania. They found that the IRI has a different impact on total crash frequency than on fatal and injury crash frequency, and on rear-end crashes. This is likely due to how roughness can affect travel speeds. This suggests that pavement management decisions should consider the safety benefits.
Cai et al. (2024) [17] introduced a novel method for braking performance assessment based on water-depth estimation using LiDAR-measured pavement geometry and vehicle-pavement simulation. The tire-pavement friction was analyzed, and the dynamic braking performance was also studied using the 85th percentile stopping distance as an indicator. The results demonstrated that rainfall intensity and vehicle velocity significantly affect braking risk. Additionally, pavement rutting accumulates deeper water depth, thereby elevating braking safety risks.
Sadeghi and Goli (2024) [5] evaluated key parameters influencing traffic safety, specifically pavement conditions and weather elements, through a review of related published articles. They highlighted the critical role of pavement friction and roughness in accidents, with rutting during rain and night having a pronounced impact. They also found that driving at higher speeds in these pavement conditions will lead to a higher rate of single-vehicle crashes, while lower speeds may cause multiple-vehicle crashes.
Huynh et al. (2025) [18] estimated a macro-level random-parameter negative binomial regression model using traffic crash, census, traffic, and pavement condition data for arterials and freeways in Victoria, Australia. They found that road segments with very poor rutting or roughness generally tend to have more traffic crashes, especially fatal crashes.
Lebaku et al. (2025) [19] examined the relationship between pavement performance and crash frequency and severity using data from the Iowa Department of Transportation (DOT). Machine learning models were used along with negative binomial and ordered probit regression models. The study’s key findings reveal that higher speed limits, well-maintained roads, and higher friction scores correlate with lower crash rates. In contrast, rougher roads and adverse weather conditions are associated with higher crash severity. This analysis emphasizes integrating safety with pavement design principles to boost road safety.
Limited research has conducted to establish a quantitative link between pavement distress, speed limit, and road safety. This disconnect highlights the need for an integrated framework that explicitly links pavement distress with road safety performance and speed management.
This research aims to propose an integrated quantitative approach to connect pavement structural distress, road safety, and speed limit setting within a unified analytical framework.
The mechanistic pavement analysis approach based on KENPAVE is used to evaluate actual traffic loading data, critical strain responses, fatigue life, and rutting life. Safety-related indicators are then derived to quantify the impact of pavement distress on vehicle stability and braking performance; these indicators are subsequently used to establish rational speed limit constraints that reflect both structural and operational safety considerations.
The main contributions of this research are threefold. First, it provides a quantitative linkage between pavement distress parameters and key road safety risk factors. Second, it introduces a pavement-based speed limit selection module that integrates hydroplaning, braking, and stability criteria. Third, it demonstrates the practical applicability of the proposed framework through a real highway case study subjected to heavy traffic loading. The proposed methodology supports a more adaptive, safety-oriented approach to speed management, in which pavement condition is an essential input to traffic control and road safety management strategies.
2. Methods of the Research
The steps shown in Figure 1 are followed to achieve the research aim. The first step is selecting the case study where failures have been observed. The necessary data will then be identified and collected. After that, the KENPAVE software will be used to analyze data and determine the critical strains and the allowable repetitions of applied axle load to avoid damage. Then the safety-related calculations will be conducted to find the margins of the set speed limit that should be considered to avoid crashes and conflicts under damaged and wet conditions. The findings will be based on the last step of the proposal process. The details of the following steps will be explained in the coming subsections.
2.1. The Study Area
The selected road for this study is Street 80, located in Hill City, Iraq. This roadway serves as a vital urban connector and is designed as a flexible pavement structure. The analyzed section spans approximately 4.4 kilometers and serves as an essential link between two major highways: the Hilla–Karbala Highway and the Hillah–Al-Najaf Highway. Given its strategic importance for regional traffic flow and heavy vehicular usage, this section was selected for detailed deformation and damage analysis.
The roadway comprises three lanes in each direction, each measuring 3.65 meters in width. The road features a shoulder width of 2.0 m on both sides. This case study offers significant insights into the structural assessment and improvement of pavement performance on this roadway.
2.2. Data Collection
Two types of data were collected in this study: layer properties and vehicle classification counting.
2.2.1. Layer Properties
For the material properties used in constructing pavement layers, official document data were collected from sources provided by the General Authority of Roads and Bridges, as detailed in Table 1. These properties are constant along the roadway section.
The AASHTO method has been used to find the Modulus of elasticity (E) and layer coefficient factors (a) of the pavement layers. Figure 2 shows the pavement structure layers, along with the obtained E and a.
The pavement structure consists of a relatively thin asphalt surface layer (2.4 in) over a stabilized bituminous base (4.8 in), a granular subbase (12 in), and a low-strength subgrade. The thin surface layer may lead to high tensile strains at its bottom, increasing the likelihood of fatigue cracking under repeated traffic. However, the thicker base layer with a high elastic modulus may accommodate stress distribution across pavement layers, reducing service deflection. The properties of the subbase layer with a thickness of 12 in may be sufficient to provide load spreading, but lower stiffness promotes the concentration of vertical compressive strains at the top of the subgrade. The subgrade also exhibits a low resilient modulus, indicating a relatively weak foundation, high vertical compressive strain at the top of the subgrade, and a high probability of rutting.
2.2.2. Vehicle Classification
The trucks were counted at the site according to axle classification. The roadway section was divided into 22 segments. Manual counting was used for each segment, and photos were taken for the trucks to identify their types according to the Iraqi Specification and estimate their weight. The number of trucks by type recorded for segment 1 is shown in Table 2. The weight of vehicles was calculated according to the Iraqi specification. For example, the weight of vehicle type 2-S3 was calculated as follows:
The weight of in-front-single axle = 7 tons
The weight of a rear single axle = 13 tons
The weight of the tandem axles= 20
The total weight of vehicle type 2-S2 =7+13+20=40 tons
The most common truck category operating in the study area is Type 2-2S. Heavy multi-axle vehicles, including Type 3 (27 tons) and Type 2–3 (47 tons), are also present, indicating a substantial proportion of overloaded or near-capacity trucks in the traffic stream at peak hour. These cause damage to the pavement. Heavy vehicles are significantly affected by surface damage, especially when it leads to water accumulation. They experience larger dynamic wheel loads, higher vertical accelerations over local settlement, and longer braking distances. Therefore, there is a significant concern of speed-related hazards, particularly under wet pavement conditions.
2.3. Estimating Equivalent Single Axle Load ESAL
The accurate evaluation of pavement design and longevity depends not only on gathering field data for lab testing but also on carefully collecting traffic volume information. This data is essential for calculating the Equivalent Single Axle Load (ESAL). ESAL assesses, over time, the damage caused by axle loads to the pavement structure, which helps in evaluating pavement layer thickness. Therefore, the systematic collection and examination of traffic volume data help ensure the durability and effectiveness of pavement thickness.
The Truck factor (TF) for each axle is estimated according to the Iraqi Specifications, and the TF for each vehicle is then calculated as shown in Table 3 (for segment 1).
The Growth Factor is calculated based on service life using equation (3.1) shown below.
where r= 6%, n =30 years, G= 66.44
The initial daily traffic is split evenly across all traffic lanes. It must be multiplied by the directional and lane distribution factors to obtain the initial traffic on the design lane. Either lane of a two-lane highway can be considered the design lane, whereas on multilane highways, the outside lane is considered the design lane. Identifying the design lane is important because, in some cases, more trucks travel in one direction than the other, or they may travel heavily loaded in one direction and empty in the other. Thus, it is necessary to determine the relevant proportion of trucks on the design lane. LDF is assumed 80% [20,21]
2.4. Pavement Structural Analysis
KENPAVE Software has been used to estimate the stress, strain, and displacement at four points. The Load magnitude per axle is assumed to be 4500 lb (for dual tires). This is estimated by dividing the Load per axle for standard axle load (W 18) by 2. For dual tires, axle load = 9000/2 = 4,500 lbs per tire. The contact pressure is assumed to be 95 psi, per Iraqi tire pressure specifications. Contact radius is estimated from Eq (3):
Tire spacing (center-to-center) assumed ≈ 13.5 in
Regarding the Number of points (Np), the critical points for stress, strain, and deflection calculation are considered in this study. These points are:
- the first point at the surface of the asphalt layer with a depth of 0 in to consider Surface deflection and potential rutting initiation.
- The second point at the bottom of the asphalt layer, at 2.4 in from the surface, is used to estimate the critical tensile strain, which is responsible for fatigue cracking prediction.
- The third point is at the midpoint of the base course, at a depth of 4.8 in, from the surface to observe stress distribution and potential shear damage in the base
- The fourth point at the top of subgrade soil, at a depth of 19.2 in from the surface, is used to estimate the critical vertical compressive strain, which is responsible for rutting prediction.
2.5. Damage Analysis
In this step, the fatigue life (Nf) and rutting life (Nr) will be estimated for each segment using the critical horizontal tensile strain at the bottom of the asphalt layer and the vertical compressive strain at the top of the subgrade, respectively. The results will be compared with the estimated ESAL.
2.5.1. Fatigue Damage
According to the Asphalt Institute, Equation (4) will be used to estimate the maximum allowable axle load frequency to avoid fatigue cracking (Nf).
The typical constants for flexible pavements (Asphalt Institute): K1= 0.0796, K2 =3.291, and K3 =0.854.
2.5.2. Rutting Damage
According to Shell and Asphalt Institute [21], Equation (5) will be used to estimate the maximum allowable axle load that pavement with specific characteristics can support before rutting occurs (Nr).
where k= 1.365 ×10⁻⁹ , and n = 4.477.
2.6. Speed Limit
To link pavement distress to speed management, a speed limit decision module was incorporated. The speed limit will be reset to account for the probability of pavement damage. The recommended speed limit will be set to the minimum speed that satisfies the hydroplaning, braking, and stability constraints.
2.6.1. The Hydroplaning Speed
The hydroplaning speed is the maximum safe speed at which the tire can be controlled during sliding on a wet pavement surface [22,23,24].
According to the Iraq specifications, Tire pressure is assumed to be 95 psi; therefore = 9.75 psi. Previous studies have shown that hydroplaning may initiate at approximately 70–90% of the predicted threshold speed, depending on water depth and surface condition [22,23,24]. Accordingly, the wet speed limit was conservatively selected as 70% of the hydroplaning speed, 70 km/h.
2.6.2. The Stopping Sight Distance (SSD)
The SSD is the distance to prevent braking and sliding risks at candidate speeds on wet or damaged pavement surfaces; a low SSD may lead to rear-end crashes. Equation (7) [25] will be used:
SSD is in meters, V is the speed of the vehicle in m/sec, g=9.81 m/s2, and f= friction factor. The friction factors for wet condition = o.4-0.5 for dry condition, and 0.2-0.3 for wet condition [25]. The target SSD will be selected based on the current speed limit under dry conditions. Accordingly, the speed limit will be determined. For example, the current speed limit in the study area is 100 k/m, and the corresponding SSD at dry conditions is 87.4 m (assuming f = 0.45). At damaged and wet conditions, the 87.4 m corresponds to 67 km/h.
2.6.4. Vertical-Shock Speed
To account for the effects of local settlements and rut edges, the critical vertical acceleration is incorporated into the framework for identifying a safe speed limit. Vertical acceleration affects ride comfort, tire-pavement contact, steering instability, and loss of control that leads to rollover crashes on damaged and wet pavement surfaces. The general equation used to determine the vertical acceleration (a) is:
To identify the safe speed limit, the target “a” should be determined. High acceleration may lead to loss of partial tire control and a drop in lateral friction, both of which are very dangerous on a wet surface. Therefore, maximum vertical acceleration (amax) should be specified. By substituting in equation (9),
According to previous studies [26,27,28], the safe amax should be less than 0.3(g). According to Hal et al. [24], although a maximum of 0.2 to 0.3g is considered safe for dry conditions, it may cause sudden steering over-reaction, hydroplaning at the rut edge, and loss of control braking. Therefore, in this research, the safe amax will be taken as 0.2g. Accordingly, the safer speed for vertical shock consideration can be estimated from equation (10).
3. Results and Discussion
3.1. Horizontal and Vertical Strains
Table 6 shows the results of ESAL estimation. Figure 3 shows the variance of the horizontal tensile strain with the depth of the point from the pavement surface.
It can be seen that the horizontal tensile strain is lowest at the top of the subgrade layer and highest at the bottom of the asphalt layer, indicating the critical strain point. This location is well known as the governing point for fatigue cracking initiation in flexible pavements. The concentration of tensile strain at this interface reflects the combined effect of the relatively thin asphalt surface layer and the stiffness contrast between the asphalt and the underlying stabilized base layer. The magnitude of the tensile strain suggests that fatigue damage is likely to accumulate rapidly under repeated traffic loading. Such strain levels are typically associated with the early development of bottom-up fatigue cracking, which propagates toward the surface and leads to surface block cracking and pothole formation. From a safety perspective, these cracking patterns degrade surface texture, reduce skid resistance, and increase braking distance, particularly on wet pavement.
Figure 4 shows the variance of the vertical compressive strain with the depth of the point from the pavement surface.
The vertical tensile strain is lowest at the surface and highest at the top of the subgrade layer, indicating the critical strain point. This location serves as the primary control point for rutting development, as permanent subgrade deformation dominates rut accumulation in flexible pavement systems. The high compressive strain value reflects the combined influence of heavy axle loads and the relatively low subgrade resilient modulus (5300 psi), indicating a limited load-bearing capacity of the foundation soil.
3.2. Allowable Axle Load Frequency to Avoid Fatigue Cracking
By applying equation (4), the maximum allowable load frequency to avoid fatigue cracking has been determined by substituting the results of the critical horizontal tensile strain, εt. The results for Nf are 2.79 × 10^6 receptions. This value is considered the maximum load repetition capacity that should not be exceeded to avoid fatigue cracking. However, the Nf is less than the mean ESAL (4,090,832), which represents the demand for load use of Highway No. 80. Therefore, fatigue cracking is expected, and the pavement design failed to carry the demand of 4,090,832 without damage.
The probability of failure (Pf), i.e., the likelihood that the system demand exceeds its capacity, is estimated by calculating the Z value, which is the difference between the mean values of demand and supply divided by the square root of the sum of their variances. The corresponding reliability is then obtained from the Z-table; the rate of failure is estimated as 1-the reliability rate. The Z value is -4.9, which exceeds the maximum values in the Z-table, indicating a completely failed system (failure=99.9999%). Because the mean demand is far to the right of the mean supply, almost the entire demand distribution lies beyond the supply distribution. This also indicates a very high probability of failure. The facility is operating in a structurally unsafe and unreliable condition.
3.3. Allowable Axle Load Frequency to Avoid Rutting
By applying equation (5), the maximum allowable load frequency to avoid rutting has been determined by substituting the results of the critical vertical compressive strain εz. The results indicate Nr is 4.14×10⁶ receptions. This value is the maximum load-repetition capacity that should not be exceeded to avoid rutting. However, the Nr for segment 1 is slightly higher than ESAL (4,090,832). Therefore, rutting is expected if the ESAL increases by a slight percentage. The results indicate that the rutting capacity slightly exceeds the mean traffic demand, yielding a positive reliability index and a relatively low probability of failure (22.1%). This suggests that the pavement design is generally adequate; however, improvements should be suggested to prevent the expected pavement damage.
3.4. Determination of a Safer Speed Limit
The results for hydroplaning speed, SSD, and vertical shock speed obtained using the method described in section 2.6 indicate that the hydroplaning speed is approximately 70 km/h. In comparison, the stopping sight distance (SSD) constraint yields a slightly lower critical speed of 67 km/h. These two values are consistent and indicate that, under wet pavement conditions and reduced friction levels caused by rutting and surface polishing, vehicle operation at speeds above approximately 70 km/h may result in a significant increase in the probability of hydroplaning and braking instability. The SSD-based speed is slightly more conservative than the hydroplaning-based speed, reflecting the strong influence of reduced friction on braking performance. This finding confirms that braking safety becomes the governing constraint under degraded wet-surface conditions and supports adopting a speed limit below the original operating speed to ensure sufficient stopping capability.
Figure 5 shows the variation of the maximum speed as a function of localized settlement depth (Δh) based on the vertical shock criterion (a≤0.20g). The results clearly demonstrate a strong inverse relationship between surface depression depth and safe operating speed. For minor surface irregularities (Δh = 5 mm), the maximum allowable speed remains relatively high (approximately 87 km/h), indicating negligible stability risk. However, as settlement depth increases, the allowable speed decreases rapidly to 62 km/h at Δh = 10 mm, 50 km/h at Δh = 15 mm, and 44 km/h at Δh = 20 mm. These results highlight the high sensitivity of vehicle stability to localized pavement deformation. At settlement depths exceeding 10 mm, vertical wheel accelerations exceed the accepted stability threshold (0.20 g), increasing the likelihood of wheel unloading, steering instability, and loss of control, particularly for heavy vehicles and under wet pavement conditions where friction margins are already reduced.
The combined evaluation of hydroplaning risk, braking performance, and vertical shock constraints provides a consistent and physically based framework for selecting a safer operating speed. The hydroplaning and SSD analyses indicate a critical wet-weather speed of approximately 67–70 km/h for general operation, while the vertical shock analysis identifies significantly lower safe speeds in the presence of localized pavement distress.
Based on these combined constraints, a recommended wet-condition speed limit of 70 km/h is proposed for the general pavement section, ensuring adequate protection against both hydroplaning and excessive braking distances. In addition, for distressed segments with localized settlements exceeding 10 mm, temporary speed reductions of 50–60 km/h are required to maintain vertical accelerations below the critical stability threshold and prevent loss of vehicle control.
The results demonstrate that pavement structural condition exerts a direct and quantifiable influence on safe operating speed. While conventional speed limits are typically based on geometric design and traffic characteristics, the present analysis shows that rutting, friction loss, and surface deformation impose more restrictive safety constraints under deteriorated and wet pavement conditions. Integrating pavement condition indicators into speed management strategies, therefore, provides a rational and proactive approach to reducing crash risk and injury severity.
This integrated framework confirms that improving pavement structural performance not only extends service life but also increases the reliability of higher operating speeds by mitigating hydroplaning risk, braking instability, and vertical shock. Conversely, in the absence of timely maintenance, speed reduction becomes a necessary operational countermeasure to preserve safety.
3.5. Proposal for Improvement
It is suggested to increase the asphalt thickness or use a stiffer AC mix to 4 inches to reduce tensile strain. KENPAVE software was run after changing the thickness of the surface asphalt layer and keeping all other variables the same as before the improvement. The result is shown in Table 7.
It is noted that the tensile strain at the bottom of the asphalt layer decreased from 175 µε to 130 µε, which is critical for improving fatigue life. The compressive strain at subgrade also decreased slightly, improving rutting resistance. Figure 6 and Figure 6 show the improvement in strains after improvement.
Figure 6.
The improvement in Horizontal strains after improvement.
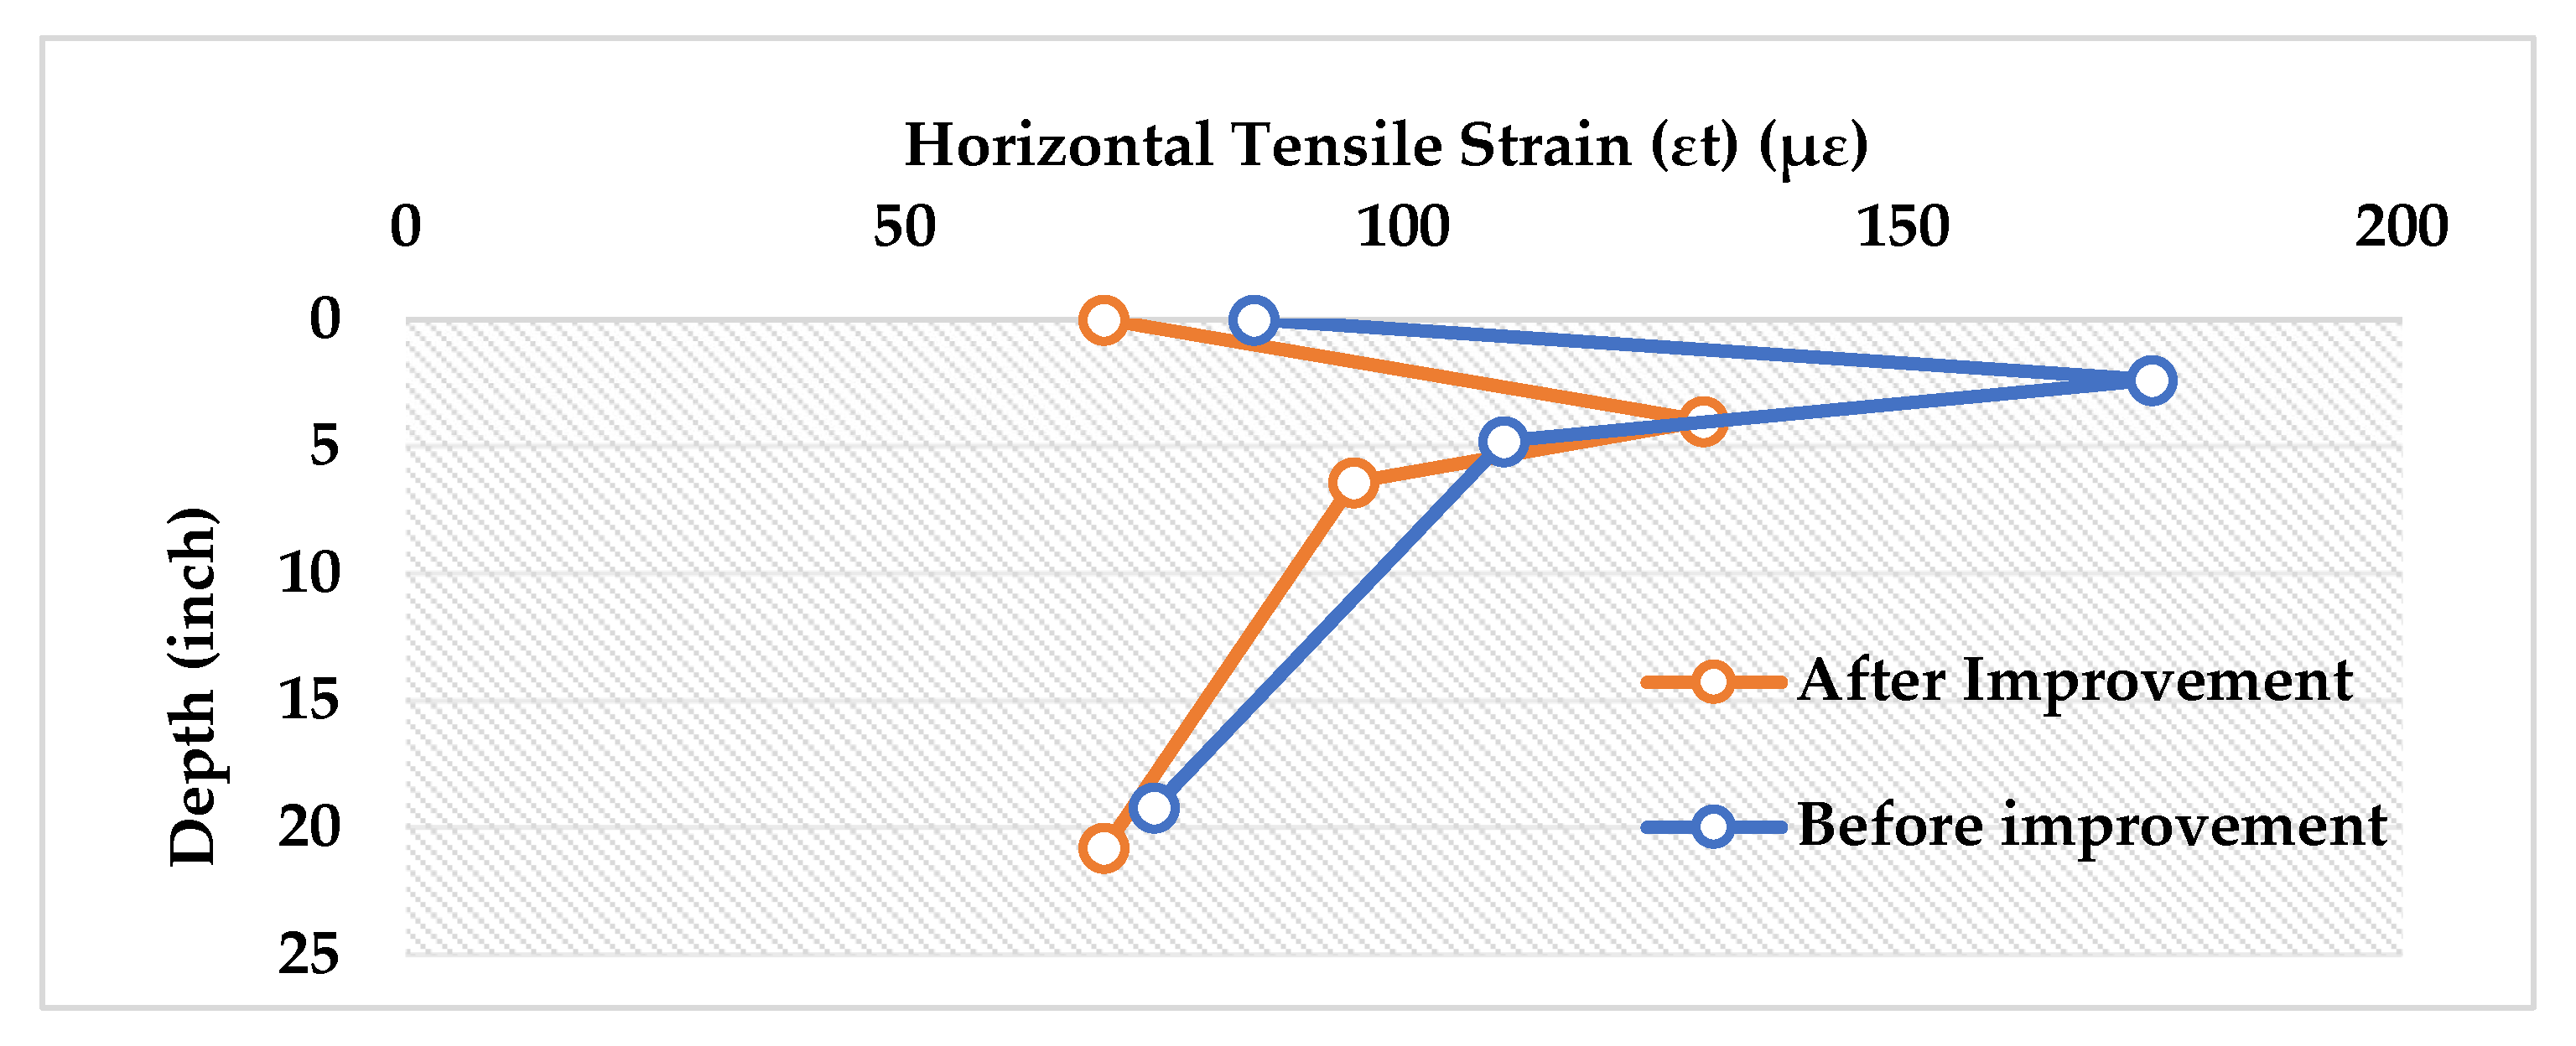
Figure 6.
The improvement in vertical strains after improvement.
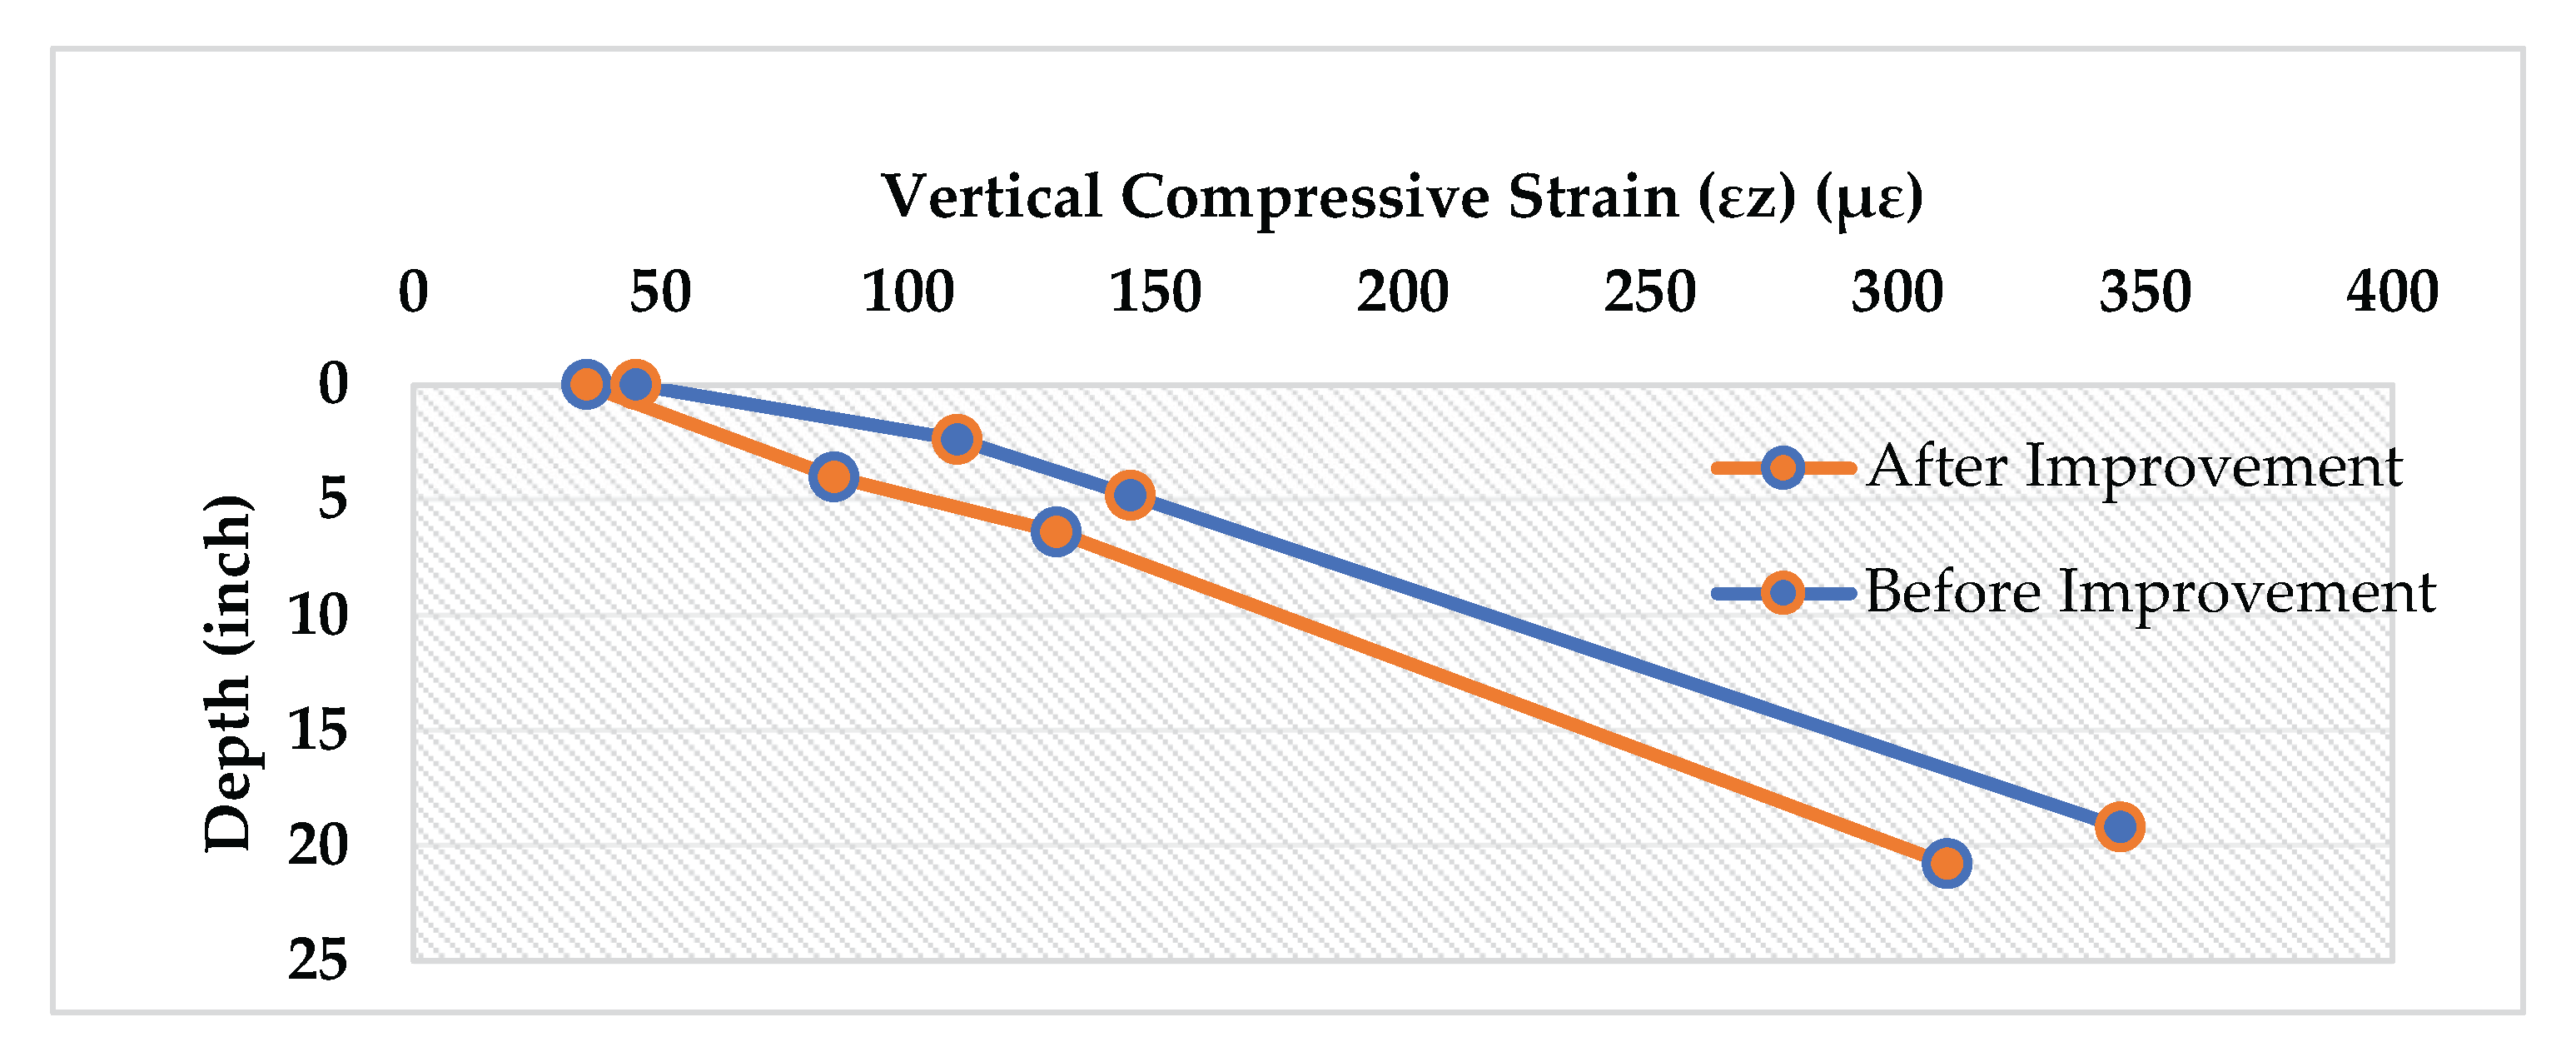
The predicted load repetitions after improvement are estimated at Nf=7.42×10⁶ and Nr=6.97×10⁶; both exceed the current ESAL with a rate of failure close to zero, indicating that the pavement structure, with the surface layer increased to 4 inches, is acceptable. The rate of failure 0f 13%
From a safety perspective, the structural improvement has important operational implications. The reduction in fatigue-cracking potential delays surface cracking and raveling, preserving surface texture and skid resistance over a longer service life. Simultaneously, the reduction in rutting rate limits water accumulation in wheel paths and decreases the likelihood of hydroplaning under wet conditions.
Moreover, lower compressive strain and reduced permanent deformation reduce the likelihood of localized settlement and surface irregularities that generate excessive vertical wheel accelerations. Consequently, the improved pavement section is expected to provide more stable vehicle–pavement interaction and allow safer operation at the recommended speed limit with higher reliability.
The comparison between the original and improved sections demonstrates that relatively modest structural modifications, such as increasing the asphalt surface thickness to 4 in, can produce substantial benefits in both pavement performance and road safety. By reducing the governing tensile and compressive strains, the improvement not only extends structural service life but also relaxes the safety constraints associated with braking instability, hydroplaning risk, and vertical shock.
These findings support the concept of integrated pavement–safety management adopted in this study, in which rehabilitation strategies are evaluated not only based on structural performance criteria but also on their ability to sustain safer operating speeds over time. The results highlight the importance of incorporating safety-oriented performance indicators into pavement design and rehabilitation decision-making processes.
4. Conclusions
This study proposed an integrated mechanistic–quantitative framework to link pavement structural distress, traffic loading, road safety indicators, and speed limit selection within a unified analytical approach. The results demonstrated that the existing pavement structure is structurally marginal, with the predicted fatigue capacity significantly lower than the cumulative traffic demand and a high probability of fatigue failure. Rutting performance was highly sensitive to traffic growth and axle load variability, indicating a risk of rapid surface deterioration as demand increases. From a safety perspective, rutting, friction loss, and localized settlement were shown to impose restrictive constraints on safe operating speed under wet pavement conditions.
The integrated analysis indicated that a wet-weather speed limit of approximately 70 km/h is a safe general operating speed for the studied section. In contrast, distressed locations with localized settlements exceeding 10 mm require temporary speed reductions to 50–60 km/h to maintain braking performance and vehicle stability.
The proposed framework confirms that pavement condition directly governs safe operating speed and should be explicitly incorporated into speed management strategies. Integrating pavement performance indicators into traffic control decisions offers a proactive and cost-effective approach to reducing crash risk and injury severity. Future research should extend the framework to multiple road classes, incorporate real-time pavement monitoring, and evaluate the effectiveness of dynamic condition-based speed limits in operational environments.
Funding
This research received no external funding.
Data Availability Statement
The data were collected during the study and are presented in the manuscript.
Acknowledgments
The authors would like to thank Mustansiriyah University (https://uomustansiriyah.edu.iq), Baghdad, Iraq, and the College of Engineering, Highway and Transportation Department for their support in the present work. This research did not receive any specific grant from funding agencies in the public, commercial, or not-for-profit sectors. This study has not been supported financially by any public or private funding agencies. During the preparation of this manuscript, the authors used Grammarly to improve the language of their writing. The authors have reviewed and edited the output and take full responsibility for the content of this publication.
Conflicts of Interest
The authors declare no conflicts of interest.
Abbreviations
The following abbreviations are used in this manuscript:
| ESAL | Equivalent Single Excel Load |
| E | Elasticity Modulus |
| ρ | Poisson ratio |
| Tf | Truck Factor |
| Gm | Growth factor |
| DL | Directional/lane Distribution Factor |
| Nf | Allowable axle load repetition considering fatigue cracking |
| Nr | Allowable axle load repetition considering rutting |
| SSD | Stopping Sight Distance |
| P | Tire pressure |
| f | Friction factor |
| a | Vertical acceleration rate |
| V | Vehicle speed |
| L | Segment length |
| εz | Vertical Compressive Strain |
| εt | Horizontal Tensile Strain |
References
- Khadka, A.; Gautam, P.; Joshi, E.; Pilkington, P.; Parkin, J.; Joshi, S.K.; Mytton, J. Road safety and heavy goods vehicle driving in LMICs: Qualitative evidence from Nepal. Journal of Transport & Health 2021, 23, 101247. [Google Scholar] [CrossRef] [PubMed]
- Bauernschuster, S.; Rekers, R. Speed limit enforcement and road safety. Journal of Public Economics 2022, 210, 104663. [Google Scholar] [CrossRef]
- Al-Nuaimi, A.N.; Jameel, A.K.; Alsadik, S.M. Impact of Variable Speed Limits on Crash Frequency and Crash Rate: Stimulation by Flow Rate and Percentage of Heavy Vehicles. Engineering, Technology & Applied Science Research 2025, 15, 20335–41. [Google Scholar] [CrossRef]
- Sugiyanto, G.; Malkhamah, S. Determining the maximum speed limit on urban roads to increase traffic safety. Journal Teknologi (Sciences & Engineering) 2018, 80(5). [Google Scholar] [CrossRef]
- Sadeghi, P.; Goli, A. Investigating the impact of pavement condition and weather characteristics on road accidents. International Journal of Crashworthiness 2024, 29, 973–89. [Google Scholar] [CrossRef]
- Shokat, D.M.; Jameel, A.K. Risk Assessment of the main transport corridor in Iraq. In InIOP Conference Series: Earth and Environmental Science; IOP Publishing, 1 Sep 2023; Vol. 1232, No. 1, p. 012056. Available online: https://iopscience.iop.org/article/10.1088/1755-1315/1232/1/012056.
- Jameel, A.; Al-Nuaimi, A. Assessment of road infrastructures in Iraq according to safe system requirements: case study Old Baquba-Baghdad rural road sections. In InIOP Conference Series: Materials Science and Engineering; IOP Publishing, 1 Jul 2020; Vol. 888, No. 1, p. 012047. Available online: https://iopscience.iop.org/article/10.1088/1757-899X/888/1/012047/meta.
- Marcondes, J.A.; Snyder, M.B.; Singh, S.P. Predicting vertical acceleration in vehicles through road roughness. Journal of Transportation Engineering 1992, 118, 33–49. [Google Scholar] [CrossRef]
- Dehnad, M.H.; Yazdi, A. A review of numerical and experimental studies on the hydroplaning of vehicles in motion on road surfaces. Results in Engineering 2024, 23, 102438. [Google Scholar] [CrossRef]
- Chen, S.; Saeed, T.U.; Labi, S. Impact of road-surface condition on rural highway safety: A multivariate random parameters negative binomial approach. Analytic methods in accident research 2017, 16, 75–89. [Google Scholar] [CrossRef]
- Alhasan, A.; Nlenanya, I.; Smadi, O.; MacKenzie, C.A. Impact of pavement surface condition on roadway departure crash risk in Iowa. Infrastructures 2018, 3, 14. [Google Scholar] [CrossRef]
- Tahir, M.A.; Tabassum, S.; Rahim, A. Impacts of pavement performance indicators on traffic oriented parameters and road safety. Mehran University Research Journal of Engineering & Technology 2022, 41(4). [Google Scholar] [CrossRef]
- Mkwata, R.; Chong, E.E. Effect of pavement surface conditions on road traffic accidents: A Review. In InE3S web of conferences;EDP Sciences; 2022; Vol. 347, p. p. 01017. [Google Scholar] [CrossRef]
- Zhang, Y.; Yuan, B.; Chou, Y. Analyzing Driving Safety Using Vehicle-Water-Filled Rutting Dynamics Model and Simulation. Advances in Materials Science and Engineering 2022, 2022, 9372336. [Google Scholar] [CrossRef]
- Shyaa, A.S.; Abd Rahma, I.D. Asphalt pavement rutting distress and affects on traffics safety. Journal of Traffic and Transportation Engineering 2022, 10, 35–9. [Google Scholar] [CrossRef] [PubMed]
- Wang, X.; Gayah, V.V.; Guler, S.I. Integration of Pavement Roughness into Safety Performance Functions of Two-Lane Rural Roads in Pennsylvania. Journal of Transportation Engineering, Part B: Pavements 2024, 150, 04024016. [Google Scholar] [CrossRef]
- Cai, J.; Ong, G.P.; Wu, D.; Zhao, L.; Zhao, H. Assessing braking performance on wet-road through water-depth estimation and vehicle-pavement dynamic simulation. International Journal of Pavement Engineering 2024, 25, 2421896. [Google Scholar] [CrossRef]
- Huynh, V.N.; Truong, L.T.; De Gruyter, C. Examining the impacts of road pavement roughness and rutting on traffic safety: A macrolevel analysis. Traffic Injury Prevention 2025, 1–7. [Google Scholar] [CrossRef] [PubMed]
- Lebaku, P.K.; Gao, L.; Sun, J.; Wang, X.; Kang, X. Assessing the Influence of Pavement Performance on Road Safety Through Crash Frequency and Severity Analysis: PKR Lebaku et al. International Journal of Pavement Research and Technology 2025, 1–22. [Google Scholar] [CrossRef]
- Hall, K.D.; Beam, S.; Lee, M. AASHTO 2002 Pavement design guide design input evaluation study; Transportation Research Committee: Little Rock, 2006. [Google Scholar]
- Huang, Y.H. Pavement analysis and design; Pearson/Prentice Hall: Upper Saddle River, NJ, 2004. [Google Scholar]
- Gallaway, B. M.; Hayes, G. G.; Ivey, D.; Ledbetter, W. B.; Olson, R. M.; Ross, H. E.; Schiller, R. Pavement and Geometric Design Criteria for Minimizing Hydroplaning–A Technical Summary (No. FHWA-RD-79-30). United States. Department of Transportation. Federal Highway Administration. Offices of Research and Development. 1979. Available online: https://rosap.ntl.bts.gov/view/dot/67508.
- Dreher, R. C.; Horne, W. B. Phenomena of pneumatic tire hydroplaning (No. NASA-TN-D-2056). 1963. Available online: https://ntrs.nasa.gov/api/citations/19640000612/downloads/19640000612.pdf.
- Hall, J. W.; Smith, K. L.; Titus-Glover, L.; Wambold, J. C.; Yager, T. J.; Rado, Z. Guide for pavement friction. Final Report for NCHRP Project 2009, 1372–76069. Available online: http://www.massenza.ru/wp-content/themes/massenza/downloads/publications/nchrp_w108.pdf.
- Hancock, M.W.; Wright, B. A policy on geometric design of highways and streets. 2013, 3, 20. Available online: https://highways.dot.gov/safety/pedestrian-bicyclist/safety-tools/417-policy-geometric-design-highways-and-streets-6th.
- ISO 2631/1; Evaluation of human exposure to whole-body vibration. 1997.
- Fundamentals of vehicle dynamics; Gillespie, T, Ed.; SAE international, 29 Apr 2021. [Google Scholar]
- Cebon, D.; Swets; Zeitlinger; Lisse. Handbook of vehicle road interaction; 1999. [Google Scholar]
Figure 1.
Method of the research.
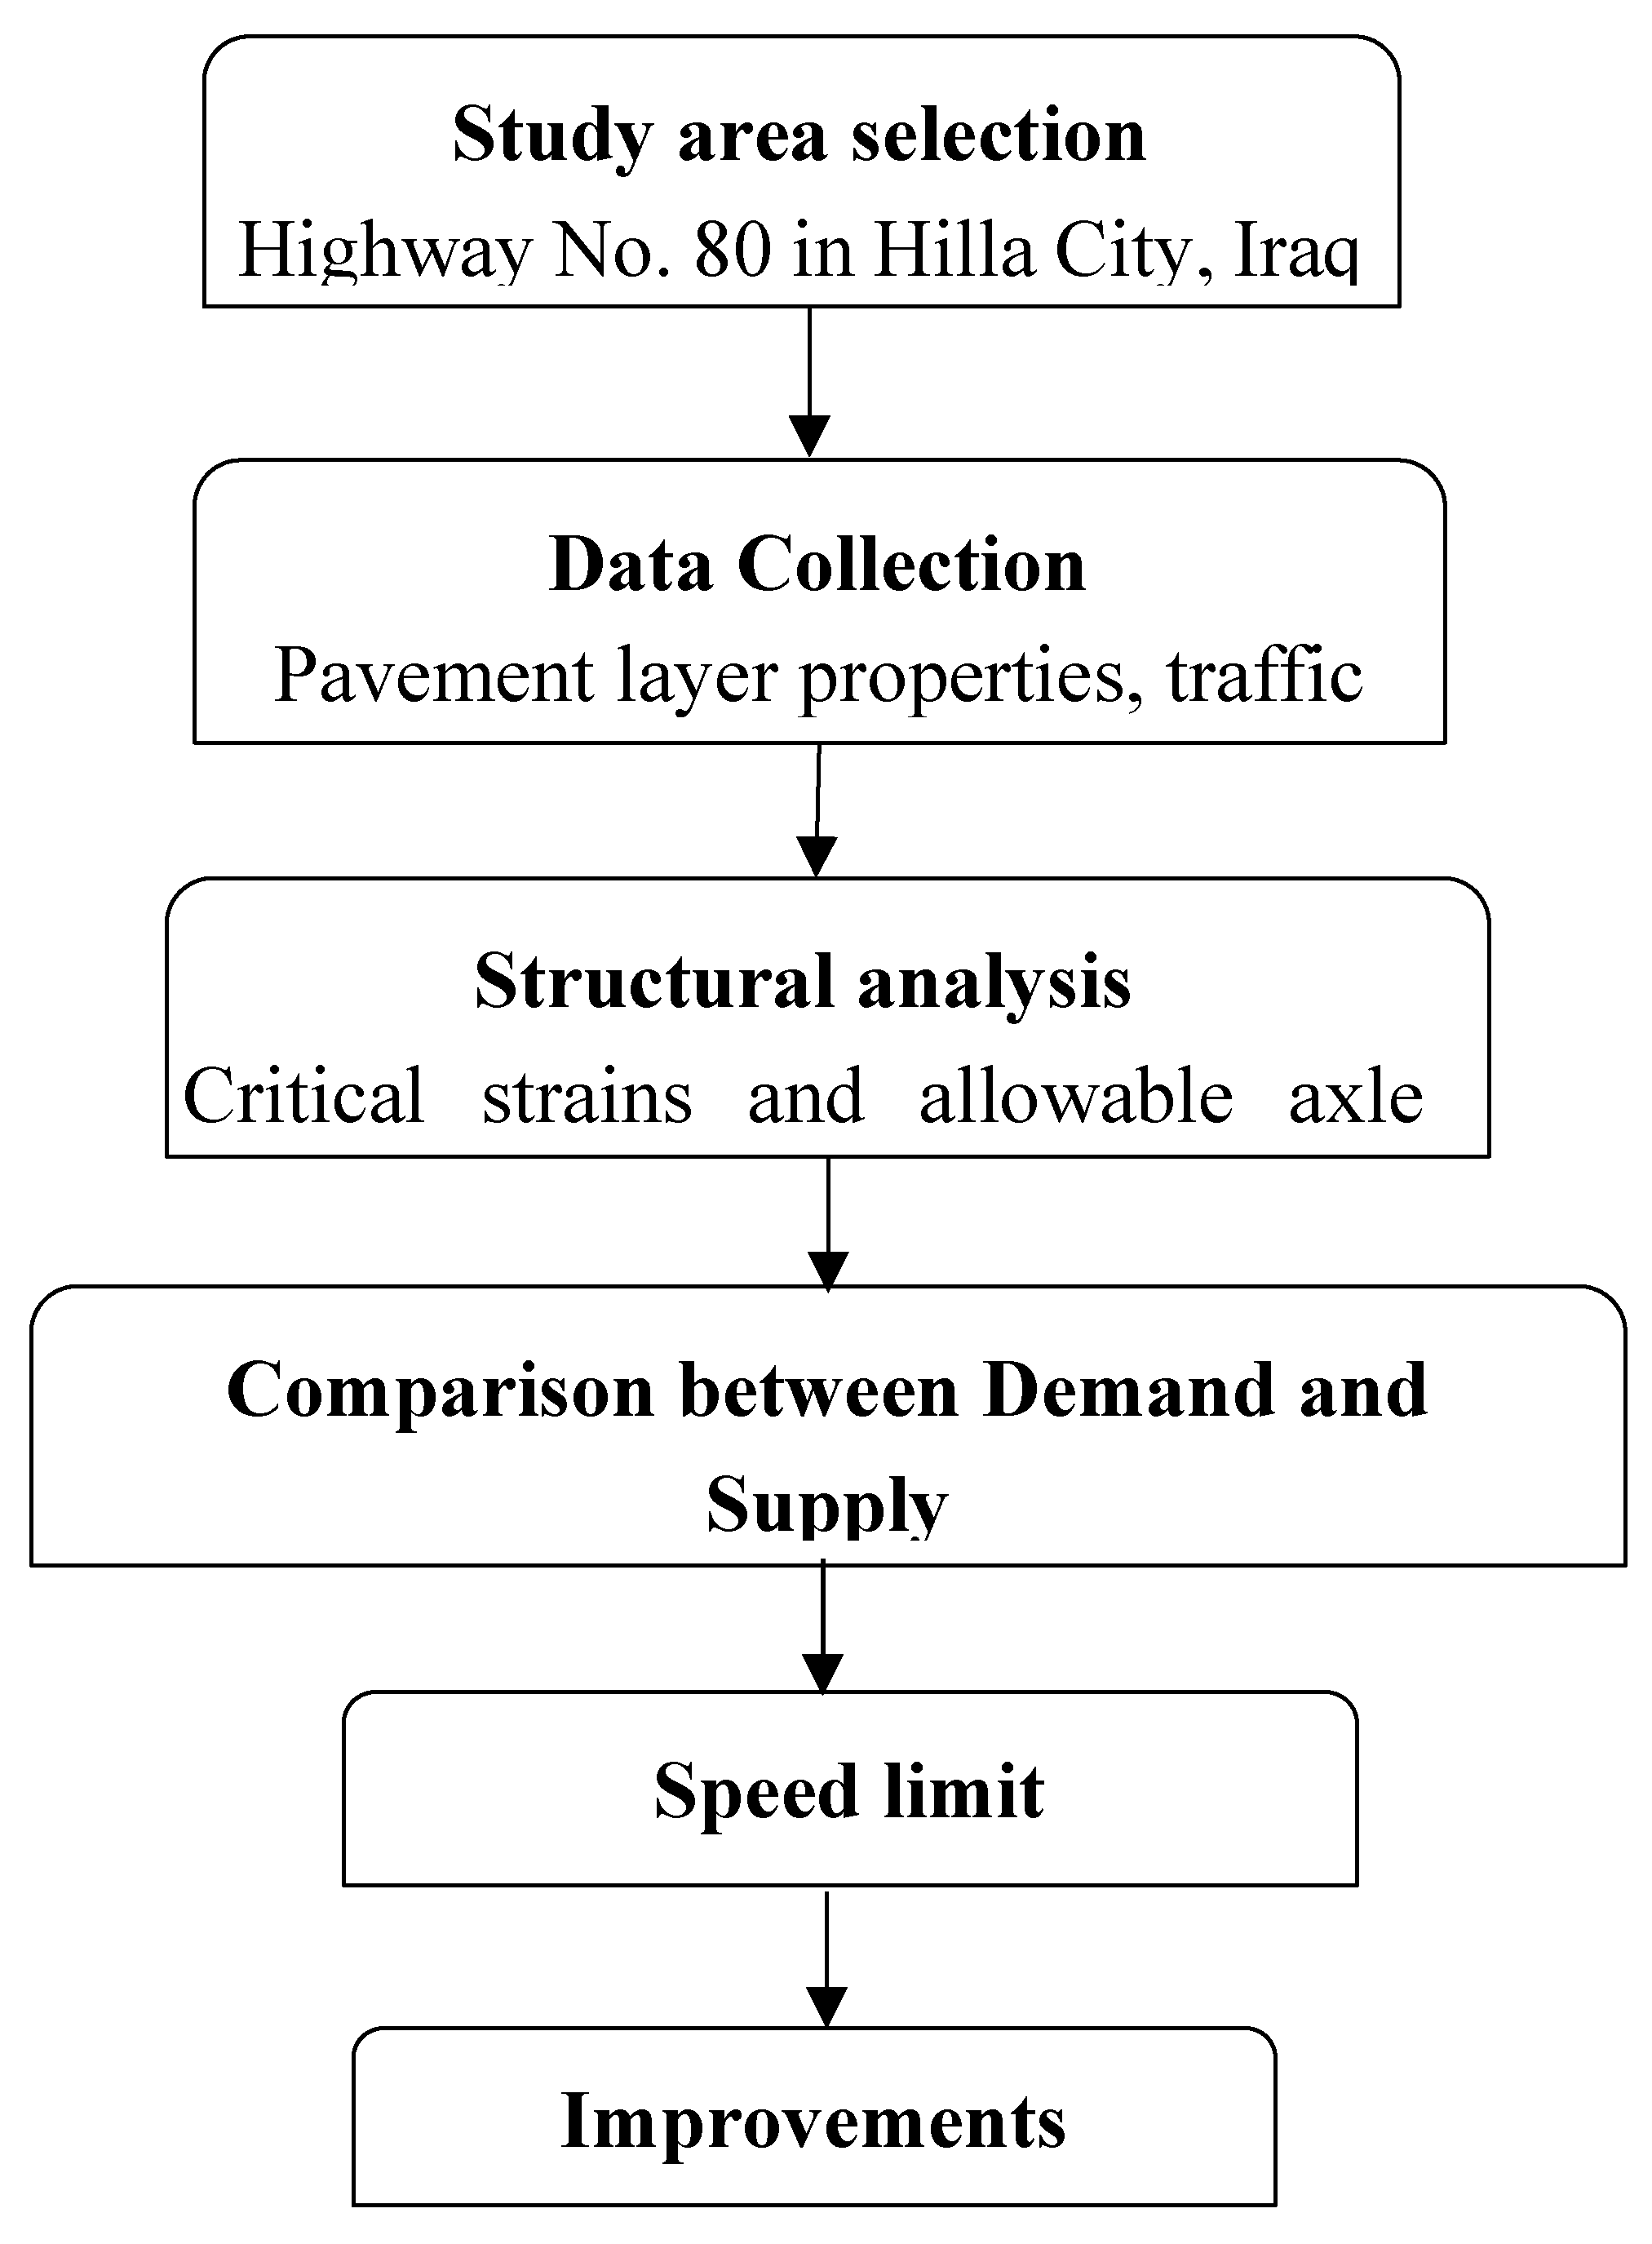
Figure 2.
Material properties of the pavement layers.
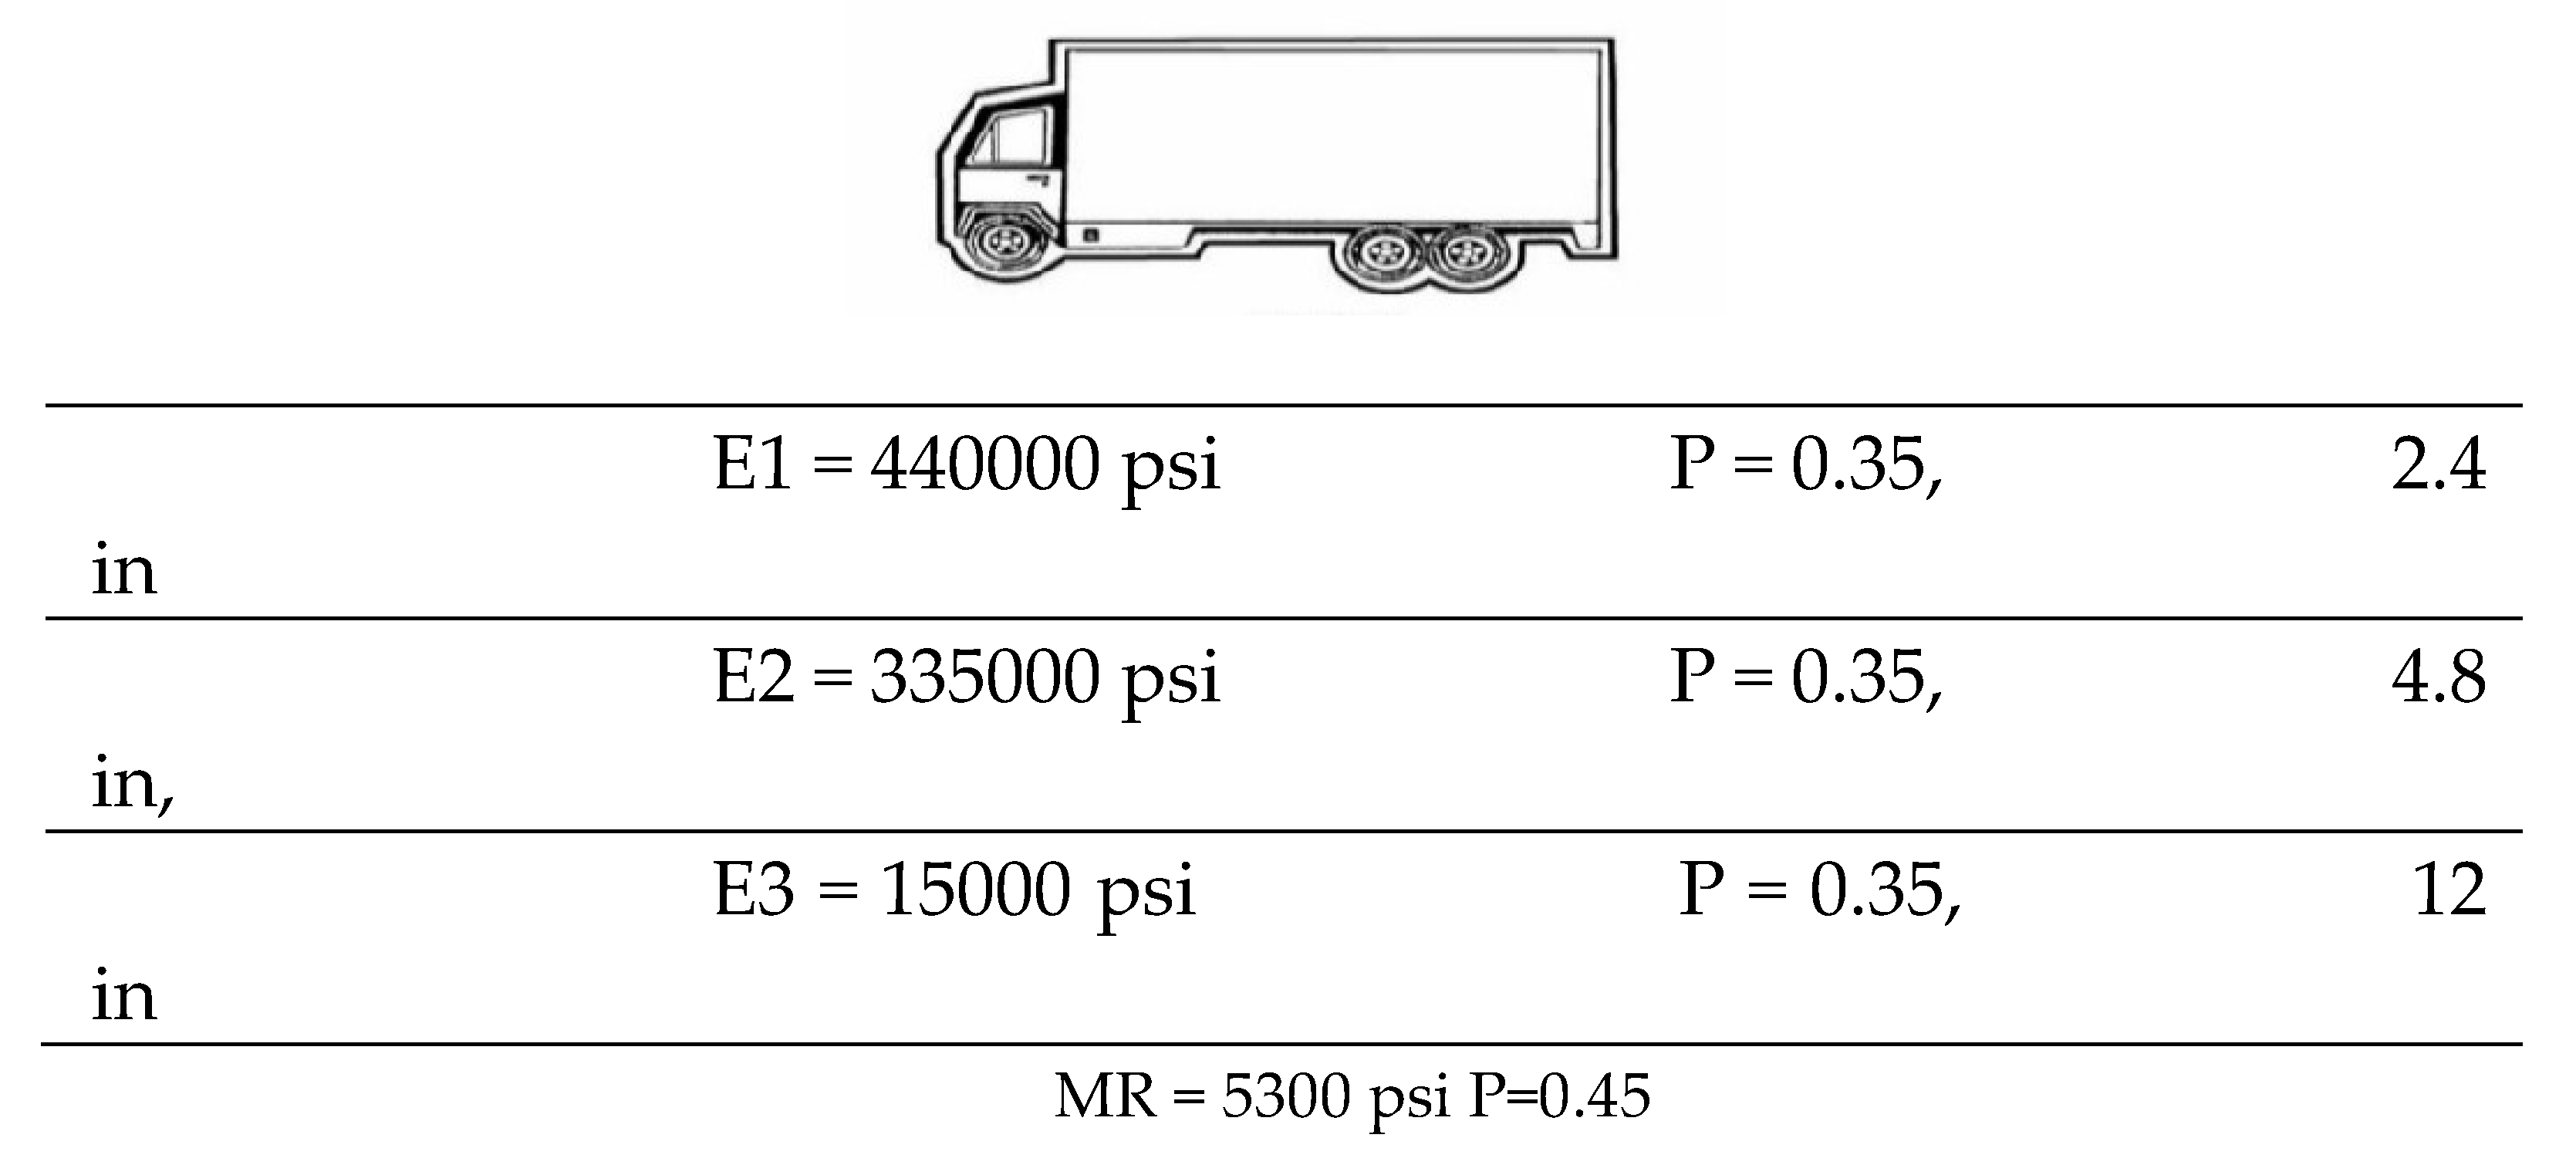
Figure 3.
The distribution of the horizontal tensile strain with depth of points from the surface.
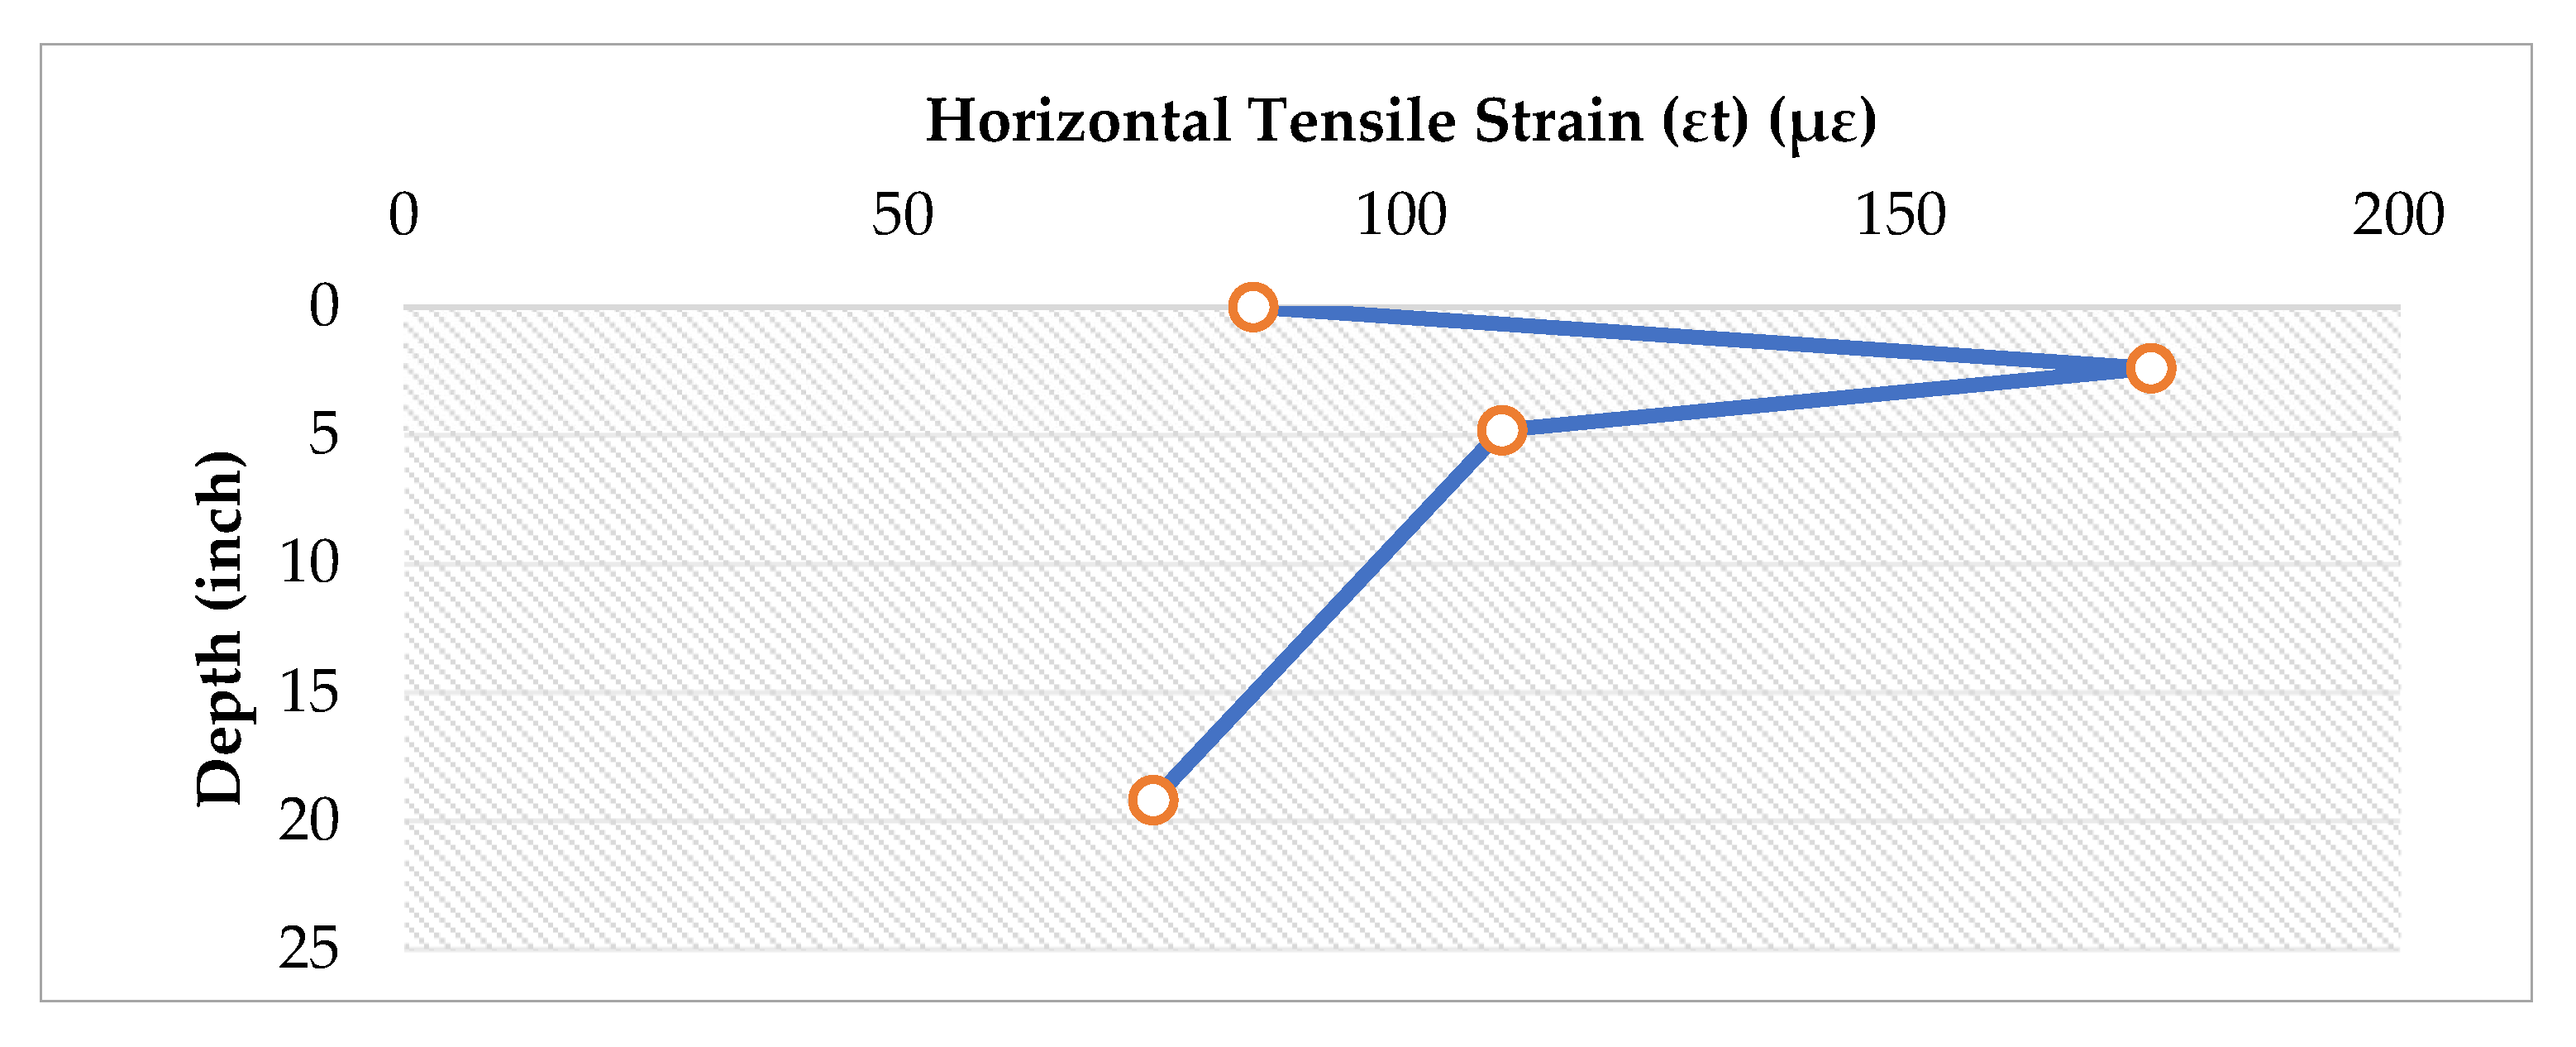
Figure 4.
The distribution of the vertical tensile strain with depth of points from the surface.
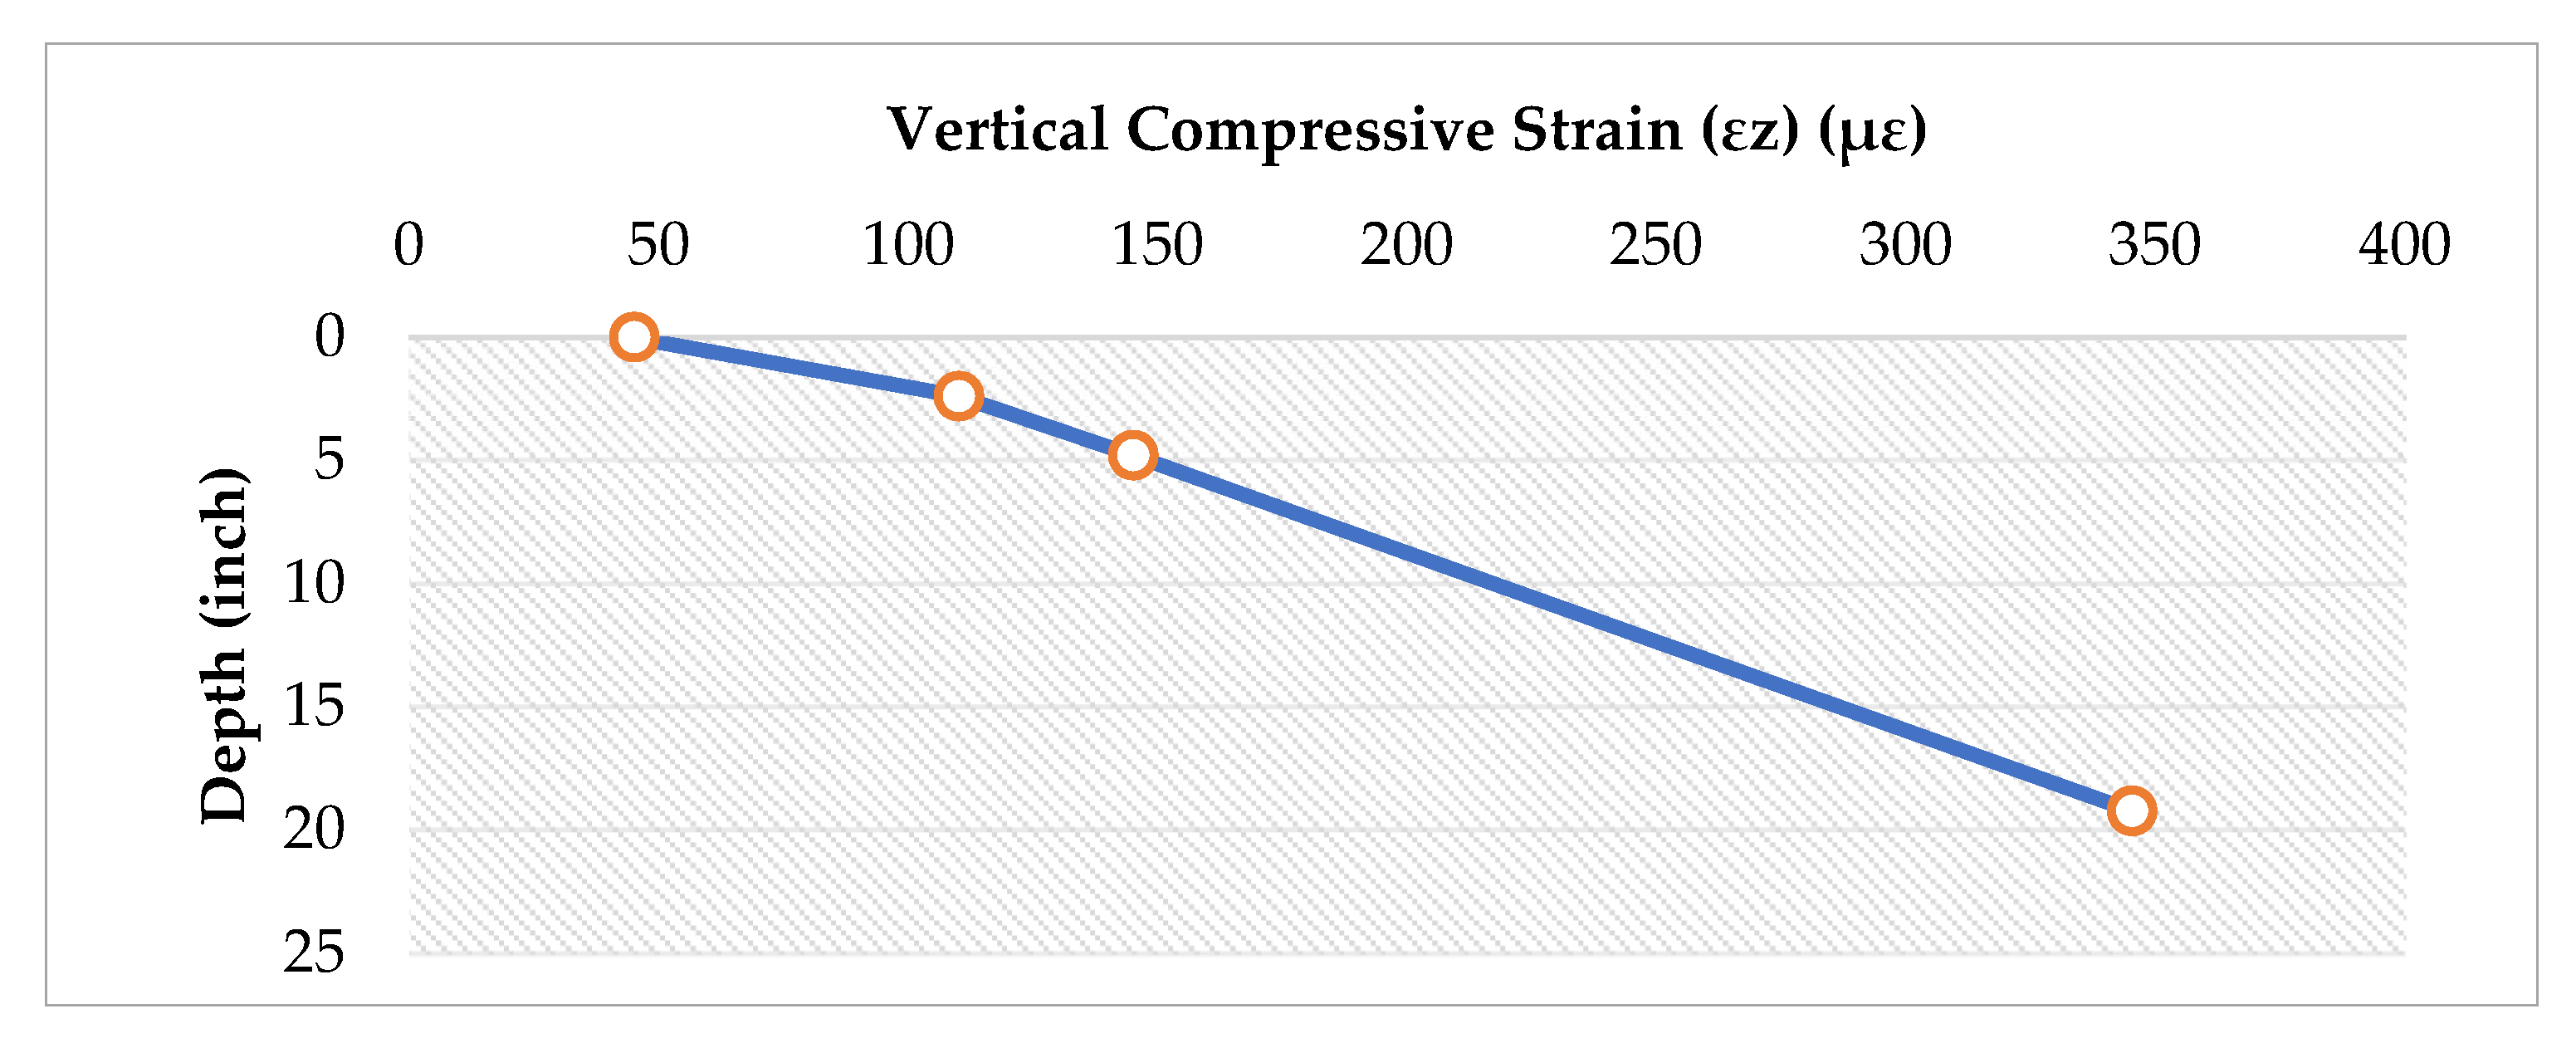
Figure 5.
The vertical shock speeds at vertical acceleration=0.2 for segment length (L)= 1 k.
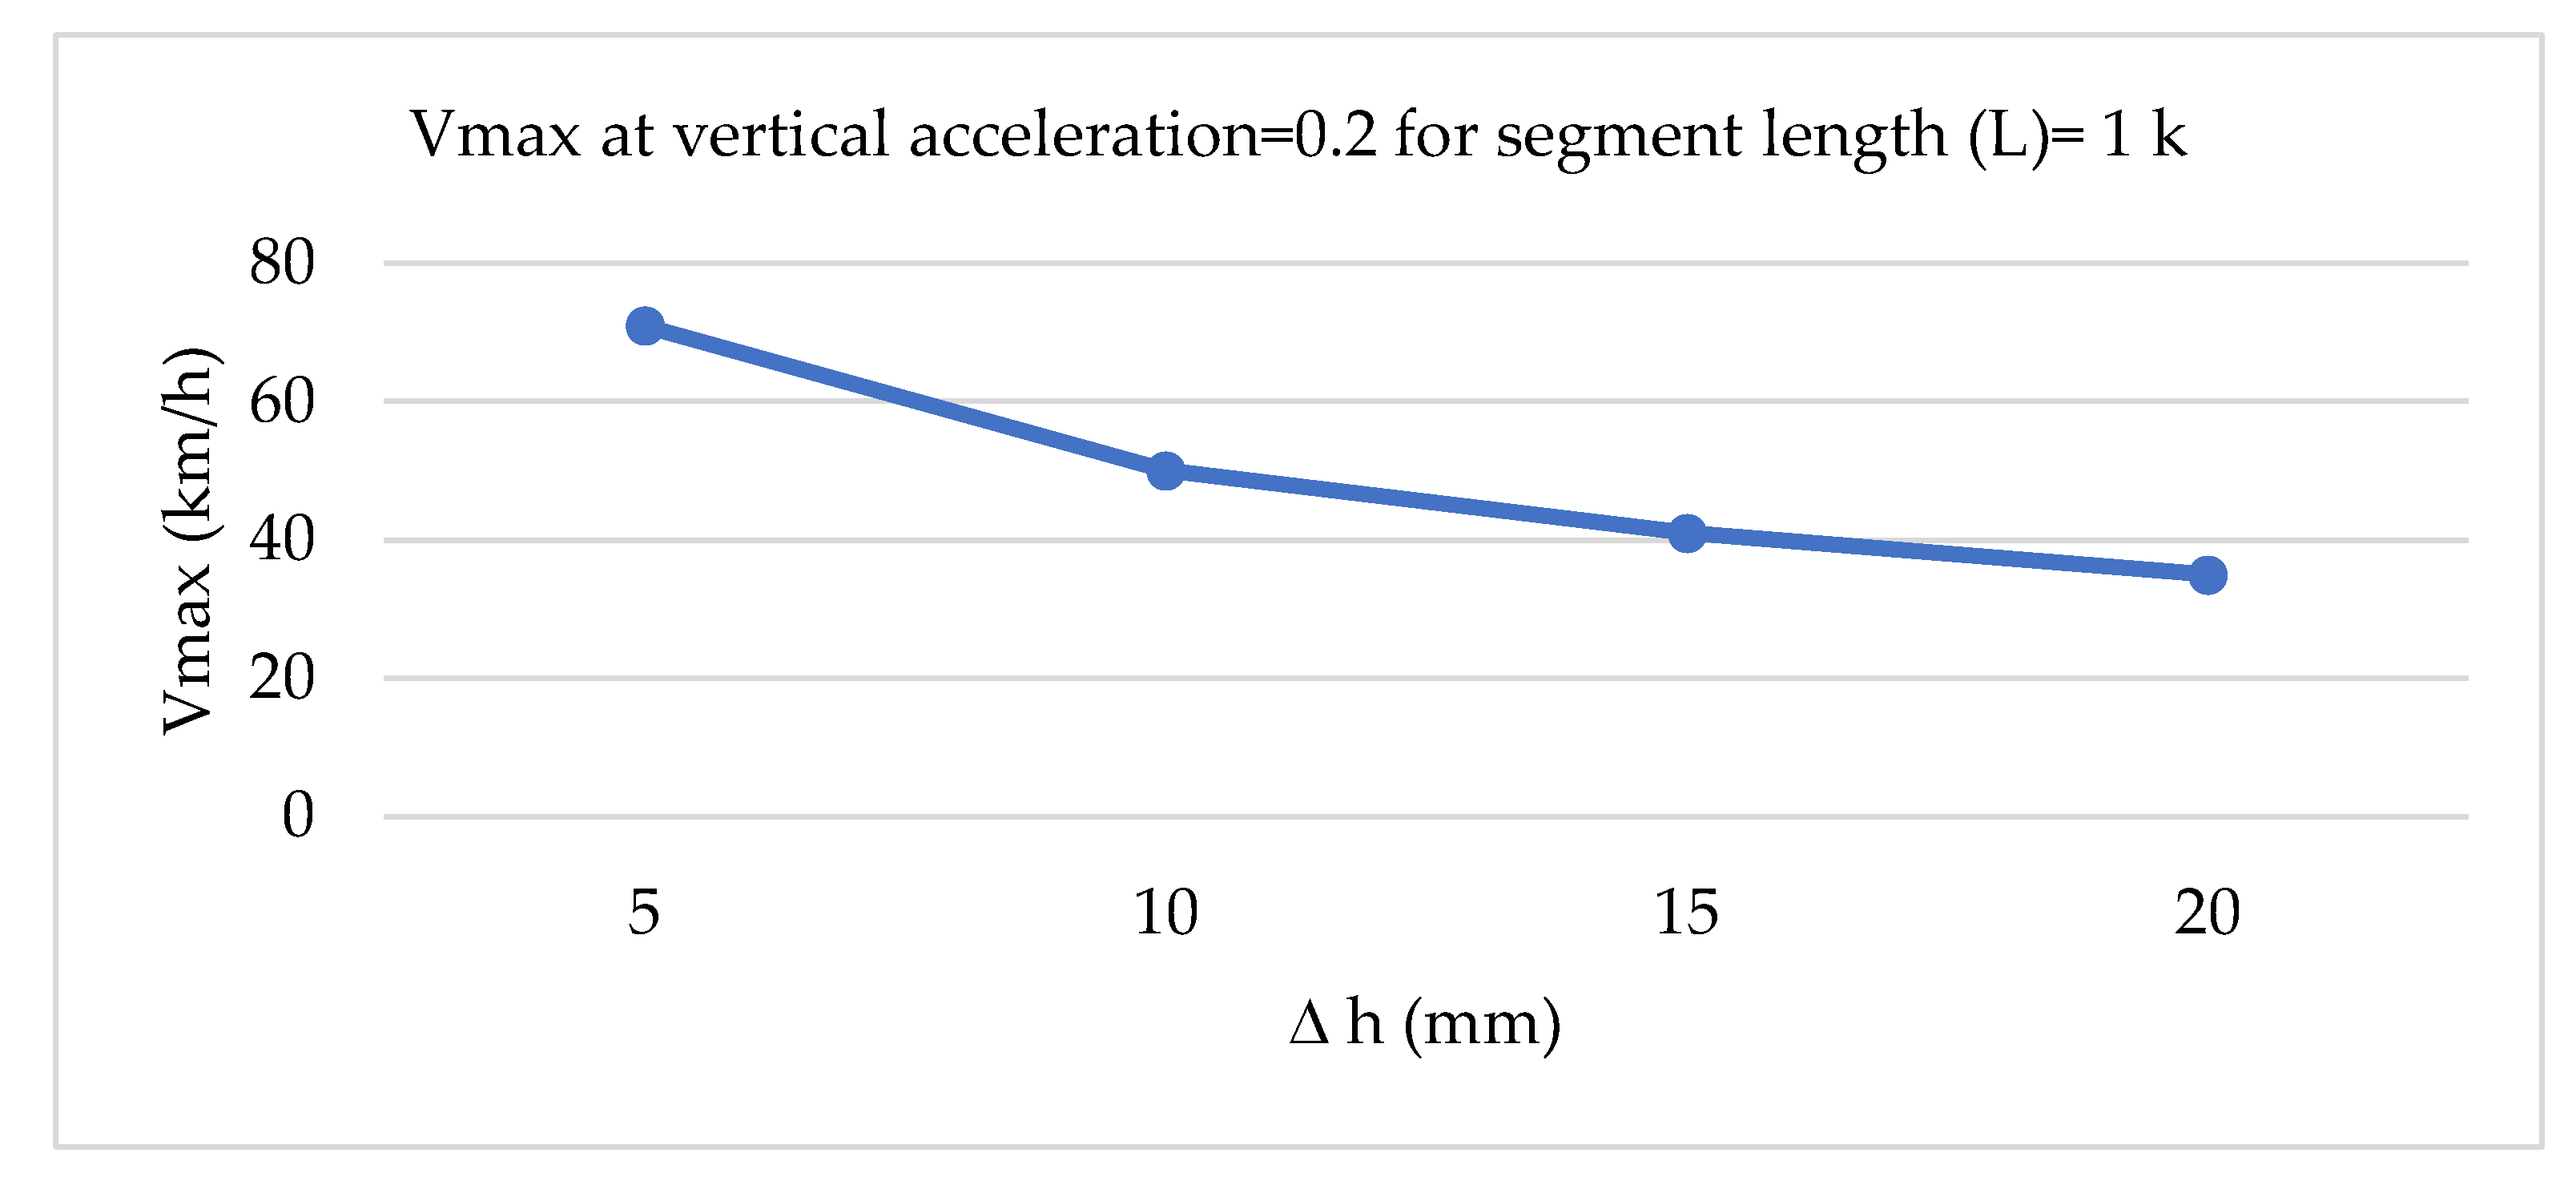

Table 1.
Thickness and Material Data of Highway 80.
| Layer | Marshal Stability | CBR | Poisson’s Ratio | Thickness (in) |
|---|---|---|---|---|
| Surface Layer (Binder) | 9 KN | 0.35 | 2.4 | |
| Stabilized Bituminous base course | 7 KN | 0.35 | 4.8 | |
| Subbase layer | 38% | 0.35 | 12 | |
| Subgrade | 4.5% | 0.45 | -- |
Table 2.
The types and weights of the trucks in the study area (segment 1).
| Number | Weight | Type |
|---|---|---|
| 17 | 40 ton | Type 2 – S2 |
| 43 | 20 ton | Type 2 |
| 11 | 27 ton | Type 3 |
| 3 | 47 ton | Type 2-3 |
Table 3.
The Truck factor results for segment 1.
| Vehicle type | Number | Single axel | Tandem | Trident | Truck factor (Tf) | |||||
|---|---|---|---|---|---|---|---|---|---|---|
| Weight (ton) | 7 | 13 | 20 | 27 | ||||||
| Type 2 | 43 | 0.58 | 6.34 | 3.6772 | ||||||
| Type 2-S2 | 17 | 0.58 | 6.34 | 3.41 | 12.539252 | |||||
| Type 3 | 11 | 0.58 | 3.41 | 1.9778 | ||||||
| Type 2-3 | 3 | 0.58 | 6.34 | 2.6 | 9.56072 | |||||
Table 4.
The results of ESAL estimation (for segment 1).
| Vehicle type | Number (ADT *T) | G | DL | (Tf) | ESAL |
|---|---|---|---|---|---|
| Type 2 | 43 | 66.44 | 0.4 | 3.6772 | 1533798 |
| Type 2-S2 | 17 | 66.44 | 0.4 | 12.539252 | 2067774 |
| Type 3 | 11 | 66.44 | 0.4 | 1.9778 | 211036.5 |
| Type 2-3 | 3 | 66.44 | 0.4 | 9.56072 | 278223.8 |
| ESAL (total) | 4090832 |
Table 5.
The results of ESAL estimation for all segments.
| Segment | ESAL |
|---|---|
| Segment 1 | 4090832 |
| Segment 2 | 4118704 |
| Segment 3 | 4196422 |
| Segment 4 | 4002095 |
| Segment 5 | 4019965 |
| Segment 6 | 4152826 |
| Segment 7 | 4014286 |
| Segment 8 | 4041557 |
| Segment 9 | 4021379 |
| Segment 10 | 4070491 |
| Segment 11 | 4097312 |
| Segment 12 | 4089130 |
| Segment 13 | 4032083 |
| Segment 14 | 4038794 |
| Segment 15 | 4107519 |
| Segment 16 | 4078306 |
| Segment 17 | 4016968 |
| Segment 18 | 4012149 |
| Segment 19 | 4014410 |
| Segment 20 | 4018801 |
| Segment 21 | 4189822 |
| Segment 22 | 4099449 |
| Mean | 4069241 |
| Standard Error | 58196.42 |
Table 6.
The results KENPAVE analysis.
| Depth (in) | Location | Horizontal Tensile Strain (εt) (µε) | Vertical Compressive Strain (εz) (µε) |
|---|---|---|---|
| 0 | Surface of Asphalt | 85 | –45 |
| 2.4 | Bottom of Asphalt | 175 ← critical for fatigue | –110 |
| 4.8 | Mid-depth of Base | 110 | –145 |
| 19.2 | Top of Subgrade | 75 | –345 ← critical for rutting |
Table 7.
The results of the analysis after increasing the thickness of the asphalt layer to 4 in for segment 1.
Table 7.
The results of the analysis after increasing the thickness of the asphalt layer to 4 in for segment 1.
| Depth (in) | Location | Horizontal Tensile Strain (εt) (µε) | Vertical Compressive Strain (εz) (µε) |
|---|---|---|---|
| 0 | Top of Asphalt | 70 | –35 |
| 4 | Bottom of Asphalt | 130 | –85 |
| 6.4 | Mid Base | 95 | –130 |
| 20.8 | Top of Subgrade | 70 | –310 |
Disclaimer/Publisher’s Note: The statements, opinions and data contained in all publications are solely those of the individual author(s) and contributor(s) and not of MDPI and/or the editor(s). MDPI and/or the editor(s) disclaim responsibility for any injury to people or property resulting from any ideas, methods, instructions or products referred to in the content. |
© 2026 by the authors. Licensee MDPI, Basel, Switzerland. This article is an open access article distributed under the terms and conditions of the Creative Commons Attribution (CC BY) license (http://creativecommons.org/licenses/by/4.0/).
Copyright: This open access article is published under a Creative Commons CC BY 4.0 license, which permit the free download, distribution, and reuse, provided that the author and preprint are cited in any reuse.


