

Submitted:
25 August 2025
Posted:
26 August 2025
You are already at the latest version
Abstract
Adverse weather-induced wet pavement conditions represent a critical factor in roadway safety. This study examines the dynamic aquaplaning phenomenon along extensive, in terms of width, 4-lane freeway alignments, aiming to assess the key aquaplaning thresholds of water film thickness above the top of pavement texture (WFT) and aquaplaning speed (APS), respectively. In total, 75 4-lane freeway alignments were examined in accordance with the German (RAA, 2008) urban motorway design guidelines (EKA 3 Class). These alignments were combined with a selected range of additional parameters, based on balanced literature findings, involving pavement surface characteristics, vehicle, and user parameters, as well as various rainfall intensity rates, resulting in 6075 combinations in total. The aquaplaning assessment was conducted using the method developed by Gallaway, with the drainage path determined from the algebraic sum of the longitudinal grade and the superelevation rate within the 3D roadway geometry. The multiple linear regression analysis demonstrated high predictive accuracy for both WFT and APS parameters. The present research sought to quantitatively identify potential critical conditions associated with key roadway, user, and vehicle parameters, with the ultimate objective of supporting the development of evidence-based variable speed limits.
Keywords:
hydroplaning
; speed limit
; freeways
; linear regression
1. Introduction
Adverse weather is proven to be a major determinative factor as far as roadway operation safety is concerned. Wet pavements contribute to about 16% of vehicle crashes in the United States, injuring over 350,000 people and killing over 4,400 each year [1]. Rainfall at varying intensities poses critical risks to traffic safety. Speed distributions under adverse weather conditions are typically characterized by lower mean speeds and greater variability—i.e., speed volatility—compared with normal (wet) pavement conditions. Even under mild rainfall intensity, reductions in driver visibility and pavement friction can, under certain circumstances, induce aquaplaning (hydroplaning), thereby compromising vehicle stability and control.
Beyond aquaplaning, drivers may also encounter vehicle skidding—a comparable steering-control hazard that arises on pavement surfaces with reduced friction supply, not limited to wet or rainy conditions.
Both skidding and aquaplaning are critical and undesirable conditions. The difference between the two phenomena, is that skidding occurs while the tires are still in contact with the pavement, typically as a result of excessive vehicle braking or acceleration (friction demand exceeds friction supply), whereas aquaplaning initiates from a reduced or complete absence of contact between tire and pavement [2]. This form of hydroplaning, referred to as dynamic hydroplaning, is the most prevalent type and typically occurs at vehicle speeds exceeding 70 km/h.
Aquaplaning phenomena may also occur at any speed on pavements with little or no micro-texture where even a very thin film of water may separate the moving tire from pavement; this type of aquaplaning is known as viscous aquaplaning. Additionally, on aircraft runways, reverted rubber aquaplaning makes its appearance, caused by the friction between the tires and the pavement, generating excessive heat [3]. The simultaneous combination of aquaplaning and skidding is called partial aquaplaning. The present research addresses the dynamic aquaplaning phenomenon.
Although variable speed limit control has been increasingly applied as an active traffic management strategy to harmonize vehicle speed and improve safety at curved road sections under adverse weather conditions, its implementation has not been associated yet with the interaction between road, user and vehicle parameters for various rain intensity rates.
In light of the above, the objective of this study is to evaluate key aquaplaning thresholds under varying rainfall intensities, focusing on the critical case of freeways with extensive pavement width. The analysis considers multiple roadway alignments in three dimensions (plan view, longitudinal profile, and superelevation design of four-lane divided freeways), in conjunction with pavement surface characteristics (e.g., texture depth), vehicle parameters (e.g., tire tread depth and inflation pressure), and user-related factors (e.g., spin-down of rotational speed at hydroplaning onset).
2. Methodology
Aquaplaning is assessed through two basic parameters, which in turn depend on additional factors such as roadway geometry, environmental conditions, and driver – vehicle interactions. These parameters are:
- Water film thickness above the top of pavement texture (WFT)
- Aquaplaning speed (APS)
WFT is defined as the thickness of water measured from the top of the pavement texture asperities, subtracted by the Mean Texture Depth (MTD) or Mean Profile Depth (MPD) [Equation (1)]. The way WFT is related to the total water flow (TWF) is visualized in Figure 1.
Two principal methodological approaches for addressing WFT and APS are identified in the literature: empirical methods based on observational data and analytical methods derived from aquaplaning modeling. Analytical models offer a distinct advantage over empirical approaches, as they are capable of incorporating complex geometric parameters (e.g., curved alignments, longitudinal grades, and superelevation rates) as well as detailed tire–pavement interaction characteristics (e.g., rutting).
However, certain empirical models, with respect to the range of the assessed parameters, have been proven to produce accurate results [4,5]. These findings can be justified by the fact that these empirical models have undergone extensive laboratory testing and, moreover, certain improvements have been incorporated to assess a more precise grade calculation in areas of compound alignments.
Such a case is the Gallaway (1979) formula [6]; one of the most widely accepted empirical models for determining WFT [2,3,7]. The aquaplaning risk through the Gallaway method is assessed by determining the expected water film thickness for a given drainage path across the carriageway and comparing it against acceptable design limits, which in general fall between 3.3mm and 4.0mm [2,7], or even 5mm for speeds below 80km/h [8]. It should also be noted that the Gallaway method [6] is limited in assessing WFT along a single flow path (zero width). Flow velocity and width or spread of the flow over the pavement surface are ignored [9].
The drainage path is defined as the trajectory of rainfall runoff following the steepest descent across the pavement surface toward the edge line. In general, longer drainage paths require more time for water accumulation, leading to increased water film depths. The aquaplaning speed outputs are compared against the roadway’s design speed and proposed speed limits based on other assessments (vehicle skidding, stopping sight distance inadequacy, etc.).
In this study, the investigated four-lane freeway alignments are designed in accordance with the German RAA (2008) [10] urban motorway design guidelines (EKA 3 class). Aquaplaning assessment is conducted using the method developed by Gallaway et al. (1979) [6], whereby the algebraic sum of the longitudinal grade and superelevation rate is evaluated within the three-dimensional roadway geometry. Specifically, the drainage path is determined through a predefined calculation step along the axis of the examined road section and is represented by segmented trajectories. Each segment incorporates the algebraic sum (vector pi) of the longitudinal grade and superelevation rate. Drainage paths exhibit constant direction vectors only in sections where both grade and superelevation remain fixed.
Figure 2 illustrates the right carriageway of a left-curved, two-lane rural road section comprising an entrance spiral transition curve followed by a circular arc. The section begins at point TS (tangent-to-spiral) with a tangent of crowned superelevation (e₁ = –2.5%, negative). Due to pavement rotation about the centerline, the superelevation reverses to e₂ = +2.5% (positive) at point TSa and subsequently reaches a constant value of e₃ (e₃ = +ecirc_arc%, positive) at point SC (spiral-to-curve), where the curve radius is set to R. Assuming the pavement rotation axis lies along an upgrade of s = +supgrade%, the algebraic sum, pᵢ, for the right carriageway is computed per design element at any lateral offset aᵢ measured from the pavement rotation axis.
[ai ≤ a, (a: distance between carriageway edge line and pavement’s rotation axis)], is calculated as follows:
- Tangent area
e = e1 = -2.5%
s = +supgrade%
- Spiral area
-2.5% ≤ ex ≤ +ecirc_arc%
where:
sai: Longitudinal grade at a lateral distance of ai from the alignment’s rotation axis (%)
ex: Superelevation rate at a distance x along the alignment’s rotation axis from point TS (%)
Δs: Relative grade at spiral area between longitudinal gradient along the carriageway edge line and longitudinal gradient (s) along the alignment’s rotation axis (%)
: Spiral length (m)
A: Spiral parameter (m)
Lx: Spiral length at distance x along the alignment’s rotation axis from point TS (m)
- Circular arc area
e = +ecirc_arc%
In the roadway’s tangent section (prior to point TS), as described by Equations (2)–(4), the compound grade vector p, defined by the fixed longitudinal grade and superelevation rate, maintains a constant direction. However, as illustrated in Figure 2, in the transition area between points TS and TSa—where pavement rotation shifts the superelevation from negative (e₁ = –2.5%) to positive (e₂ = +2.5%)—the critical drainage path is established. This occurs because the drainage path direction alternates from outward to inward and then outward again, following a curved trajectory and thereby increasing its overall length.
In the present analysis, the determination of the critical drainage paths, along the chainage of the alignment, consisted of a calculation step set to 0.05m (Li = 0.05m).
Such curved drainage paths are further increased with steep grades, a fact that in turn amplifies the risk of aquaplaning. In general, in order to reduce the aquaplaning potential, the drainage paths should be limited to a length of approximately 60m [2,8].
Figure 3 shows the calculated drainage paths along a 3+3 lanes left curved divided road section (2x11.00m carriageway) consisting of an entry and exit spiral curve and a circular arc in between. As illustrated in Figure 3, drainage paths generally extend laterally across the pavement surface (grey lines). However, in sections where superelevation transitions from outward to inward or vice versa, the drainage paths deviate into curved trajectories, reaching their maximum extents within the green and red highlighted areas. These elongated drainage paths—approximately 55 m in length—substantially increase the likelihood of aquaplaning hazards.
Nevertheless, in terms of safety, it should be emphasized that the area with the red drainage path is more critical than the respective green one (Figure 3), because the water runoff starts and terminates at the inner shoulder area, adjacent to the roadway’s passing lane, where higher speeds are observed.
Based on the Gallaway [6] method, the WFT and APS formulas are as follows:
where:
WFT: Water film thickness above the top of pavement texture (mm)
TXD: Average pavement texture depth (mm)
L: Length of drainage path (m)
SG: Best single grade representation of the drainage path (see below) (%)
I: Excess rainfall intensity, which is actual rainfall intensity minus the infiltration rate or permeability of the pavement surface (mm/hr)
As already mentioned, the grade of the drainage paths is constant only at the tangent area, where along the curved sections, the so called “equal area grade” is applied, which is characterized as the “best single grade representation of the drainage path” and is calculated via the following steps [2]:
Step 1: Plot the longitudinal profile of the drainage path;
Step 2: Calculate the total area under the profile;
Step 3: Calculate the vertical ordinate of the equal area triangle, by dividing the area above by the length of the profile, and then multiplying by 2;
Step 4: Plot the new ordinate (at highest point on drainage path) and joining back to point of analysis;
Step 5: Calculate the slope of this line, expressed as a percentage (%).
where:
APS: Aquaplaning speed (km/hr)
SD: Spindown of the tire rotational speed at the initiation of hydroplaning (%)
TP: Tire pressure (psi)
TTD: Tire tread depth (mm)
3. Analysis
As noted above, the aquaplaning assessment was conducted in accordance with the German RAA (2008) [10] urban motorway design guidelines (EKA 3 class). Figure 4 illustrates the applied cross-section configuration, consisting of 4+4 lanes (RQ 38.5). For EKA 3 motorways, the general design speed is 80 km/h, with regulatory speed limits set up to 100 km/h.
The RAA, 2008 [10] control values for critical geometric values are as follows:
- Minimum curve radius: Rmin = 280m
- Minimum spiral parameter: Amin = 90m
- Minimum superelevation rate at tangents: emin = 2.5% (crown configuration)
- Maximum superelevation rate at arcs: emax = 6.0%
- Maximum longitudinal grade at the pavement rotation axis: saxis max = 6.0%
- Minimum relative grade between longitudinal gradient along the carriageway edge line and longitudinal gradient along the rotation axis at the areas between e1 = -2.5% and e2 = +2.5% : Δsmin = (0.1 a)% (a: distance between carriageway edge line and rotation axis)
Critical locations for hydroplaning are identified along sections where pavement rotation transitions between positive and negative superelevation rates. For the present analysis, a wide range of geometric parameters were combined, subject to the following constraints:
- i.
- Application of three distinct curve radii (R₁ = 280 m, R₂ = 550 m, R₃ = 1000 m), each paired with the corresponding superelevation rates (e₁ = 6.0%, e₂ = 4.0%, e₃ = 2.5%), in accordance with the RAA (2008) guidelines.
- i.
- ii. R/3 ≤ A ≤ R
- i.
- iii. Application of increasing longitudinal grade values from 0.0% up to a maximum of 6.0%, while ensuring a minimum compound grade of 0.50% at the carriageway edge line during pavement rotation between positive and negative superelevation rates, in order to maintain adequate drainage.
The following formula applies algebraically:
from which the minimum grade at the pavement rotation axis can be determined as follows:
sedge line = saxis + Δs ≥ 0.5%
saxis min = 1.6%
Considering the geometric constraints outlined above and combining the design parameters presented in Table 1, a total of 75 alignments were generated and evaluated for aquaplaning assessment. These alignments resulted from the combination of three curve radii with their respective superelevation rates, five spiral lengths satisfying the rule R/3 ≤ A ≤ R, and five longitudinal grade values meeting the minimum threshold of 1.6%.
Additional parameters considered in the aquaplaning investigation included pavement texture depth (TXD), tire tread depth (TTD), spin-down effect (SD), and tire pressure (TP), along with rainfall intensity (RI). The selected ranges for these parameters were established based on consolidated findings from the literature, as follows:
- TXD (mm): 0.5, 1.0, 1.5 [3]
In total, 6075 combinations were examined for the determination of water film thickness above the top of pavement texture (WFT) and aquaplaning speed (APS) values, respectively. The process is based on defining the critical drainage path per case.
In order to assess the significance in terms of involvement degree of the critical parameters stated above, it was decided to implement multiple linear regression for both water film thickness (WFT) and aquaplaning speed (APS) outputs. Linear regression is a widely known, simple technique used to model a linear relationship between a continuous dependent variable and one or more independent variables [12]. Consequently, regression models were developed to investigate the relationship between WFT and APS and the governing roadway geometry parameters.
To complement the developed models, elasticity analyses were performed. In applied practice, elasticity analysis quantifies the sensitivity of the dependent variable to a 1% change in a continuous independent variable.
When dealing with independent categorical variables, it is meaningful to implement pseudoelasticities to obtain the incremental changes that are incurred as a result of category changes in the categorical variables [12].
By using elasticity (and pseudo-elasticity) analyses, the influence of each variable on WFT and APS was explicitly quantified. Following [12], the elasticity (ei) of a dependent variable Y with respect to a continuous independent variable X, which has a regression coefficient β, can be defined as follows:
The absolute elasticities were rescaled across the range of all continuous independent variables by normalizing the lowest value to 1 and adjusting the remaining variables proportionally to their absolute scores. Pseudoelasticities were not rescaled alongside elasticities, as the magnitudes of change in their associated independent variables are not directly comparable.
4. Discussion
As shown in Table 2 and Table 3, the linear regression analysis conducted for WFT and APS demonstrated high predictive accuracy, with adjusted coefficients of determination (R²) exceeding 96%. However, not all examined independent variables were found to be statistically significant.
Moreover, from the road geometry parameters point of view, only grade values were found statistically significant. As revealed from the p-value and t-stat outputs, besides grade, both rain intensity rate and pavement texture depth appear to be essential for WFT. As far as APS predictions are concerned, apart from the latter independent variables, tire pressure and tire tread depth appear also significant.
In addition to the identification of the involved parameters, elasticity analysis was performed to quantify their effects. Regarding WFT assessment, it can be seen through Table 2 that the most critical value is RI, followed by grade. For example, by increasing by 1% the RI rate and grade value, the WFT value increases and decreases by 0.75% and 0.38%, respectively. On the other hand, as seen in Table 3, RI affects (reversely) APS and ranks third in terms of significance (1% increase of RI results to 0.06% decrease in APS). The most critical independent parameter for APS prediction is tire pressure, followed by pavement texture depth (elasticity values of 0.302 and 0.095, respectively).
Pavement texture depth (TXD) seems to be a significant parameter for both WFT and APS. Assuming tire pressure and rain intensity rates remain constant, an increase of the pavement texture depth by 0.5mm results in a decrease of the WFT and an increase of the APS values by approximately 0.2mm and 5km/h, respectively.
Figure 5 presents the WFT and APS values derived from the models as a function of grade, assuming average parameter values for TXD and TTD (1.0 mm). The results indicate that steeper grades are generally associated with reduced aquaplaning potential. However, this finding must be cross-validated against the corresponding drainage path length. A closer examination of Figure 5 reveals that WFT values exceeding the critical threshold of 4 mm occur at rainfall intensities greater than approximately 60 mm/h, even under mild grade conditions (e.g., for RI = 80 mm/h, WFT > 4 mm is observed at grades below 4.5%). Consequently, the corresponding APS values associated with WFT values above 4 mm should be considered invalid.
Such cases should be approached with caution, as lower speed recommendations for APS may be necessary (e.g., absolute minimum values of 60 km/h or 70 km/h). Alternatively, mitigation measures can be considered, such as the introduction of longitudinal crown lines between lanes or the establishment of minimum thresholds for pavement texture depth (TXD).
5. Conclusions
The present research aimed to investigate critical aquaplaning thresholds. The analysis was performed for the German RAA, 2008 urban motorway design guidelines (EKA 3 Class), examining an unfavorable divided cross section in terms of pavement width (4+4 lanes).
The correlation was performed utilizing the well-known Gallaway formula [8], enriched by analyzing the involved road geometry parameters in 3D jointly with various rainfall intensity rates, pavement surface characteristics (texture depth), vehicle (tire tread depth and pressure) and user parameters (spindown of the rotational speed at the initiation of hydroplaning).
The proposed methodology identified roadway segments where aquaplaning potential is critical and cannot be overlooked. From a road geometry perspective, only grade values were found to be statistically significant. Beyond grade, the statistical analysis highlighted the influence of rainfall intensity and pavement texture depth, while tire pressure and tire tread depth were also shown to be significant factors for WFT and APS assessments, respectively.
This research aimed to quantitatively identify critical conditions associated with key roadway, user, and vehicle parameters, with the ultimate goal of informing the development of evidence-based variable speed limits. The continuation of the work conducted on implementing reliable variable speed limits shall require a more integrated and holistic approach with the contribution of additional conditions that further restrict vehicle speed (e.g. skidding, traffic conditions, visibility, more detailed driver behavior assessment, etc.).
In conclusion, it must be highlighted that the proposed methodology is primarily applicable to connected and autonomous vehicles (CAVs), whose adoption can significantly enhance roadway safety by using real-time data to dynamically adjust speeds and navigate challenging conditions more effectively. CAVs can respond promptly to changing road conditions, reducing the risks associated with aquaplaning and skidding, whereas their ability to implement and adhere to variable speed limits based on real-time information ensures a safer driving environment under adverse weather conditions.
Author Contributions
Conceptualization, S.M., A.K., V.M., and K.A.; methodology, S.M., A.K., V.M., and K.A.; validation, S.M., A.K., V.M., and K.A.; formal analysis, S.M., A.K., V.M., and K.A.; investigation, S.M., A.K., V.M., and K.A.; data curation, S.M., A.K., V.M., and K.A.; writing—original draft preparation, S.M., A.K., V.M., and K.A.; writing—review and editing, S.M., A.K., V.M., and K.A.; All authors have read and agreed to the published version of the manuscript.
Funding
This research received no external funding.
Data Availability Statement
The raw data supporting the conclusions of this article will be made available by the authors on request.
Conflicts of Interest
The authors declare no conflicts of interest.
References
- Federal Highway Administration (FHWA). How Do Weather Events Impact Roads? . U.S. Department of Transportation. 2018 Jun [accessed 2018 Jun 1]. https://ops.fhwa.dot.gov/weather/q1_roadimpact.htm.
- Transportation Infrastructure Ireland (TII). Rural Road Link Design. Ireland; 2023.
- Lee H, Ayyala D. Enhanced Hydroplaning Prediction Tool. 2020.
- Ross NF, Russam K, Laboratory RR. The Depth of Rain Water on Road Surfaces. Road Research Laboratory; 1968. (RRL report). https://books.google.gr/books?id=kMoCuwAACAAJ.
- Gallaway Bob M., Schiller RE Jr, Rose JG. The Effects of Rainfall Intensity, Pavement Cross Slope, Surface Texture, and Drainage Length on Pavement Water Depths, Research Report No. 138-5. 1971.
- Gallaway BM, Hayes GG, Ivey DL, Ledbetter WB, Olson RM. Pavement and Geometric Design Criteria for Minimizing Hydroplaning, Report No. FHWARD-79-31. 1979.
- Chesterton J, Nancekivell N, Tunnicliffe N. The Use of the Gallaway Formula for Aquaplaning Evaluation in New Zealand. 2006 Jan 1.
- Austroads. Guide to Road Design Part 5A: Drainage: Road Surface, Networks, Basins and Subsurface. Edition 2.1. Austroads; 2023.
- Sitek MA, Lottes SA. Computational Analysis of Water Film Thickness During Rain Events for Assessing Hydroplaning Risk Part 2: Rough Road Surfaces. United States; 2020. https://www.osti.gov/biblio/1677647. doi:10.2172/1677647.
- Ed.German Road and Transportation Research Association. Geometric Design Standards. Guidelines for the Design of Roads, (RAA). Germany; 2008.
- Pirelli. Safe Driving and Tyre Features. https://www.pirelli.com/tyres/en-au/car/driving-and-tyre-tips/safe-driving-andtyre-features.
- Pirelli. Safe Driving and Tyre Features. https://www.pirelli.com/tyres/en-gb/car/driving-and-tyre-tips/how-to-read/recommended-tyre-pressure.
Figure 1.
Relation between WFT, TWFT and MTD [3].
Figure 1.
Relation between WFT, TWFT and MTD [3].
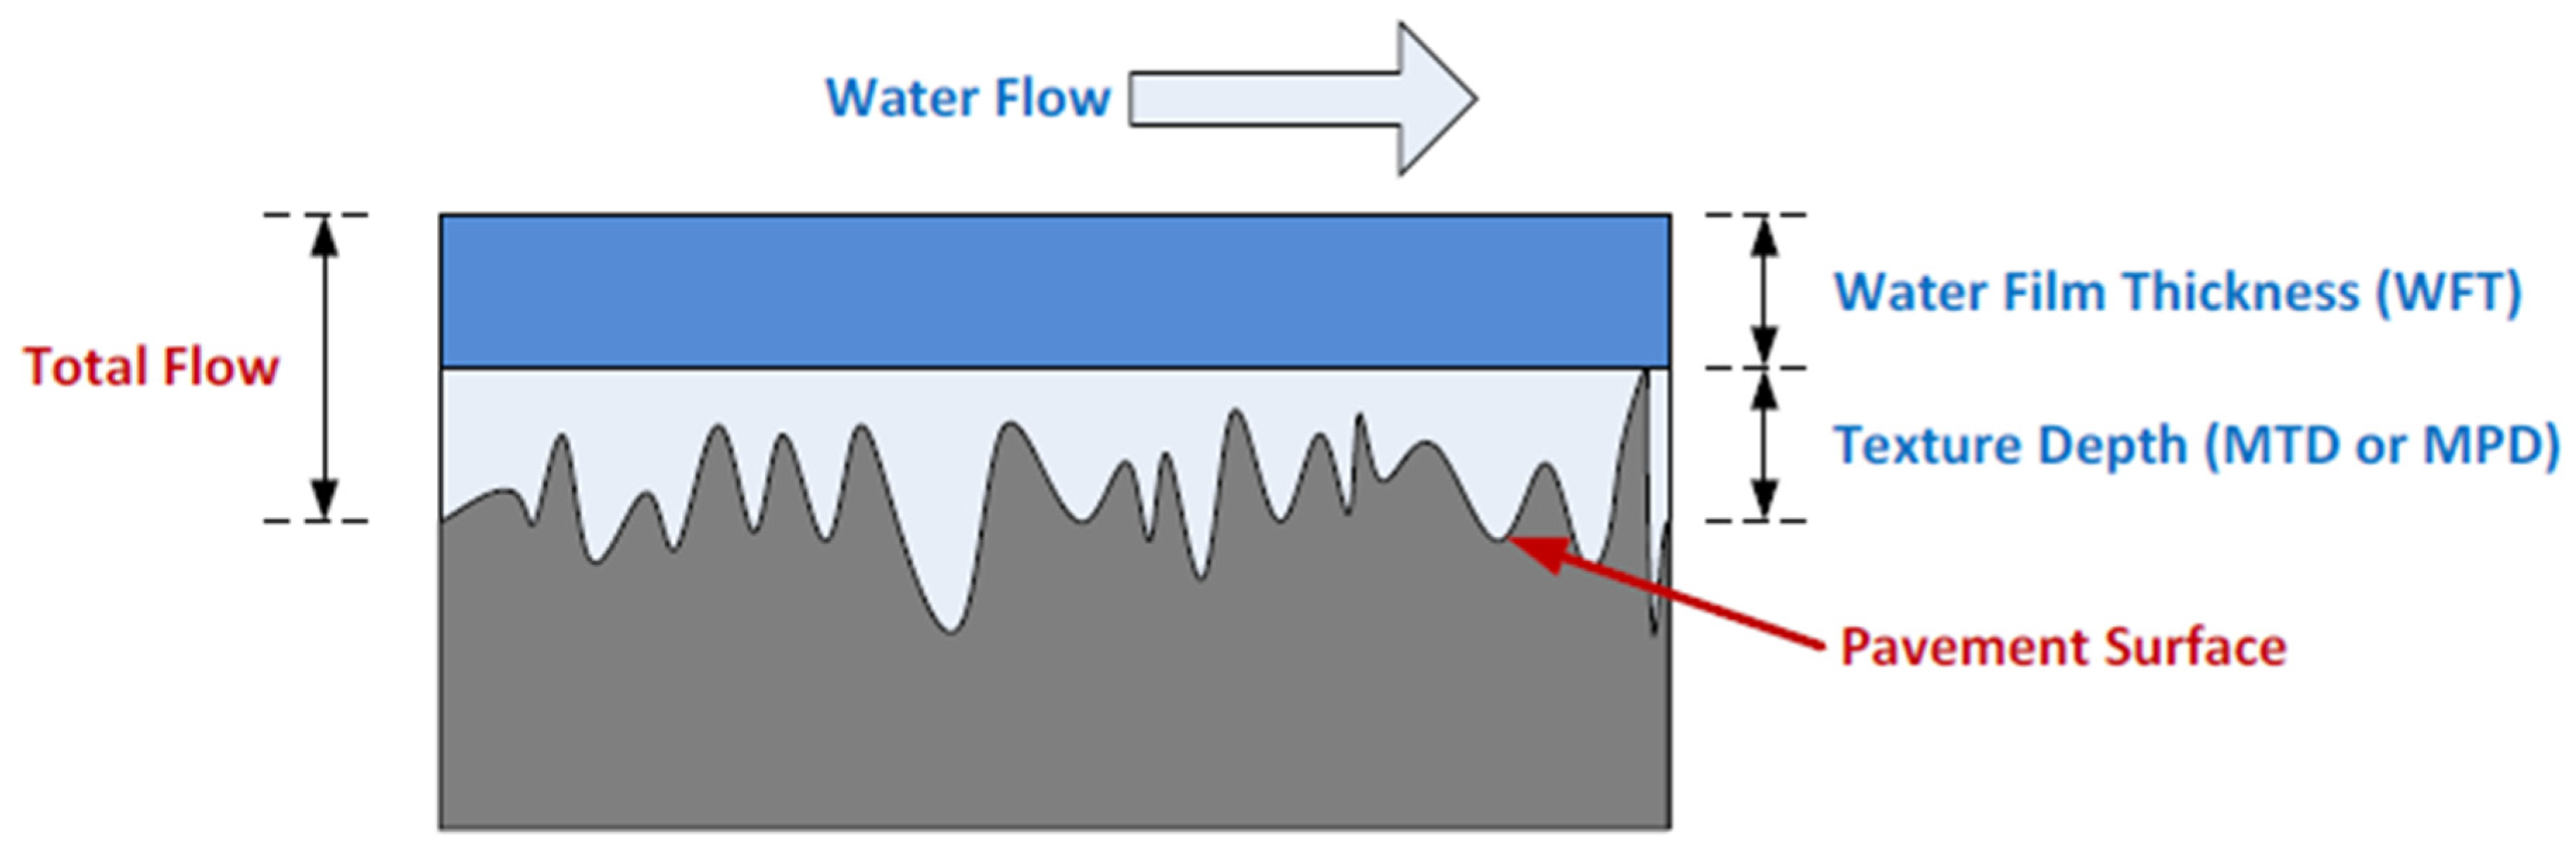
Figure 2.
Pavement rotation along a left curved, upgrade road section between tangent and curve. Note: Arrow in critical drainage path indicates water flow direction.
Figure 2.
Pavement rotation along a left curved, upgrade road section between tangent and curve. Note: Arrow in critical drainage path indicates water flow direction.
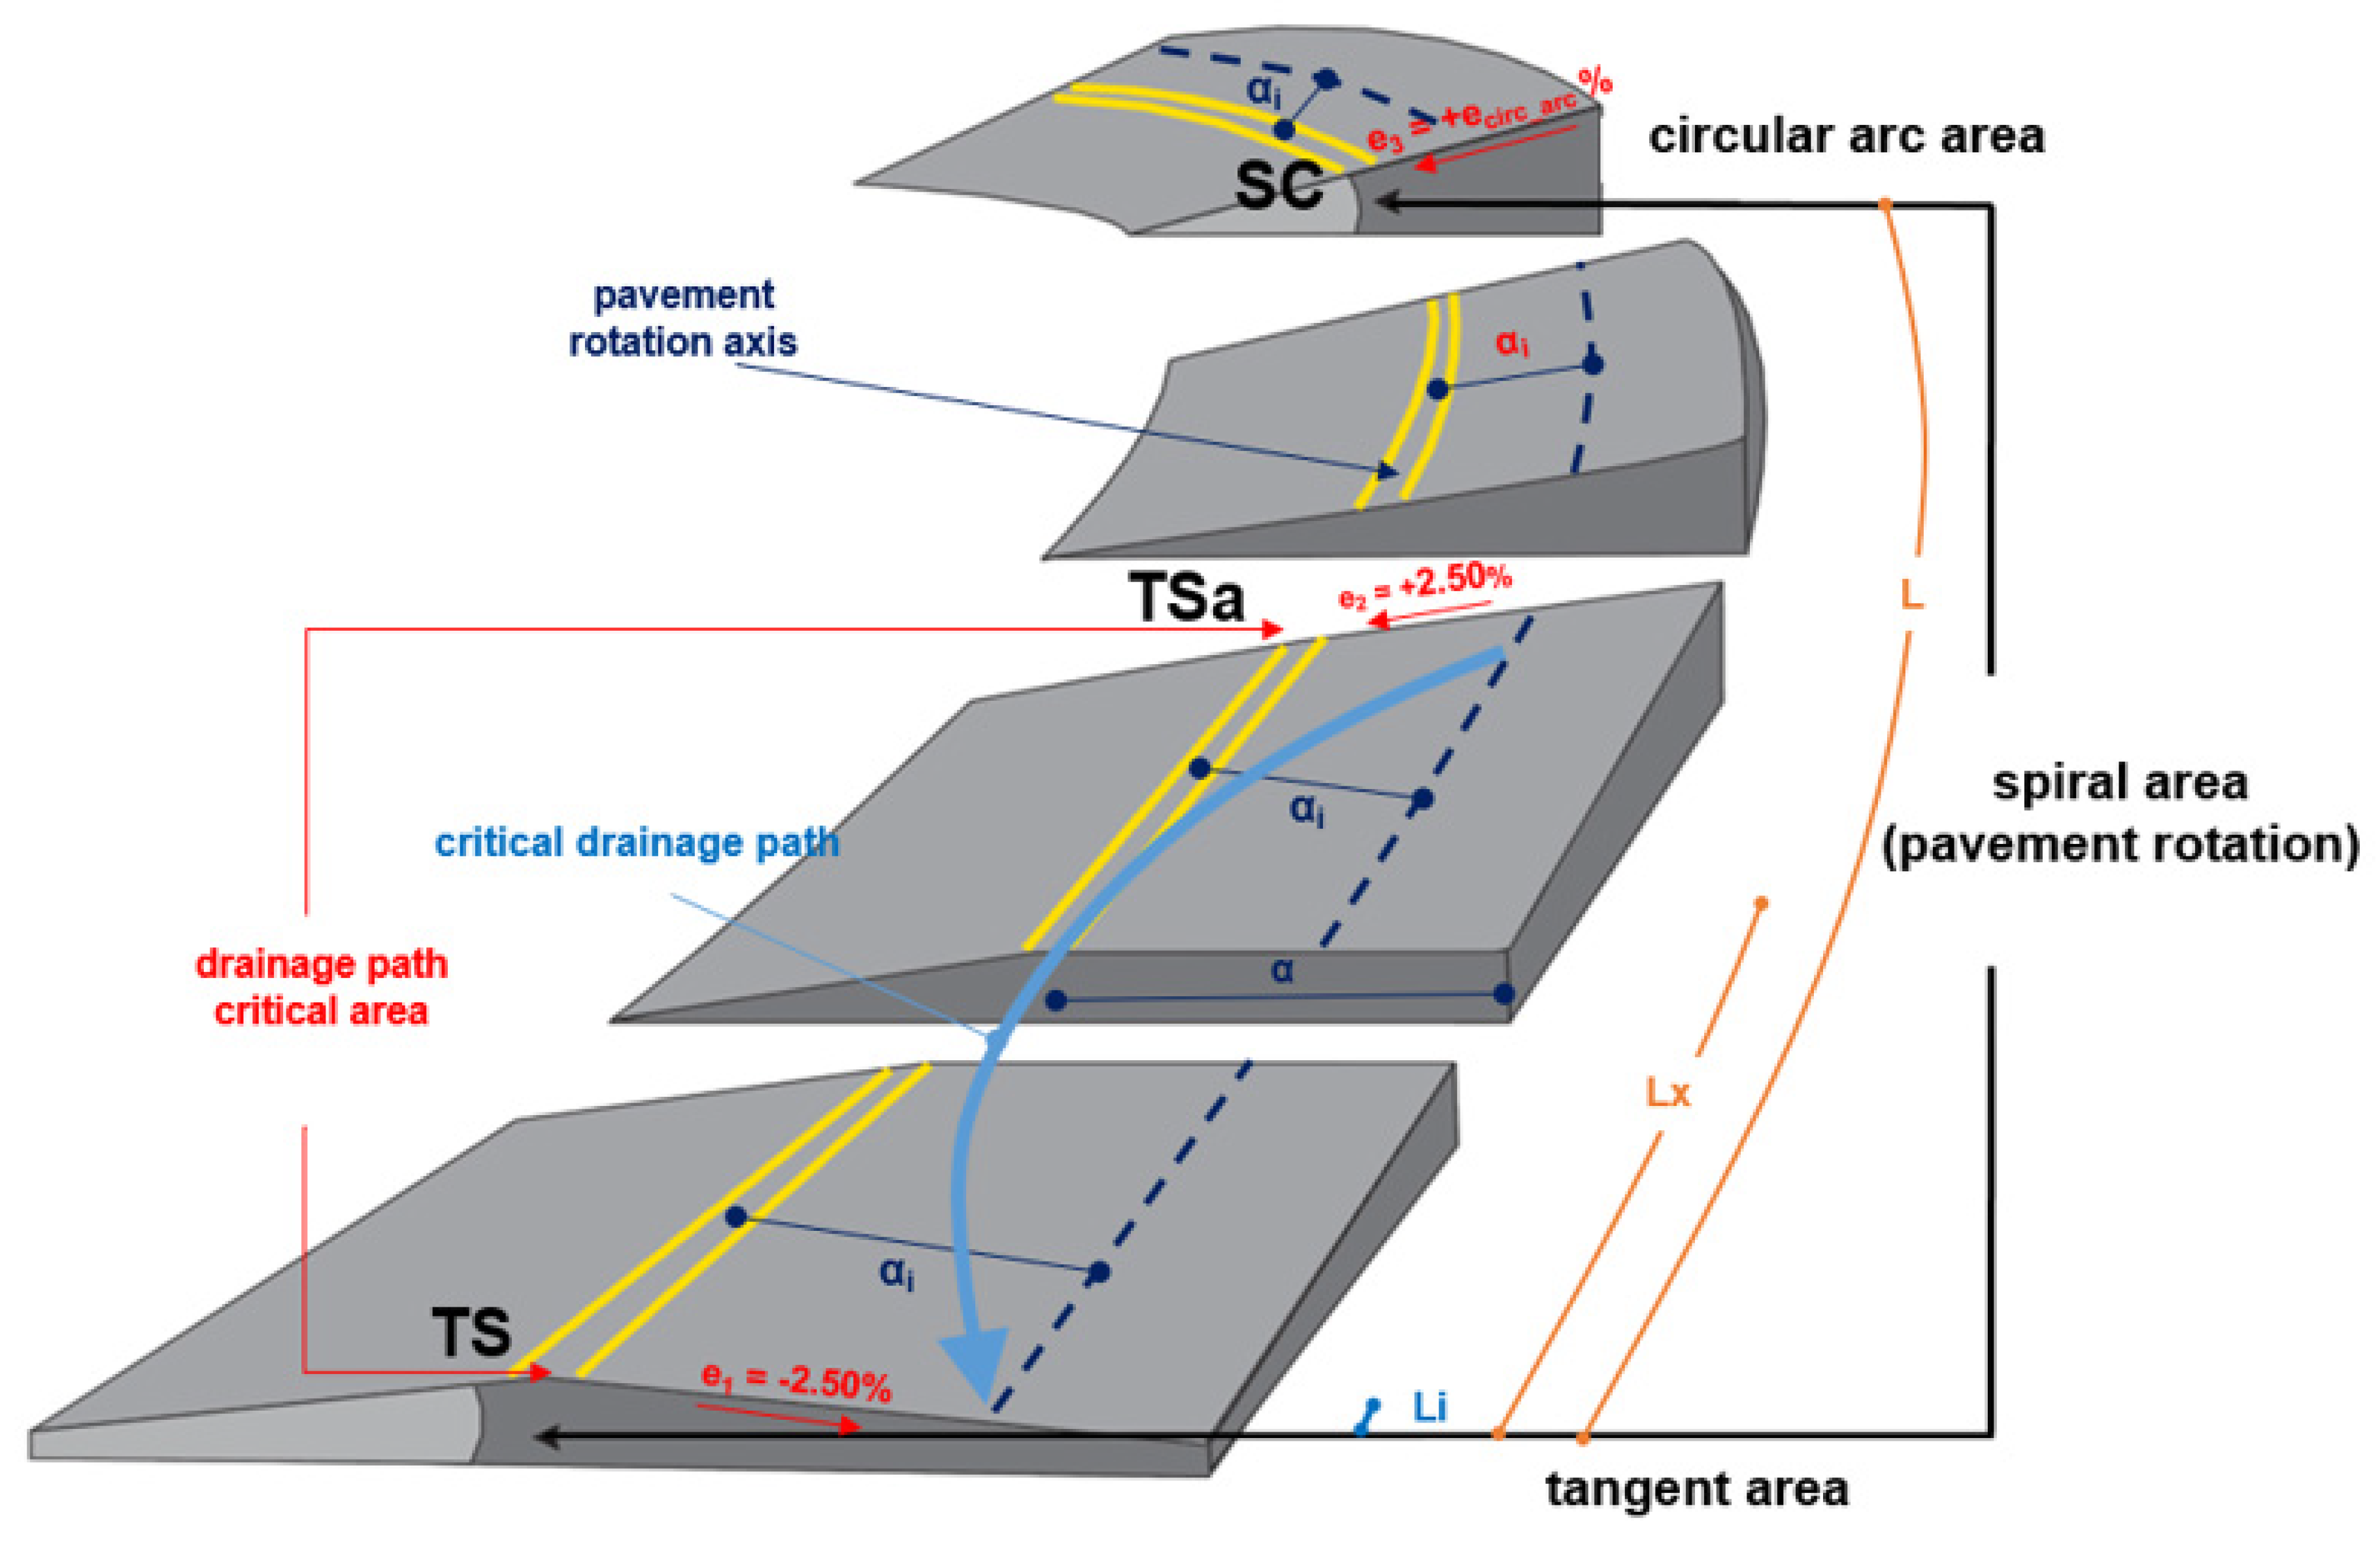
Figure 3.
Drainage path along a 3+3 lanes left curved divided road section. Note: a=11.0m, etangent=-2.5%, ecirc_arc=+4.5%, s=+2.0%, TS: tangent to spiral, SC: spiral to curve, CS: curve to spiral, ST: spiral to tangent, grey arrows indicate direction of drainage path. Emergency lane omitted.
Figure 3.
Drainage path along a 3+3 lanes left curved divided road section. Note: a=11.0m, etangent=-2.5%, ecirc_arc=+4.5%, s=+2.0%, TS: tangent to spiral, SC: spiral to curve, CS: curve to spiral, ST: spiral to tangent, grey arrows indicate direction of drainage path. Emergency lane omitted.
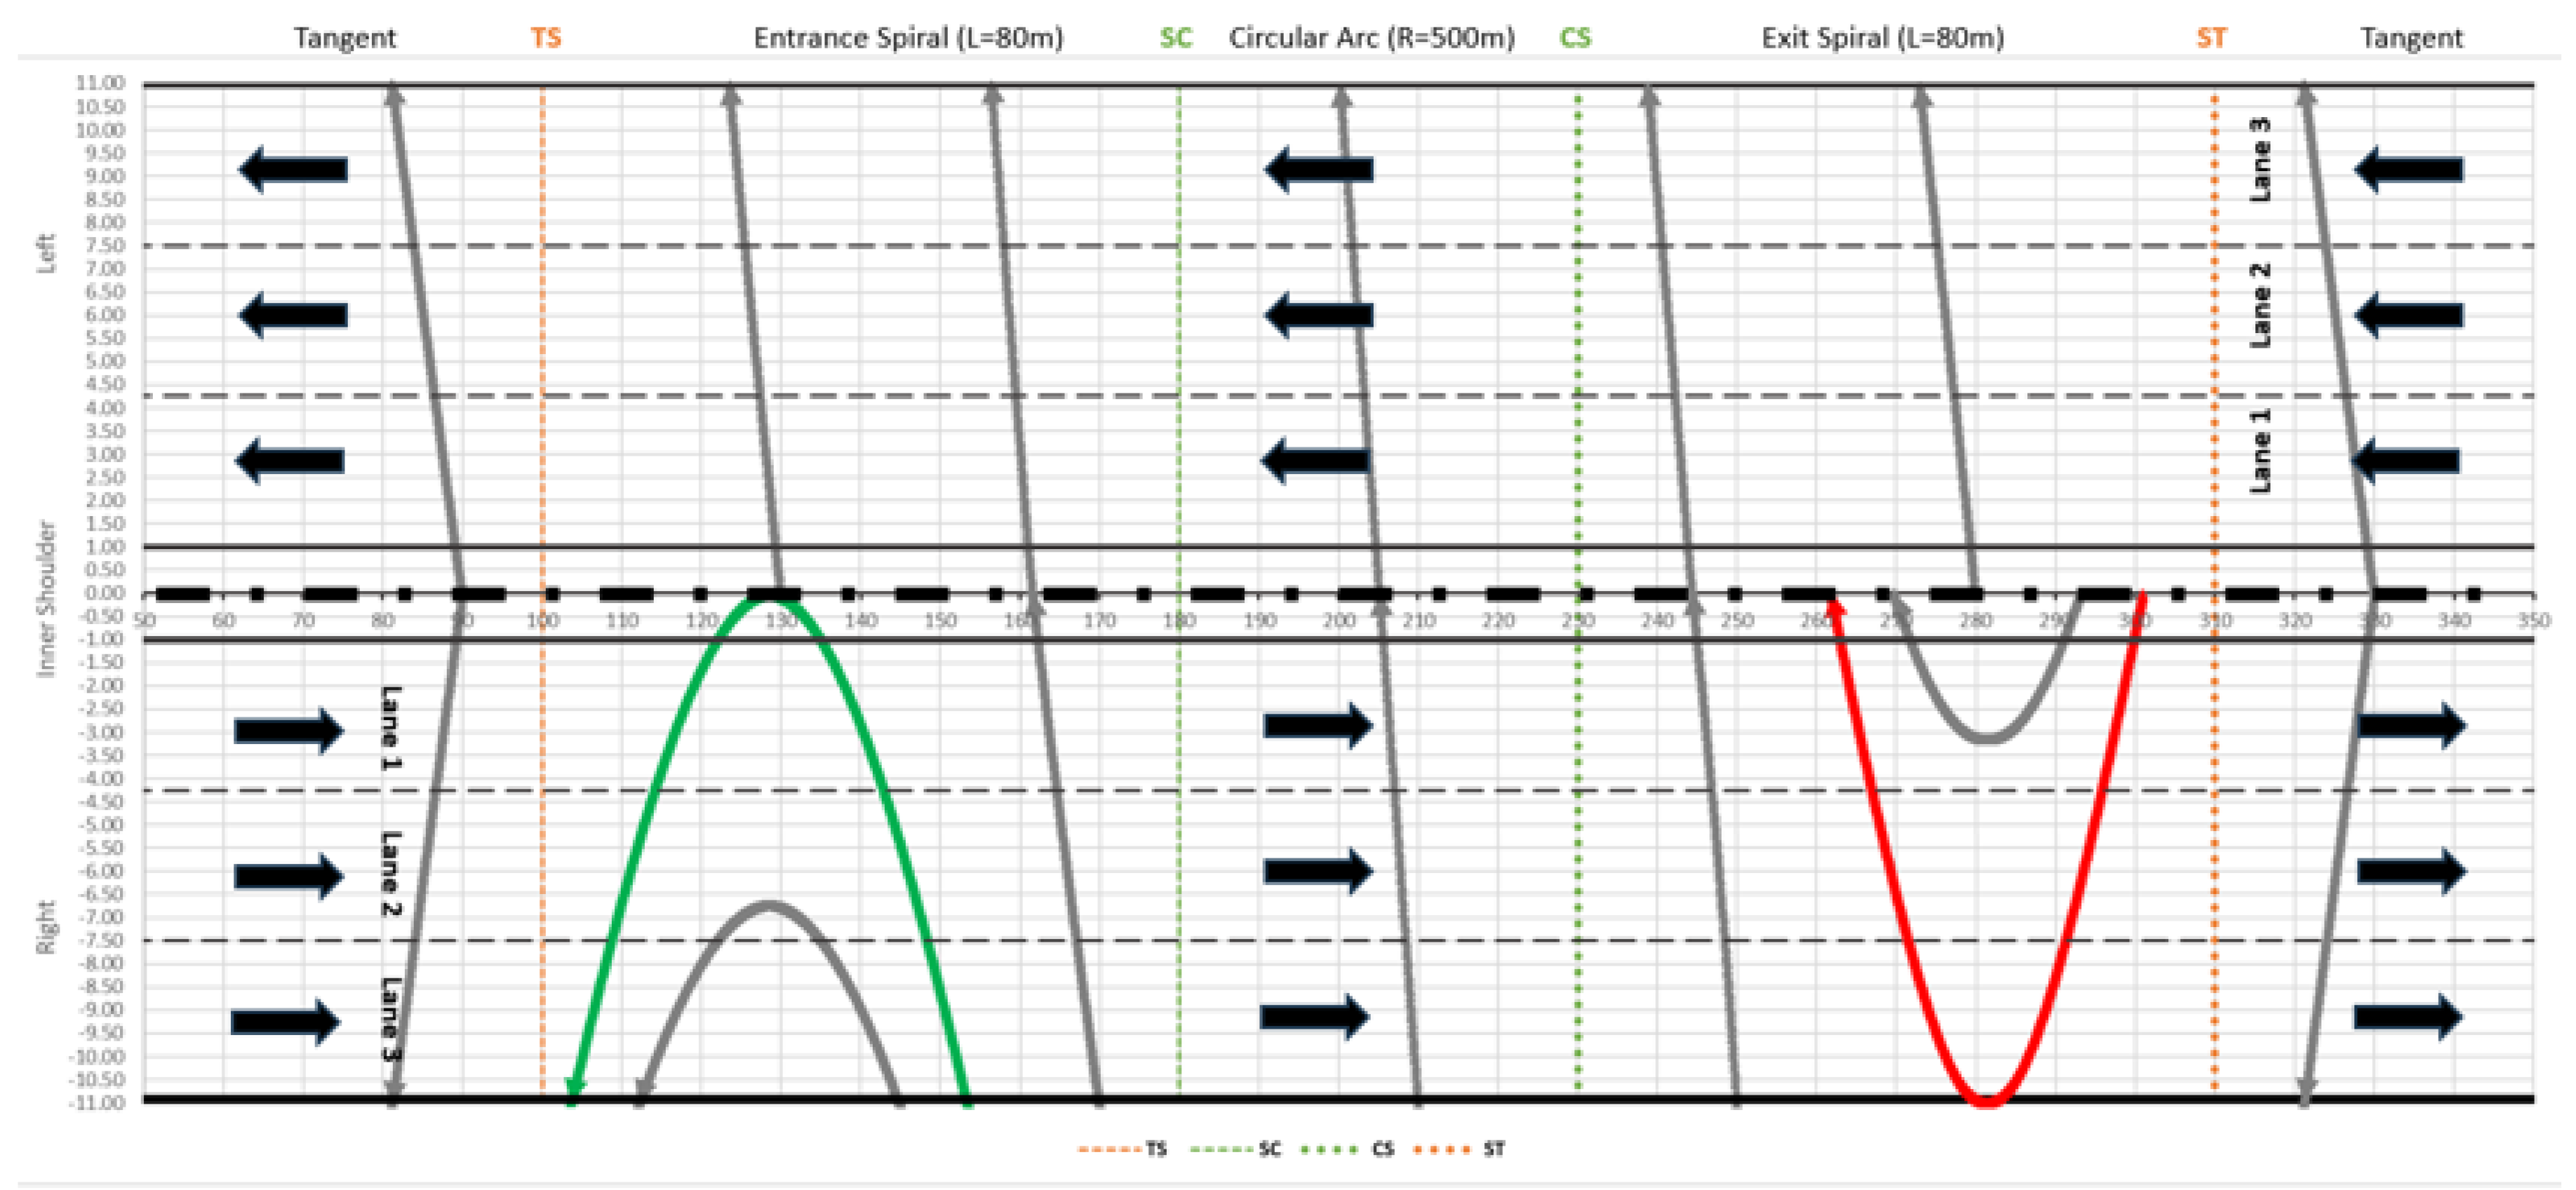
Figure 4.
Standard 4lane cross-sections for EKA 3 motorways. Cross Section RQ38.5 (a=14.5, Δsmax=1.45%). Note: “a” distance between carriageway edge line and rotation axis [emergency lane (hard shoulder) not included).
Figure 4.
Standard 4lane cross-sections for EKA 3 motorways. Cross Section RQ38.5 (a=14.5, Δsmax=1.45%). Note: “a” distance between carriageway edge line and rotation axis [emergency lane (hard shoulder) not included).
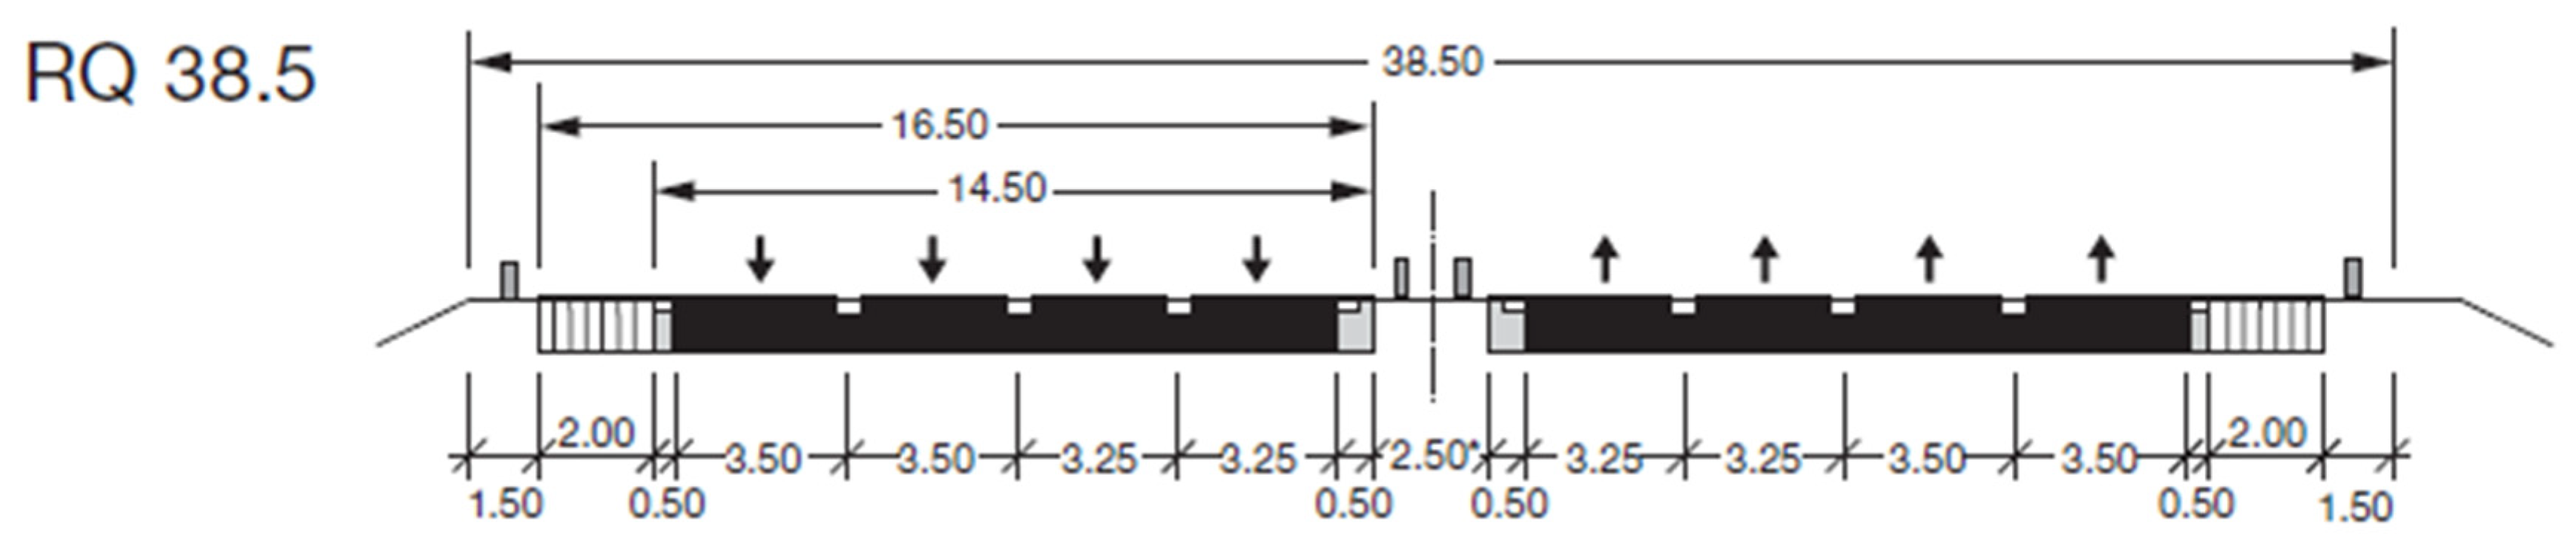
Figure 5.
Water film thickness (WFT) and aquaplaning speed (APS) outputs. Note: TXD and TTD parameters set to their average values of 1.0mm and 1.0mm, respectively.
Figure 5.
Water film thickness (WFT) and aquaplaning speed (APS) outputs. Note: TXD and TTD parameters set to their average values of 1.0mm and 1.0mm, respectively.
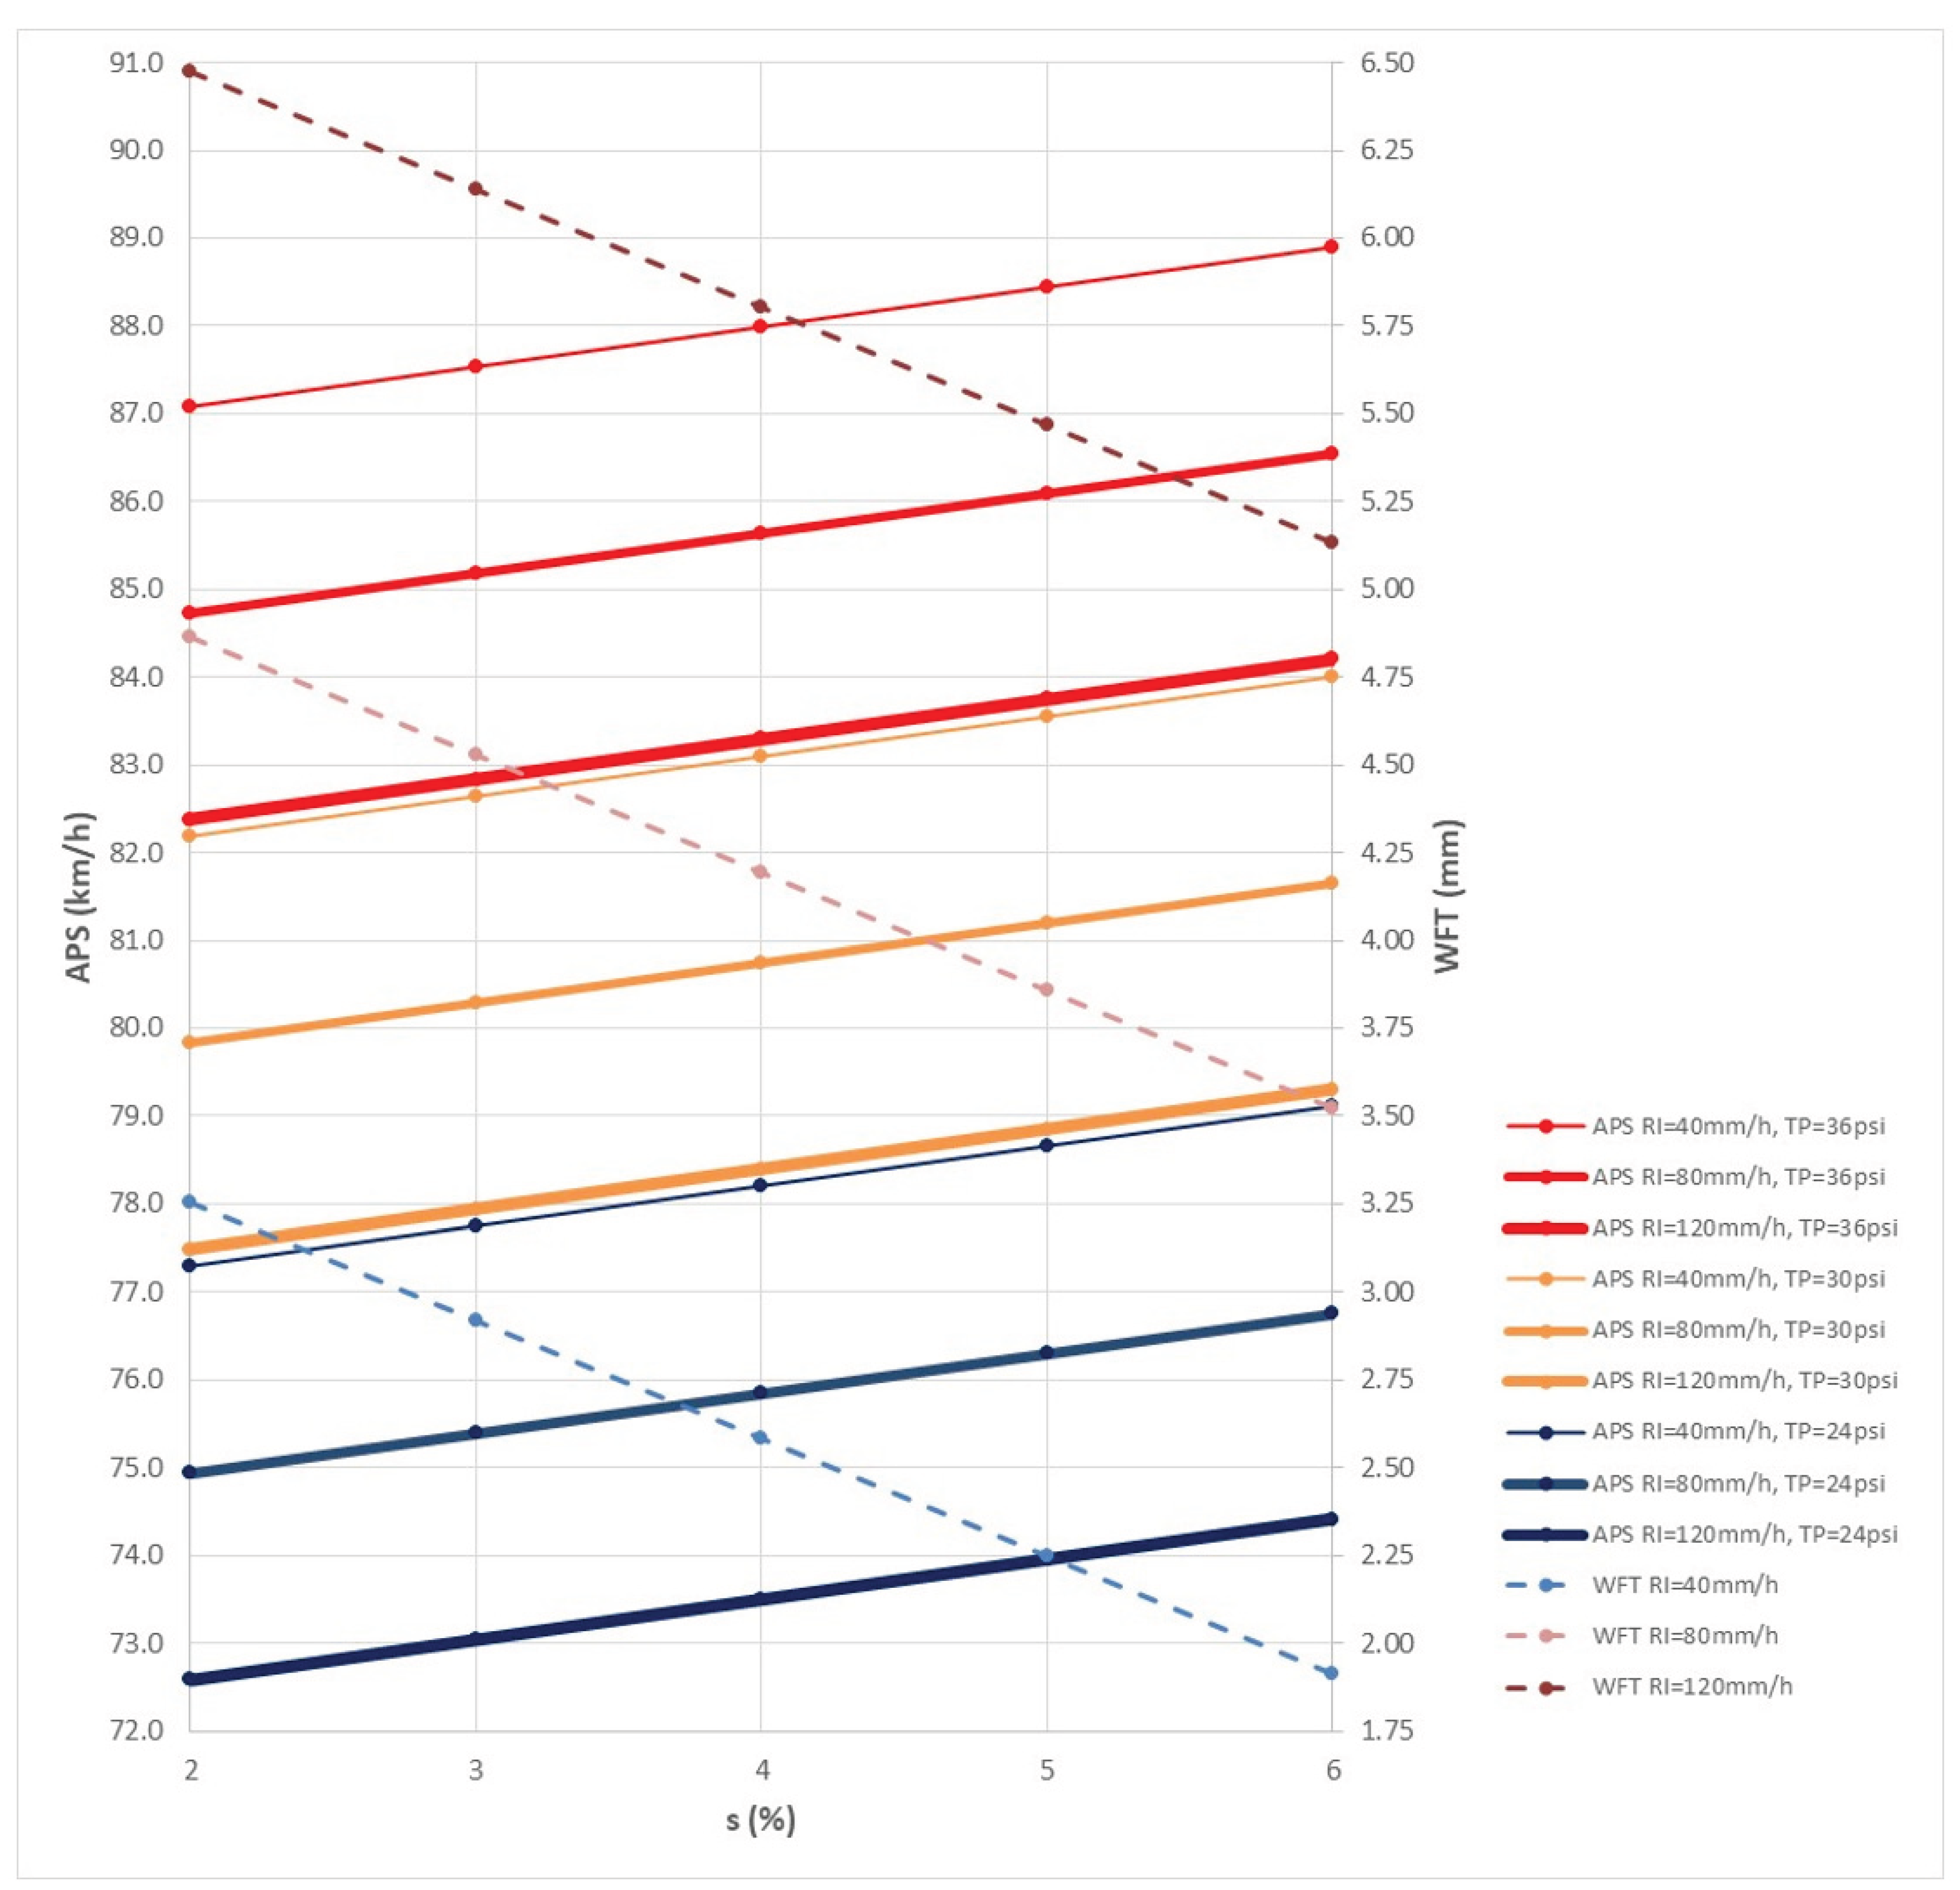

Table 1.
Utilized Geometric Parameters of RQ 38.5 Cross Section.
| R (m) | A/R | e (%) | s (%) |
|---|---|---|---|
| 280 | 0.33, 0.40, 0.60, 0.80, 1.00 | 6.0 | 2.0, 3.0, 4.0, 5.0, 6.0 |
| 550 | 4.0 | ||
| 1000 | 2.5 |
Table 2.
Descriptive statistics and coefficients for water film thickness (WFT).
| Regression Statistics | ||||||||
| Multiple R | 0.987 | |||||||
| R Square | 0.974 | |||||||
| Adjusted R Square | 0.974 | |||||||
| Standard Error | 0.227 | |||||||
| Observations | 6075 | |||||||
| ANOVA | ||||||||
| df | SS | MS | F | Significance F | ||||
| Regression | 3 | 11986.89 | 3995.63 | 77258.09 | 0 | |||
| Residual | 6071 | 313.98 | 0.05 | |||||
| Total | 6074 | 12300.86 | ||||||
| Coefficients | Standard Error | t Stat | P-value | Lower 95% | Upper 95% | Elasticity | Relative Elasticity | |
| Intercept | 2.694 | 0.013 | 201.455 | 0 | 2.667 | 2.720 | - | - |
| s | -0.335 | 0.002 | -162.497 | 0 | -0.339 | -0.331 | -0.384 | 1.000 |
| RI | 0.040 | 0.000 | 450.111 | 0 | 0.040 | 0.040 | 0.754 | -1.963 |
| TXD | -0.376 | 0.007 | -52.621 | 0 | -0.390 | -0.362 | -0.105 | 0.272 |
Table 3.
Descriptive statistics and coefficients for aquaplaning speed (APS).
| Regression Statistics | ||||||||
| Multiple R | 0.983 | |||||||
| R Square | 0.966 | |||||||
| Adjusted R Square | 0.966 | |||||||
| Standard Error | 1.046 | |||||||
| Observations | 6075 | |||||||
| ANOVA | ||||||||
| df | SS | MS | F | Significance F | ||||
| Regression | 5 | 190803.47 | 38160.69 | 34895.63 | 0 | |||
| Residual | 6069 | 6636.86 | 1.09 | |||||
| Total | 6074 | 197440.33 | ||||||
| Coefficients | Standard Error | t Stat | P-value | Lower 95% | Upper 95% | Elasticity | Relative Elasticity | |
| Intercept | 48.601 | 0.108 | 451.043 | 0 | 48.390 | 48.812 | - | - |
| s | 0.455 | 0.009 | 47.961 | 0 | 0.436 | 0.474 | 0.023 | 1.000 |
| RI | -0.059 | 0.000 | -142.988 | 0 | -0.060 | -0.058 | -0.059 | -2.615 |
| TXD | 7.762 | 0.033 | 236.171 | 0 | 7.697 | 7.826 | 0.095 | 4.208 |
| TP | 0.816 | 0.003 | 298.063 | 0 | 0.811 | 0.822 | 0.302 | -5.119 |
| TTD | 2.772 | 0.033 | 84.343 | 0 | 2.707 | 2.836 | 0.034 | 0.361 |
Disclaimer/Publisher’s Note: The statements, opinions and data contained in all publications are solely those of the individual author(s) and contributor(s) and not of MDPI and/or the editor(s). MDPI and/or the editor(s) disclaim responsibility for any injury to people or property resulting from any ideas, methods, instructions or products referred to in the content. |
© 2025 by the authors. Licensee MDPI, Basel, Switzerland. This article is an open access article distributed under the terms and conditions of the Creative Commons Attribution (CC BY) license (http://creativecommons.org/licenses/by/4.0/).
Copyright: This open access article is published under a Creative Commons CC BY 4.0 license, which permit the free download, distribution, and reuse, provided that the author and preprint are cited in any reuse.


