
Submitted:
26 May 2025
Posted:
26 May 2025
You are already at the latest version
Abstract
With the rapid advancement of urbanization, urban transportation systems are facing increasingly severe congestion challenges, especially at traditional roundabouts. The rapid increase in vehicles has led to a sharp increase in pressure at roundabouts. In order to alleviate the traffic pressure in the roundabout, this paper changes the road design parameters of the roundabout, uses CFD method combined with sensitivity analysis to study the influence of different inlet angles, lane numbers and outer radius on the pressure, and seeks the road design parameter scheme with the optimal mitigation effect. Firstly, the full factorial experimental design method is used to select the sample points in the design sample space, and the response values of each sample matrix are obtained by CFD. Secondly, the response surface model between the road design parameters of the roundabout and the pressure in the ring is constructed. The single factor analysis method and the multi-factor analysis method are used to analyze the influence of the road parameters on the pressure of each feature point, and then the moment independent sensitivity analysis method based on the response surface model is used to solve the sensitivity distribution characteristics of the road design parameters of the roundabout. Finally, the Kriging surrogate model is constructed, and the NSGA-II is used to solve the multi-objective optimization problem to obtain the optimal solution set of road parameters. The results show that there are significant differences in the mechanism of action of different road geometric parameters on the pressure of each feature point of the roundabout, and it shows obvious spatial heterogeneity of parameter sensitivity. The pressure changes of the two feature points at the entrance conflict area and the inner ring weaving area are significantly correlated with the lane number parameters. There is a strong coupling relationship between the pressure of the maximum pressure extreme point in the ring and the radius parameters of the outer ring. According to the optimal scheme of road parameters, that is, when the parameter set (inlet angle/°, number of lanes, outer radius/ m) meets (35.4, 5, 65), the pressure of feature points decreases by 34.1%, 38.3% and 20.7% respectively, which has a significant effect on alleviating the pressure in the intersection. This study optimizes the geometric parameters of roundabouts through multidisciplinary methods, provides a data-driven congestion reduction strategy for the urban sustainable development framework, and significantly improves road traffic efficiency, which is crucial for building an efficient traffic network and promoting urban sustainable development.
Keywords:
Annular intersection
; Sensitivity analysis
; Road design
; CFD
; Multi-objective optimization
Introduction
With the coordinated evolution of urbanization and road traffic system, the problem of traffic congestion has become increasingly prominent. Solving this problem is crucial to the normal operation of the city [1]. In the topology of the road network, the intersection is a typical traffic conflict node, and its traffic efficiency directly restricts the overall efficiency of the road network. Facts have proved that the congestion at urban road intersections is the most serious, and more than 80% of delays are concentrated at intersections [2]. Their traffic bottleneck effect has become a major obstacle to the improvement of road network carrying capacity. Intersections without signal control, especially roundabouts, are more congested. Therefore, alleviating congestion at roundabouts is considered to be an important issue.
The congestion problem of roundabouts can be studied through the application of intelligent transportation technology or infrastructure transformation. The former traffic management system based on intelligent connected technology explores and develops technologies such as intelligent connected vehicles, vehicle-road coordination, and automatic driving by constructing traffic flow models and digital simulation platforms [3,4,5,6], which can significantly increase the number of passing vehicles and reduce control delays [7,8,9]. However, its technical framework still has systematic limitations--it has not broken through the structural capacity bottleneck of the physical road network, and it is difficult to cope with the commuting rigid demand in the saturated state of the road network during peak hours. In addition, equipping a signal [10,11] at the roundabout changes the operating mode from decentralized rule control to centralized control, which may reduce safety and effectiveness. The latter mainly breaks through the structural limitations from the perspective of physical space optimization. The geometric structure of the roundabout is the main determinant of the capacity and performance of the roundabout [12,13,14,15,16]. In the practical process of dealing with the bottleneck of urban traffic space, the optimization of physical space forms a dual technical path. On the one hand, innovative designs based on geometric reconstruction, such as the double-layer roundabout designed by alternative roundabouts, provide solutions for urban and suburban areas with limited space. It has unique advantages in capacity and safety [17,18], but this method ignores the problems of large engineering volume and high cost. On the other hand, it focuses on the refinement of existing facilities. Studies have confirmed that the optimization of geometric parameters of conventional plane roundabouts also has significant benefits [19], such as the diameter of the inscribed circle and the angle of the vehicle entrance. These parameters directly affect the deflection angle, which in turn affects the speed control and traffic efficiency of the roundabout [20,21]. In this regard, the traffic flow characteristics of plane roundabouts are studied, the main bottleneck areas of traffic congestion are found, and the parameters affecting traffic congestion at roundabouts are optimized [22,23,24,25,26], which has a significant effect on alleviating traffic congestion at intersections.
The main bottleneck area of traffic congestion can be determined and analyzed by using the dynamic characteristics of fluid flow in CFD [27,28,29,30,31]. As an advanced numerical simulation technology, CFD provides a multi-dimensional analysis perspective and quantitative research tool for solving complex traffic flow problems such as traffic congestion. CFD can effectively insight into the formation and propagation of congestion, so as to facilitate the study of the impact of queue distribution on congestion formation [32,33]. It is worth noting that the road geometric parameters have different effects on the distribution of traffic pressure field in different areas of the roundabout (such as the inner and outer ring roads) [34]. It is necessary to establish a parameter sensitivity analysis model to quantify the influence weight of key design parameters and provide a theoretical basis for the optimal design of transportation infrastructure [35]. Optimizing the design of roundabouts requires an in-depth understanding of traffic dynamics and the interaction between various design parameters and traffic behavior. Multi-objective optimization modeling can be applied to the optimization process of roundabout design, and algorithms are used to effectively balance these objectives to ensure that the roundabout design achieves the optimal balance between capacity and traffic efficiency [36].
In summary, this paper uses Fluent software of CFD to study the congestion problem of roundabouts. Determine the key parameters affecting the road in the traffic congestion area of the roundabout; the experimental design method is used to simulate each model, and the response surface model between the key parameters of the road and the pressure in the ring is constructed to determine the influence of single factor and interaction effect on the pressure field. The sensitivity analysis of the key parameters of the road at the roundabout is carried out to find out the parameters that have a significant impact on the traffic pressure. The Kriging surrogate model is constructed, and the multi-objective genetic algorithm is used to optimize the different road parameters of the roundabout, and the optimal parameter combination is obtained.
1. Road Parameter Setting and Test Design of Roundabout
1.1. Geometric Model
The plane geometric parameter model of the roundabout takes the central island as the core, and constructs a multi-lane circular traffic system through the geometric relationship of concentric circles. The core parameters include: central island diameter , outer ring diameter , total ring width (corresponding to four-lane ring road right, single lane width ); the total width of single entrance and exit (including two lanes, single lane width ); the entrance tangential angle and the transition curve of the connecting section adopt an arc with a radius of to realize the curvature adaptation between the ring road and the entrance lane. The specific geometric model is shown in Figure 1.
In order to better analyze the pressure characteristics around the roundabout, the intersection point located at the center line of the entrance lane and the edge line of the outer ring lane is selected, and the initial merging position of the vehicle and the pressure statistical benchmark are calibrated, which is the feature point A. The point is set based on the concept of “conflict point” in traffic flow theory, which can capture the initial interaction between the vehicle entering the ring road and the original traffic flow in the ring. From point A along the extension line of the entrance lane to the center line of the inner ring lane, the geometric mapping relationship between the entrance and the inner ring lane is characterized, that is, the feature point B, which is located in the vehicle weaving zone. Monitoring its pressure value can provide key data support for geometric parameter optimization and traffic efficiency improvement. Based on the traffic density-velocity dynamic model, the maximum traffic pressure value of the loop is monitored, which is the characteristic point Pmax. The spatial position is dynamically determined by the extreme condition of the pressure field gradient, and its purpose is to quantify the bottleneck effect intensity. The positions of feature points A and B are shown in Figure 1. The three feature points constitute a collaborative analysis framework, which supports the multi-dimensional evaluation of traffic efficiency and pressure at roundabouts.
1.2. CFD Numerical Method
Traffic flow pressure is an important parameter to characterize the interaction between vehicles and traffic congestion. Based on the numerical simulation method of CFD, the traffic flow is compared to fluid, and a two-dimensional control equation is established to model the vehicle flow. With the help of Lighthill-Whitham-Richards (LWR) theory, a traffic flow control system including continuity equation, momentum equation and state equation is constructed. It is worth noting that the LWR model [29] is a classical traffic flow model. Its core is the continuity equation combined with the velocity-density relationship, that is, the state equation, ignoring the inertia term in the momentum equation. The numerical solution uses the finite volume method to discretize the computational domain, sets the inlet/outlet boundary conditions and the initial density field, and iterates through the pressure-velocity coupling algorithm. The simulation results can quantitatively show the pressure distribution in the road network. The high-pressure area corresponds to the congested road section with frequent acceleration and deceleration of vehicles, and the low-pressure area represents the free flow state. The specific control equation is as follows.
- (1)
- Continuity equation:
Because the simulation selects the steady-state environment, the density does not change with time, and Equation (1) can be expressed as :
- (2)
- Turbulent Kinetic Energy Equation:
The turbulent viscosity governing equations in this study are calculated using the standard (2 eqn) model as follows.
where is the generation term for turbulent energy due to the mean velocity gradient, is the generation term for turbulent energy due to buoyancy, and represents the contribution of pulsation expansion in compressible turbulence, , and are empirical constants, = 0 when the main flow direction is perpendicular to the direction of gravity, and the default constants = 1.44, = 1.92, = 0.09, = 1.0, = 1.3.
When the flow is unpressurized and no user-defined source terms are considered, , , , . At this time, the standard model becomes as follows:
1.3. Road Parameter Test Design
The geometric parameter design of the road is the main determinant of the capacity and performance of the roundabout. For example, the diameter of the roundabout directly affects the smoothness of the vehicle 's roundabout trajectory. If the diameter is too small, it will lead to frequent vehicle interweaving and increase conflict points. Insufficient number and width of lanes may limit the parallel capacity of vehicles and aggravate congestion. Insufficient number of import lanes or unreasonable channelization will reduce traffic efficiency. Therefore, this paper considers optimizing the geometric design of the road from three parameters: the inlet angle of the roundabout, the number of lanes and the outer radius.
The inlet angle refers to the angle between the center line of the entrance lane and the tangent line of the outer edge of the circular lane when the vehicle enters the roundabout from the entrance lane. The number of lanes refers to the number of independent lanes available for vehicles to drive around the island in the roundabout ring. The outer radius refers to the radius of curvature of the center line of the outermost lane at the roundabout (the distance from the center of the roundabout to the center line of the outer edge lane). The range of each parameter is shown in Table 1.
The Full Factorial Design (FFD) method was used to comprehensively analyze all combinations of all independent variables at all levels, and the inlet angle was used as a gradient every 5°. The number of lanes per unit 1 as a gradient; the radius of the outer ring is taken as a gradient every 7.5 m, and a total of 112 sample matrices are obtained. Then, the pressure response values of the characteristic points A, B and Pmax are obtained by Fluent software simulation calculation, due to the large number of design sample matrix data. In view of the integrity requirements and space limitations of data presentation, only a few representative sample matrix response values are listed, as shown in Table 2.
From the values of the three input factors given in Table 2, it can be seen that there are great differences in the values of the three input factors, such as the inlet angle of the roundabout and the number of lanes. In order to avoid the influence of the difference in the value of the three input factors on the response target y(x), the values of the three input factors are normalized by the formula.
where is the normalized parameter of different input variables, is the -th input variable, and are the maximum and minimum values of the input variables, respectively.
2. Sensitivity Analysis of road Parameters at Roundabouts
2.1. Response Surface Model Construction
The Response Surface Method (RSM) is a method to establish a one-to-one mathematical relationship between the selected road design parameters and the pressure of each feature point based on the experimental design results. For the n-dimensional input factor , the response target is . The function expression between the input factor x and the response objective y is:
Where, is the sub-item of the fitting polynomial with order of x, is the coefficient of each item, which is fitted by the least square method from the response target , and is the number of items of the fitting polynomial.
Based on FFD, 112 sample point matrices were generated to construct a response surface approximation model. Then, the significant p-value analysis of each sub-item of the constructed response surface approximation model is carried out. Table 3 gives the significant p-values of each sub-item of the A-point, B-point and Pmax response surface model under different parameters. In the response surface polynomial, represents the inlet angle; represents the number of lanes; represents the outer radius of the intersection.
For the A-point response surface model, the significance p values of the polynomial sub-items , , , , , and are less than 0.05, indicating that the above sub-items have significant effects. For the B-point response surface model, the polynomial sub-terms , , , , and have a significant effect. For the Pmax response surface model, the polynomial subformulas , , , , , , and have a significant effect.
According to the significance p-value analysis results of each sub-item of the polynomial response surface of point A, point B and Pmax, combined with the significance p-value analysis evaluation criteria, the sub-items with significant influence are retained, and the sub-items with insignificant influence are removed. Finally, the polynomial response surface approximation model is obtained, and the mathematical relationship is as follows.
The polynomial response surface model is gradually approaching the actual value through the approximate value, so there is a random error in the process of fitting the polynomial response surface model. In order to ensure the accuracy of the fitted response surface approximation model, it is necessary to analyze the error of the fitted response surface approximation model. The commonly used error evaluation criteria are Maximum Error (ME), Root Mean Square Error (RMSE), Average Error (AE) and Coefficient of Determination (R2). As shown in Table 4, the 1-3 order error values of the polynomial response surface approximation model of point A, point B and Pmax are given.
From Table 4, it can be found that with the gradual increase of the fitting order of the polynomial response surface approximation model of A point, B point and Pmax, the values of the polynomial function ME, AE and RMSE show a decreasing trend. On the contrary, the value of R2 gradually increases with the increase of the polynomial function fitting order, and the value gradually approaches 1. For the second-order and third-order polynomial response surface, the error of each polynomial response surface approximation model is relatively close, which indicates that the accuracy of the second-order polynomial response surface approximation model is sufficient to meet the design requirements. Therefore, this paper chooses the second-order polynomial to fit the A-point, B-point and Pmax polynomial response surface approximation model.
2.2. Single Parameter Influence Analysis
Using the obtained response surface approximation model and the single factor analysis method, the independent influence of the inlet angle (x1), the number of lanes (x2) and the outer radius (x3) on the A point, B point and Pmax is analyzed respectively. The influence of specific parameters is shown in Figure 2.
Figure 2 (a), (b) and (c) are the curves of point A, point B and Pmax pressure at different inlet angles. It can be seen that with the increase of the inlet angle, the pressure of point A and Pmax is positively correlated, and the pressure of point B is negatively correlated.
Figure 2 (d), (e) and (f) are the pressure change curve of each feature point when setting different number of lanes. It can be seen that the pressure of point A, point B and Pmax shows a strong negative correlation with the increase of the number of lanes, indicating that the more the number of lanes set within a certain range, the better the pressure relief effect in the ring.
Figure 2 (g), (h) and (i) are the pressure curve of each feature point when the outer radius is different. It can be seen that with the increase of the outer radius, the pressure at point A is positively correlated, and the pressure at point B and Pmax is negatively correlated.
2.3. Two-Parameter Impact Analysis
The multi-factor and multi-crossover analysis method was used to explore the influence of different key parameters of the roundabout on the pressure of point A, point B and Pmax under the interaction of two. The results of the influence of the three key road parameters of the roundabout on the pressure of each feature point are shown in Figure 3.
The following two conclusions can be obtained from Figure 3. First, it can be obtained whether the interaction between the three key parameters is significant. For example, the interaction between the inlet angle and the number of lanes in Figure 3 (a) has a significant effect on point A; Figure 3 (b) The interaction between the inlet angle and the outer ring radius is relatively not significant. Secondly, the distribution law of the parameters when the pressure of each feature point is the smallest can be obtained from the results of the interaction of the three key parameters in the above figure. For example, when the number of lanes at the roundabout in Figure 3 (c) is 5 lanes, the pressure at point A is the smallest when the radius of the outer ring is 42.5 m.
2.4. Full Parameter Impact Analysis
In the Global Sensitivity Analysis [37] (GSA) method, the moment independent sensitivity analysis method is selected to quantitatively analyze the influence of different parameters of the roundabout road design. According to the above, FFD is used to construct the response surface model of A point, B point and Pmax respectively, and the statistics of the response surface approximation model of each feature point can be obtained. The moment independent sensitivity analysis method is applied to the sensitivity analysis of key parameters of different roads at roundabouts through Python.
Where and are empirical unconditional cumulative distribution function and conditional cumulative distribution function respectively.
Then the sensitivity index of point A, point B and Pmax response surface model can be calculated:
The main geometric parameters affecting the internal pressure of the ring at the roundabout include the vehicle entrance angle , the number of lanes , and the outer ring radius , which are defined as the following unified form :
2.4.1. Sensitivity Analysis Results of Different Parameters at Point A
Based on the existing response surface approximation model of point A, the sensitivity analysis of different key parameters of the road is carried out by using the moment independent sensitivity analysis method, so as to obtain the quantitative influence degree of different parameters on the pressure of point A. The results of K-S statistical distribution and cumulative distribution function (CDF) of different parameters are shown in Figure 4.
Through Formula (13), the sensitivity index of different parameters of roundabout road design can be obtained. However, since the expected value is very sensitive to the extreme value of K-S, for some specific conditional values , the median is used as the summary statistic, supplemented by the maximum value [38]. The sensitivity index is shown in Table 5.
Based on the sensitivity indicators given in Figure 4 and Table 5, the following rules can be summarized:
(1) According to the relevant content of CDF, if the distance between the conditional CDF (gray solid line) and the unconditional CDF (red dotted line) is larger, or the conditional CDF is more dispersed around the unconditional cumulative distribution function , then this parameter has a greater impact on the output response. From the distribution results of CDF with different parameters in Figure 4 (d), (e) and (f), it can be found that the design parameters and of the roundabout road have a great influence on the pressure in the ring, and has the least influence on the pressure in the ring.
(2) According to the relevant content of the statistical sensitivity index, it can be concluded that the larger the value of the sensitivity index is, the greater the influence of the parameter on the response value is. According to the sensitivity index given in table 5, it can be seen that the design parameters and of the roundabout road have a great influence on the pressure in the ring, and has the least influence.
(3) In general, the order of the influence of different parameters on the pressure in the ring is : > > , that is, number of lanes> inlet angle> outer radius.
2.4.2. The Sensitivity Analysis Results of Different Parameters of B Point
Combining the second-order polynomial response surface approximation model of B point fitted by experimental design with sensitivity analysis method, the sensitivity analysis of different key parameters is carried out, so as to obtain the quantitative influence degree of different road geometric parameters on B point pressure. The statistical distribution of different parameters and the results of CDF are shown in Figure 5.
According to Formula (13), the sensitivity indexes of different parameters for point B pressure can be obtained. The specific values are shown in Table 6.
Based on the sensitivity index for different parameters of point B pressure given in Figure 5 and Table 6, the following rules can be summarized:
(1) From the distribution results of different parameters CDF in Figure 5 (d), (e) and (f), it can be found that for parameter , a significant deviation is observed between the conditional CDF and the unconditional CDF , indicating that has the most pronounced influence on the output response. Parameter also exhibits a moderate impact on the in-ring pressure.
(2) According to the K-S statistical sensitivity index of different parameters given in table 6, it can be seen that the value of sensitivity index is the largest, which indicates that the road design parameter has the greatest influence on the response output value.
(3) It is found that the influence of different road design parameters on the pressure of point B in the ring is sorted from large to small as follows: > > , that is, the number of lanes> outer radius> inlet angle.
2.4.3. Sensitivity Analysis Results of Different Parameters of Pmax
The sensitivity analysis of different parameters is also carried out. The sensitivity analysis of different key parameters is carried out by moment independent sensitivity analysis method combined with Pmax response surface approximation model. The statistical distribution and CDF results of different parameters are shown in Figure 6.
The sensitivity indexes of different parameters are shown in Table 7.
From the sensitivity index of different parameters listed in Figure 6 and Table 7, the following rules can be obtained:
(1) From the distribution results of different parameters CDF in Figure 6 (d), (e) and (f), it can be seen that the difference between the conditional CDF and the unconditional CDF of parameter is the largest, indicating that has the most significant influence on the output response. exhibits a secondary influence, while has the minimal impact.
(2) From the K-S statistical sensitivity index of different parameters given in Table 7, parameter shows the largest maximum and median values of the sensitivity index , further confirming its dominant effect on the target response.
(3) Based on the above conclusions, the quantified influence of parameters on the in-ring Pmax follows the order > > , corresponding to outer radius> number of lanes> inlet angle.
3. Road Parameter Optimization and Optimal Scheme Analysis of Roundabout
3.1. Multi-Objective Optimization Model and Approximate Model Construction
Multi-objective optimization can be understood as the process of optimizing multiple independent variables at the same time. The multi-objective optimization problem can be expressed as the following form:
Where is the -th design variable; is the -th objective function; is the -th constraint condition; is the -th constraint condition; and are the upper and lower limits of the -th variable range.
Due to the large difference in the flow field structure around each feature point area, the pressure at each point is also different. Therefore, starting from the principle of relieving the pressure in the ring to the greatest extent, the pressure minimization of feature points A, B and Pmax is taken as the optimization objective, and a multi-objective optimization mathematical model with different parameters under constraint conditions is established. The formula is as follows:
Where , and are used as the optimization variables, which represent the entrance angle, the number of lanes and the radius of the outer ring respectively.
In multi-objective optimization, an independent Kriging model can be constructed for each objective function to improve the efficiency of solving complex multi-objective problems. The Kriging model consists of a local deviation surrogate model and a global approximation surrogate model. The expression is as follows [39]:
Where is the variable of the Kriging model, is the regression model found according to the known function group dependent on , is the error of the random process, and its mean value is 0. The regression model can be calculated in the following ways:
Where is the regression coefficient, is the predetermined basis function, is the number of sample points in the training sample, is the unit column vector. In addition, the covariance between any two points is as follows:
Where is the variance of the random process, is an -dimensional symmetric positive-definite diagonal matrix, is the spatial correlation function between any two points and in the sample. The spatial correlation function is usually described by the Gaussian correlation function, as stipulated in engineering [40]:
Where is the number of optimization variables and is the correlation coefficient of the approximate model.
The Kriging model is used to fit the nonlinear characteristics of the pressure of each feature point. The inlet angle, the number of lanes and the radius of the outer ring of the roundabout are used as the independent variables of the Kriging approximation model. The sample matrix of the design sample space is selected by DOE, and then the response values of each feature point are obtained by numerical calculation. The Kriging surrogate model also uses a step-by-step approximation method to fit the sample point matrix, so there are also random errors. In order to ensure the accuracy of the Kriging approximation model, the error of the Kriging approximation model must be analyzed.
The error analysis of the Kriging surrogate model constructed by A point, B point and Pmax is carried out respectively. The values of the four error evaluation criteria of the Kriging surrogate model are shown in Table 8.
The values of ME, AE and RMSE of the Kriging surrogate model constructed by each feature point are relatively small, and the value of R2 is equal to 1. This shows that the accuracy of the constructed Kriging approximation model can meet the design requirements, so the Kriging approximation model selected in this study is feasible.
3.2. Road Parameters Optimization
In order to obtain the Pareto frontier optimal solution set with the minimum pressure of each feature point in the ring, the Kriging approximation model is used, and the multi-objective optimization of road design parameters is carried out with NSGA-II. The specific parameter settings of NSGA-II in the optimization process are shown in Table 9.
After multi-objective optimization using NSGA-II, a total of 100 Pareto front solutions are obtained, which constitute the optimal solution set of the pressure in the ring. The three-dimensional Pareto front cloud map composed of the optimal solution set obtained by the pressure optimization of each feature point is shown in Figure 7.
The dynamic balance mechanism of pressure in the ring is revealed by NSGA-II multi-objective collaborative optimization. Because the inlet angle, the number of lanes and the outer radius have directional conflicts with the pressure of each feature point, the Pareto frontier is irregularly distributed, and the optimal interval of comprehensive pressure drop needs to be determined by non-dominated sorting and crowding distance calculation. The enhanced Pareto front is visualized by blue highlight and white edge enhancement. In this paper, the “shortest distance method” standard is used to select a relatively optimal solution from the frontier solution set obtained by optimization. The calculation formula of the “shortest distance method” standard is as follows:
Where is the number of optimization objectives, is the value of the c-th Pareto solution of the -th optimization objective in the Pareto frontier optimization solution set, and is the distance between the selected Pareto frontier optimal solution and the origin.
In this paper, the pressure of point A in the optimized frontier solution set is-11253.86 Pa by the “shortest distance method” standard. B point pressure-21134.30 Pa ; the non-dominated solution of Pmax pressure 15488.49 Pa. The design variables of the road parameters of the roundabout corresponding to the above optimization results are : the inlet angle is 35.4°; the number of lanes is 5 lanes ; the outer radius is 65 m. The comparison of optimization results and simulation results is shown in Table 10.
Through numerical verification, the error between the genetic algorithm optimization solution set and the simulation results is within an acceptable range, which verifies the reliability of the Pareto front solution. It should be noted that the typical solution obtained in this study is based on the shortest distance method. In practical engineering, the optimization scheme can be dynamically selected in combination with multi-criteria decision-making. If the inlet congestion needs to be alleviated first, the solution set with the minimum pressure of feature point A can be selected, and then the changed parameters can be selected according to the actual situation.
3.3. Analysis of Optimal Scheme
The geometric model is established by using the optimization scheme obtained by the shortest distance method, and the numerical solution is based on the standard (2eqn) model. The pressure cloud diagram of the roundabout before and after optimization is shown in Figure 8.
Compared with the original roundabout, the pressure of each region of the optimized intersection is effectively alleviated. For the ① and ② regions in Figure 8, the significant pressure at the entrance of the roundabout is mainly due to the interlaced area formed by the incoming traffic flow and the circulating traffic flow in the roundabout, which leads to the discontinuity of the velocity field and induces the vehicle to slow down or even stop waiting. By adding the number of lanes, the degree of mutual interference between traffic flows can be effectively reduced. It is worth noting that the pressure field is characterized by a banded distribution with the red high pressure area as the core and wrapped by the yellow sub-high pressure area, rather than discrete node congestion. For regions ③ and ④ in Figure 8, the reason for the high pressure in the inner ring road is that the inner ring vehicles need to change lanes continuously to reach the exit, and frequent lane changes cause conflicts and deceleration. By increasing the number of lanes and the outer radius, the vehicle has enough time and space to complete the adjustment of speed and lane.
In summary, this scheme mainly increases the number of lanes from 4 to 5, and expands the outer radius from 50 m to 65 m, so that the weaving angle of the weaving area decreases, and the decrease of the weaving angle will reduce the lane-changing weaving conflict of the vehicle, thereby increasing the driving speed of the vehicle when merging and diverging to relieve the pressure. The pressure of quantitative index feature points A, B and Pmax is reduced by 34.1%, 38.3% and 20.7% respectively, which has a significant effect on alleviating congestion at intersections. The appropriate inlet angle also ensures the fluency of vehicle inflow and the balance of sight distance, avoiding conflicts caused by sharp turns or insufficient sight distance.
4. Conclusions
In this study, the sample matrix of the inlet angle, the number of lanes and the outer radius of the roundabout was constructed by CFD numerical simulation, and the response surface models of feature points A (entrance conflict zone), B (inner ring weaving zone) and Pmax (pressure extreme point in the ring) were established. The influence mechanism of parameters is revealed by single factor, interaction effect and global sensitivity analysis. Finally, the multi-objective optimization of road design parameters is carried out by NSGA-II with the pressure drop in the ring as the optimization objective. The main conclusions are as follows:
(1) The influence of independence and interaction of road design parameters on pressure. Under the influence of single factor, the increase of lane number significantly alleviates the pressure in the ring. The inlet angle is positively correlated with point A and Pmax pressure, and negatively correlated with point B. The increase of outer radius leads to the increase of point A pressure and the decrease of point B and Pmax. In the interaction effect, the influence of different parameters on the pressure of each point is obtained respectively. For example, the interaction between the inlet angle and the number of lanes has a significant effect on the pressure of point A, while the interaction between the inlet angle and the outer radius has a weak effect on point A. The nonlinear coupling mechanism between parameters is quantitatively revealed.
(2) There are regional differences in the sensitivity of road design parameters. By constructing the feature point response surface model and the moment independent global sensitivity analysis method, the influence weight of the design parameters of the roundabout on the pressure in the ring is quantitatively evaluated. According to the distribution of CDF and K-S statistical sensitivity index , the results show that for point A, the influence of different parameters on the pressure in the ring is ranked from large to small as number of lanes> inlet angle> outer radius. For point B, it is the number of lanes> outer radius> inlet angle. For Pmax, it is the outer radius> the number of lanes> inlet angle.
(3) The optimization scheme of road design parameters can effectively alleviate the pressure in the ring. By constructing the Kriging surrogate model of the roundabout and carrying out multi-objective collaborative optimization based on NSGA-II, the Pareto optimal solution set of the pressure of the feature points is obtained, that is, the combination scheme of road parameters to minimize the pressure in the ring. For example, the inlet angle is changed to 35.4°, the number of lanes is increased from 4 to 5, and the outer radius is widened from 50 m to 65 m. Compared with the original scheme, the pressure of feature points A, B and Pmax is reduced by 34.1%, 38.3% and 20.7% respectively, which significantly improves the traffic pressure at the roundabout.
Funding
This research received no external funding.
Data Availability Statement
The data presented in this study are available on request from the corresponding author.
Acknowledgments
Thanks for the financial support from KINGFAR INTERNATIONAL INC. (20230114479).
Conflicts of Interest
The authors declare no conflicts of interest.
References
- Zeng, J. W.; Qian, Y. S.; Wang, B. B.; Wang, T. J.; Wei, X. T. The impact of traffic crashes on urban network traffic flow. Sustainability 2019, 11, 3956. [Google Scholar] [CrossRef]
- Sun, X. T.; Ma, W. J.; Huang, W. Comparative study on the capacity of a signalised roundabout. IET Intell. Transp. Syst. 2016, 10, 175–185. [Google Scholar] [CrossRef]
- Guerrieri, M. A theoretical model for evaluating the impact of connected and autonomous vehicles on the operational performance of turbo roundabouts. International Journal of Transportation Science and Technology 2024, 14, 202–218. [Google Scholar] [CrossRef]
- Huang, Z. M.; Liu, H. C.; Shen, S. J.; Ma, J. Parallel optimization with hard safety constraints for cooperative planning of connected autonomous vehicles. In 2024 IEEE International Conference on Robotics and Automation (ICRA), Yokohama, Japan, 13-17 MAY 2024. [CrossRef]
- Yang, X. H.; Wang, F. J.; Bai, Z. Q.; Xun, F. F.; Zhang, Y. L.; Zhao, X. Y. Deep learning-based congestion detection at urban intersections. Sensors 2021, 21, 2052. [Google Scholar] [CrossRef]
- Cao, D. F.; Liu, Z. D.; Hu, C. Y.; Ding, N. The Design of Vehicle Profile Based on Multivehicle Collaboration for Autonomous Vehicles in Roundabouts. Security and Communication Networks 2023, 1, 1416999. [Google Scholar] [CrossRef]
- Martin-Gasulla, M.; Elefteriadou, L. Traffic management with autonomous and connected vehicles at single-lane roundabouts. Transportation research part C: Emerging technologies 2021, 125, 102964. [Google Scholar] [CrossRef]
- Azimian, A.; Catalina Ortega, C. A.; Espinosa, J. M.; Mariscal, M. Á.; García-Herrero, S. Analysis of drivers’ eye movements on roundabouts: A driving simulator study. Sustainability 2021, 13, 7463. [Google Scholar] [CrossRef]
- Tarhuni, F.; Mahat, R.; Eltwati, A.; Eldofani, M.; Albarki, A. Turbo-Roundabouts as a Tool for Enhancing Urban Efficiency and Safety: A Case Study. Journal of Advanced Research in Applied Sciences and Engineering Technology, 2024, 34, 279–288. [Google Scholar] [CrossRef]
- Jiang, Z. H.; Wang, T.; Li, C. Y.; Pan, F.; Yang, X. G. Investigation on two-stop-line signalized round about: Capacity and optimal cycle length. Journal of Advanced Transportation 2019, 1, 1–9. [Google Scholar] [CrossRef]
- Assolie, A. A.; Sukor, N. S. A.; Khliefat, I.; Abd Manan, T. S. B. Modeling of Queue Detector Location at Signalized Roundabouts via VISSIM Micro-Simulation Software in Amman City, Jordan. Sustainability 2023, 15, 8451. [Google Scholar] [CrossRef]
- Tian, Z. Z.; Troutbeck, R.; Kyte, M.; Brilon, W.; Vandehey, M. A. R. K.; Kittelson, W.; Robinson, B. (2000, June). In A further investigation on critical gap and follow-up time. In Proceedings of the 4th International Symposium on Highway Capacity, Maui, Hawaii, 27 JUNE 2000. [Google Scholar]
- Murphy, T. The Turbo Roundabout: A First in North America. In TAC 2015: Getting You There Safely-2015 Conference and Exhibition of the Transportation Association of Canada//ATC: Destination sé curité routiè re-2015 Congrè s et Exposition de l'Association des transports du Canada. Ottawa, Canada. 2015.
- Vasconcelos, L. , Seco, Á., & Silva, A. B. Comparison of procedures to estimate critical headways at roundabouts. Promet–Traffic&Transportation 2013, 25, 43–53. [Google Scholar] [CrossRef]
- Ma, W. J.; Liu, Y.; Head, L.; Yang, X. G. Integrated optimization of lane markings and timings for signalized roundabouts. Transportation research part C: Emerging technologies, 2013, 36, 307-323. [CrossRef]
- Mauro, R.; Cattani, M. Functional and economic evaluations for choosing road intersection layout. PROMET-Traffic&Transportation, 2012, 24, 441-448. [CrossRef]
- Tollazzi, T.; Tesoriere, G.; Guerrieri, M.; Campisi, T. Environmental, functional and economic criteria for comparing “target roundabouts” with one-or two-level roundabout intersections. Transportation research part D: Transport and environment, 2015, 34, 330-344. [CrossRef]
- He, Q. H.; Meng, Y. Y.; Tan, W.; Tian, X.; Liu, S. R; Yang, H.; Shao, Y.; Pan, B. H. Analyzing the relationship between the efficiency and safety of a turbo roundabout by the factor analysis method. Heliyon, 2024, 10. [Google Scholar] [CrossRef] [PubMed]
- Tollazzi, T.; Tesoriere, G.; Guerrieri, M.; Campisi, T. Environmental, functional and economic criteria for comparing “target roundabouts” with one-or two-level roundabout intersections. Transportation research part D: Transport and environment 2015, 34, 330–344. [Google Scholar] [CrossRef]
- Guerrieri, M.; Corriere, F.; Casto, B. L.; Rizzo, G. A model for evaluating the environmental and functional benefits of “innovative” roundabouts. Transportation Research Part D: Transport and Environment 2015, 39, 1–16. [Google Scholar] [CrossRef]
- Corriere, F.; Guerrieri, M.; Ticali, D.; Messineo, A. Estimation of air pollutant emissions in Flower roundabouts and in conventional roundabouts. Archives of Civil Engineering 2013, 229–246. [Google Scholar] [CrossRef]
- Guerrieri, M.; Khanmohamadi, M. A multi-objective method for large multi-lane roundabout design through microscopic traffic simulation and SSAM analysis. Sustainable Futures 2024, 8, 100313. [Google Scholar] [CrossRef]
- Zakeri, S.; Choupani, A. A.; Shaaban, K. Assessing the Traffic Management of Three Cost-Effective Roundabout Designs: Flower, Hamburger, and Flower-Hamburger. International Journal of Civil Engineering 2025, 23, 1–15. [Google Scholar] [CrossRef]
- Ahac, S.; Ahac, M.; Majstorović, I.; Bašić, S. Speed reduction capabilities of two-geometry roundabouts. Applied Sciences 2023, 13, 11816. [Google Scholar] [CrossRef]
- Sołowczuk, A. B.; Benedysiuk, W. Design of Turbo-Roundabouts Based on the Rules of Vehicle Movement Geometry on Curvilinear Approaches. Sustainability 2023, 15, 13882. [Google Scholar] [CrossRef]
- Džambas, T.; Ahac, S.; Dragčević, V. Design of turbo roundabouts based on the rules of vehicle movement geometry. Journal of transportation engineering 2016, 142, 05016004. [Google Scholar] [CrossRef]
- Lighthill, M.J.; Whitham, G.B. On kinematic waves I. Flood movement in long rivers. Proc. R. Soc. London. Ser. A. Math. Phys. Sci. 1955, 229, 281–316. [Google Scholar] [CrossRef]
- Richards, P.I. Shock waves on the highway. Oper. Res. 1956, 4, 42–51. [Google Scholar] [CrossRef]
- Li, J.; Xiong, L.; Peng, S. Dynamic model of mixed traffic flow. Wuhan Univ. Technol. 2006, 2, 362–364. [Google Scholar]
- Xiong, L.; Wang, Y.; Li, J. Theory, model and application of traffic flow dynamics. Harbin Inst. Technol. 2006, 5, 732–734. [Google Scholar]
- Xiong, L.; Liu, H. Calibration of the relationship model between mixed traffic flow parameters. Wuhan Univ. Technol. 2008, 03, 561–564. [Google Scholar]
- Sun, D.; Lv, J.; Waller, S.T. In-depth analysis of traffic congestion using computational fluid dynamics (CFD) modeling method. Mod. Transp. 2011, 19, 58–67. [Google Scholar] [CrossRef]
- Hatem, M.K.; Qasim, G.J. Simulation Traffic Flow in Urban Arterial Streets Using CFD (Army Canal Street as a Case Study). IOP Conf. Ser. Mater. Sci. Eng. 2021, 1105, 012105. [Google Scholar] [CrossRef]
- Dong, S. H.; Zhang, H. Y.; Li, S. Q.; Jia, N.; He, N. A Study on Urban Traffic Congestion Pressure Based on CFD. Sustainability 2024, 16, 10911. [Google Scholar] [CrossRef]
- Li, F. Research on resistance increasing mechanism and parameter optimization of brake plate in streamlined area of high-speed train. Doctor’s Thesis, Central South University, Hunan,China,2022.
- Pilko, H.; Mandžuka, S.; Barić, D. Urban single-lane roundabouts: A new analytical approach using multi-criteria and simultaneous multi-objective optimization of geometry design, efficiency and safety. Transportation Research Part C: Emerging Technologies 2017, 80, 257–271. [Google Scholar] [CrossRef]
- Plischke, E.; Borgonovo, E.; Smith, C. L. Global sensitivity measures from given data. European Journal of Operational Research 2013, 226, 536–550. [Google Scholar] [CrossRef]
- Liu, H. B.; Chen, W.; Sudjianto, A. Relative entropy based method for probabilistic sensitivity analysis in engineering design. Journal of Mechanical Design 2006, 128, 326–336. [Google Scholar] [CrossRef]
- Jia, G.; Taflanidis, A. A. Kriging metamodeling for approximation of high-dimensional wave and surge responses in real-time storm/hurricane risk assessment. Computer Methods in Applied Mechanics and Engineering 2013, 261, 24–38. [Google Scholar] [CrossRef]
- Zeng, W.; Yang, Y.; Xie, H.; Tong, L. J. CF-Kriging surrogate model based on the combination forecasting method. Proceedings of the Institution of Mechanical Engineers, Part C: Journal of Mechanical Engineering Science 2016, 230, 3274–3284. [Google Scholar] [CrossRef]
41. Disclaimer/Publisher’s Note: The statements, opinions and data contained in all publications are solely those of the individual author(s) and contributor(s) and not of MDPI and/or the editor(s). MDPI and/or the editor(s) disclaim responsibility for any injury to people or property resulting from any ideas, methods, instructions or products referred to in the content. |
Figure 1.
Calculation model and feature point diagram.
Figure 2.
Influence of road design parameters on pressure at feature points.
Figure 3.
Interactive effects of road design parameters on pressure at feature points.
Figure 4.
Sensitivity analysis results of parameter effects on pressure at point A.
Figure 5.
Sensitivity analysis results of parameter effects on pressure at point B.
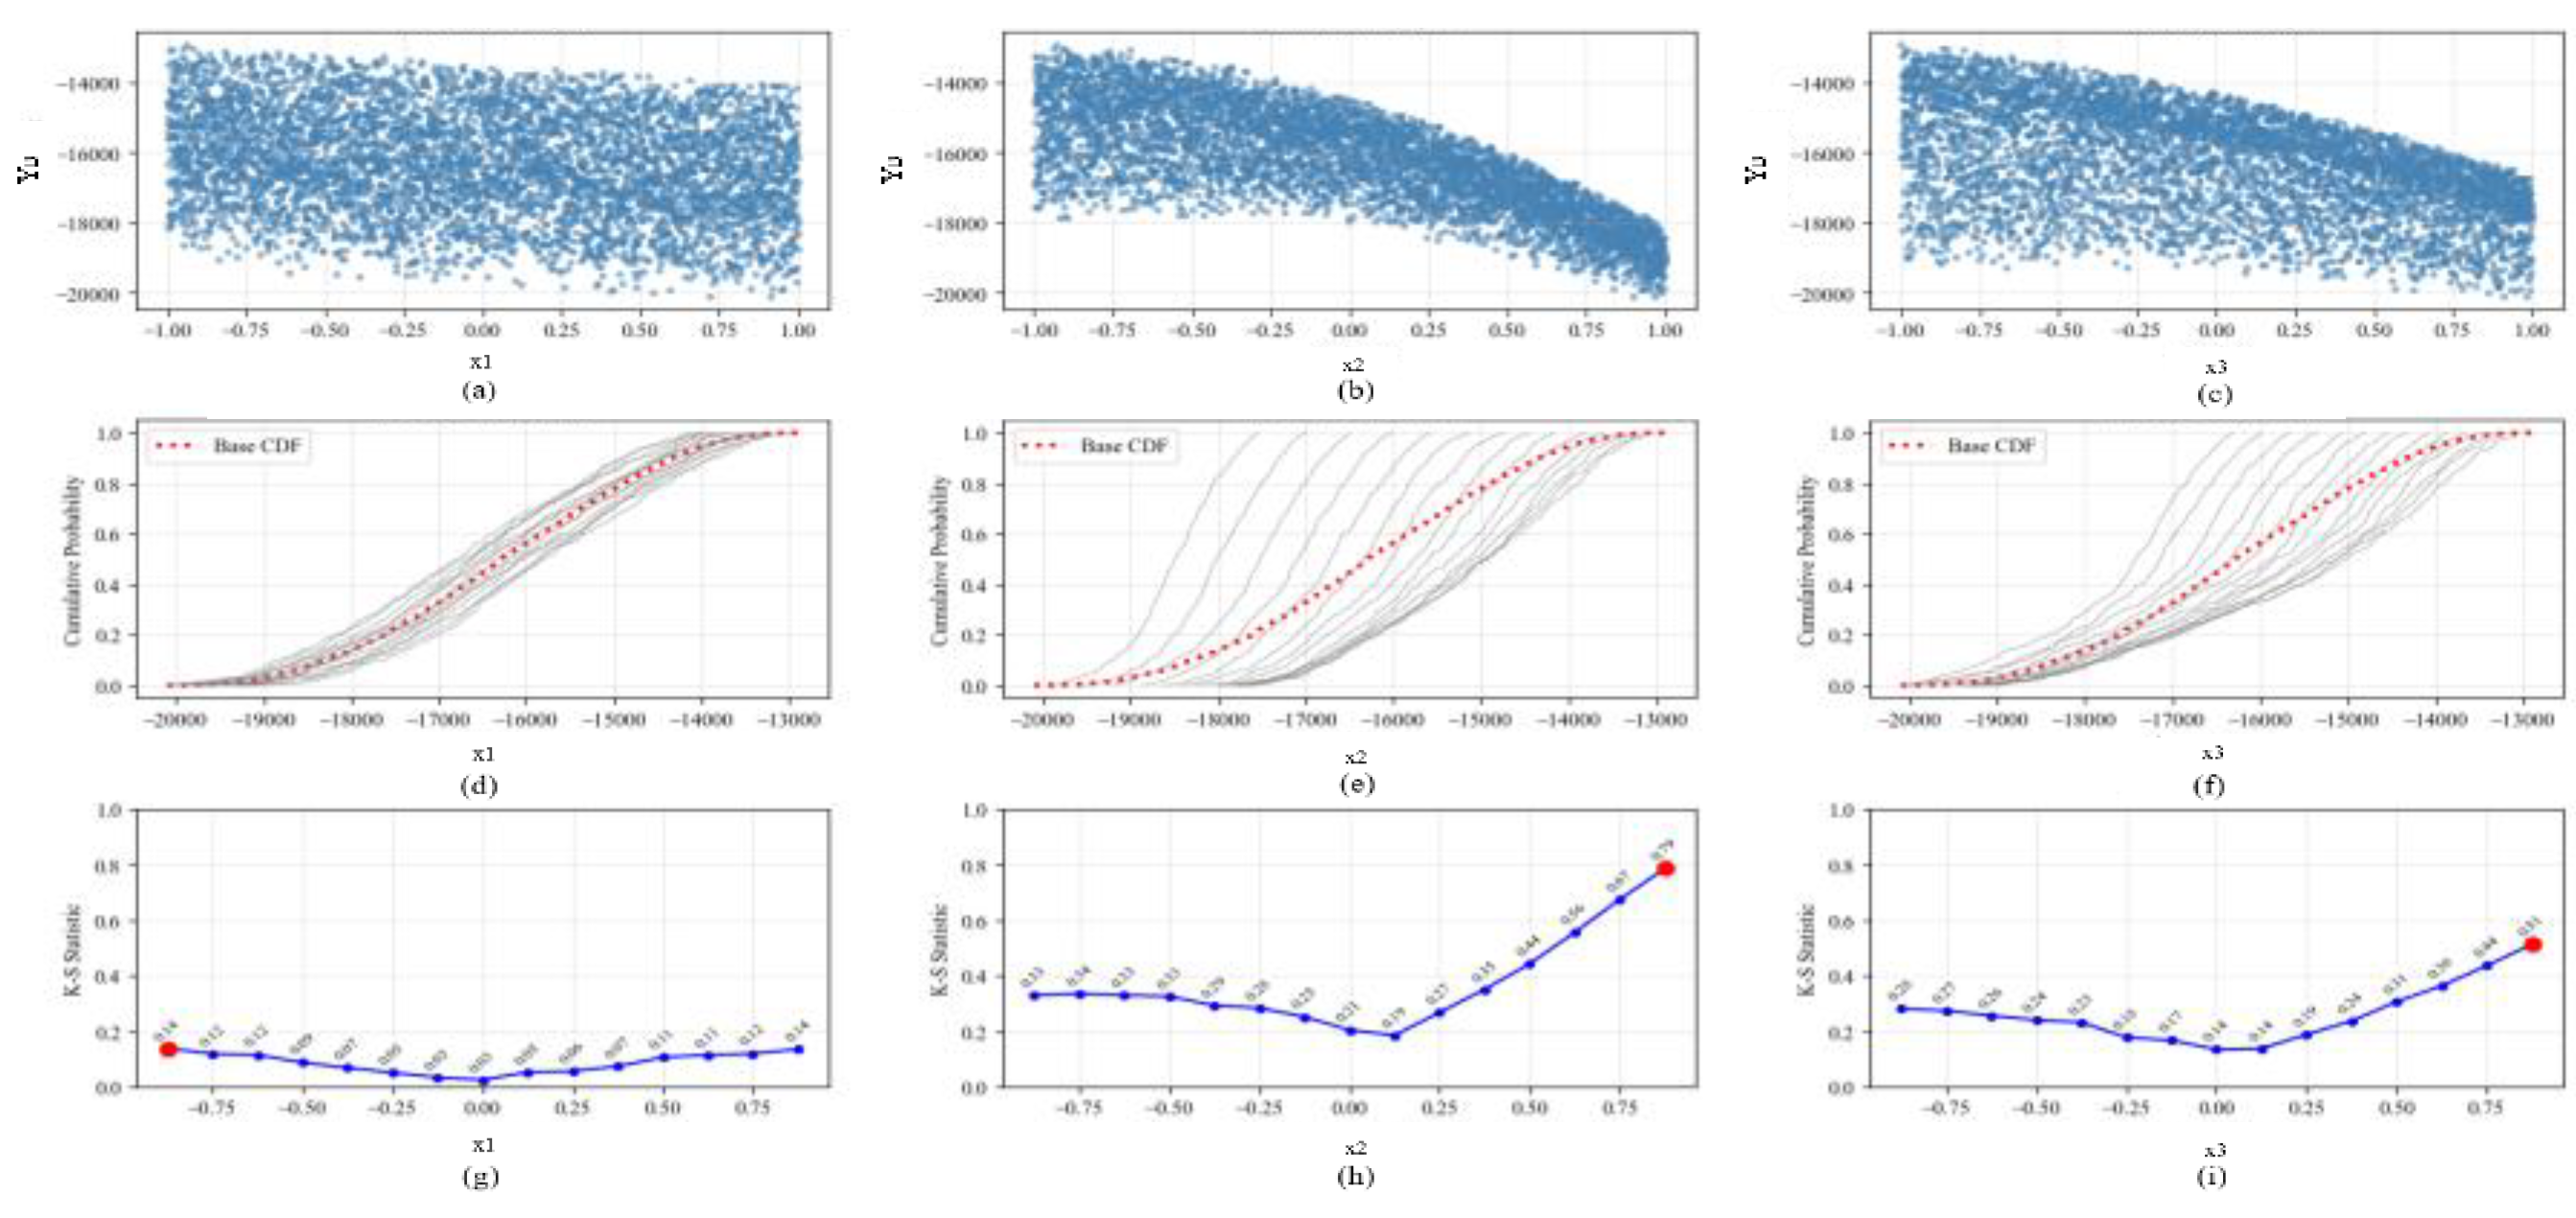
Figure 6.
Sensitivity analysis results of parameter effects on pressure at point Pmax.
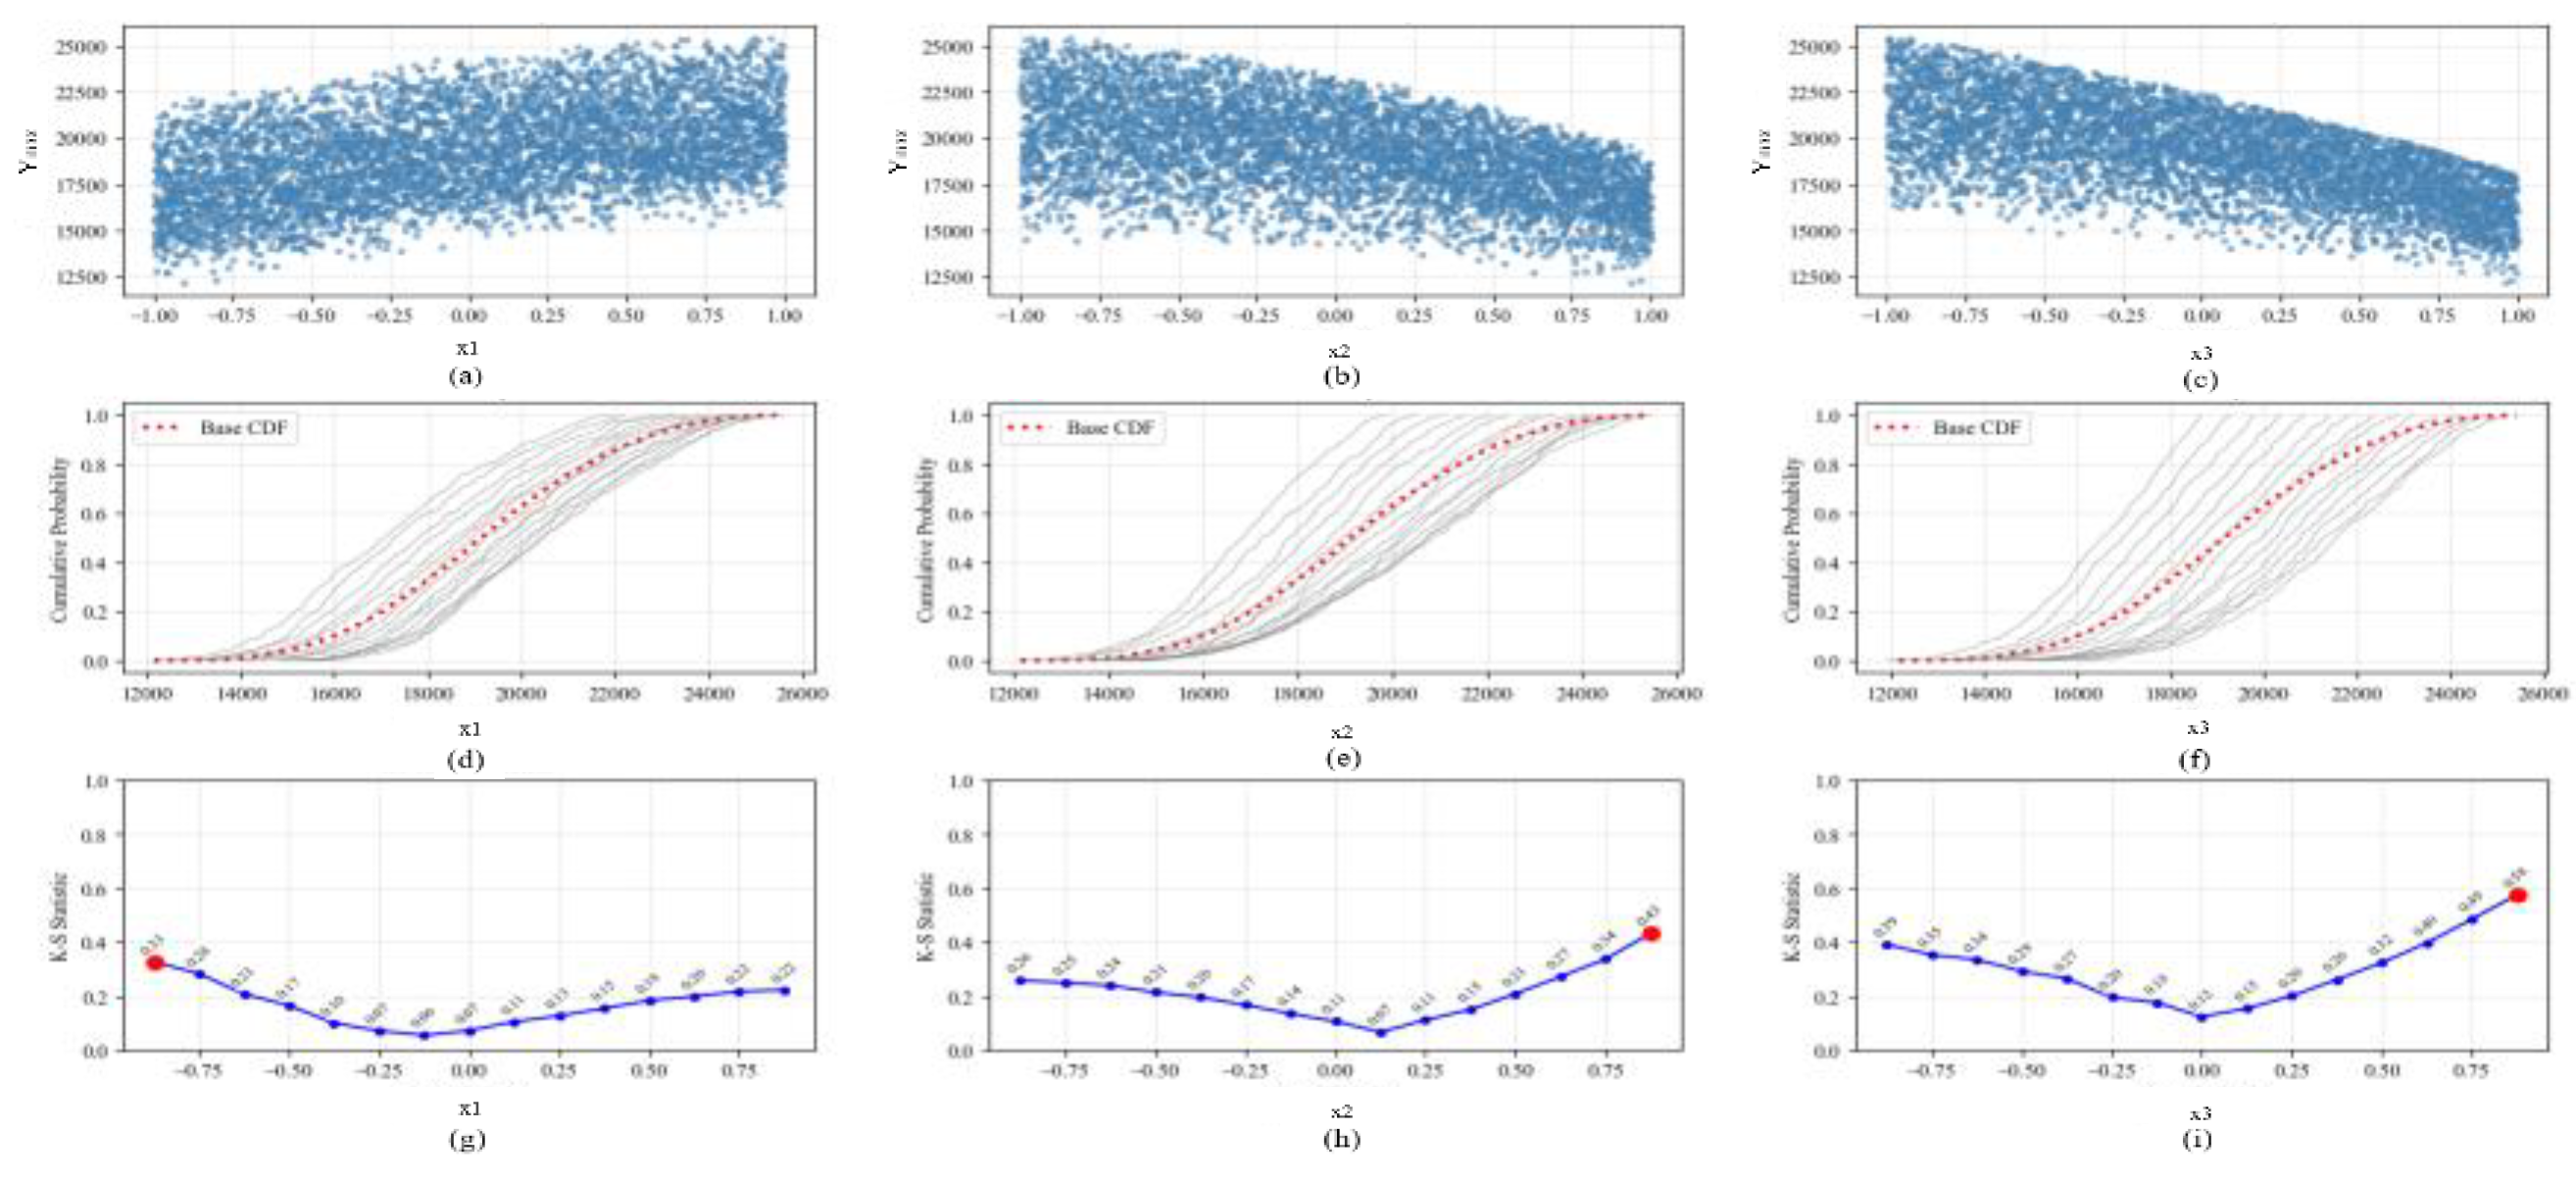
Figure 7.
Pressure optimization results at points A, B, and Pmax.
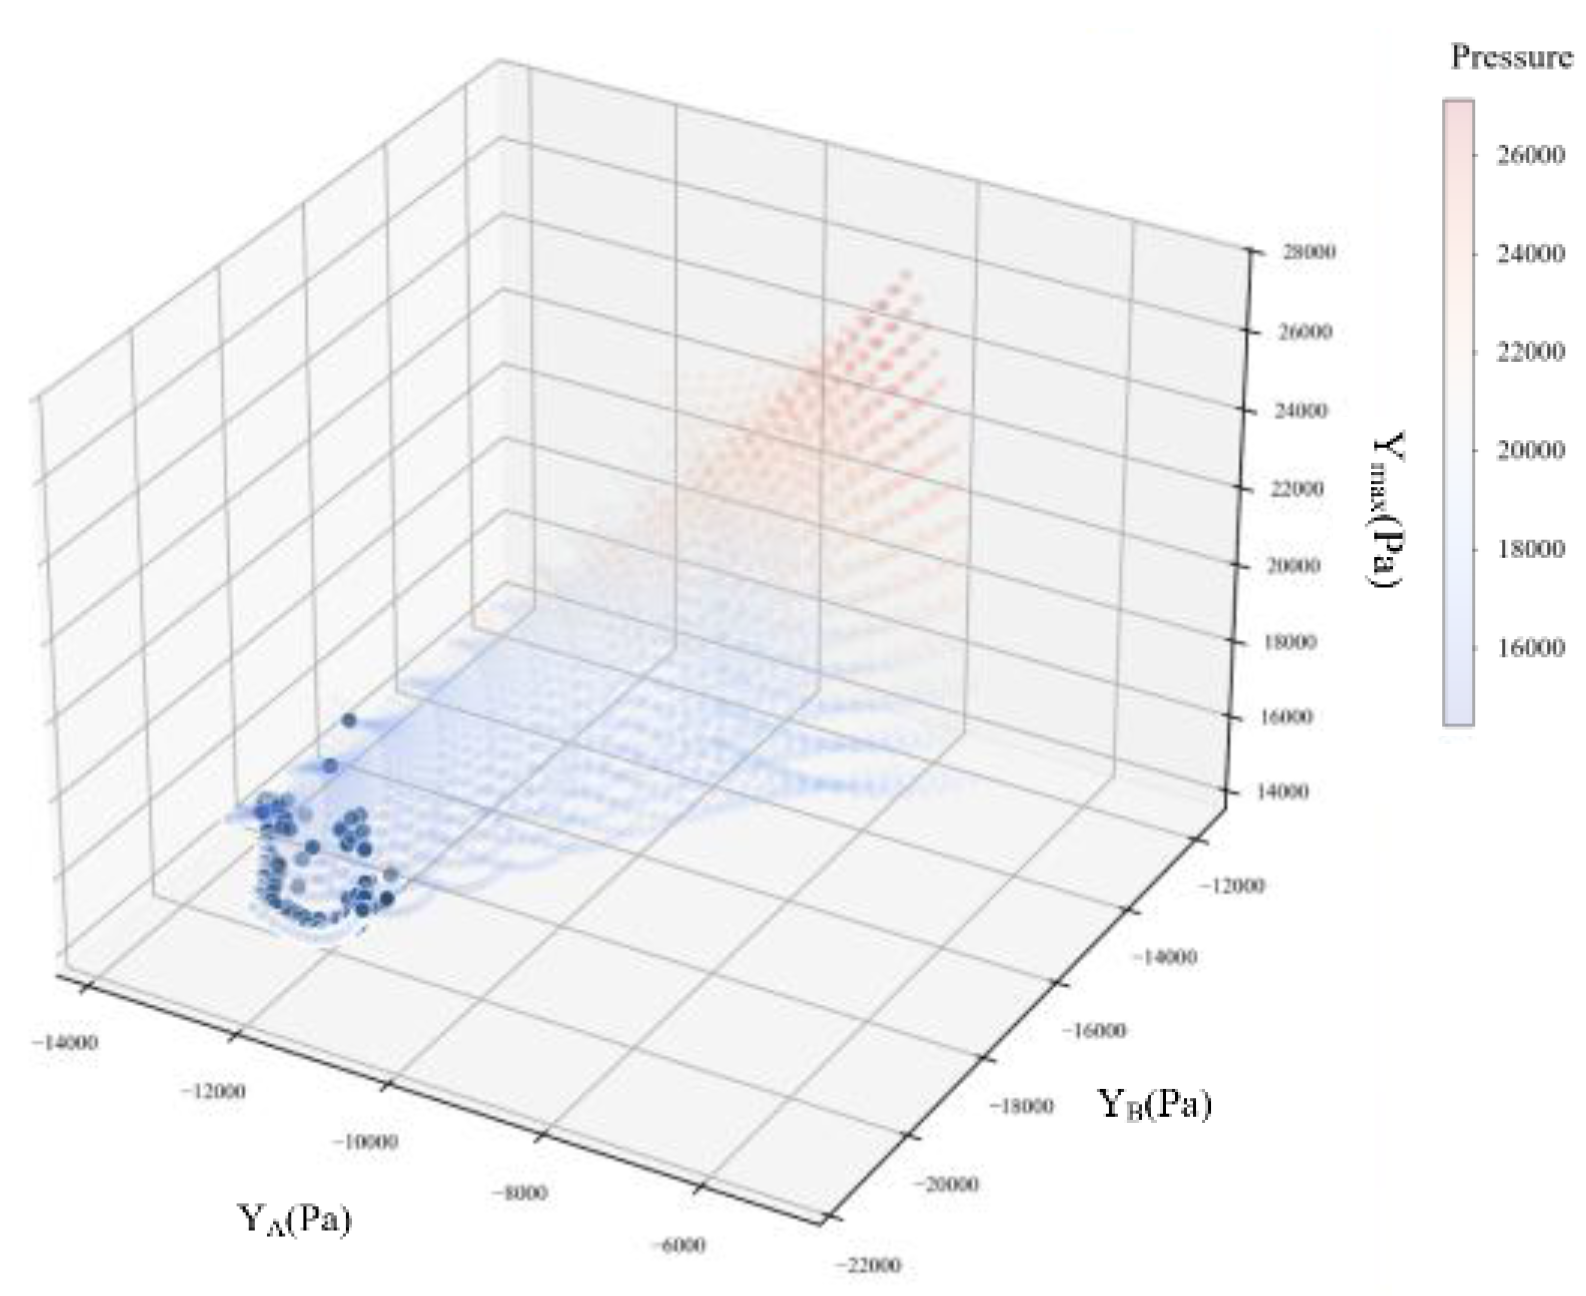
Figure 8.
Comparison of original and optimized pressure cloud.
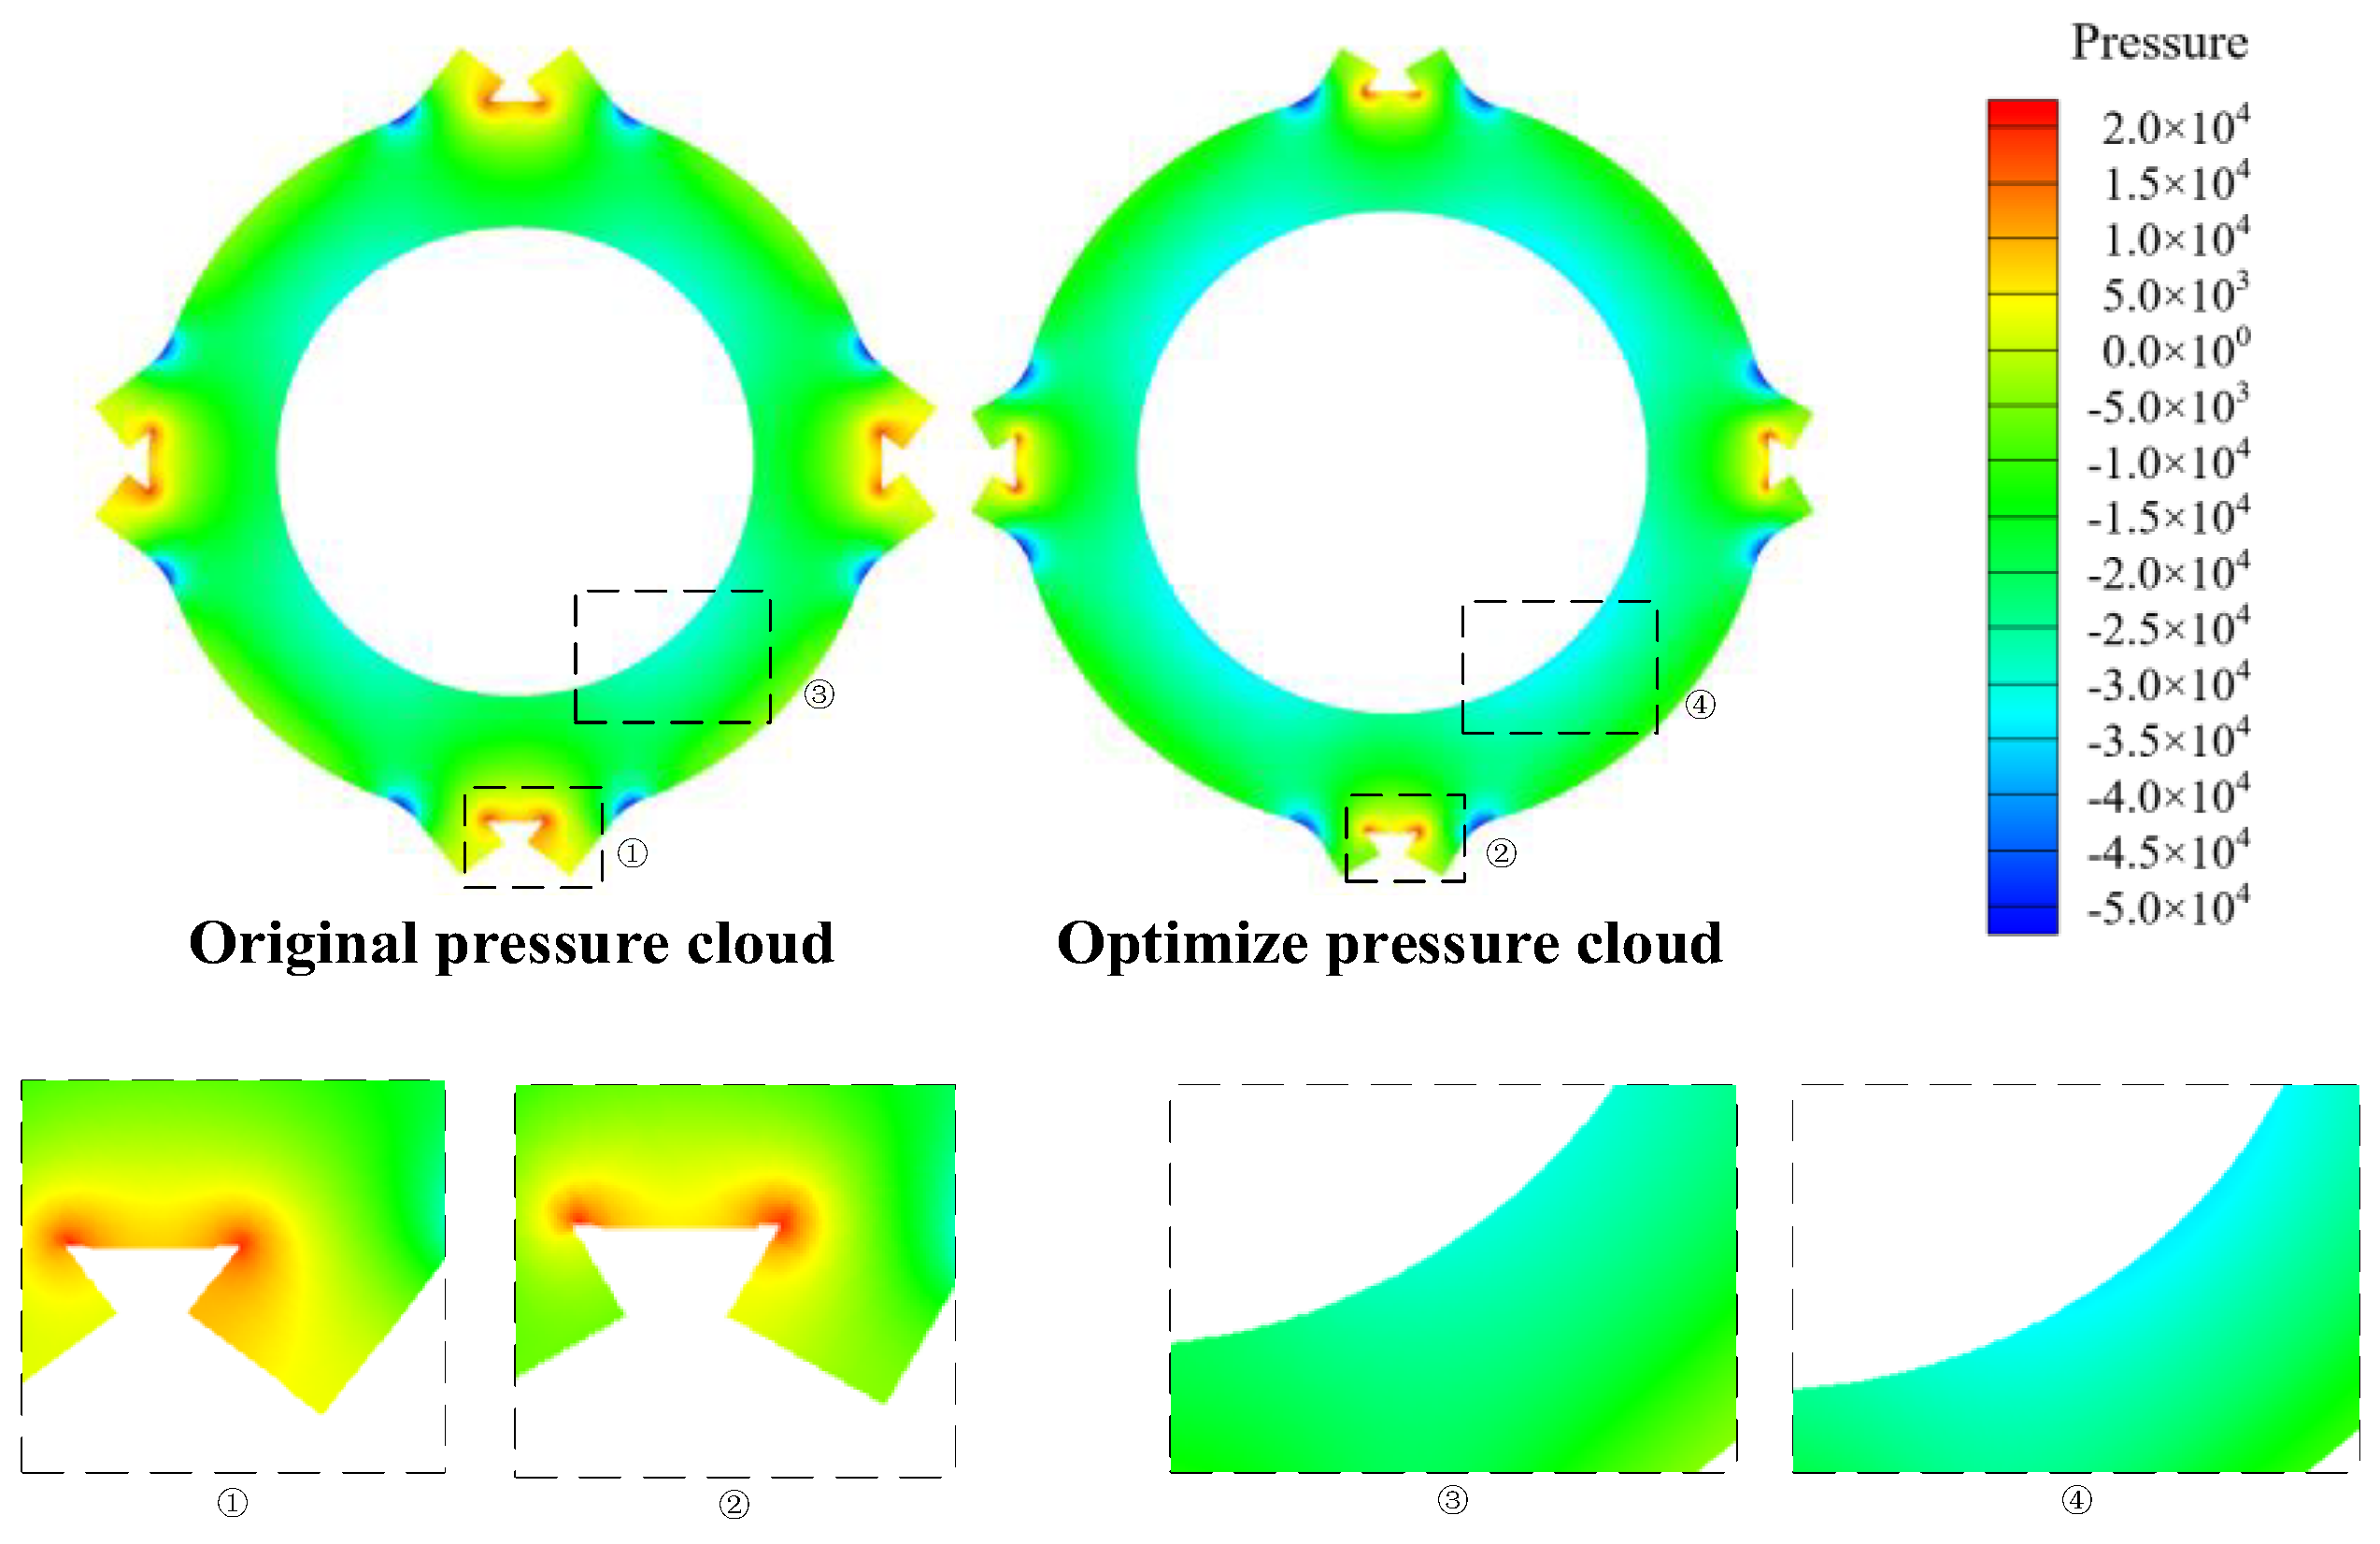

Table 1.
Variation ranges of roundabout design parameters.
| Parameter | Inlet Angle | Number of Lanes | Outer Radius |
|---|---|---|---|
| Minimum | 15° | 2 | 42.5m |
| Maximum | 45° | 5 | 65m |
Table 2.
FFD matrix and response values.
| NO. | Inlet Angle(°) | Number of Lanes | Outer Radius(m) | Point A Pressure(Pa) | Point B Pressure(Pa) | Point Pmax Pressure(Pa) |
|---|---|---|---|---|---|---|
| 1 | 15 | 2 | 42.5 | -7882.5 | -11833.1 | 15571.6 |
| 2 | 15 | 3 | 42.5 | -10104 | -21082.8 | 14383.2 |
| 3 | 15 | 4 | 42.5 | -12274 | -23143 | 15966.3 |
| 4 | 15 | 5 | 42.5 | -15309.7 | -28458.1 | 14991.7 |
| 5 | 15 | 2 | 50 | -9933.3 | -11500.1 | 22138.3 |
| …… | ||||||
| 108 | 45 | 5 | 57.5 | -10180.1 | -20688.1 | 23993.1 |
| 109 | 45 | 2 | 65 | -3111.9 | -5998.8 | 26981.3 |
| 110 | 45 | 3 | 65 | -6838.81 | -7233.62 | 28432.2 |
| 111 | 45 | 4 | 65 | -10339.9 | -14334.3 | 27489.2 |
| 112 | 45 | 5 | 65 | -14736.7 | -16732.3 | 27583.6 |
Table 3.
Analysis of p-values for the response surface surrogate model.
| Fitting Term | |||||||||
|---|---|---|---|---|---|---|---|---|---|
| Point A | 0.012 | 0.001 | 0.021 | 0.009 | 0.003 | 0.188 | 0.037 | 0.054 | 0.047 |
| Point B | 0.027 | 0.001 | 0.018 | 0.162 | 0.001 | 0.047 | 0.084 | 0.091 | 0.023 |
| Point Pmax | 0.008 | 0.001 | 0.010 | 0.042 | 0.001 | 0.034 | 0.052 | 0.028 | 0.019 |
Table 4.
Error analysis of the response surface surrogate model.
| Target Response | Order | AE | ME | RMSE | R2 |
|---|---|---|---|---|---|
| Point A | 1 | 1176.49 | 4235.19 | 1586.03 | 0.712 |
| 2 | 892.35 | 2963.93 | 1244.71 | 0.884 | |
| 3 | 745.87 | 2624.45 | 997.30 | 0.891 | |
| Point B | 1 | 2457.88 | 8912.37 | 3880.19 | 0.653 |
| 2 | 1542.70 | 6210.57 | 2654.35 | 0.852 | |
| 3 | 1321.42 | 5347.86 | 2216.23 | 0.867 | |
| Point Pmax | 1 | 1623.53 | 5874.29 | 2649.61 | 0.785 |
| 2 | 1085.75 | 4123.84 | 1483.42 | 0.897 | |
| 3 | 942.86 | 3752.12 | 1297.57 | 0.913 |
Table 5.
Sensitivity Indices of Parameter Effects on Pressure at Point A.
| Median | 0.22 | 0.30 | 0.13 |
| Maximum | 0.39 | 0.66 | 0.21 |
Table 6.
Sensitivity Indices of Parameter Effects on Pressure at Point B.
| Median | 0.09 | 0.33 | 0.24 |
| Maximum | 0.14 | 0.79 | 0.51 |
Table 7.
Sensitivity Indices of Parameter Effects on Pressure at Point Pmax.
| Median | 0.17 | 0.21 | 0.29 |
| Maximum | 0.33 | 0.43 | 0.58 |
Table 8.
Error Analysis of the Kriging Model.
| Target Response | AE | ME | RMSE | R2 |
|---|---|---|---|---|
| Point A | <0.001 | <0.001 | <0.001 | 1 |
| Point B | <0.001 | <0.001 | <0.001 | 1 |
| Point Pmax | <0.001 | <0.001 | <0.001 | 1 |
Table 9.
Parameter Settings for the NSGA-II Genetic Algorithm.
| Parameter | Value |
|---|---|
| Population size | 100 |
| Number of generations | 100 |
| Crossover probability | 0.9 |
| Crossover distribution index | 15 |
| Mutation distribution index | 20 |
Table 10.
Comparison of optimization and simulation results.
| Target Variable | Simulation Value (Pa) | Optimized Value (Pa) | Relative Error (%) |
|---|---|---|---|
| -11940.15 | -11253.86 | 5.74 | |
| -20281.52 | -21134.30 | 4.20 | |
| 16748.34 | 15488.49 | 7.52 |
Disclaimer/Publisher’s Note: The statements, opinions and data contained in all publications are solely those of the individual author(s) and contributor(s) and not of MDPI and/or the editor(s). MDPI and/or the editor(s) disclaim responsibility for any injury to people or property resulting from any ideas, methods, instructions or products referred to in the content. |
© 2025 by the authors. Licensee MDPI, Basel, Switzerland. This article is an open access article distributed under the terms and conditions of the Creative Commons Attribution (CC BY) license (http://creativecommons.org/licenses/by/4.0/).
Copyright: This open access article is published under a Creative Commons CC BY 4.0 license, which permit the free download, distribution, and reuse, provided that the author and preprint are cited in any reuse.


