
Submitted:
08 February 2026
Posted:
09 February 2026
You are already at the latest version
Abstract
The exploitation in new materials of even the smallest scraps of textiles would contribute to their success in fields, such as the automotive industry. In this work, alkaline treatment with low tenors of sodium hydroxide (NaOH) was applied on flax and hemp fabric textile residues, trying to recover the most suitable process conditions as the function of the quality of treated fibres. Several parameters have been considered, the temperature and the concentration of the alkaline solution, the immersion time in it, and finally the immersion time in distilled water during the neutralization phase. Drying tests were carried out at a controlled temperature to verify the effects of the various treatment parameters. The effect of the various procedures was elucidated by thermogravimetric analysis (TGA), scanning electron microscopy (SEM), X-ray diffraction (XRD) so to measure crystallinity, atomic force microscopy (AFM) to elucidate the variation of roughness, and nitrogen absorption/desorption cycles to how microporosities develop with treatment. It is suggested that only the 1.5 wt./vol.% treatment did produce some worthwhile modification of the fibres to prepare them for their use in composites, more evidently in flax than in hemp, though care needs to be taken about fibre embrittlement and potential permeability to water.
Keywords:
alkali treatment
; hemp fibres
; flax fibres
; thermal properties
; crystallinity
; porosity
; tensile properties
1. Introduction
In the automotive sector, the use of lignocellulosic fibres is being widely investigated to be used in a number of components with various functions in the vehicle, normally as the reinforcement for a polymer matrix, for applications such as interior panels, arm rests, covers, and other inserts [1]. Several reviews do exist, over the last two decades at least, to substantiate their interest and effectiveness, as renewable materials, in car production [2,3,4]. Most recent studies concentrated on singling out which parts of the vehicle can be prospectively manufactured using these materials, in competition with extracted cellulose, therefore adapting them to the purpose by selecting and compatibilising the fibres, as required [5,6,7].
An important drive for this application is that polymer composites reinforced with lignocellulosic fibres are substantially lighter than fiberglass and, in most cases, also of carbon fibre composites. Beyond that, these fibres represent a renewable filler that can also be employed as a by-product if not a secondary raw material from other sectors, such as textiles, an occurrence that provides significant quality at no added cost [8].
Plant fibres from a large number of species have been proposed for automotive applications, such as it is the case for kenaf [9], pineapple [10], date palm [11], bamboo [12], sisal [13], banana [14], abaca [15], jute [16], nettle [17], etc. In the European context, hemp and flax have proven to be the most viable and available fibres for potential application in the automotive sector [18,19]. A circular economy approach does also suggest employing fibres that find application also in other sectors, such as most typically textile and construction, and the relevant scraps might therefore offer a good service in parts with cumbersome and irregular sections, even being used as fillers [20,21].
In general terms, to improve the compatibility of the fibres with the polymer matrix, surface modification processes are used that lead to a reduction in the hydrophilicity of the fibres and their geometrical regularization [22]. Despite a number of chemical modification processes having been proposed, from an industrial point of view, treatment with an alkaline solution, defined as alkalization or mercerization, is one of the simplest and cheapest methods [23,24,25]. The application of a widely available and easily neutralizable chemical, such as sodium hydroxide, acts on the purification of cellulose in the fibre, removing loose and non-structural material from it [26,27,28]. In practical terms, this proved to be effective in increasing the amount of alpha-cellulose in the treated fibers [29].
Alkaline treatment extracts the secondary components of the fibres, mainly hemicellulose, a very hygroscopic oligosaccharide, and lignin, a polymer consisting of various aromatic alcoholic monomers. Other components that influence the properties of plant fibres, such as pectin, tannins and waxes, are present in much smaller proportions, forming the amorphous matrix in lignocellulosic fibres, linked to the cellulose via ester and ether bonds, but also via secondary interactions such as hydrogen bonds [30]. During alkaline hydrolysis, these bonds are broken in order to extract and dissolve the components of the matrix [31].
Immediately after the alkaline treatment, the fibres must be treated with a bath in distilled water to remove the excess of NaOH from the fibres’ surface [32]. In this way, hygroscopicity is reduced thanks to the elimination of very hydrophilic components such as hemicellulose and thanks to the use of the hydroxyl groups of cellulose, which are no longer available for interaction with the water in the external environment. The fibres should have better mechanical properties due to the structural realignment of the cellulose chains. Moreover, the compatibility with polymeric matrices should be improved due to the elimination of very hydrophilic components such as hemicellulose and the increase of the surface roughness of the fibres, which improves the adhesion and mechanical interlocking between the two materials during the polymerisation phase [33]. However, it needs also to be pointed out that an excessive alkalinization can produce mechanical damage, especially fibrillation, in the fibres, especially if already worn out by previous working, such as it is the case for scraps: this will increase their brittleness and possibly inducing sudden failure, especially by fibrillation [34].
In this work, different combinations of parameters for the alkaline treatment of scraps from two specific cultivars of flax and hemp of European origin were studied. In particular, the factors considered were: (i) the temperature at which the treatment in alkaline solution takes place, (ii) the concentration of sodium hydroxide (NaOH) solutions; (ii) the immersion time of the fibres in the alkaline solution, which is also related with (iv) the time of subsequent neutralization of the fibres in distilled water. Since these processes will later be used in industry, the use of low NaOH concentrations, not exceeding 1.5% w/v, was examined to limit the disposal costs for the alkaline broths. The immersion time was minimised as much as possible, thinking to achieve most effect by the temperature increase of the solution. Various low tenor alkaline treatments on hemp and flax fibres were therefore examined, evaluating the mass loss obtained and measuring the thermal properties using thermogravimetric analysis (TGA), comparing the various morphological patterns of the fibres surfaces and studying their roughness profile via the analysis of atomic force microscopy (AFM) parameters. The latter methodology provides data able to evaluate the potential increase of compatibility of lignocellulosic fibres on polymer matrices as the effect of chemical treatment [35].
2. Materials and Methods
2.1. Materials and Treatment
HP Composites S.p.A. supplied scraps of untreated plain textile weave materials from hemp and flax fabrics, as residues from composites’ production, both with a surface weight of 200 g/m2. The fibres had been originally obtained from the Futura cultivar from Italy, and from the Oliver-Viking crossing cultivar, in France, for hemp and flax, respectively (Figure 1).
The flax and hemp fabrics scraps were cut into 70 mm side squares, and the resulting samples were dried in an oven at 80 °C for 24 hours. They were weighed using an analytical balance and the masses of the samples were all in the range of 1.5 to 2 grams. Alkali treatment was carried out by immersing each sample in 50 ml of a basic solution in sealed vials. The samples were treated using the process controlling in detail four parameters: concentration of the alkaline solution, temperature at which the treatment takes place, exposure time to treatment, time of immersion in distilled water. Both fibres were treated with alkaline solution NaOH concentrations, 0.5, 1 and 1.5% m/v. The solutions were kept at three different temperatures, namely 25, 60 and 80 °C, with different exposure times were carried out for each alkali concentration: 30, 90 and 150 minutes.
Finally, each treated sample was immersed in a bath of distilled water for 90 minutes (the water was changed every 30 minutes) to control the pH, which must be neutral at the beginning. The fibres were subsequently dried all night at 80 °C in the oven and finally weighed to check the residual mass.
For the alkaline treatments, 98% purity NaOH tablets and distilled water were used to prepare the alkaline solutions. The fibre treatments were carried out in a ventilated oven at a controlled temperature. To prepare the samples for subsequent characterizations, the fibres were finely pulverized using the Vibromill MV-400.
For comparison, pure microcrystalline cellulose powder (20 micrometres diameter) was also purchased from Sigma-Aldrich.
2.2. Characterization Methods
Infrared spectra of hemp and flax fibres as received compared with that obtained from pure microcrystalline cellulose were recorded from 4000 to 400 cm-1 in transmission mode using a PerkinElmer Spectrum 100 FT-IR instrument.
On untreated and treated fibres other characterization methods were also employed. In particular:
Thermogravimetric analysis (TGA) was carried out in a N2 stream with a PerkinElmer STA 6000 simultaneous thermal analyser on the raw fibre powder under nitrogen supply at 20 ml/min with a heating rate of 30 °C/min to verify the degree of purification obtained after the alkaline treatment [36].
Scanning electron microscopy (SEM) analysis was carried out using a Scanning Electron Microscope Zeiss Sigma 300 FESEM (Field Emission SEM).
Atomic force microscopy (AFM) images were acquired in tapping mode by using CSI Nano-observer, Les Ulis, France, and P-doped n-type Si cantilever (resonance frequency = 75 kHz). The measurements were performed by using resonant mode.
The Powder X-ray Diffraction (PXRD) patterns of the treated and untreated fibres were acquired on a Bruker D6 PHASER equipped with a Cu Kα radiation (λ = 1.54060 Å) and a Lynxeye detector, at 40 kV and 15 mA, with a step size of 0.03° and a step time of 0.05 s, over an angular range of 7–40° 2θ. To determine the crystallinity index (Ic) of the samples, the powder patterns were deconvoluted by applying Gauss fitting procedure using Origin software. The deconvolution process allowed us to identify and separate the crystalline peaks. Ic was calculated according to the following equation (1), as from [37]:
where I(002) represents the intensity peak at around 20-22°, corresponding to the crystallographic plane (002) (crystalline region), I(am) indicates the intensity peak at around 15.8-16°, lying between the planes (002) and (101) (amorphous region) [38].
The Brunauer−Emmett−Teller (BET) specific surface area, pore size distribution was determined using an ASAP 2020 Micromeritics instrument. Nitrogen gas was employed as the adsorbate at 77 K. Prior to measurements, 2 g of each sample was degassed under dynamic vacuum at 100 °C until a constant high vacuum was achieved (~10−5 bar). BET surface areas were calculated from the N2- adsorption isotherms in the 0.01− 0.1 P/P0 range, adhering to Rouquerol consistency criteria. Pore size distribution data were also calculated from the N2 adsorption isotherms at 77 K based on nonlocal density functional theory (NL-DFT) model in the Micromeritics ASAP2020 software package.
Differential scanning calorimetry (DSC) analyses were conducted with a Perkin Elmer DSC 6000 with a heating protocol of -20 to 400 °C and a heating rate of 10 °C/min; a nitrogen flow was purged at 30 ml/min. Samples were weighted in a range between 5 and 8 mg and placed into aluminium pans, then sealed.
Tensile test measurements were performed employing a dynamometer Shimadzu AGS-X equipped with a load cell of 10 kN, using a constant speed of 1 mm/min, the gauge length was fixed at 50 mm. Hemp and flax fibre strands have been manually removed from the supplied fabric scraps. Strand fibres were alkali treated following the same procedure as for the squares. All the fibres obtained were conditioned at constant temperature of 25 °C and relative humidity of 50% for 48 h before analysis. Strand diameter was measured with a digital thickness gauge by averaging the measurement in 5 different points of the strand, which were found to be in between 190 and 230 micrometres (assuming circular strand).
3. Results and Discussion
3.1. Chemical Groups of Extracted Fibres by FTIR
To initiate the consideration of the results, a brief comment will be provided on the chemical properties of fibres extracted from scraps. In the FT-IR spectra, shown in Figure 2, the characteristic absorption peaks of natural fibres can be observed, as compared with pure cellulose. Going more into detail, the following peaks are observed:
(a) an intense and broad band at 3312 cm-1 due to the stretching of the -OH groups present on the repetitive glucopyranoside units, through which intra-chain H-interactions are established
(b) between 2970 and 2840 cm-1, three low intensity absorptions corresponding to the stretches of the aliphatic C-H bonds [39]
(c) low-intensity absorptions at 1408 and 1338 cm-1, associated to the bending of the C-H and O-H bonds [40]
(d) between 1100 and 1000 cm-1, very intense absorptions, corresponding to the C-O-C stretches of the acetal groups present in the cellulose [41]
(e) the intense band at 1712 cm-1 characteristic of the non-conjugated carbonyl vibrations, which may be typical of the lignin content [42], in accordance with the presence of ester groups
(f) at 1241 cm-1 another intense band assignable to the ethereal groups of aromatic substances, typical of lignin [43].
The hemp IR spectrum is very similar to pure cellulose, however the absorptions at 1712 cm-1 and 1245 cm-1 are not present, differently from flax. This evidence suggests the absence of strong covalent interactions such as ester and ether bonds between the cellulose and the amorphous matrix. In flax, as reported in [44], also the presence of (g) 897 cm-1 β-glycosidic linkages between the sugar units in cellulose can be observed, which will be also mostly responsible for the peaks below 700 cm-1 [45].
3.2. Conditions of Chemical Treatment and Mass Loss
The number of initial procedures investigated for alkali treatment are 27 for each of the two fibres, considering all the combinations of the three parameters (NaOH concentration, immersion time, and solution temperature). The results as regards the mass lost in all circumstances are reported in Figure 3. By increasing the immersion time in alkaline solution, a larger mass loss is obviously observed. The parameter that seems to have less influence on the amount of mass extracted is the alkali concentration: varying it from 0.5 to 1 and 1.5% m/v, for the same temperature and time of immersion in alkaline solution, the mass of the extracted non-structural material is very similar among the various samples. In flax, the use of a warmer alkali solution does increase the mass loss, whilst this is not the case for hemp, unless the maximum time of immersion of 150 minutes is used. This could be explained by the higher amount of non-structural material they contain, namely hemicellulose and other low molecular weight polysaccharide. It is also possibly the case that loose and unstructured materials need more time to be dissolved due to the more elongated and variable sectional geometry of hemp fibers [46] with respect to that of flax fibres (more regularly polygonal) [47].
Data on chemical composition of flax and hemp fibres are largely available, which suggests by near infrared (NIR) spectroscopy studies that for flax the amount of cellulose is between 70 up to over 85%, depending on the cultivar [48]: data from previous studies on Oliver variety indicate a medium range value of 77% [49]. For hemp an even larger variation can be found, namely between 55 and over 80% can be found [50]. Post-retting measurements indicated that Futura hemp cultivar places itself around the maximum possible value for cellulose content [51]. In industrial terms, it appears more practical to try to adapt the same treatment method for both fibres, though it is recognized that its effect might be variable.
Eight sample categories, on which a more detailed study on the effect of treatment is carried out, are reported in Table 1:.
Figure 4 reports the mass lost after the alkaline treatment for all sample categories. The largest mass loss is reported measured for the FT-MAX category and seems to be mainly due to the combined effect of the warmer temperature and the longer exposition time. This might be expected since the hydrolysis process of the amorphous components of the fibres is strongly endothermic, which is due to the depolymerization of less-structural cellulose content due to alkali treatment, as suggested also elsewhere [52]. In addition, as already clarified, the treatments remove more matter from flax fibres than from hemp ones. On the other hand, considering the scattering of values, a treatment with a more concentrated and warmer solution for a longer time would be less controllable.
3.3. Thermal Properties of Untreated and Treated Fibres
As regards the thermal degradation pattern of fibres, as it appears from thermogravimetric analysis (TGA) depicted in Figure 5. This is obviously characterised by the chemical composition of the fibre, as the shape of the curve is influenced by the presence of amorphous components such as hemicellulose and lignin, which affect the tendency of the thermal degradation of the cellulose. The carbonaceous residual mass is mainly constituted by lignin and ashes, though it is likely that a limited and progressive degradation of the former would occur in a wide temperature range [53]. This is also owed to the high degree of branching and the strong condensation of the aromatic fractions [54,55,56]. The trends of these curves are very similar to each other, therefore the TGA curves of the three most representative samples of treated fibres were compared with the degradation curves of the raw fibres and pure cellulose. The TGA analysis shows that the alkaline treatments under different conditions did not cause significant changes in the thermal behaviour of the treated samples compared to untreated ones and to microcrystalline cellulose. The degradation rate, curve shape and residual mass at 600 °C remain very similar to the reference sample.
However, a closer look at the degradation curve of hemp shows more differences that are indicated in Table 2: the interval for the thermal decomposition of the structural part of the fibre, which is prevalently formed by crystalline cellulose, is reported, such as going from a degradation start temperature (Tds) to a degradation end temperature (Tde). The degradation range is reconstructed in accordance with the method applied e.g., in [57], according to the intercepts at the two first sections of the typical S curve obtained in the TGA tests for ligno-cellulosic fibres. The mass lost in this specific interval does grow with increasing treatment with flax, especially for FT-MAX fibres, while this trend is not much consistent for hemp fibres. What is clearly reported is that the residue at 600 °C does come closer to the one measured for the pure cellulose one, where also the degradation pattern is more rapid and requires less thermal energy.
DSC curves for untreated samples and for those subjected to max. treatment, exposed in Figure 6, are exhibiting two main endothermic peaks with notable similarities. The first, a broad peak with a maximum between 67 and 75 °C, corresponds to the release of absorbed water. The second peak, occurring in any case not below 315 °C is associated with the collapse of cellulose structure [58,59]. This decomposition temperature is slightly higher in treated samples compared to their untreated counterparts, indicating enhanced thermal stability in both HT-MAX and FT-MAX fibres. The effect is particularly pronounced in hemp fibres, where the peak shifts from 347 to 362 °C. A slight increase is also observed in the treated flax sample. This improvement may be attributed to increased cellulose crystallinity in the hemp fibres following alkaline treatment, as is confirmed further down by XRD analysis, which likely results in a more thermally stable material [60]. More generally, comparing the DSC with the TGA data, it can be suggested that the former indicate that the onset of thermal phenomena is delayed with respect to the beginning of mass loss associated with cellulose degradation. Additionally, a sharp peak around 250 °C is observed in both FNT and FT-max samples, which may be due to dewaxing or local lignin degradation phenomena [61,62], likely to be due to the cleavage of α- and ß-aryl-alkyl-ether linkages, as reported in [63]. No significant thermal events are detected between 150 and 320 °C for HNT and HT-MAX samples, indicating their stability within this temperature range.
3.4. Crystallinity Measurements by X-Ray Diffraction (XRD)
The structural order and crystallinity of untreated and alkali-treated flax and hemp fibres were investigated by X-ray diffraction. The diffraction profiles are shown in Figure 7, where peak deconvolution was performed to distinguish between crystalline and amorphous contributions. The key peak at approximately 2θ ~ 22° corresponds to the (002) crystalline plane of cellulose I, while the broad background centred around 2θ ~ 18–19° represents the amorphous regions of the fibre matrix. In both flax (FNT) and hemp (HNT), the XRD patterns exhibit a broad and asymmetric shape typical of semi-crystalline lignocellulosic materials. The fitted curves reveal a distinct but modest crystalline peak (002) superimposed on a large amorphous contribution. This reflects the presence of a disordered matrix composed of hemicellulose, lignin, and disorganized cellulose chains, which hinders the full expression of crystalline features. Following NaOH treatment, the XRD patterns of both flax (FT-MAX) and hemp (HT-MAX) show a marked increase in the intensity and sharpness of the (002) reflection. This enhancement is accompanied by a reduction in the amorphous background, indicating the removal of non-crystalline constituents such as hemicellulose, pectin, and residual lignin. The changes suggest a clear increase in the relative crystallinity of the fibres after alkali treatment. While both fibres show similar trends upon treatment, flax (FT-MAX) exhibits a slightly sharper and more defined (002) peak compared to hemp (HT-MAX), indicating that flax may either start with a slightly higher initial crystallinity. Moreover, the crystallinity index has been calculated according to Segal’s method which has been extensively applied also on native cellulose (see e.g., the review in [64]). This method has been discussed, and limitations have been suggested, especially on the delimitation of the reliability of peak sharpness measurements and hence in amorphous subtraction [65]. It remains nonetheless a fast technique to estimate the Ic and allows comparative measurements. As shown in Figure 7b and Figure 7d, hemp fibres (HT-MAX) demonstrate a greater relative increase in Ic compared to flax (FT-MAX) (Figure 7a and Figure 7c). In general, alkaline treatment leads to a slight enhancement in the crystalline structure of both flax and hemp fibres. While flax exhibits a naturally higher initial crystallinity and treatment does not appear to increase it, hemp undergoes a more substantial reorganization of its internal structure, reflected in a greater increase in the crystallinity index. It has been suggested elsewhere [66] that even higher values for crystallinity index of treated flax fibres with up to 10% NaOH could be reached, up to 78%, however exceeding some limit a transformation from cellulose I to cellulose II is likely to be produced [67]. Crystallinity index values obtained with this method on hemp are usually lower, often not exceeding 60% [68,69].
3.5. Study of Absorption/desorption Isotherms to Measure Pore Distribution
Figure 8 presents the N2 adsorption/desorption isotherms and corresponding pore size distributions for both untreated and alkali-treated fibres to assess their pore distribution through surface area measurements, according to the Brunauer-Emmet-Teller theory (BET) [70]. As per IUPAC classification, the isotherms generally correspond to Type III, characteristic of non-porous materials. The alkali treatment did not significantly alter the isotherm profiles, although a slight increase in nitrogen uptake, particularly in hemp fibres, suggests a modest improvement in surface area (see Table 3).
FT-MAX and HT-MAX samples exhibit increased N₂ adsorption at higher relative pressures in comparison to the initial fibres, indicating enhanced surface area and porosity following treatment. Despite this, the pore size distribution curves remain mostly unchanged, suggesting that while the number and volume of mesopores increased, their size remained consistent. These observations are consistent with known effects of alkaline treatment, which removes surface barriers (e.g., lignin and waxes) and opens up internal voids without drastically altering pore dimensions [71].
3.5. Fibre Surface Morphology
SEM analyses were performed to obtain qualitative information on the morphology of the treated fibres: these are reported in Figure 9 for flax and Figure 10 for hemp. From the surface morphology of the fibres, it is in fact possible to obtain indications on the possible adhesion capacity of the fibres to the polymeric matrix, during the processing phase of composite materials [72,73]. As a general consideration, the surface of flax fibres does appear much smoother, despite the presence of deviated kink bands, which are particularly observed in untreated fibres, and have been widely discussed in literature [74]. However, FT-MAX fibres do clearly show a much rougher surface and the presence of some loose matter, which might be a confirmation of the mass loss data. In the case of hemp, the surface aspect starts from heterogeneous dimensions of individual fibres and the alkaline treatment with a more concentrated NaOH solution gives greater morphological modification of the fibres surface. Other than this, de-fibrillation does clearly appear, which is frequently recognised in these fibres, though not normally affecting their strength [75]. This is especially evident at HT-MAX (Figure 10H).
In Figure 11, optical micrographs of samples tested for roughness under atomic force microscopy (AFM) are reported. AFM analyses are in particular concentrated on a single fibre offering profiles with a length of 5 µm. Figure 12 and Figure 13 show the topography of the flax and hemp fibres, respectively. Previous studies using AFM, namely on flax, documented to which extent the relevant roughness of the fibre surface can be influenced by the presence of the middle lamella cementing the different fibre cells [76]. This impedes achieving a sufficiently smooth surface in many cases. On the other hand, other AFM observations confirmed the limited dependence of sclerenchyma cells, such as those derived from hemp, on humidity content, practically hindering any swelling process, which also makes roughness measurements more reliable in various environmental conditions [77].
As for the effect of treatment on roughness profiles, depicted in Figure 11 and Figure 12, it is suggested that even the more aggressive conditions experimented did not generally modify the surface profiles, possibly only resulting in some reduction of the importance of the tiniest asperities, not exceeding the micron level.
For more thorough considerations, in Table 4 the roughness parameters and values measured are reported. The parameters of the roughness profile are defined as follows: Rp = Maximum peak height; Rv = Maximum valley depth; Rz = Maximum height; Rt = Total height; Ra = Average profile; Rq = Root mean square (RMS) deviation; Rsk = Skewness; Rku = Kurtosis. In particular, shifting to the positive value of skewness with treatment, namely on hemp, suggests the more limited presence of surface microvoids that could assist water penetration [78] and at the same time also affect the achievement of an effective interface in composites [79]. A more refined study would elucidate the repeatability of this outcome and whether treatment can be further tailored for this objective.
3.6. Tensile Fibres Measurements
Figure 14 shows representative stress–strain curves for both treated and untreated fibre bundles. The slight, continuous fluctuations in stress observed during testing have been attributed to progressive fracture of individual fibres within the bundle before the final breaking point is reached [80]. The average maximum tensile stress and elongation at break, reported in Table 5, are lower for both hemp and flax fibres after alkali treatment. This decrease can be explained by differences in the chemical composition - particularly cellulose content - and internal structure of the two fibre types [81].
As seen in Figure 15, the only parameter that clearly increases following alkali treatment is Young’s modulus for both hemp and flax fibres, leading to a considerably higher rigidity yet to potential brittleness. This increase in stiffness is due to some removal of amorphous components such as hemicellulose, lignin, and surface waxes. Their removal exposes the underlying crystalline cellulose microfibrils, which can better align during mechanical loading, resulting in a stiffer material [82]. In contrast, untreated fibres retain these flexible, non-cellulosic components, which contribute to higher toughness and energy absorption. Without them, treated fibres become more brittle and prone to breaking under lower loads, leading to reduced tensile strength and elongation at break. Additionally, excessive or harsh alkali treatment can damage the cellulose structure or introduce microcracks, further compromising the fibres’ ability to withstand high stress before failure [83]. Values obtained are along the lines of what has been measured in previous classical studies, such as [84] for flax, and [85] for hemp, though in the latter case for a crop with higher crystallinity index, even exceeding 70%.
4. Conclusions
In this work, treatments using low concentration (up to 1.5 wt.%) sodium hydroxide solutions for different immersion times (up to 150 minutes) and temperatures (up to 80 °C), aimed at possibly improving some characteristics of flax and hemp fabrics, were studied. Solution’s temperature is a parameter that may influence the extraction capacity of the treatment of amorphous components, such as hemicellulose and lignin. Consequently, some changes are found in the characteristics of the treated fibres compared to the starting raw materials, albeit in thermal characterization no major modifications are found. The SEM images show very interesting results on the morphology, such as the evidence that an optimization of the various parameters for NaOH treatment, namely concentration, time of immersion and temperature, can improve fibre surface characteristics. This can be also extended to fibre roughness, where smoothing, more effective in the case of flax, does lead to a better interaction between polymer fibres and matrices, through mechanical interlocking, in the preparation of composite materials. Geometrical modifications raised though also concerns about the creation of microvoids by correction of surface profiles, and consequent water penetration. Chemical treatment does appear to effectively increase crystallinity of hemp fibres, while a similar effect on flax fibres is limited, if not at all absent, at this tenor of alkali. The only recognised effect that low concentration alkali effect can definitely produce is the higher stiffness of both flax and hemp fibres, though at the expense of some brittleness, especially noticed on the former, where strength is more than halved by the maximum level of treatment.
Small differences in NaOH concentration were not expected to produce major effects in the extraction of amorphous components, but the immersion time is also a parameter to take into consideration. Future studies will need to verify whether longer immersion times can improve the efficiency of treatments in order to obtain better materials than those manufactured using untreated fibres scraps.
Author Contributions
Conceptualization, V.C., F.M., and M.A.; methodology, S.X., L.P., V.C., and R.G.; validation, S.X., R.Gi., and L.P.; data analysis, R.Gi., C.F., and S.M.; writing—original draft preparation, S.M., F.M., and C.S.; writing—review and editing, C.S. and C.F.; supervision, F.M., and M.A. All authors have read and agreed to the published version of the manuscript.
Funding
PhD scholarship of Lorenzo Pietracci was financed by the Italian Ministry of University and Research (MUR), within the project “Composite Materials Hub of Valle del Tronto, Marche region”, for research activities relating to environmental sustainability, design, modelling, and chemical development of products in the sector of composite materials for applications in automotive sector. This work was financially supported by MUR – PNRR (Decreto Direttoriale n. 703 del 20-4-2022), within the framework of the project “VITALITY - Innovation, digitalisation and sustainability for the diffused economy in Central Italy” (cod. ECS_00000041), Spoke 9 - Nanostructured materials and devices. This work was also carried out under the frame of the project Nano4-Fresh – Nanomaterials for environmentally friendly and sustainable handling of perishable products (PRIMA19_00246), which is part of the Partnership on Research and Innovation in the Mediterranean Area (PRIMA) Programme supported by the European Union and funded by the national funding bodies of Participating States.
Institutional Review Board Statement
Not applicable.
Informed Consent Statement
Not applicable.
Data Availability Statement
Data are available upon request.
Acknowledgments
Thanks are due to the University of Camerino (Italy) for financial support.
Conflicts of Interest
The authors declare no conflicts of interest.
Abbreviations
The following abbreviations are used in this manuscript:
| AFM | Atomic Force Microscopy |
| BET | From the Brunauer-Emmet-Teller theory |
| FTIR | Fourier Transform Infrared Spectroscopy |
| NIR | Near Infrared Spectroscopy |
| NL-DFT | Non-local density functional theory |
| SEM | Scanning Electron Microscopy |
| TGA | Thermogravimetric Analysis |
| XRD | X-Ray diffraction |
References
- Naik, V.; Kumar, M. A review on natural fiber composite material in automotive applications. Engineer. Sci. 2021, 18, 1–10. [Google Scholar] [CrossRef]
- Chen, Y.; Chiparus, O.; Sun, L.; Negulescu, I.; Parikh, D. V.; Calamari, T. A. Natural fibers for automotive nonwoven composites. J. Ind. Text. 2005, 35(1), 47–62. [Google Scholar] [CrossRef]
- Huda, M. S.; Drzal, L. T.; Ray, D.; Mohanty, A. K.; Mishra, M. Natural-fiber composites in the automotive sector. In Properties and performance of natural-fibre composites; Pickering, K., Ed.; Woodhead Publishing: Sawston, Cambridge, UK, 2008; pp. 221–268. [Google Scholar]
- Holbery, J.; Houston, D. Natural-fiber-reinforced polymer composites in automotive applications. Jom 2006, 58(11), 80–86. [Google Scholar] [CrossRef]
- Ferreira, F. V.; Pinheiro, I. F.; de Souza, S. F.; Mei, L. H.; Lona, L. M. Polymer composites reinforced with natural fibers and nanocellulose in the automotive industry: A short review. J. Compos. Sci. 2019, 3(2), 51. [Google Scholar] [CrossRef]
- Ramli, N.; Mazlan, N.; Ando, Y.; Leman, Z.; Abdan, K.; Aziz, A. A.; Sairy, N. A. Natural fiber for green technology in automotive industry: a brief review. IOP conference series: Materials science and engineering, 2018, June; IOP Publishing: Bristol, UK; Vol. 368, p. p. 012012. [Google Scholar]
- Elseify, L. A.; Midani, M.; El-Badawy, A.; Jawaid, M. Manufacturing automotive components from sustainable natural fiber composites; Springer International Publishing: Cham, Switzerland, 2021; pp. 53–65. [Google Scholar]
- Dunne, R.; Desai, D.; Sadiku, R.; Jayaramudu, J. A review of natural fibres, their sustainability and automotive applications. J. Reinf. Plast. Compos. 2016, 35(13), 1041–1050. [Google Scholar] [CrossRef]
- Sreenivas, H. T.; Krishnamurthy, N.; Arpitha, G. R. A comprehensive review on light weight kenaf fiber for automobiles. Int. J. Lightw. Mater. Manufact. 2020, 3(4), 328–337. [Google Scholar] [CrossRef]
- Sangilimuthukumar, J.; Kumar, T. S. M.; Santulli, C.; Chandrasekar, M.; Senthilkumar, K.; Siengchin, S. The use of pineapple fiber composites for automotive applications: a short review. J. Mater. Sci. Res. Rev. 2020, 6(3), 39–45. [Google Scholar]
- Al-Oqla, F. M.; Sapuan, S. M. Natural fiber reinforced polymer composites in industrial applications: feasibility of date palm fibers for sustainable automotive industry. J. Clean. Prod. 2014, 66, 347–354. [Google Scholar] [CrossRef]
- Getu, D.; Nallamothu, R. B.; Masresha, M.; Nallamothu, S. K.; Nallamothu, A. K. Production and characterization of bamboo and sisal fiber reinforced hybrid composite for interior automotive body application. Mater. Today Proc. 2021, 38, 2853–2860. [Google Scholar] [CrossRef]
- Miniappan, P. K.; Marimuthu, S.; Kumar, S. D.; Gokilakrishnan, G.; Sharma, S.; Li, C.; Abbas, M. Mechanical, fracture-deformation, and tribology behavior of fillers-reinforced sisal fiber composites for lightweight automotive applications. Rev Adv. Mater. Sci. 2023, 62(1), 20230342. [Google Scholar] [CrossRef]
- Balda, S.; Sharma, A.; Capalash, N.; Sharma, P. Banana fibre: a natural and sustainable bioresource for eco-friendly applications. Clean Technol. Environ. Pol. 2021, 23, 1389–1401. [Google Scholar] [CrossRef]
- Niranjan, R. R.; Junaid Kokan, S.; Sathya Narayanan, R.; Rajesh, S.; Manickavasagam, V. M.; Ramnath, B. V. Fabrication and testing of abaca fibre reinforced epoxy composites for automotive applications. Adv. Mater. Res. 2013, 718, 63–68. [Google Scholar] [CrossRef]
- Alves, C.; Silva, A.; Reis, L.; Ferrão, P.; Freitas, M. Sustainable design of automotive components through jute fiber composites: an integrated approach. New trends and developments in automotive industry; InTech: Houston, TX, USA, 2011; pp. 223–254. [Google Scholar]
- Kumar, N.; Das, D. Fibrous biocomposites from nettle (Girardinia diversifolia) and poly (lactic acid) fibers for automotive dashboard panel application. Compos. Part B Eng. 2017, 130, 54–63. [Google Scholar] [CrossRef]
- La Rosa, A. D.; Cozzo, G.; Latteri, A.; Mancini, G.; Recca, A.; Cicala, G. A comparative life cycle assessment of a composite component for automotive. Chem. Eng. Trans. 2013, 32, 1723–1728. [Google Scholar]
- Kerwan, K.; Coles, S. Natural materials in automotive design. In Designing with Natural Materials; Ormondroyd, G.A., Morris, A.F., Eds.; CRC Press: Boca Raton, FL., USA, 2018; pp. 165–179. [Google Scholar]
- Ma, H.; Guna, V.; Raju, T.; Murthy, A. N.; Reddy, N. Converting flax processing waste into value added biocomposites. Ind. Crops Prod. 2023, 195, 116434. [Google Scholar] [CrossRef]
- Pernevan, M. S.; Marsavina, L.; Pernevan, I.; Popescu, M. Comparative analysis regarding the mechanical properties of polymer matrix based biocomposites reinforced with hemp scraps. In: International Multidisciplinary Scientific GeoConference (SGEM) Proceedings, Albena Resort & SPA, Bulgaria, 17 - 23 June 2012; vol. 4, p. 667. [Google Scholar]
- Bledzki, A. K.; Fink, H.-P.; Specht, K. Unidirectional Hemp and Flax EP- and PP-Composites: Influence of Defined Fiber Treatments. J. Appl. Polym. Sci. 2004, 93(5), 2150–2156. [Google Scholar] [CrossRef]
- Väisänen, T.; Batello, P.; Lappalainen, R.; Tomppo, L. Modification of Hemp Fibers (Cannabis Sativa L.) for Composite Applications. Ind. Crops Prod. 2018, 111, 422–429. [Google Scholar] [CrossRef]
- Khalid, M. Y.; Imran, R.; Arif, Z. U.; Akram, N.; Arshad, H.; Al Rashid, A.; Garcia Marquez, F. P. Developments in chemical treatments, manufacturing techniques and potential applications of natural-fibers-based biodegradable composites. Coatings 2021, 11(3), 293. [Google Scholar] [CrossRef]
- Tanasă, F.; Zănoagă, M.; Teacă, C.; Nechifor, M.; Shahzad, A. Modified hemp fibers intended for fiber-reinforced polymer composites used in structural applications—A Review. I. Methods of Modification. Polym. Compos. 2020, 41(1), 5–31. [Google Scholar] [CrossRef]
- Fiore, V.; Di Bella, G.; Valenza, A. The effect of alkaline treatment on mechanical properties of kenaf fibers and their epoxy composites. Compos. Part B Eng. 2015, 68, 14–21. [Google Scholar] [CrossRef]
- Hassan, F.; Zulkifli, R.; Ghazali, M. J.; Azhari, C. H. Kenaf Fiber Composite in Automotive Industry: An Overview. Int. J. Adv. Sci. Eng. Inform. Technol. 2017, 7(1), 315. [Google Scholar] [CrossRef]
- Akil, H. M.; Omar, M. F.; Mazuki, A. A. M.; Safiee, S.; Ishak, Z. A. M.; Abu Bakar, A. Kenaf fiber reinforced composites: A Review. Mater. Des. 2011, 32(8–9), 4107–4121. [Google Scholar] [CrossRef]
- Makarov, I. S.; Smyslov, A. G.; Palchikova, E. E.; Vinogradov, M. I.; Shandryuk, G. A.; Levin, I. S.; Kulichikhin, V. G. Nonwoven materials based on natural and artificial fibers. Cellulose 2024, 31(3), 1927–1940. [Google Scholar] [CrossRef]
- Md Salim, R.; Asik, J.; Sarjadi, M. S. Chemical Functional Groups of Extractives, Cellulose and Lignin Extracted from Native Leucaena Leucocephala Bark. Wood Sci. Technol. 2021, 55(2), 295–313. [Google Scholar] [CrossRef]
- Ouajai, S.; Shanks, R. A. Composition, Structure and Thermal Degradation of Hemp Cellulose after Chemical Treatments. Polym. Degrad. Stab. 2005, 89(2), 327–335. [Google Scholar] [CrossRef]
- Bahrami, R.; Bagheri, R.; Dai, C. Influence of fine structure on the variations of thermal and mechanical properties in flax fibers modified with different alkaline treatment conditions. J. Nat. Fib. 2022, 19(13), 5239–5257. [Google Scholar] [CrossRef]
- Gassan, J.; Mildner, I.; Bledzki, A. K. Influence of Fiber Structure Modification on the Mechanical Properties of Flax Fiber-Epoxy Composites. Mech. Compos. Mater. 1999, 35(5), 435–440. [Google Scholar] [CrossRef]
- Mendonça, M.; Dias, M. C.; Martins, C. C. N.; Durães, A. F. S.; Damásio, R. A. P.; Tonoli, G. H. D. Alkaline pretreatment facilitate mechanical fibrillation of unbleached cellulose pulps for obtaining of cellulose micro/nanofibrils (MFC). J Nat. Fib. 2022, 19(16), 13385–13400. [Google Scholar] [CrossRef]
- Ariawan, D.; Akbar, H. I. Adhesion energy and roughness observation on alkali treated natural fiber as composites reinforcement. Conference on Broad Exposure to Science and Technology 2021 (BEST 2021) Proceedings, Serang, Banten, Indonesia, 14-15 August, 2021; Atlantis Press: Dordrecht, The Netherlands, 2022, February; pp. 464–469. [Google Scholar]
- d’Almeida, A. L. F. S.; Barreto, D. W.; Calado, V.; d’Almeida, J. R. M. Thermal analysis of less common lignocellulose fibers. J. Therm. Anal. Calorim. 2008, 91(2), 405–408. [Google Scholar] [CrossRef]
- Segal, L.; Creely, J.J.; Martin, A.E.; Conrad, C.M. An Empirical Method for Estimating the Degree of Crystallinity of Native Cellulose Using the X-Ray Diffractometer. Text. Res. J. 1959, 29(10), 786–794. [Google Scholar] [CrossRef]
- Salem, K. S.; Kasera, N. K.; Rahman, M. A.; Jameel, H.; Habibi, Y.; Eichhorn, S. J.; Lucia, L. A. Comparison and assessment of methods for cellulose crystallinity determination. Chem. Soc. Rev. 2023, 52(18), 6417–6446. [Google Scholar] [CrossRef]
- Manaila, E.; Stelescu, M. D.; Craciun, G.; Surdu, L. Effects of benzoyl peroxide on some properties of composites based on hemp and natural rubber. Polym. Bull. 2014, 71, 2001–2022. [Google Scholar] [CrossRef]
- Atakan, R.; Bical, A.; Celebi, E.; Ozcan, G.; Soydan, N.; Sarac, A. S. Development of a flame retardant chemical for finishing of cotton, polyester, and CO/PET blends. J. Ind. Text. 2019, 49(2), 141–161. [Google Scholar] [CrossRef]
- Abidi, N.; Cabrales, L.; Haigler, C. H. Changes in the cell wall and cellulose content of developing cotton fibers investigated by FTIR spectroscopy. Carbohydr. Polym. 2014, 100, 9–16. [Google Scholar] [CrossRef] [PubMed]
- Neumann, M.; Wagner, S.; Noske, R.; Tiersch, B.; Strauch, P. Morphology and structure of biomorphous silica isolated from Equisetum hyemale and Equisetum telmateia. Z. fur Naturforsch. B 2010, 65(9), 1113–1120. [Google Scholar] [CrossRef]
- Popescu, C. M.; Popescu, M. C.; Vasile, C. Structural analysis of photodegraded lime wood by means of FT-IR and 2D IR correlation spectroscopy. Int. J. Biol. Macromol. 2011, 48(4), 667–675. [Google Scholar] [CrossRef]
- Seghini, M. C.; Touchard, F.; Chocinski-Arnault, L.; Placet, V.; François, C.; Plasseraud, L.; Sarasini, F. Environmentally friendly surface modification treatment of flax fibers by supercritical carbon dioxide. Molecules 2020, 25(3), 438. [Google Scholar] [CrossRef]
- Himmelsbach, D. S.; Akin, D. E. Near-infrared Fourier-transform Raman spectroscopy of flax (Linum usitatissimum L.) stems. J. Agric. Food Chem. 1998, 46(3), 991–998. [Google Scholar] [CrossRef]
- Del Masto, A.; Trivaudey, F.; Guicheret-Retel, V.; Placet, V.; Boubakar, L. Nonlinear tensile behaviour of elementary hemp fibres: a numerical investigation of the relationships between 3D geometry and tensile behaviour. J. Mater. Sci. 2017, 52(11), 6591–6610. [Google Scholar] [CrossRef]
- Gogoli, K.; Gehring, F.; Poilâne, C.; Morales, M. Analysis of morphological variations of flax fibre bundles by Fraunhofer diffraction. Ind. Crops Prod. 2021, 171, 113856. [Google Scholar] [CrossRef]
- Enakiev, Y.I.; Grishina, E.A.; Belopukhov, S.L.; Dmitrevskaya, I. I Application of NIR spectroscopy for cellulose determination in flax. Bulg. J. Agric. Sci. 2018, 24(5), 897–901. [Google Scholar]
- Bourmaud, A.; Morvan, C.; Bouali, A.; Placet, V.; Perre, P.; Baley, C. Relationships between micro-fibrillar angle, mechanical properties and biochemical composition of flax fibers. Ind. Crops Prod. 2013, 44, 343–351. [Google Scholar] [CrossRef]
- Shahzad, A. Hemp fiber and its composites–a review. J. Compos. Mater. 2012, 46(8), 973–986. [Google Scholar] [CrossRef]
- Orm, E. B.; Sutton-Charani, N.; Bayle, S.; Benezet, J. C.; Bergeret, A.; Malhautier, L. Influence of field retting on physicochemical and biological properties of “Futura 75” hemp stems. Ind. Crops Prod. 2024, 214, 118487. [Google Scholar] [CrossRef]
- Bismarck, A.; Aranberri-Askargorta, I.; Springer, J.; Lampke, T.; Wielage, B.; Stamboulis, A.; Shenderovich, I.; Limbach, H.-H. Surface characterization of flax, hemp and cellulose fibers; surface properties and the water uptake behavior. Polym. Compos. 2002, 23(5), 872–894. [Google Scholar] [CrossRef]
- Mijas, G.; Manich, A.; Lis, M. J.; Riba-Moliner, M.; Algaba, I.; Cayuela, D. Analysis of lignin content in alkaline treated hemp fibers: thermogravimetric studies and determination of kinetics of different decomposition steps. J. Wood Chem. Technol. 2021, 41(5), 210–219. [Google Scholar] [CrossRef]
- Pasangulapati, V.M.; Ramachandriya, K. D.; Kumar, A.; Wilkins, M. R.; Jones, C. L.; Huhnke, R. L. Effects of cellulose, hemicellulose and lignin on thermochemical conversion characteristics of the selected biomass. Bioresource Tech. 2012, 114, 663–669. [Google Scholar] [CrossRef] [PubMed]
- Hosoya, T.; Kawamoto, H.; Saka, S. Cellulose–hemicellulose and cellulose–lignin interactions in wood pyrolysis at gasification temperature. J. Anal. Appl. Pyrolysis 2007, 80(1), 118–125. [Google Scholar] [CrossRef]
- Thygesen, A.; Oddershede, J.; Lilholt, H.; Thomsen, A. B.; Ståhl, K. On the determination of crystallinity and cellulose content in plant fibres. Cellulose 2005, 12, 563–576. [Google Scholar] [CrossRef]
- Palanisamy, S.; Rajan, V. K.; Mani, A. K.; Palaniappan, M.; Santulli, C.; Alavudeen, A.; Ayrilmis, N. Extraction and characterization of fiber from the flower stalk of Sansevieria cylindrica. Physiol. Plant. 2024, 176(2), e14279. [Google Scholar] [CrossRef]
- Le Troedec, M.; Sedan, D.; Peyratout, C.; Bonnet, J. P.; Smith, A.; Guinebretiere, R.; Krausz, P. Influence of various chemical treatments on the composition and structure of hemp fibres. Compos. A Appl. Sci. Manufact. 2008, 39(3), 514–522. [Google Scholar] [CrossRef]
- Ye Xue, Y.; Hu, W.; Hu, X. Thermal analysis of natural fibers in “Thermal Analysis of Textiles and Fibers”; Jaffe, Michael, Menczel, Joseph D., Eds.; Woodhead Publishing: Sawston, UK, 2020; pp. Pages 105–132. [Google Scholar]
- Arbelaiz, A.; Fernandez, B.; Ramos, J. A.; Mondragon, I. Thermal and crystallization studies of short flax fibre reinforced polypropylene matrix composites: Effect of treatments. Thermochim. Acta 2006, 440(2), 111–121. [Google Scholar] [CrossRef]
- Mwaikambo, L. Y.; Ansell, M. P. The effect of chemical treatment on the properties of hemp, sisal, jute and kapok for composite reinforcement. Macromol. Mater. Eng. 1999, 272, 108–116. [Google Scholar] [CrossRef]
- Amit, T. A.; Roy, R.; Raynie, D. E. Thermal and structural characterization of two commercially available technical lignins for potential depolymerization via hydrothermal liquefaction. Curr. Res. Green Sustain. Chem. 2021, 4, 100106. [Google Scholar] [CrossRef]
- Reddy, J. P.; Rhim, J. W. Extraction and characterization of cellulose microfibers from agricultural wastes of onion and garlic. J. Nat. Fib. 2018, 15(4), 465–473. [Google Scholar] [CrossRef]
- Terinte, N.; Ibbett, R.; Schuster, K. C. Overview on native cellulose and microcrystalline cellulose I structure studied by X-ray diffraction (WAXD): Comparison between measurement techniques. Lenzinger Berichte 2011, 89(1), 118–131. [Google Scholar]
- Salem, K. S.; Kasera, N. K.; Rahman, M. A.; Jameel, H.; Habibi, Y.; Eichhorn, S. J.; Lucia, L. A. Comparison and assessment of methods for cellulose crystallinity determination. Chem. Soc. Rev. 2023, 52(18), 6417–6446. [Google Scholar] [CrossRef] [PubMed]
- Zheng, D.; Ding, R. Y.; Lei, Z.; Xingqun, Z.; Chong-Wen, Y. Thermal properties of flax fiber scoured by different methods. Thermal Sci. 2015, 19(3), 939–945. [Google Scholar] [CrossRef]
- Lazić, B. D.; Janjić, S.; Rijavec, T.; Kostić, M. Effect of chemical treatments on the chemical composition and properties of flax fibers. J. Serb. Chem. Soc. 2017, 82(1), 83–97. [Google Scholar] [CrossRef]
- Palanikumar, K.; Natarajan, E.; Markandan, K.; Ang, C. K.; Franz, G. Targeted pre-treatment of hemp fibers and the effect on mechanical properties of polymer composites. Fibers 2023, 11(5), 43. [Google Scholar] [CrossRef]
- Dai, D.; Fan, M. Characteristic and performance of elementary hemp fibre. Mater. Sci. Appl. 2010, 1(06), 336. [Google Scholar] [CrossRef]
- Naderi, M. Surface area: Brunauer–Emmett–Teller (BET). In Progress in filtration and separation; Tarleton, E.S., Ed.; Academic Press: Cambridge, MA, USA, 2015; pp. 585–608. [Google Scholar]
- Célino, A.; Fréour, S.; Jacquemin, F.; Casari, P. The hygroscopic behavior of plant fibers: a review. Front. Chem. 2014, 1, 43. [Google Scholar] [CrossRef] [PubMed]
- Xiao, X.; Cheng, M.; Zhong, Y. Effects of alkali treatment on the mechanical properties and moisture absorption behavior of flax/polypropylene composites. J. Nat. Fib. 2022, 19(14), 9201–9222. [Google Scholar] [CrossRef]
- ArunRamnath, R.; Murugan, S.; Sanjay, M. R.; Vinod, A.; Indran, S.; Elnaggar, A. Y.; Siengchin, S. Characterization of novel natural cellulosic fibers from Abutilon Indicum for potential reinforcement in polymer composites. Polym. Compos. 2023, 44(1), 340–355. [Google Scholar] [CrossRef]
- Melelli, A.; Durand, S.; Arnould, O.; Richely, E.; Guessasma, S.; Jamme, F.; Beaugrand, J.; Bourmaud, A. Extensive investigation of the ultrastructure of kink-bands in flax fibres. Ind. Crops Prod. 2021, 164, 113368. [Google Scholar] [CrossRef]
- Pacaphol, K.; Aht-Ong, D. Preparation of hemp nanofibers from agricultural waste by mechanical defibrillation in water. J. Clean. Prod. 2017, 142, 1283–1295. [Google Scholar] [CrossRef]
- Melelli, A.; Arnould, O.M; Beaugrand, J.; Bourmaud, A. The middle lamella of plant fibers used as composite reinforcement: Investigation by atomic force microscopy. Molecules 2020, 25(3), 632. [Google Scholar] [CrossRef]
- George, M.; Mussone, P. G.; Abboud, Z.; Bressler, D. C. Characterization of chemically and enzymatically treated hemp fibres using atomic force microscopy and spectroscopy. Appl. Surf, Sci. 2014, 314, 1019–1025. [Google Scholar] [CrossRef]
- Coste, R.; Pernes, M.; Tetard, L.; Molinari, M.; Chabbert, B. Effect of the interplay of composition and environmental humidity on the nanomechanical properties of hemp fibers. ACS Sustain. Chem. Eng. 2020, 8(16), 6381–6390. [Google Scholar] [CrossRef]
- Ding, L.; Han, X.; Cao, L.; Chen, Y.; Ling, Z.; Han, J.; He, S.; Jiang, S. Characterization of natural fiber from manau rattan (Calamus manan) as a potential reinforcement for polymer-based composites. J. Bioresour. Bioprod. 2022, 7, 190–200. [Google Scholar] [CrossRef]
- Wang, B.; Pierre-Antoine, A.; Guillaume, M.; Yang, G.; Zhou, S. Sustainable additive manufacturing: Microstructural evolution and mechanical viability of recycled Flax/PP via fused granular fabrication. Ind. Crops Prod. 2015, 236, 121997. [Google Scholar] [CrossRef]
- Chaishome, J.; Rattanapaskorn, S. The influence of alkaline treatment on thermal stability of flax fibres. IOP Conference Series: Materials Science and Engineering, 2017, April; IOP Publishing: Bristol, UK; Vol. 191, p. 012007. [Google Scholar]
- Gassan, J.; Bledzki, A.K. Possibilities for improving the mechanical properties of jute/epoxy composites by alkali treatment of fibres. Compos. Sci. Technol. 1999, 59, 1303–1309. [Google Scholar] [CrossRef]
- Sosiati, H.; Pratiwi, H.; Wijayanti, D.A.; Soekrisno, S. The influence of alkali treatments on tensile strength and surface morphology of cellulose microfibrils. Adv. Mater. Res. 2015, 1123, 147–150. [Google Scholar] [CrossRef]
- Baley, C. Analysis of the flax fibres tensile behaviour and analysis of the tensile stiffness increase. Compos. A Appl. Sci. Manufact. 2002, 33(7), 939–948. [Google Scholar] [CrossRef]
- Marrot, L.; Lefeuvre, A.; Pontoire, B.; Bourmaud, A.; Baley, C. Analysis of the hemp fiber mechanical properties and their scattering (Fedora 17). Ind. Crops Prod. 2013, 51, 317–327. [Google Scholar] [CrossRef]
Figure 1.
Optical microscopy images (magnification 5x) of: a) flax and b) hemp scraps.
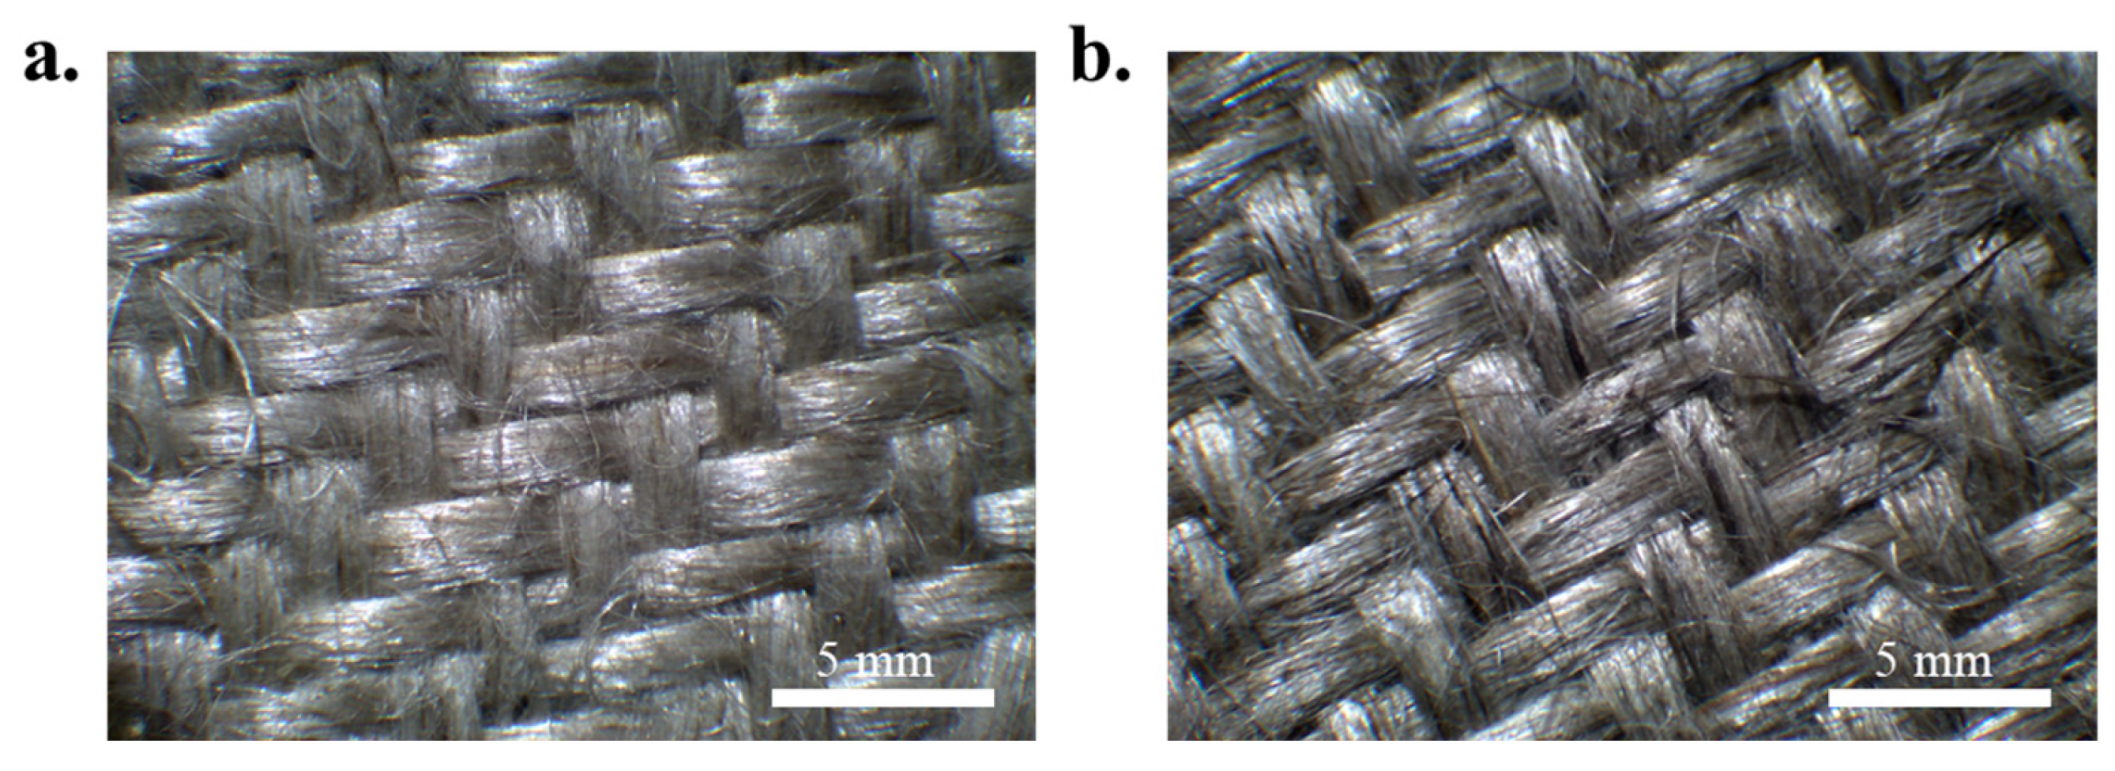
Figure 2.
FTIR spectra for the hemp and flax fibres as received in comparison with pure microcrystalline cellulose.
Figure 2.
FTIR spectra for the hemp and flax fibres as received in comparison with pure microcrystalline cellulose.
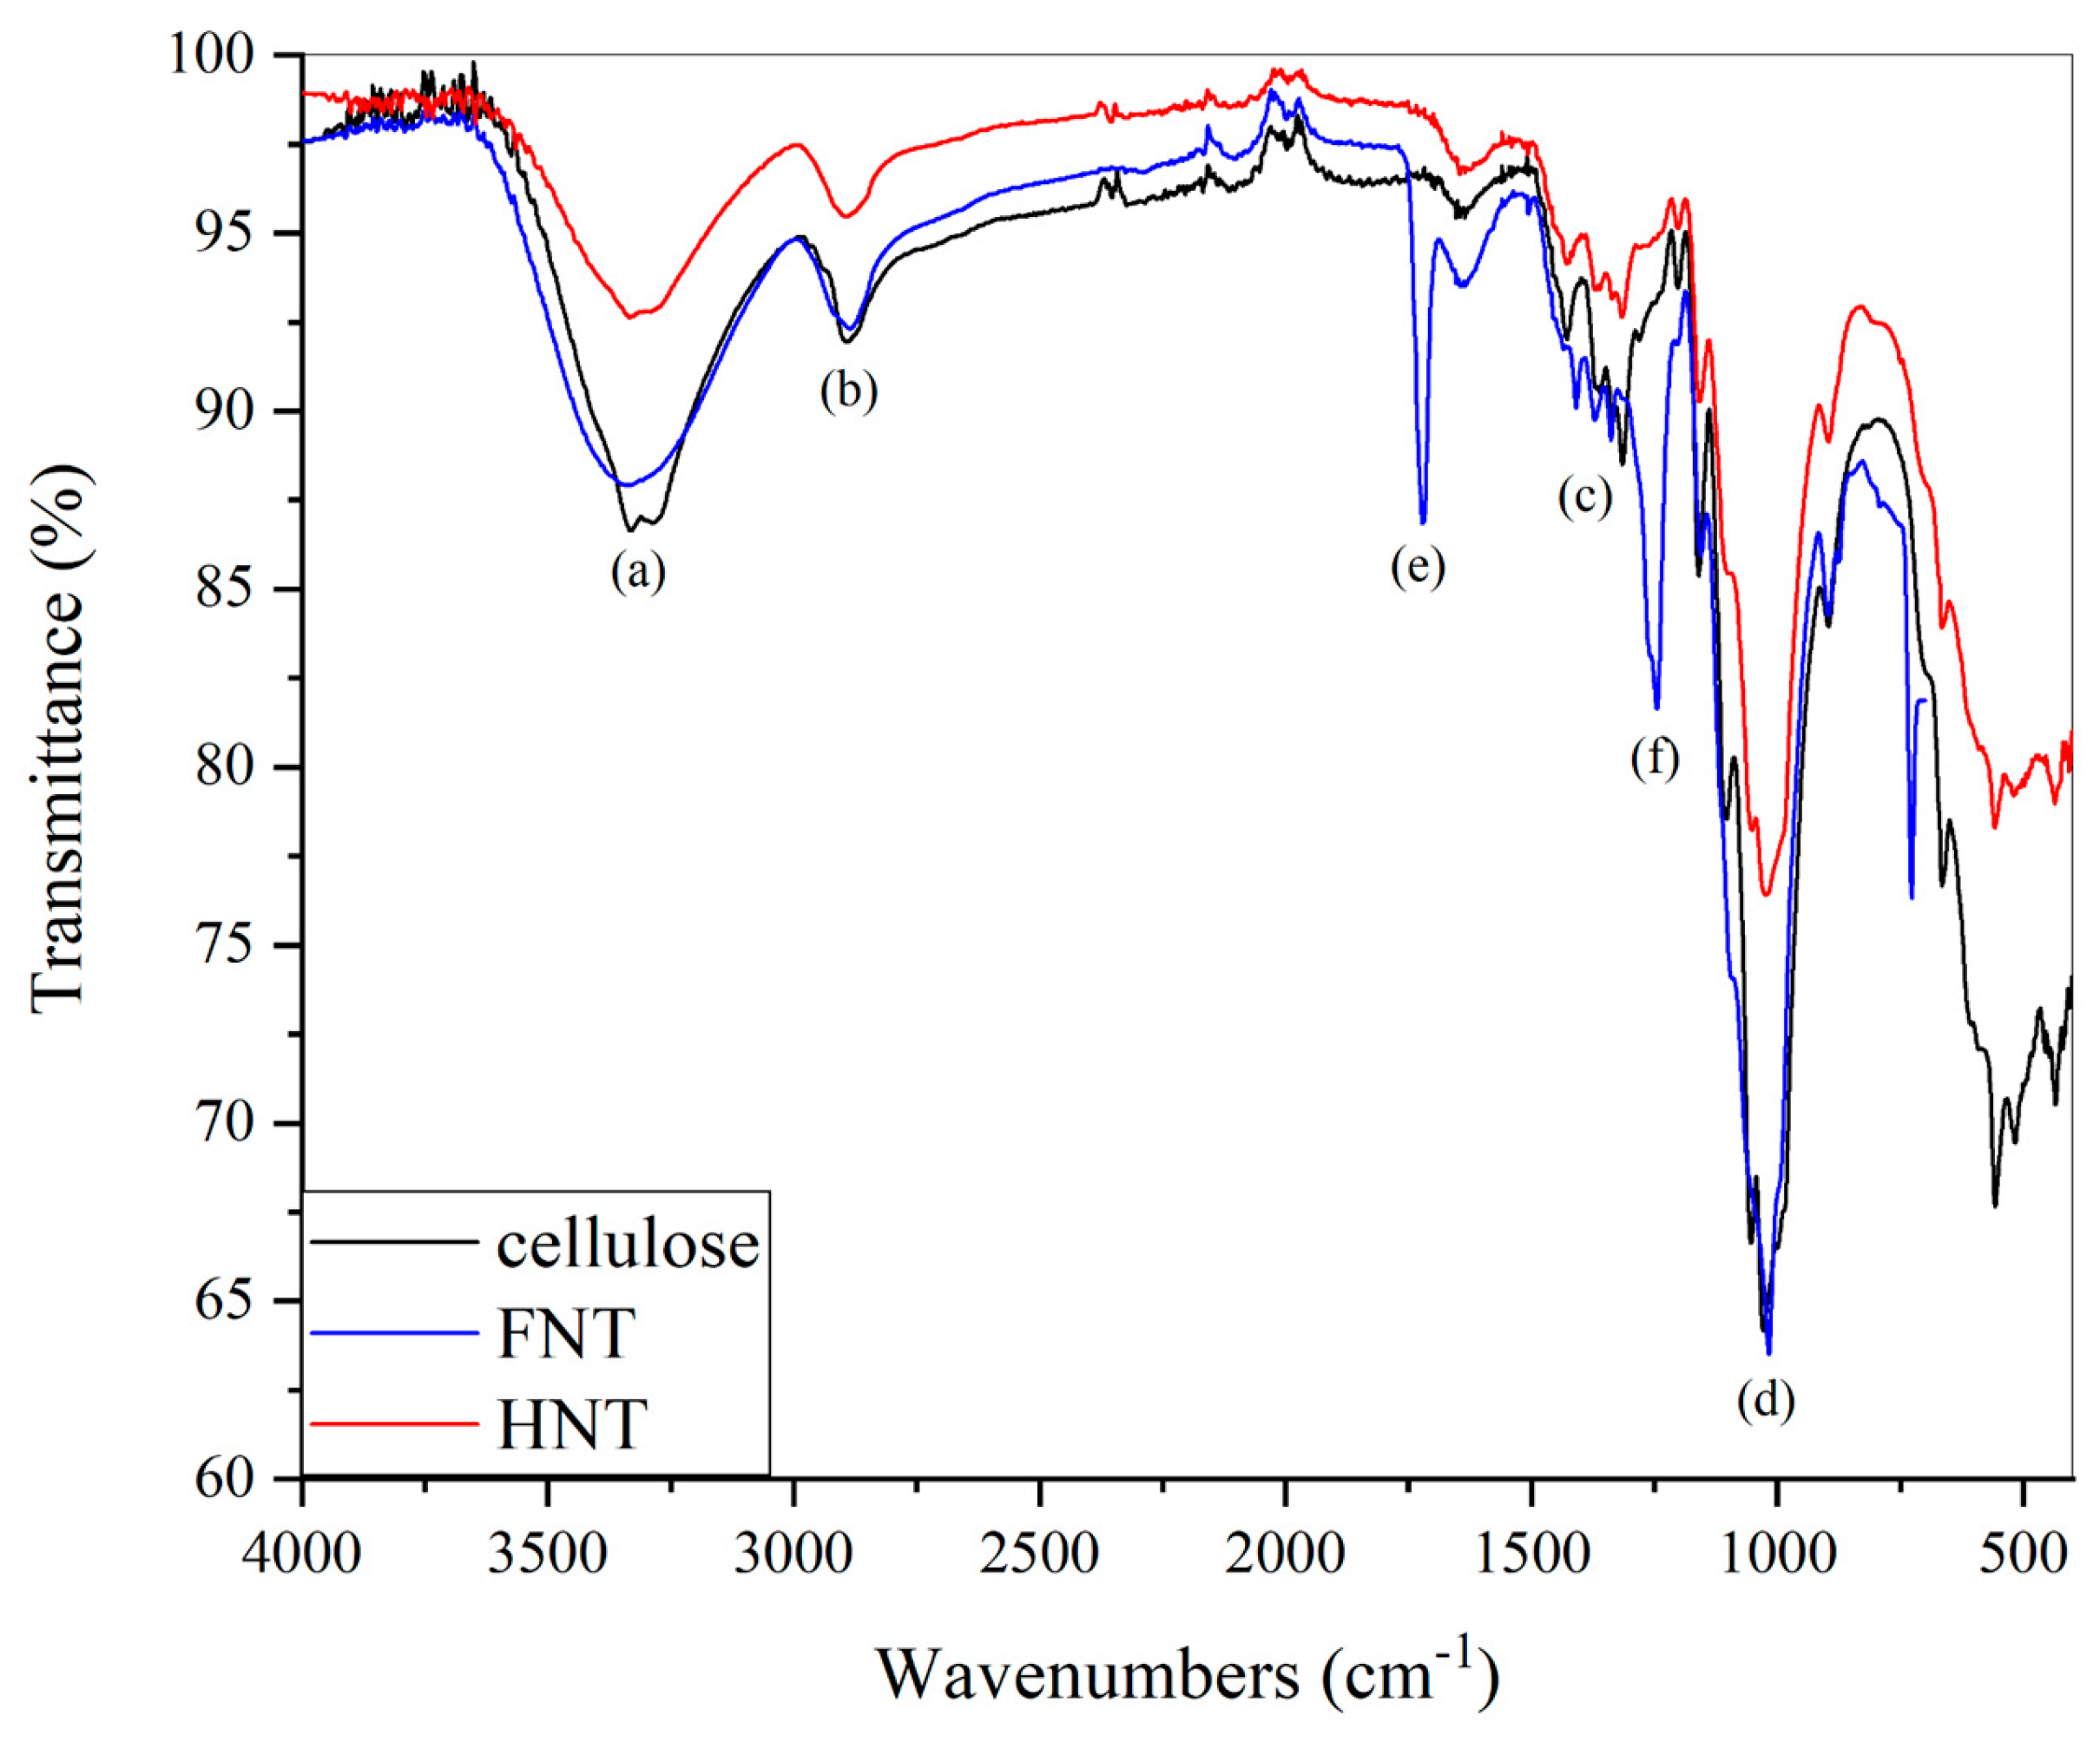
Figure 3.
Mass lost (%) for treated fibres with all parameters’ combinations.
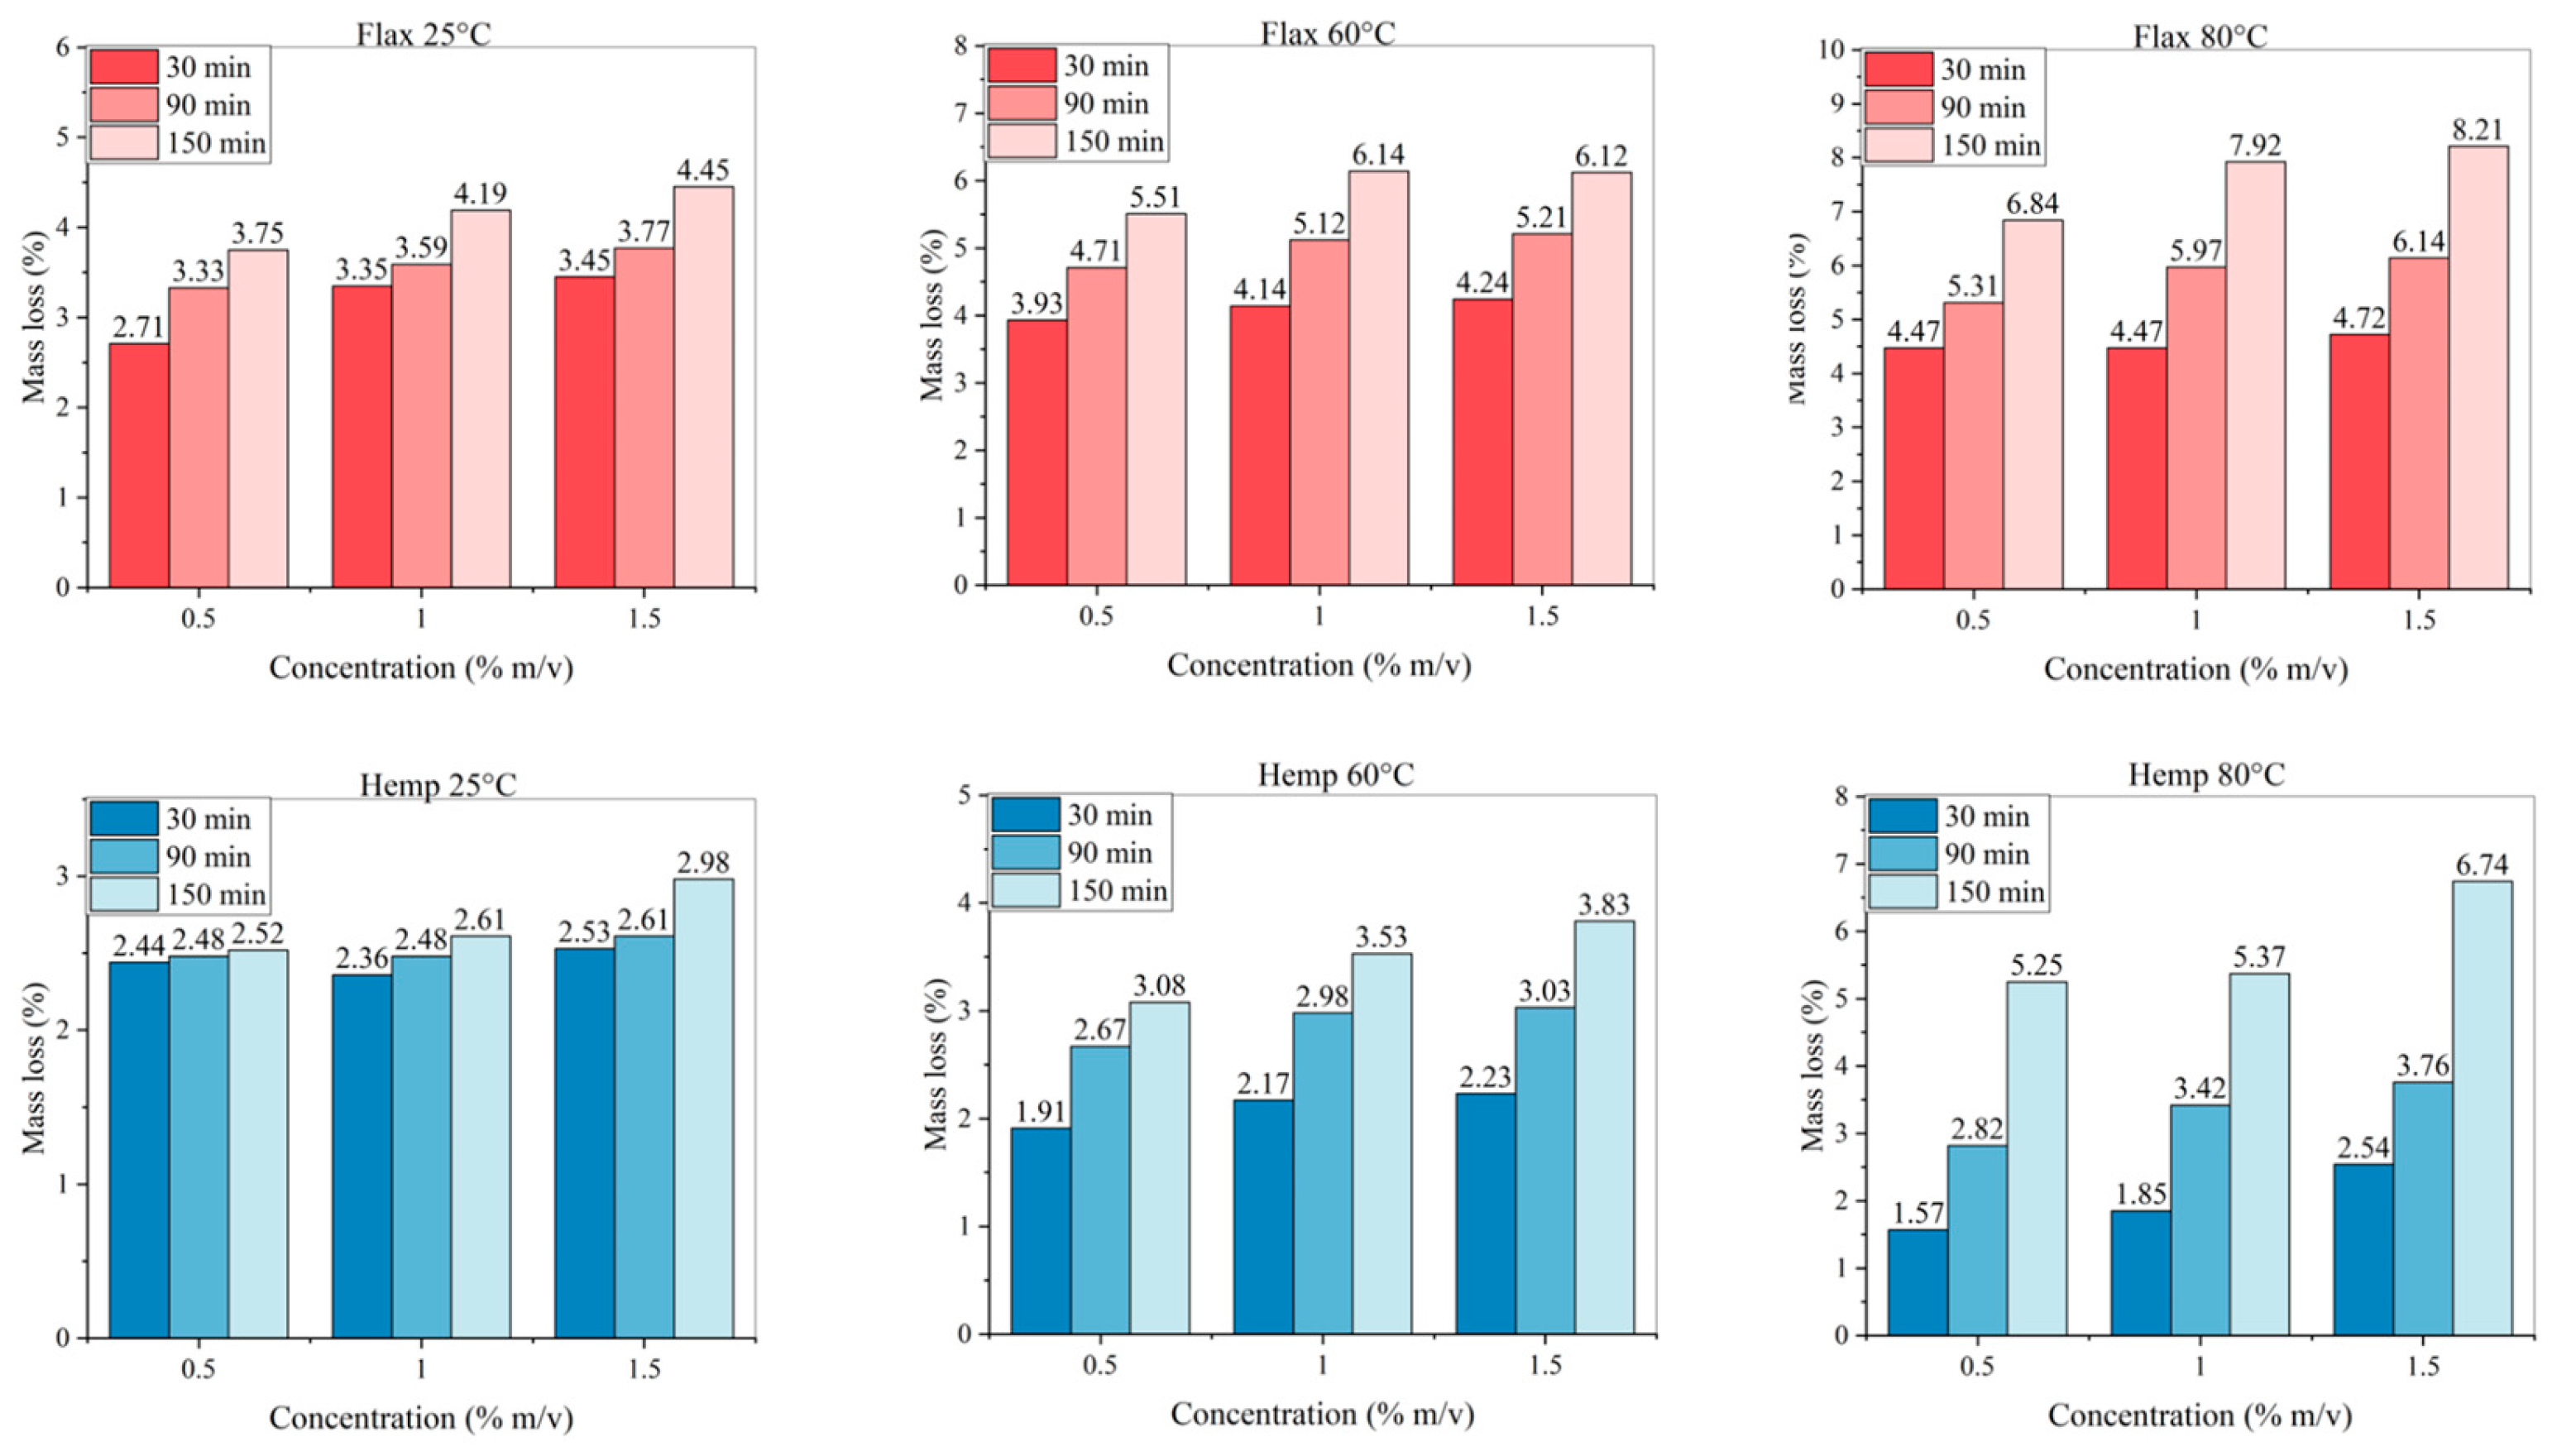
Figure 4.
Mass loss (%) for treated fibres with selected combinations.
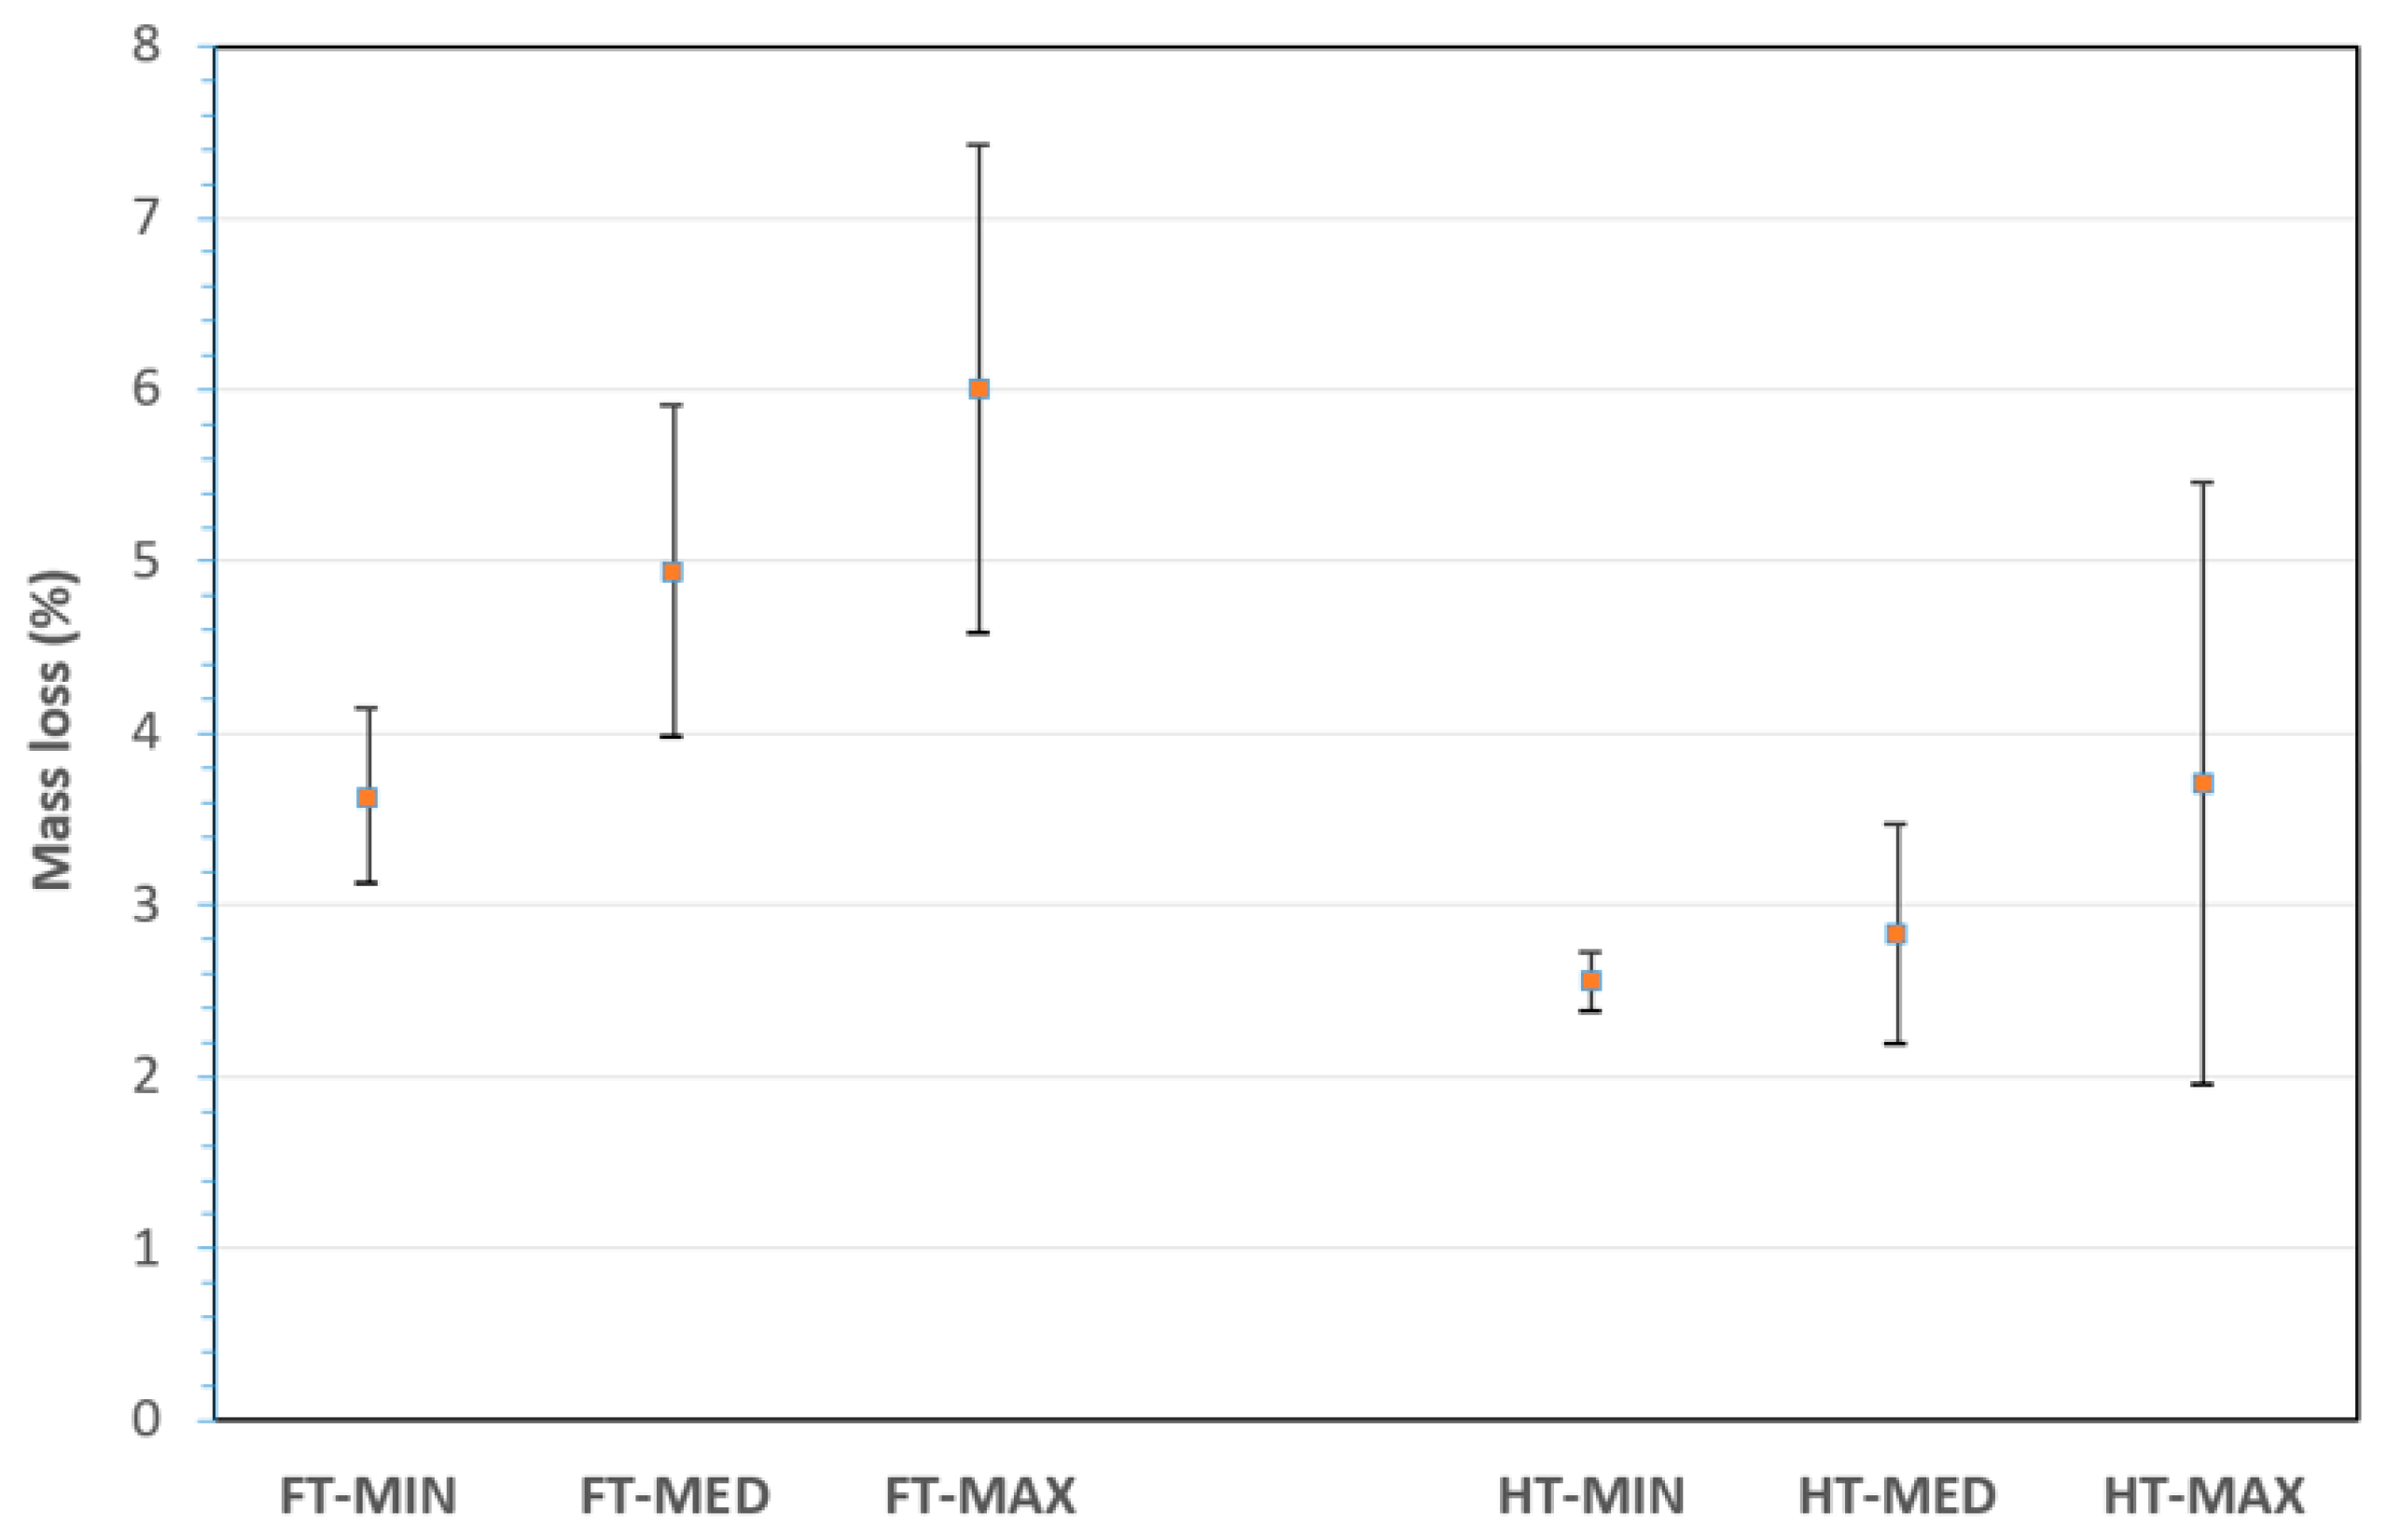
Figure 5.
Thermogravimetric analysis (TGA) for: a) hemp treated and untreated samples, and b) flax treated and untreated samples, in both cases compared to cellulose reference.
Figure 5.
Thermogravimetric analysis (TGA) for: a) hemp treated and untreated samples, and b) flax treated and untreated samples, in both cases compared to cellulose reference.
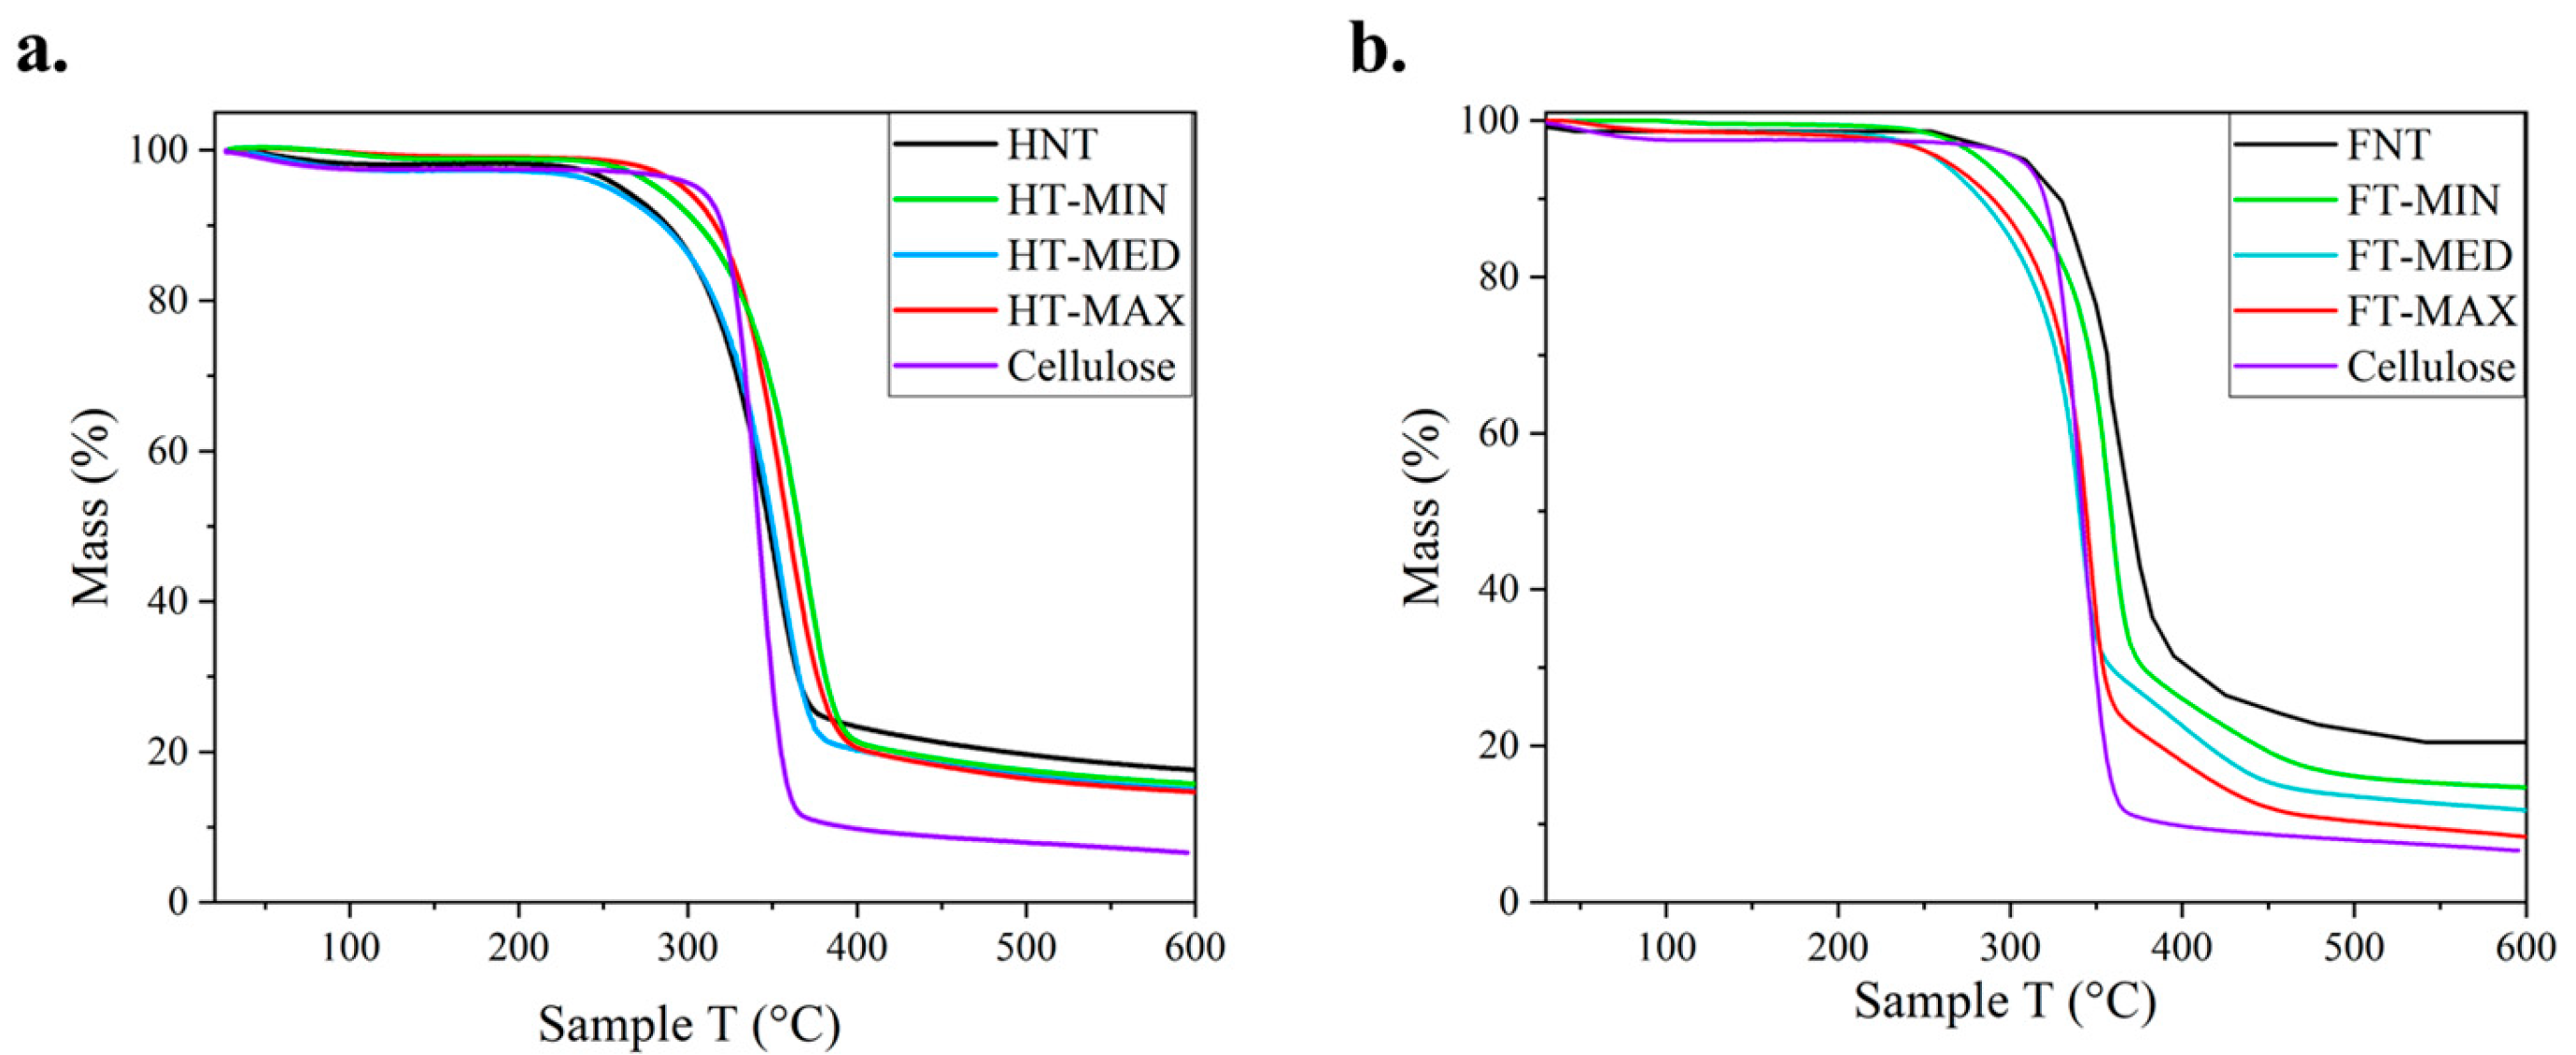
Figure 6.
Differential Scanning Calorimetry (DSC) analysis for max-treated and untreated samples.
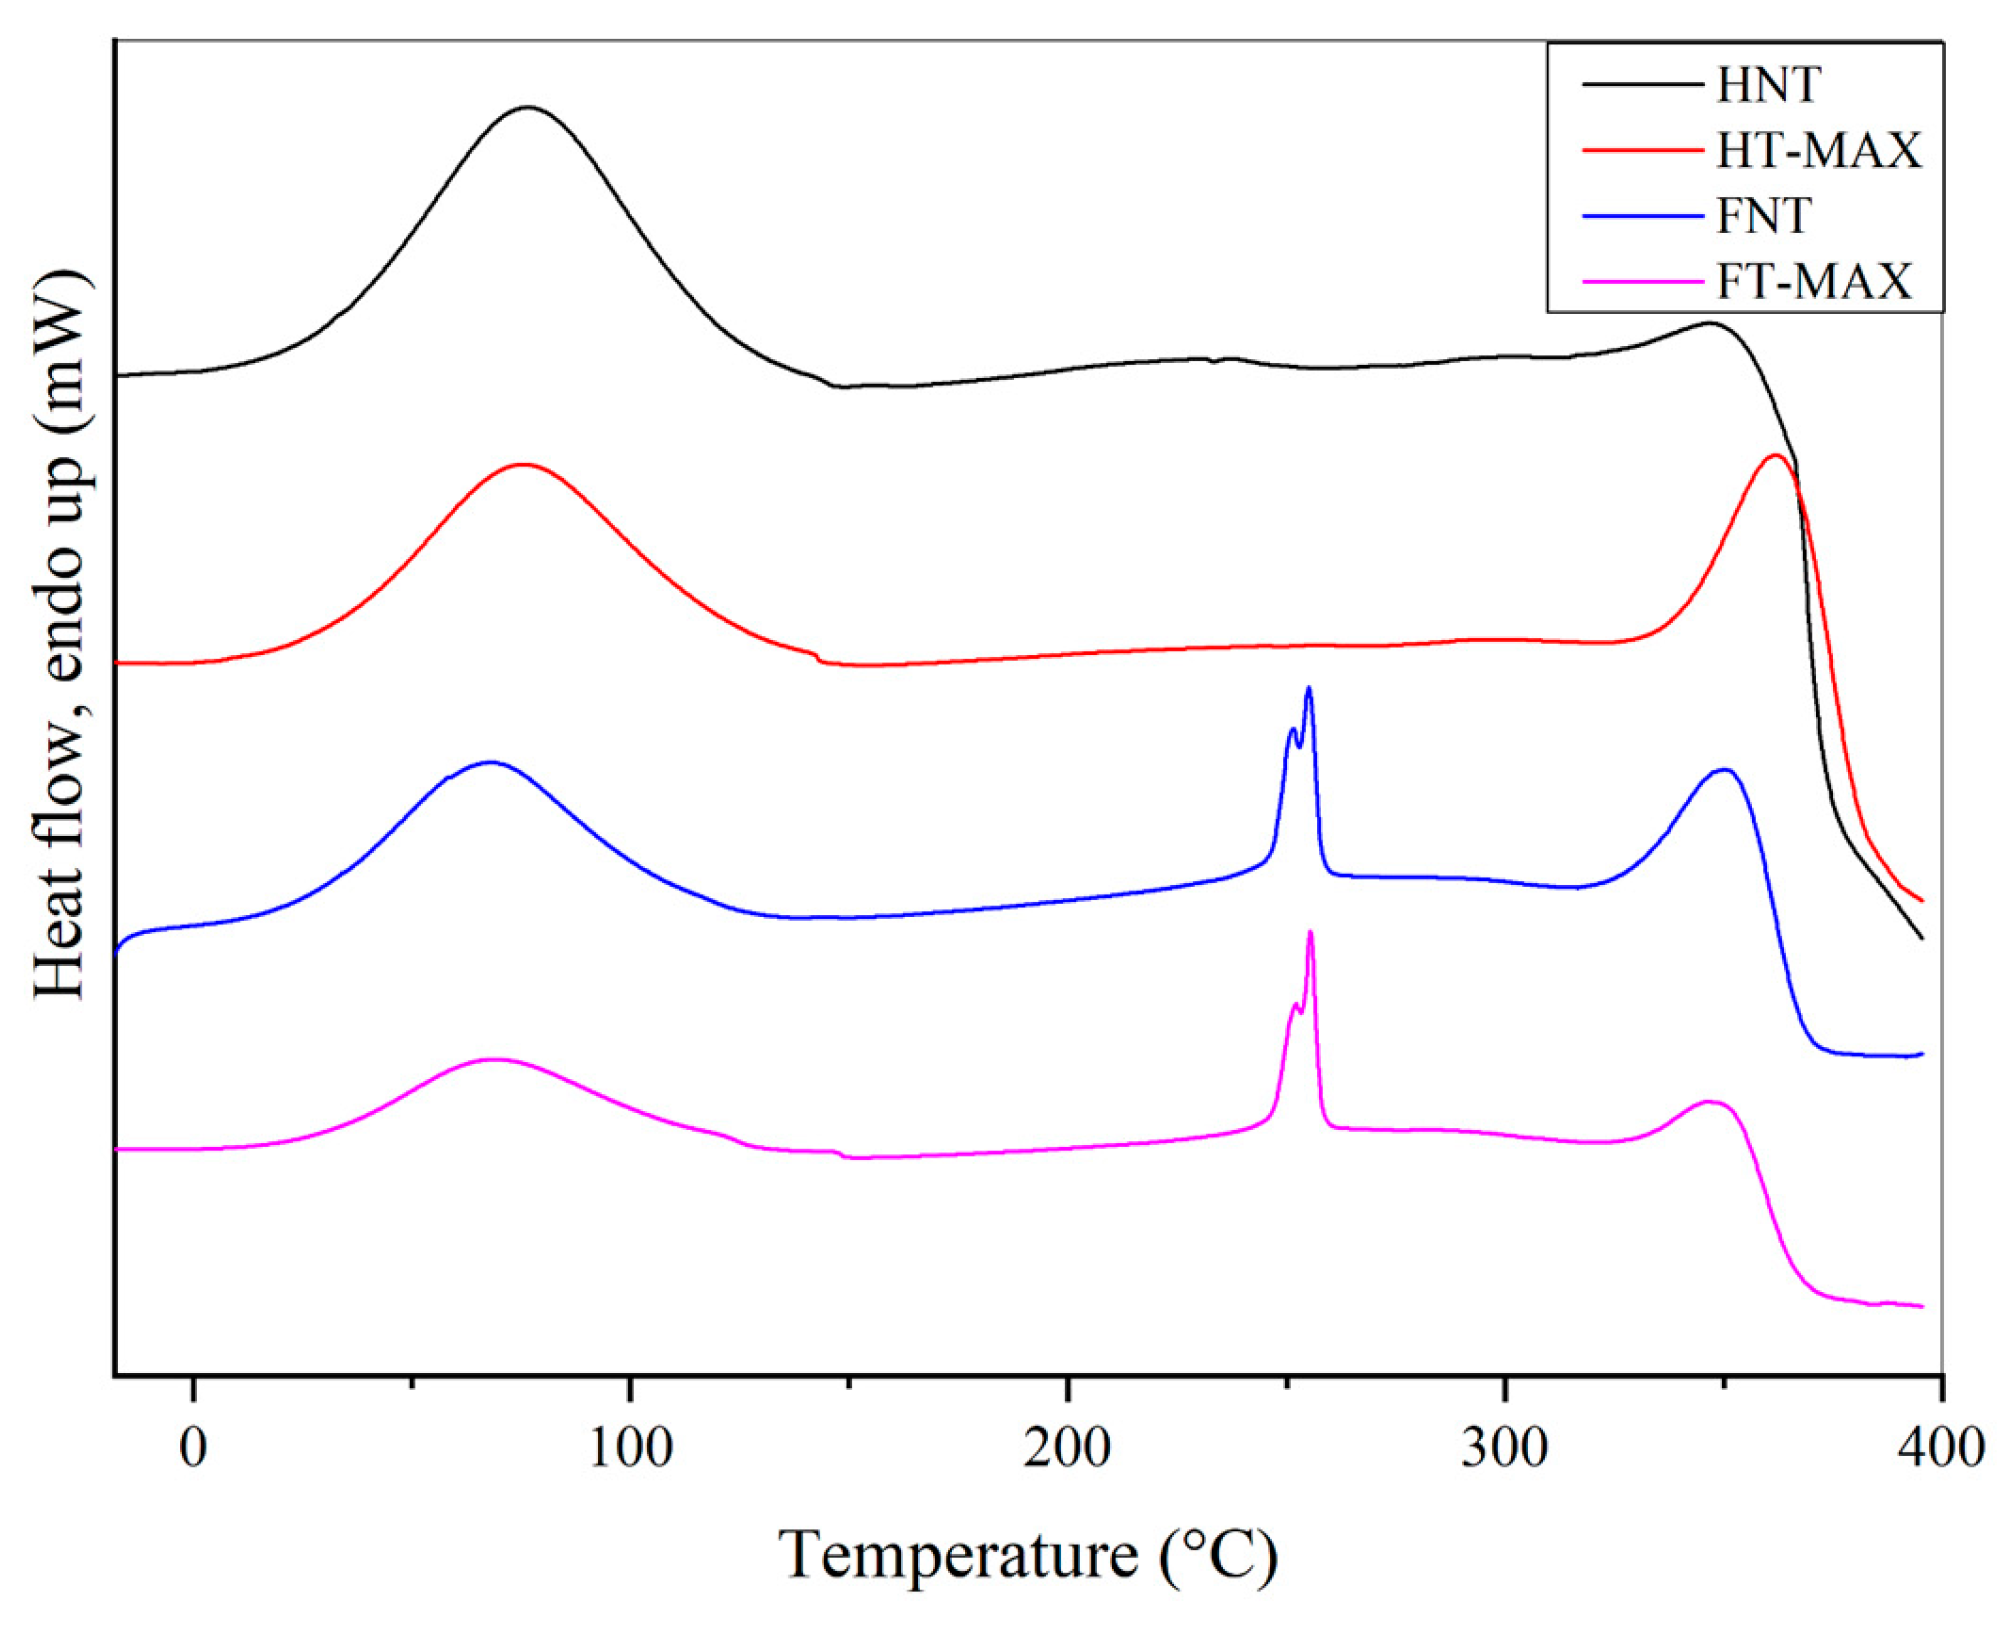
Figure 7.
XRD profiles of untreated hemp (a) and flax (c) fibres (black lines) with their deconvolution curves (crystalline peaks: orange lines; cumulative fit curve: green line); PXRD patterns of the untreated and treated hemp (b) flax (d) fibres and Ic(%) values calculated for the fibres.
Figure 7.
XRD profiles of untreated hemp (a) and flax (c) fibres (black lines) with their deconvolution curves (crystalline peaks: orange lines; cumulative fit curve: green line); PXRD patterns of the untreated and treated hemp (b) flax (d) fibres and Ic(%) values calculated for the fibres.
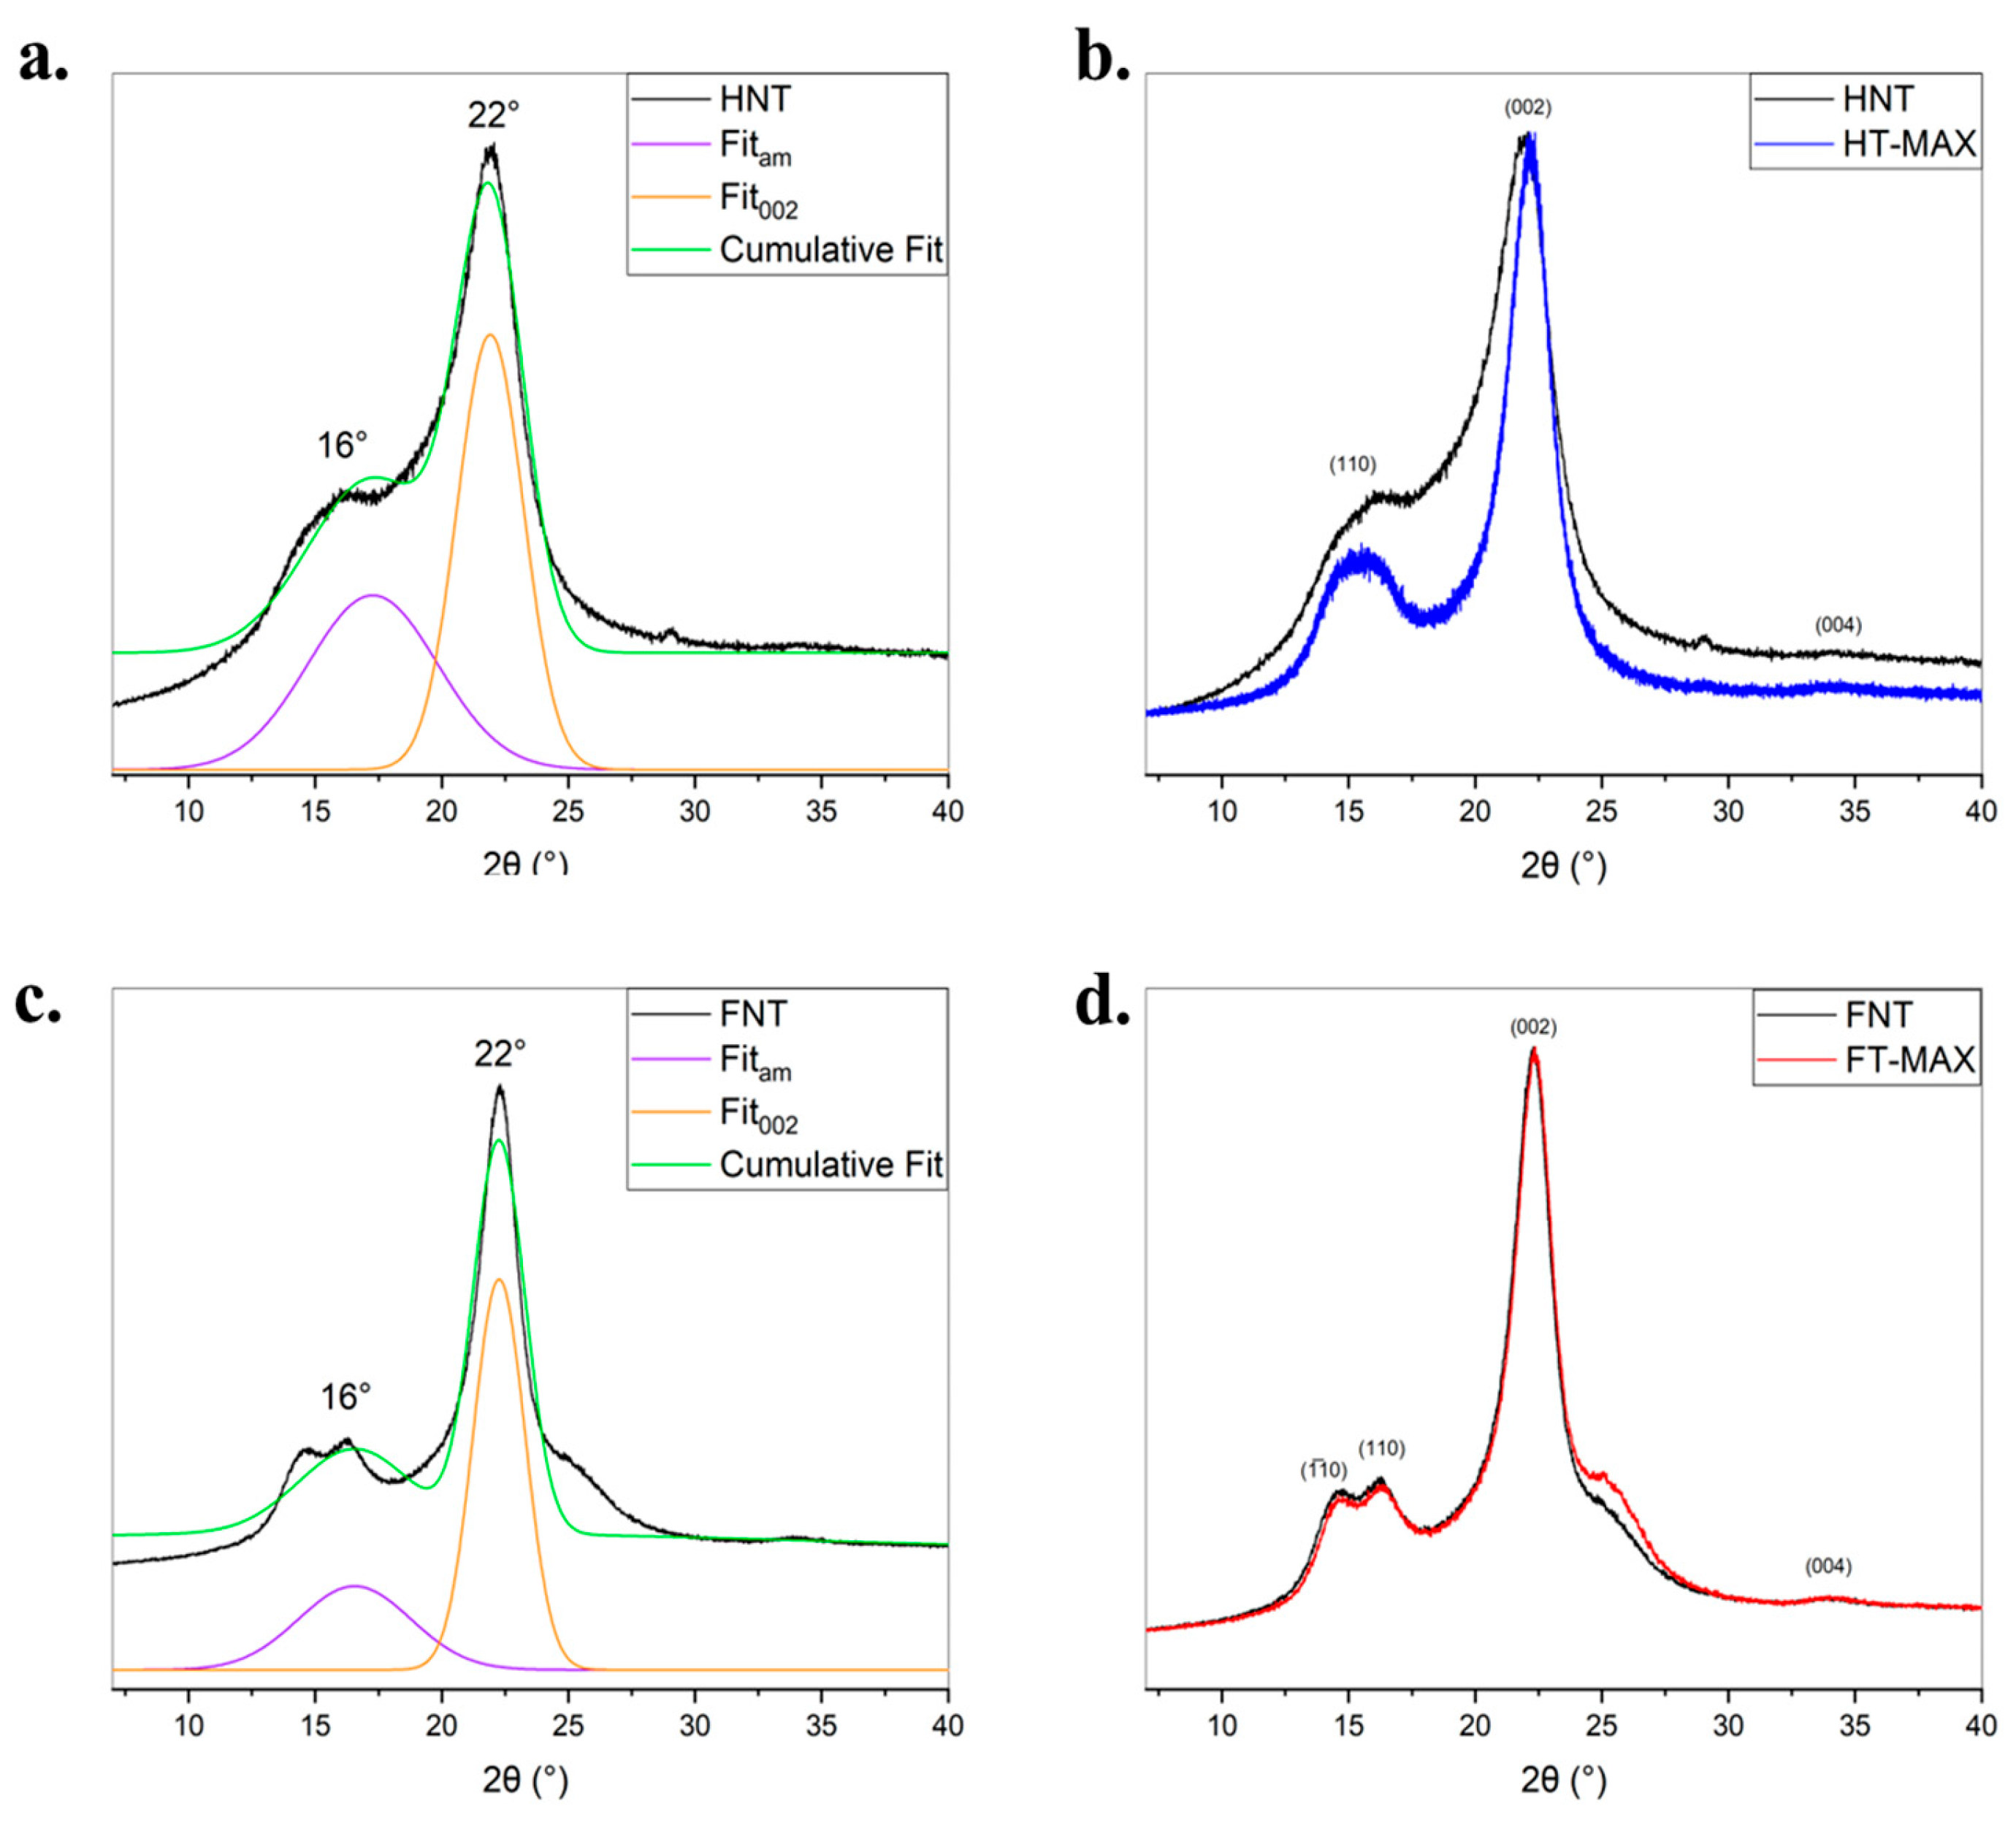
Figure 8.
Adsorption/desorption isotherms of treated and untreated flax samples (a) and hemp samples (c); Pore size distribution of treated and untreated flax samples (b) and hemp samples (d) derived from the N2 adsorption data isotherms, calculated by fitting the NL-DFT model.
Figure 8.
Adsorption/desorption isotherms of treated and untreated flax samples (a) and hemp samples (c); Pore size distribution of treated and untreated flax samples (b) and hemp samples (d) derived from the N2 adsorption data isotherms, calculated by fitting the NL-DFT model.
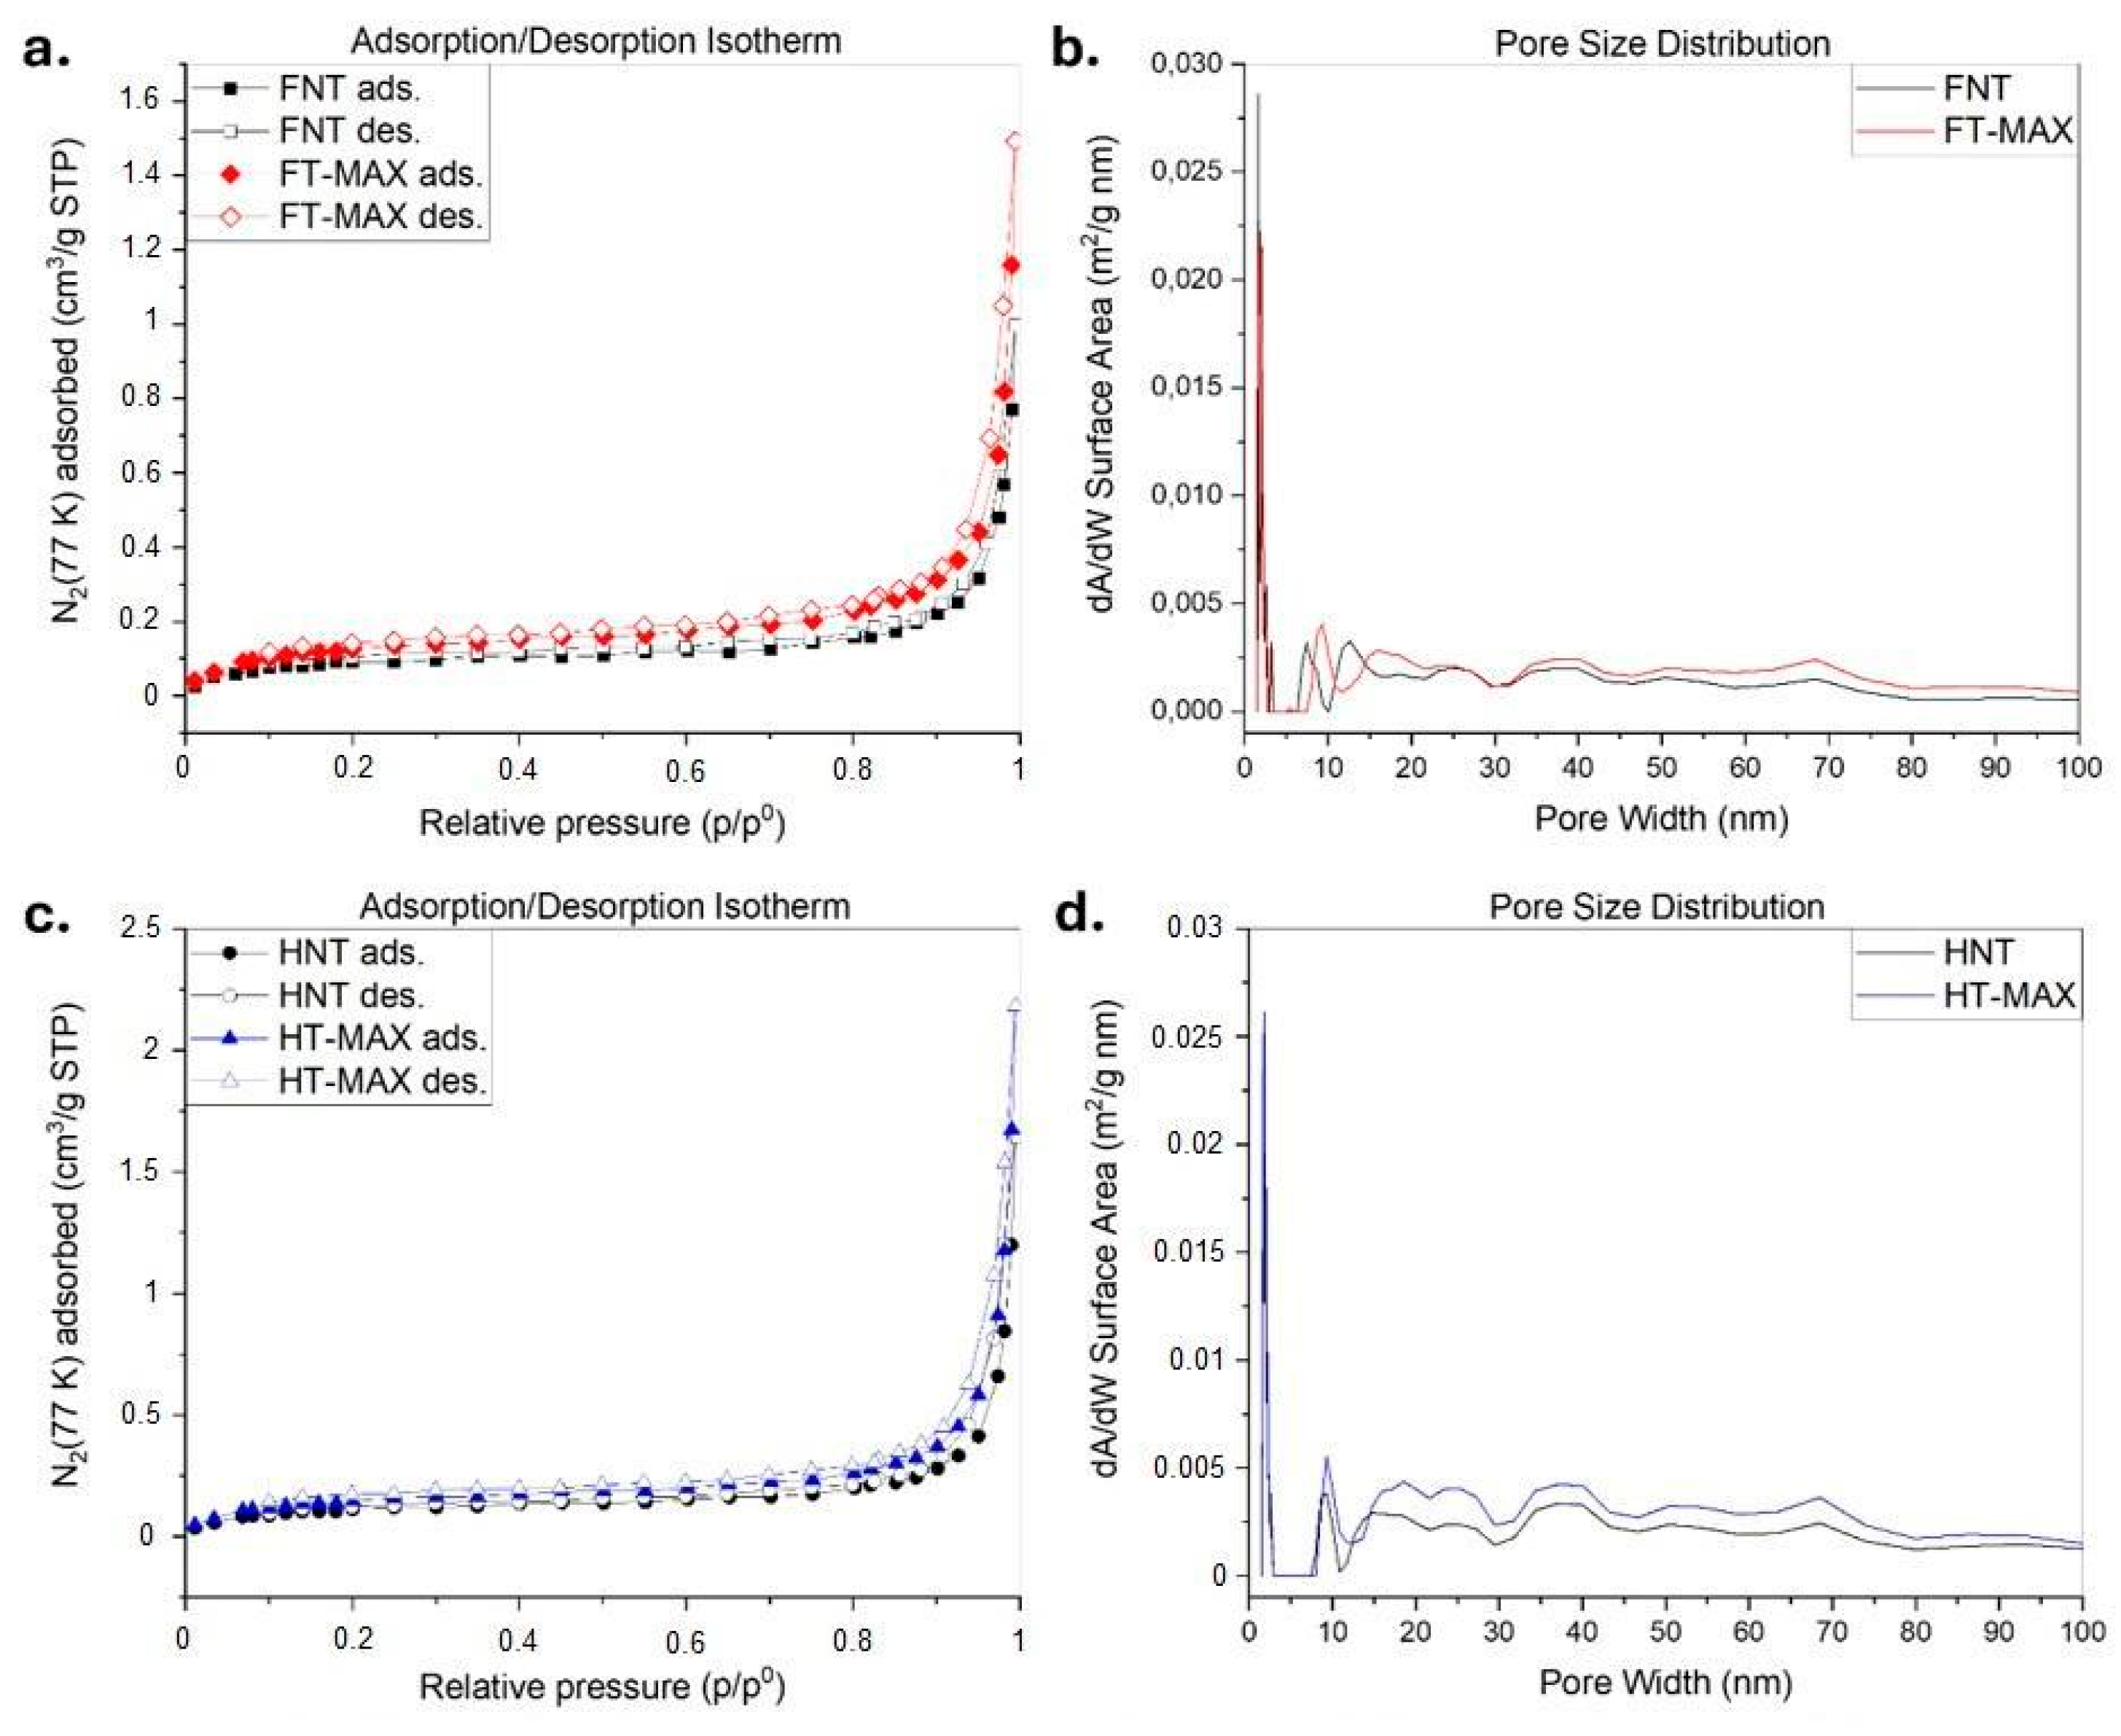
Figure 9.
SEM morphological observations for different flax untreated and treated fibres: a) and b) FNT; c) and d) FT-MIN; e) and f) FT-MED; g) and h) FT-MAX.
Figure 9.
SEM morphological observations for different flax untreated and treated fibres: a) and b) FNT; c) and d) FT-MIN; e) and f) FT-MED; g) and h) FT-MAX.
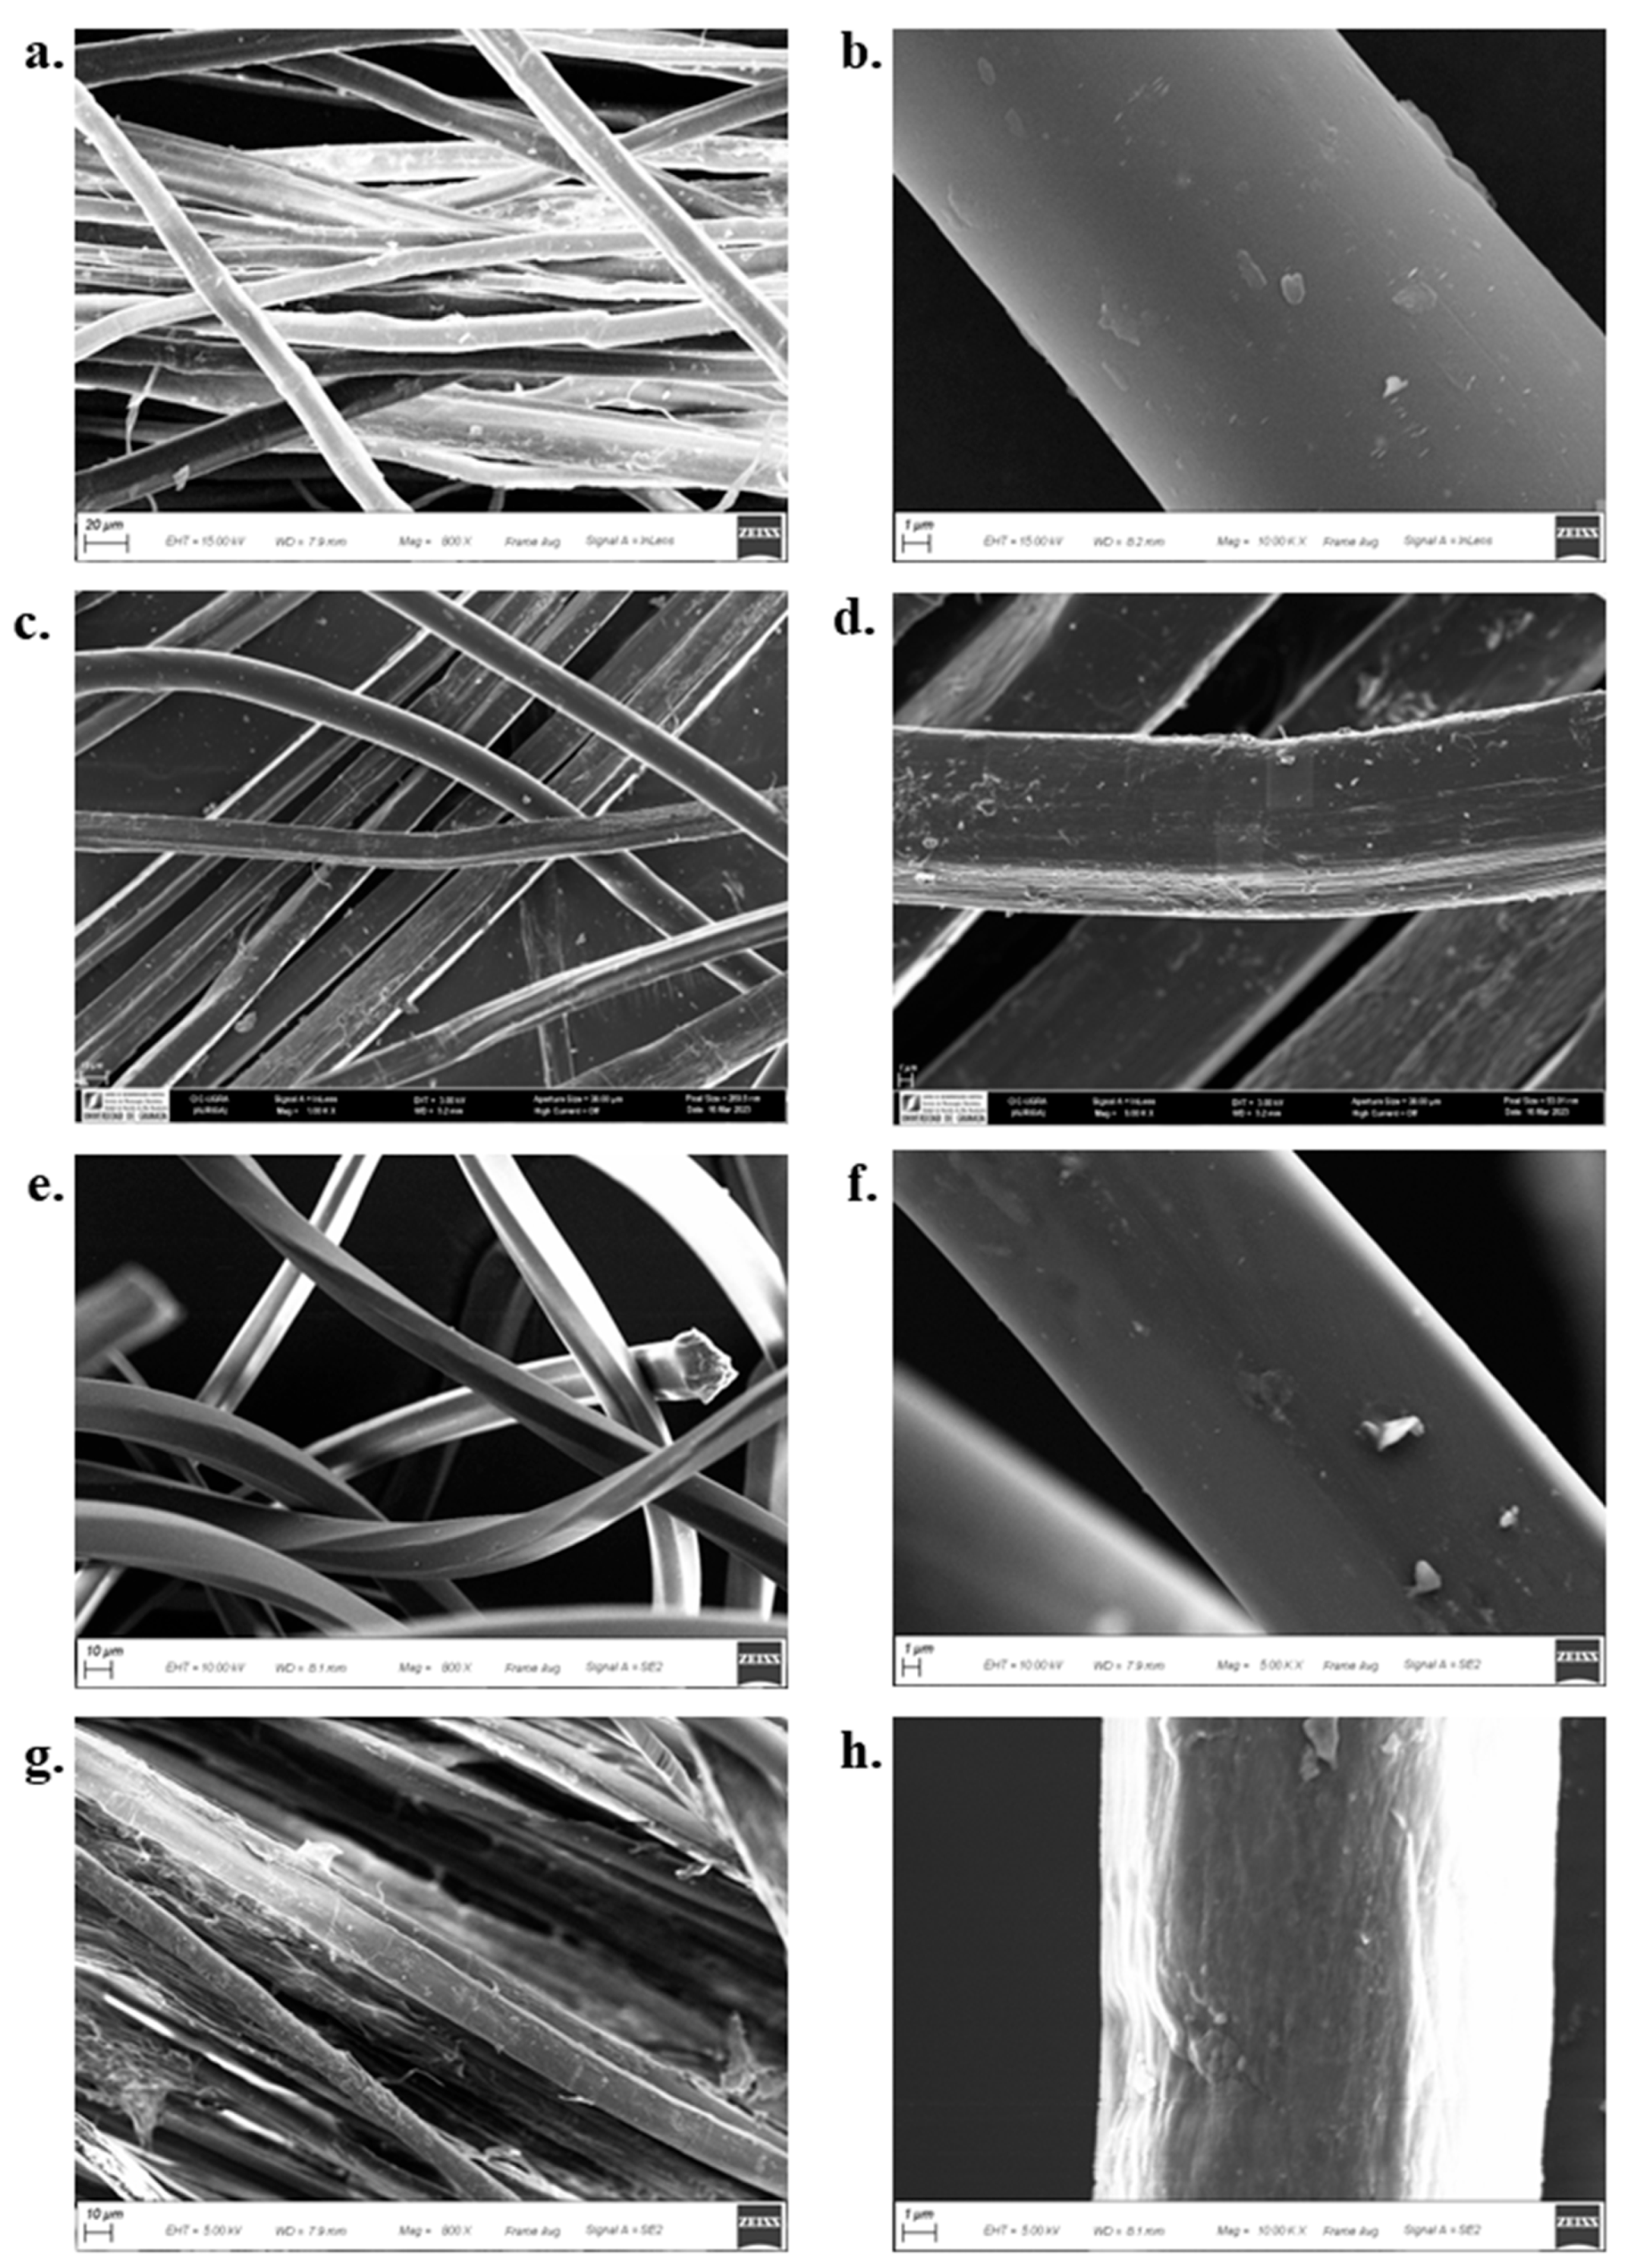
Figure 10.
SEM morphological observations for different hemp untreated and treated fibres: a) and b) HNT, c) and d) HT-MIN, e) and f) HT-MED, g) and h) HT-MAX.
Figure 10.
SEM morphological observations for different hemp untreated and treated fibres: a) and b) HNT, c) and d) HT-MIN, e) and f) HT-MED, g) and h) HT-MAX.
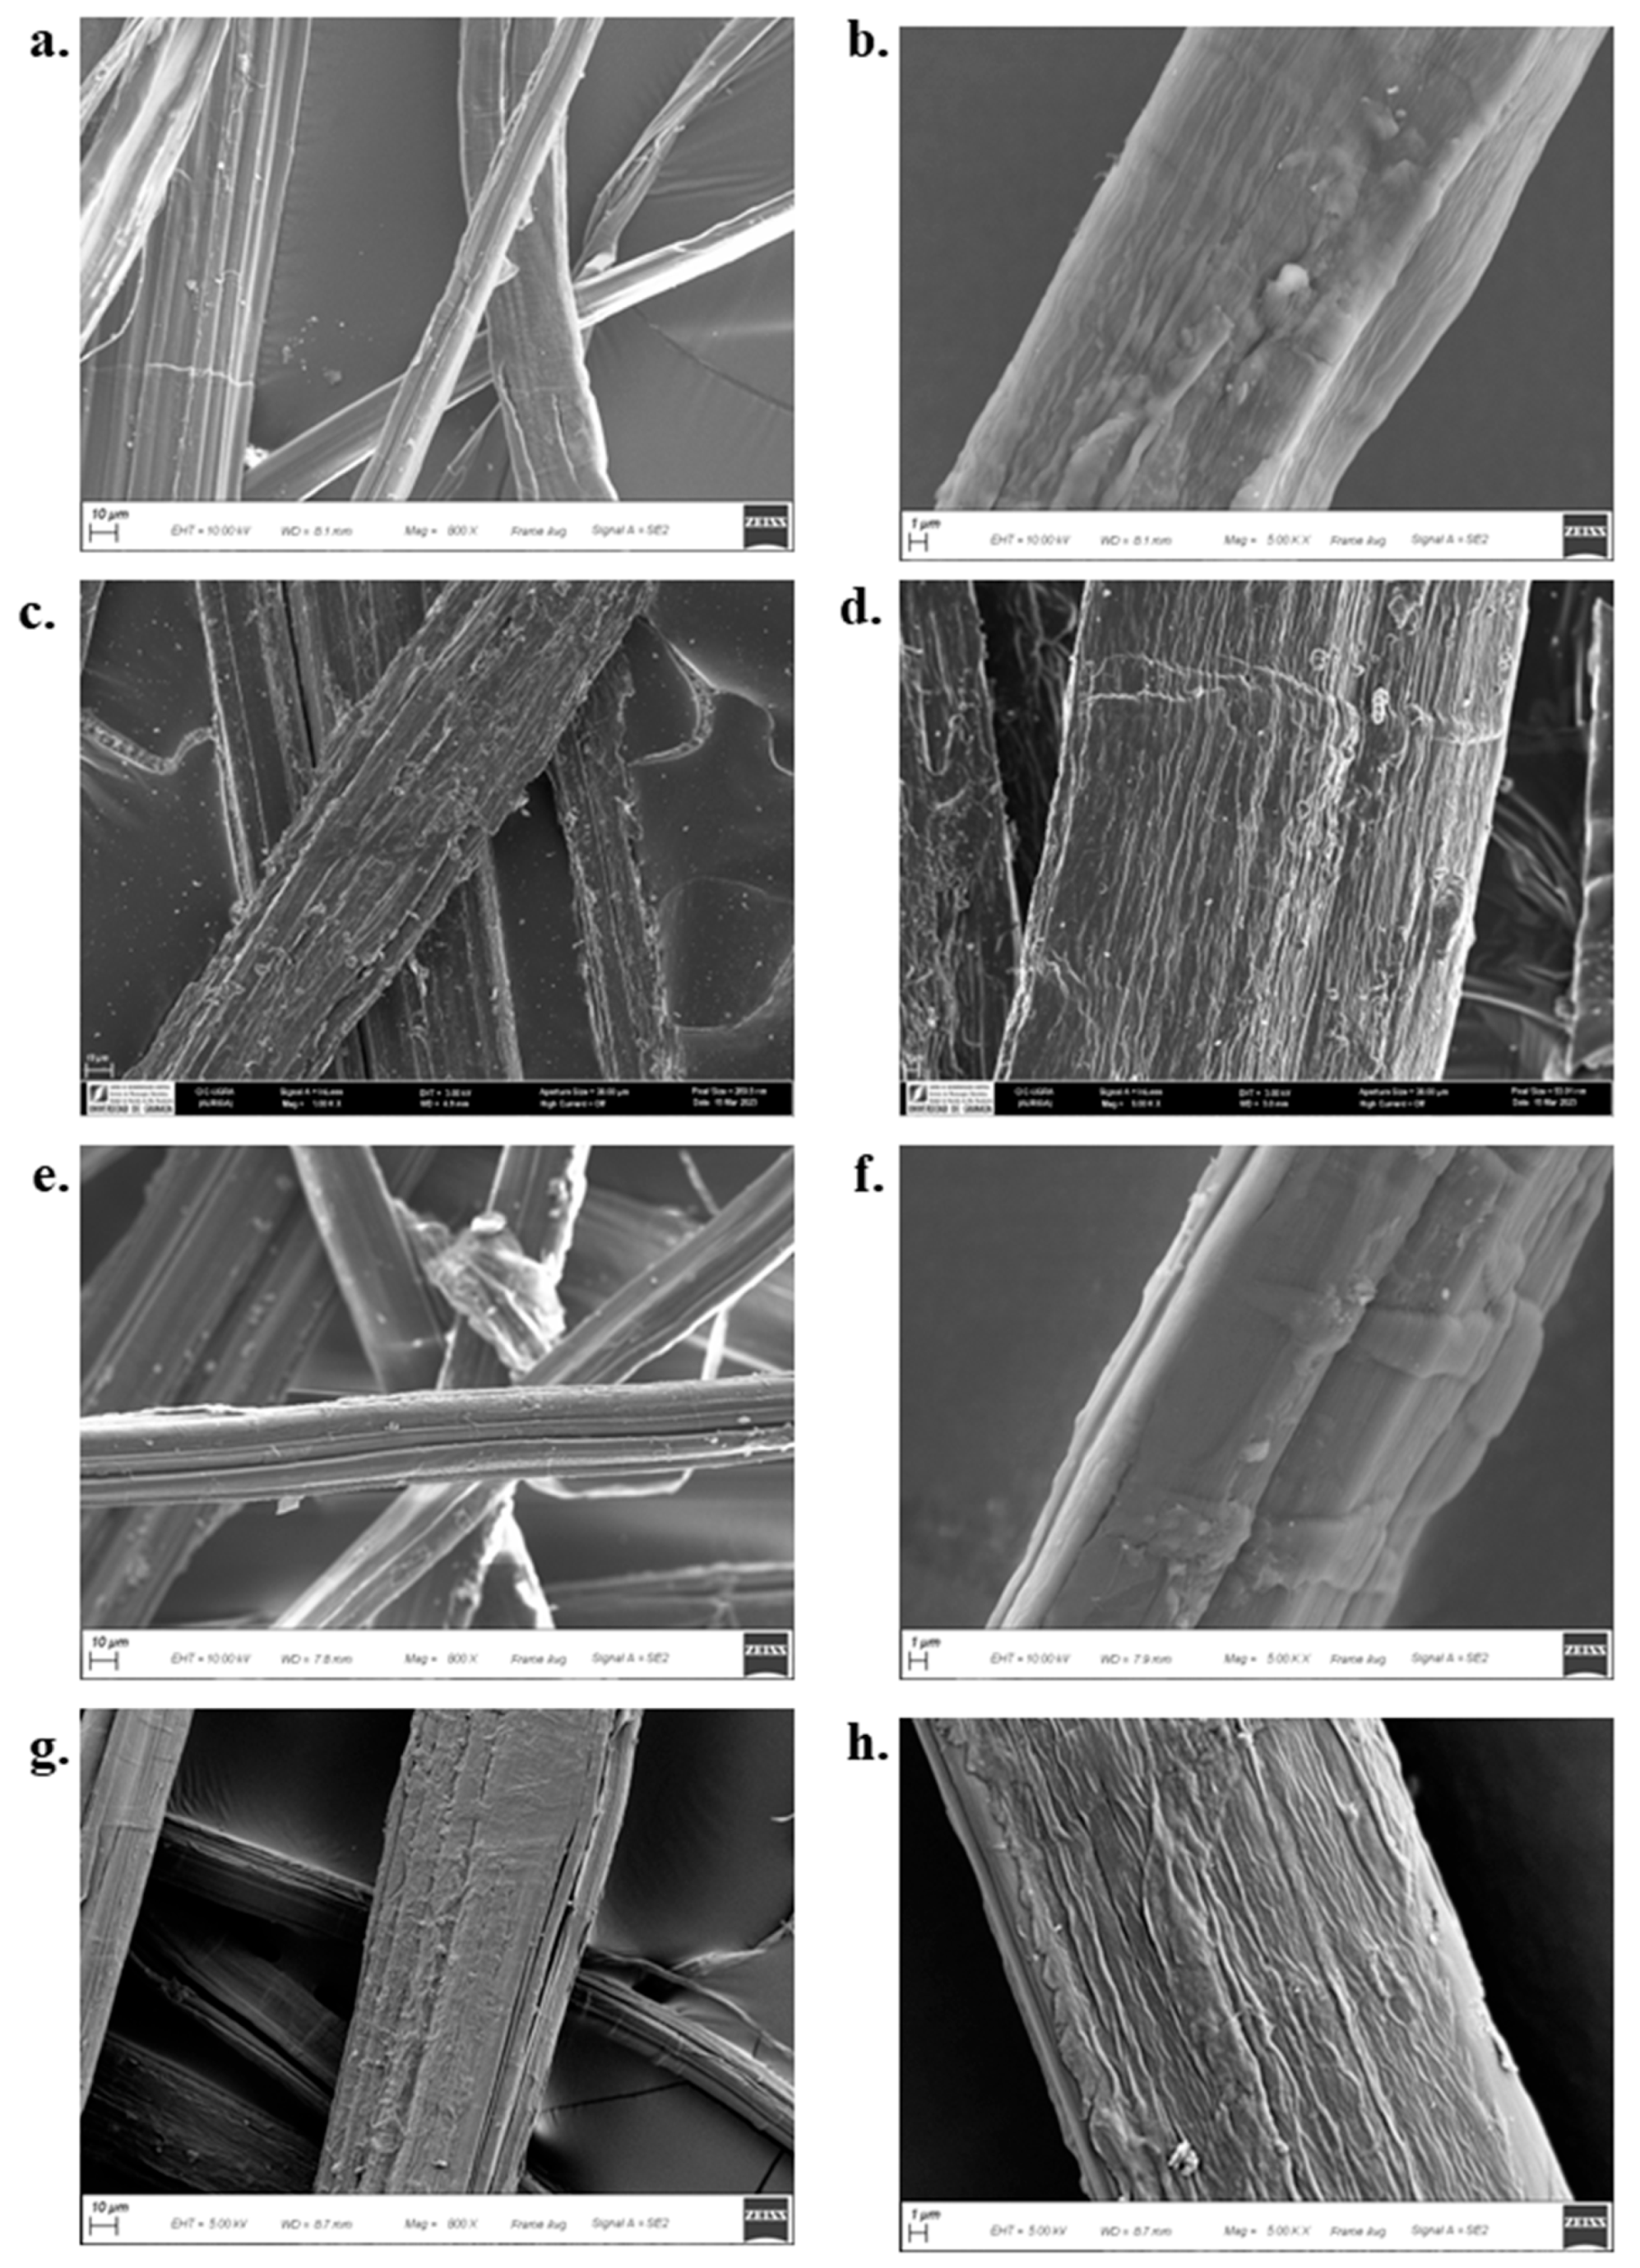
Figure 11.
Optical micrographs of samples tested for roughness under atomic force microscopy (AFM).
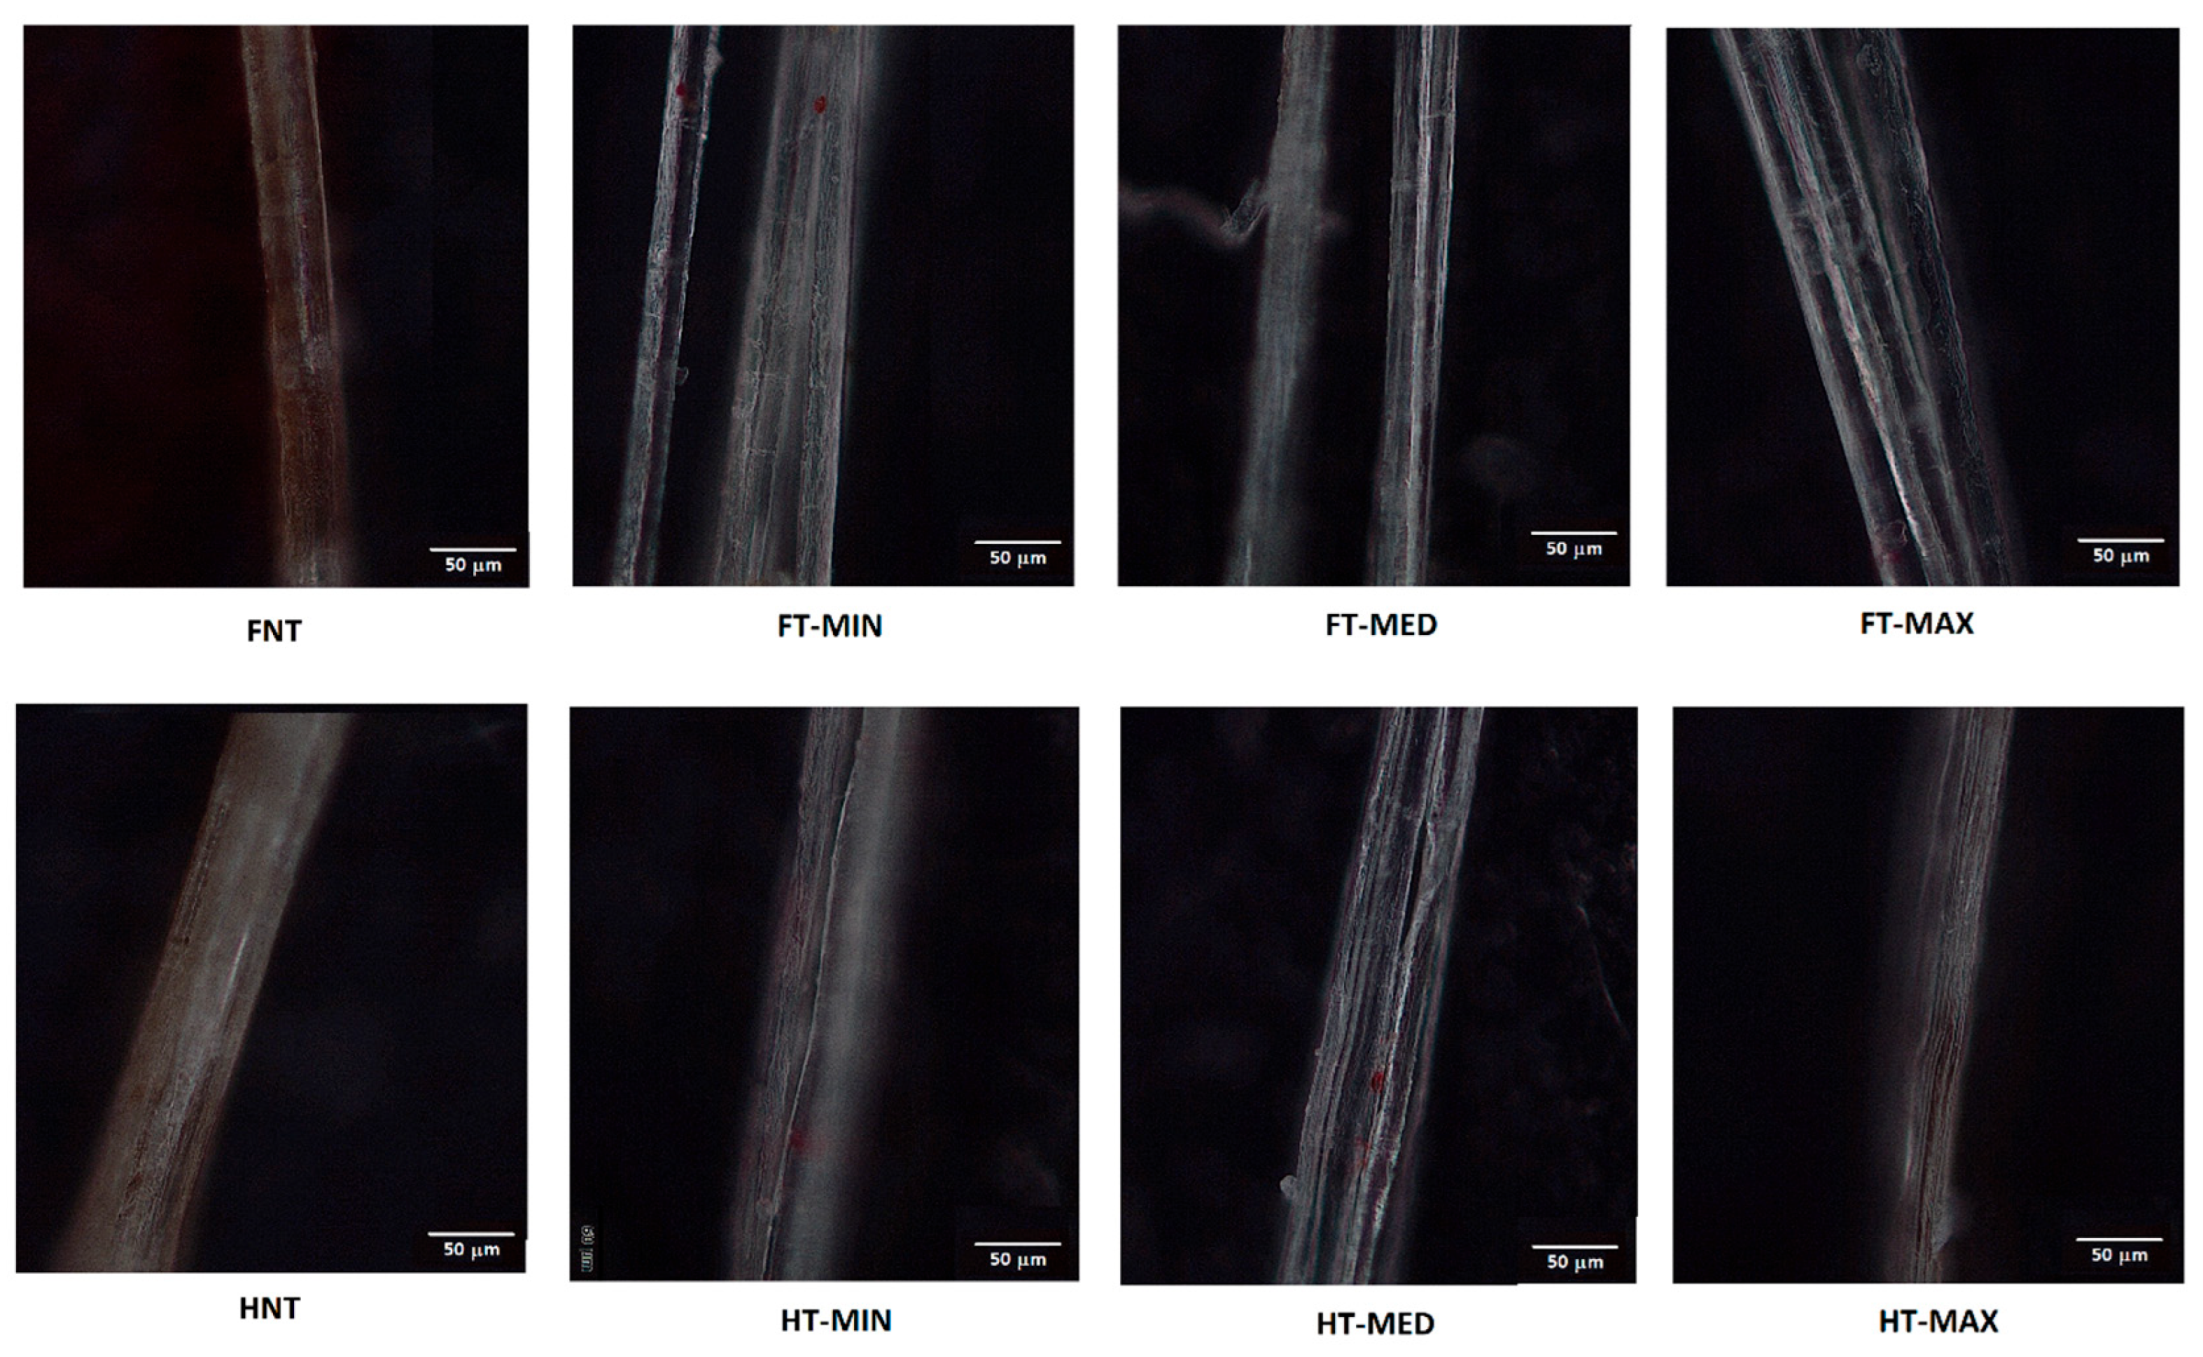
Figure 12.
AFM images of flax fibre: a) sample FNT, b) sample FT-MIN; c) sample FT-MED; d) sample FT-MAX.
Figure 12.
AFM images of flax fibre: a) sample FNT, b) sample FT-MIN; c) sample FT-MED; d) sample FT-MAX.
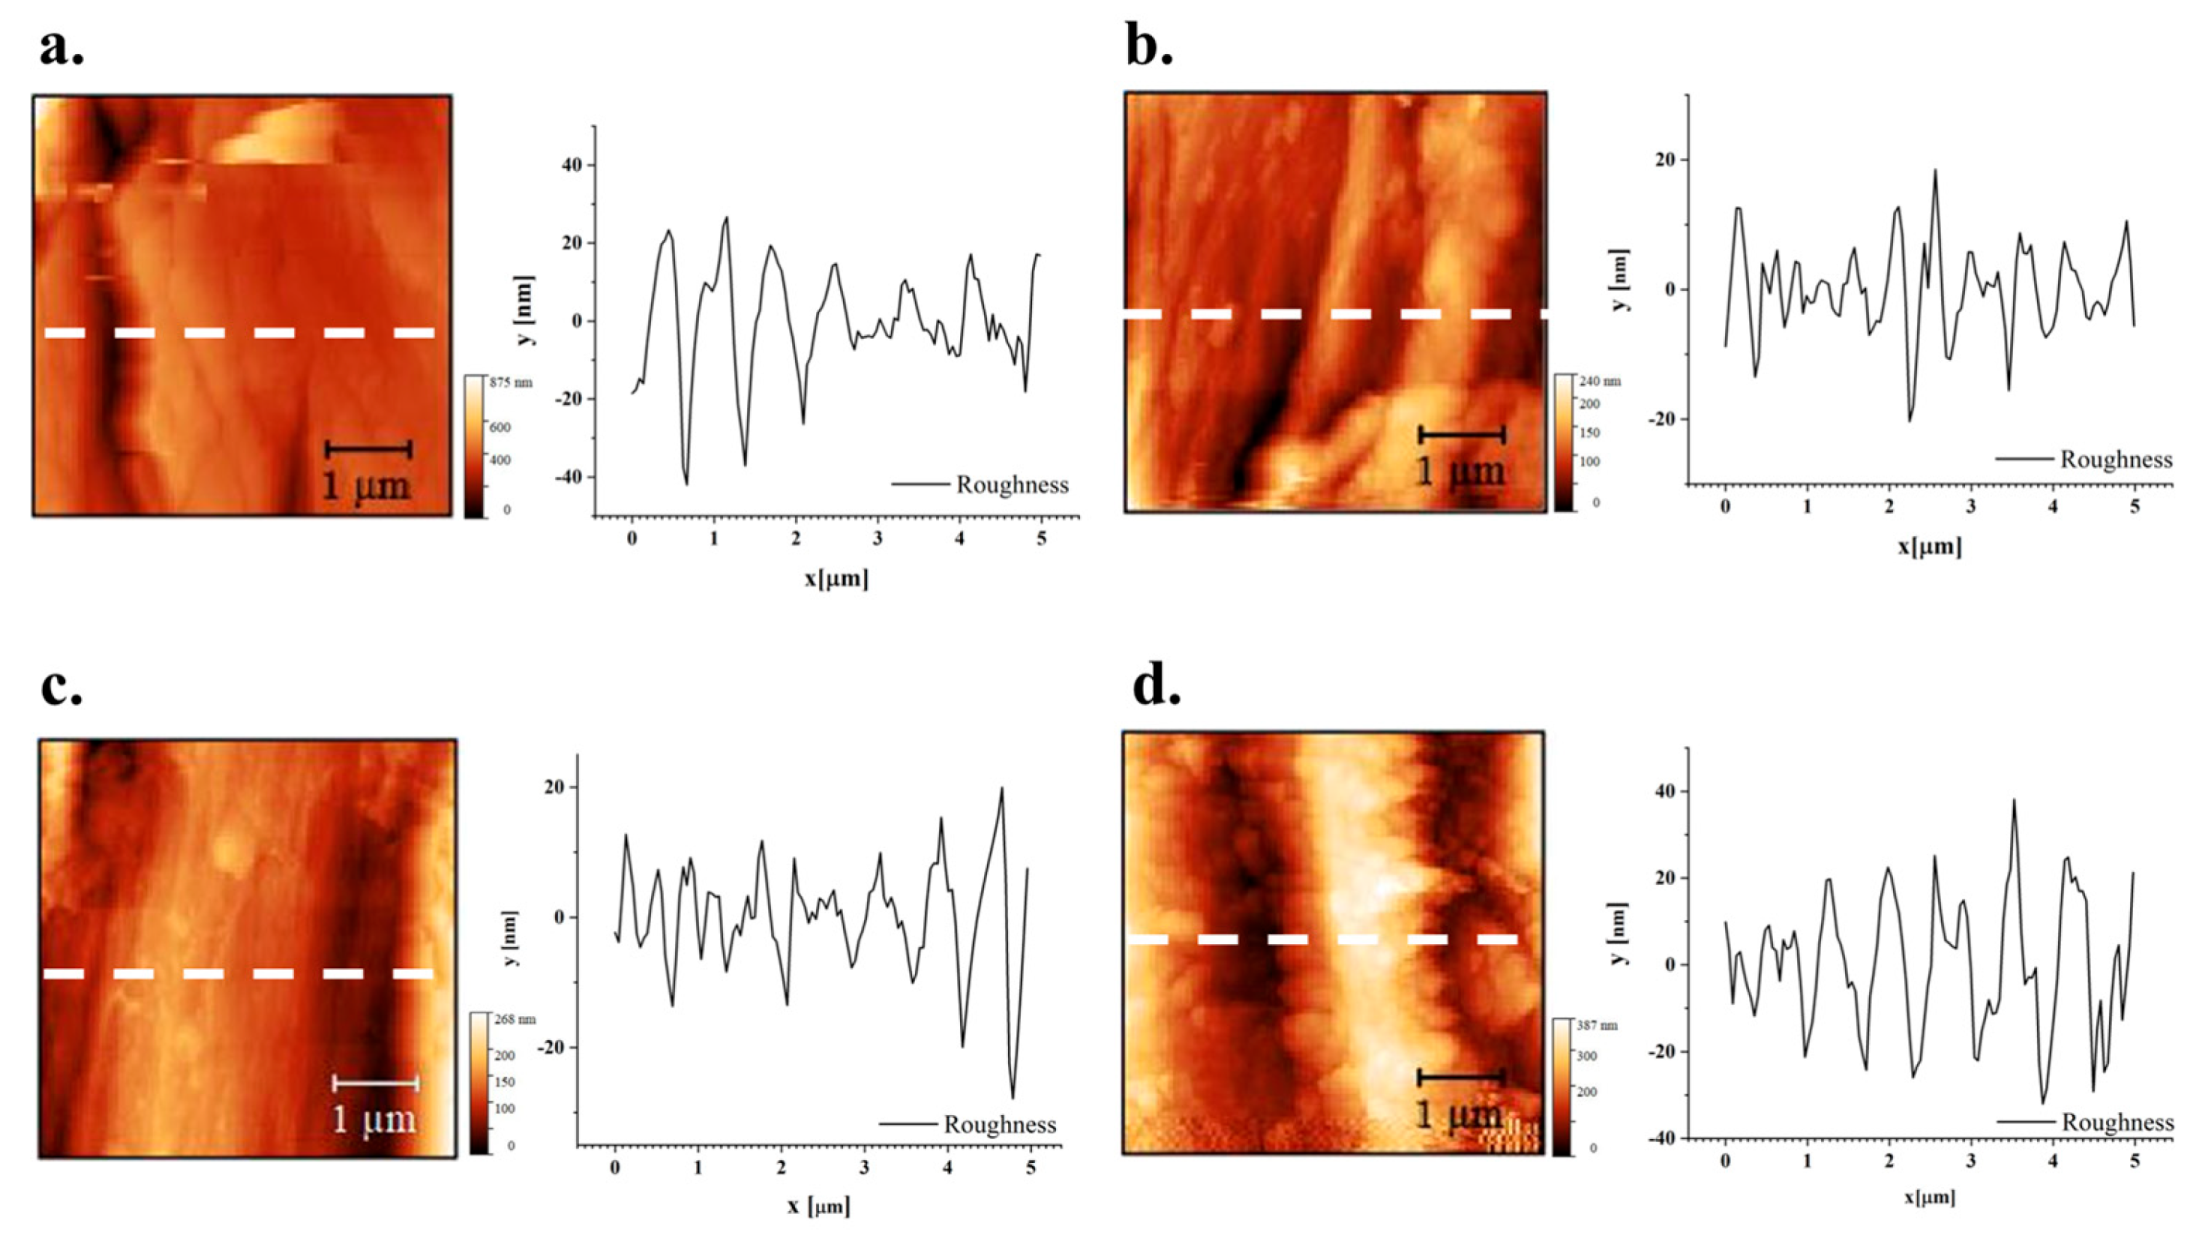
Figure 13.
AFM images of hemp fibre: a) sample HNT, b) sample HT-MIN, c) sample HT-MED, d) sample HT-MAX.
Figure 13.
AFM images of hemp fibre: a) sample HNT, b) sample HT-MIN, c) sample HT-MED, d) sample HT-MAX.
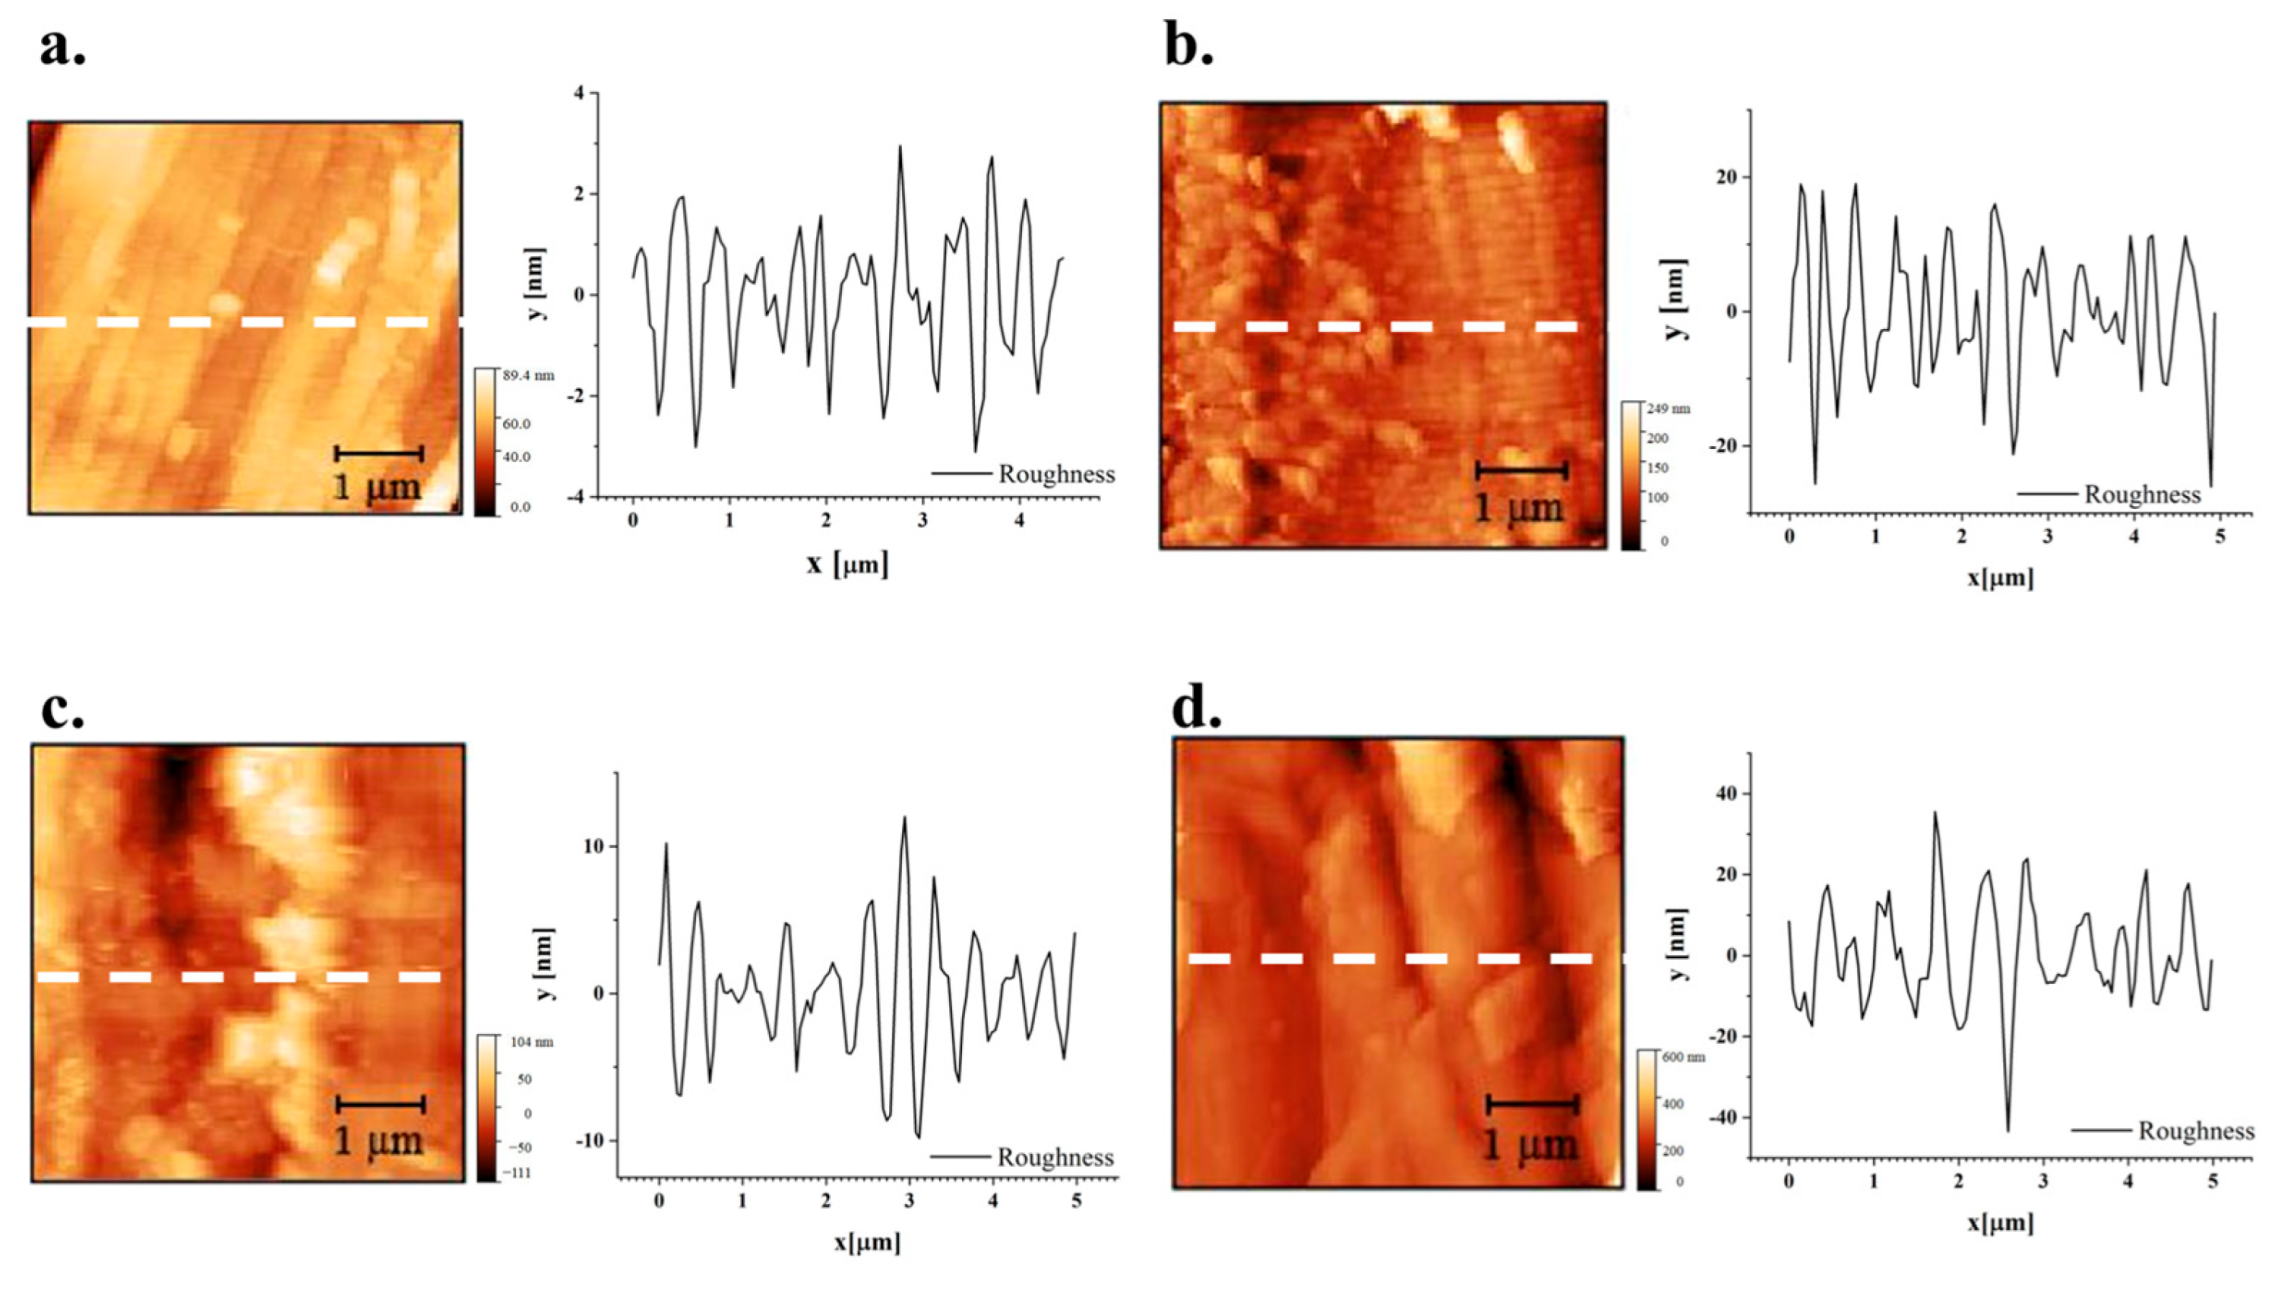
Figure 14.
Stress vs Strain representative curves of max-treated and untreated samples.
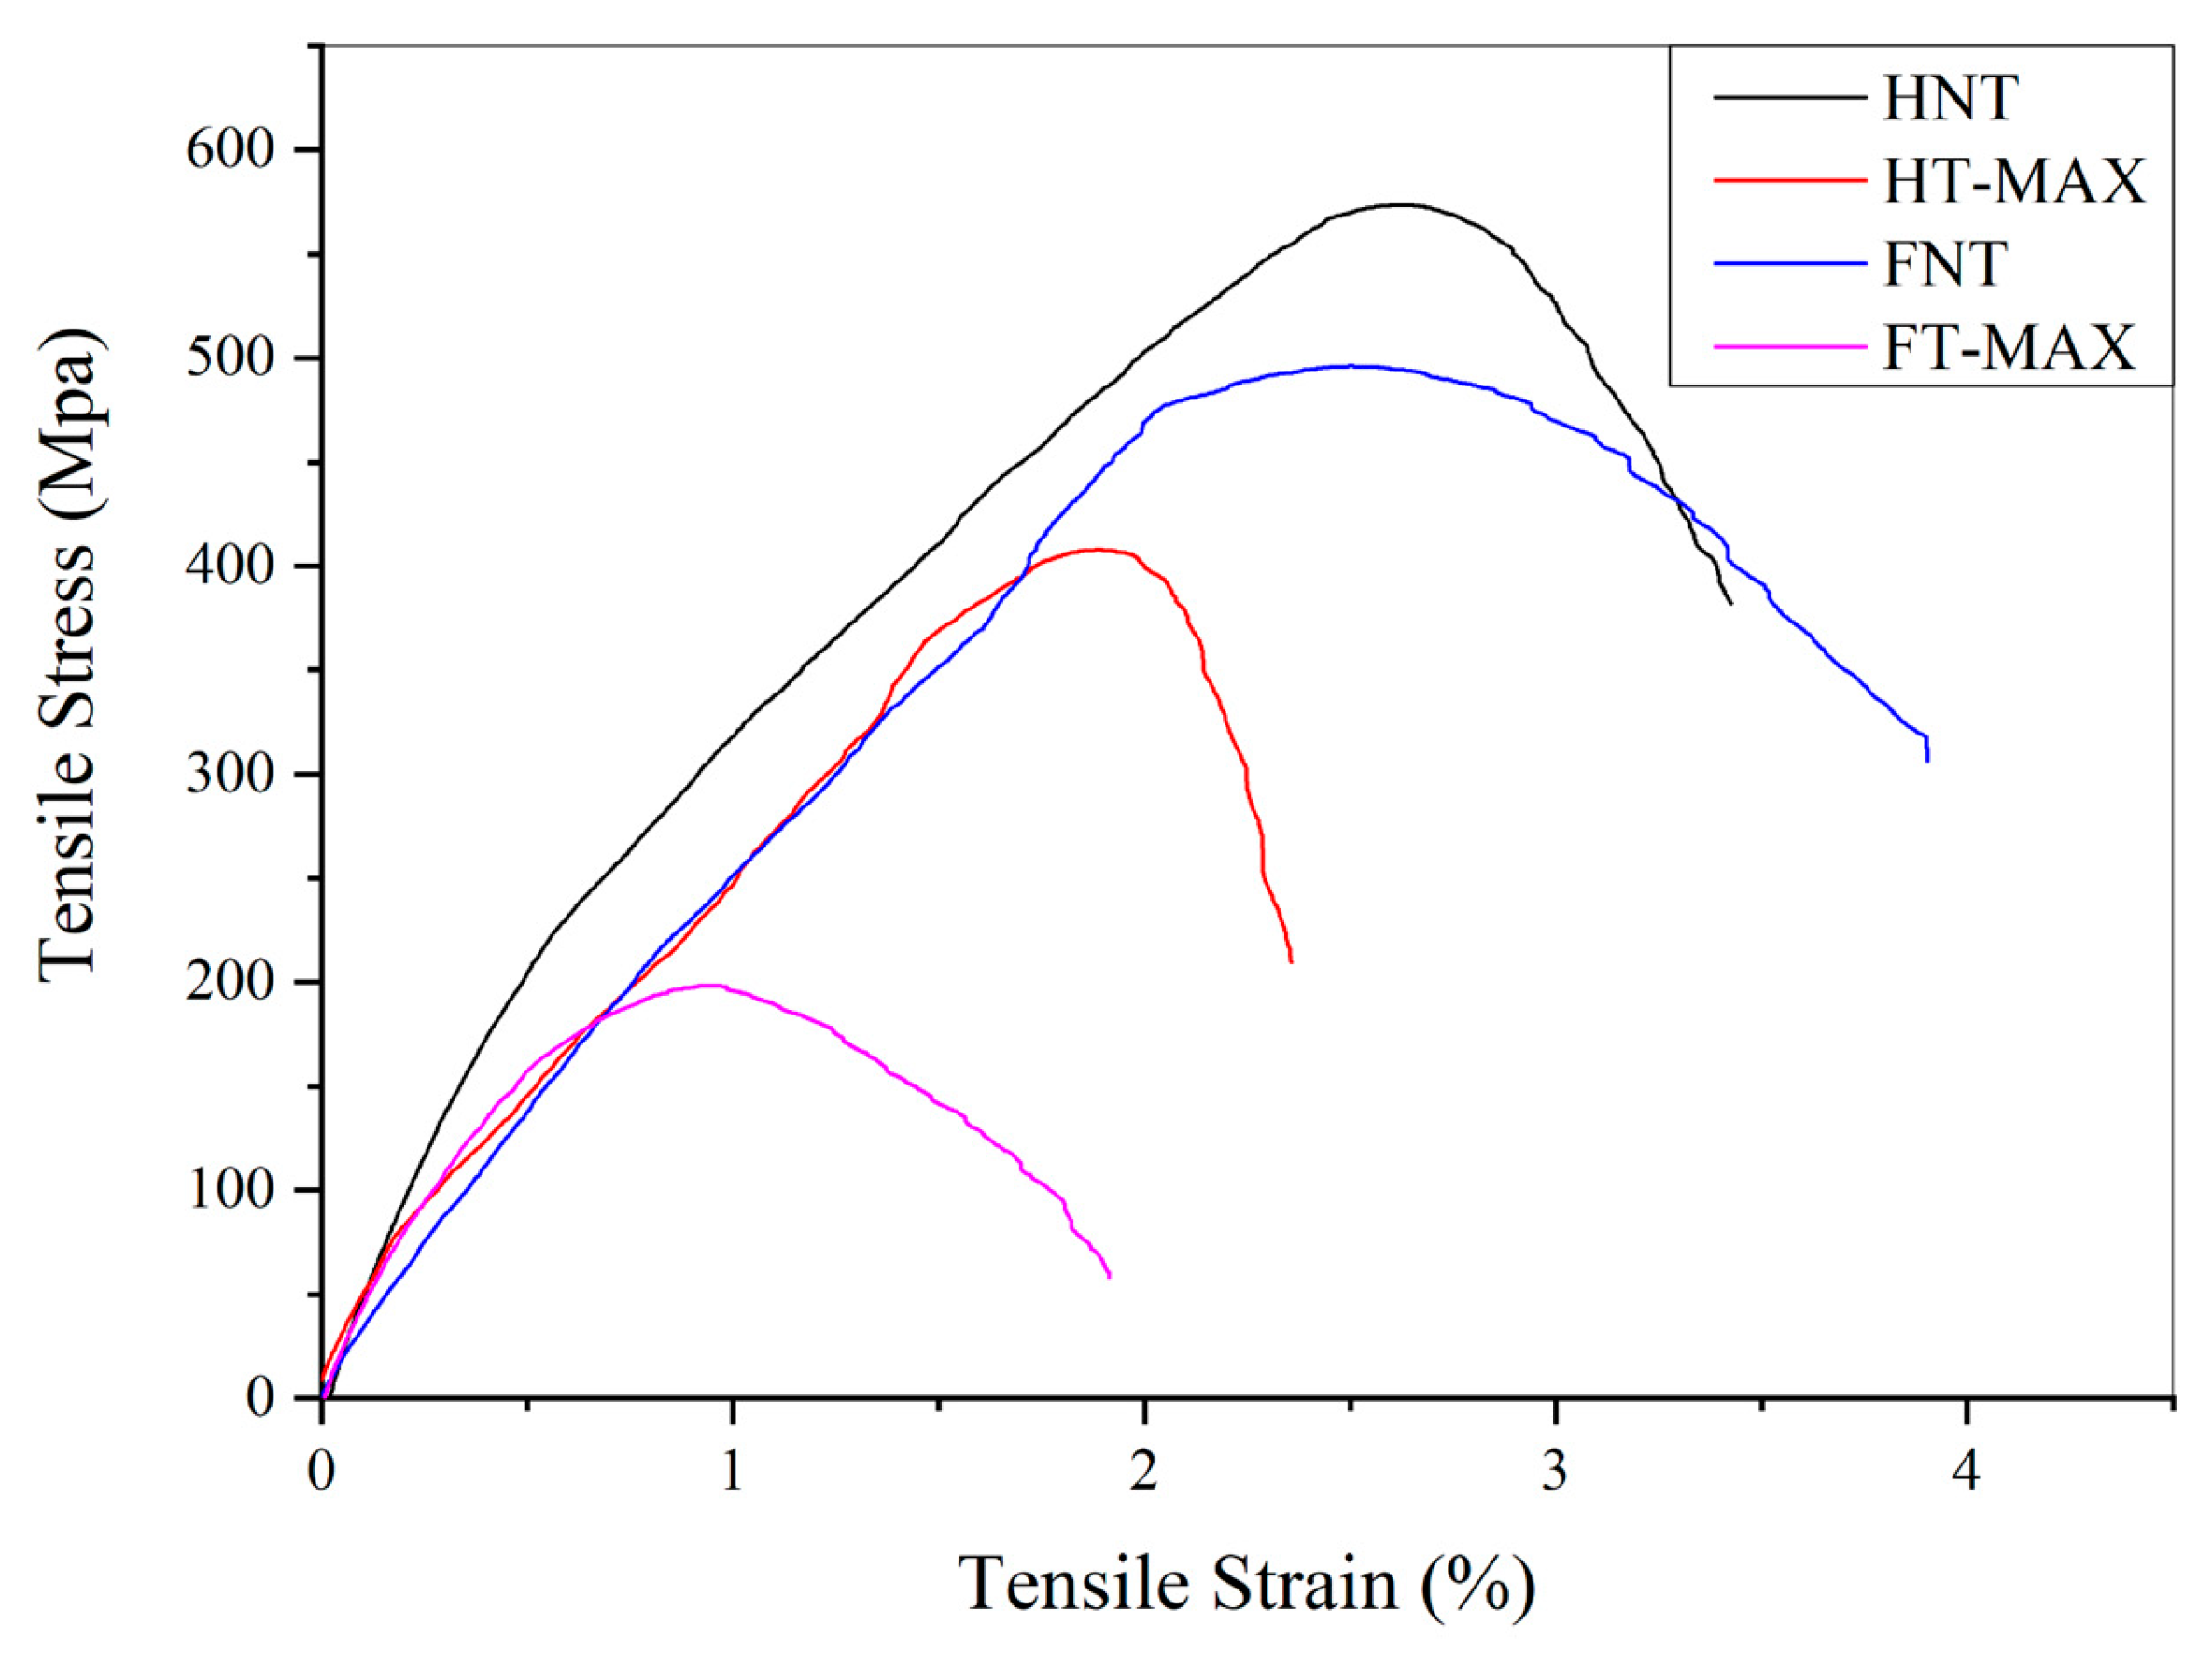
Figure 15.
Mechanical properties of max-treated and untreated samples.
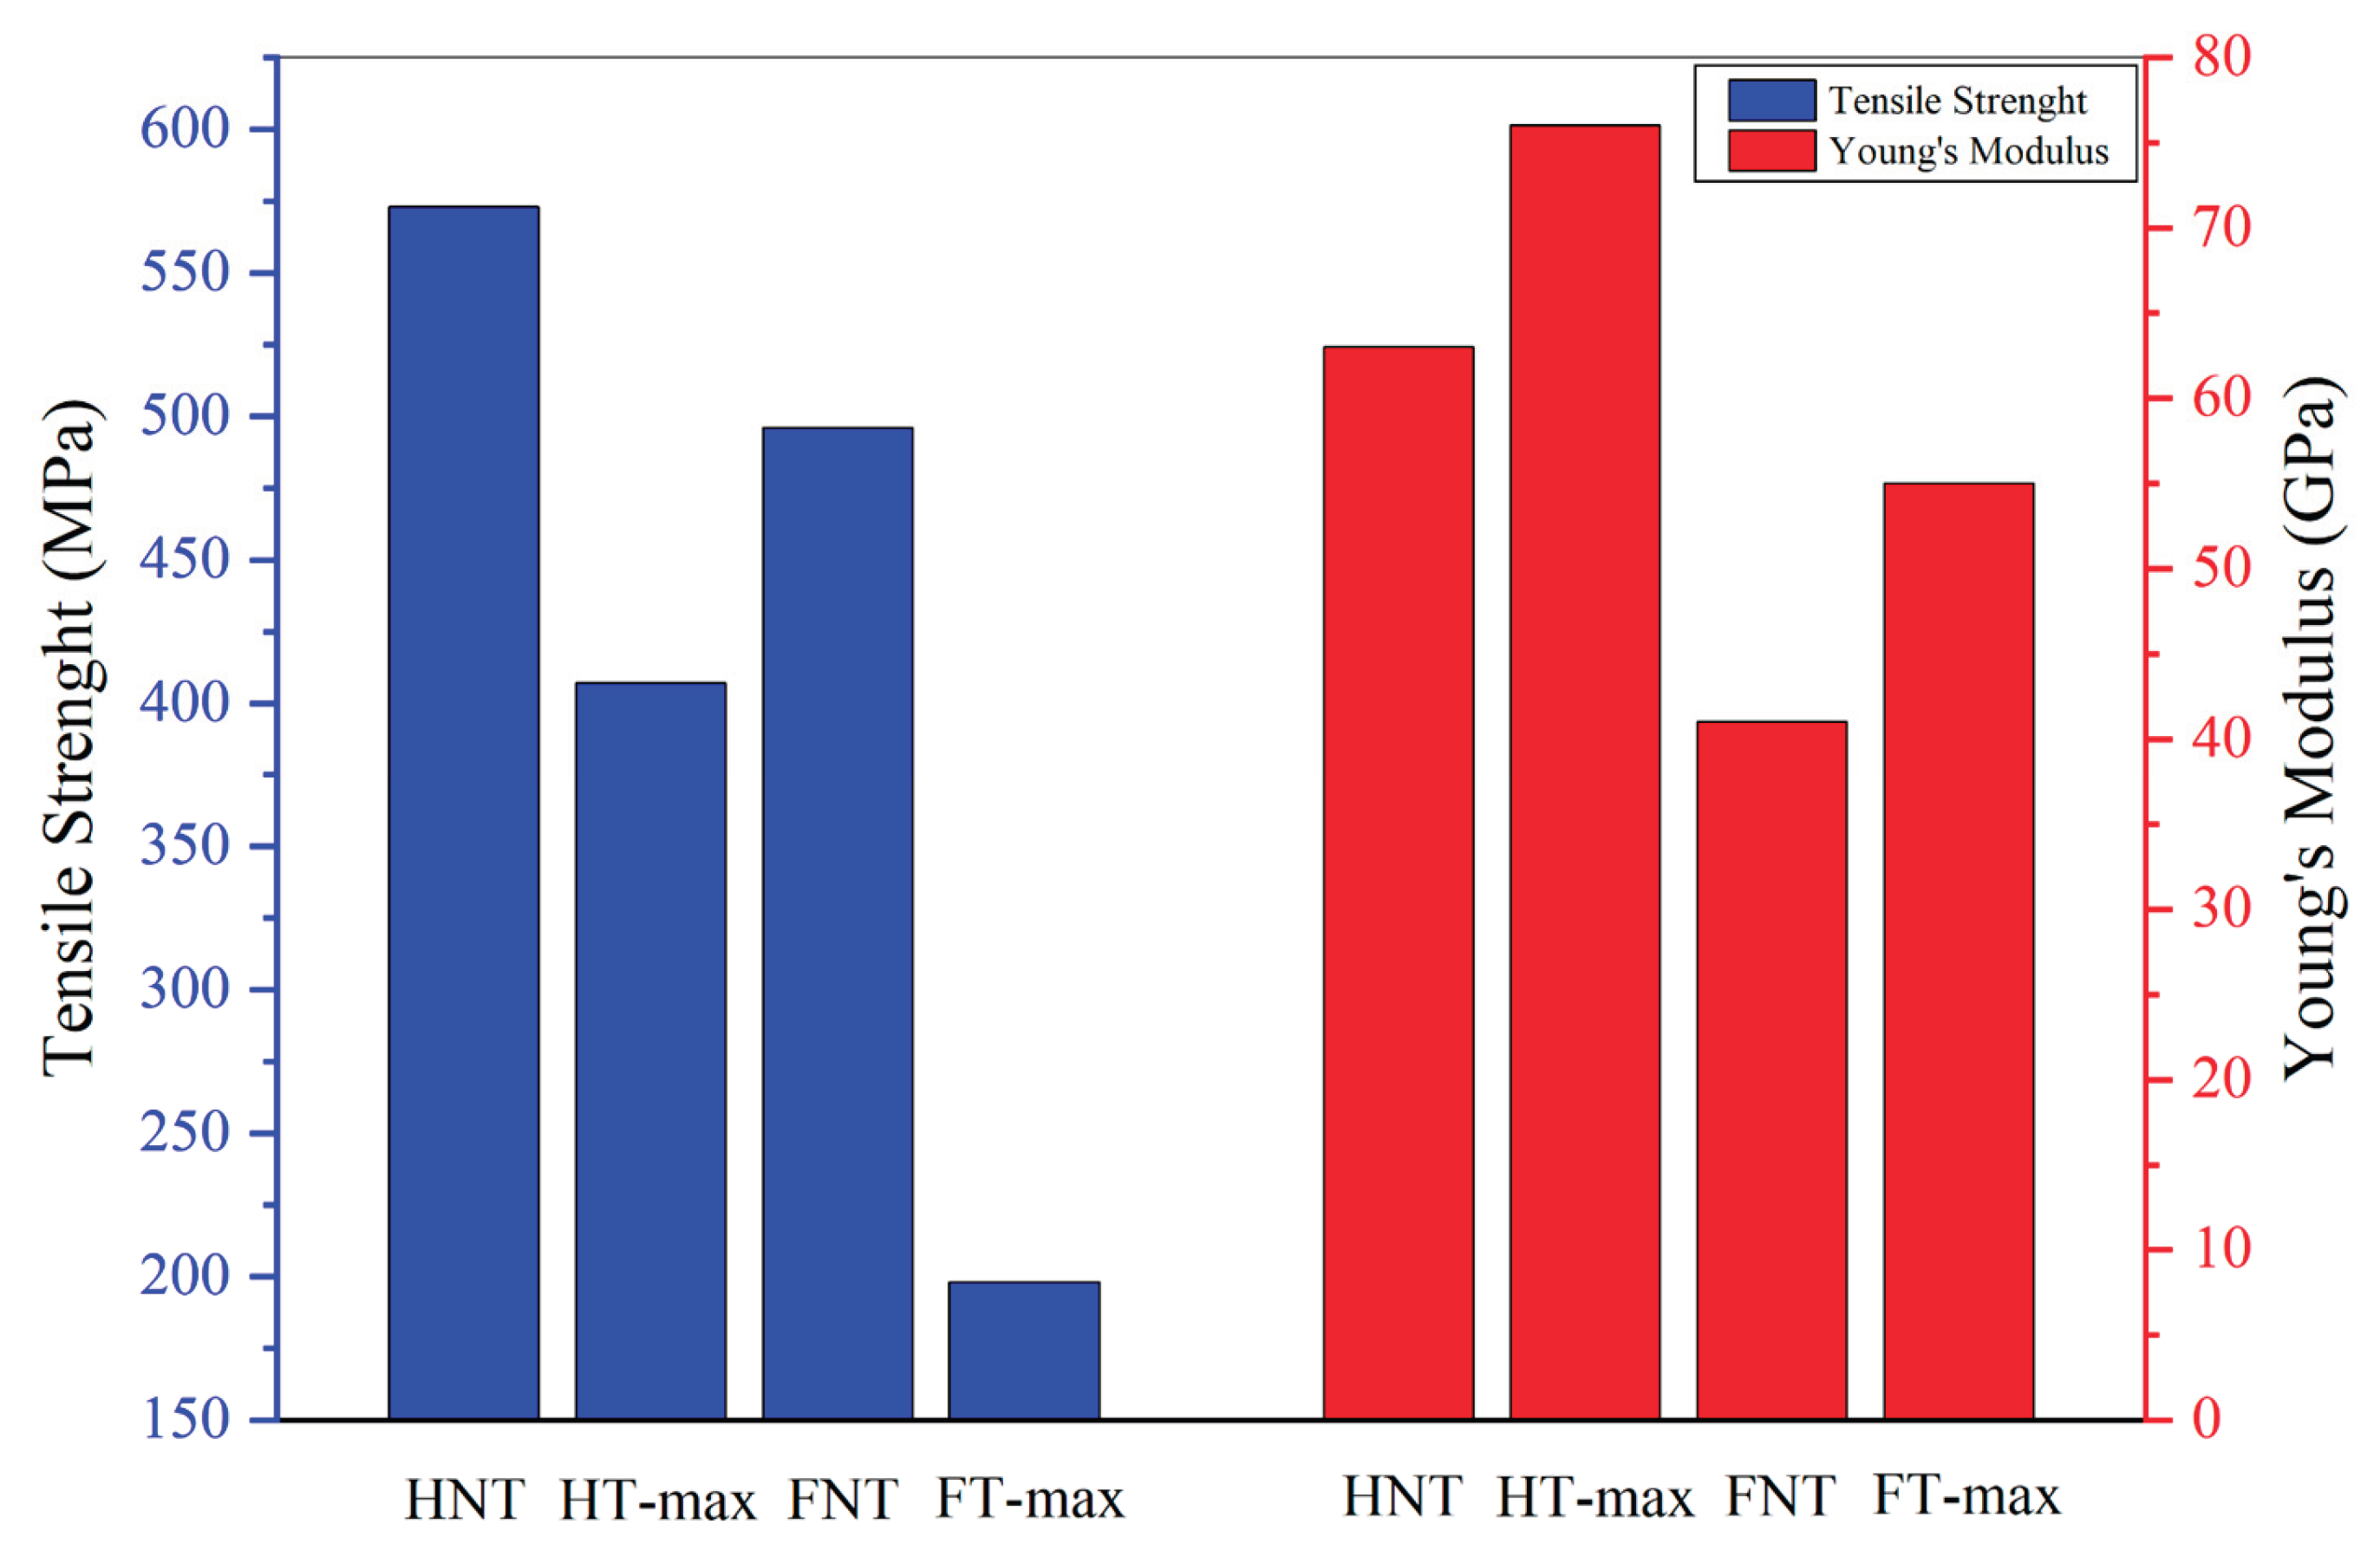

Table 1.
Categories of samples examined, identification codes and relevant treatment parameters.
| Sample category | Temperature (°C) | Time (min) | NaOH concentration (g/100 ml) | ||
|---|---|---|---|---|---|
| FNT | Untreated | ||||
| FNT-MIN | 25 | 30 | 0.5 | ||
| FNT-MED | 60 | 90 | 1 | ||
| FNT-MAX | 80 | 150 | 1.5 | ||
| HNT | Untreated | ||||
| HNT-MIN | 25 | 30 | 0.5 | ||
| HNT-MED | 60 | 90 | 1 | ||
| HNT-MAX | 80 | 150 | 1.5 | ||
Table 2.
Thermal degradation patterns for the different samples (Tonset = Onset degradation temperature; Tendset = End degradation temperature).
Table 2.
Thermal degradation patterns for the different samples (Tonset = Onset degradation temperature; Tendset = End degradation temperature).
| Sample | Tonset (°C) | Tendset (°C) |
Mass loss below Tonset (%) | Mass loss between Tonset and Tendset (%) | Residue at 600 °C (%) |
|---|---|---|---|---|---|
| Cellulose | 306 | 365 | 5.1 | 83.7 | 6.3 |
| FNT | 309 | 408 | 10.9 | 61 | 20.7 |
| FT-MIN | 290 | 370 | 6.3 | 62.6 | 14.7 |
| FT-MED | 261 | 359 | 5.8 | 64.8 | 12.2 |
| FT-MAX | 262 | 391 | 5.2 | 76.3 | 8.3 |
| HNT | 273 | 368 | 8.3 | 66.9 | 19.2 |
| HT-MIN | 283 | 395 | 5.8 | 71.9 | 14.9 |
| HT-MED | 272 | 365 | 8.1 | 66.7 | 13.3 |
| HT-MAX | 303 | 393 | 6.9 | 72.6 | 13.1 |
Table 3.
BET surface area of flax and hemp fibres before and after treatment.
| Sample category | δBET (m2 g−1) |
|---|---|
| HNT | 0.3688 ± 0.0101 |
| HT-MAX | 0.5341 ± 0.0109 |
| FNT | 0.3158 ± 0.0085 |
| FT-MAX | 0.4582 ± 0.0102 |
Table 4.
Roughness parameters from AFM and relevant values.
| Parameter | Flax Samples | Hemp Samples | ||||||
|---|---|---|---|---|---|---|---|---|
| FNT | FT-MIN | FT-MED | FT-MAX | HNT | HT-MIN | HT-MED | HT-MAX | |
| Rp (nm) | 26.72 | 18.49 | 19.94 | 38.15 | 2.95 | 19.00 | 12.02 | 35.50 |
| Rv (nm) | 42.02 | 20.35 | 27.86 | 32.02 | 2.57 | 26.05 | 9.84 | 43.45 |
| Rz (nm) | 56.07 | 28.41 | 33.01 | 53.07 | 4.96 | 40.06 | 19.58 | 50.28 |
| Rt (nm) | 68.74 | 38.84 | 47.80 | 70.17 | 6.06 | 45.04 | 21.86 | 78.95 |
| Ra (nm) | 9.92 | 4.88 | 5.90 | 11.91 | 1.02 | 7.28 | 3.03 | 9.76 |
| Rq (nm) | 12.97 | 6.38 | 7.79 | 14.50 | 1.26 | 9.08 | 3.99 | 12.28 |
| Rsk | -0.60 | -0.25 | -0.67 | -0.04 | -0.29 | -0.23 | 0.11 | 0.04 |
| Rku | 3.83 | 3.89 | 4.42 | 2.47 | 2.75 | 3.12 | 3.53 | 3.73 |
Table 5.
Mechanical properties values and standard deviation, between brackets, for treated and untreated fibres.
Table 5.
Mechanical properties values and standard deviation, between brackets, for treated and untreated fibres.
| Sample | Tensile Strength (MPa) | Strain at break (%) |
Young’s modulus (GPa) |
|---|---|---|---|
| FNT | 496 (150) | 3.9 (0.3) | 41 (5.8) |
| FT-MAX | 198 (44) | 1.9 (0.1) | 55 (8.9) |
| HNT | 573 (77) | 3.4 (0.6) | 63 (9.2) |
| HT-MAX | 407 (149) | 2.3 (0.2) | 76 (12) |
Disclaimer/Publisher’s Note: The statements, opinions and data contained in all publications are solely those of the individual author(s) and contributor(s) and not of MDPI and/or the editor(s). MDPI and/or the editor(s) disclaim responsibility for any injury to people or property resulting from any ideas, methods, instructions or products referred to in the content. |
© 2026 by the authors. Licensee MDPI, Basel, Switzerland. This article is an open access article distributed under the terms and conditions of the Creative Commons Attribution (CC BY) license.
Copyright: This open access article is published under a Creative Commons CC BY 4.0 license, which permit the free download, distribution, and reuse, provided that the author and preprint are cited in any reuse.


