1. Introduction
Wool, the fibrous outgrowth from sheep’s pores and skin, is one of the maximum flexible and robust herbal fibers diagnosed to humanity. Its shape, composed predominantly of keratin, a protein discovered in human hair and nails offers it elasticity, moisture absorption, and thermal insulation residences [
1]. This adaptability has made wool a cornerstone of material manufacturing for millennia. Archaeological proof indicates that people had the use of wool at least within the Bronze Age, marking it as one of the earliest fibers to be processed and woven into textiles [
2]. Among the most famous historic artifacts is the Pazyryk rug, a woolen carpet dated to about 500 BC. Discovered in a Siberian tomb in the permafrost of the Altai Mountains, the rug stays remarkably preserved and is considered one of the oldest surviving examples of a pile-woven cloth [
3]. Its intricate styles and craftsmanship offer helpful insights into the inventive and cultural practices of the nomadic Scythian tribes [
4]. Today, the Pazyryk rug is exhibited at the Hermitage Museum in St. Petersburg, symbolizing the long-lasting importance of wool in human records and background [
5].
Wool is labeled into three wonderful types primarily based at the diameter and period of their fibers [
6]. Merino wool is identified as the very best high-quality because of its high-quality fibers, which degree less than 25 µm in diameter. Crossbred wools are derived from sheep which have been bred through crossing a couple of breeds, and they show off fiber diameters starting from 25 to 33 µm. The 0.33 kind, called long wool, is characterized through its lengthy fleeces and tremendous fiber diameter, exceeding 33 µm. This category is summarized in three wool kinds: Merino (<25µm); Crossbred wool (25-33µm); Long wool (>33µm).
In Morocco, Wool has been a important material produced considering that historical times, satisfying the wishes of the populace. Once sheared, the wool is processed through impurity elimination, washing, and spinning, resulting in threads prepared to be used [
7].
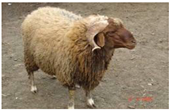
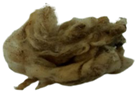
The excellence of wool is decided by way of the use of the fineness of its fibers, with finer fibers correlating to higher expenses. Optimal wool is derived from the shearing of lambs, depending on their fitness and energy. In Morocco, the Sardi and Boujaâd breeds are famed for generating specific wool. Specifically, Sardi wool is noted for its density and uniformity, the absence of stains, impurities, and colored fibers. The average mass of an individual fleece is ready 2.2 kg.
The softness of this wool usually degrees between 50 and 60 at the Bradford scale [
8]. A distinct sort of Moroccan wool is derived from the Siroua breed of sheep, that’s local to OUARZAZATE. These wool stocks terrific similarities with the relatively esteemed Australian and New Zealan wools, noted for the fineness in their fibers. The wool threads extracted from Siroua sheep are the most appropriate for crafting Amazigh rugs [
9].
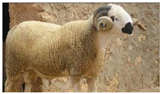
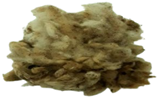
Experts additionally point out the “Timahdite” breed, observed in the Fez-Meknes area. This breed produces wool that is uniformly white, without spots, jar, or extraneous fibers, and is uniformly disbursed across the sheep’s body. Additionally, there are different lesser-recognized wool types, every with specific characteristics, consisting of “D’man, Boujaâd, and Beni Guil” [
10].
Moroccan wool from the Sardi and Timahdite breeds holds big capacity within the technical fabric region, particularly in non-woven packages. Sardi wool, regarded for its chemical resistance and durability, can be utilized in non-woven merchandise such as insulation panels, automobile interiors, and industrial filters where power and resistance to harsh conditions are required. On the opposite hand, the best and exceptionally absorbent Timahdite wool is right for non-woven textiles like medical dressings, hygiene merchandise, and high-performance wipes, presenting softness and brilliant moisture management. These programs underscore the flexibility of Moroccan wool in meeting the demands of modern technical textiles while promoting sustainable and locally sourced substances.
In this gift paper, we’ve conducted a comprehensive characterization and evaluation of the bodily and chemical properties of uncooked wool using a variety of units, including FTIR (Fourier-transform infrared), TGA (Thermogravimetric Analysis), OFDA (Optical Fiber Diameter Analyzer), and SEM (Scanning Electron Microscopy), among others, alongside numerous checking out methodologies that adhere to worldwide requirements inclusive of fat content material dedication, base and acid percentage, solubility, and tensile power assessments. All those efforts have been directed towards the improvement of a non-woven wool-based textile supposed for technical applications [
11].
The originality of this work lies in the convergence between technical innovation, valorization of local Moroccan resources and contribution to sustainability. It offers a unique opportunity to link heritage, ecology, and modernity through an interdisciplinary approach:
Valorization of an underexploited local resource: The wool of the Moroccan sheep breeds is often considered an agricultural by-product, little used in industrial sectors. This work transforms an abundant but underexploited raw material into a product with high added value.
Ecological and sustainable character Wool as a biodegradable fiber: Using a natural fiber in non-woven materials meets the growing demand for environmentally friendly products. Contribution to Moroccan cultural heritage.
This project is not limited to a scientific or economic approach: it is also part of the promotion of a unique local heritage.
2. Experimental
Characterizations and Physico-chemical properties of wool was studied using various technique such as FTIR, TGA, OFDA, SEM, and diverse testing methods according to international standards like grease content, acid and base percentage, solubility, and tensile strength.
2.1. Materials
2.1.1. Products and Solvents
All chemicals and reagents were utilized as received, without further purification.
Dichloromethane (CH2Cl2 (75-09-2)) was employed to ascertain and analyze fat content and solubility, sourced from SIGMA-ALDRICH.
Pyridine or azine (C5H5N (110-86-1)) was utilized to determine the percentage of acid, with LOBACHEMIE as the supplier. Sodium hydroxide (NaOH (1310-73-2)) was used for both acid and base percentage determination and solubility analysis, provided by SIGMA-ALDRICH.
Phenolphthalein R-COO-R (77-09-8) was employed for acid percentage determination, supplied by FLUKA. Boric acid (10043-35-3) was used to determine the percentage of the base, sourced from LOBACHEMIE.
Hydrochloric acid (HCl (7647-01-0)) was used for determining both acid and base percentages, with HONEYWELL as the supplier. Methyl red (493-52-7) was employed for base percentage determination, provided by MERCK.
Methylene blue (61-73-4) was used for base percentage determination, supplied by FLUKA. Acetic acid (64-19-7) was used for acid percentage determination and solubility analysis, sourced from SOLVACHIM.
Ammonia (NH3 (1336-21-6)) was used for degreasing wool fibers, sourced from SOLVACHIM. ECE Phosphate Reference Detergent was employed to remove a wide array of dirt and stains, supplied by SDC.
2.1.2. Measurement of Fiber Diameter
The fiber diameter was determined utilizing a GT-B17B 2018 fiber fineness tester microscope. For this measurement, the objective lens employed for this examination was a 506226 Hi Plane 4x/0.1.
2.1.3. Water Absorption Capacity
The water absorption capacity of wool fibers was assessed following the ASTM D570 standard [
12]. 100 g of wool fibers was dried at 80 °C for 8 hours, Then, the fibers were immersed in distilled water [
1] at room temperature, blotted with a lint-free cloth, and weighed at 10-minute intervals until a stable weight was recorded. The water absorption rate of the wool fiber is determined using the following equation:
Equation (1): Water absorption rate of the wool fiber.
In this equation:
Me (%) is the water absorption rate at time t
W(i) (in grams) is the initial weight of the fibers at time =0
W(t) (in grams) is the weight of the fibers at time t
2.2. Methods
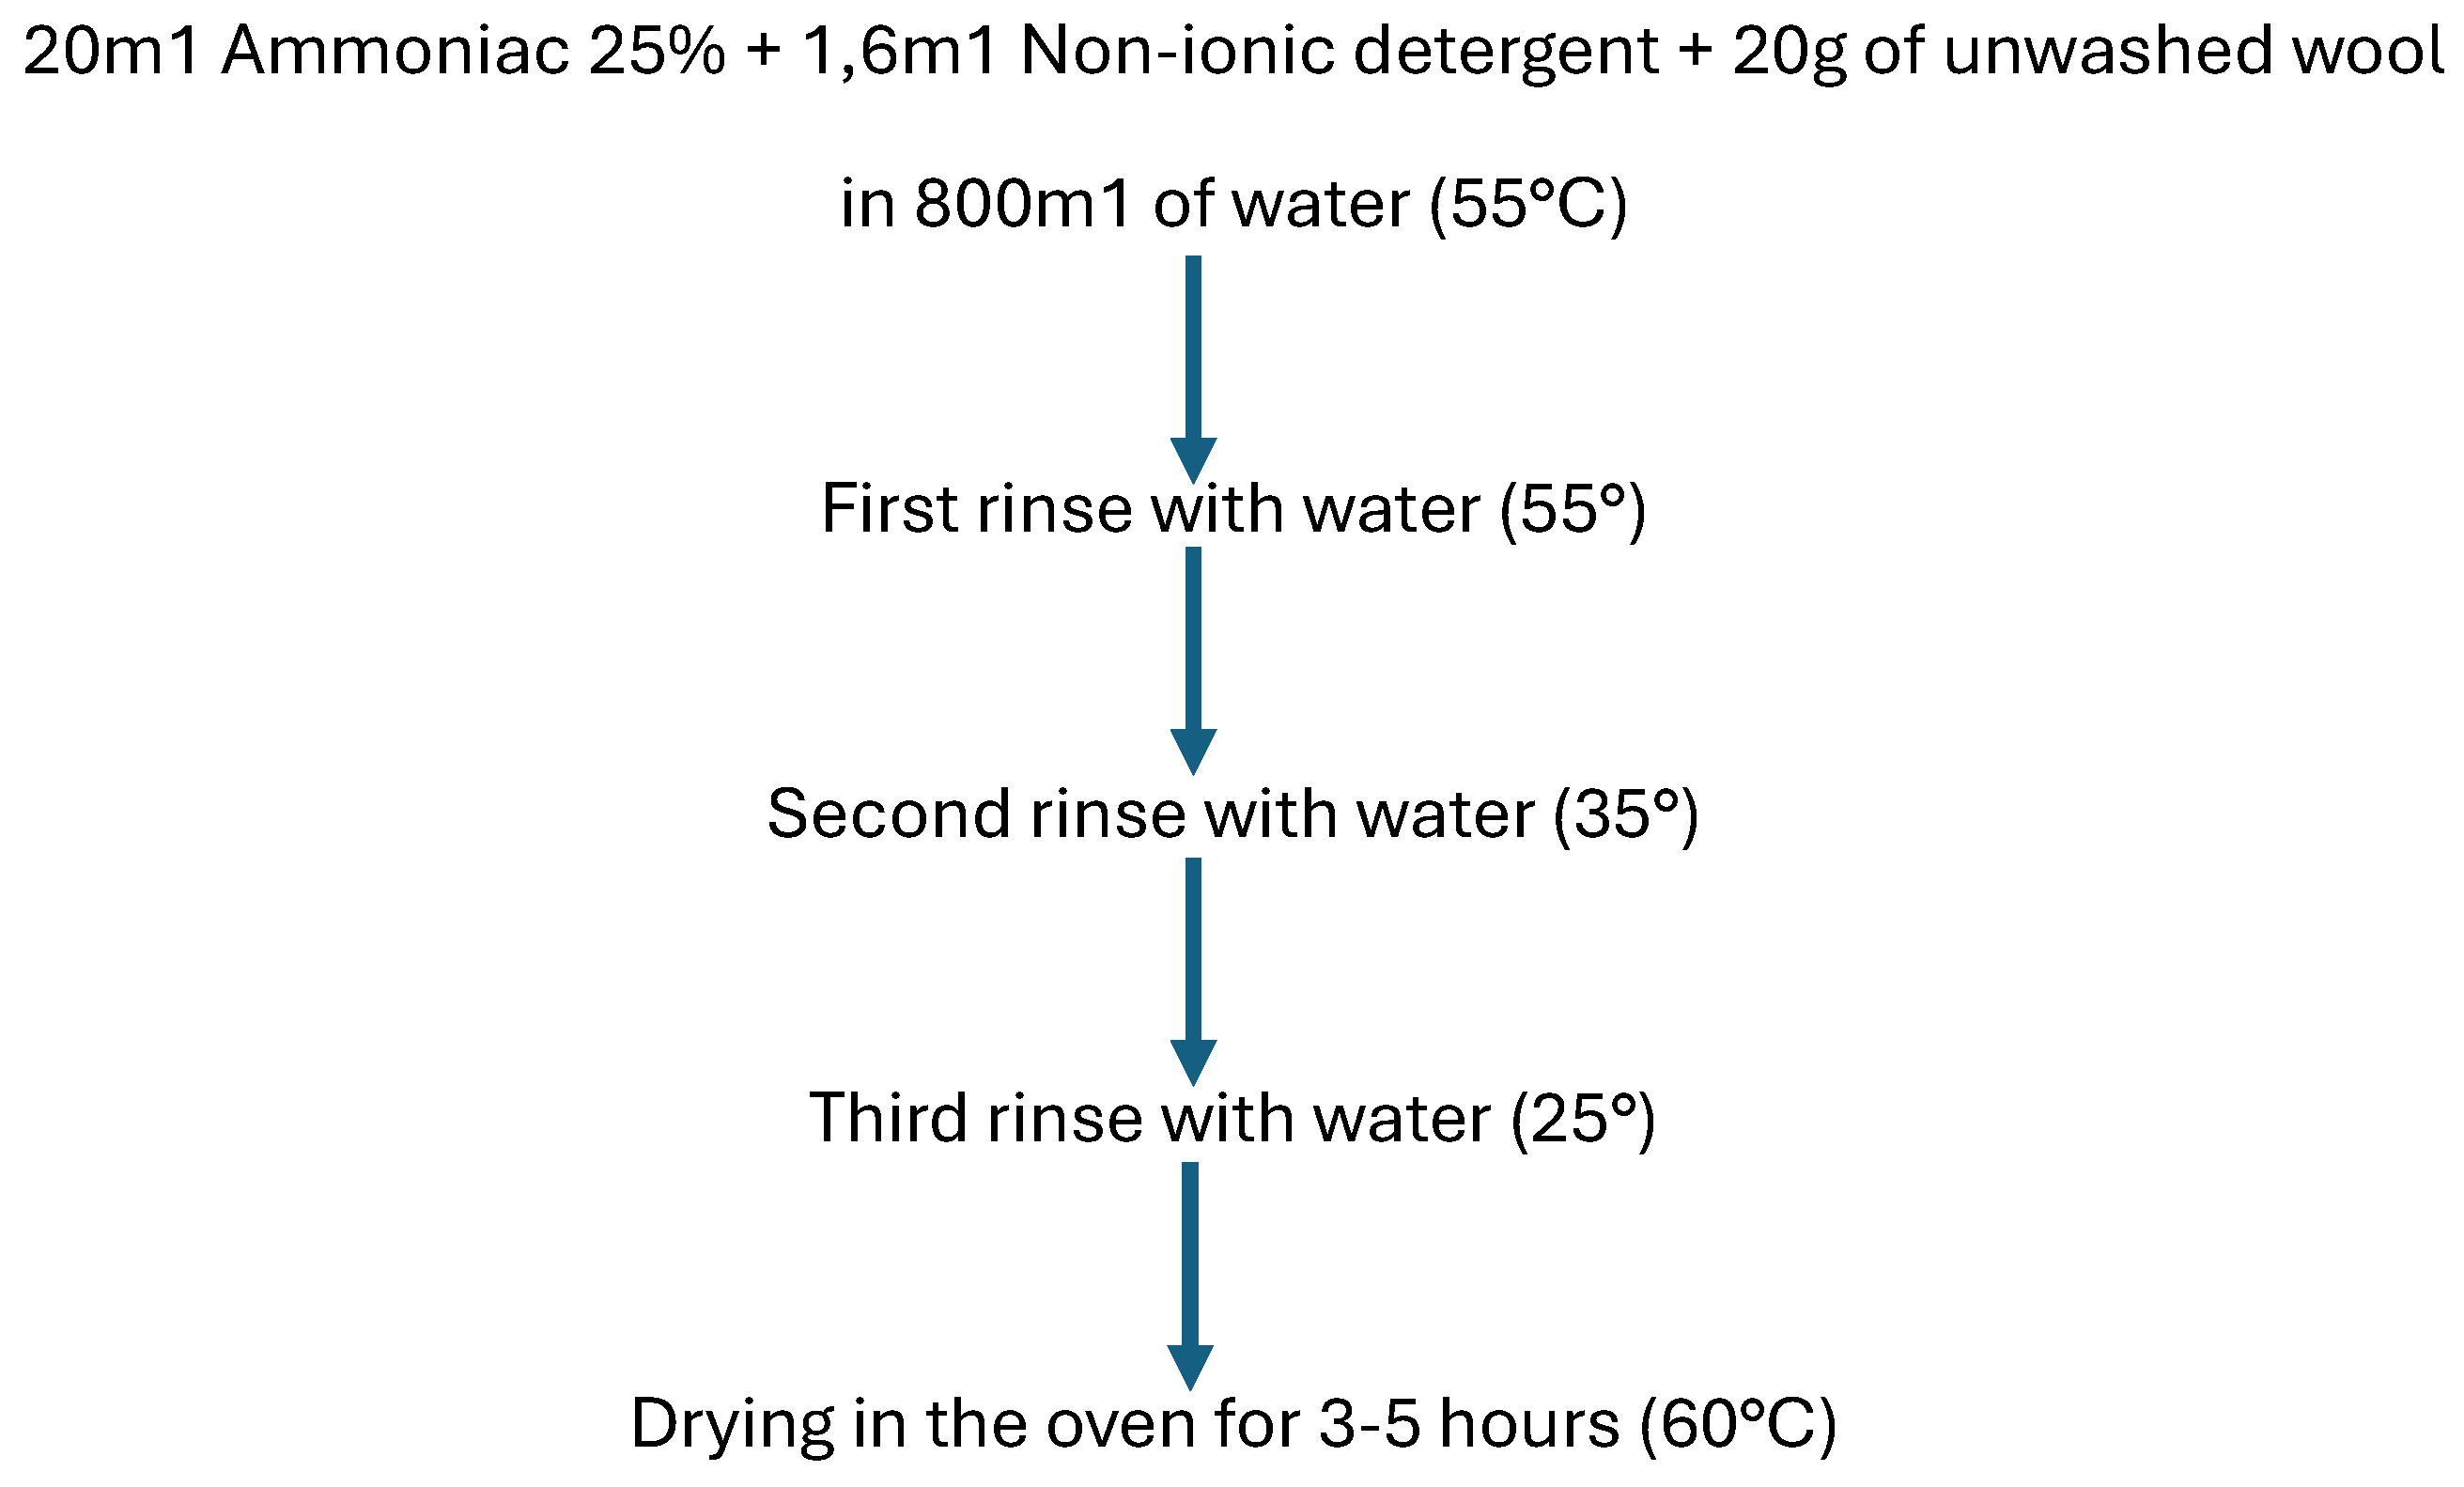
2.2.1. Washing Wool (Degreasing)
Figure 1 illustrates a flowchart detailing the protocols for washing wool.
2.2.2. Fat Rate Analysis
The test was conducted in accordance with ISO 3074-14 standard [
13]. The sample material (wool, m=5g) was loaded into a filter paper cup and positioned in the main chamber of a Soxhlet extractor. Afterwards, 250ml of Dichloromethane was measured and poured into a round-bottomed flask, which was then placed on a heating mantle.
The Soxhlet extractor was affixed above the round-bottomed flask, and a reflux condenser was positioned above the extractor. The solvent was heated to reflux and allowed to extract for a duration of 3 hours. Post-extraction, the solvent was removed using a rotary evaporator to isolate the extracted compound.
The insoluble portion of the sample was subjected to drying at 105°C for a period of 4 hours. It was then allowed to cool in a desiccator for 2 hours before being weighed. The lipid extraction percentages were subsequently calculated using the following formula:
Equation (2): Lipid extraction percentages
2.2.3. Analysis of Hydrophilic Capacity
This check entails submerging a precise amount of wool in water for predetermined periods, finally measuring the varying mass. A representative pattern, weighing 0. Five ± 0.001 grams are selected. The prepared pattern is then immersed in a chosen beaker containing distilled water at ambient temperature for 15 minutes, with mechanical agitation carried out.
Subsequently, the pattern is extracted, and appropriate pressure is used to dispose of surplus water 1. Three bars. The preceding two steps are repeated until a steady mass is completed. Analysis of the humidity level
A wool sample is first weighed after which dried to obtain a constant mass at a temperature of 105 ± 3°C inside an oven using ambient air. The discovered mass loss is attributed to moisture and is mentioned as moisture content material, in accordance with ASTM D1576-thirteen. For the moisture calculation, a minimum of two representative sub-samples, every weighing 1 ± zero.001 g, are decided on from the number one sample.
Each 1 g sub-pattern is transferred in a weighing bottle and subjected to drying in a ventilated oven set at one hundred and five ± 3°C. Following drying, the bottle is stopped, cooled in a desiccator, and the mass of the bottle along with its contents is measured. The drying process is repeated until a constant mass is achieved. The contents are then removed to ascertain the dry mass of the sample, using the mass of the empty bottle for reference.
The moisture content H is calculated as the mass loss of the test sample, expressed as a percentage of its dry mass. The formula utilized to determine H is:
Equation (3): Moisture content H.
In this equation:
m (1) is the initial mass of the test sample,
m (2) represents the dry mass of the test sample.
2.2.4. Acid Percentage Calculation
This control consists in immersing a certain quantity of wool in a dilute pyridine solution, which promotes the extraction of acid from the wool. The latter is determined by titration with a well-known sodium hydroxide solution. following the ISO 3073-1975 standard. Initially, at least two representative samples each, weighing 2 ± 0.001 g, and a sample weighing 1 ± 0.001 g are collected. The 1 g sample is placed in a weighing bottle, dried in a ventilated oven at 105 ± 3 °C, then stopped, cooled in a desiccator, and weighed to determine the mass of the bottle and its contents. The heating process continues until a constant mass is achieved, after which the contents are removed to ascertain the dry mass of the sample by weighing the empty bottle.
Secondly, the other two samples are placed into separate conical flasks, closed with glass stoppers, and 100 ml of pyridine solution is added to each. Each flask is sealed and shaken on a mechanical shaker for one hour. Alternatively, the flasks can be left to sit overnight after initial shaking to ensure proper wetting of the sample.
Thirdly, the liquid from each flask is decanted into separate glass beakers, filtered to retain fibrous materials. From each beaker, 50 ml of the filtered liquid is pipetted into separate conical flasks. Three drops of phenolphthalein solution are added to each flask, and the extract is titrated with sodium hydroxide solution until a weak pink color persists after light manual shaking [
14].
The mass of acid, A, expressed as a percentage of the dry mass of the test sample, is calculated using the formula:
Equation (4): Percentage of the dry mass of the test sample
In this equation:
T represents the normality of the sodium hydroxide solution.
V is the volume of sodium hydroxide used for titration in milliliters.
k is a constant with the following values:
For hydrochloric acid calculation: 3.65
For formic acid calculation: 4.6
For sulfuric acid calculation: 4.9
For acetic acid calculation: 6.0
And m is the dry mass, in grams, of the test sample of approximately 1 g.
2.2.5. Solubility Analysis in the Base
Wool solubility is decided by way of submerging wool in a sodium hydroxide solution underneath precise conditions of time, temperature, and extent. The mass loss is then measured as the difference in mass of the dry pattern before and after remedy, adhering to the ISO 3072-1975 well known. The sample undergoes Soxhlet extraction with dichloromethane for 1 hour at a minimal charge of six cycles in step with hour. Dichloromethane is permitted to evaporate, and all vegetation and other foreign our bodies are removed. The test sample is subsequently cut into short lengths of approximately 1 cm and balanced with the laboratory atmosphere.
After the pretreatment, the masses of the test samples are determined with a precision of 0.0002 g:
The sample is then placed in a weighing bottle and dried in a ventilated oven at 105 ± 3°C. The bottle is stopped, cooled in a desiccator, and the mass of the bottle and its contents is registered. Heating continues until a constant mass is achieved, then the contents are removed, and the dry mass of the sample is determined by weighing the empty bottle.
100 ml of the sodium hydroxide solution is measured into a bottle, capped loosely, and the bottle is fixed in a water bath in such a way that the water level outside the bottle is at least 5 cm higher than the solution level inside. This setup is important for precise temperature control. Once the solution temperature stabilizes at 65 ± 0.5 °C, a measured mass sample is carefully introduced into the bottle, the cap is replaced, and the bottle is gently shaken to ensure complete wetting of the sample. Shaking is repeated gently after 15, 30, and 45 minutes, each shaking lasting no more than 5 seconds.
After 1 hour, the contents are transferred carefully to a glass filter crucible of known mass and emptied by suction. Then, any fibrous material remaining in the bottle is washed into the crucible with distilled water. The residue in the crucible is washed six times with water, with complete draining after each wash, and the suction is released. The crucible is then filled twice with acetic acid solution, left to stand for 1 minute each time, and emptied by suction. Finally, the residue is washed six times with water, drained completely after each wash, and the crucible and its contents are dried at 105+3°C, cooled in a desiccator, and weighed. These operations are repeated until a constant mass is obtained [
15].
Alkali solubility, S, is the mass loss of the test sample expressed as a percentage of its calculated dry mass. The solubility is determined using the formula:
Equation (5): The equation of solubility
In this equation:
m (1) represents the dry mass of the test sample
m (2) represents the dry mass of the residue.
2.2.6. Infrared Analysis
The IR spectra of both raw and washed wool fiber samples were obtained utilizing the FTIR 4600 TYPE A spectrophotometer, with analyses recorded in transmission mode (%) within the spectral range of 4000 to 500 cm
-1. FTIR spectroscopy served to ascertain whether the washing processes influenced the functional groups present in the wool fibers [
16].
2.2.7. Characterization of Mechanical and physical Properties: OFDA Fiber Diameter
The Optical Fiber Diameter Analyzer (OFDA) is an instrument used to degree the diameter and other characteristics of herbal fibers, especially wool, however it may additionally analyze other fibers which includes alpaca, mohair and cashmere. OFDA technology permits fast, accurate fiber measurements, which might be crucial for assessing fiber first-class, mainly in textile packages.
Fiber diameter (FD) denotes the mean width of an person cross-phase of a wool fiber. This dimension is expressed in microns (µm), wherein one micron is equal to at least one-thousandth of a millimeter.
Within the context of this project, the fiber diameter is classified by setting a hundred and fifty fibers from every sample onto a pitcher slide for examination of the fiber diameter making use of the OFDA. This magnification reduces four instances the scale of the photo [
17]. Fiber Tensile strength:
The Tensile strength LUDWIG Mpk is a specialized piece of equipment commonly used for testing the mechanical properties of materials, particularly for tensile testing. This apparatus is designed to measure the tensile strength, elongation, and other relevant characteristics of various materials, which is very important in material science, engineering, and quality control processes.
In 1971, Bunsell et al. Performed a comprehensive investigation into the mechanical residences of high-quality single fibers, such as tension, relaxation, creep, and fatigue, utilizing an established trying out gadget. During these experiments, fibers were secured among two clamps, one of which was connected to a movable beam incorporating a load mobile.
In the context of this mission’s measurements of fiber tensile electricity and elongation, the system adhered to the ASTM D3822 standard. This involved employing a 5N load cell and maintaining a testing speed of 10 mm/min as facilitated by the device. Tensile strength LUDWIG Mpk [
18].
3. Results and Discussions
3.1. Characterization of Chemical Properties
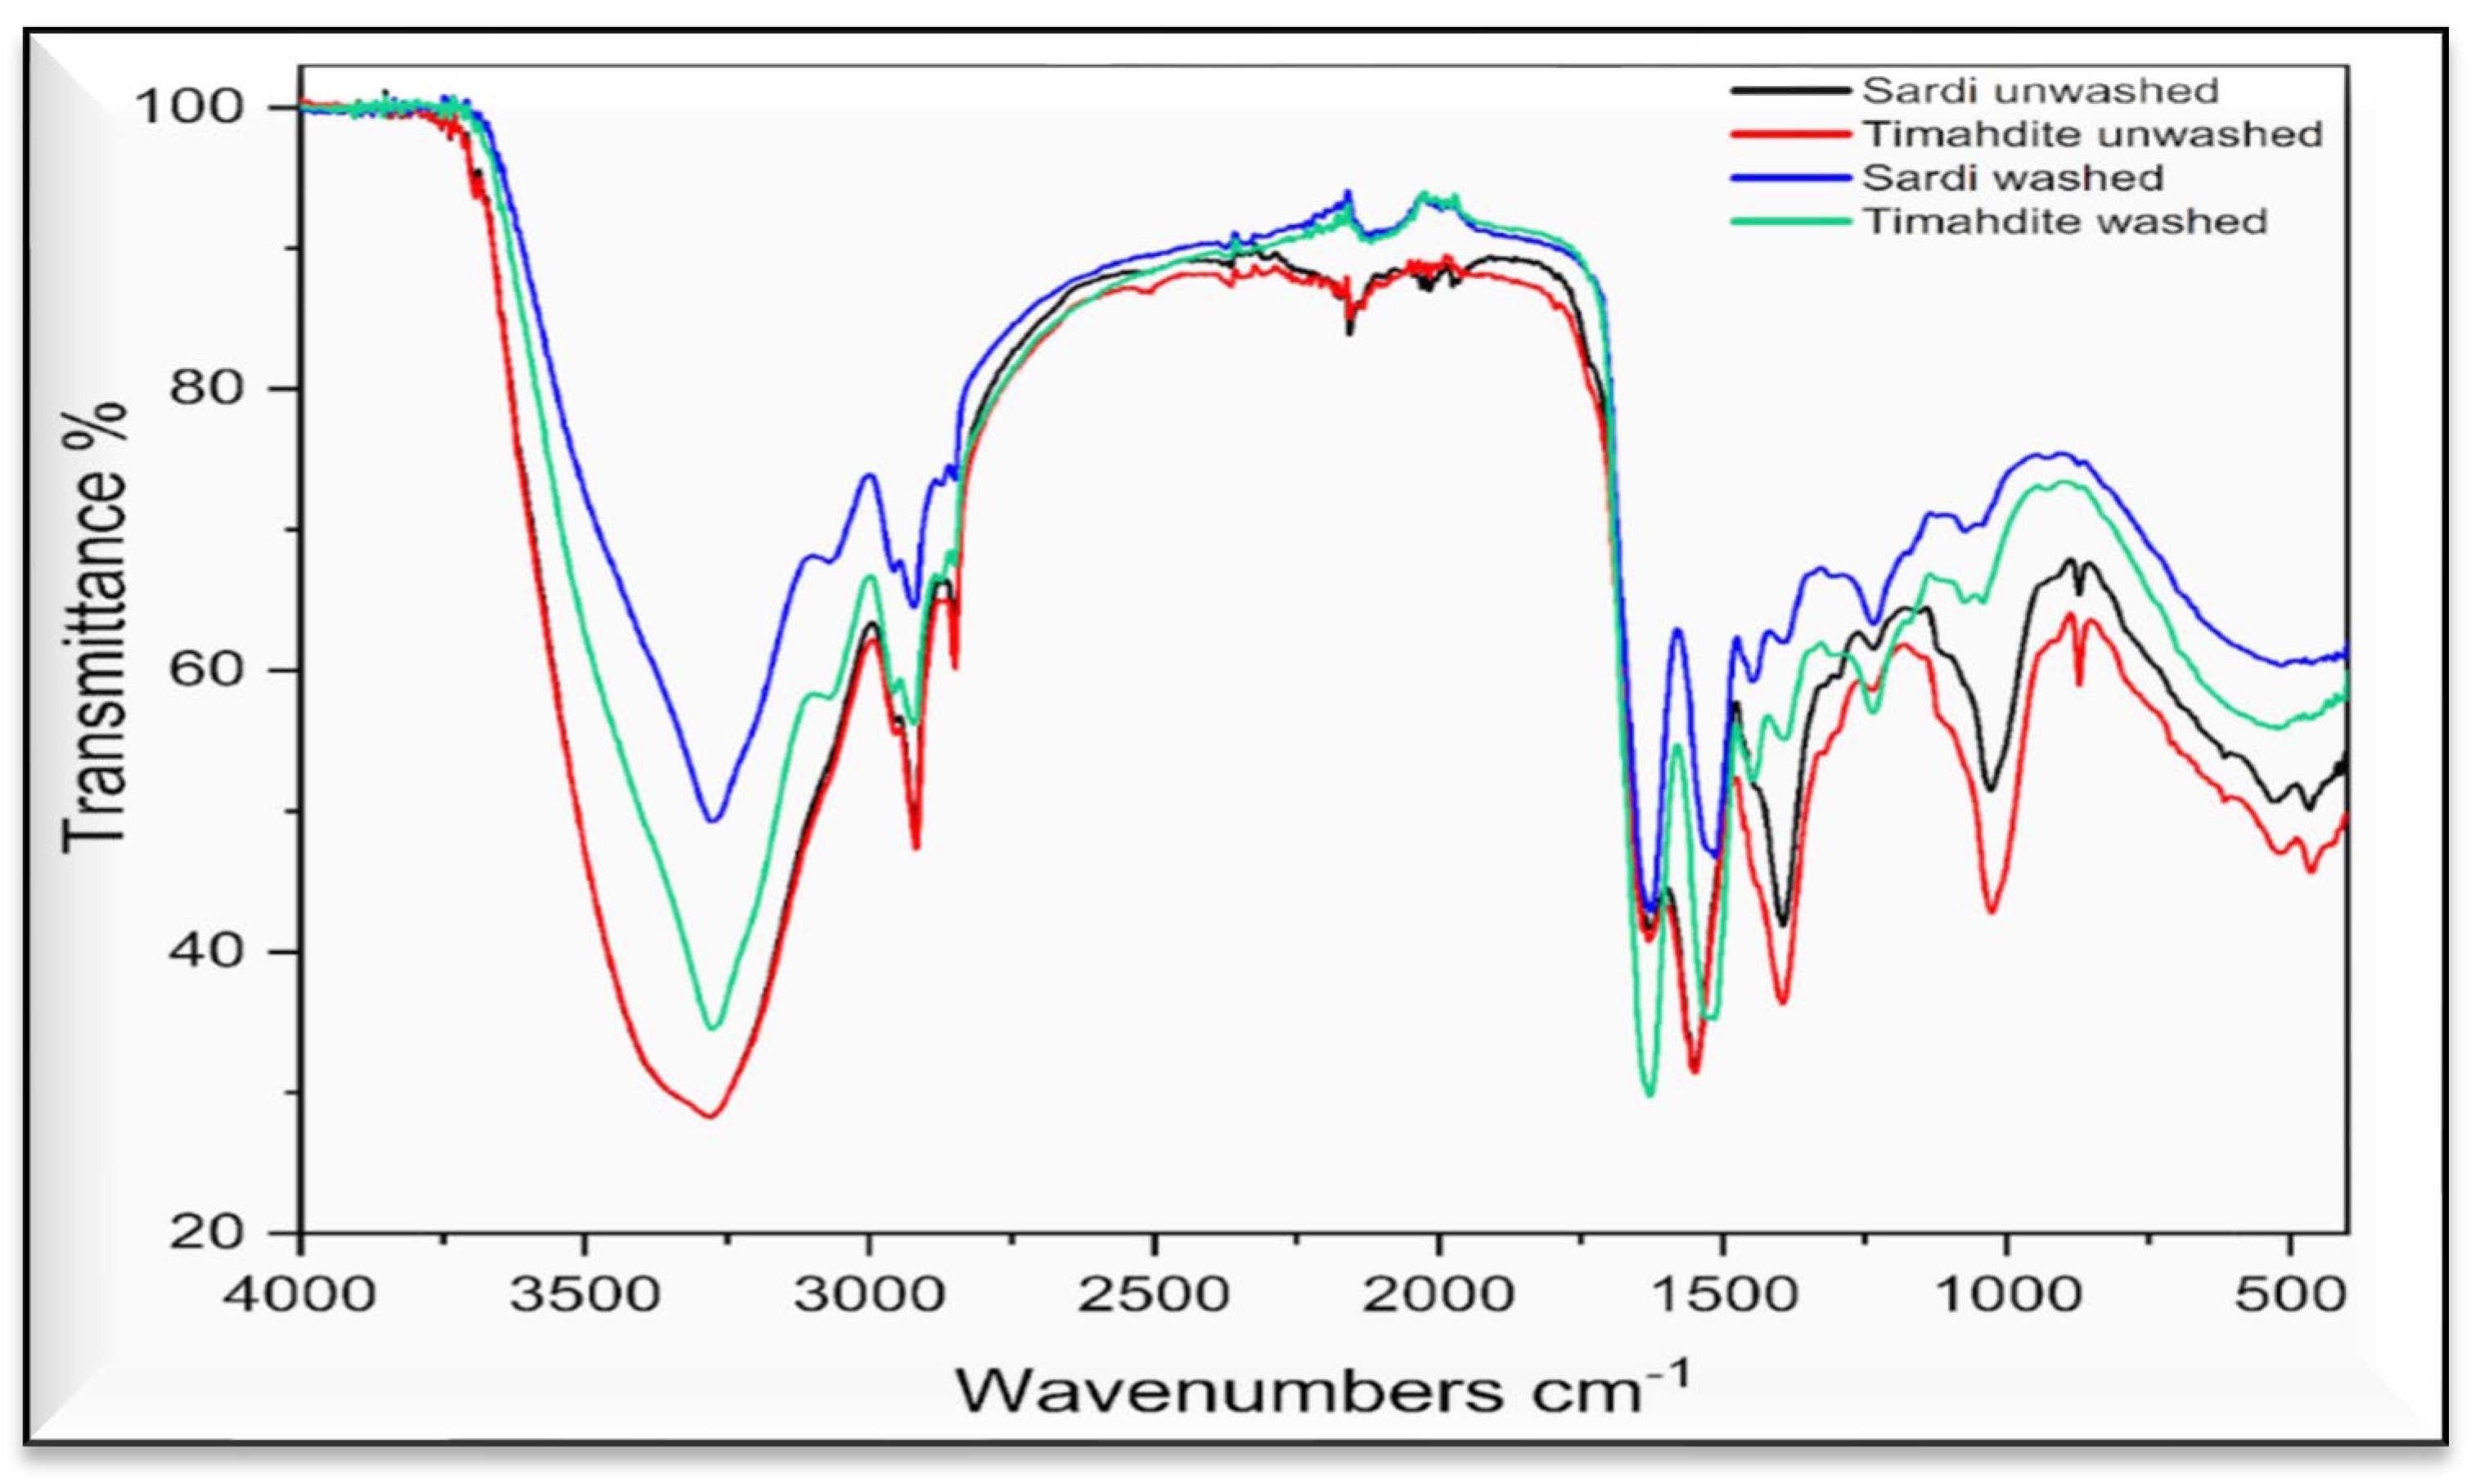
3.1.1. Infrared
An evaluation of the function bands of the unwashed samples (
Figure 2), suggests that they share an equal structural composition. The primary difference lies inside the variant inside the intensities, which can be attributed to the heterogeneity in fiber sizes and diameters.
As shown in
Figure 2., the range of 3272-3072 cm-1 shows a broad peak band of high intensity, indicating the presence of elongation vibrations in the O-H and N-H bonds.
In the range of 2964-2931 cm-1, multiple bands of very fine peaks suggest elongation vibrations of the C-H and C-H2 bonds, exhibiting variable intensities.
The 1632 cm-1 band, characterized by a single peak of low intensity, corresponds to the elongations of Primary Amide bonds.
The 1523 cm-1 bands, of very fine medium intensities, correspond to in-plane deformations of Secondary Amide bonds.
For the range 1442-1380 cm-1, the bands with a single peak of very fine weak intensity correspond to deformation vibrations of Tertiary Amide.
Finally, at 1061 cm-1, the bands of very fine medium intensities correspond to the presence of elongation vibrations of Sulfoxides (SO3, SOS and SO₂S).
Similar infrared spectrum results were observed by Yao et al. [
19].
Upon analyzing the feature bands of the washed samples (
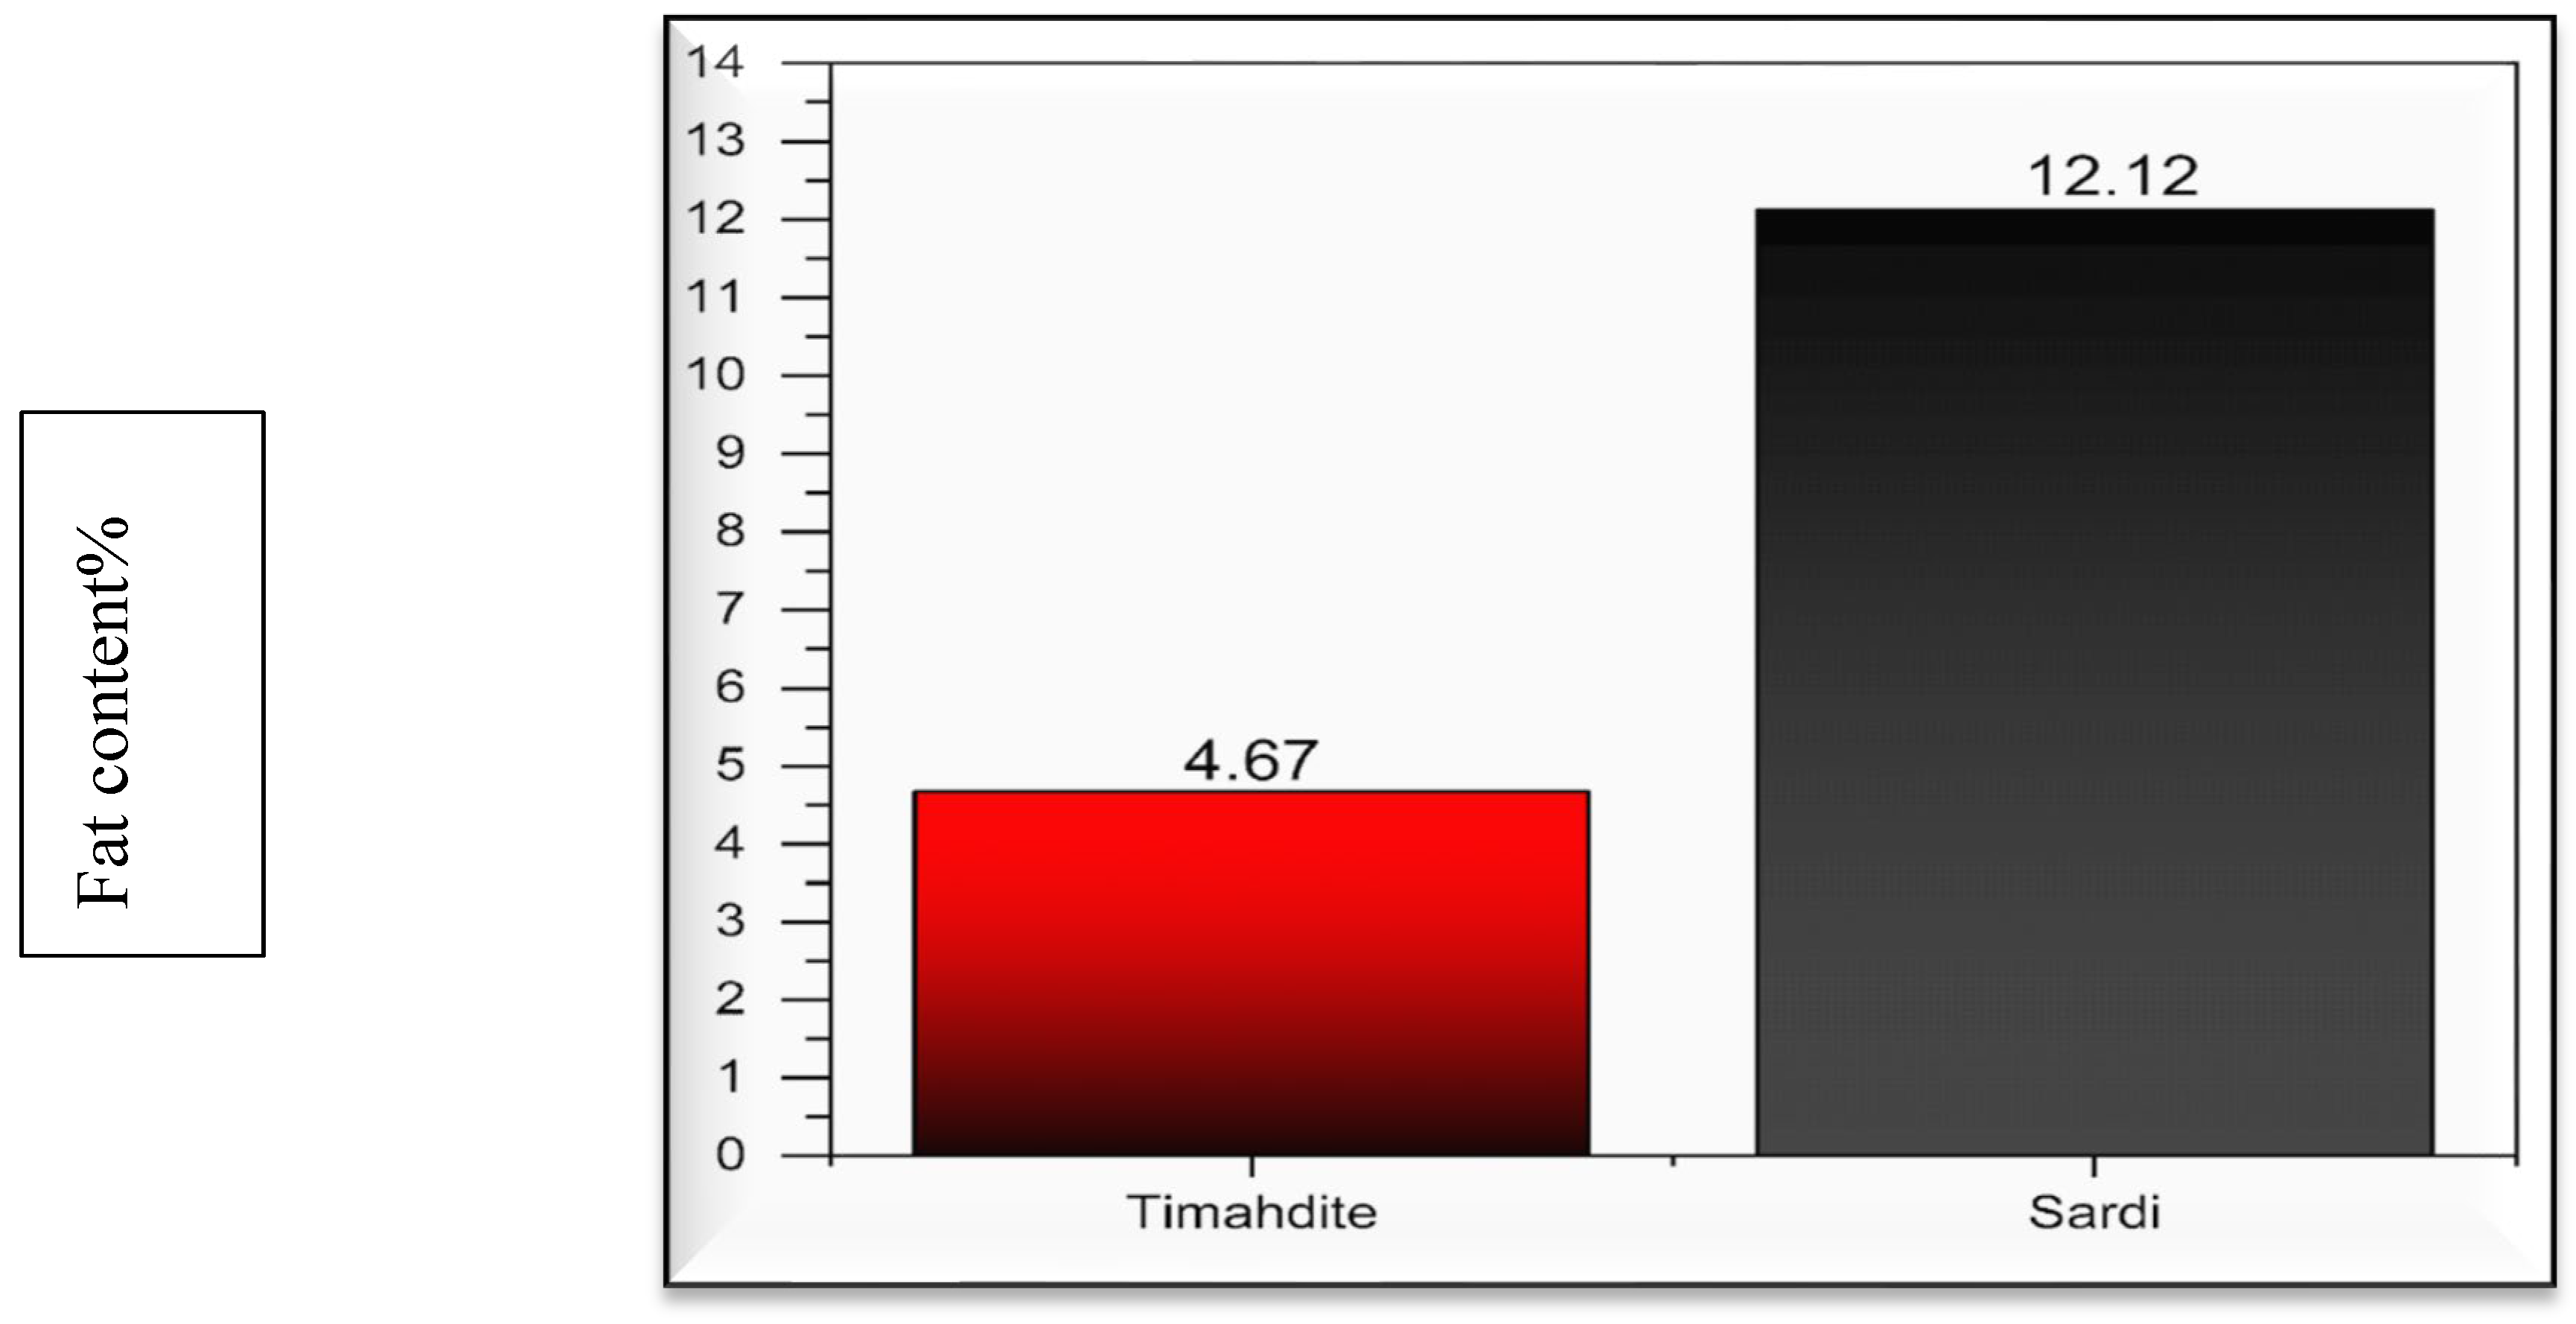
Figure 2), it’s miles obtrusive that they possess equal structural compositions. The sole distinction among them lies inside the versions in the intensities of the purposeful organizations, which can be corroborated by means of the differing sizes and fiber diameters. Fat Level:
Figure 3 Presents the proportion ranges of fatty acids of many of the diverse breeds examined. The Sardi breed extract demonstrates a higher fatty acid substance content material compared to different breeds, with a fee of 12.12%. Conversely, the Timahdite breed famous a fatty acid percentage of 4.67%. This value can be corroborated through infrared spectroscopy within the band c language of 3272-3072 cm-1, corresponding to carboxylic acid (OH) bonds.
3.1.2. Percentage of Acid
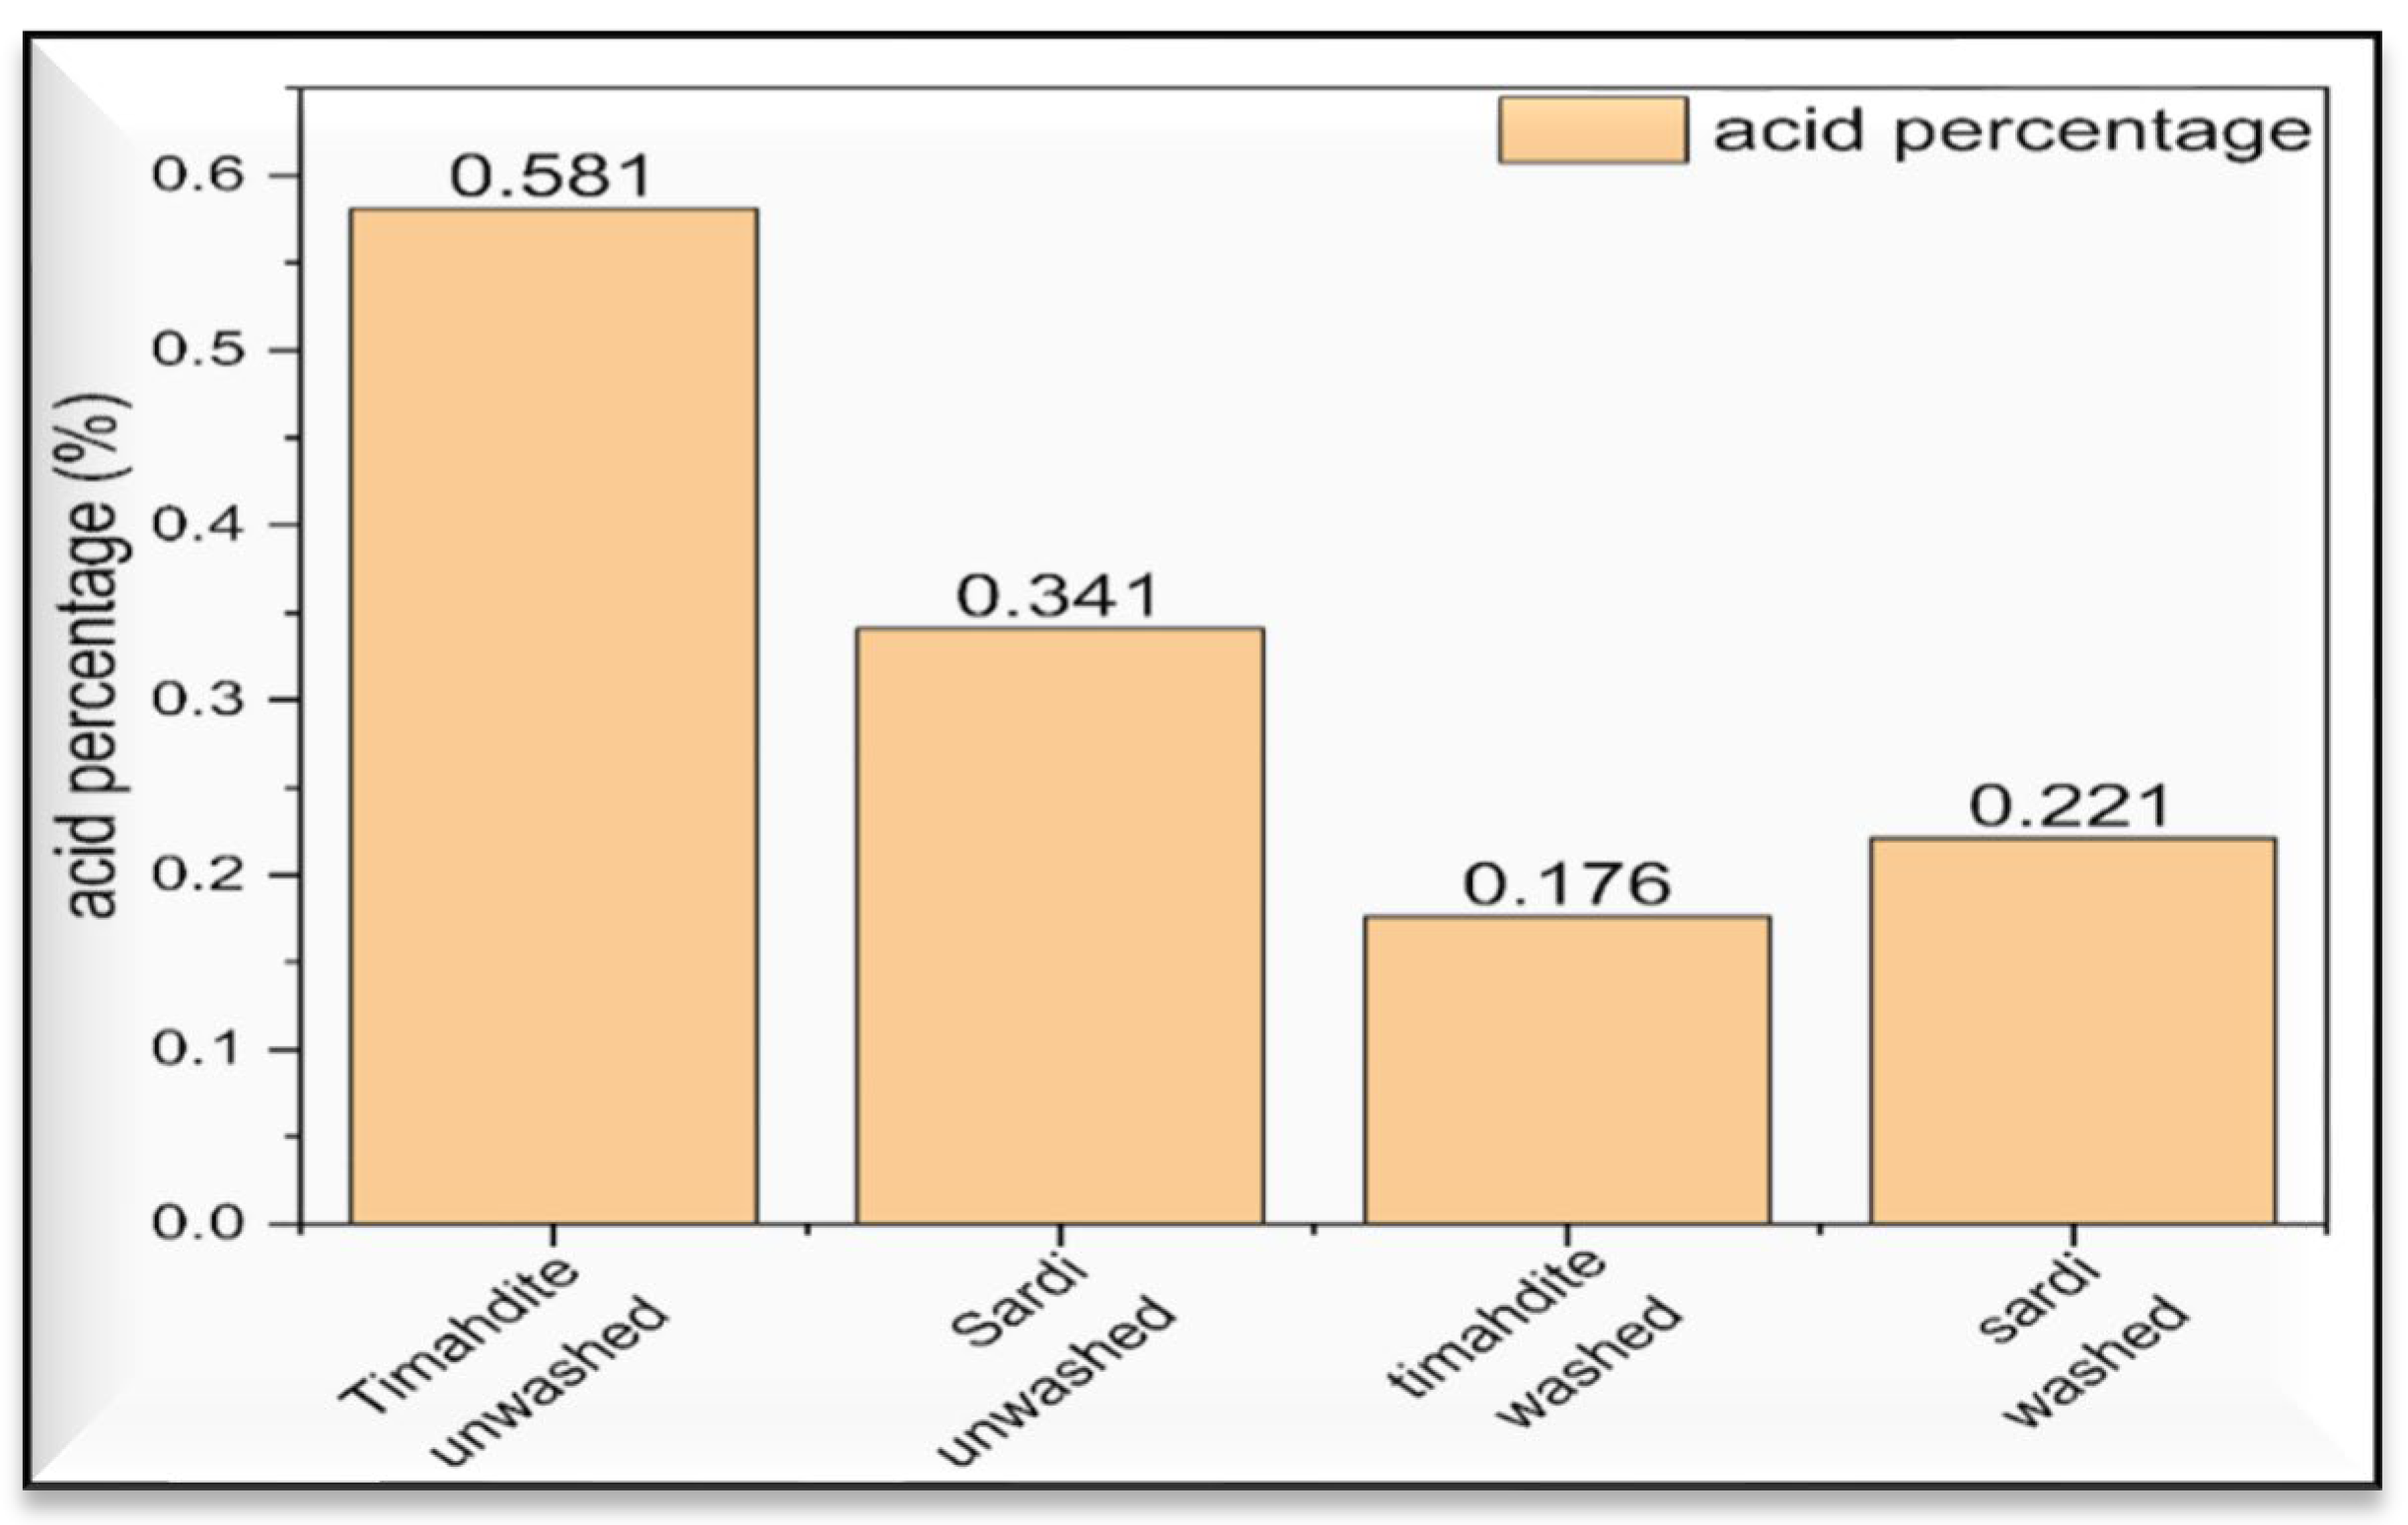
The analysis of acid percentage shows that the acid content in unwashed wool fibers from two breeds is low, not surpassing 0.6% of the dry mass of the tested samples.
Among the breeds, the Timahdite breed exhibits the highest acid concentration at 0.581%, while the Sardi breed shows a lower percentage of 0.341%, as illustrated in
Figure 4 for washed and unwashed fibers.
The acid percent evaluation for washed fibers suggests that the acid content material in wool fibers across diverse breeds stays below 0.341% of the dry mass of the examined samples. Notably, the Sardi breed well-known shows the very best acid awareness with a fee of zero.221%, whilst the Timahdite breed indicates a percent of 0.176%, as illustrated in
Figure 4.
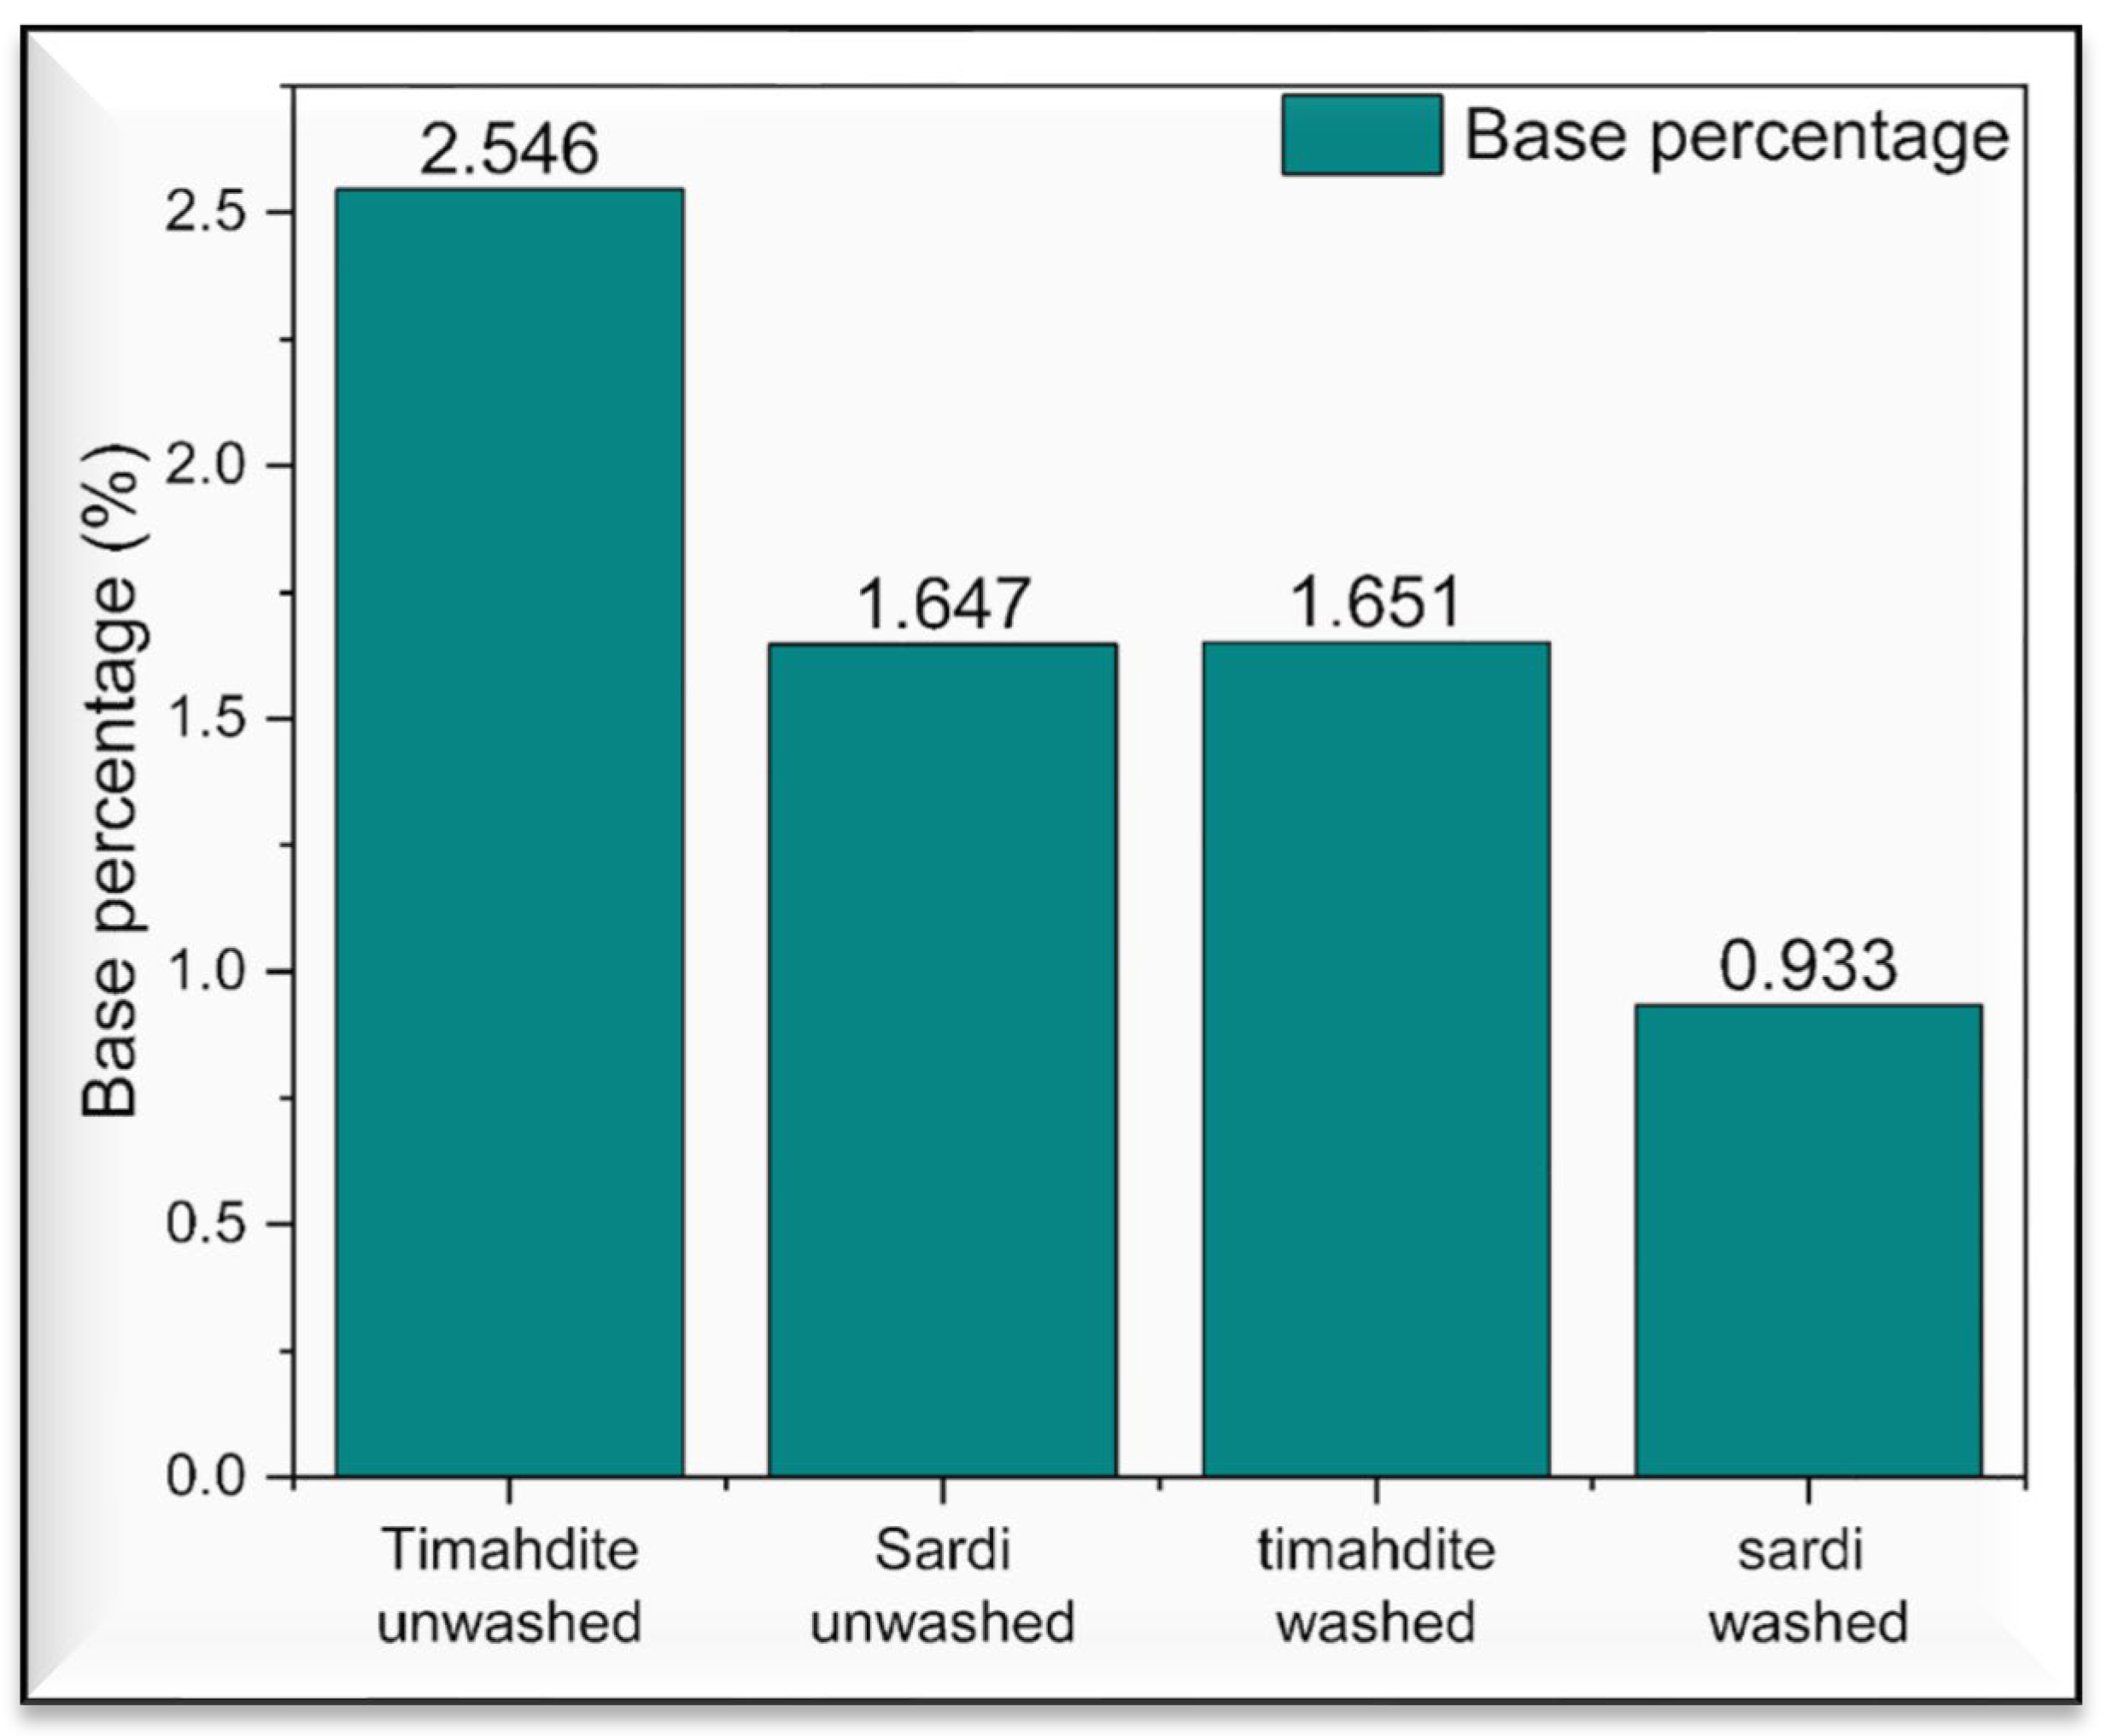
3.1.3. Base Percentage
The base percentage assessment exhibits the amount of base present within the fibers of unwashed wool. The Timahdite breed reveals the very best base content material, measured at 2.546%, at the same time as the Sardi breed suggests a base percent of 1.647%, as illustrated in
Figure 5.
The base percentage evaluation indicates the amount of base gift inside the fibers of the washed wool. According to
Figure 5, the Timahdite breed exhibits the very best base content material, measuring at 1.651%, while the Sardi breed shows a lower percentage of 0.933%.
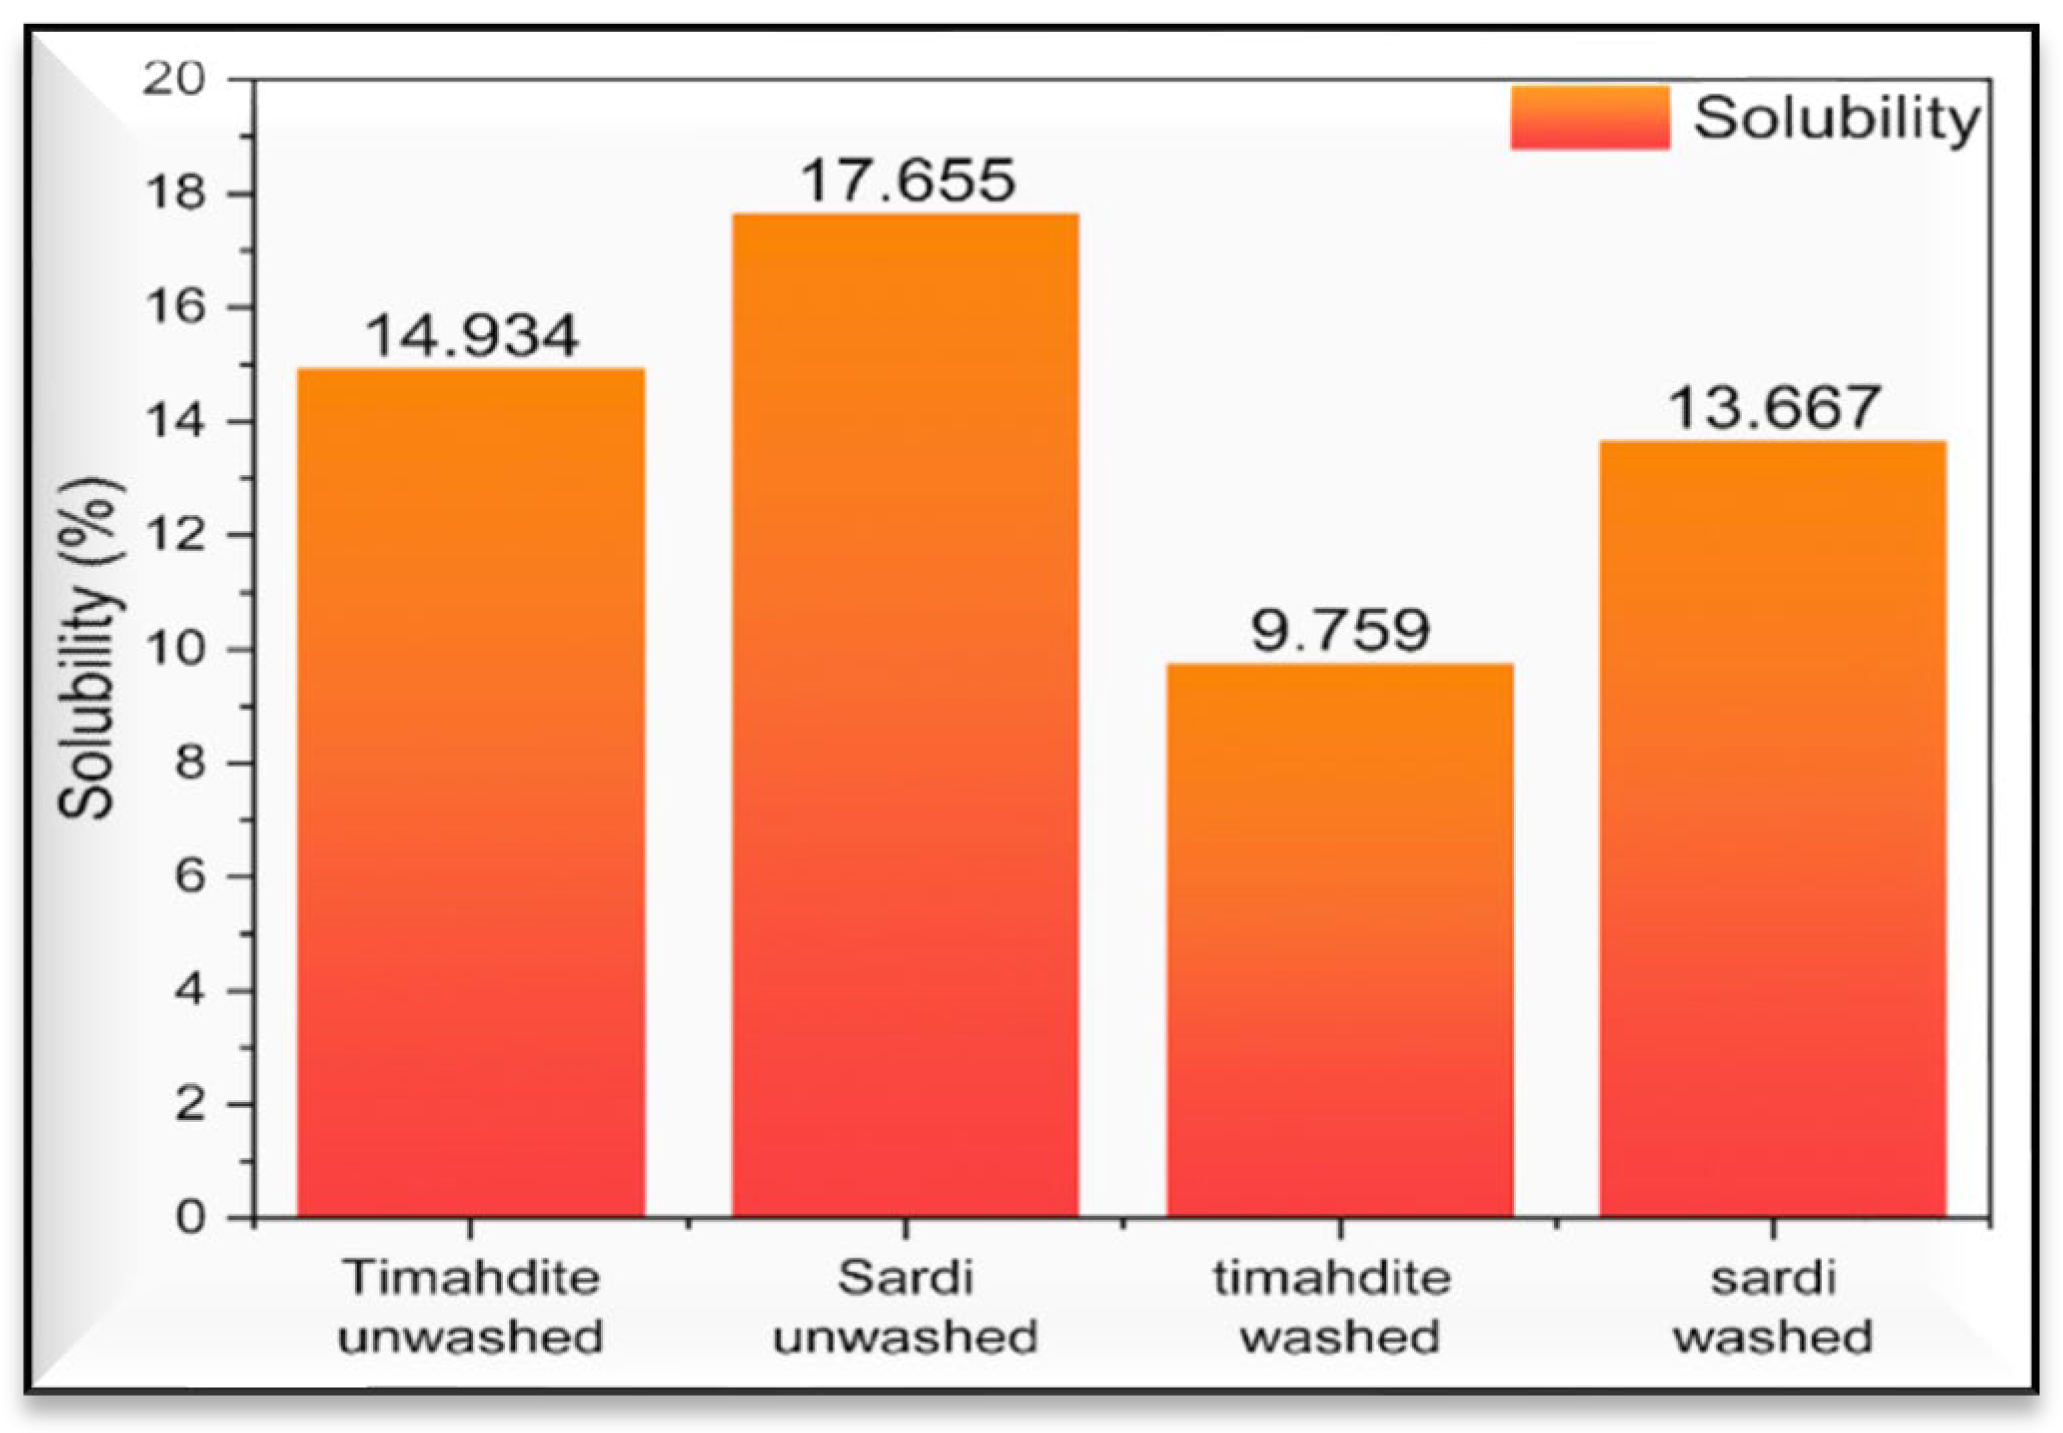
3.1.4. Solubility in Base
The solubility assessment in a basic solution suggests that the solubility of unwashed wool fibers from various breeds does not surpass 18% of the dry mass of the samples tested, corroborating current literature. The fee of unwashed Sardi is 17.655% however unwashed Timahdite is 14.934%
Figure 6 illustrates that the Sardi breed famous has the highest resistance to basic answer attacks, in comparison to the Timahdite breed.
Figure 6. illustrates that the Sardi breed exhibits the highest solubility in Base percentage post-washing, at 13.667%. While the Timahdite breed demonstrates a lower solubility percentage, registering at merely 9.759%.
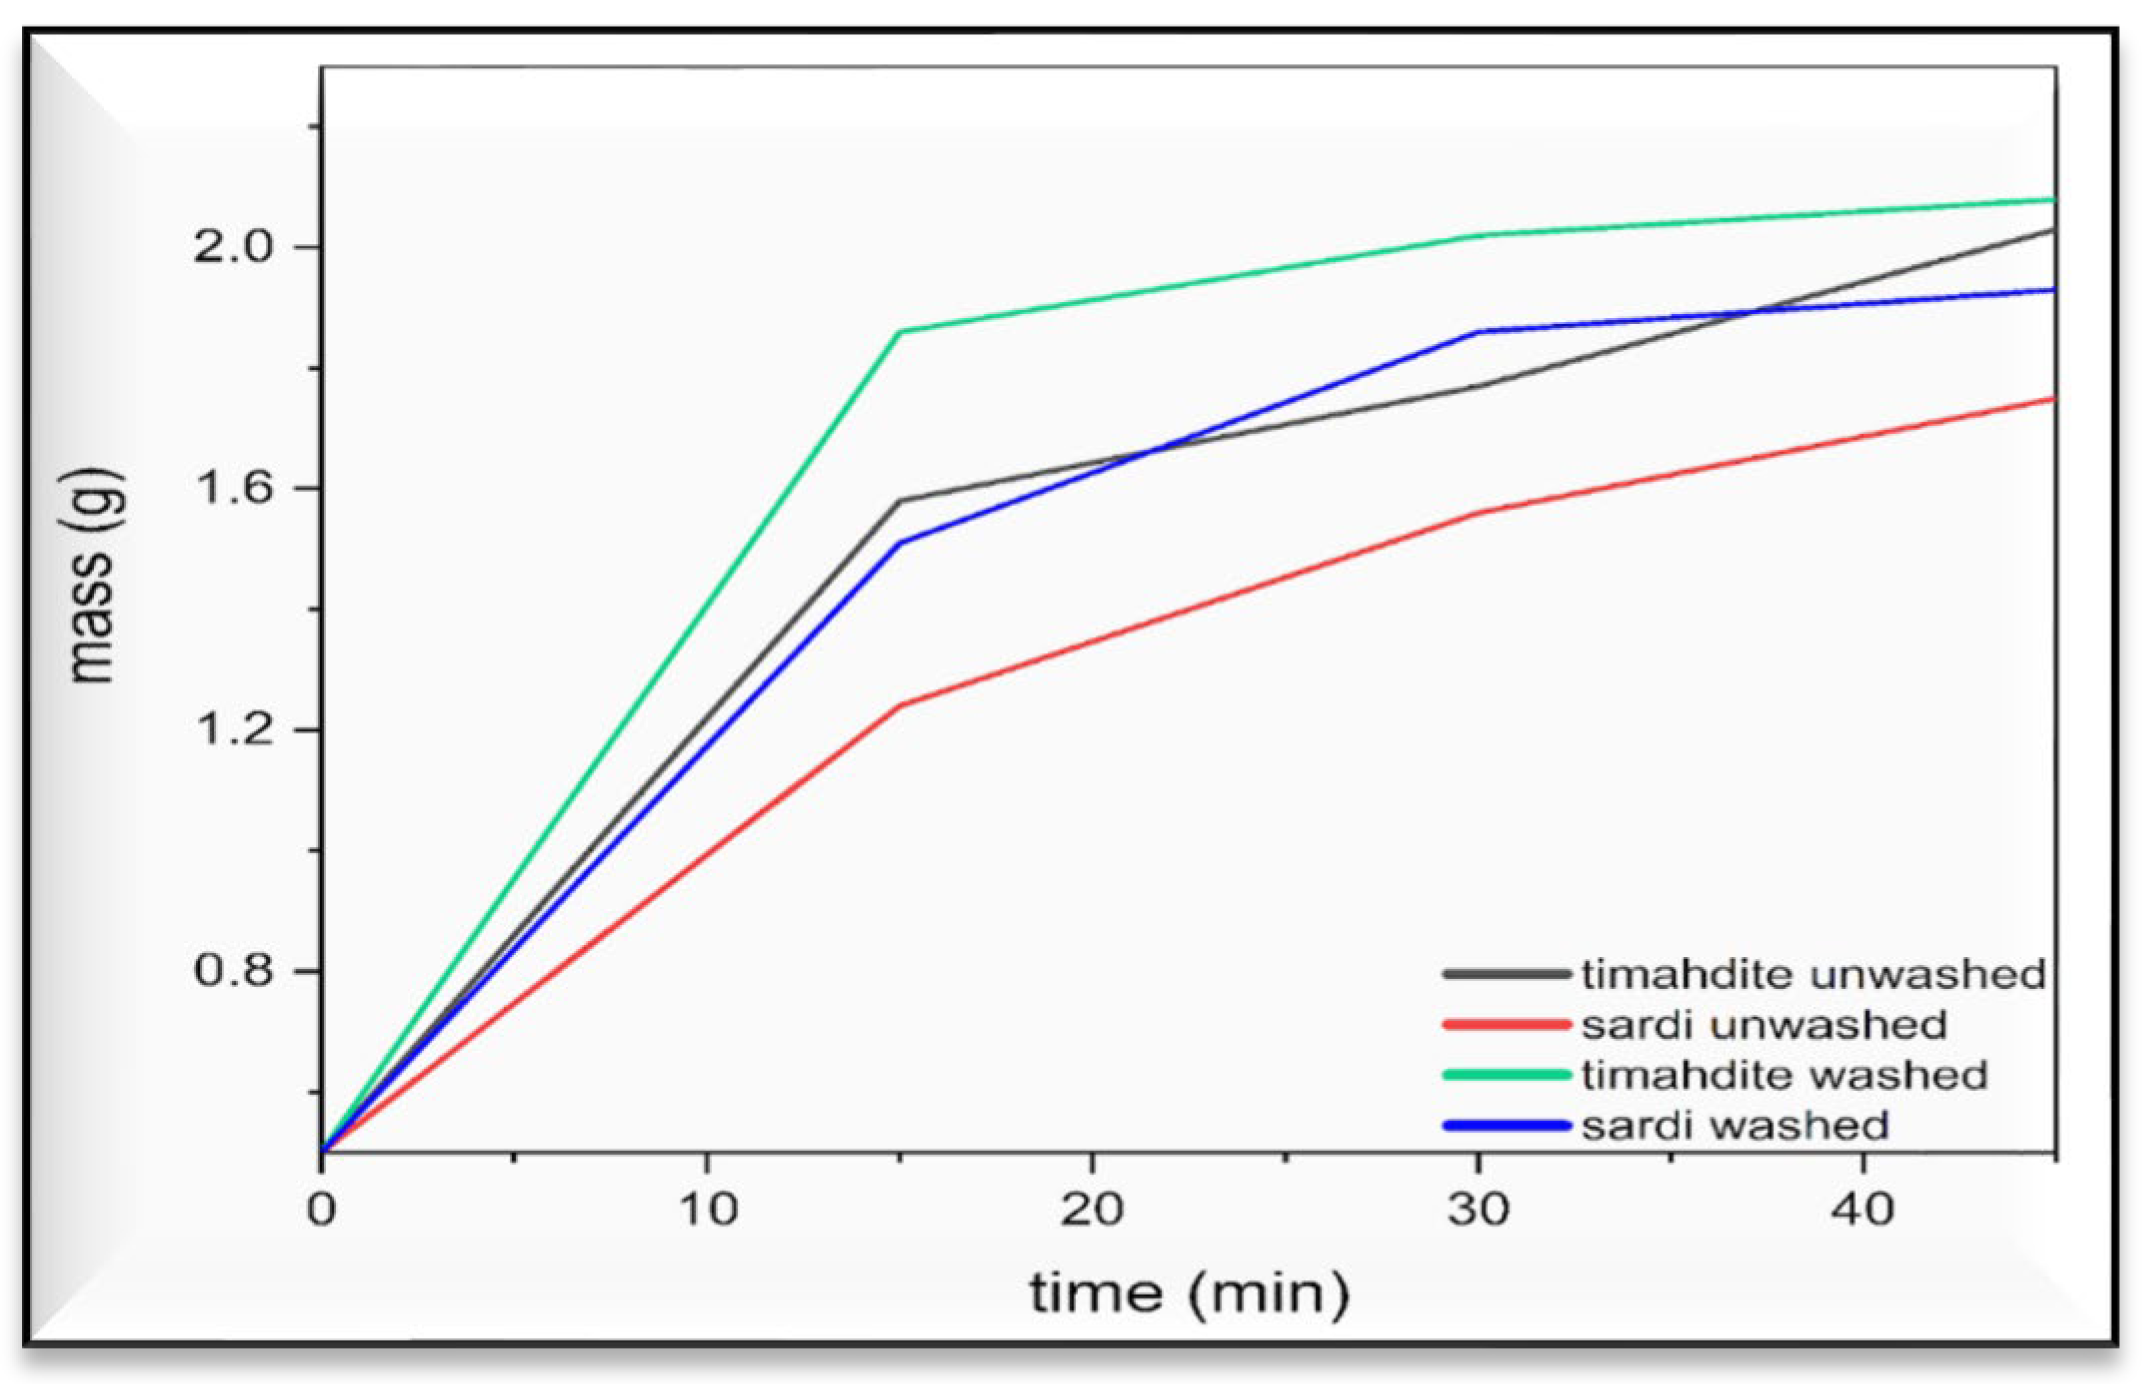
3.1.5. Water Absorption Capacity
The assessment of water absorption capacity was conducted for both washed and unwashed fibers of the two breeds. The outcomes reflect the changes in water absorption for each sample over time.
For unwashed fibers, it was observed that the Timahdite breed presented the highest water absorption capacity, indicated by an increase in initial mass up to 2.03g. In contrast, the Sardi breed demonstrated the lower mass value at 1.75g (
Figure 7). Similarly, for washed fibers, the Timahdite breed maintained the highest water absorption capacity at 2.08g, whereas the Sardi breed showed a lower mass value at 1.93g.
Table 2.
Evolution of the Mass of Samples Timahdite and Sardi as a Function of Time.
Table 2.
Evolution of the Mass of Samples Timahdite and Sardi as a Function of Time.
| Time (min) |
0 |
15 |
30 |
45 |
| Mass Timahdite unwashed (g) |
0,50 |
1,58 |
1,77 |
2,03 |
| Mass Sardi unwashed (g) |
0,50 |
1,24 |
1,56 |
1,75 |
| Timahdite washed (g) |
0.50 |
1.86 |
2.02 |
2.08 |
| Sardi washed (g) |
0.50 |
1.51 |
1.85 |
1.93 |
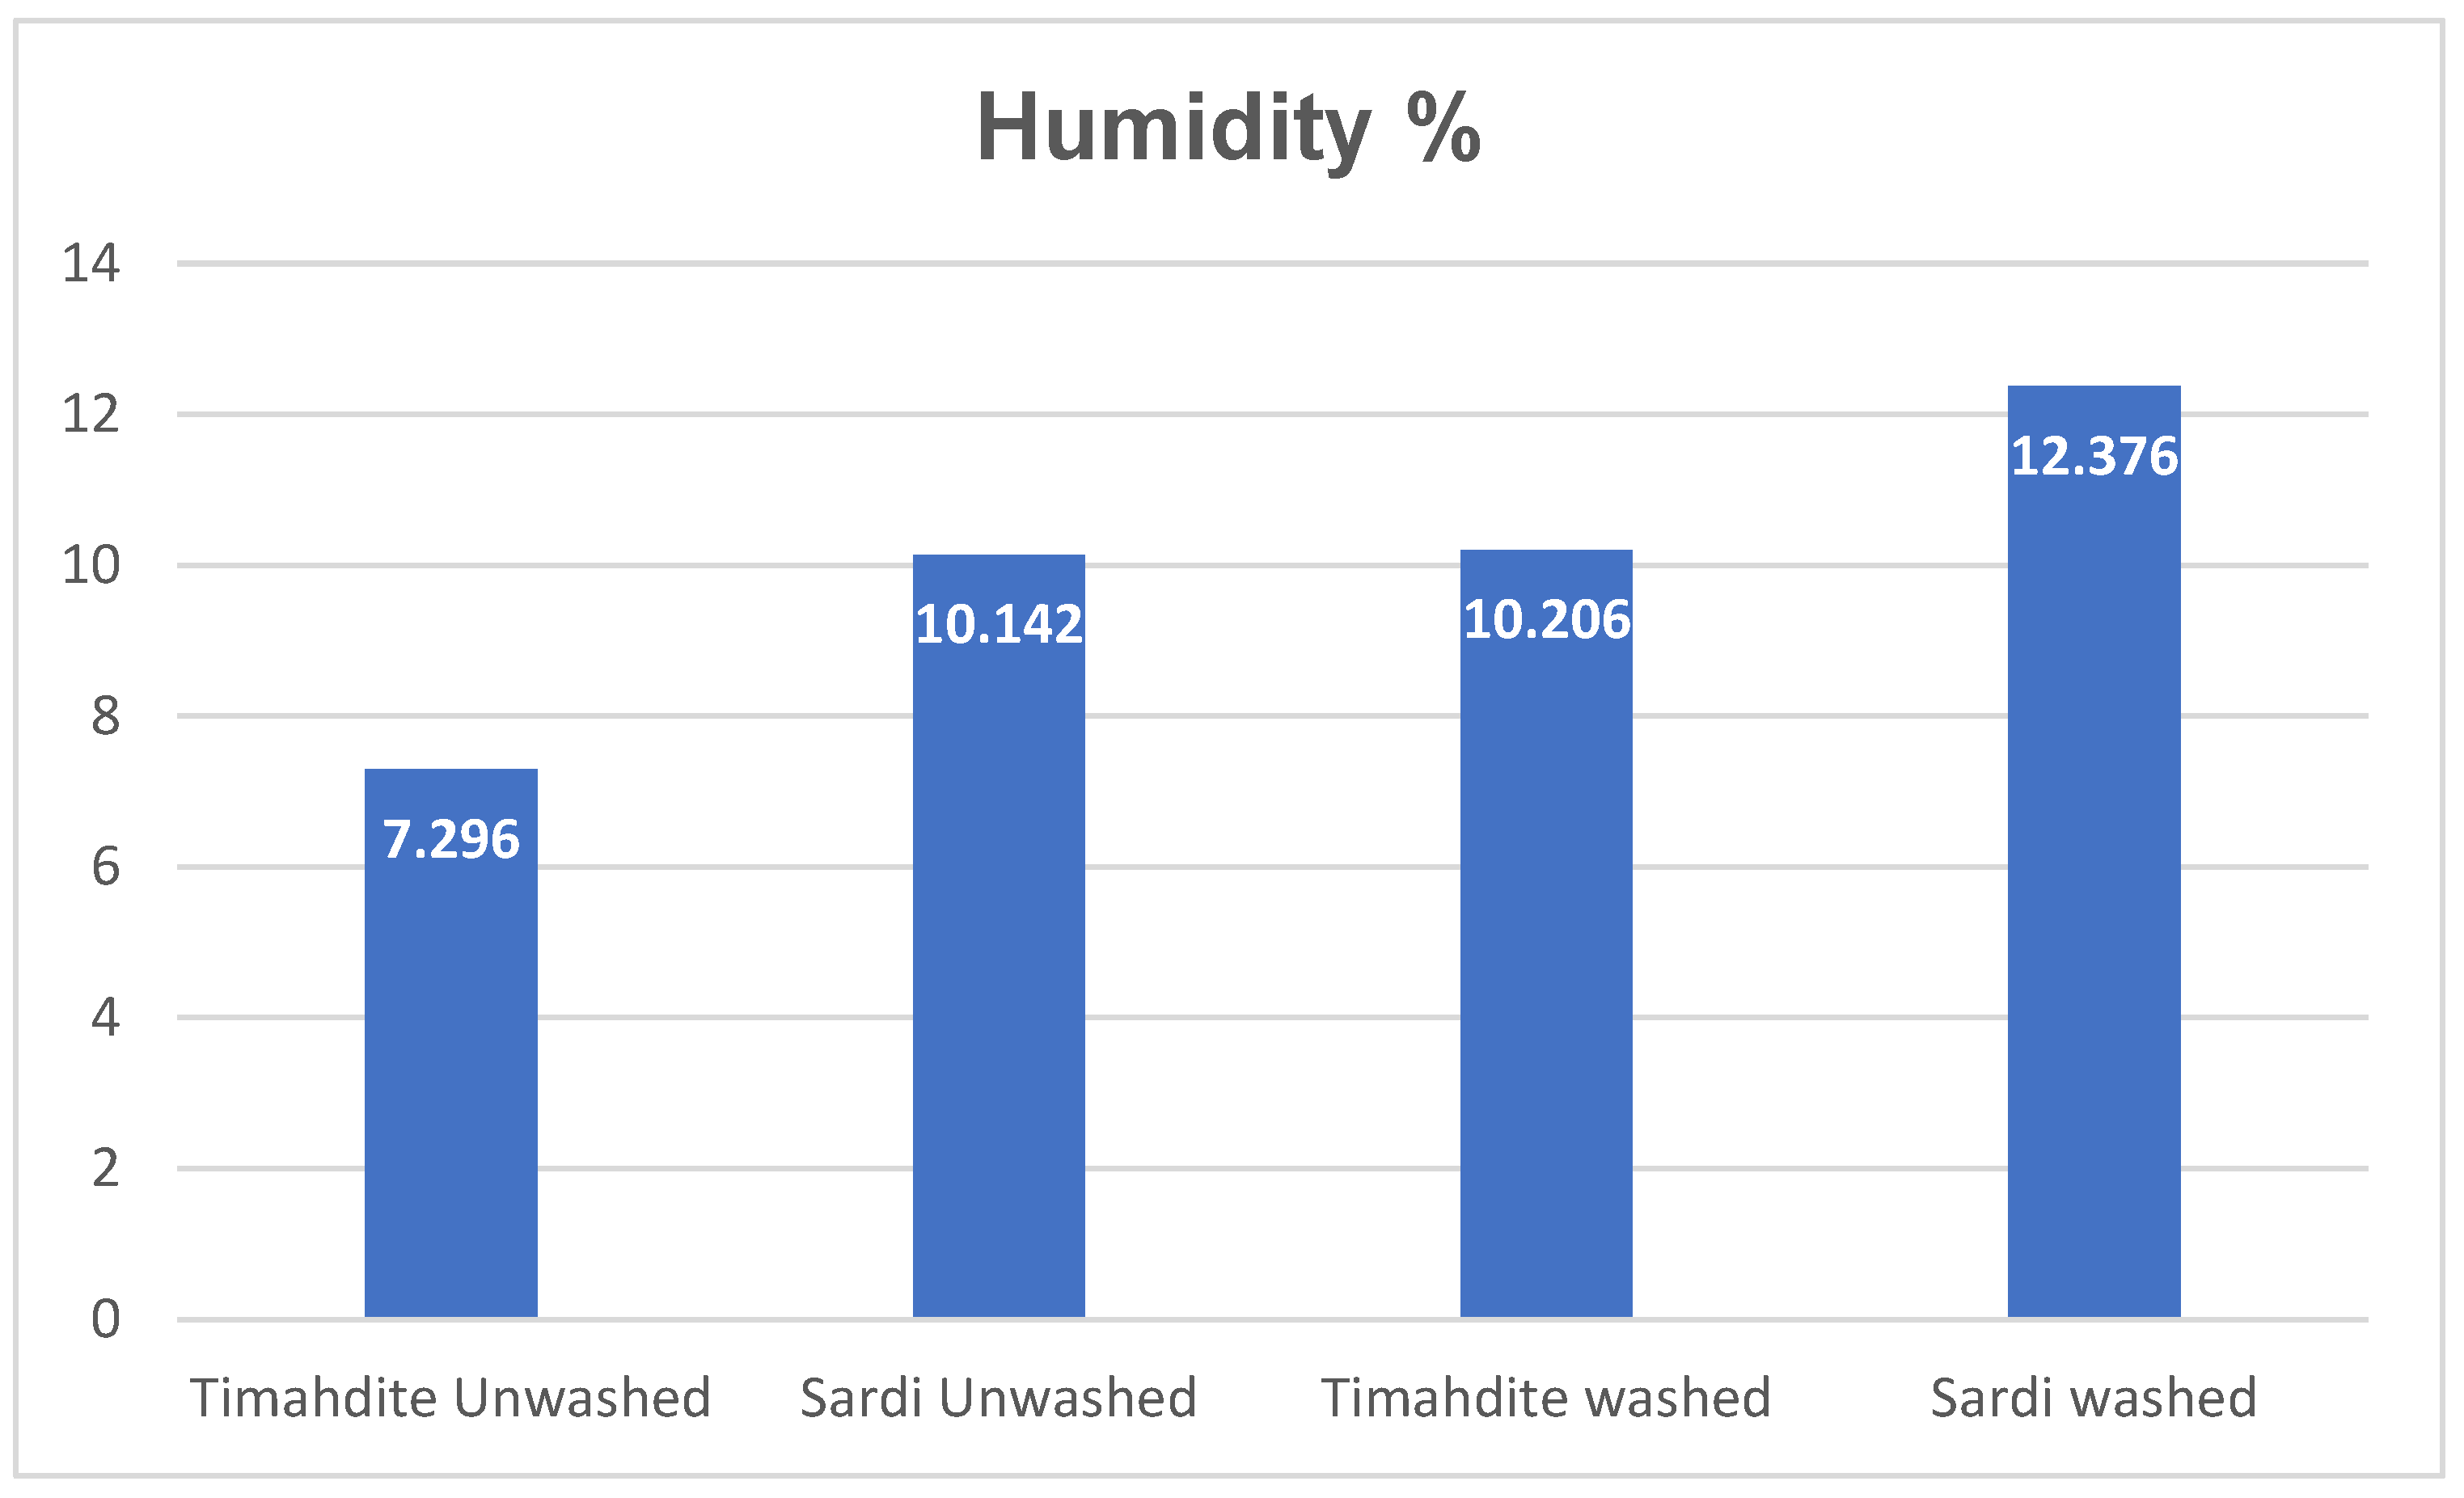
3.1.6. Humidity Rate
Wool fibers certainly comprise varying tiers of water, which aren’t regular. According to the TIS 876-2547 standard, the average moisture content material needs to variety between four% and 13%. The assessment of the humidity level promptly indicates a minor discrepancy among the breeds, as illustrated in
Figure 8. It is found that the Sardi breed’s unwashed fibers show off a better humidity absorption price of 12.376%, compared to Timahdite wool, has a fee of seven.296%.
The results show that the relative humidity of Timahdite fibers increases from 7.296% to 10.206% after washing, representing an increase of approximately 40%. This suggests that washing significantly enhances the moisture retention capacity of this fiber, likely by removing hydrophobic contaminants or altering its structure to expose hygroscopic functional groups. In comparison, the relative humidity of Sardi fibers will increase from 10.142% to twelve.376% after washing, an extra mild increase of about 22%. This indicates that Sardi fibers are evidently greater hydrophilic and less stricken by washing. Before washing, Sardi well-known shows a better relative humidity than Timahdite (10.142% in comparison to 7.296%), confirming its inherently extra hygroscopicity. However, after washing, at the same time as Sardi still keeps a higher relative humidity (12.376% compared to 10.206% for Timahdite), the relative improvement is greater widespread for Timahdite. These behavioral variations are probably due to the intrinsic homes of the fibers and the impact of washing on their floor or inner shape.
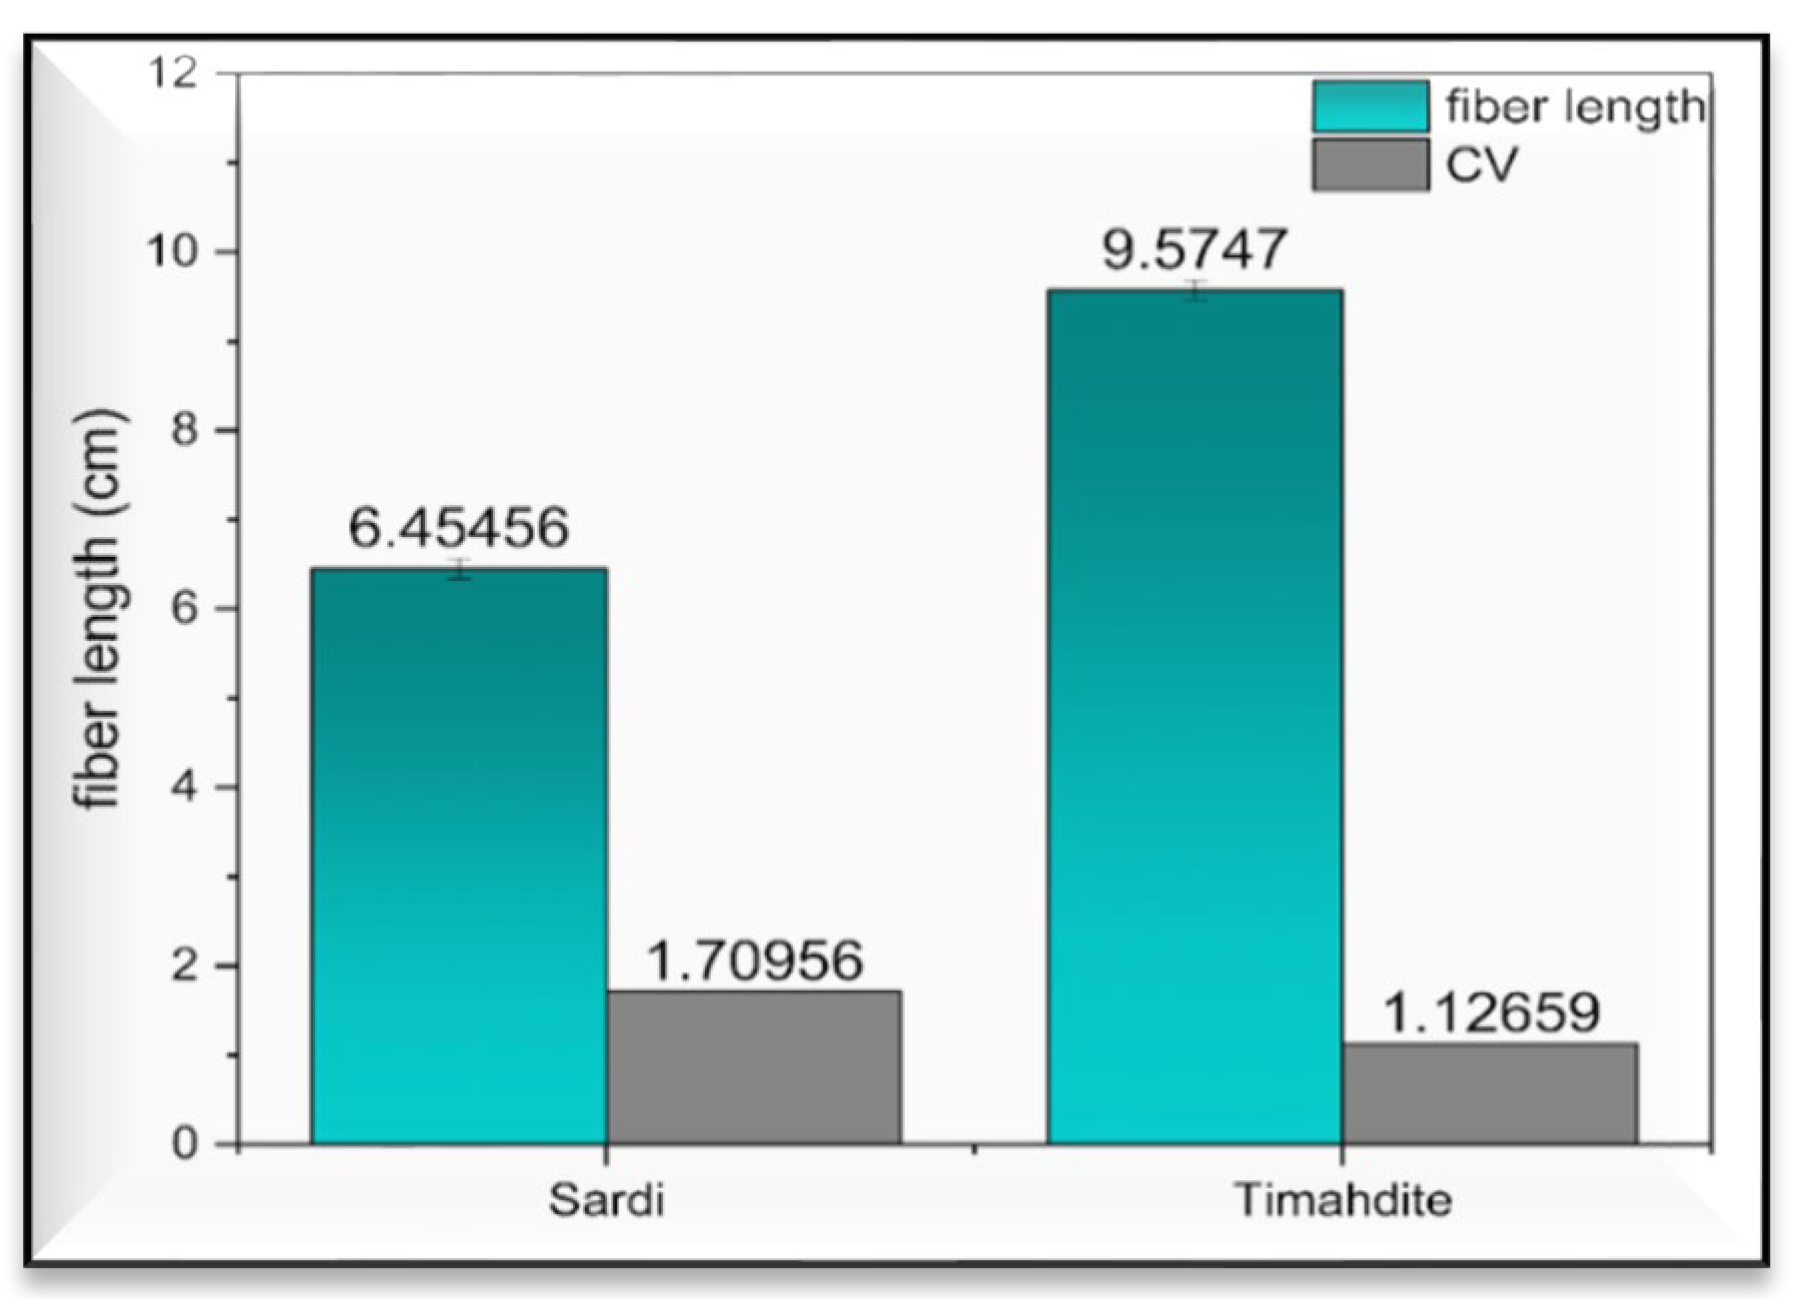
3.1.7. Fiber Length (Almetere)
Fiber period evaluation the use of the Almeter is a technique typically hired within the fabric industry to measure the average period and distribution of fibers in a sample. The Almeter is a specialized tool widely used within the cotton and other herbal fiber processing industries to evaluate fiber best. Understanding fiber length is crucial in determining material performance characteristics such as strength, spinning ability and overall quality.
Sardi wool possesses an average fiber length of 6.45456 cm. Conversely, Timahdite wool exhibits an average fiber length of 9.5747 cm. Therefore, it is evident that the fibers of Timahdite wool are generally longer than those of Sardi wool, as illustrated in
Figure 9.
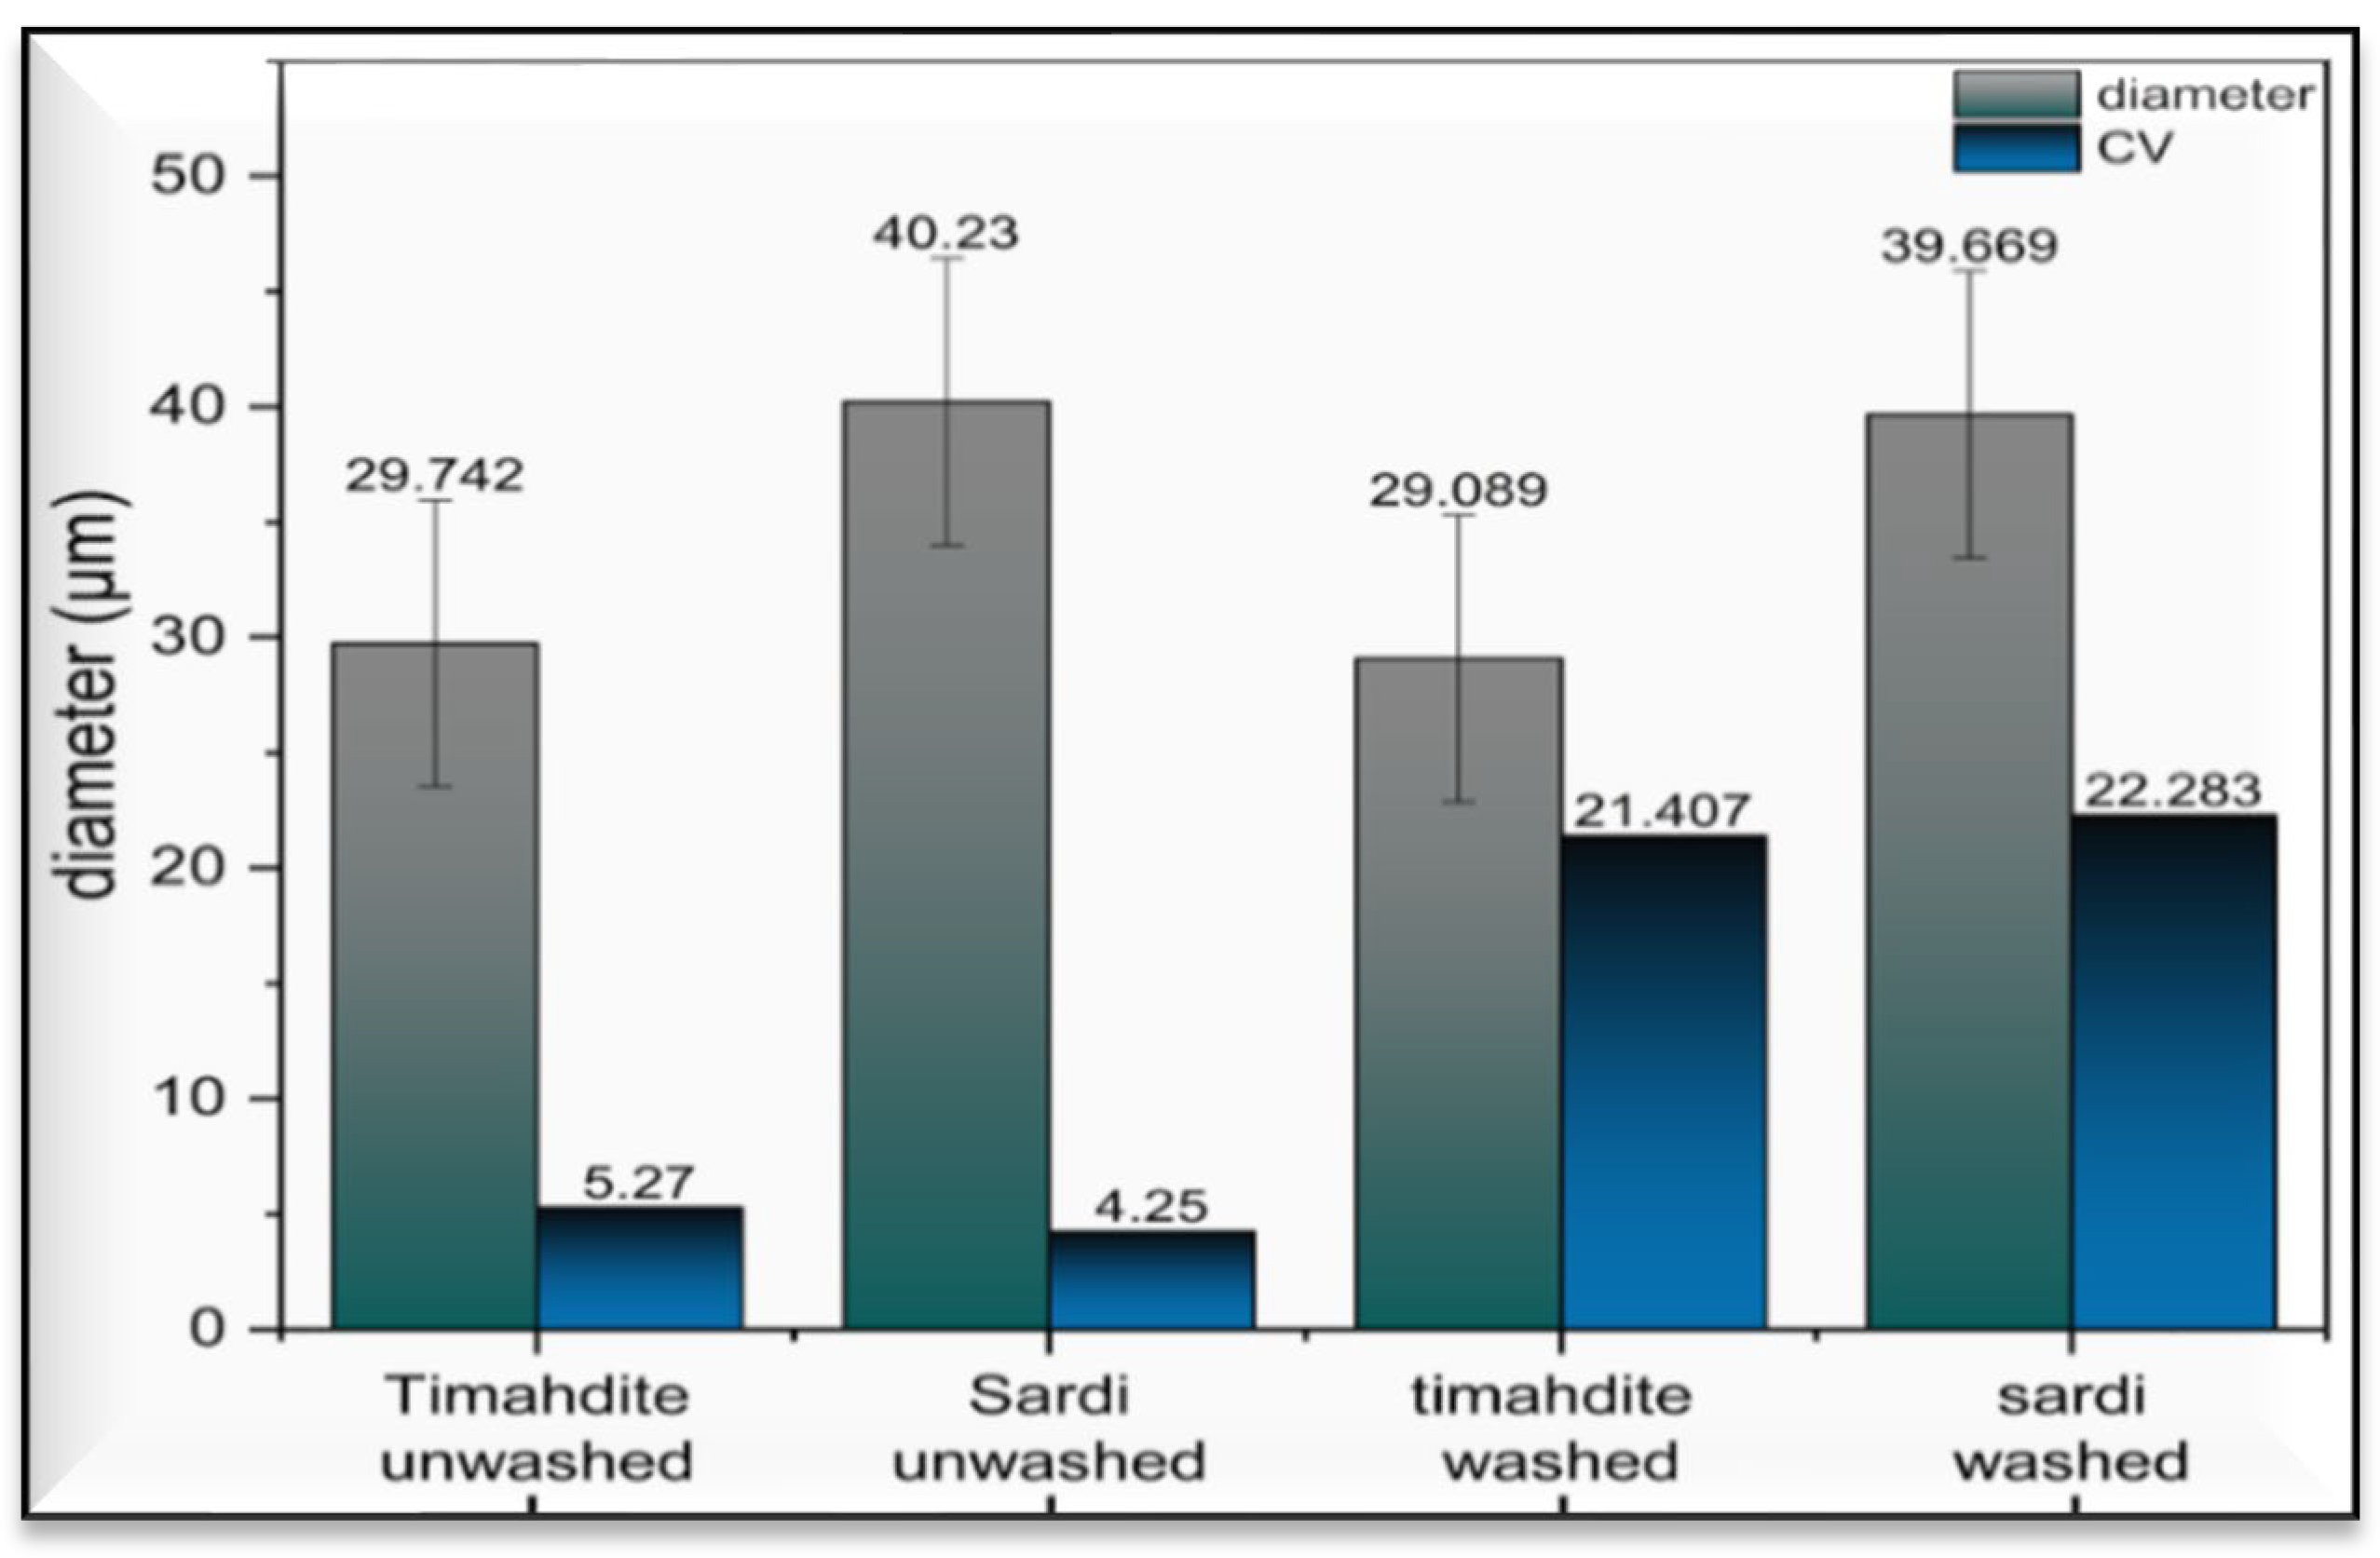
3.1.8. Fiber Diameter (OFDA)
The diameter of fibers from wonderful breeds of raw wool turned into assessed utilizing an optical microscope to capture distinctive pictures of the fibers from each breed (check with
Figure 10). Subsequently, ImageJ software was hired to measure a hundred and fifty diameter values for every sample, facilitating the calculation of the common diameter, the coefficient of variant, and the usual deviation of those measurements.
These findings are consolidated in
Table 3. The calculated average diameters were then represented in distribution graphs to facilitate their interpretation and evaluation (see
Figure 11).
In Table 8, we present a comparative analysis of the mean fiber diameters for each breed. The data indicate that the Timahdite breed shows the most refined fibers, with an average diameter of 29.742µm and a coefficient of variation (CV) of 5.17%. Conversely, the Sardi breed demonstrates a greater average diameter, measured at 40.230µm, accompanied by a CV of 2.51%.
Based on these findings, a comparison with other breeds documented in the literature is feasible (
Table 3). Consequently, the Timahdite breed can be classified within the Crossed wool category, characterized by a fineness ranging between 25µm and 33µm. In contrast, the Sardi breed should be categorized under the long wool group, which shows a fineness exceeding 33µm.
These histograms show a detailed representation of the diameter distribution for the two unprocessed, unwashed samples.
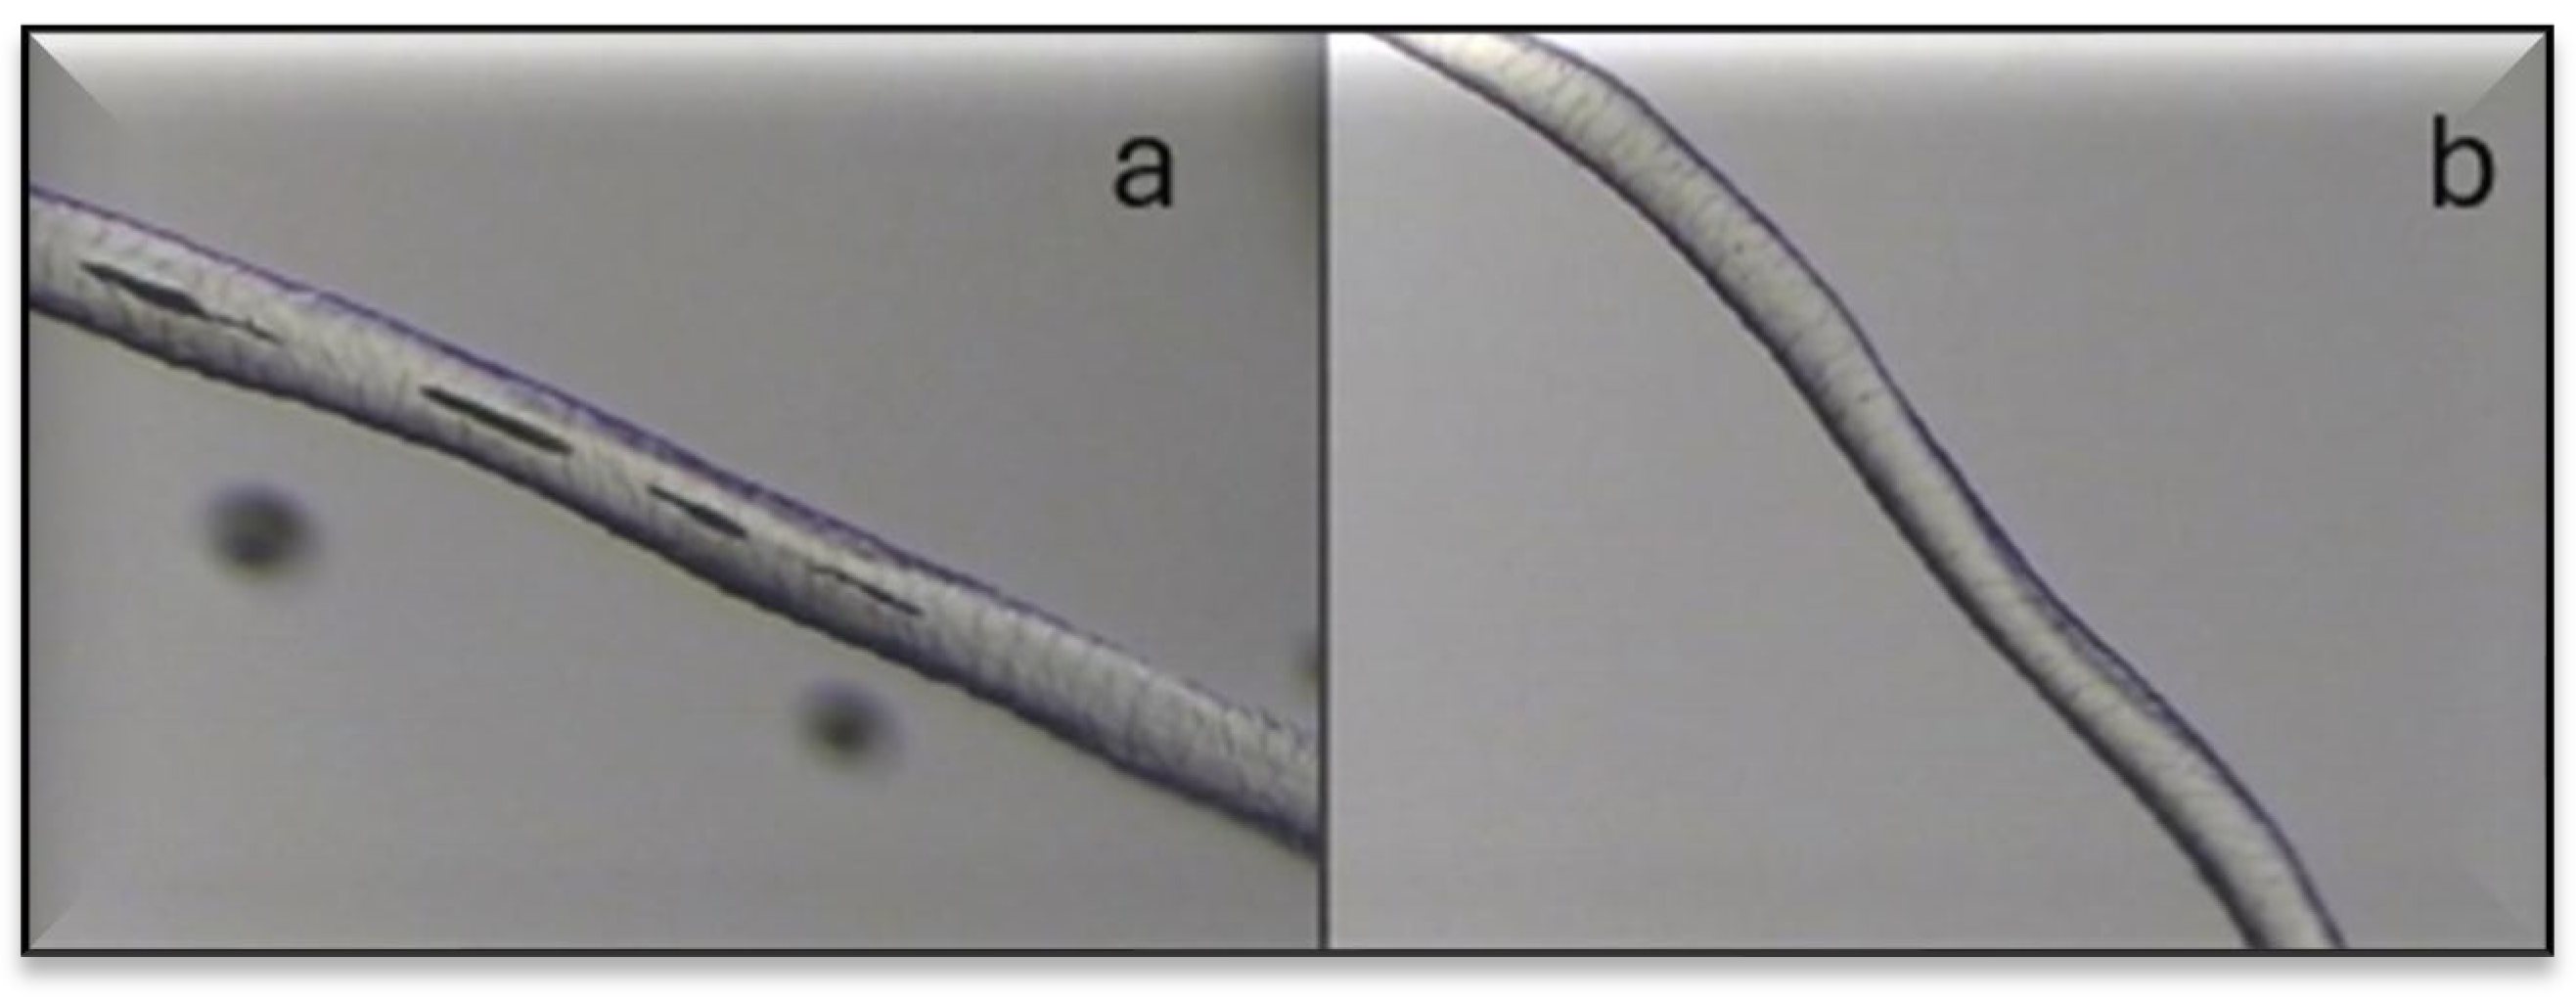
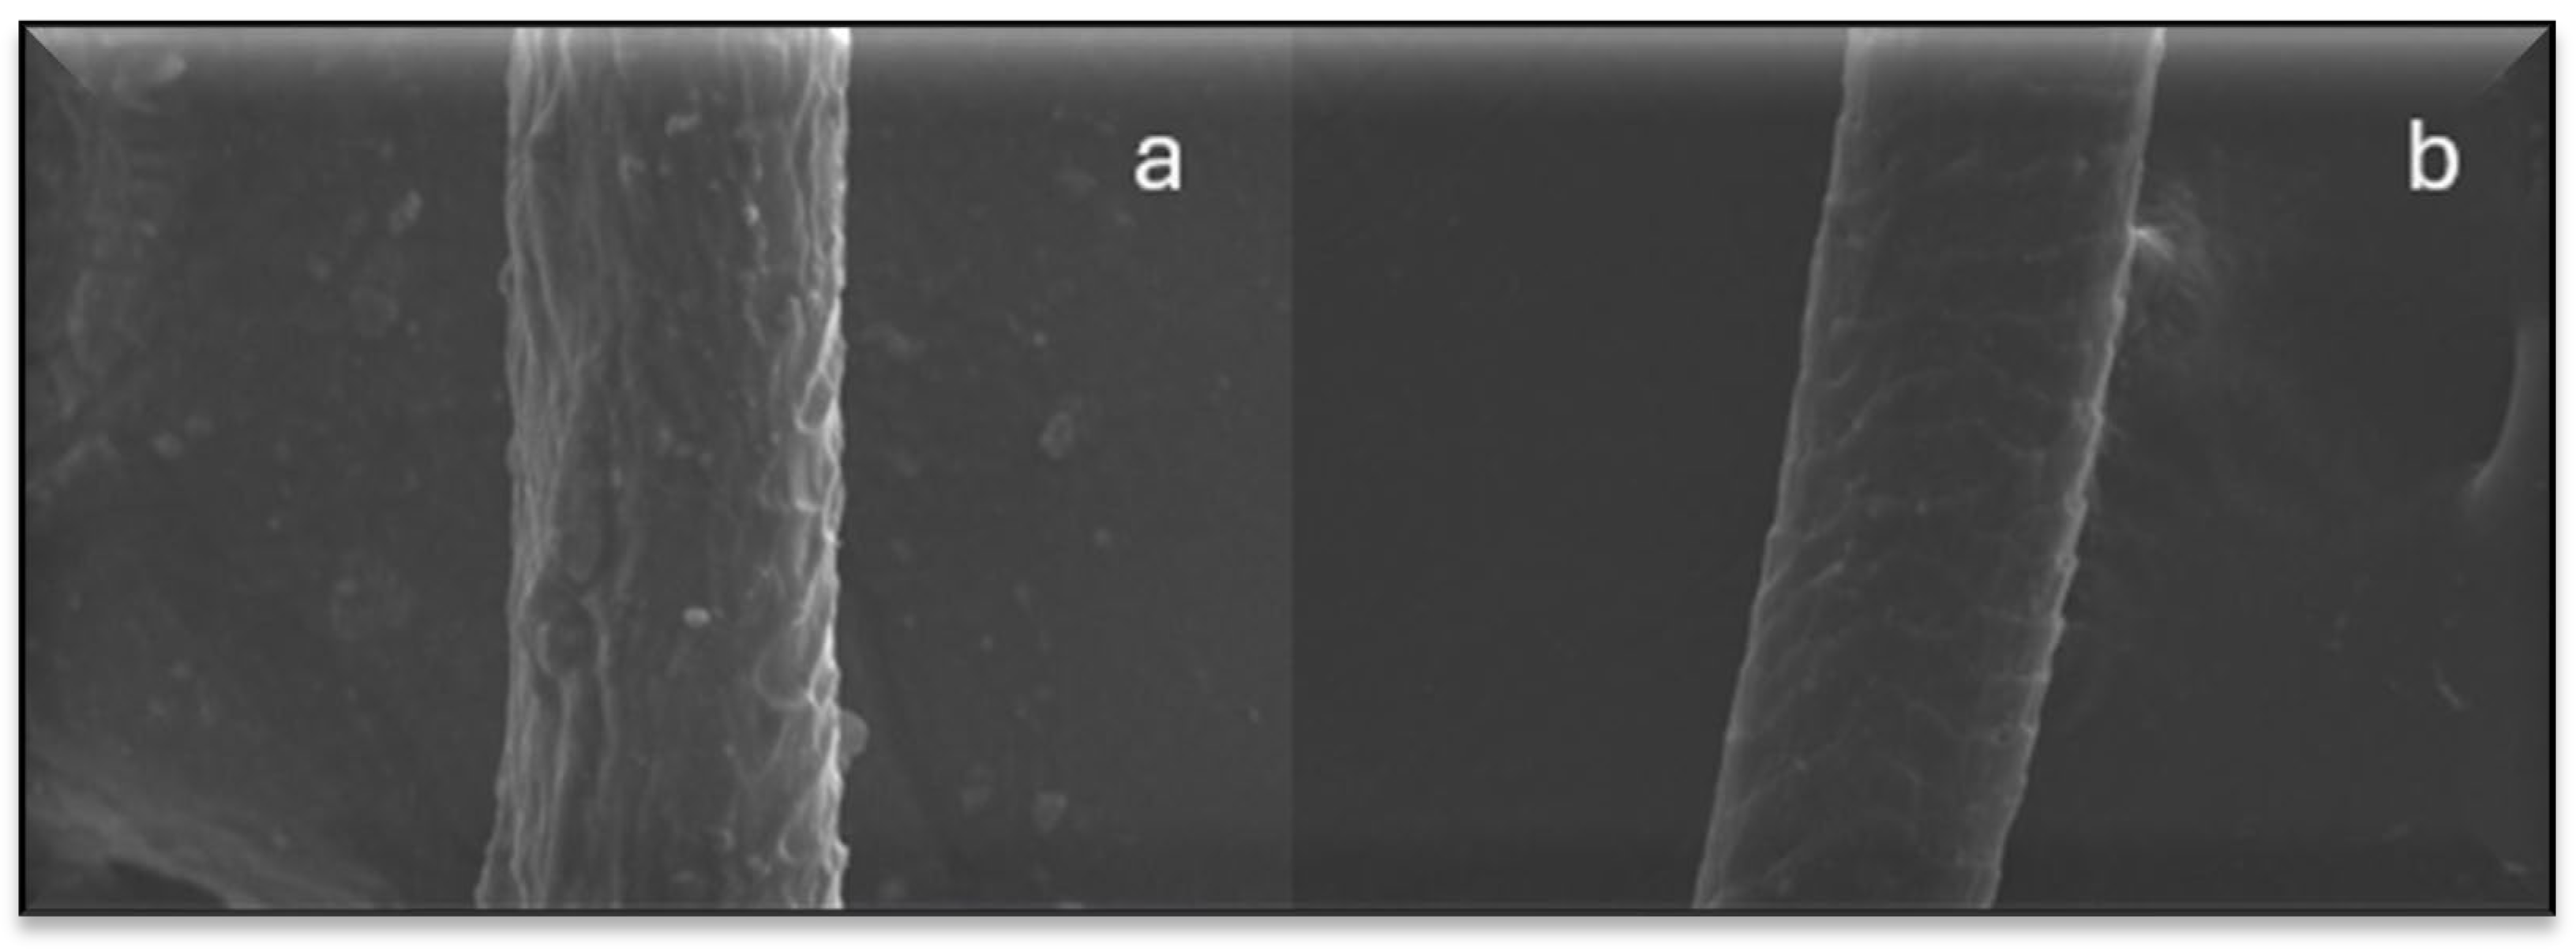
Figure 12.
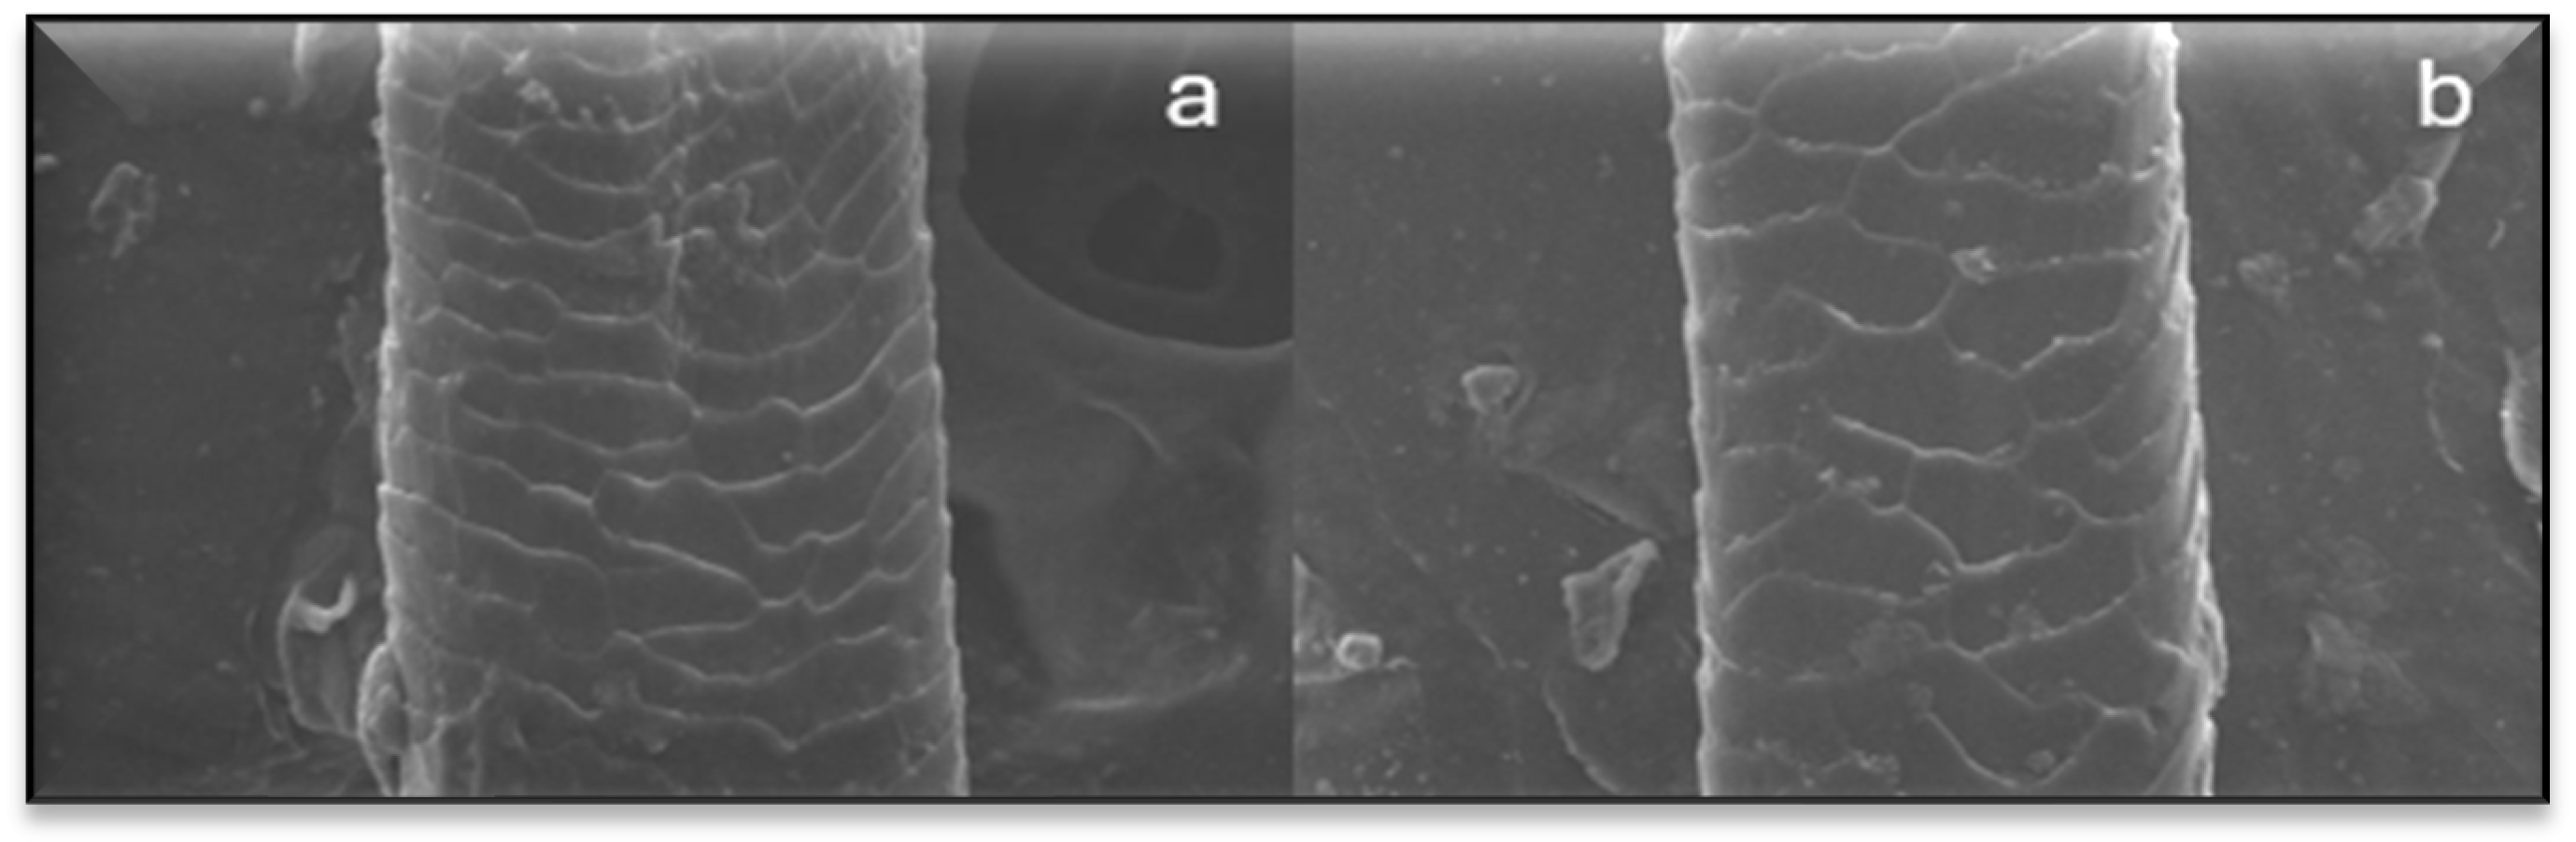
Microscopic image of washed Sardi (a) and washed Timahdite (b).
Figure 12.
Microscopic image of washed Sardi (a) and washed Timahdite (b).
Table 4.
Results of the diameters of the different breeds and their average diameter and CV of unwashed fibers by OFDA.
Table 4.
Results of the diameters of the different breeds and their average diameter and CV of unwashed fibers by OFDA.
| Races |
Timahdite |
Sardi |
| Average Diameter (µm) |
29,08 |
39,66 |
| CV% |
21,38 |
22,26 |
| Standard deviation |
6,22 |
8,83 |
Table 5.
Results of the diameters of the different breeds and their average diameter and CV of unwashed fibers by PORTAR.
Table 5.
Results of the diameters of the different breeds and their average diameter and CV of unwashed fibers by PORTAR.
| Races |
Timahdite |
Sardi |
| Average Diameter (µm) |
27,8 |
37,4 |
| CV% |
2,05 |
1,73 |
| Standard deviation |
0,57 |
0,65 |
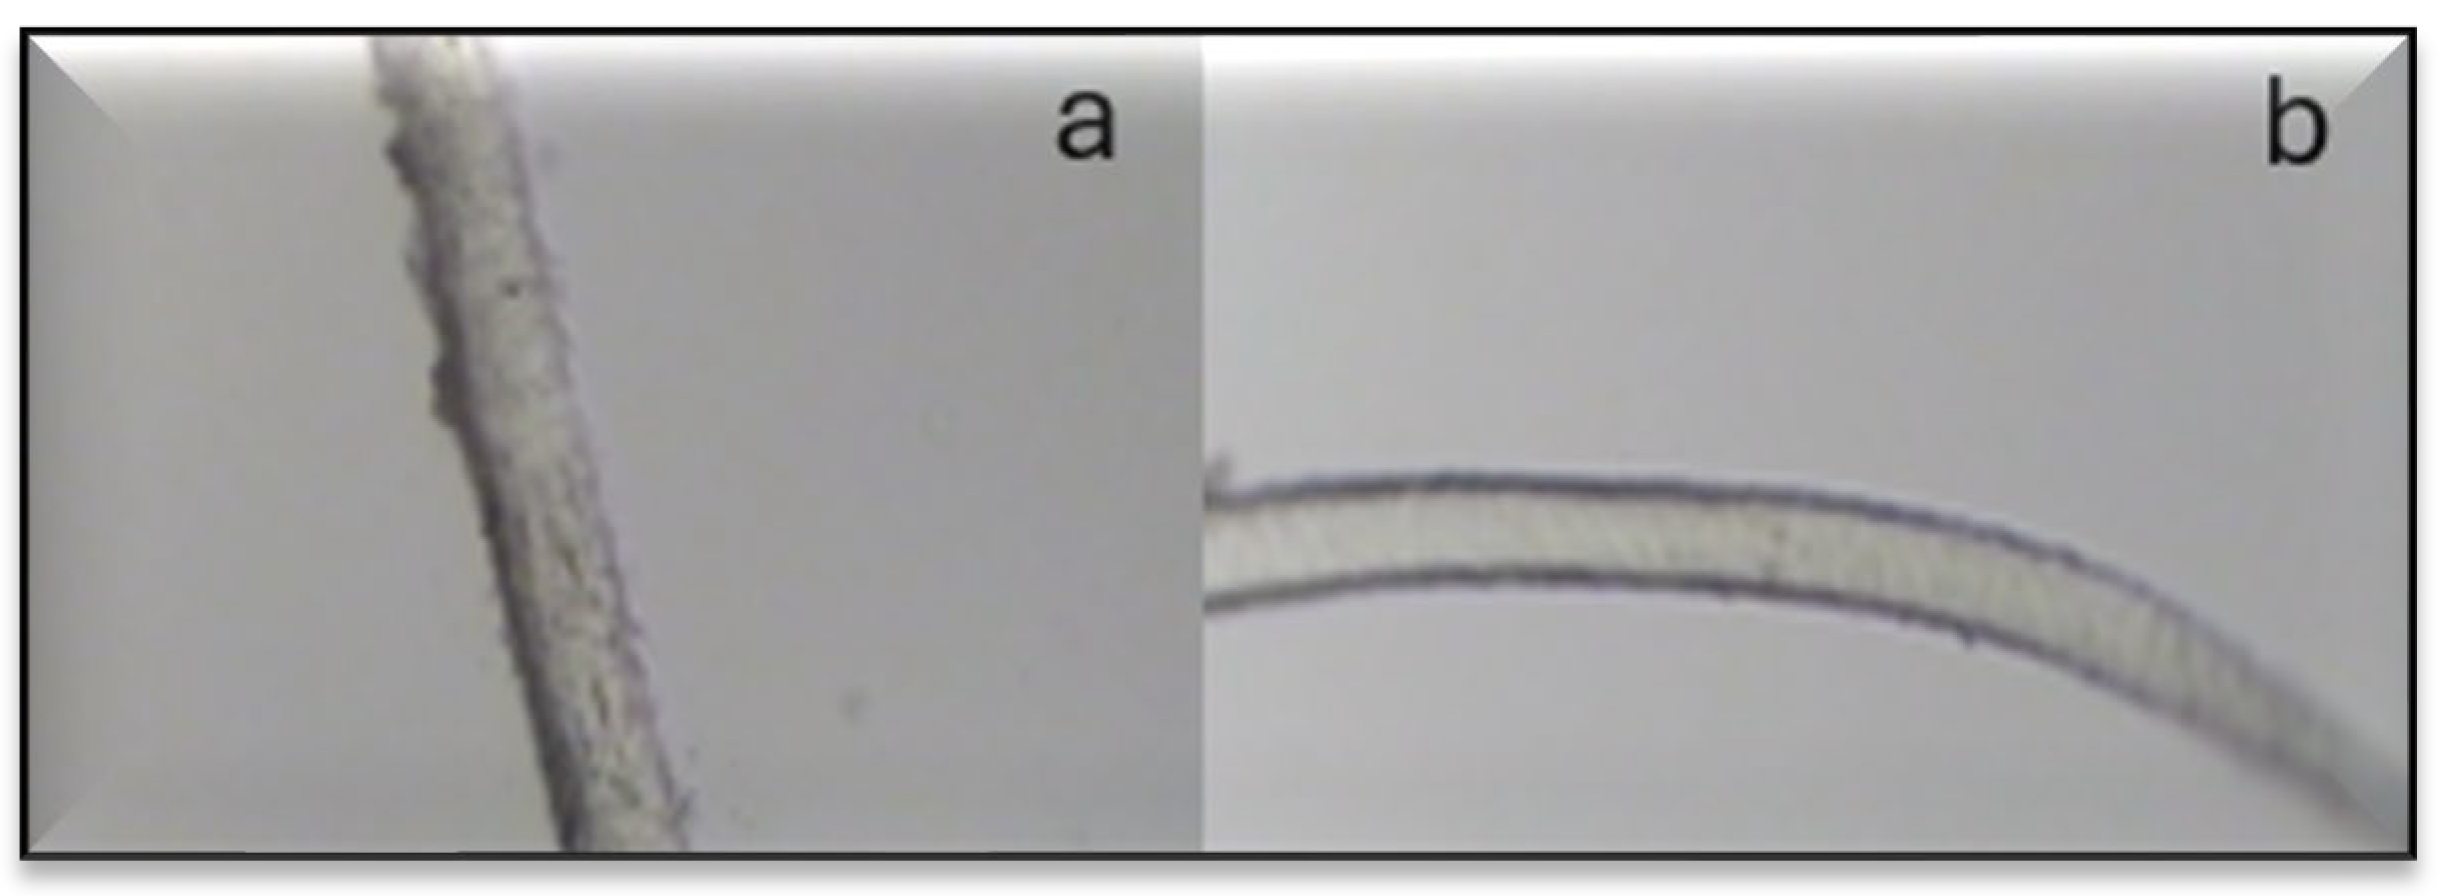
3.1.9. SEM
The analysis through (SEM) reveals a scaly architecture of the wool fiber. These scales show moderate length and a nearly convex shape, particularly notable in Timahdite fibers (
Figure 13—b). Conversely, the scales of the Sardi breed fibers were not distinctly visible, likely due to the presence of a fatty layer coating the scales (
Figure 13—a).
Moreover, these images confirm that the fiber diameter of Timahdite is less than that of Sardi.
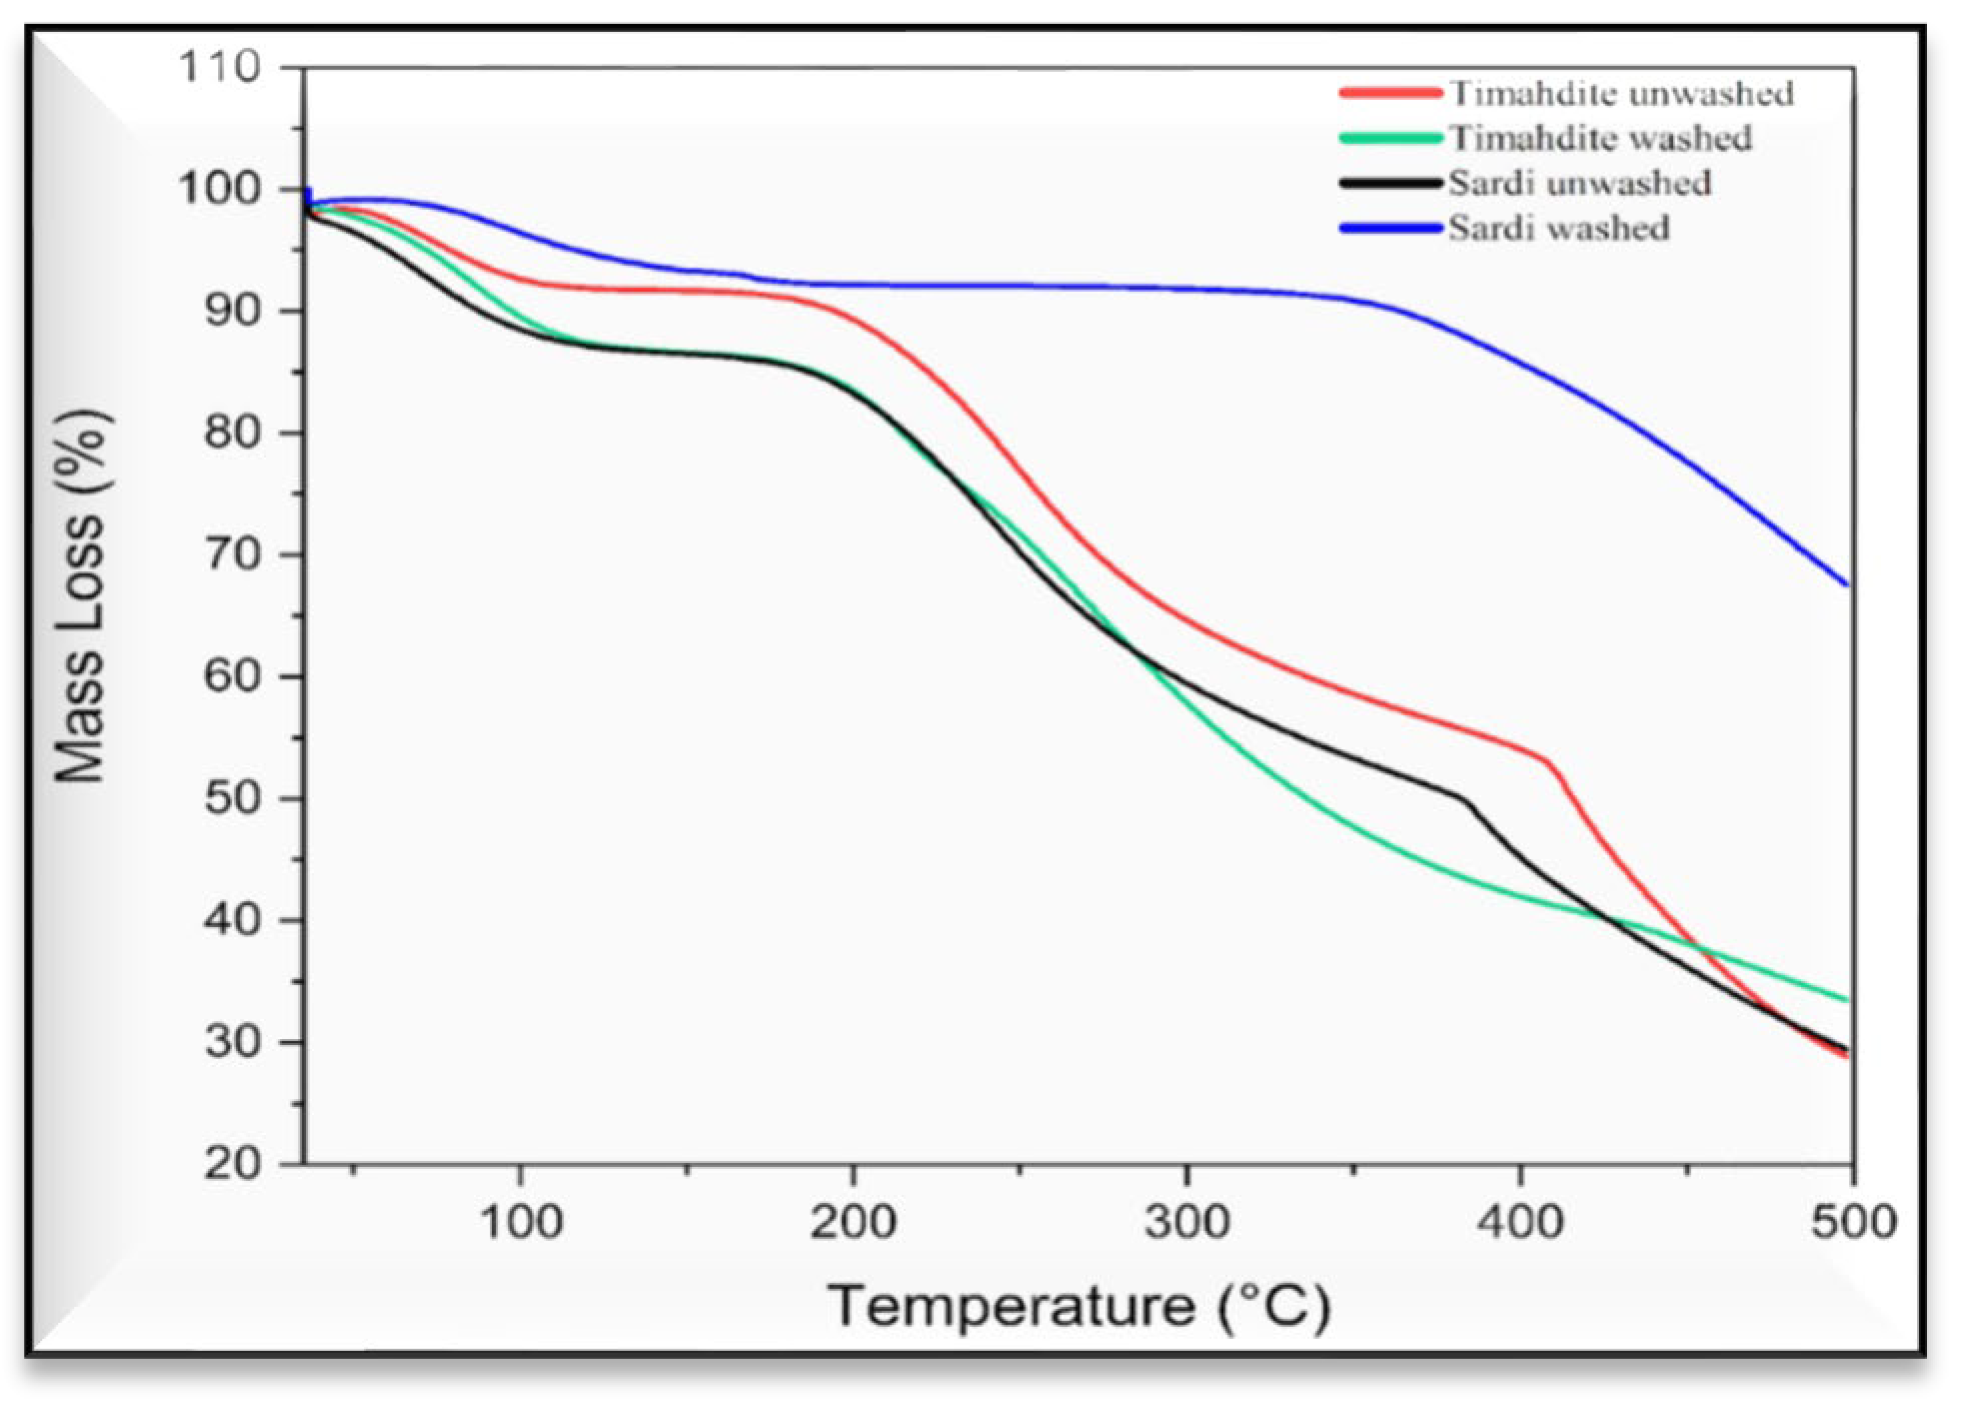
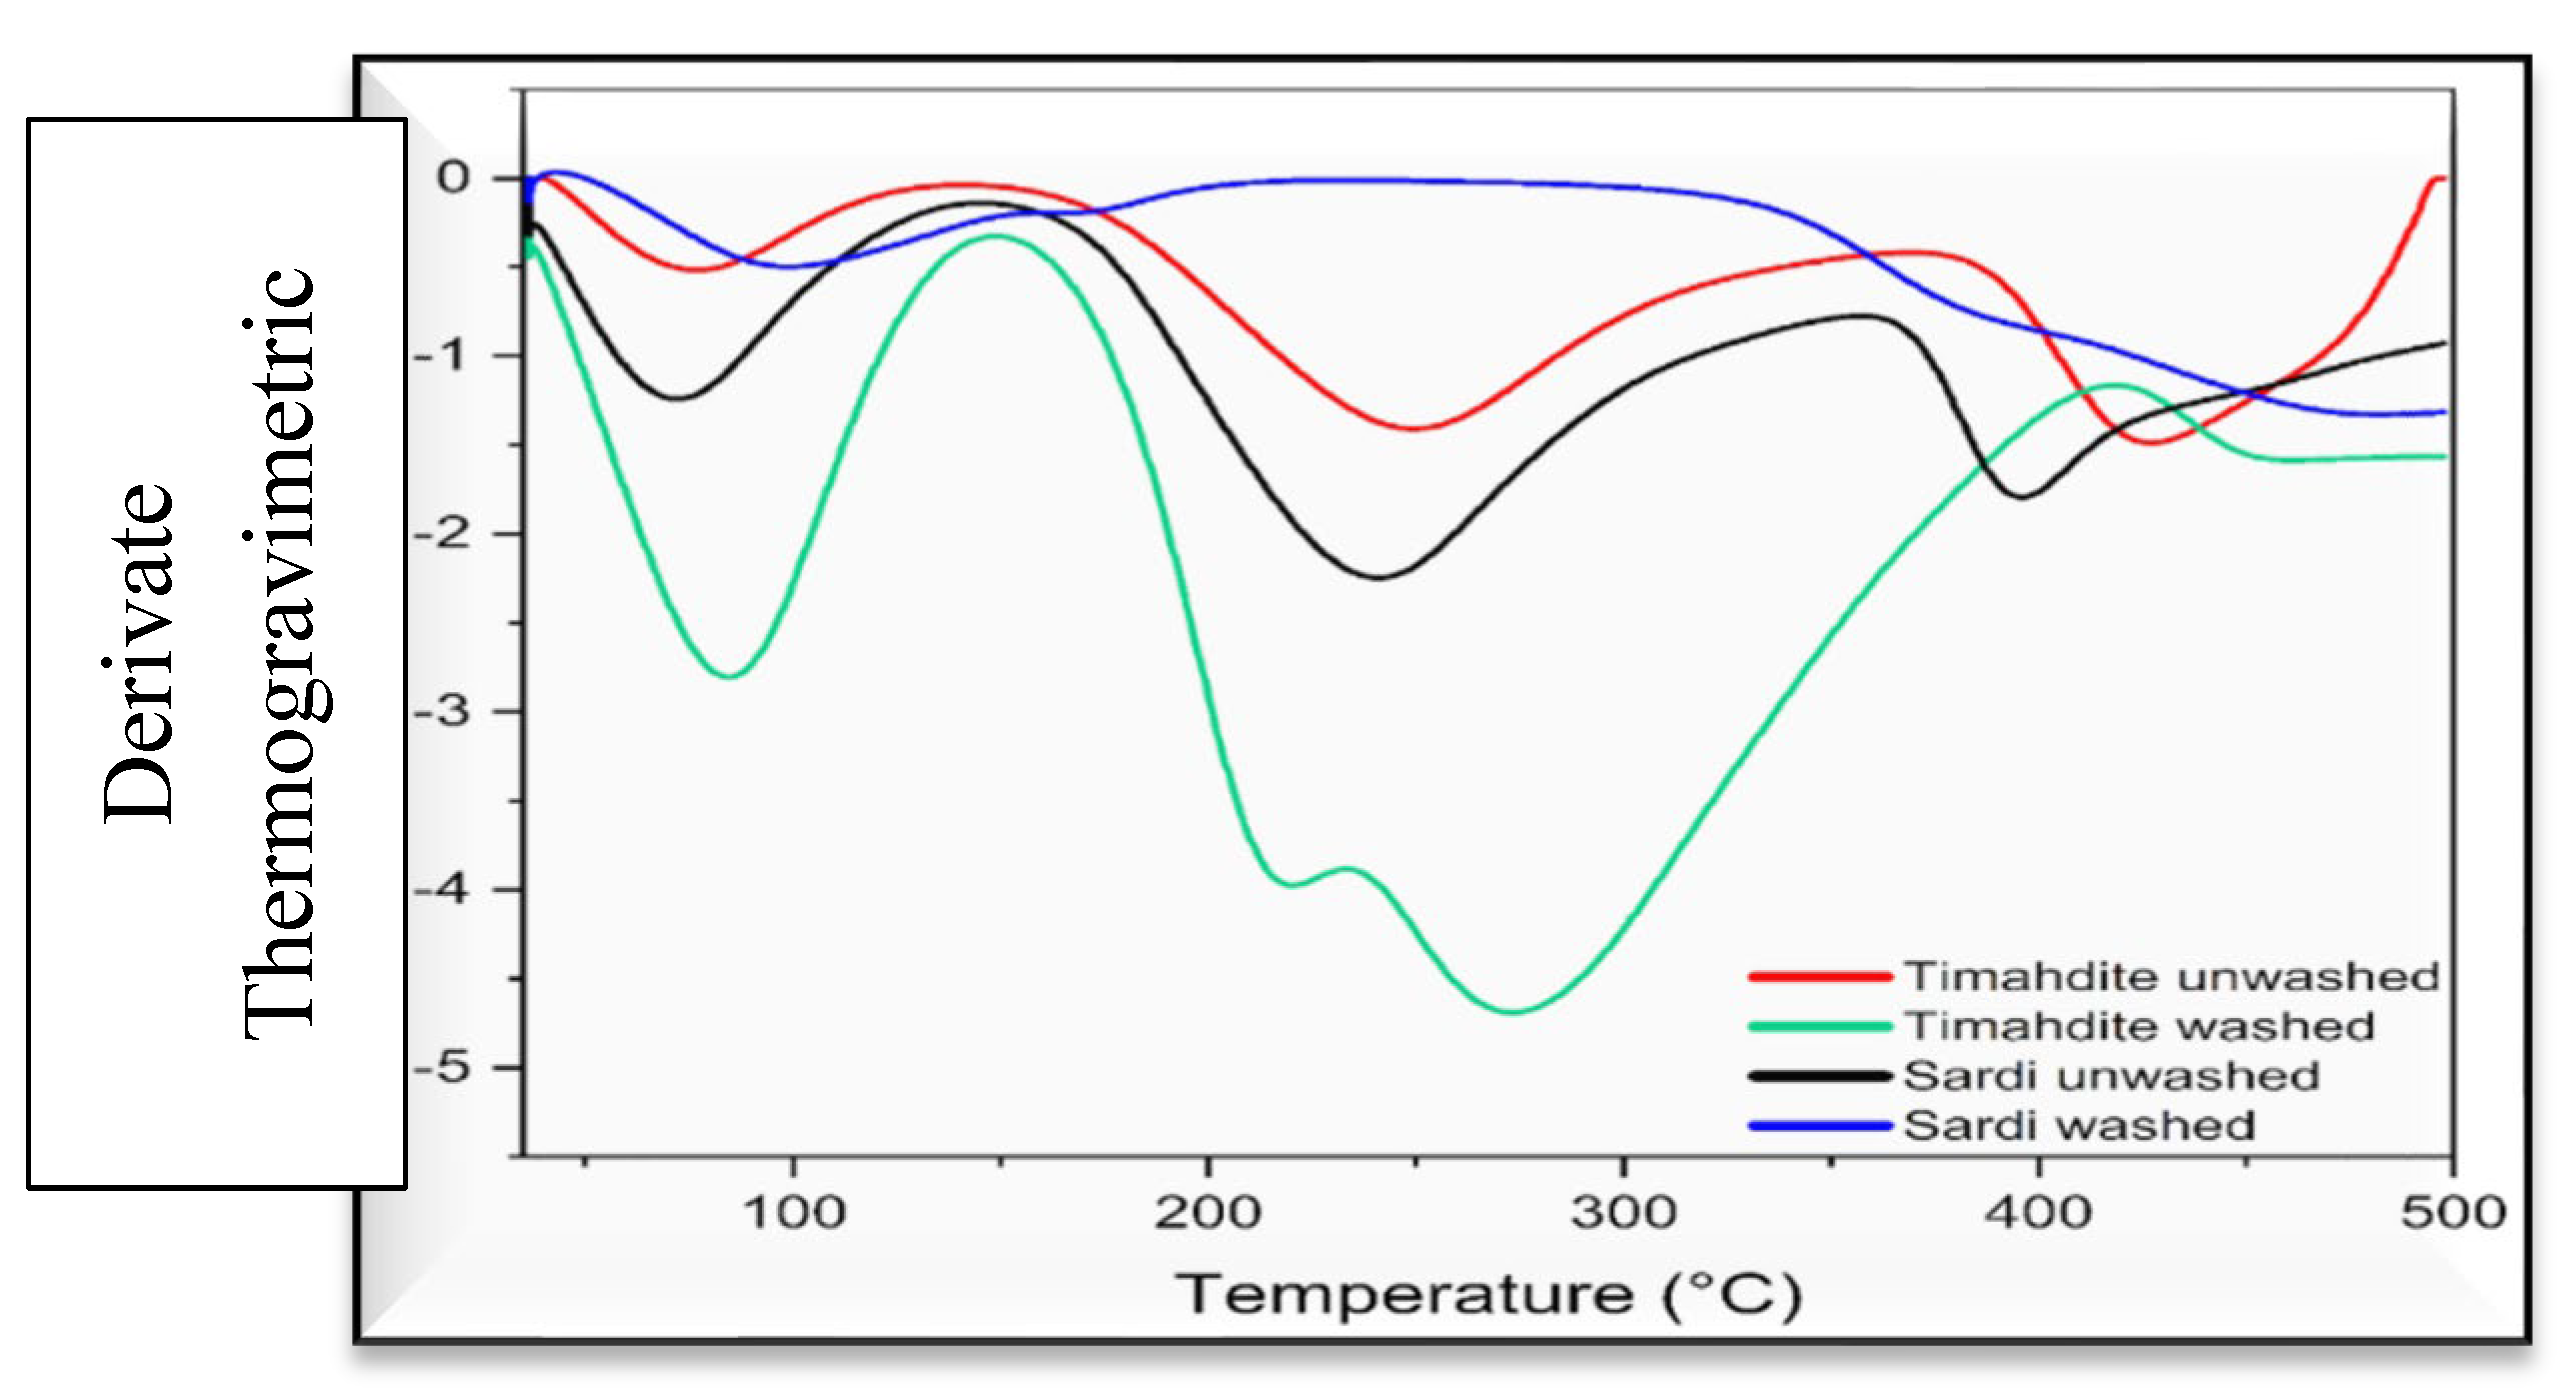
3.1.10. TGA
To look at the thermal stability of wool fibers and account for time constraints, TGA and DTG analyses were performed on 4 samples. These protected 4 samples from Timahdite and Sardi fibers, washed and two unwashed, with the goal of comparing the thermal stability between the unwashed samples and analyzing the impact of washing on their balance.
The thermal behavior of raw and degreased wool samples was analyzed utilizing TGA and DTG methodologies or Differential Thermogravimetry, is a thermal analysis technique closely related to Thermogravimetric Analysis (TGA). It provides information about changes in a material’s mass as it is subjected to controlled temperature changes over time, but with a focus on the rate of mass change. DTG measures the differential weight loss of a sample relative to a reference material, offering insights into the thermal stability, composition, and decomposition behavior of materials.
The resultant curves are illustrated in
Figure 14 and
Figure 15. The four samples demonstrated two principal thermal transitions. The initial endothermic peak observed at approximately 75 ± 5 °C is attributed to the removal of moisture and volatile substances, which constitute about 6.5-13% of the samples’ total weight.
The second endothermic event, occurring between 200 °C and 400 °C, primarily signifies the degradation of protein side chains. In this temperature range, the associated weight losses were approximately 45 ± 4% for unwashed wool and 39% for washed wool. Notably, for Timahdite wool, a shoulder appeared around 225 °C within this second endotherm, likely due to the cooperative elimination of sulfur-containing gases or other small molecules. Pakkaner et al. [20] reported similar TGA curve results for various wool samples.
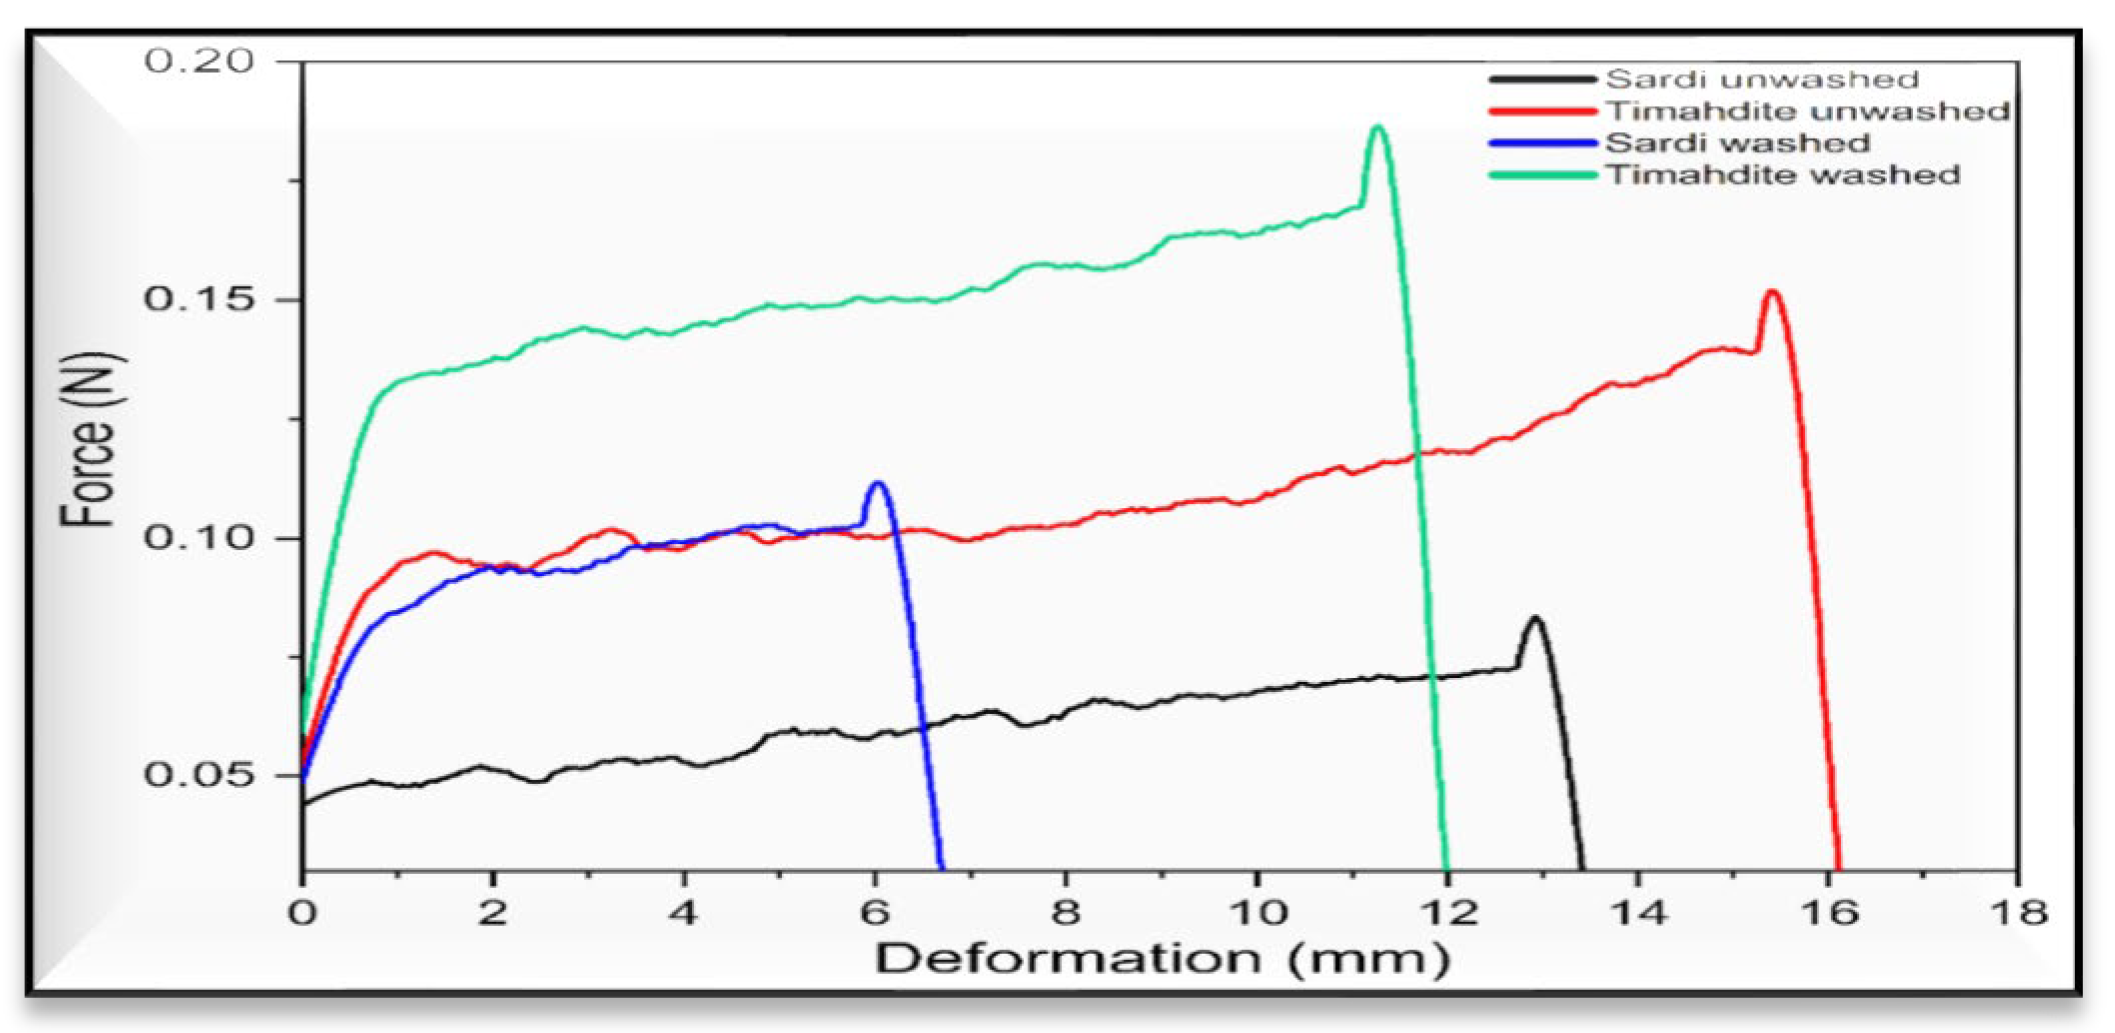
3.1.11. Tensile Strength
Table 6. presents the mechanical Tensile strength characteristics of the two breeds of wool.
Table 6.
Results of mechanical characteristics in Tensile strength.
Table 6.
Results of mechanical characteristics in Tensile strength.
| Breeds |
Elongation (%) |
Stress (MPa) |
Force (N) : |
| Timahdite Unwashed |
34.24 |
218.833 |
0.152 |
| Sardi Unwashed |
28.71 |
65.713 |
0.084 |
| Timahdite washed |
30.19 |
139.85 |
0.185 |
| Sardi washed |
29.45 |
60.36 |
0.11 |
From
Figure 16 and
Table 6, The mechanical properties of wool fibers from the Timahdite and Sardi breeds, before and after washing, show significant variations. For the Timahdite breed, unwashed fibers show an elongation of 34.24%, a stress of 218.833 MPa, and a force of 0.152 N. While after washing, elongation decreases to 30.19%, stress to 139.85 MPa, but the force increases to 0.185 N. For the Sardi breed, unwashed fibers have an elongation of 28.Seventy one%, a stress of sixty five.713 MPa, and a pressure of 0.084 N, and after washing, elongation slightly will increase to 29.Forty five%, stress to 60.36 MPa, and pressure will increase to 0.11 N. To study the thermal balance of wool fibers and account for time constraints, TGA and DTG analyses have been done on four samples. These included 4 samples from Timahdite and Sardi fibers, washed and unwashed, with the aim of evaluating the thermal balance among the unwashed samples and studying the impact of washing on their balance.
3.2. The Impact of Washing on the Samples
This section examines the impact of washing on wool fibers, that specialize in their chemical, morphological, and mechanical characteristics. For this analysis, we selected breeds: Timahdite and Sardi.
3.2.1. Comparison of Chemical Properties
From
Figure 16, it turns clean that washing the samples reduces the depth of the practical organizations. This effect is in all likelihood attributed to the elimination of fatty acids, which commonly adhere to the general formulation CH3-(CH2)n-COOH, accordingly corroborating this phenomenon.
3.2.2. Comparative Analysis of Morphological Properties
The impact of washing on the morphological characteristics of wool fibers was analyzed using SEM. The images acquired (
Figure 17) indicate that post-washing, the scales exhibit signs of damage. Nevertheless, there is a noticeable absence of impurities on the surface of the fiber that remains unwashed.
3.2.3. Comparison of Mechanical and physical Properties: Fiber Diameter (PORTAR)
Has proven in
Table 7, the fiber diameter measurements of the Timahdite breed post-washing suggests a wonderful similarity to those received thru the OFDA approach. Conversely, the diameter measurements for the Sardi breed post-washing are inconsistent, probably because of the heterogeneous nature of the fibers inside the same breed.
4. Conclusion
In summary, the Sardi and Timahdite breeds display vital differences of their wool characteristics. The Sardi breed is characterized by a higher fatty acid content, elevated resistance, and more advantageous solubility after washing. On the opposite hand, the Timahdite breed present a good water absorption ability, fiber length, fineness, and elongation, at the side of the very best base content and humidity ranges after washing. The sizeable versions in fiber diameter submit-washing for the Sardi breed advise an extra heterogeneous fiber shape as compared to the Timahdite breed, which continues consistent measurements.
The development of wool processing techniques, particularly adapted to the characteristics of each breed, can help to improve the quality and efficiency of nonwoven manufacturing.
A study of the differences observed in wool properties between Sardi and Timahdite breeds shows that Sardi wool may be preferred for products requiring chemical resistance, while Timahdite wool is preferred for textiles requiring excessive fineness and absorbency for nonwovens.
This may result in selection applications aimed toward improving certain perfect characteristics.
The main perspective of our study is the mixture of wool from Moroccan breeds and polyester, which will be the subject of my second article, with the aim of enhancing the value of Moroccan wool while meeting the wishes of modern Moroccan companies working in the bedding sector.
References
- Kadolph, S. J., & Langford, A. L. (2001). Textiles. Prentice Hall.
- Barber, E. J. W. (1991). Prehistoric Textiles: The Development of Cloth in the Neolithic and Bronze Ages with Special Reference to the Aegean. Princeton University Press. [CrossRef]
- Schürmann, U. (1978). The Pazyryk: A Rug of the Iron Age. Graz: Akademische Druck-u. Verlagsanstalt.
- Jenkins, D. T. (2003). The Cambridge History of Western Textiles. Cambridge University Press.
- Hermitage Museum. (n.d.). The Pazyryk Rug. [Museum Catalog Entry]. Hunter, L. (2001). Wool fiber properties: Quality implications. Textile Progress, 31(1), 1–36.
- W. Fung, (2000) in Handbook of Technical Textiles, 490.
- J. Yao, Y. Liu, S. Yang, J. Liu, J. Eng. (2008). Fibers Fabr. 3, 1558. [CrossRef]
- Kestur Gundappa Satyanarayanaa, Thais Flores-Sahagunb, Gregorio G Carbajal Arizagac, Talita Szlapak Francob and Valcineide de Andrade TanobeWool Fiber Reinforced Polymer Composites. Copyright c 2022 Elsevier Ltd. [CrossRef]
- R. Lopez, M. Pascual, D. García-Sanoguera, L. Sánchez-Nacher, R. Balart, (2012). Fibers Polym. 13, 1139. [CrossRef]
- W. Simpson, G. Crawshaw, (2002). Wool: Science and Technology, Elsevier.
- ISO 9073-15 : 2007, (2007). https://www.iso.org/standard/42093.html.
- Y. Gallery, (2020).https://www.yassinigallery.com/fr/blogs/infos/types-of-wool-and-its-treatments.
- K. Sinnppoo, L. Arnold, R. Padhye, (2010).Text. Res. J. 80, 1083.
- J. Tabor, T. Ghosh, (2019).in High Performance Technical Textiles.
- S. Tridico, (2009). in Identification of Textile Fibers, Elsevier, 27.
- J.I. Goldstein, D.E. Newbury, D.C. Joy, C.E. Lyman, P. Echlin, E. Lifshin, L. Sawyer, J.R. Michael, (2017) Scanning Electron Microscopy and X-ray Microanalysis, 4th edn., (Springer,).
- P. Gabbott,(2007) in Principles and Applications of Thermal Analysis, (Blackwell Pub., ). [CrossRef]
- ASTM International (2014), ASTM D3822/D3822M-14.
- https://www.iso.org/fr/standard/61784.html.
Figure 1.
Wool washing protocol flowchart.
Figure 1.
Wool washing protocol flowchart.
Figure 2.
Infrared spectrum of raw samples.
Figure 2.
Infrared spectrum of raw samples.
Figure 3.
Histogram of the results of fat content of unwashed Timahdite and Sardi fibers.
Figure 3.
Histogram of the results of fat content of unwashed Timahdite and Sardi fibers.
Figure 4.
Histogram of acid percentage results of Unwashed and Washed fibers.
Figure 4.
Histogram of acid percentage results of Unwashed and Washed fibers.
Figure 5.
Histogram of Unwashed and Washed Fiber Base Percentage Results.
Figure 5.
Histogram of Unwashed and Washed Fiber Base Percentage Results.
Figure 6.
Histogram of Solubility in Base results for unwashed and washed fibers.
Figure 6.
Histogram of Solubility in Base results for unwashed and washed fibers.
Figure 7.
Curve of water absorption power results of washed and unwashed fibers.
Figure 7.
Curve of water absorption power results of washed and unwashed fibers.
Figure 8.
Histogram of humidity results for unwashed and washed fibers.
Figure 8.
Histogram of humidity results for unwashed and washed fibers.
Figure 9.
Comparison of Fiber Length and Coefficient of Variation (CV) between Sardi and Timahdite Wools.
Figure 9.
Comparison of Fiber Length and Coefficient of Variation (CV) between Sardi and Timahdite Wools.
Figure 10.
Optical microscope images of unwashed raw wool fibers (a) Sardi, (b) Timahdite.
Figure 10.
Optical microscope images of unwashed raw wool fibers (a) Sardi, (b) Timahdite.
Figure 11.
Histograms of diameter distribution for unwashed raw samples.
Figure 11.
Histograms of diameter distribution for unwashed raw samples.
Figure 13.
SEM imaging of wool fibers: a) Sardi; b) Timahdite.
Figure 13.
SEM imaging of wool fibers: a) Sardi; b) Timahdite.
Figure 14.
Mass Loss as a Function of Temperature for Washed and Unwashed Timahdite and Sardi Wool.
Figure 14.
Mass Loss as a Function of Temperature for Washed and Unwashed Timahdite and Sardi Wool.
Figure 15.
Derivative Thermogravimetric Analysis (DTG) of Washed and Unwashed Timahdite and Sardi Wool as a Function of Temperature.
Figure 15.
Derivative Thermogravimetric Analysis (DTG) of Washed and Unwashed Timahdite and Sardi Wool as a Function of Temperature.
Figure 16.
Tensile strength graph of raw samples.
Figure 16.
Tensile strength graph of raw samples.
Figure 17.
SEM imaging of Sardi fibers: a) Unwashed Sardi; b) Sardi washed.
Figure 17.
SEM imaging of Sardi fibers: a) Unwashed Sardi; b) Sardi washed.
Table 3.
Results of the diameters of the different breeds and their average diameter and CV of unwashed fibers.
Table 3.
Results of the diameters of the different breeds and their average diameter and CV of unwashed fibers.
| Races |
Timahdite |
Sardi |
| Average Diameter (µm) |
29,74 |
40,23 |
| CV% |
5,17 |
2,51 |
| Standard deviation |
1,54 |
1,01 |
Table 7.
Diameter results for washed and unwashed Sardi and Timahdite by PORTAR and OFDA.
Table 7.
Diameter results for washed and unwashed Sardi and Timahdite by PORTAR and OFDA.
| Type of wool |
PORTAR |
OFDA |
| Washed Sardi (µm) |
29.08 |
39.66 |
| Washed Timahdite (µm) |
27.80 |
29.08 |
| Unwashed Sardi (µm) |
38.43 |
40.23 |
| Unwashed Timahdite(µm) |
28.72 |
29.94 |
|
Disclaimer/Publisher’s Note: The statements, opinions and data contained in all publications are solely those of the individual author(s) and contributor(s) and not of MDPI and/or the editor(s). MDPI and/or the editor(s) disclaim responsibility for any injury to people or property resulting from any ideas, methods, instructions or products referred to in the content. |
© 2025 by the authors. Licensee MDPI, Basel, Switzerland. This article is an open access article distributed under the terms and conditions of the Creative Commons Attribution (CC BY) license (http://creativecommons.org/licenses/by/4.0/).