
Submitted:
05 February 2026
Posted:
06 February 2026
You are already at the latest version
Abstract
The fading affect bias (FAB) is the faster fading of unpleasant than pleasant affect, and this effect is positively and negatively related to healthy/adaptive and unhealthy/non-adaptive outcomes, respectively. These findings suggest that the FAB is a form of emotion regulation and general healthy coping. Although Pillersdorf and Scorboria (2019) found a negative relation between the FAB and marijuana consumption, they only examined non-marijuana events, which limited the investigation. The current study examined the relation of the FAB to marijuana consumption measures as well as additional healthy and unhealthy outcome measures across marijuana and non-marijuana events in person (Experiment 1) and online (Experiment 2). Both experiments showed a robust FAB that was positively predicted by healthy variables and negatively predicted by unhealthy variables, and marijuana consumption/effects positively predicted the FAB for marijuana events. In Experiment 2, several healthy and unhealthy variables predicted the FAB more strongly for marijuana events than non-marijuana events, which demonstrated specific healthy coping, and rehearsals partially mediated these complex effects. Implications are discussed.
Keywords:
fading affect bias
; marijuana consumption
; marijuana events
; healthy coping
1. Introduction
“Smoke em if you got em” was a galvanizing call to nicotine-laden gaseous arms in World War II (Bius, 2019), whereas the battle cry in modern parlance notifies willing party goers to spark their blunts in a joint effort to embrace a hallucinogenic haze. Whereas cigarette smoking has received bad press from the medical profession for its cancer-causing effects (Inoue-Choi et al., 2018), the emotional costs of marijuana consumption have been presented in the psychological literature. For example, Degnhardt et al. (2003) found that heavy marijuana users reported more severe levels of depression compared to less frequent users, and Dorard et al. (2008) showed that cannabis abusers reported higher levels of trait anxiety than non-users. More recently, Pillersdorf and Scorboria (2019) found that marijuana consumption was negatively related to emotional regulation in the form of the fading affect bias (FAB), which is the faster fading of unpleasant than pleasant affect related to events in autobiographical memory (Walker et al., 1997). One reason that marijuana consumption may have resulted in low FAB in the Pillesdorf and Scorboria study is that participants were only asked to remember and rate non-marijuana events, especially considering evidence that marijuana consumption positively predicts healthy outcome measures (Castle et al., 2025; Sznitman et al., 2022). To correct this oversight, the goal of the current study was to examine the relation of the FAB to marijuana consumption/effects and other healthy/unhealthy variables across marijuana and non-marijuana events, along with the ability of rehearsals to mediate these effects.
1.1. The Fading Affect Bias
For nearly a century, researchers have known that people record and recall more pleasant than unpleasant events (Jersild, 1931; Meltzer, 1930; 1931; Watters & Leeper, 1936) and that unpleasant affect fades faster than pleasant affect (Cason, 1932). Roughly 40 years later, Holmes (1970) replicated both these findings. Near the turn of the century, Walker et al. (1997) again demonstrated that the emotions tied to unpleasant events faded faster than the emotions connected to pleasant events, and Walker and his colleagues referred to this phenomenon as the fading affect bias (FAB; Walker et al., 2003a). The FAB begins within 12 hours of events, remains constant for 3 months (Gibbons et al., 2011), increases from that point (Walker et al., 1997), and is reliable across events (e.g., Gibbons et al., 2013; Gibbons et al., 2015). The FAB is also robust across various cultures (Ritchie et al., 2014), makes people feel good, and helps them seek new experiences (Ritchie et al., 2014a; Walker et al., 2003; Walker & Skowronski, 2009).
Theories relevant for the FAB suggest that biological, cognitive, and emotional resources reduce the harmful effects of unpleasant events (Taylor, 1991) by putting them in perspective, which minimizes their impact (Ritchie et al., 2014a). Conversely, these bio-social-psychological resources seem to enhance positive self-perceptions with a focus on the importance of pleasant events (Ritchie et al., 2014; Sedikides & Alicke, 2018). The FAB helps people feel good about themselves (e.g., Gibbons et al., 2015; Ritchie et al., 2014a), which is congruent with self-enhancement theories (Ritchie et al., 2006; Sedikides & Alicke, 2018). Together, these assertions suggest that the FAB is a general healthy coping mechanism. These conclusions are supported by research showing that the FAB was large for adaptive events, such as religious and spiritual events (Gibbons et al., 2015) and problem-solving events (Gibbons et al., 2024), and small for non-adaptive events, such as death events (Gibbons et al., 2016), social media events (Gibbons et al., 2017), and videogame events (Gibbons & Bouldin, 2019).
In other research indicating healthy coping, the FAB was positively related to healthy outcomes, such as positive religious coping and spirituality (Gibbons et al., 2015), mature death attitudes (Gibbons et al., 2016), and self-esteem (Gibbons et al., 2017). Similar research demonstrated that event rehearsal ratings positively predicted the FAB (e.g., Gibbons & Lee, 2019; Skowronski et al., 2004), and they mediated complex FAB effects (e.g., Gibbons et al., 2017). In contrast to the smaller body of research demonstrating positive relations between the FAB and healthy outcomes, a larger body of research shows negative relations between the FAB and unhealthy outcomes. Specifically, the FAB is negatively related to dispositional mood (Ritchie et al., 2009), dysphoria (Gibbons & Lee, 2019; Walker et al., 2003), trait anxiety (Walker et al., 2014), state anxiety (Gibbons et al., 2017; Gibbons & Lee, 2019), stress (Gibbons et al., 2017; Gibbons & Lee, 2019S), eating disorder symptoms (Ritchie et al., 2019), parental abuse (Skowronski et al., 2016; Skowronski et al., 2023), social media use (Gibbons et al., 2017), and false memories (Gibbons et al., 2022). Importantly, the FAB was smaller for marijuana consumers than marijuana non-users (Pillersdorf & Scoboria, 2019), which suggested that marijuana consumption is unhealthy.
1.2. Marijuana Consumption and Unhealthy/Non-Adaptive Outcomes
Marijuana consumers, commonly referred to as “stoners” gained the popular nickname amidst the rise of hippie culture during the 1960s and 1970s. According to Etymonline (2025), the term referred to users who were described as “stuporous”— lazy individuals who often slept too much, and experienced cognitive deficits and emotional problems (Stoner Mg, 2019). This stereotype was further reinforced by popular, comedic, stoner characters, such as Cheech and Chong in the 1970s. Petrucci (2020) tested the assumption that marijuana users are lazy or unmotivated in a sample of 1,168 men and women and found that cannabis use was positively related to apathy. Similarly, Looby and Earleywine (2007) found that dependent cannabis users, determined by the DSM-IV-TR in a large sample (N = 2500), reported low motivation. Lac and Luk (2017) reported similar results in a longitudinal study of 505 college students; marijuana consumption produced low initiative and persistence that worsened over time.
When testing the assumption that marijuana users experience sleep problems in 354 participants who all reported using marijuana in the previous year, Drazdowski et al. (2019) found that marijuana consumption was negatively related to sleep efficiency. Similarly, Bolla et al. (2008) found that, compared to a control group, a sample of 17 heavy marijuana users, who discontinued use for the study, experienced differences in Standard Polysomnography measures, such as lower total sleep times, worse sleep efficiency, and less slow-wave sleep. The research also showed worse sleep efficiency, longer sleep onset, and shorter REM latency for the heavy marijuana consumers than the control group. Ogeil. et al (2015) found similar results in a sample of 248 participants. Specifically, risky marijuana use, which was assessed using the MSI-X (Alexander, 2003), was associated with high scores on the PSQI subscales for daytime dysfunction, as well as use of sleep medication.
In addition to motivation and sleep, researchers have tested whether marijuana consumption is connected to cognitive deficits. Schuster et al. (2019) tested 76 young adults aged 18 to 25 years who all self-reported being frequent cannabis users, which was defined as using cannabis at least once per week. The researchers discovered that participants who frequently used cannabis demonstrated slow reaction times on a test of sustained attention and reported experiencing meta-cognitive deficits. Specifically, participants reported problems with task initiation and planning involved in everyday cognitive tasks, as determined by the Behavior Rating Inventory of Executive Function-Self Report Version (Guy et al., 2004). Meier et al. (2022) found similar results in a longitudinal study, using a sample of 1037 participants from New Zealand; long-term cannabis users showed declines in intelligence from childhood to midlife and poorer learning and processing speed relative to their childhood intelligence. Informants familiar with the participants reported memory and attention problems. These declines and deficits may have been due to the reduced hippocampal volume that occurred across time. Similarly, Hanson et al. (2010) found that a sample of 19 marijuana consumers, aged 15 to 19 years old, exhibited poorer verbal learning, verbal working memory, and attention accuracy compared to controls. Improvements, however, were observed in both word-list learning and verbal working memory after 2 to 3 weeks of abstinence.
In addition to motivation, sleep, and cognition, marijuana consumption has been negatively related to healthy/adaptive mood measures and other adaptive subjective assessments (i.e., life satisfaction and self-efficacy). For example, Gruber et al. (2012) found that marijuana use lowered mood across time in a 4-week diary study in which bipolar participants described their mood daily. Similarly, Lex et al. (1989) asked a sample of 30 participants to complete daily diary questionnaires that monitored their use of marijuana and other drugs and found that heavy marijuana users reported higher negative moods (e.g., confusion, fatigue, and anger) and lower positive moods (e.g., friendliness, elation, and vigor) than light marijuana users. In a cross-sectional study, Hines et al. (2020) examined the association of high-potency cannabis and general mental health outcomes in 1087 participants from the UK with a mean age of 24 years who all self-reported their past-year cannabis use. The researchers found that depression, generalized anxiety disorder, and psychotic experiences were positively related to high-potency marijuana consumption.
1.3. Marijuana Consumption and Healthy/Adaptive Outcomes
In contrast to the negative assumptions about and reports on marijuana consumption, other research has shed some light on the positive effects of cannabis use. For example, Castle et al. (2025) recently conducted a meta-analysis of 10,000 peer-reviewed research articles and found that medical marijuana consumption helped reduce inflammation and other cancer-related symptoms, such as pain, nausea, and appetite loss. Safakish et al. (2020) found similar pain reduction for marijuana consumption in a longitudinal study of 751 chronic pain patients. Specifically, marijuana consumers reported significant reductions in pain severity and improvements in pain interference, as well as decreased reports of headaches, fatigue, and anxiety. Notably, marijuana-consuming participants using opioids at baseline showed significant reductions in their oral morphine equivalent doses. Similarly, Poli et al. (2018) tested a sample of 338 marijuana-consuming participants with different chronic pain conditions, and they found that pain intensity significantly decreased from baseline to 12 months.
In addition to pain reduction, marijuana consumption produces other adaptive psychological effects. For example, Roitman et al. (2014) found that the main psychoactive element in marijuana, THC, may be effective in reducing nightmares and improving sleep quality in patients with PTSD. Similarly, Kuhathasan (2022) found that cannabis consumers, who were anxious or both depressed and below 45 years old, reported reduced symptoms of insomnia. In contrast, the anti-insomnia effects of marijuana consumption were strongest in anxious individuals between 35 and 44 years old and weakest in anxious individuals 25 to 34 years old.
Past research has also found that marijuana consumption is positively related to mood. For example, Sznitman et al. (2022) conducted a 14-day diary study and found that intended cannabis use and recent cannabis use were related to enhanced positive affect and decreased negative affect. In addition, participants with bipolar disorder, PTSD, and depression who consumed cannabis reported improved moods. In a 4-week diary study with mood measures reported 3 times per day, Gruber et al. (2012) found that mood symptoms improved for bipolar participants who consumed marijuana more than bipolar participants who did not consume marijuana. Lake et al. (2019) uncovered similar effects in the context of PTSD, using the 2012 Canadian Community Health Survey - Mental Health, with a total sample of 225,113 participants. Specifically, the researchers discovered that PTSD was associated with the likelihood of experiencing a major depressive episode and suicidal ideation in non-cannabis users, but the relation was not found in cannabis users. Similarly, Li et al. (2020) examined the effectiveness of dried cannabis flower to immediately relieve symptoms of depression in a sample of 1,819 participants who self-administered cannabis 5,876 times using an app called Releaf from the years 2016 to 2019. The researchers found that cannabis consumption relieved depression in individuals reporting non-zero levels of depression, regardless of the marijuana strain consumed.
1.4. The Current Study
The FAB is faster fading of unpleasant than pleasant affect, which enhances the likelihood that individuals feel good, seek pleasant experiences, and avoid unpleasant situations. The FAB has been studied in many contexts, including marijuana, with Pillesdorf and Scoboria (2019) finding a larger FAB for non-marijuana consumers than for marijuana consumers for non-marijuana events. The current study was designed to correct the limitation in the Pillesdorf and Scoboria study by examining the FAB and its relations to adaptive and non-adaptive variables, including marijuana consumption, across marijuana and non-marijuana events. Although both experiments tested college-age students, Experiment 1 was conducted in person, whereas Experiment 2 was conducted online. We expected to find general healthy coping in the form of robust FAB that is positively related to healthy/adaptive variables and negatively related to unhealthy/non-adaptive variables. As the literature on marijuana was mixed, with some studies indicating that marijuana consumption and its reactive effects were unhealthy, and other studies showing that marijuana consumption/effects were healthy, we expected the FAB to be predicted by marijuana consumption. We also tested for specific healthy coping, which would be revealed if the relations of predictors and the FAB are significant for both events, with the relation being stronger for one event than the other event. We also examined whether rehearsal ratings would mediate complex FAB effects.
2. Experiment 1
Experiment 1 was conducted in a laboratory where we asked participants to remember two pleasant and two unpleasant marijuana and non-marijuana events. Participants provided their demographics, estimated their marijuana consumption, rated their traits and emotions, and remembered, described, and rated their events in an order that was balanced with a Latin square. The main dependent variable was fading affect for pleasant and unpleasant events. The predictor measures included marijuana consumption, neuroticism, positive and negative affect, depression, anxiety, stress, grit, and sleep disturbance. We expected robust FAB effects that were positively and negatively related to healthy and unhealthy variables, respectively, which would show general healthy coping. We also expected specific healthy coping, and we expected complex, three-way interactions to be mediated by rehearsal ratings.
2.1. Method
2.1.1. Participants
The initial study sample included 328 undergraduates who signed up using the SONA recruitment system from a small, public, liberal arts university in the southeastern United States. The participants ranged in age from 18 to 23 years old, with 1 participant being 41 years old (M = 19.52, SE = 0.037). Participants were primarily recruited from introductory psychology courses, and they earned course credit for their participation. The sample predominantly contained female (80.6% women), Caucasian (74.5%), Christian (74.6%), and heterosexual (87.8%) individuals. The current study was approved by the university's Institutional Review Board (IRB# 1349053-2), and participants were treated ethically according to American Psychological Association (APA) guidelines, which included briefing, informed consent, and debriefing (APA, 2017).
2.1.2. Materials and Measures
Materials for the current study included several questionnaires. Specifically, the demographic questionnaire asked participants to describe their gender, race, ethnicity, and religious affiliation. The next questionnaire asked participants about their general marijuana usage, including the hours they spent high, the degree of highness, the number of highness sessions, and the mental competency for each day of the week in a typical week. The questionnaires also included the Big Five Mini-Markers Scale, the Positive and Negative Affect Schedule (PANAS), the Depression, Anxiety, and Stress Survey (DASS), as well as the Grit scale, the Pittsburgh Sleep Quality Index (PSQI), and an event questionnaire. The event questionnaire asked participants to provide event descriptions and then the initial and final affect for each event, the frequency they thought or talked about the event, the cognitive competency for the event, as well as the hours high, the degree of highness, the hours cognitively competent, their highness cognitive competency, and their event cognitive competency for each marijuana event.
Daily marijuana involvement (consumption and its effects). Daily marijuana involvement included daily hours high, daily degree of highness, daily number of sessions, and overall cognitive competency. Participants provided the number of hours they spent consuming marijuana on a typical day each day in a typical week, and we calculated the average hours per day. Participants also provided their degree of highness on an average day each day in an average week on a scale ranging from 0 (completely sober) to 100 (completely stoned), and we calculated the average degree of highness each day. Participants provided their number of marijuana consumption sessions on a typical day each day in a typical week, and we calculated the average number of daily sessions. Participants provided their overall cognitive competency on the day of the experiment on a scale ranging from 0 (completely incompetent) to 100 (completely competent).
Neuroticism. The current study used the entire brief version of the Big Five, called Mini Markers (Saucier, 1994), but we only focused on the 8-item neuroticism scale. The scale asks participants to rate the extent to which they believe adjectives describe them (envious, fretful, jealous, moody, temperamental, touchy, relaxed, unenvious), on a 9-point scale, ranging from 1 (Extremely Inaccurate) to 9 (Extremely Accurate). The eight items from the neuroticism component of the scale were evaluated, reverse-scored when necessary (items 26 and 36), and used to calculate an average score in the current study, with high scores indicating high neuroticism. Cronbach’s alpha for the neuroticism scale was .728.
Positive and negative affect. The Positive and Negative Affect Schedule (PANAS) is a 20-item questionnaire that assesses the way participants feel at the time they complete the questionnaire (Watson et al., 1988). The PANAS is comprised of two mood scales that examine positive and negative affect by instructing participants to rate words, such as “interesting” and “irritable,” respectively, on a 5-point scale, ranging from 1 (slightly or not at all) to 5 (extremely). Average positive and negative affect scores were calculated, and the Cronbach’s alphas for the positive and negative scales were .872 and .834, respectively.
Depression, anxiety, and stress. The Depression, Anxiety, Stress Scale (DASS-21; Lovibond & Lovibond, 1995) is a 21-item scale assessing depression, anxiety, and stress. Each emotional construct is measured with 7 items. All items used 4-point response scales, ranging from 0 (did not apply to me at all) to 3 (applied to me very much or most of the time). An example of a depression item is “I found it difficult to work up the initiative to do things.” An average depression score was calculated, and high scores indicated high levels of depression. Anxiety items are scored the same way as depression scores, and an example of an anxiety item is “I felt I was close to panic.” An average anxiety score was calculated, with high scores indicating high levels of anxiety. Stress items are scored the same way as depression and anxiety, and an example of a stress item is “I found it hard to wind down.” An average stress score was calculated, and high scores indicated high levels of stress. Cronbach’s alphas for depression, anxiety, and stress were .894, .796, and .775, respectively.
Grit. The grit scale uses 12 items to assess passion, perseverance, and focus in relation to long-term goals (Duckworth et al., 2009). An example of a statement is “Setbacks don’t discourage me. I don’t give up easily.” Each item was rated on a 5-point response scale ranging from 1 (not like me at all) to 5 (very much like me). Items 1, 3, 5, 7, 9 were reverse scored and the average was calculated with high scores indicating high levels of grittiness. Cronbach’s alpha for average grit was .810.
Sleep. The Pittsburgh Sleep Quality Index (PSQI) is a questionnaire with open-ended questions and Likert-type statements used to measure sleep quality and sleep disturbances. The open-ended questions approached the sleep duration with four questions, such as “During the past month, what time have you usually gone to bed at night?” Additionally, the seven closed-ended questions asked for the frequency of sleep disturbances with statements, such as, “During the past month, how often have you had trouble sleeping because you cannot get to sleep within 30 min?” Answers were given on a 4-point Likert-type scale ranging from 1 (Not during the past month) to 4 (Three or more times a week). Furthermore, participants were given a space to name any disturbance not named by the questionnaire, with a scale providing the frequency the event described by the item was experienced. The scores from the items were averaged, and Cronbach’s alpha for the PSQI scale was .728.
Fading affect and rehearsal for events. After each event was briefly described in four lines or less, it was rated for initial and current affect with each one using a single-item scale ranging from -3 (very unpleasant) to +3 (very pleasant), including a score of 0 (neutral). For initially pleasant events, fading affect was calculated by subtracting the current affect from the original affect. For initially unpleasant events, fading affect was calculated by subtracting the original affect from the current affect. These calculations ensured that all measures indicating fading affect were positive across pleasant and unpleasant events, such that a large fading affect score indicated a large amount of fading, and a small fading affect score indicated little fading. Each event was also rated for the frequency it was thought or talked about with a single-item scale ranging from 0 (never/infrequently) to 6 (very frequently).
Marijuana involvement per marijuana event. Marijuana involvement per marijuana event included the number of hours consuming marijuana for that marijuana event and the degree of highness for that event. The degree of highness scale used a 1-item answer scale ranging from 0 (completely sober) to 100 (completely stoned).
2.1.3. Procedure
Participants signed up for the study through SONA, and they were provided a timeslot to complete the in-person study. Upon arrival, participants received a consent form. Participants were then informed that their consent was being sought for participation in the research study, their participation was completely voluntary, and they could stop participating at any time without any negative repercussions. Participants were also briefed on the fact that they would complete multiple questionnaires concerning general demographics, their marijuana consumption, personality, mood, psychological distress, sleep quality, and grit. Participants were informed that the study examined the emotions tied to pleasant and unpleasant event memories involving and not involving marijuana consumption (theirs or other individuals), along with rehearsal ratings for these events. Participants were told that they should only provide events that did not cause emotional pain, and, therefore, the experimental procedure should have provided no known risks to them.
Participants were informed that the experiment would demand up to 60 minutes of their time, and they would receive equitable and reasonable class credit for their participation. Participants were told that the information they provided was confidential and would only be examined by research assistants or the Principal Investigator of the study. Participants were also informed that their data would be encrypted and placed under lock and key. Participants were then given the contact information of the Principal Investigator and the Chair of the IRB. Participants were also given the contact information of the university counseling center to be used in the unlikely case that they experienced emotional discomfort. After receiving all the information in the briefing, participants signed the consent form before engaging in the procedure.
Following the briefing, participants completed a packet of questionnaires, which included general demographics, personality, mood, psychological distress, sleep quality, and grit. Then, participants recalled an event that occurred within the last 7 days and included pleasant and unpleasant marijuana and non-marijuana events. Participants were told that marijuana events involved the consumption of marijuana by them and/or someone with whom they were engaging. For each event, participants reported the date that the event occurred (as specifically as possible), and they wrote a brief, four-line event description disclosing as much information as they felt comfortable sharing. Participants then provided an initial/original emotion for the way they felt at the time of the event. Participants were told that unpleasant events should initially be rated using a negative number ranging from -3 (very unpleasant) to -1 (mildly unpleasant) and pleasant events should be initially rated using a positive number ranging from 1 (mildly pleasant) to 3 (very pleasant). Participants were asked to rate the way they currently (time of the experiment) felt about the event on a scale ranging from -3 (very unpleasant) to +3 (very pleasant).
Participants then provided the frequency they thought or talked about an event on a rating scale ranging from 0 (never/infrequently) to 6 (always/very frequently). For marijuana events, participants provided the number of hours they consumed marijuana for that event and their degree of highness for that event. Finally, participants were given a debriefing form, asked to read it in its entirety, and asked if they had any questions. Participants were given credit through SONA following their debriefing.
2.2. Analytic Strategy
Event, not participant, was the unit of analysis, and fading affect was the dependent variable. Although the 328 participants provided 2624 events, participants did not provide initial or final affect ratings for 614 of these events, and they did not provide the correct event for the requested label in terms of pleasantness or marijuana for another 199 events. A total of 1811 events remained for analysis. We first tested the FAB and whether it was moderated by event type using a 2 (Initial Event Affect) x 2 (Event Type) completely between-groups ANOVA with initial event affect (pleasant or unpleasant) and event type (Marijuana or Non-marijuana) as the independent variables, as done in previous research (e.g., Gibbons et al., 2024). The F-values, partial eta2 values, and p-values were reported for these analyses. In the event of a significant Initial Event Affect x Event Type interaction, t-values were planned to be used to understand it.
We then present results from clustered data, including a nominal-level variable to represent each participant and control for clustered data in each model. This data structure enabled us to test for systematic differences in fading affect among four types of events as they related to self-reported continuous measures. The continuous variables included positive and negative PANAS, depression, anxiety, stress, neuroticism (as part of the Mini Markers scale), Grit, and poor sleep quality (PSQI). Continuous variables also included average daily marijuana consumption in hours, average daily number of sessions, and average daily consumption hours. For marijuana events, continuous variables also included the number of hours consuming marijuana, the degree of highness, the hours of being cognitively competent, the highness cognitive competency, and the event cognitive competency. We tested the two-way interactions between initial event affect (pleasant vs. unpleasant) and individual difference variables in predicting fading affect, while controlling for relevant main effects, and participant. More importantly, we tested the three-way interaction between initial event affect (pleasant vs. unpleasant), event type (marijuana vs. non-marijuana), and continuous variables while controlling for all two-way interactions, relevant main effects, and participant.
To test our moderation hypotheses, we employed Model 1 of the Process macro via IBM SPSS (Hayes, 2022; Hayes, 2013) to examine fading affect, y, for pleasant and unpleasant events (initial event affect), x, across the continuum of self-reported, continuous individual difference variables, w, while controlling for the nominal-level variable, participant. If the FAB occurred, the Johnson-Neyman technique, which breaks down the interactive effect of initial event affect on fading affect (i.e., FAB) across 22 sections of the continuous predictor, m, indicated if the FAB was evident for individuals who reported low or high levels of an individual difference variable (Preacher et al., 2006). For any statistically significant interaction analyses produced by the Process macro, we reported the indirect effect, the corresponding standard error, t-value, p-value, 95% CI lower- and upper-estimates, as well as ΔR2 (effect size) at each level of the moderators.
We also tested the three-way interactions between initial event affect and two-variable combinations of individual difference variables, while controlling for all two-way interactions, relevant main effects, and the nominal-level variable, participant. Using Model 3 of the Process macro (Hayes, 2022; Hayes, 2013), we specified the control variable (participant), the main effects, the two-way interactions between initial event affect, x, event type, w, and a self-reported, continuous individual difference variable, m. We examined the interactive effect of initial event affect and event type across the self-reported, continuous individual difference variables using the Johnson-Neyman technique. The goal of these analyses was to determine the points where the FAB was large and small for levels of one self-reported, continuous individual difference variable, across levels of another individual difference variable.
We also used Model 11 of the Process macro (Hayes, 2022; Hayes, 2013) to evaluate rehearsal frequency and memory measures as possible mediators for any three-way interactions not involving those mediators (i.e., Model 3 is tested within Model 11). In Model 11, we hypothesized that initial event affect, x, would interact with one self-reported, continuous individual difference variable, z, to predict fading affect, y, across levels of a different individual difference variable, w, and this effect of x*w*z on y may occur through event rehearsal frequency or memory measures, m. We reported the conditional indirect effect of x*w*z on y through m, examining the indirect effect of x on y through m at levels of the moderators, w and z. In each model, we again controlled for possible influences due to participants.
2.3. Results
2.3.1. Main Effects and Two-Way Interactions
The ANOVAs for the discrete predictors. The ANOVAs produced heterogeneity, but violation of this parametric assumption for conducting ANOVA is not a problem if the sample sizes are relatively equal, defined by a ratio of largest to smallest sample sizes equal or less than 1.5 (Statistics Solutions, 2023). The sample size ratios calculated for initial event affect, event type, and the interaction were all less than 1.5, and, hence, relatively equal. The overall analysis of variance investigating initial affect intensity was statistically significant, F(3, 1870) = 97.978, p < .001, ηp2 = .136. Pleasant events (M = 2.431, SE = 0.026) did not demonstrate different initial affect intensity than unpleasant events (M = 2.362, SE = 0.026), F(1, 1870) = 0.766, p > .38, ηp2 = .000, which did not support regression-to-the-mean as an explanation for FAB effects. The non-marijuana events (M = 2.620, SE = 0.020) were initially more intense than the marijuana events (M = 2.090, SE = 0.030), F(1, 1870) = 230.366, p < .001, ηp2 = .110. In addition, the Initial Event Affect x Event Type interaction was statistically significant, F(1, 1870) = 54.732, p < .001, ηp2 = .028. Figure 1 depicts initial affect intensity across initial event affect and event type.
The overall analysis of variance for fading affect was statistically significant, F(3, 1808) = 75.768, p < .001, ηp2 = .112. Importantly, affect faded more for unpleasant events (M = 1.517, SE = 0.058) than pleasant events (M = 0.433, SE = 0.043), F(1, 1808) = 214.192, p < .001, ηp2 = .106, which supported the hypothesis that a robust FAB effect would be found. No other effects were significant in the ANOVA. Figure 2 depicts fading affect across initial event affect and event type.
Process Model 1 analyses for continuous predictors. We used the Process Model 1 (Hayes, 2022; Hayes, 2013) to examine whether self-reported, continuous individual variables predicted the FAB. The positive continuous predictors of the FAB included cognitive competency, highness for marijuana events, and rehearsal frequency. The negative continuous predictors of the FAB included negative PANAS, depression, anxiety, stress, sleep disturbance, and neuroticism. For the cognitive competency variable, the Process Model 1 (Hayes, 2022) revealed a significant main effect of cognitive competency as well as a significant two-way interaction between cognitive competency and initial event affect (i.e., FAB), B = 0.010 (SE < 0.003), t(1704) = 3.715, p < .001, 95% CI [0.005, 0.015], Model ΔR2 (due to the two-way interaction) = .007, overall Model R2 = .102, p < .001. As seen in Figure 3, the FAB increased with cognitive competency primarily because the fading of unpleasant affect increased as cognitive competency increased. The Johnson-Neyman results showed that the FAB started small and non-significant at the lowest level of cognitive competency, increased and became significant at the second lowest cognitive competency level of 3.821, and continued to amplify from that point.
For highness of marijuana events, the Process Model 1 revealed a significant main effect of marijuana event highness as well as a significant two-way interaction between marijuana event highness and initial event affect, B = 0.012 (SE = 0.004), t(713) = 2.841, p < .001, 95% CI [0.004, 0.020], Model ΔR2 (due to the two-way interaction) = .010, overall Model R2 = .094, p < .001 (i.e., Figure 3). The FAB increased with marijuana event highness primarily because the fading of pleasant affect decreased as marijuana event highness increased. The Johnson-Neyman results showed that the FAB started small and non-significant at the lowest four levels of marijuana event highness but then increased and became significant at the fifth lowest marijuana event highness level of 16.224 and increased with marijuana event highness from that point. For rehearsal frequency, the Process Model 1 revealed significant main effects of rehearsal frequency and initial event affect as well as a significant two-way interaction between rehearsal frequency and initial event affect, B = 0.103 (SE = 0.038), t(1806) = 2.690, p < .007, 95% CI [0.028, 0.178], Model ΔR2 (due to the two-way interaction) < .004, overall Model R2 = .116, p < .001 (i.e., Figure 3). The FAB increased with rehearsal frequency primarily because the fading of pleasant affect decreased as rehearsal frequency increased.
When examining negative PANAS as a predictor of the FAB (e.g., initial event affect), the Process Model 1 revealed significant main effects for initial event affect and negative PANAS. Moreover, the results from the Process Model 1 revealed a significant two-way interaction between negative PANAS and initial event affect, B = -0.670 (SE = 0.106), t(1801) = -6.309, p < .001, 95% CI [-0.878, -0.462], Model ΔR2 (due to the two-way interaction) = .019, overall Model R2 = .131, p < .001. Figure 4 showed that the FAB decreased with negative PANAS because the fading of unpleasant affect increased and the fading of pleasant affect decreased as negative PANAS increased. The Johnson-Neyman results showed that the FAB started large and significant at the lowest levels of negative PANAS, was last significant at the negative PANAS level of 3.101, inverted and became negative at the negative PANAS level of 3.625, strengthened and became significant at the negative PANAS level of 4.298, and increased with negative PANAS from that point.
For depression, the Process Model 1 revealed significant main effects of depression and initial event affect as well as a significant two-way interaction between depression and initial event affect, B = -0.643 (SE = 0.114), t(1807) = -5.619, p < .001, 95% CI [-0.867, -0.419], Model ΔR2 (due to the two-way interaction) = .015, overall Model R2 = .128, p < .001 (i.e., Figure 4). The FAB decreased with depression primarily because the fading of unpleasant affect decreased as depression increased. The Johnson-Neyman results showed that the FAB started large and significant at the lowest levels of depression but decreased and was last significant at the depression level of 1.843, and then it decreased, inverted, and increased in strength, but never became significant. For anxiety, the Process Model 1 revealed significant main effects of anxiety and initial event affect as well as a significant two-way interaction between anxiety and initial event affect, B = -0.501 (SE = 0.114), t(1807) = -4.414, p < .001, 95% CI [-0.724, -0.278], Model ΔR2 (due to the two-way interaction) < .001, overall Model R2 = .122, p < .001 (i.e., Figure 4). The FAB decreased with anxiety primarily because the fading of unpleasant affect decreased as anxiety increased. The Johnson-Neyman results showed that the FAB started large and significant at the lowest levels of anxiety, but decreased and was last significant at the anxiety level of 2.189, and then it decreased from that point.
For stress, the Process Model 1 revealed significant main effects of stress and initial event affect as well as a significant two-way interaction between stress and initial event affect, B = -0.437 (SE = 0.120), t(1803) = -3.641, p < .001, 95% CI [-0.673, -0.202], Model ΔR2 (due to the two-way interaction) < .007, overall Model R2 = .117, p < .001 (i.e., Figure 4). The FAB decreased with stress primarily because the fading of unpleasant affect decreased as stress increased. The Johnson-Neyman results showed that the FAB started large and significant at the lowest levels of stress but decreased and was last significant at the stress level of 2.588 (second highest level of stress) and decreased from that point.
For poor sleep as measured by the PSQI, the Process Model 1 revealed significant main effects of poor sleep and initial event affect as well as a significant two-way interaction between poor sleep and initial event affect, B = -0.639 (SE = 0.180), t(1702) = -3.548, p < .001, 95% CI [-0.992, -0.286], Model ΔR2 (due to the two-way interaction) < .007, overall Model R2 = .121, p < .001 (i.e., Figure 4). The FAB decreased with poor sleep primarily because the fading of unpleasant affect decreased as poor sleep increased. The Johnson-Neyman results showed that the FAB started large and significant at the lowest levels of poor sleep but decreased and was last significant at the third highest poor sleep level of 3.096. For neuroticism, the Process Model 1 revealed significant main effects of neuroticism and initial event affect as well as a significant two-way interaction between neuroticism and initial event affect, B = -0.176 (SE = 0.059), t(1769) = -2.984, p < .001, 95% CI [-0.292, -0.060], Model ΔR2 (due to the two-way interaction) = .004, overall Model R2 = .342, p < .001 (i.e., Figure 4). The FAB decreased with neuroticism, primarily because the fading of pleasant affect increased as neuroticism increased.
2.3.2. Process Model 3 for Three-Way Interactions with Continuous Predictors
We found significant three-way interactions for average daily hours spent consuming marijuana, average daily degree of highness, and average daily sessions spent consuming marijuana. For average daily marijuana hours, the Process Model 3 (Hayes, 2022; Hayes, 2013) revealed significant main effects of average daily marijuana hours and initial event affect. In addition, all three two-way interactions were significant and, importantly, the three-way interaction between average daily marijuana hours, event type, and initial event affect was significant, B = 0.209 (SE = 0.075), t(1741) = 2.799, p = .005, 95% CI [0.063, 0.356], Model ΔR2 (due to the three-way interaction) = .004, overall Model R2 = .119, p < .001. As shown in Figure 5, the FAB started large and significant for non-marijuana events and decreased steadily, but non-significantly, as average daily marijuana hours increased. In contrast, the FAB started positive and significant, but a little smaller for marijuana events, and increased significantly as average daily marijuana hours increased, which did not provide evidence of specific healthy coping.
For average daily highness, the Process Model 3 revealed a significant main effect of initial event affect as well as significant Event Type x Daily Highness and Initial Event Affect x Event Type two-way interactions. Importantly, the three-way interaction between average daily highness, event type, and initial event affect was significant, B = 0.200 (SE = 0.007), t(1754) = 2.700, p < .008, 95% CI [0.005, 0.035], Model ΔR2 (due to the three-way interaction) < .004, overall Model R2 = .119, p < .001 (i.e., Figure 5). The FAB started large and significant for non-marijuana events and decreased non-significantly with average daily marijuana hours, whereas the FAB started significant and smaller for marijuana events and increased significantly as average daily marijuana hours increased. Although the pattern of this three-way interaction showed specific healthy coping, the statistics did not demonstrate specific healthy coping.
For average daily marijuana sessions, the Process Model 3 revealed significant main effects of average daily marijuana sessions and initial event affect, as well as significant Event Type x Average Daily Marijuana Sessions and Initial Event Affect x Event Type two-way interactions. Importantly, the three-way interaction between average daily marijuana sessions, event type, and initial event affect was significant, B = 0.492 (SE = 0.212), t(1730) = 2.317, p < .021, 95% CI [0.076, 0.909], Model ΔR2 (due to the three-way interaction) < .003, overall Model R2 = .121, p < .001 (i.e., Figure 5). The FAB started large and significant for non-marijuana events and decreased in a nearly significant manner as average daily marijuana sessions increased, whereas the FAB started significant but a little smaller for marijuana events and increased in a nearly significant manner as average daily marijuana hours increased. Again, the pattern of this three-way interaction showed specific healthy coping, but the statistics did not support the presence of specific healthy coping.
2.3.3. Examining Rehearsal as a Mediator of the Three-Way Interactions
Next, we examined the conditional indirect effects of initial event affect on fading affect for marijuana and non-marijuana events across quintiles of overall average daily hours spent consuming marijuana, average daily degree of highness, and average daily sessions spent consuming marijuana through rehearsal ratings using the Process Model 11 (Hayes, 2022; Hayes, 2013). The results showed that rehearsal frequency did not mediate any of the three-way interactions at any quintile of any of the measures across marijuana and non-marijuana events. The results did not support rehearsal frequency as a mediator of the complex, significant three-way interactions found in the current study.
2.4. Discussion
We found a robust overall fading affect bias (FAB) that did not differ across marijuana and non-marijuana events, as exhibited via the absence of a significant Initial Event Affect by Event Type interaction (F < 1). Furthermore, overall cognitive competency, marijuana event highness, and event rehearsal positively predicted the FAB, whereas negative PANAS, depression, anxiety, stress, sleep disturbance, and neuroticism all negatively predicted the FAB. Except for the relation involving the marijuana event highness measure, these findings replicated the outcomes from a variety of FAB studies (e.g., Gibbons & Boudin, 2019; Gibbons et al., 2013; Gibbons & Lee, 2019; Ritchie et al., 2009; Skowronski et al., 2004; Walker et al., 2014). These results also demonstrated general healthy coping for the FAB, which enhances self-perceptions and makes people feel good (e.g., Ritchie et al., 2014; Sedikides & Alicke, 2018).
Although the marijuana literature showed that marijuana consumption/effects could act as healthy/adaptive or unhealthy/non-adaptive variables, Pillesdorf and Scoboria (2019) found that marijuana consumption was unhealthy because the FAB was larger for non-marijuana users than for marijuana consumers. However, the results of Experiment 1 showed that 1) marijuana consumption did not significantly predict the FAB, and 2) highness for marijuana events, which is the product of marijuana consumption, positively predicted the FAB. Neither of these results replicated the results of Pillesdorf and Scorboria. One explanation for these different findings may pertain to the fact that Experiment 1 examined marijuana and non-marijuana events, whereas Pillesdorf and Scoboria only evaluated non-marijuana events.
The event type explanation is partially supported by the negative, albeit non-significant, relations between the FAB and the three marijuana-consumption measures (average daily marijuana hours, average daily highness, and average daily marijuana sessions) for non-marijuana events as part of the three-way interactions in Experiment 1. These non-significant negative relations for non-marijuana events mirrored the significant negative relation of marijuana consumption and the FAB for the non-marijuana events in the Pillesdorf and Scoboria (2019) study. Experiment 2 was designed to replicate the procedure in Experiment 1 using an online data collection format to determine whether the results in Experiment 1 were 1) an aberration or 2) a direct product of the methodology.
In addition to the various two-way interactions, three three-way interactions were significant for three marijuana involvement variables (two consumption variables and one reaction variable) as they differentially predicted the FAB across marijuana and non-marijuana events. Specifically, marijuana consumption positively and significantly predicted the FAB for marijuana events, and negatively and non-significantly predicted the FAB for non-marijuana events. These results replicated the general pattern found by Gibbons et al. (2013) for alcohol consumption, such that alcohol consumption negatively predicted the FAB for non-alcohol events and positively predicted the FAB for alcohol events. No indication of specific healthy coping was found in Experiment 1.
Whereas several FAB studies have shown that rehearsals mediated significant three-way interactions (e.g., Gibbons et al., 2013; Gibbons et al., 2017), rehearsals did not mediate the significant three-way interactions in Experiment 1 involving initial event affect, event type, and the three marijuana involvement measures, which included two consumption measures (hours and sessions spent consuming marijuana) and one reactive effects measure (average daily highness). Experiment 2 provided another opportunity to examine the possibility that rehearsal ratings could mediate complex, three-way-interaction FAB effects in the context of marijuana.
3. Experiment 2
Experiment 2 was designed to replicate the procedure in Experiment 1, but it was conducted online rather than in person. Again, participants were asked to provide demographics, ratings of their traits, estimations of their marijuana consumption, and they were asked to remember, describe, and rate two pleasant and two unpleasant events that involved or did not involve marijuana, totaling eight events, in an order that was balanced with a Latin square. The ratings were the same in Experiment 2 as in Experiment 1. We expected general healthy coping, such that healthy variables were expected to positively predict the FAB and unhealthy variables were expected to negatively predict the FAB. Although the Pillesdorf and Scoboria (2019) finding suggested that we would find a negative relation between marijuana consumption/effects and the FAB, the findings in Experiment 1 suggested that we would find positive relations between the variables. Based on the three-way interactions in Experiment 1, we expected the marijuana consumption/effects to 1) positively predict the FAB for marijuana events and 2) negatively predict the FAB for non-marijuana events. We also tested whether rehearsal ratings would mediate the three-way interactions in the experiment.
3.1. Methods
3.1.1. Participants
The initial study sample included 232 students who signed up using the Qualtrix survey-creation system on Amazon MTurk, which is an online data collection mechanism. Participants ranged in age from 18 to 23 years old (M = 21.310, SE = 0.039). The sample was primarily comprised of female (67.7% women), Caucasian (62.5.5% Caucasian, 20.7% Asian, 9.9% 9.9% Hispanic, 5.2% African American), Christian (71.1% Christian, 11.2% Hindu, 4.7% Atheist, 3.9% Agnostic, 3% Islam), heterosexual (69.0% Heterosexual, 25.0% Bisexual, 3.9% Homosexual) individuals. The current study was approved by the University Institutional Review Board (IRB# 1576077-2), and participants were treated ethically according to American Psychological Association (APA) guidelines, which included briefing, informed consent, and debriefing (APA, 2017).
3.1.2. Materials, Measures, Procedure, and Analytic Strategy
The materials and measures used in Experiment 1 were also used in Experiment 2; the descriptions for these measures can be found in the Materials and Measures section of Experiment 1. The scaled measures included average daily hours of marijuana consumption (α = .908), average daily marijuana sessions (α = .934), average daily degree of highness (α = .961), neuroticism from the Big Five Mini-Markers Scale (α = .811), positive PANAS (α = .842), negative PANAS (α = .872), as well as depression (α = .833), anxiety (α = .826), stress (α = .799), Grit (α = .842), and poor sleep as measured by the Pittsburgh Sleep Quality Index (α = .796). Scaled measures also included 1-item scales, which pertained to the degree of highness for marijuana events, as well as cognitive competency, initial and current affect, and rehearsal frequency for each event. Non-scaled measures included hours spent consuming marijuana and sessions consuming marijuana for each marijuana event. The procedure in Experiment 2 was the same as the one used in Experiment 1, except participants signed up for the experiment via Amazon MTurk, they hit a button to provide signed consent, and they completed the entire experiment in an online format. The analytic strategy in Experiment 2 was the same as the one used in Experiment 1.
Two research assistants independently rated marijuana and non-marijuana events as 1 (description clearly matched label), 2 (description likely matches label), 3 (description might match label), 4 (undescribed), and 5 (description matches opposite event label). The kappa for the interrater reliability was .778 (SE = .011), p < .001. The percent agreement for the two research assistants was 83.351%. From the 1856 events, we removed 128 events that were rated a 5 by either rater, as these events clearly did not match their event label.
3.2. Results
3.2.1. Main Effect and Two-Way Interactions: Evidence of General Healthy Coping for FAB
ANOVA analyses for discrete two-way interactions. The ANOVA for initial affect intensity did not produce heterogeneity. The overall analysis of variance for initial affect intensity was not statistically significant, F(3, 1724) = 1.804, p = .144, η2partial = .003, and the two main effects and interaction were not statistically significant (p > .05), which means that regression-to-the-mean could not explain any significant FAB effects. Figure 6 displays initial event affect across event type and initial event affect. The ANOVA for fading affect did produce significant heterogeneity, but violation of this parametric assumption for conducting ANOVA is not a problem if the sample sizes are relatively equal, defined by a ratio of largest to smallest sample sizes equal or less than 1.5 (Statistics Solutions, 2025). The sample size ratios calculated for initial event affect, event type, and the interaction were all less than 1.5, and, hence, relatively equal. The overall ANOVA for fading affect was statistically significant, F(3, 1722) = 64.128, p < .001, η2partial = .100. Only the main effect of initial event affect was statistically significant, F(1, 1722) = 188.657, p < .001, η2partial = .099, with unpleasant events showing greater fading affect (M = 2.341, SE = 0.064) than pleasant events (M = 1.197, SE = 0.053), which demonstrated a fading affect bias (FAB). Figure 7 depicts fading affect across event type and initial event affect.
Process Model for continuous two-way interactions. We used the Process Model 1 (Hayes, 2022; Hayes, 2013) to examine whether self-reported, continuous individual variables predicted the FAB. The significant positive predictors of the FAB included grit, cognitive competency, rehearsal frequency, average daily hours high, positive PANAS, average daily degree of highness, average daily sessions high, degree of marijuana event highness, and hours high for marijuana events. For the grit variable, the Process Model 1 revealed significant main effects of grit and initial event affect (i.e., FAB) as well as a significant two-way interaction of grit and initial event affect, B = 1.165 (SE = 0.132), t(1723) = 8.818, p < .001, 95% CI [0.906, 1.425], Model ΔR2 (due to the two-way interaction) = .039, overall Model R2 = .138, p < .001. Figure 8 shows that the FAB increased with grit because the fading of pleasant events decreased, and the fading of unpleasant events increased as grit increased. The Johnson-Neyman results showed that the FAB started reversed and significant at the lowest level of grit, and decreased and inverted as grit increased, and was last significant at the grit level of 1.924. The FAB then became non-significant at the grit level of 2.025, inverted and became positive at a grit level of 2.395, significant at a grit level of 2.4763, and generally increased from that point.
For the cognitive competency variable, the Process Model 1 revealed significant main effects of cognitive competency and initial event affect as well as a significant two-way interaction of cognitive competency and initial event affect, B = 0.031 (SE < 0.004), t(1479) = 8.212, p < .001, 95% CI [0.024, 0.039], Model ΔR2 (due to the two-way interaction) = .039, overall Model R2 = .135, p < .001 (i.e., Figure 8). The FAB increased with cognitive competency because the fading of pleasant events decreased, and the fading of unpleasant events, but mostly because fading of pleasant affect decreased as cognitive competency increased. The Johnson-Neyman results showed that the FAB started reversed and significant at the lowest level of cognitive competency. The FAB then decreased and was last significant at a cognitive competency level of 14.156, and it was last negative at a cognitive competency level of 25.000. The FAB then inverted and became positive at a cognitive competency level of 30.000, significant at a cognitive competency level of 36.327, and generally increased with cognitive competency from that point.
For the rehearsal frequency variable, the Process Model 1 (Hayes, 2022) revealed significant main effects of rehearsal frequency and initial event affect as well as a significant two-way interaction of rehearsal frequency by initial event affect interaction, B = 0.385 (SE = 0.048), t(1723) = 8.095, p < .001, 95% CI [0.291, 0.478], Model ΔR2 (due to the two-way interaction) < .033, overall Model R2 = .138, p < .001. As seen in Figure 8, the FAB increased with rehearsal frequency because the fading of pleasant events decreased with rehearsal frequency, but mostly because the fading of unpleasant events increased with rehearsal frequency. The Johnson-Neyman results showed that the FAB started reversed and non-significant at the lowest level of rehearsal frequency and decreased, was last negative at rehearsal frequency levels of 1.300, inverted and became positive at rehearsal frequency levels of 1.600, significant at rehearsal frequency levels of 2011, and increased with rehearsal frequency from that point.
For average daily hours high, the Process Model 1 revealed significant main effects of average daily hours high and initial event affect as well as a significant two-way interaction of average daily hours high by initial event affect, B = 0.127 (SE < 0.019), t(1723) = 6.759, p < .001, 95% CI [0.090, 0.164], Model ΔR2 (due to the two-way interaction) < .023, overall Model R2 < .125, p < .001 (i.e., Figure 8). The FAB increased with average daily hours high because the fading of pleasant events decreased, but mostly because the fading of unpleasant events increased as average daily hours high increased. For the positive PANAS variable, the Process Model 1 revealed significant main effects of positive PANAS and initial event affect as well as a significant two-way interaction of positive PANAS by initial event affect, B = 0.580 (SE = 0.102), t(1723) = 5.666, p < .001, 95% CI [0.379, 0.780], Model ΔR2 (due to the two-way interaction) < .017, overall Model R2 < .116, p < .001 (i.e., Figure 8). The FAB increased with positive PANAS because the fading of pleasant events decreased, and the fading of unpleasant events increased as positive PANAS increased. The Johnson-Neyman results showed that the FAB started reversed and non-significant at the lowest level of positive PANAS and then decreased and became positive at the positive PANAS level of 1.2000. The FAB became significant at a positive PANAS level of 1.724 and generally increased with positive PANAS from that point.
For average daily degree of highness, the Process Model 1 revealed a significant main effect of average daily degree of highness and a significant two-way interaction between average daily degree of highness and initial event affect, B = 0.017 (SE = 0.003), t(1723) = 5.409, p < .001, 95% CI [0.011, 0.023], Model ΔR2 (due to the two-way interaction) = .016, overall Model R2 < .126, p < .001 (i.e., Figure 8). The FAB increased with average daily degree of highness only because the fading of unpleasant affect increased as average daily degree of highness increased. The Johnson-Neyman results showed that the FAB started positive and non-significant at the lowest level of average daily degree of highness, increased and became significant at an average daily degree of highness level of 8.747, and generally increased with average daily degree of highness from that point. For the average daily high sessions variable, the Process Model 1 revealed significant main effects of average daily high sessions and initial event affect as well as a significant two-way interaction between average daily high sessions and initial event affect, B < 0.196 (SE = 0.042), t(1723) = 4.630, p < .001, 95% CI [0.113, 0.278], Model ΔR2 (due to the two-way interaction) < .011, overall Model R2 < .121, p < .001 (i.e., Figure 9). The FAB increased with average daily high sessions only because the fading of unpleasant events increased as average daily high sessions increased.
For the degree of highness for marijuana events variable, the Process Model 1 revealed a significant main effect of the degree of highness for marijuana events as well as a significant two-way interaction between the degree of highness for marijuana events and initial event affect, B < 0.022 (SE < 0.005), t(867) = 4.522, p < .001, 95% CI [0.012, 0.031], Model ΔR2 (due to the two-way interaction) < .021, overall Model R2 < .124, p < .001 (i.e., Figure 8). The FAB increased with the degree of highness for marijuana events because the fading of pleasant events decreased, and the fading of unpleasant events increased as the degree of highness for marijuana events increased. The Johnson-Neyman results showed that the FAB started reversed and non-significant at the lowest level of degree of highness for marijuana events, became positive at the degree of highness for marijuana events level of 15.000, became significant at the degree of highness for marijuana events level of 28.592, and generally increased as the degree of highness for marijuana events increased.
For hours high for marijuana events, the Process Model 1 revealed significant main effects of hours high for marijuana events and initial event affect as well as a significant two-way interaction between hours high for marijuana events and initial event affect, B = 0.054 (SE = 0.019), t(868) = 2.818, p < .005, 95% CI [0.016, 0.091], Model ΔR2 (due to the two-way interaction) = .008, overall Model R2 < .112, p < .001 (i.e., Figure 8). The FAB increased with hours high for marijuana events because the fading of pleasant events decreased slightly, and the fading of unpleasant events increased slightly as hours high for marijuana events increased.
The significant negative predictors of the FAB included anxiety, depression, neuroticism, poor sleep, stress, and negative PANAS. For the anxiety variable, the Process Model 1 revealed significant main effects of anxiety and initial event affect as well as a significant two-way interaction between anxiety and initial event affect, B = -0.773 (SE < 0.112), t(1723) = -6.450, p < .001, 95% CI [-1.008, -0.538], Model ΔR2 (due to the two-way interaction) < .021, overall Model R2 = .139, p < .001. Figure 9 showed that the FAB decreased with anxiety only because the fading of unpleasant events decreased as anxiety increased. The Johnson-Neyman results showed that the FAB started large and significant at the lowest level of anxiety, decreased and was last significant at the anxiety level of 3.652, and decreased with anxiety from that point. For the depression variable, the Process Model 1 revealed significant main effects of depression and initial event affect as well as a significant two-way interaction between depression and initial event affect, B = -0.697 (SE = 0.118), t(1723) = -5.904, p < .001, 95% CI [-0.929, -0.466], Model ΔR2 (due to the two-way interaction) = .018, overall Model R2 < .136, p < .001 (i.e., Figure 9). The FAB decreased with depression only because the fading of unpleasant events decreased as depression increased. The Johnson-Neyman results showed that the FAB started large and significant at the lowest level of depression, decreased, and was last significant at the depression level of 3.758, and decreased with depression from that point.
For neuroticism, the Process Model 1 revealed significant main effects of neuroticism and initial event affect as well as a significant two-way interaction between neuroticism and initial event affect, B < -0.315 (SE = 0.057), t(1723) = -5.481, p < .001, 95% CI [-0.427, -0.202], Model ΔR2 (due to the two-way interaction) < .015, overall Model R2 = .114, p < .001 (i.e., Figure 9). The FAB decreased with neuroticism because the fading of pleasant affect increased, and the fading of unpleasant events decreased as neuroticism increased. The Johnson-Neyman results showed that the FAB started large and significant at the lowest level of neuroticism. The FAB then decreased and was last significant at the neuroticism level of 7.751, and the FAB decreased with neuroticism from that point.
For poor sleep quality, the Process Model 1 revealed significant main effects of poor sleep quality and initial event affect as well as a significant two-way interaction between poor sleep quality and initial event affect, B < -0.869 (SE < 0.164), t(1501) = -5.294, p < .001, 95% CI [-1.191, -0.547], Model ΔR2 (due to the two-way interaction) = .016, overall Model R2 < .125, p < .001 (i.e., Figure 9). The FAB decreased with poor sleep quality only because the fading of unpleasant events decreased as poor sleep quality increased. The Johnson-Neyman results showed that the FAB started large and significant at the lowest level of poor sleep quality, and then the FAB decreased and was last significant at the poor sleep quality level of 3.581, and it decreased with poor sleep quality from that point.
For the stress variable, the Process Model 1 revealed significant main effects of stress and initial event affect as well as a significant two-way interaction between stress and initial event affect, B = -0.646 (SE < 0.126), t(1723) = -5.136, p < .001, 95% CI [-0.893, -0.399], Model ΔR2 (due to the two-way interaction) = .013, overall Model R2 = .125, p < .001 (i.e., Figure 9). The FAB decreased with stress only because the fading of unpleasant affect decreased as stress increased. The Johnson-Neyman results showed that the FAB started large and significant at the lowest level of stress, the FAB then decreased and was last significant at the stress level of 3.713, and it decreased with stress from that point. For negative PANAS, the Process Model 1 revealed significant main effects of negative PANAS and initial event affect as well as a significant two-way interaction between negative PANAS and initial event affect, B < -0.404 (SE = 0.091), t(1848) = -4.433, p < .001, 95% CI [-0.583, -0.225], Model ΔR2 (due to the two-way interaction) = .010, overall Model R2 = .127, p < .001 (i.e., Figure 10). The FAB decreased with negative PANAS only because the fading of unpleasant affect decreased as negative PANAS increased.
3.2.2. Continuous Three-Way Interactions Testing for Specific Healthy Coping
We found six significant three-way interactions with initial event affect, event type, and continuous variables, including average daily degree of highness, grit, negative PANAS, anxiety, depression, and stress. For average daily degree of highness, the Process Model 3 (Hayes, 2022; Hayes, 2013) revealed that all the main effects and two-way interactions were significant, as was the three-way interaction between average daily degree of highness, event type, and initial event affect (i.e., FAB), B < -0.019 (SE = .006), t(1598) = -2.957, p = .003, 95% CI [-.031, -0.006], Model ΔR2 (due to the three-way interaction) < .005, overall Model R2 < .132, p < .001. As shown in Figure 10, the FAB started large and significant for non-marijuana events and increased steadily, but not significantly, as average daily degree of highness increased, whereas the FAB started small, negative, non-significant, and reversed for marijuana events and increased strongly and significantly as average daily degree of highness increased.
The Process Model 3 showed that all the main effects and two-way interactions were significant except for the main effect of event type and the grit by event type interaction. Importantly, the grit by event type by initial event affect interaction was significant, B = -0.624 (SE = .264), t(1717) = -2.361, p = .018, 95% CI [-1.143, -0.106], Model ΔR2 (due to the three-way interaction) < .003, overall Model R2 = .142, p < .001 (i.e., Figure 10). The FAB started positive, but non-significant, at the lowest levels of grit for non-marijuana events and increased steadily and significantly as grit increased. In contrast, the FAB started reversed and non-significant at the lowest levels of grit for the marijuana events and increased strongly and significantly along with grit. As the relations between grit and the FAB were both positive and significant, with a larger effect for marijuana than non-marijuana events, these results demonstrated specific healthy coping.
For negative PANAS, the Process Model 3 revealed that all the main effects and two-way interactions were significant, as was the three-way interaction between negative PANAS, event type, and initial event affect, B < 0.496 (SE = 0.182), t(1717) = 2.721, p < .007, 95% CI [0.139, 0.854], Model ΔR2 (due to the three-way interaction) < .004, overall Model R2 < .132, p < .001. Figure 11 showed that the FAB started large and significant for non-marijuana events and decreased steadily but non-significantly as negative PANAS increased, whereas the FAB started large and significant for marijuana events, and decreased strongly and significantly and became non-significant as negative PANAS increased. For anxiety, the Process Model 3 revealed that all the main effects and two-way interactions were significant except for the main effect of event type. Importantly, the anxiety by event type by initial event affect interaction was significant, B = 0.615 (SE = 0.240), t(1717) = 2.563, p < .011, 95% CI [0.144, 1.086], Model ΔR2 (due to the three-way interaction) = .003, overall Model R2 = .144, p < .001 (i.e., Figure 11). The FAB started large and significant for non-marijuana events and decreased steadily and significantly as anxiety increased, whereas the FAB started very large and significant for marijuana events, and decreased very strongly and significantly and became non-significant as anxiety increased, which demonstrated specific healthy coping.
For depression, the Process Model 3 revealed that all the main effects and two-way interactions were significant except for the main effect of event type and the depression by initial event affect interaction. Importantly, the depression by event type by initial event affect interaction was significant, B < 0.535 (SE < .236), t(1717) = 2.266, p < .024, 95% CI [0.072, 0.999], Model ΔR2 (due to the three-way interaction) < .003, overall Model R2 < .141, p < .001 (i.e., Figure 11). The FAB started large and significant for non-marijuana events and decreased steadily and significantly as depression increased, whereas the FAB started very large and significant for marijuana events, and decreased very strongly and significantly, and became non-significant as depression increased, which demonstrated specific healthy coping.
For the stress variable, the Process Model 3 revealed that all the main effects and two-way interactions were significant except for the main effect of event type and the stress by event type interaction. Importantly, the stress by event type by initial event affect interaction was statistically significant, B < 0.565 (SE < .252), t(1717) = 2.240, p = .025, 95% CI [0.070, 1.060], Model ΔR2 (due to the three-way interaction) < .003, overall Model R2 = .130, p < .001 (i.e., Figure 11). The FAB started large and significant for non-marijuana events and decreased steadily and significantly as stress increased, whereas the FAB started very large and significant for marijuana events, and decreased very strongly and significantly, and became non-significant as stress increased, which demonstrated specific healthy coping.
3.2.3. Examining Rehearsal as a Mediator of the Three-Way Interactions
Next, we examined the conditional indirect effects of initial event affect on fading affect across marijuana and non-marijuana events and quintiles of average daily degree of highness, Grit, negative PANAS, anxiety, depression, and stress through rehearsal ratings using the Process Model 11 (Hayes, 2022; Hayes, 2013). Rehearsal ratings mediated the three-way interaction involving average daily degree of highness at the first three levels of this continuous variable for non-marijuana events only. Rehearsal ratings mediated the three-way interaction involving grit at the first two quintiles of grit for marijuana events, but at every quintile of grit for non-marijuana events. Rehearsal ratings mediated the three-way interaction involving negative PANAS at the third quintile of negative PANAS for marijuana events, and at the last three quintiles of negative PANAS for non-marijuana events. Rehearsal ratings mediated the three-way interaction involving anxiety at the third quintile of anxiety for marijuana events and at the last three quintiles of anxiety for non-marijuana events. Rehearsal ratings mediated the three-way interaction involving depression at the last four quintiles of depression for non-marijuana events only. Rehearsal ratings mediated the three-way interaction involving stress at the first three quintiles of stress for marijuana events, but at every quintile of stress for non-marijuana events.
3.3. Discussion
In an online procedure replicating the one used in Experiment 1, Experiment 2 exhibited robust fading affect bias (FAB) that did not differ across event types, demonstrating general healthy coping and replicating the findings in Experiment 1. Similarly, the continuous measures in Experiment 2 consistently showed general healthy coping, as they significantly predicted the FAB. Specifically, the FAB was positively predicted by grit, cognitive competency, rehearsal ratings, average daily hours high, positive PANAS, average degree of highness, average daily high sessions, average degree of highness for marijuana events, and average hours high for marijuana events. In contrast, the FAB was negatively predicted by anxiety, depression, neuroticism, poor sleep quality, stress, and negative PANAS. These results suggest that the FAB is a form of general healthy coping, which replicates the findings in Experiment 1.
Importantly, every two-way interaction involving marijuana consumption and its reactive effects positively predicted the FAB in Experiment 2, which suggested that marijuana consumption/effects were adaptive because they enhanced healthy emotional coping in the form of FAB. One reason that marijuana consumption/effects could have been perceived as healthy by the online participants in Experiment 2 is that these individuals consumed marijuana more often and were high more frequently and, consequently, enjoyed those experiences more than the individuals in Experiment 1. Except for participants’ degree of highness, post-hoc examinations of the marijuana/consumption effects from both experiments supported this explanation. Specifically, overall cognitive competency was lower, and the other four measures of marijuana consumption/effects (hours high for marijuana events, average daily hours high, average degree of highness, and average daily marijuana sessions) were significantly higher in Experiment 2 than in Experiment 1. These results also supported the premise that the online procedure may have allowed participants to openly share their event descriptions as well as their thoughts and feelings about those events to a greater degree than the in-person procedure, which increased the marijuana consumption/effects ratings. Online marijuana consumers may have preferred the privacy of their room or a setting of their choosing to share their events, feelings, and behaviors, unlike in-person marijuana consumers, who may have worried about sharing their illegal activities in a laboratory setting.
More continuous predictors of the FAB were significant in Experiment 2 than in Experiment 1, and with fewer participants, which suggests that the online procedure produced data with less error variance than the in-person procedure. The online procedure in Experiment 2 may have allowed participants to feel secure that their information would remain confidential, increasing the validity and, consequently, the consistency of their responses. A post-hoc comparison of the variance statistics (e.g., standard deviations) across the two experiments did not support this possibility, as the results were mixed. Alternatively, participants engaging in the online procedure of Experiment 2 may have been motivated to begin and execute it with effort due to its expedited access. In contrast to the in-person procedure, the online procedure could be accessed at any time and place with internet access, and it did not necessitate travel to the laboratory. Regardless of the explanation, the two-way interaction findings highlight the effectiveness of online studies in FAB research, extend the work of other FAB research conducted online (Gibbons et al., 2024), and promote their use in future FAB studies.
In addition to the many two-way interactions, we found six significant three-way interactions in Experiment 2. These results showed that the average daily degree of highness positively predicted the FAB for marijuana events and non-marijuana events, but the relation was not significant for non-marijuana events. These results partially replicated the marijuana consumption/effects results from Experiment 1, which demonstrated the same significant positive relation for marijuana events. However, the pattern of findings for the non-marijuana events did not replicate across the two experiments in the current study. The in-person and online procedures used in the two experiments may explain the different results. As stated previously, participants online may have felt free to retrieve and describe events from wider contexts than participants in person, which could have influenced their ratings of event affect as well as their ratings of marijuana consumption/effects. The previously mentioned post-hoc comparison of most marijuana consumption measures across the two experiments/procedures supported this explanation. This explanation is also supported by post-hoc analyses demonstrating higher introversion in Experiment 2 than Experiment 1, a negative relation between introversion and both event highness and daily highness in Experiment 1, and positive relations between daily consumption sessions and degree of highness in Experiment 2.
The two and three-way interactions involving marijuana consumption/effects suggest that consuming marijuana and getting high helps people regulate their emotions by quickly losing their unpleasant feelings for marijuana events while holding onto their pleasant feelings for marijuana events, with the likely consequence being further marijuana engagement. Future research can test the premise of a causal relation between the FAB and marijuana engagement by tracking marijuana novices who have just begun to consume marijuana across time. These individuals should describe their marijuana and non-marijuana events, as well as their marijuana consumption/effects across time (e.g., 6 to 12 weeks). This quasi, cross-lagged panel design could help determine if early FAB leads to later marijuana consumption/effects and events or early marijuana consumption/effects and events lead to later FAB. Similar studies could be run in the context of any drug or behavior that could be considered habitual or addictive, such as alcohol, nicotine, caffeine, videogame play, social media, television shows, movies, and gambling. The problem with such a study is the pressure that participants may feel to continue the newly introduced activity. Therefore, participants should be continually reminded by the experimenters that they can quit engaging in the addictive behavior throughout the entire experimental timeline.
The three-way interaction with grit showed that the FAB increased with grit for both marijuana events and non-marijuana events, but it was larger for marijuana events. This finding is the second instance of specific healthy coping in the FAB literature. In the first instance, partner-esteem positively predicted the FAB more strongly for relationship than non-relationship events (Gibbons et al., 2021). Four other instances of specific healthy coping occurred in the current study. Specifically, the FAB decreased with negative PANAS, anxiety, depression, and stress more strongly for marijuana than non-marijuana events. The rarity of these effects in the FAB literature and the abundance of them in Experiment 2 suggest that the experiment produced high power that cannot be explained by differences in measurement sensitivity and/or error variance, because the data did not support these possibilities.
In contrast to the absence of mediation findings in Experiment 1, the rehearsal (thinking and talking combined) ratings in Experiment 2 partially mediated all six significant three-way interactions, and they mediated the interaction effects at more quintiles of non-marijuana events than quintiles of marijuana events. These findings suggest that participants in Experiment 2 of the current study experienced greater emotion regulation via the FAB for non-marijuana events from repeating their events mentally or with other individuals. The mediation findings and the stronger relations between continuous predictors and the FAB for marijuana than non-marijuana events suggest that rehearsal enhanced weak relations but not strong ones.
4. General Discussion
We found robust overall fading affect bias (FAB) effects in Experiments 1 and 2 that did not differ across marijuana and non-marijuana events, which displayed general healthy coping for the FAB. General healthy coping was also demonstrated in the form of many positive and negative relations in both experiments between the FAB and healthy/adaptive and non-healthy/non-adaptive measures, respectively. These findings replicated and extended past work showing similar results (Gibbons & Boudin, 2019; Gibbons et al., 2013; Gibbons & Lee, 2019; Ritchie et al., 2009; Skowronski et al., 2004; Walker et al., 2014). The FAB helps people seek new experiences with the expectation that those events, too, will show FAB, which leads to positive self-perceptions about life and their role in it (Ritchie et al., 2014).
The positive relations between marijuana consumption/reaction measures and the FAB in both experiments ran counter to the expectations based on the FAB being higher for non-marijuana than marijuana consumers in the Pillesdorf & Scoboria (2019) study. One possible explanation for these different findings is that the FAB was not compared across marijuana consumers and non-marijuana consumers in both experiments in the current study. Therefore, we compared fading affect for pleasant and unpleasant events across participants who did and did not consume marijuana or did and did not get high for every marijuana consumption/effects measure, except for overall cognitive competency, because the competency level indicating sobriety is unclear. For every measure, we found that pleasant affect faded less or unpleasant affect faded more for marijuana consumers reporting being high than marijuana non-consumers not reporting being high. These results demonstrated a positive relation between marijuana consumption/effects and the FAB, and they are in line with the two-way interactions displaying that relation in the current study, not the results from Pillesdorf and Scoboria (2019) showing a larger FAB for marijuana non-consumers than marijuana consumers.
Even though three three-way interactions involving marijuana consumption/effects and event type significantly predicted the FAB in Experiment 1, only one of these three-way interactions was significant in Experiment 2, and it involved a different marijuana consumption/effects variable than in Experiment 1. The strong two-way interactions in Experiment 2 could have driven the marijuana consumption/effects to positively predict the FAB in consistent ways across marijuana and non-marijuana events that limited their influence on these strong relations. However, five other continuous variables differentially predicted the FAB across event type in Experiment 2, which does not support the explanation that powerful two-way interactions overrode the variance found across event type for relations between FAB and marijuana consumption/effects.
A more plausible explanation for the paucity of three-way FAB interactions involving marijuana consumption/effects and event type in Experiment 2 relative to Experiment 1 is the fact that an individual's cannabis consumption/effects depends largely on their dependency. Prior research has shown that individuals who meet the full diagnostic criteria for cannabis dependency tend to experience many negative effects, including particularly poor cognitive functioning and mental health (Braidwood et al., 2018; Looby & Earleywine, 2007). In contrast to non-dependent users, who do not show the same mental health issues (Braidwood et al., 2018; Degenhardt et al., 2002; Van der Pol et al., 2013) and may experience FAB as a healthy or adaptive coping mechanism, dependent users may experience FAB as an avoidant coping mechanism that could be connected to poor mental health. As the current study did not test for this potentially influential factor, future research testing FAB effects in the context of addictive behaviors should measure it and statistically control for it.
One major limitation in the current study is that we did not ask participants to provide their marijuana reactivity, which includes the degree of highness, hours high, and competency, for non-marijuana events. Participants who spent a majority of their time high could have been, and likely were, under the influence of marijuana for their non-marijuana events. Therefore, the variables measuring marijuana reactivity for both event types may have been able to show strong positive relations to the FAB for both marijuana and non-marijuana events, but only for individuals reporting high levels of marijuana involvement. Such an effect would be noted in the breakdown of a significant interaction of initial event affect, daily marijuana involvement, and hours/degree high across both events. Future research should correct for this limitation by measuring marijuana reactivity and analyzing its effects on the FAB within the context of addictive behaviors for both the addictive behavior event (e.g., marijuana) and the non-addictive behavior event (e.g., non-marijuana).
Another limitation is that participants were asked to subjectively assess the way they felt after consuming marijuana. Unfortunately, individuals do not always make these judgments consistently and accurately. For example, King et al. (2022) gave heavy and very heavy intravenous alcohol doses to a group that had been drinking heavily for a prolonged period before the experiment and then tested their physiological and subjective reactions. Although the participants’ physiological reactions were different across the two alcohol doses, their subjective reactions did not differ across them. These results demonstrate that subjective assessments do not always accurately reflect actual drug doses the same way as objective measures, such as physiological reactions. Future studies could employ physiological measures to enhance the accuracy of their measures and the validity of their conclusions. However, physiological measures are often difficult and expensive to administer, and subjective experiences are best captured with subjective measures. Therefore, researchers have to weigh the costs and benefits of using physiological and subjective measures. As an alternative to both these measures, future research could ask participants to engage in challenging tasks (e.g., puzzles) when they are or are not high, and then measure their performance, reaction time, and subjective assessments of their experiences. To avoid the legal and ethical considerations of marijuana manipulations in the laboratory, these studies could be conducted online with participants logging in and providing information at various times when they are high.
Based on the findings that rehearsal partially, yet significantly, mediated every significant three-way interaction in Experiment 2, as it has mediated complex FAB effects in the past (e.g., Gibbons et al., 2013; Gibbons et al., 2017), rehearsal ratings involving thinking and/or talking should be evaluated as interventions that could produce the desired FAB reductions or reversals. The upside of these findings is that most of the mediation occurred for non-marijuana events, which is the majority of events for most people. In addition to rehearsal not mediating FAB effects for non-marijuana events in Experiment 2, rehearsal did not mediate any complex FAB effects in Experiment 1. One possible explanation for the mediation differences across the two experiments is that participants in Experiment 1 interacted in social circles with individuals who facilitated deep disclosures (Muir et al., 2019) through receptive and active listening (Muir et al., 2015), which enhanced FAB and made rehearsal frequency irrelevant. This explanation could also be extended to the mediation differences across events in Experiment 2, such that non-marijuana events may have been shared more deeply and with listeners who were more active than marijuana events. Future research should assess disclosure depth, level of active listening, and rehearsal frequency as mediators of complex FAB effects to fully evaluate the mediating effects of rehearsal.
In summary, two experiments found general healthy coping in the form of significant FAB effects that did not differ across event type, as well as positive and negative relations of the FAB to adaptive and non-adaptive variables, respectively. These two experiments also demonstrated positive relations between marijuana consumption/effects and the FAB and significant three-way interactions in which marijuana consumption/effects positively predicted the FAB for marijuana events. More three-way interactions involving marijuana consumption/effects were found in Experiment 1 than in Experiment 2. However, more two-way interactions involving marijuana consumption/effects were found in Experiment 2, more three-way interactions were significant in Experiment 2, and both specific healthy coping and mediation of significant three-way interactions by rehearsal ratings were only demonstrated in Experiment 2.
Possible explanations for the different findings in the two experiments included procedural differences as well as potential differences in marijuana dependency and reactivity. Future research should measure these constructs to evaluate their explanatory value, as well as assess rehearsal disclosure depth and the extent to which audience members listened actively to shared event descriptions to fully examine rehearsal as a mediator of complex FAB effects. Future research should also consider conducting quasi-, cross-lagged panel design studies to test whether the link between marijuana consumption/effects and the FAB is causal. As the current study re-established the FAB as general healthy coping and established marijuana consumption/effects as adaptive measures facilitating the FAB, we have to conclude that getting high can, and is even likely to, lead to emotional highs.
Author Contributions
Conceptualization, Jeffrey Alan Gibbons, Emma Friedmann and Kaylee Harris; Methodology, Jeffrey Alan Gibbons, Emma Friedmann and Kaylee Harris; Validation, Jeffrey Alan Gibbons; Formal analysis, Jeffrey Alan Gibbons; Investigation, Jeffrey Alan Gibbons, Chayse Angela Cotton, Matthew Traversa, Emma Friedmann and Kaylee Harris; Resources, Jeffrey Alan Gibbons; Data curation, Jeffrey Alan Gibbons; Writing – original draft, Jeffrey Alan Gibbons, Chayse Angela Cotton, Matthew Traversa, Emma Friedmann and Kaylee Harris; Writing – review & editing, Jeffrey Alan Gibbons, Chayse Angela Cotton and Matthew Traversa; Visualization, Jeffrey Alan Gibbons; Supervision, Jeffrey Alan Gibbons; Project administration, Jeffrey Alan Gibbons, Emma Friedmann and Kaylee Harris. All authors have read and agreed to the published version of the manuscript.
Funding
This research was funded by Christopher Newport University (grant number: #70-720-7213).
Informed Consent Statement
Informed consent was obtained from all subjects involved in the study.
Data Availability Statement
The data are available from the first author upon reasonable request.
Acknowledgments
We would like to thank Emily Peterson, Gabriela Rocha, Luke Fernandez, Elizabeth Mazzello, and Franchesca Pandolfe. All these individuals helped to create and run the experiments, as well as enter and check the data. Luke found a couple of articles that we used for the introduction.
Conflicts of Interest
The authors declare no conflict of interest.
References
- Alexander, D. A marijuana screening inventory (experimental version): Description and preliminary psychometric properties. American Journal of Drug and Alcohol Abuse 2003, 29(3), 619–646. [Google Scholar] [CrossRef]
- American Psychological Association. Ethical principles of psychologists and code of conduct . (2002, amended effective June 1, 2010, and January 1, 2017). 2017. Available online: https://www.apa.org/ethics/code/.
- Bius, J. R. How the US Military Taught Americans to Smoke. Zócalo Public Square. 5 August 2019. Available online: https://www.zocalopublicsquare.org/how-the-us-military-taught-americans-to-smoke/?utm_source.
- Bolla, K. I.; Lesage, S. R.; Gamaldo, C. E.; Neubauer, D. N.; Funderburk, F. R.; Cadet, J. L.; David, P. M.; Verdejo-Garcia, A.; Benbrook, A. R. Sleep disturbance in heavy marijuana users. Sleep 2008, 31(6), 901–908. [Google Scholar] [CrossRef] [PubMed]
- Braidwood, R.; Mansell, S.; Waldron, J.; Rendell, P. G.; Kamboj, S. K.; Curran, H. V. Non-dependent and dependent daily cannabis users differ in mental health but not prospective memory ability. Frontiers in Psychiatry 2018, 9, 97. [Google Scholar] [CrossRef] [PubMed]
- Cason, H. The learning and retention of pleasant and unpleasant activities. Archives of Psychology 1932, 134, 96. [Google Scholar] [CrossRef]
- Castle, R. D.; Marzolf, J.; Morris, M.; Bushell, W. C. Meta-analysis of medical cannabis outcomes and associations with cancer. Frontiers in Oncology 15 2025. [Google Scholar] [CrossRef]
- Drazdowski, T. K.; Lee, C. M.; Neighbors, C. College students’ using marijuana to sleep relates to frequency, problematic use, and sleep problems. Journal of American College Health 2019, 67(7), 647–656. [Google Scholar] [CrossRef]
- Degenhardt, L.; Lynskey, M.; Coffey, C.; Patton, G. 'Diagnostic orphans' among young adult cannabis users: persons who report dependence symptoms but do not meet diagnostic criteria. Drug and Alcohol Dependence 2002, 67(2), 205–212. [Google Scholar] [CrossRef]
- Dorard, G.; Bungener, C.; Phan, O.; Edel, Y.; Corcos, M.; Berthoz, S. Is alexithymia related to cannabis use disorder? Results from a case-control study in outpatient adolescent cannabis abusers. Journal of Psychosomatic Research 95 2017, 74–80. [Google Scholar] [CrossRef]
- Duckworth, A. L.; Quinn, P. D. Development and validation of the Short Grit Scale (GRIT–S). Journal of Personality Assessment 2009, 91, 166–174. [Google Scholar] [CrossRef]
- Etymonline. 2025. Available online: https://www.etymonline.com/word/stoner.
- Gibbons, J. A.; Bouldin, B. Videogame play and events are related to unhealthy emotion regulation in the form of low fading affect bias in autobiographical memory. Consciousness and Cognition 2019, 74, 102778. [Google Scholar] [CrossRef] [PubMed]
- Gibbons, J. A.; Dunlap, S.; Friedmann, E.; Dayton, C.; Rocha, G. The fading affect bias is disrupted by false memories in two diary studies of social media events. Applied Cognitive Psychology 2022, 36(2), 346–362. [Google Scholar] [CrossRef]
- Gibbons, J. A.; Dunlap, S. M.; Horowitz, K.; Wilson, K. A fading affect bias first: Specific healthy coping with partner-esteem for romantic relationship and non-relationship events. International Journal of Environmental Research and Public Health 2021, 18(19), 10121. [Google Scholar] [CrossRef] [PubMed]
- Gibbons, J. A.; Fehr, A. M. A.; Brantley, C. J.; Lee, S. A.; Walker, R. Testing the fading affect for healthy coping in the context of death. Death Studies 2016, 40, 513–527. [Google Scholar] [CrossRef] [PubMed]
- Gibbons, J. A.; Hartzler, J. K.; Hartzler, A. W.; Lee, S. A.; Walker, W. R. The fading affect bias shows healthy coping at the general level, but not the specific level for religious and non-religious events. Consciousness and Cognition 2015, 36, 265–276. [Google Scholar] [CrossRef]
- Gibbons, J. A.; Horowitz, K. A.; Dunlap, S. M. The fading affect bias shows positive outcomes at the general but not the individual level of analysis in the context of social media. Consciousness and Cognition 2017, 53, 47–60. [Google Scholar] [CrossRef] [PubMed]
- Gibbons, J. A.; Lee, S. A. Rehearsal partially mediates the negative relations of the fading affect bias with depression, anxiety, and stress. Applied Cognitive Psychology 2019, 33, 693–701. [Google Scholar] [CrossRef]
- Gibbons, J. A.; Lee, S. A.; Walker, W. R. The fading affect bias begins within 12 hours and persists for 3 months. Applied Cognitive Psychology 2011, 25, 663–672. [Google Scholar] [CrossRef]
- Gibbons, J. A.; Toscano, A.; Kofron, S.; Rothwell, C.; Lee, S. A.; Ritchie, T. D.; Walker, W. R. The fading affect bias across alcohol consumption frequency for alcohol-related and non-alcohol-related events. Consciousness and Cognition 2013, 22, 1340–1351. [Google Scholar] [CrossRef]
- Gibbons, J. A.; Vandevender, S.; Langhorne, K.; Peterson, E.; Buchanan, A. In-person and online studies examining the influence of problem solving on the fading affect bias. Behavioral Sciences 2024, 14(9), 806. [Google Scholar] [CrossRef]
- Gruber, S. A.; Sagar, K. A.; Dahlgren, M. K.; Olson, D. P.; Centorrino; Lukas, S. E. Marijuana impacts mood in bipolar disorder: A pilot study. Mental Health and Substance Use 2012, 5(3), 228–239. [Google Scholar] [CrossRef]
- Guy, S. C.; Isquith, P. K.; Gioia, G. A. Behavior rating inventory of executive function-self-report version; Psychological Assessment Resources, Inc: Florida, 2004. [Google Scholar]
- Hanson, K. L.; Winward, J. L.; Schweinsburg, A. D.; Medina, K. L.; Brown, S. A.; Tapert, S. F. Longitudinal study of cognition among adolescent marijuana users over three weeks of abstinence. Addictive Behaviors 2010, 35(11), 970–976. [Google Scholar] [CrossRef]
- Hayes, A. F. Introduction to mediation, moderation, and conditional process analysis: A regression-based approach; Guilford Press: New York, NY, USA, 2022. [Google Scholar]
- Hayes, A. F. The PROCESS macro for SPSS and SAS (version 2.13) [Software]. 2013. Available online: http://www.process.
- Hines, L. A.; Freeman, T. P.; Gage, S. H.; Hickman, M.; MacLeod, J. Association of high-potency cannabis use with mental health and substance use in adolescence. JAMA Psychiatry 2020, 78(5), 515–522. [Google Scholar] [CrossRef]
- Holmes, D. S. Differential change in affective intensity and the forgetting of unpleasant personal experiences. Journal of Personality and Social Psychology 15 1970, 234–239. [Google Scholar] [CrossRef] [PubMed]
- Inoue-Choi, M.; Hartge, P; Liao, L. M.; Caporaso, N.; Freedman, N. D. Association between long-term low-intensity cigarette smoking and incidence of smoking-related cancer in the National Institutes of Health-AARP cohort. International Journal of Cancer 2018, 142(2), 271–280. [Google Scholar] [CrossRef] [PubMed]
- Jersild, A. Memory for the pleasant as compared with the unpleasant. Journal of Experimental Psychology 1931, 14, 284–288. [Google Scholar] [CrossRef]
- King, A.; Vena, A.; Hasin, D. S.; deWit, H.; O’Connor, S. J.; Cao, D. Subjective responses to alcohol in the development and maintenance of alcohol use disorder. American Journal of Psychiatry 2021, 178(6), 560–571. [Google Scholar] [CrossRef] [PubMed]
- Kuhathasan, N. Therapeutic cannabis use for sleep and mental health . Doctoral dissertation, McMaster University, 2022. Available online: https://macsphere.mcmaster.ca/handle/11375/28273.
- Lac, A.; Luk, J. W. Testing the amotivational syndrome: Marijuana use longitudinally predicts lower self-efficacy even after controlling for demographics, personality, and alcohol and cigarette use. Prevention Science 2017, 19(2), 117–126. [Google Scholar] [CrossRef]
- Lake, I. R.; Matheson, K.; Popovich, G. Does cannabis use modify the effect of post-traumatic stress disorder on severe depression and suicidal ideation? Evidence from a population-based cross-sectional study of Canadians. Journal of Psychopharmacology 2019, 33(9), 1219–1226. [Google Scholar] [CrossRef]
- Lex, B. W.; Griffin, M. L.; Mello, N. K.; Mendelson, J. H. Alcohol, marijuana, and mood states in young women. Substance Use & Misuse 1989, 24(6), 639–652. [Google Scholar] [CrossRef]
- Li, X.; Diviant, J. P.; Stith, S. S.; Brockelman, F.; Keeling, K.; Hall, B.; Vigil, J. M. The effectiveness of cannabis flower for immediate relief from symptoms of depression. Yale Journal of Biology and Medicine 2020, 93(2), 251–264. [Google Scholar] [CrossRef]
- Looby, A.; Earleywine, M. Negative consequences associated with dependence in daily cannabis users. Substance Abuse Treatment, Prevention, and Policy 2007, 2(3), 1–7. [Google Scholar] [CrossRef]
- Lovibond, S. H.; Lovibond, P. F. Manual for the Depression, Anxiety & Stress Scales. In Psychology Foundation; 1995. [Google Scholar] [CrossRef]
- Meltzer, H. The present status of experimental studies on the relationship of feeling to memory. Psychological Review 1930, 37, 124–139. [Google Scholar] [CrossRef]
- Meltzer, H. Sex differences in forgetting pleasant and unpleasant experiences. Journal of Abnormal and Social Psychology 25 1931, 450–464. [Google Scholar] [CrossRef]
- Meier, M. H.; Caspi, A.; R. Knodt, A.; Hall, W.; Ambler, A.; Harrington, H.; Hogan, S.; M. Houts, R.; Poulton, R.; Ramrakha, S.; Hariri, A. R.; Moffitt, T. E. Long-term cannabis use and cognitive reserves and hippocampal volume in midlife. American Journal of Psychiatry 2022, 179(5), 362–374. [Google Scholar] [CrossRef] [PubMed]
- Muir, K.; Brown, C.; Madill, A. Conversational patterns and listener responses associated with an enhanced fading affect bias after social disclosure. Journal of Language and Social Psychology 2019, 38(5-6), 552–585. [Google Scholar] [CrossRef]
- Muir, K.; Brown, C.; Madill, A. The fading affect bias: Effects of social disclosure to an interactive versus non-responsive listener. Memory 2015, 23(6), 829–847. [Google Scholar] [CrossRef]
- Ogeil, R. P.; Phillips, J. G.; Rajaratnam, S. M. W.; Broadbear, J. H. Risky drug use and effects on sleep quality and daytime sleepiness. Human Psychopharmacology: Clinical and Experimental 2015, 30(5), 356–363. [Google Scholar] [CrossRef]
- Petrucci, A. S. A comprehensive examination of the links between cannabis use and motivation. Substance Use & Misuse 2020, 55(3), 444–457. [Google Scholar] [CrossRef]
- Pillersdorf, D.; Scoboria, A. Cannabis-associated impairments in the fading affect bias and autobiographical memory specificity. Consciousness and Cognition 2019, 74. [Google Scholar] [CrossRef]
- Poli, P.; Crestani, F.; Salvadori, C.; Valenti, I.; Sannino, C. Medical cannabis in patients with chronic pain: Effect on pain relief, pain disability, and psychological aspects. A prospective non-randomized single-arm clinical trial. La Clinica Terapeutica 2018, 169(3), e102–e107. [Google Scholar] [CrossRef]
- Preacher, K. J.; Curran, P. J.; Bauer, D. J. Computational tools for probing interactions in multiple linear regression, multilevel modeling, and latent curve analysis. Journal of Educational and Behavioral Statistics 2006, 31, 437–448. [Google Scholar] [CrossRef]
- Ritchie, T. D.; Batteson, T. J.; Bohn, A.; Crawford, M. T.; Ferguson, G. V.; Schrauf; Vogl, R. J.; Walker, W. R. A pancultural perspective on the fading affect bias in autobiographical memory. Memory 2014a, 23, 278–290. [Google Scholar] [CrossRef]
- Ritchie, T. D.; Kitsch, K. S.; Dromey, M.; Skowronski, J. J. Individuals who report eating disorder symptoms also exhibit a disrupted fading affect bias in autobiographical memory. Memory 2019, 27, 239–249. [Google Scholar] [CrossRef]
- Ritchie, T. D.; Skowronski, J. J.; Harnett, J.; Wells, B.; Walker, W. R. The fading affect bias in the context of emotion activation level, mood, and personal theories of emotion change. Memory 2009, 17, 428–444. [Google Scholar] [CrossRef]
- Ritchie, T. D.; Skowronski, J. J.; Wood, S.; Walker, W. R.; Vogl, R. J.; Gibbons, J. A. Event self-importance, event rehearsal, and the fading affect bias in autobiographical memory. Self and Identity 5 2006, 172–195. [Google Scholar] [CrossRef]
- Roitman, P.; Mechoulam, R.; Cooper-Kazaz, R.; Shalev, A. Preliminary, open-label, pilot study of add-on oral Δ9-tetrahydrocannabinol in chronic post-traumatic stress disorder. Clinical Drug Investigation 2014, 34(8), 587–591. [Google Scholar] [CrossRef]
- Safakish, R.; Ko, G.; Salimpour, V.; Hendin, B.; Sohanpal, I.; Loheswaran, G.; Yoon, S. Y. R. Medical cannabis for the management of pain and quality of life in chronic pain patients: A prospective observational study. Pain Medicine 2020, 21(11), 3073–3086. [Google Scholar] [CrossRef]
- Saucier, G. Mini-Markers: A brief version of Goldberg’s Unipolar Big-Five Markers. Journal of Personality Assessment 63 1994, 506–516. [Google Scholar] [CrossRef]
- Schuster, R. M.; Tackett, J. L.; Davis, S. M.; Futch, W. S.; Barraza, F.; Weissenburger, A. Cross-domain correlates of cannabis use disorder severity among young adults. Psychology of Addictive Behaviors 2019, 33(8), 664–675. [Google Scholar] [CrossRef]
- Sedikides, C.; Alicke, M. D. The five pillars of self-enhancement and self-protection. In Oxford handbook of motivation; Ryan, R. M., Ed.; 2018. [Google Scholar]
- Siegel, R. L.; Miller, K. D.; Jemal, A. Cancer statistics. CA: A Cancer Journal for Clinicians 2018, 68(1), 7–30. [Google Scholar] [CrossRef]
- Skowronski, J. J.; Crouch, J. L.; Coley, S. L.; Sasson, S.; Wagner, M. F.; Rutledge, E.; Cote, K.; Miksys, C.; Milner, J. S. Fading of affect associated with negative child-related memories varies by parental child abuse potential. Applied Cognitive Psychology 2016, 30(6), 972–982. [Google Scholar] [CrossRef]
- Skowronski, J. J.; Crouch, J. L.; Milner, J. S. Does the fading affect bias vary by memory type and a parent's risk of physically abusing a child? A replication and extension. Psychological Reports 2023, 126(5), 2418–2432. [Google Scholar] [CrossRef]
- Skowronski, J.; Gibbons, J.; Vogl, R.; Walker, W. The effect of social disclosure on the intensity of affect provoked by autobiographical memories. Self & Identity 2004, 3, 285–309. [Google Scholar] [CrossRef]
- Statistics Solutions. The assumption of homogeneity of variance, 2018. The Assumption of Homogeneity of Variance - Statistics Solutions. 2023. Available online: https://statisticsolutions.com (accessed on 10 July 2023).
- Mug, Stoner. Urban Dictionary. 2019. Available online: https://www.urbandictionary.com/define.php?term=Stoner.
- Sznitman, S. R.; van Rijswijk, L.; Cousijn, J. Cannabis use as a predictor and outcome of positive and negative affect in college students: An ecological momentary assessment study. Addictive Behaviors 2022, 128, 107221. [Google Scholar] [CrossRef]
- Taylor, S. E. Asymmetrical effects of positive and negative affect: The mobilization-minimization hypothesis. Psychological Bulletin 1991, 110, 67–85. [Google Scholar] [CrossRef]
- van der Pol, P.; Liebregts, N.; de Graaf, R.; ten Have, M.; Korf, D. J.; van den Brink, W.; van Laar, M. Mental health differences between frequent cannabis users with and without dependence and the general population. Addiction 2013, 108(8), 1459–1469. [Google Scholar] [CrossRef]
- Walker, W. R.; Skowronski, J. J. The fading affect bias: But what the hell is it for? Journal of Applied Cognitive Psychology 23 2009, 1122–1136. [Google Scholar] [CrossRef]
- Walker, W. R.; Skowronski, J.; Gibbons, J.; Vogl, R.; Thompson, C. On the emotions that accompany autobiographical memories: Dysphoria disrupts the fading affect bias. Cognition & Emotion 2003a, 17, 703–723. [Google Scholar] [CrossRef]
- Walker, W.; Vogl, R.; Thompson, C. Autobiographical memory: Unpleasantness fades faster than pleasantness over time. Applied Cognitive Psychology 11 1997, 399–413. [Google Scholar] [CrossRef]
- Walker, W. R.; Yancu, C. N.; Skowronski, J. J. Trait anxiety reduces affective fading for both positive and negative autobiographical memories. Advances in Cognitive Psychology 2014, 10, 81–89. [Google Scholar] [CrossRef]
- Watson, D.; Clark, L.; Tellegen, A. Development and validation of brief measures of positive and negative affect: The PANAS scales. Journal of Personality and Social Psychology 54 1988, 1063–1070. [Google Scholar] [CrossRef] [PubMed]
- Watters, R.; Leeper, R. The relation of affective tone to the retention of experiences in everyday life. Journal of Experimental Psychology 19 1936, 203–215. [Google Scholar] [CrossRef]
Figure 1.
Initial affect intensity across pleasant and unpleasant marijuana and non-marijuana events for Experiment 1.
Figure 1.
Initial affect intensity across pleasant and unpleasant marijuana and non-marijuana events for Experiment 1.
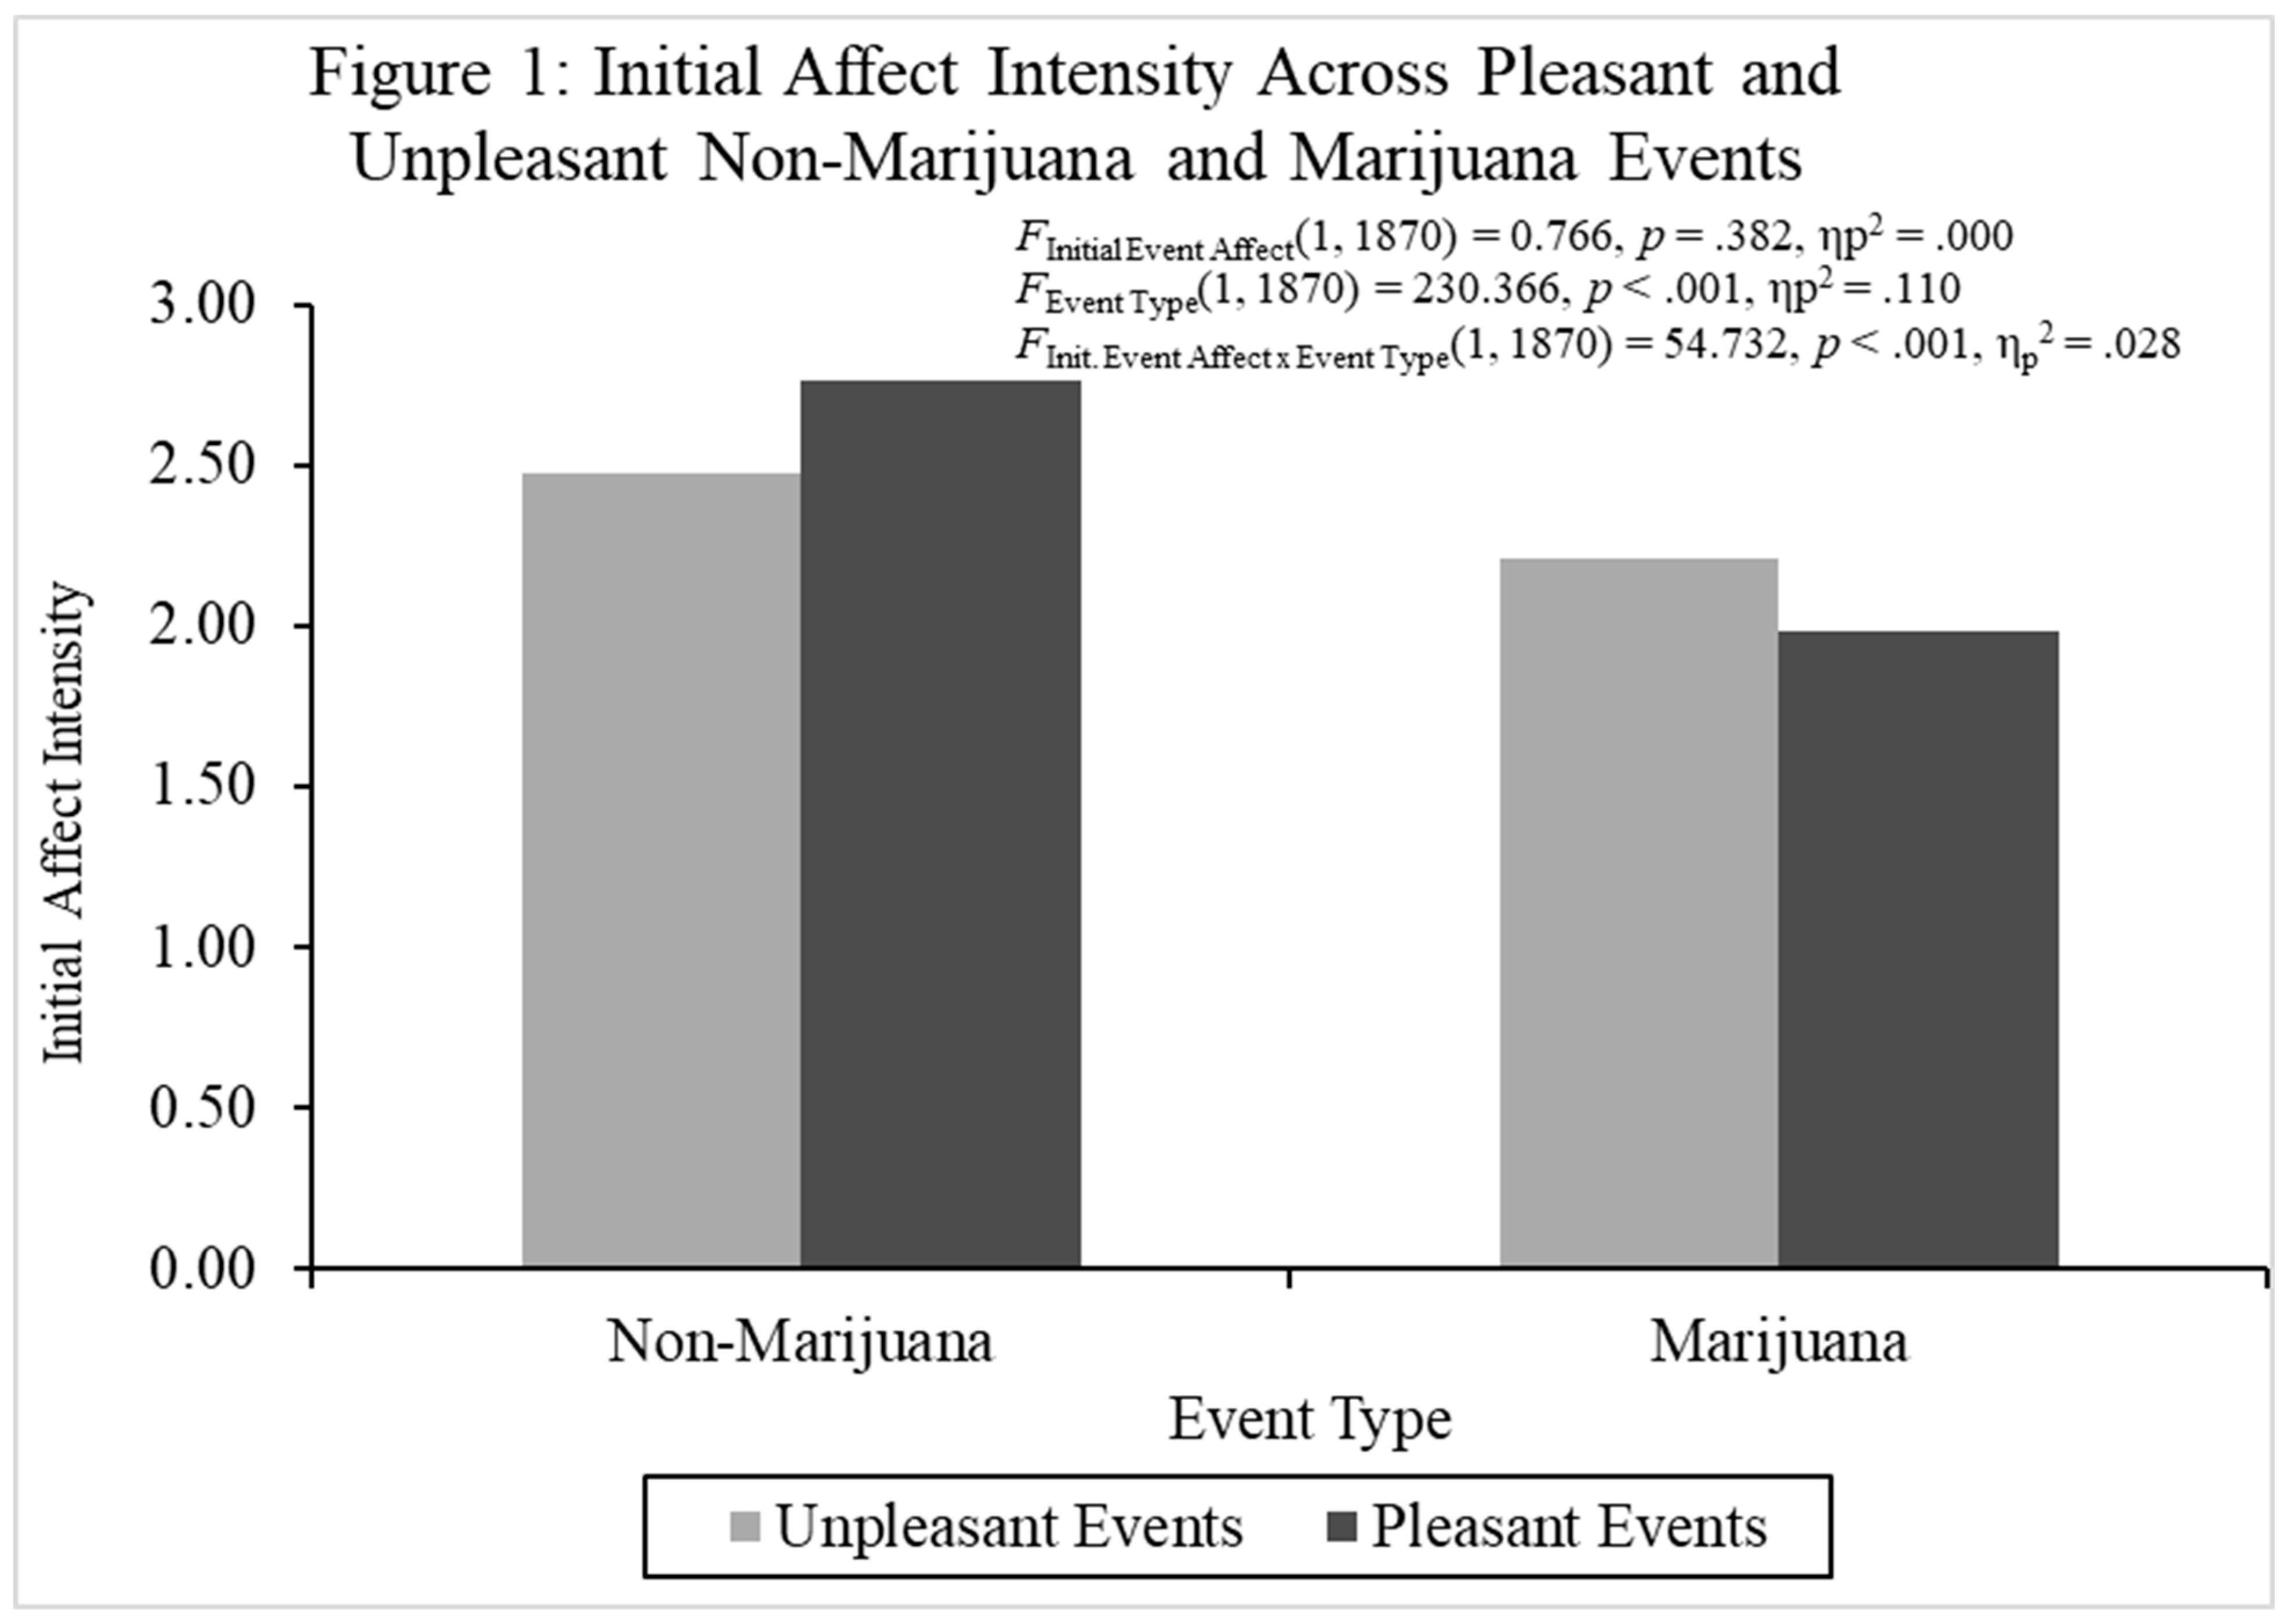
Figure 2.
Fading affect across pleasant and unpleasant marijuana and non-marijuana events for Experiment 1.
Figure 2.
Fading affect across pleasant and unpleasant marijuana and non-marijuana events for Experiment 1.
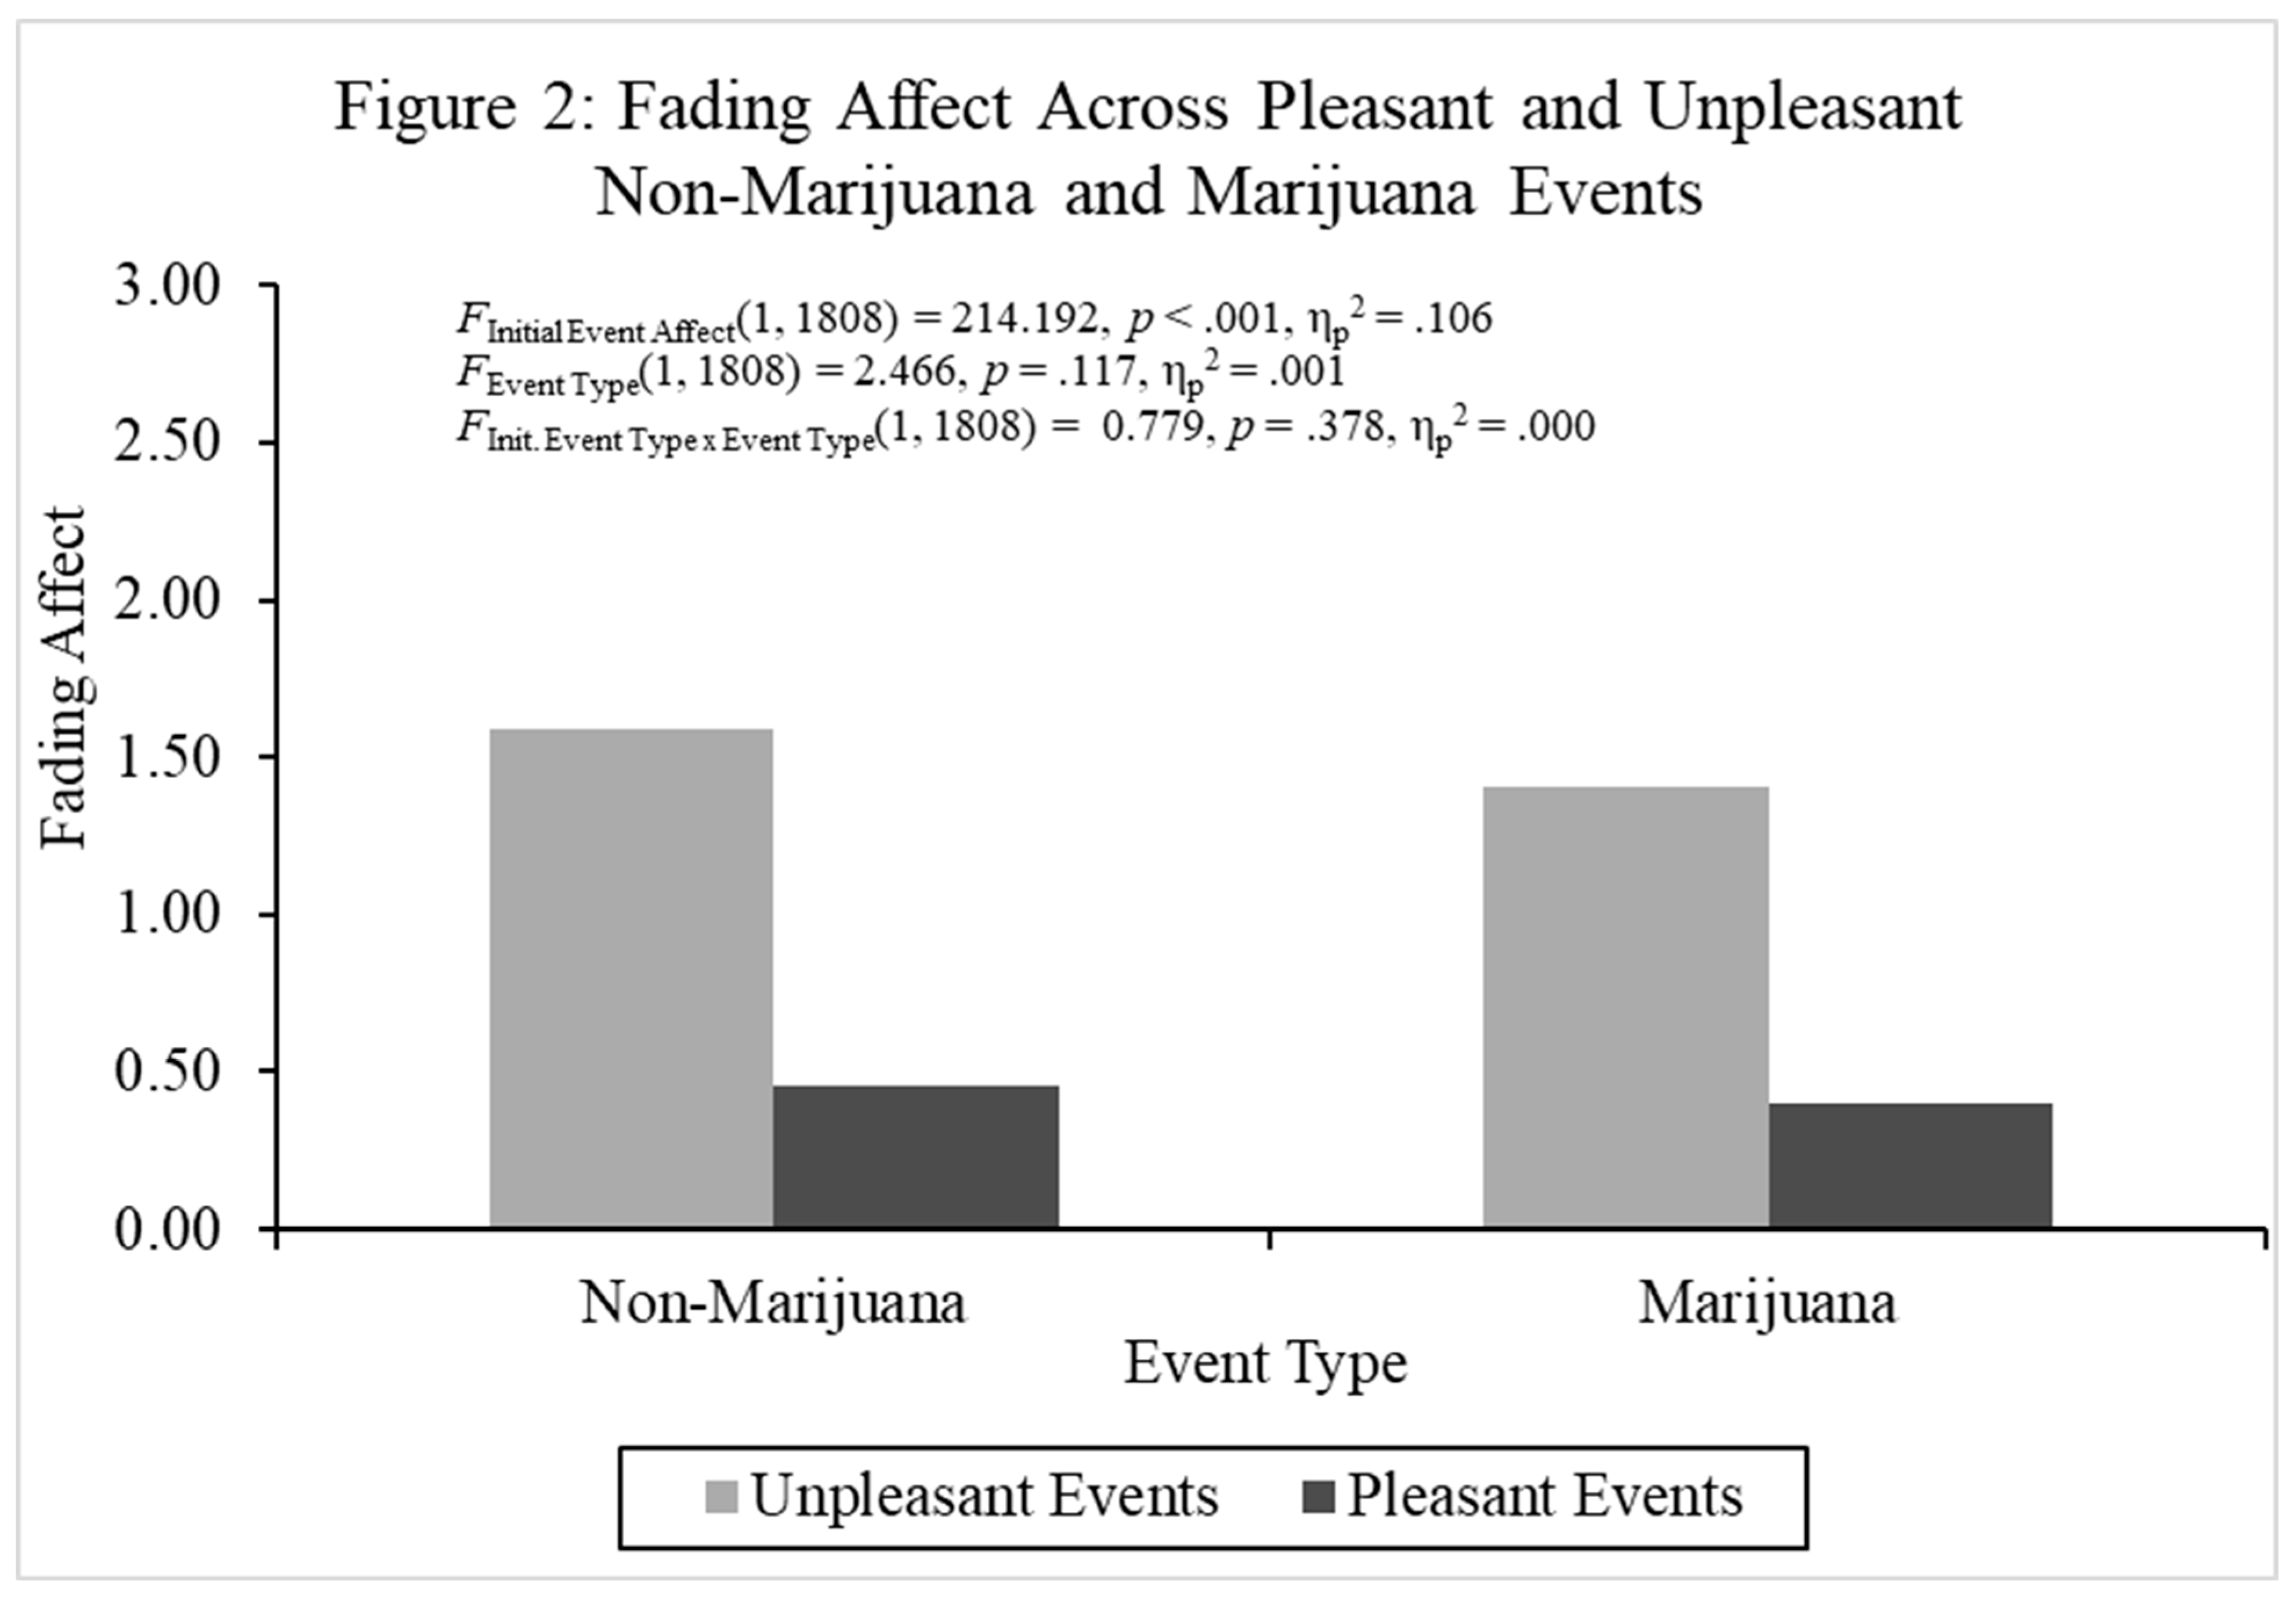
Figure 3.
Fading affect for pleasant and unpleasant events across quintiles (10th through 90th) of cognitive competence for Experiment 1.
Figure 3.
Fading affect for pleasant and unpleasant events across quintiles (10th through 90th) of cognitive competence for Experiment 1.
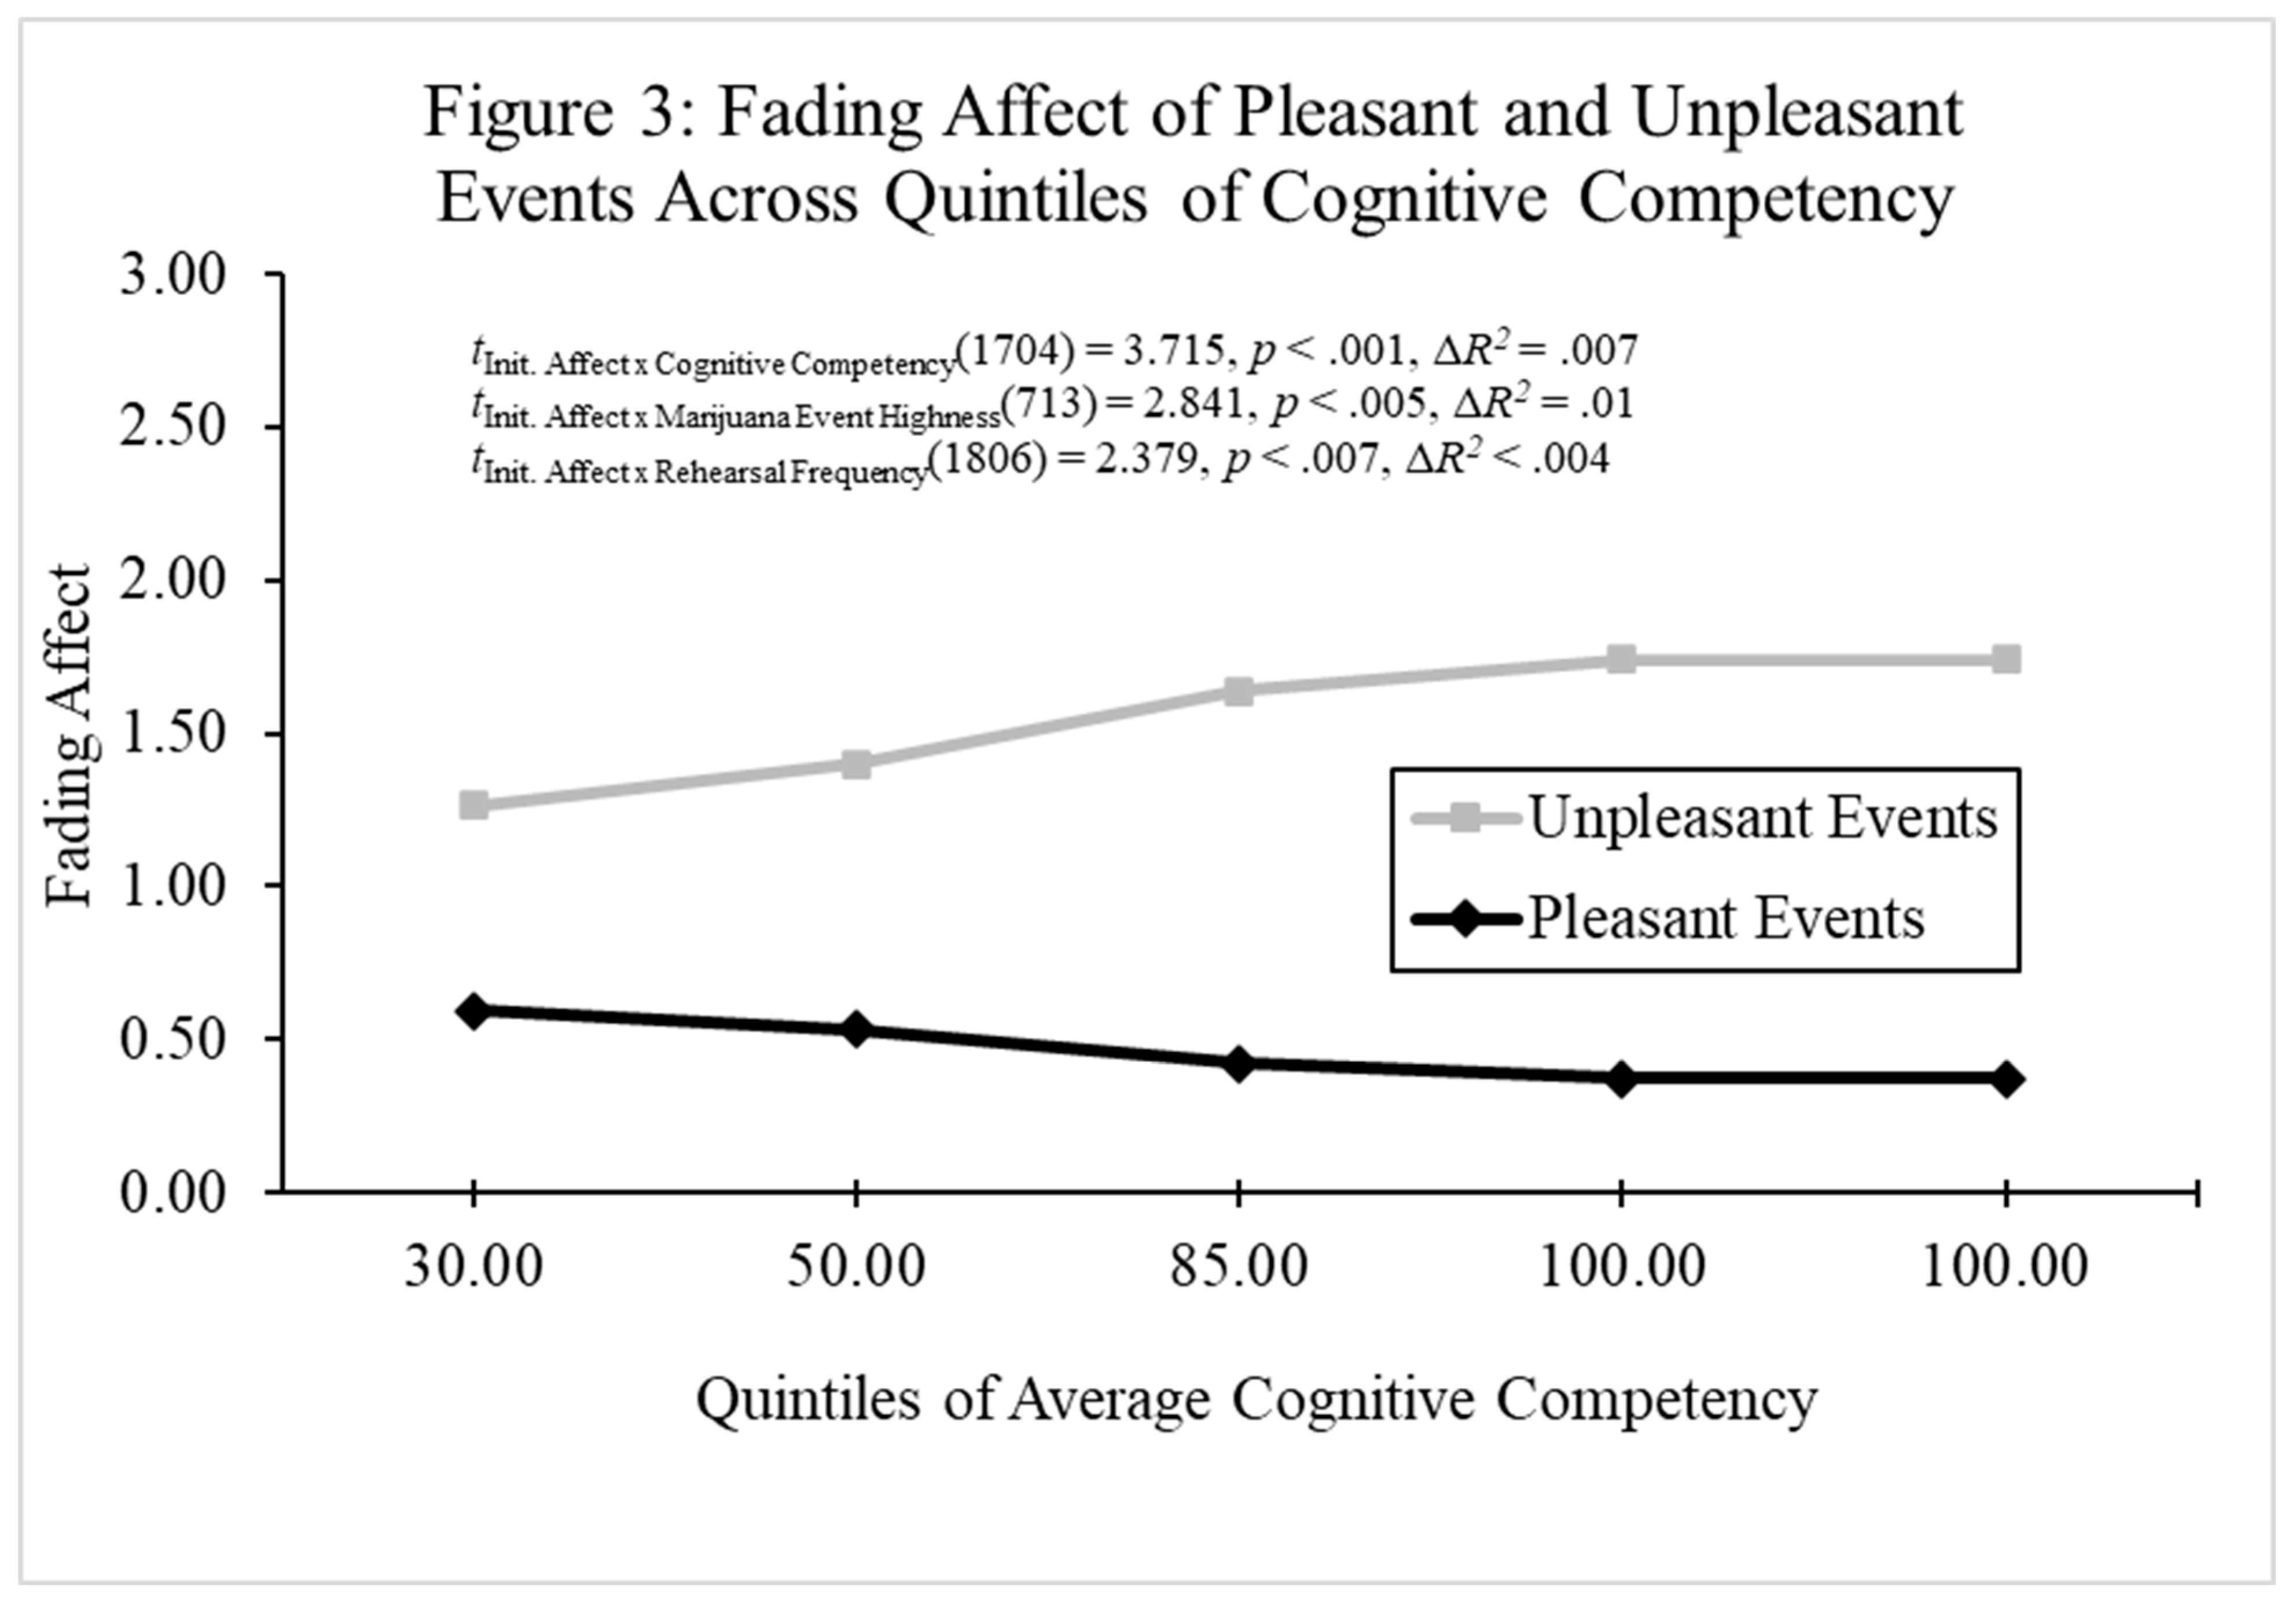
Figure 4.
Fading affect for pleasant and unpleasant events across quintiles (10th through 90th) of Negative PANAS for Experiment 1.
Figure 4.
Fading affect for pleasant and unpleasant events across quintiles (10th through 90th) of Negative PANAS for Experiment 1.
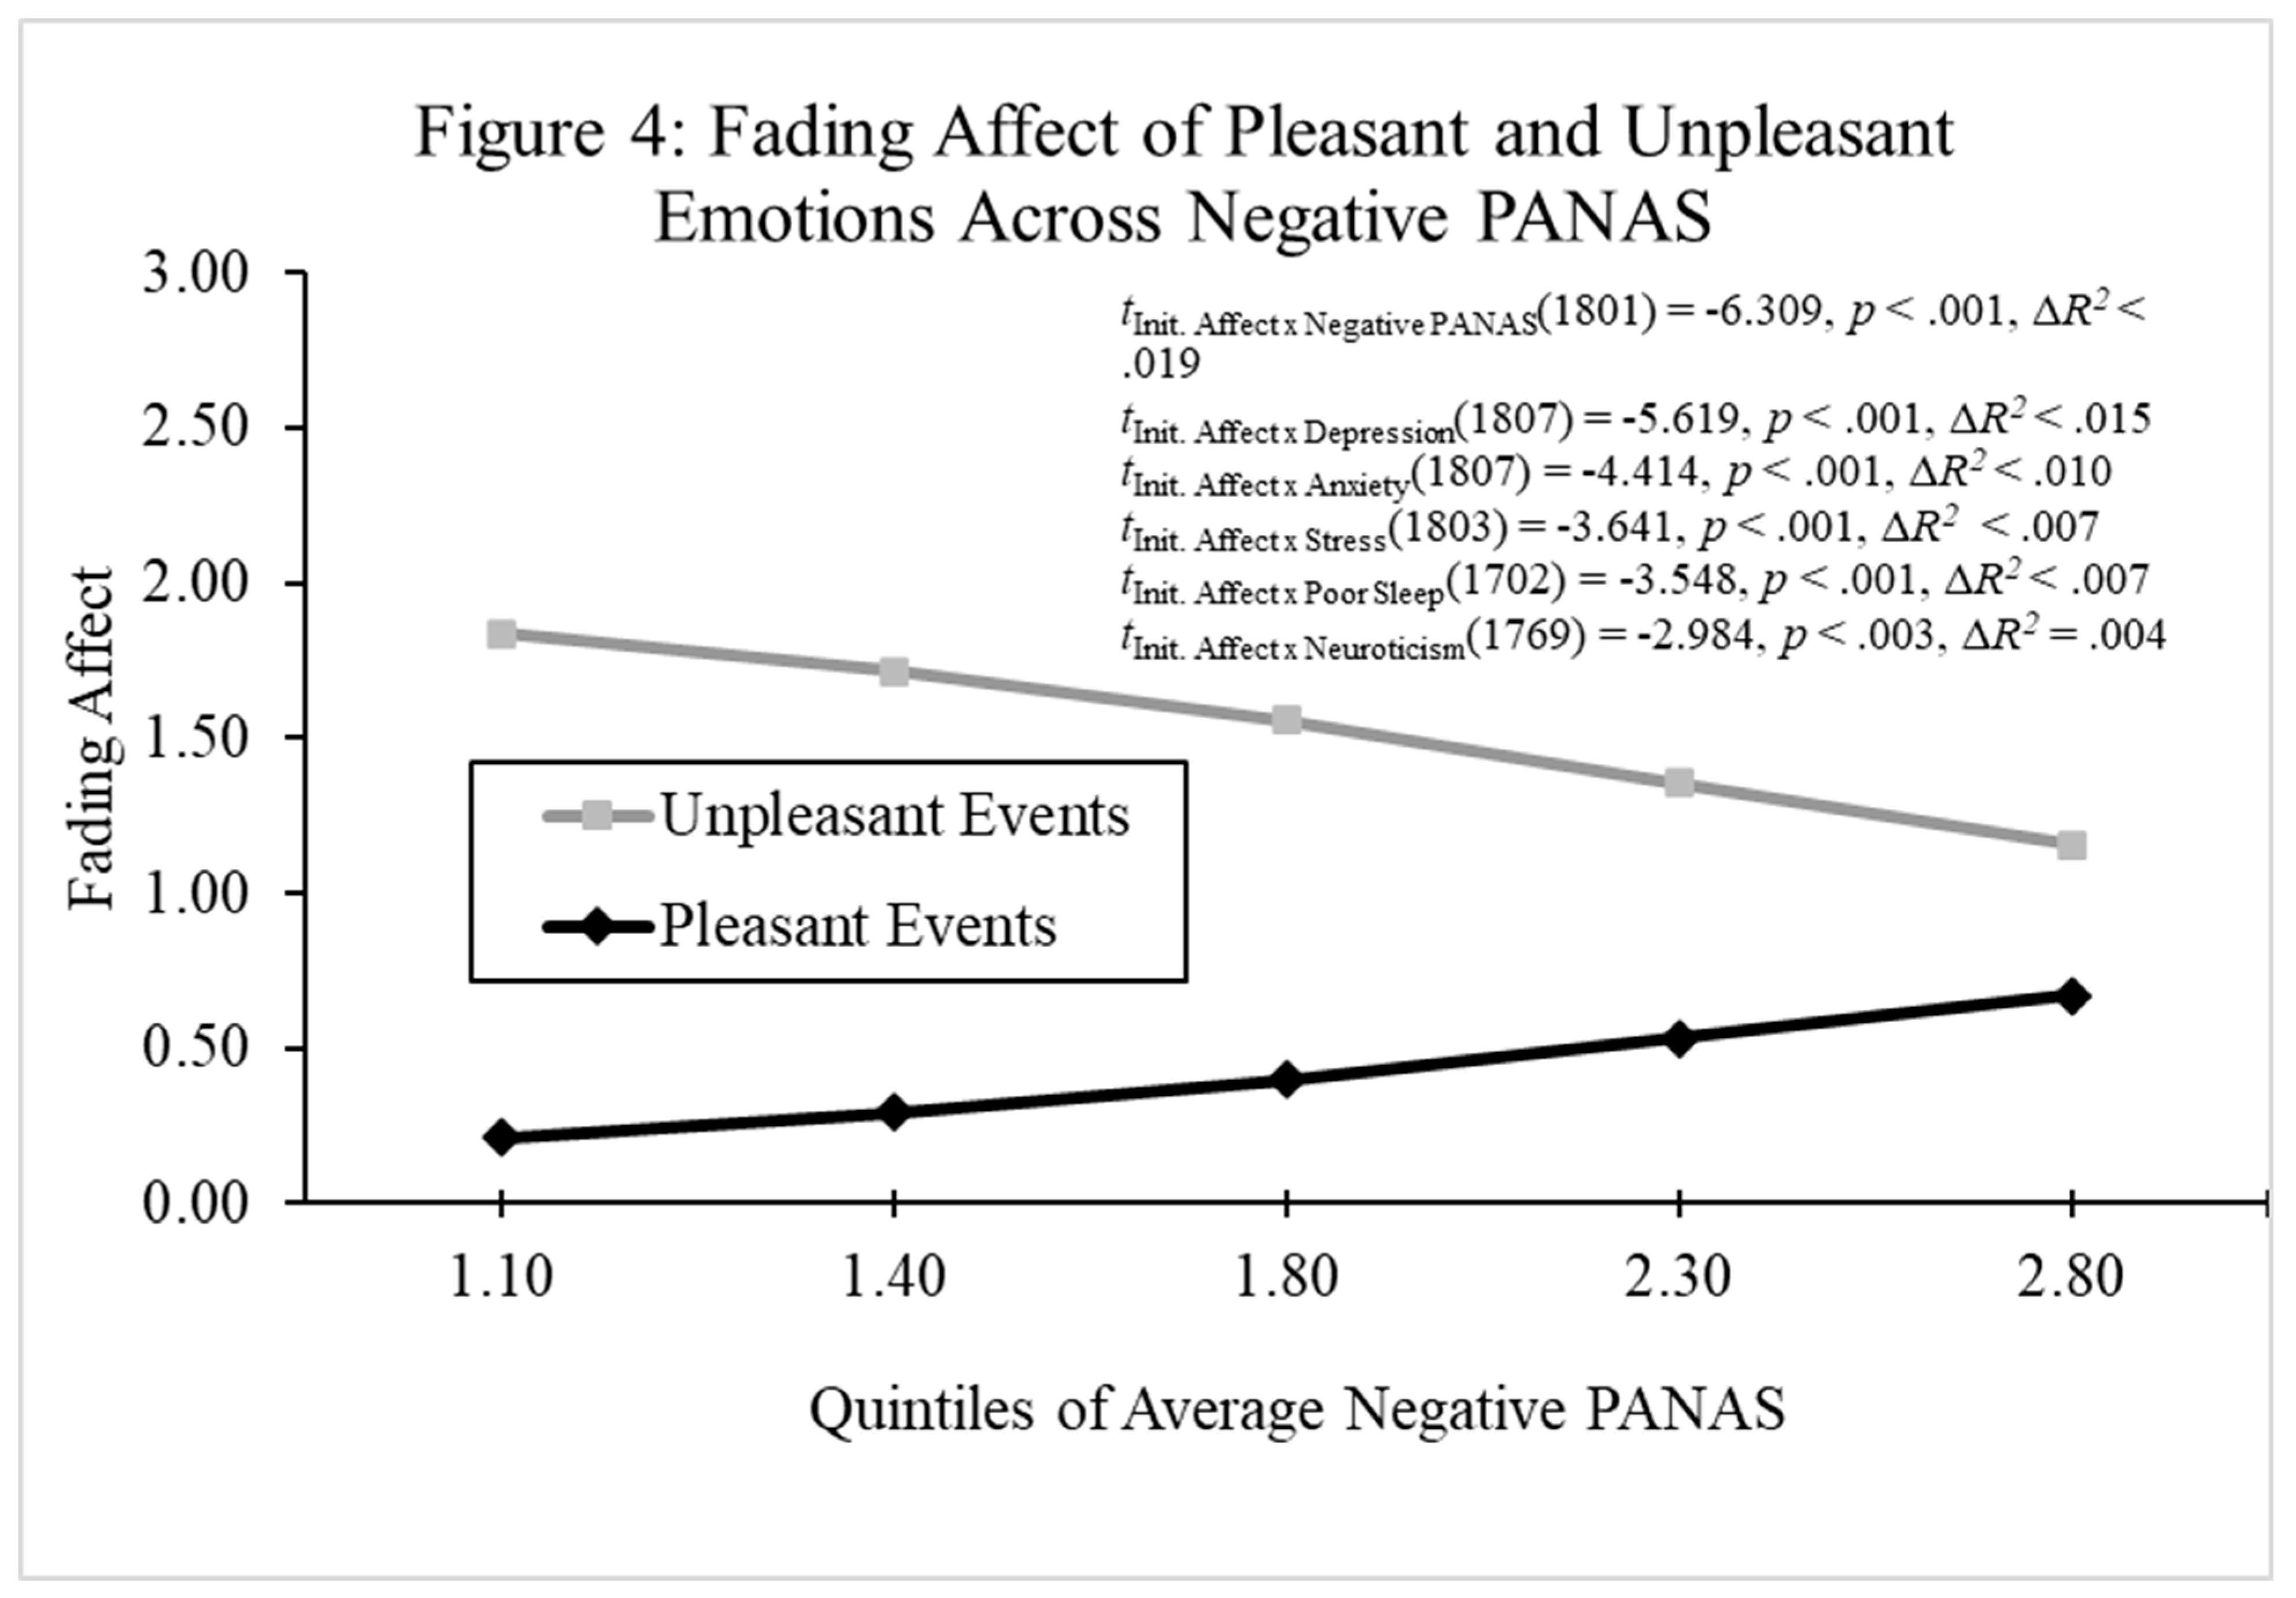
Figure 5.
Fading affect for pleasant and unpleasant marijuana and non-marijuana events across quintiles (10th through 90th) of daily marijuana hours for Experiment 1.
Figure 5.
Fading affect for pleasant and unpleasant marijuana and non-marijuana events across quintiles (10th through 90th) of daily marijuana hours for Experiment 1.
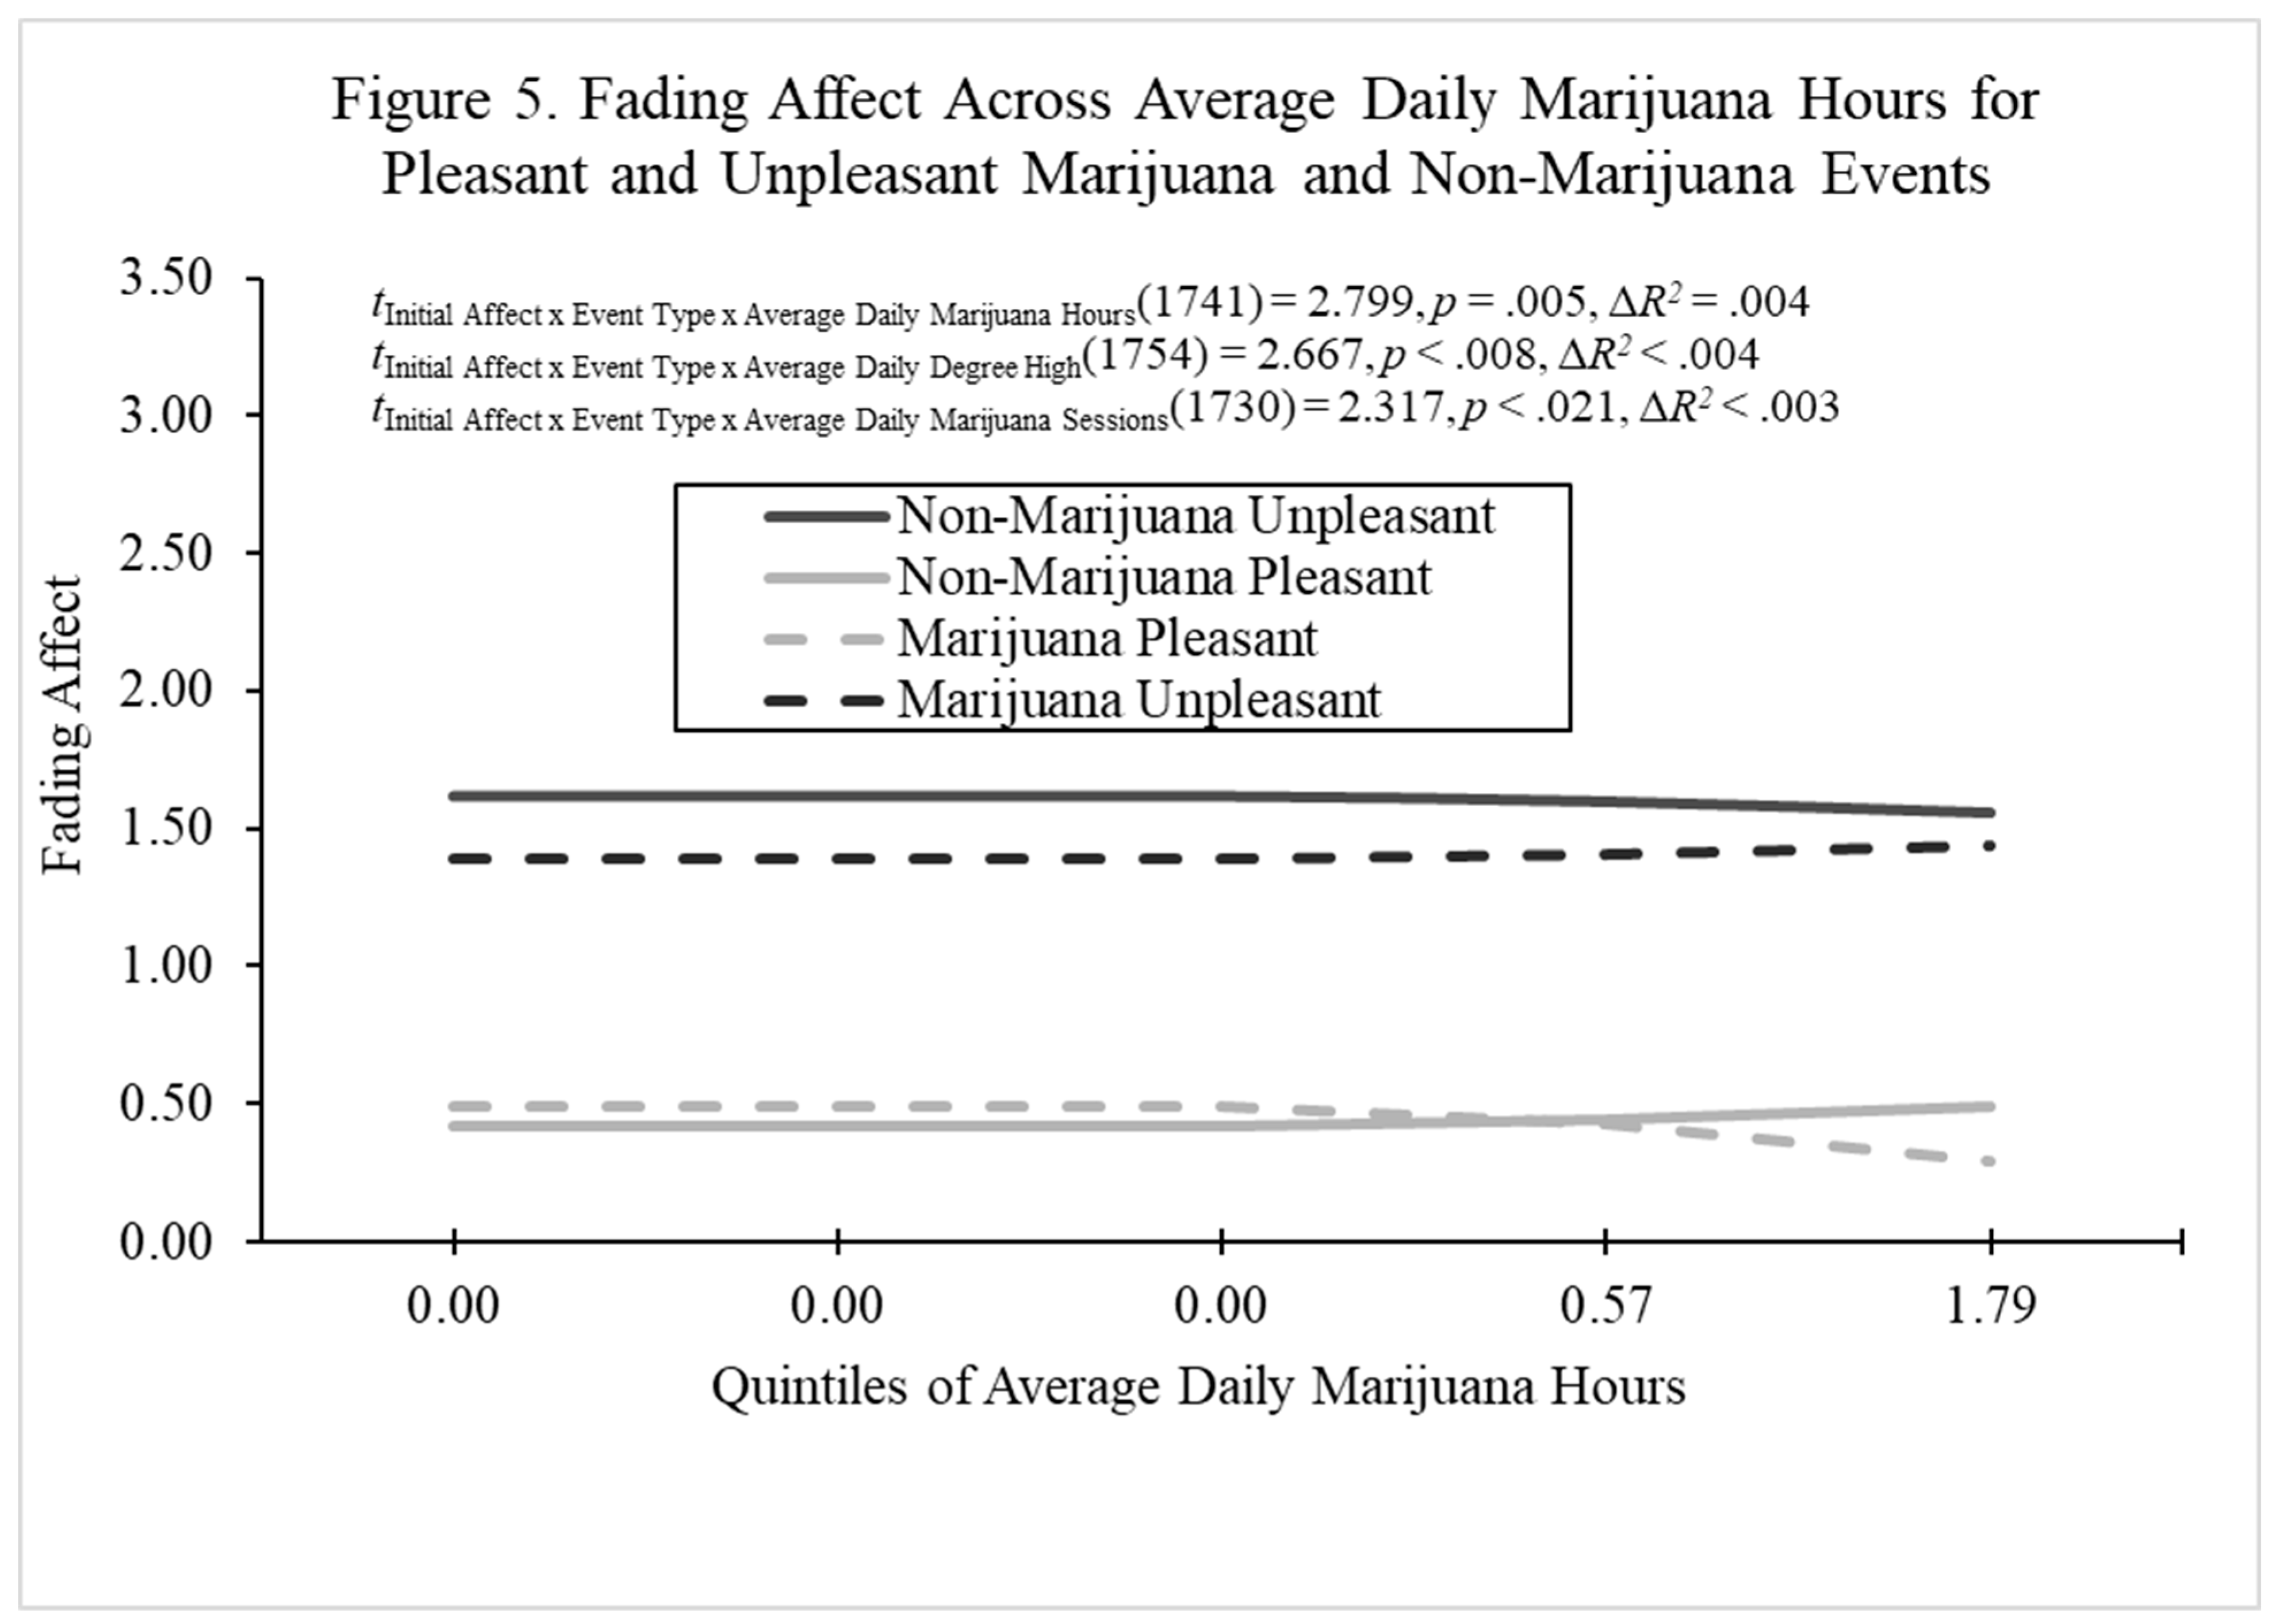
Figure 6.
Initial affect intensity for pleasant and unpleasant marijuana and non-marijuana events for Experiment 2.
Figure 6.
Initial affect intensity for pleasant and unpleasant marijuana and non-marijuana events for Experiment 2.
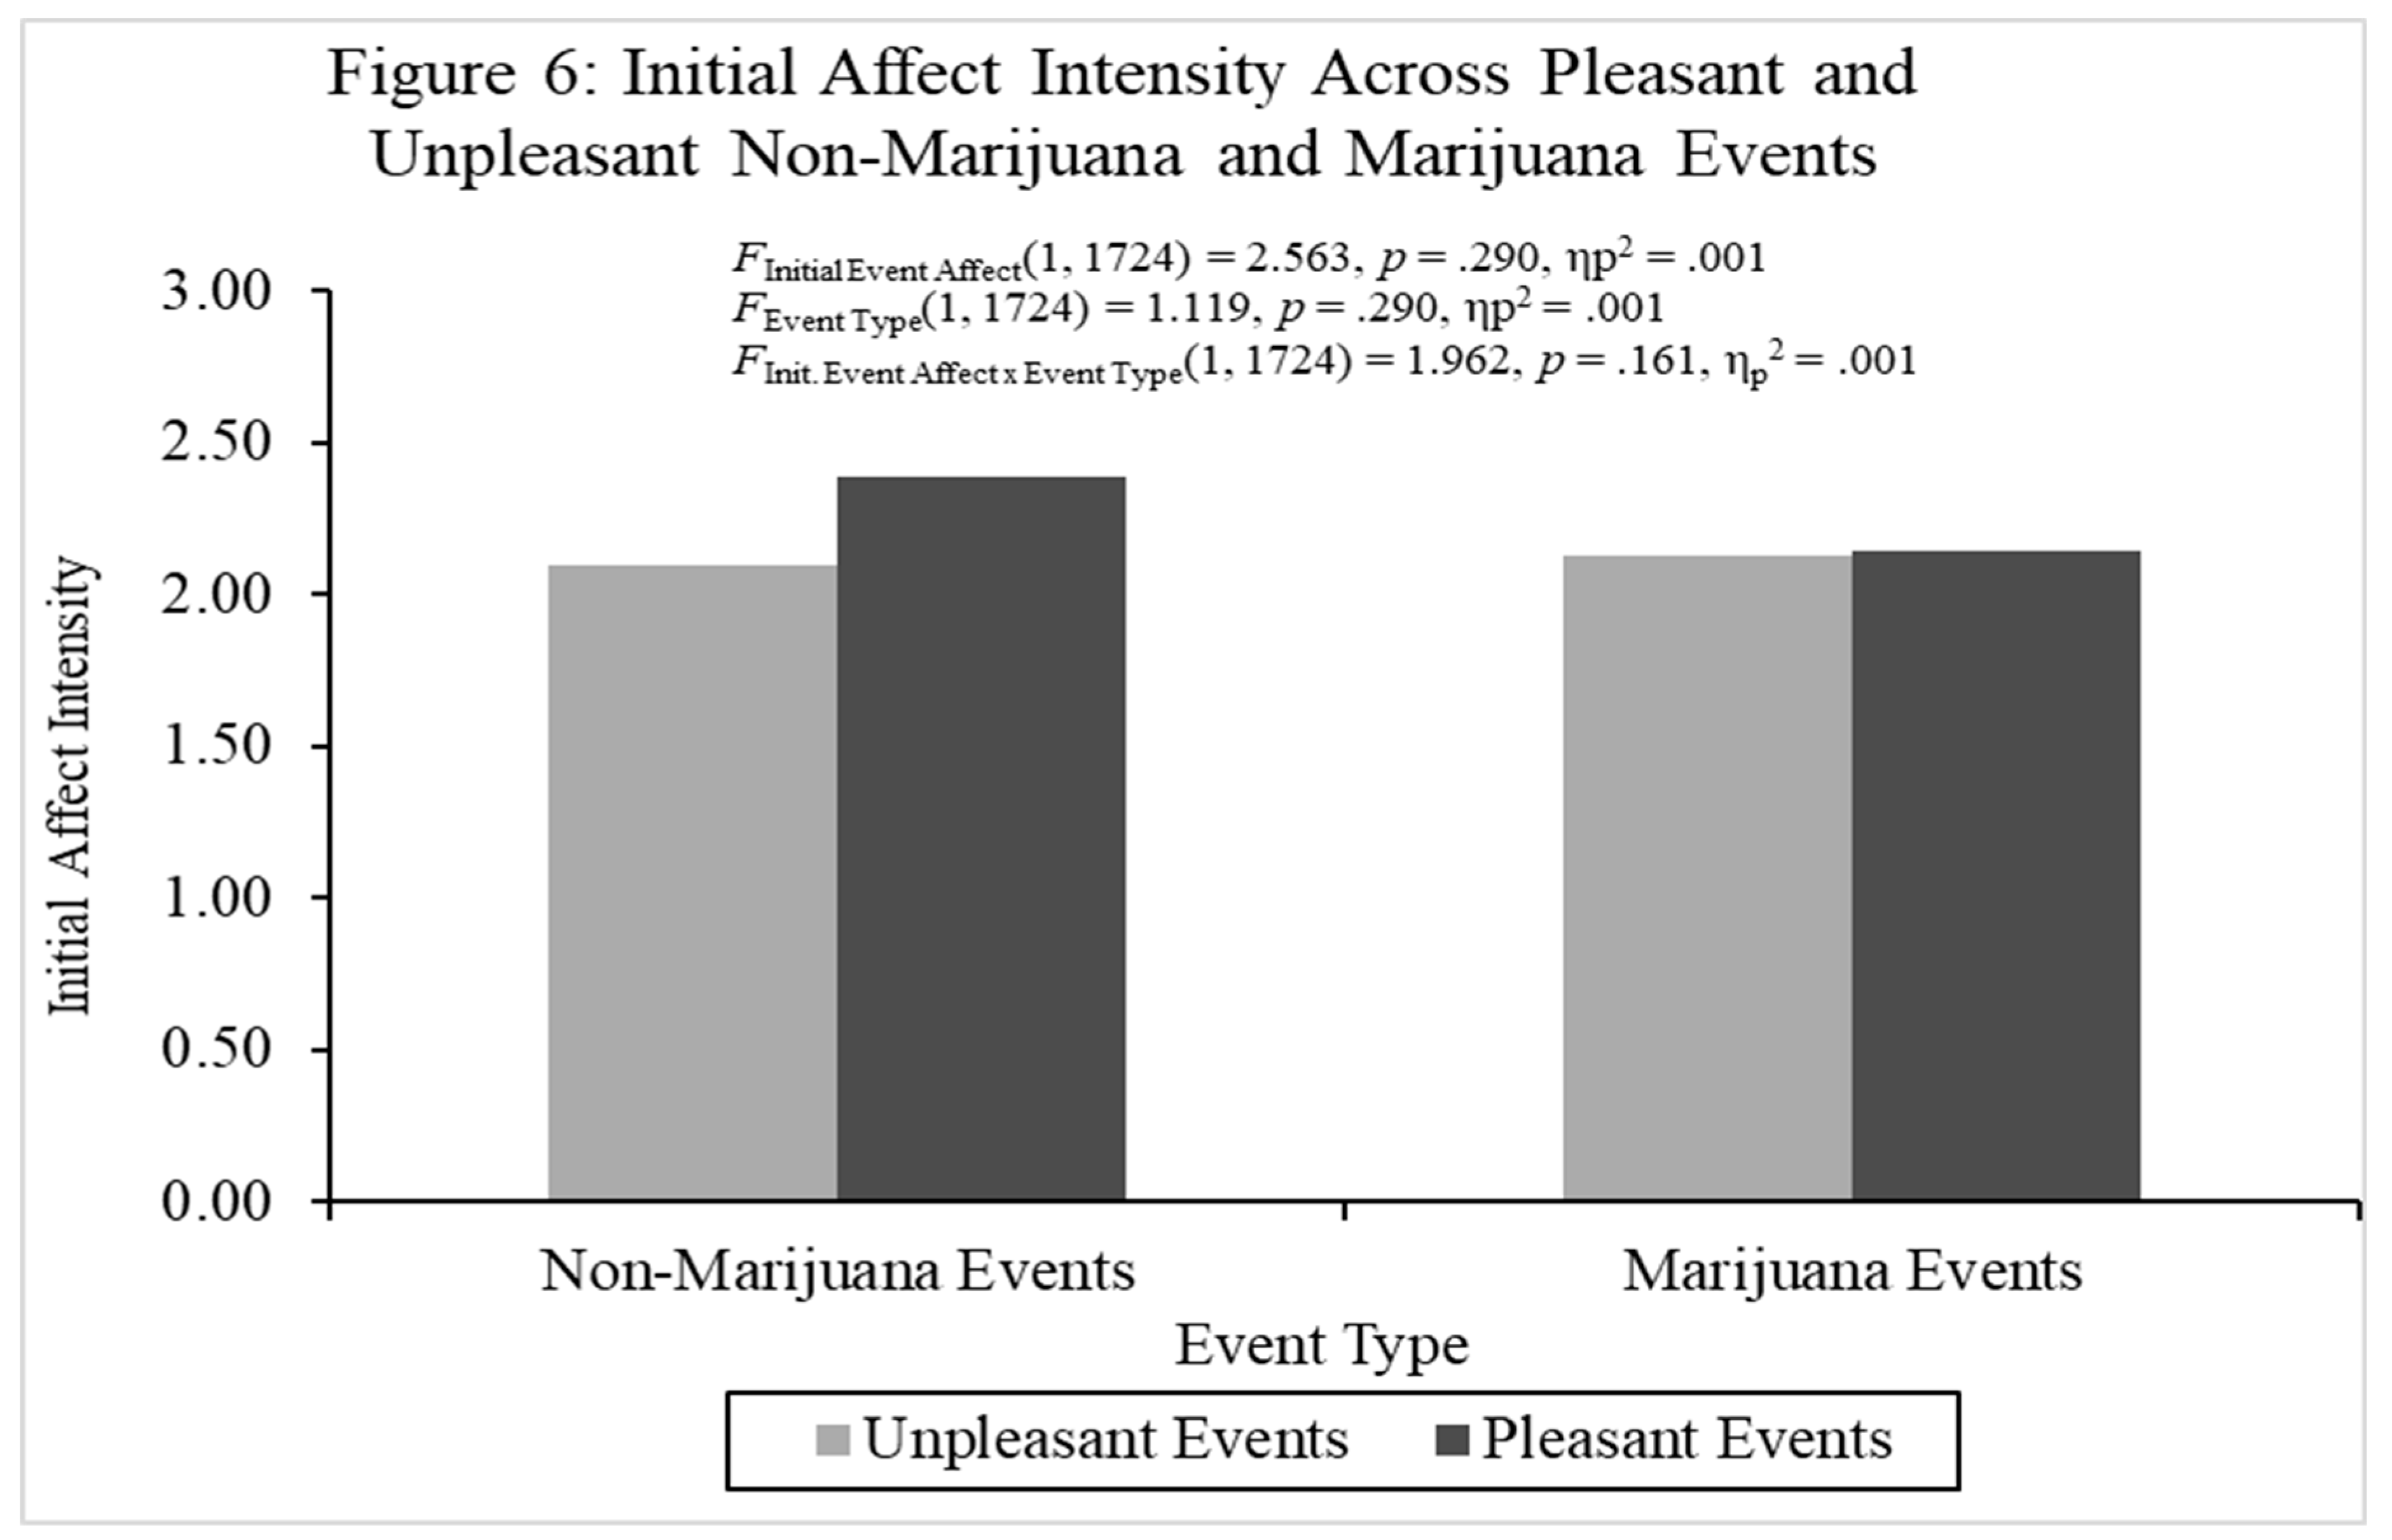
Figure 7.
Fading affect for pleasant and unpleasant marijuana and non-marijuana events for Experiment 2.
Figure 7.
Fading affect for pleasant and unpleasant marijuana and non-marijuana events for Experiment 2.
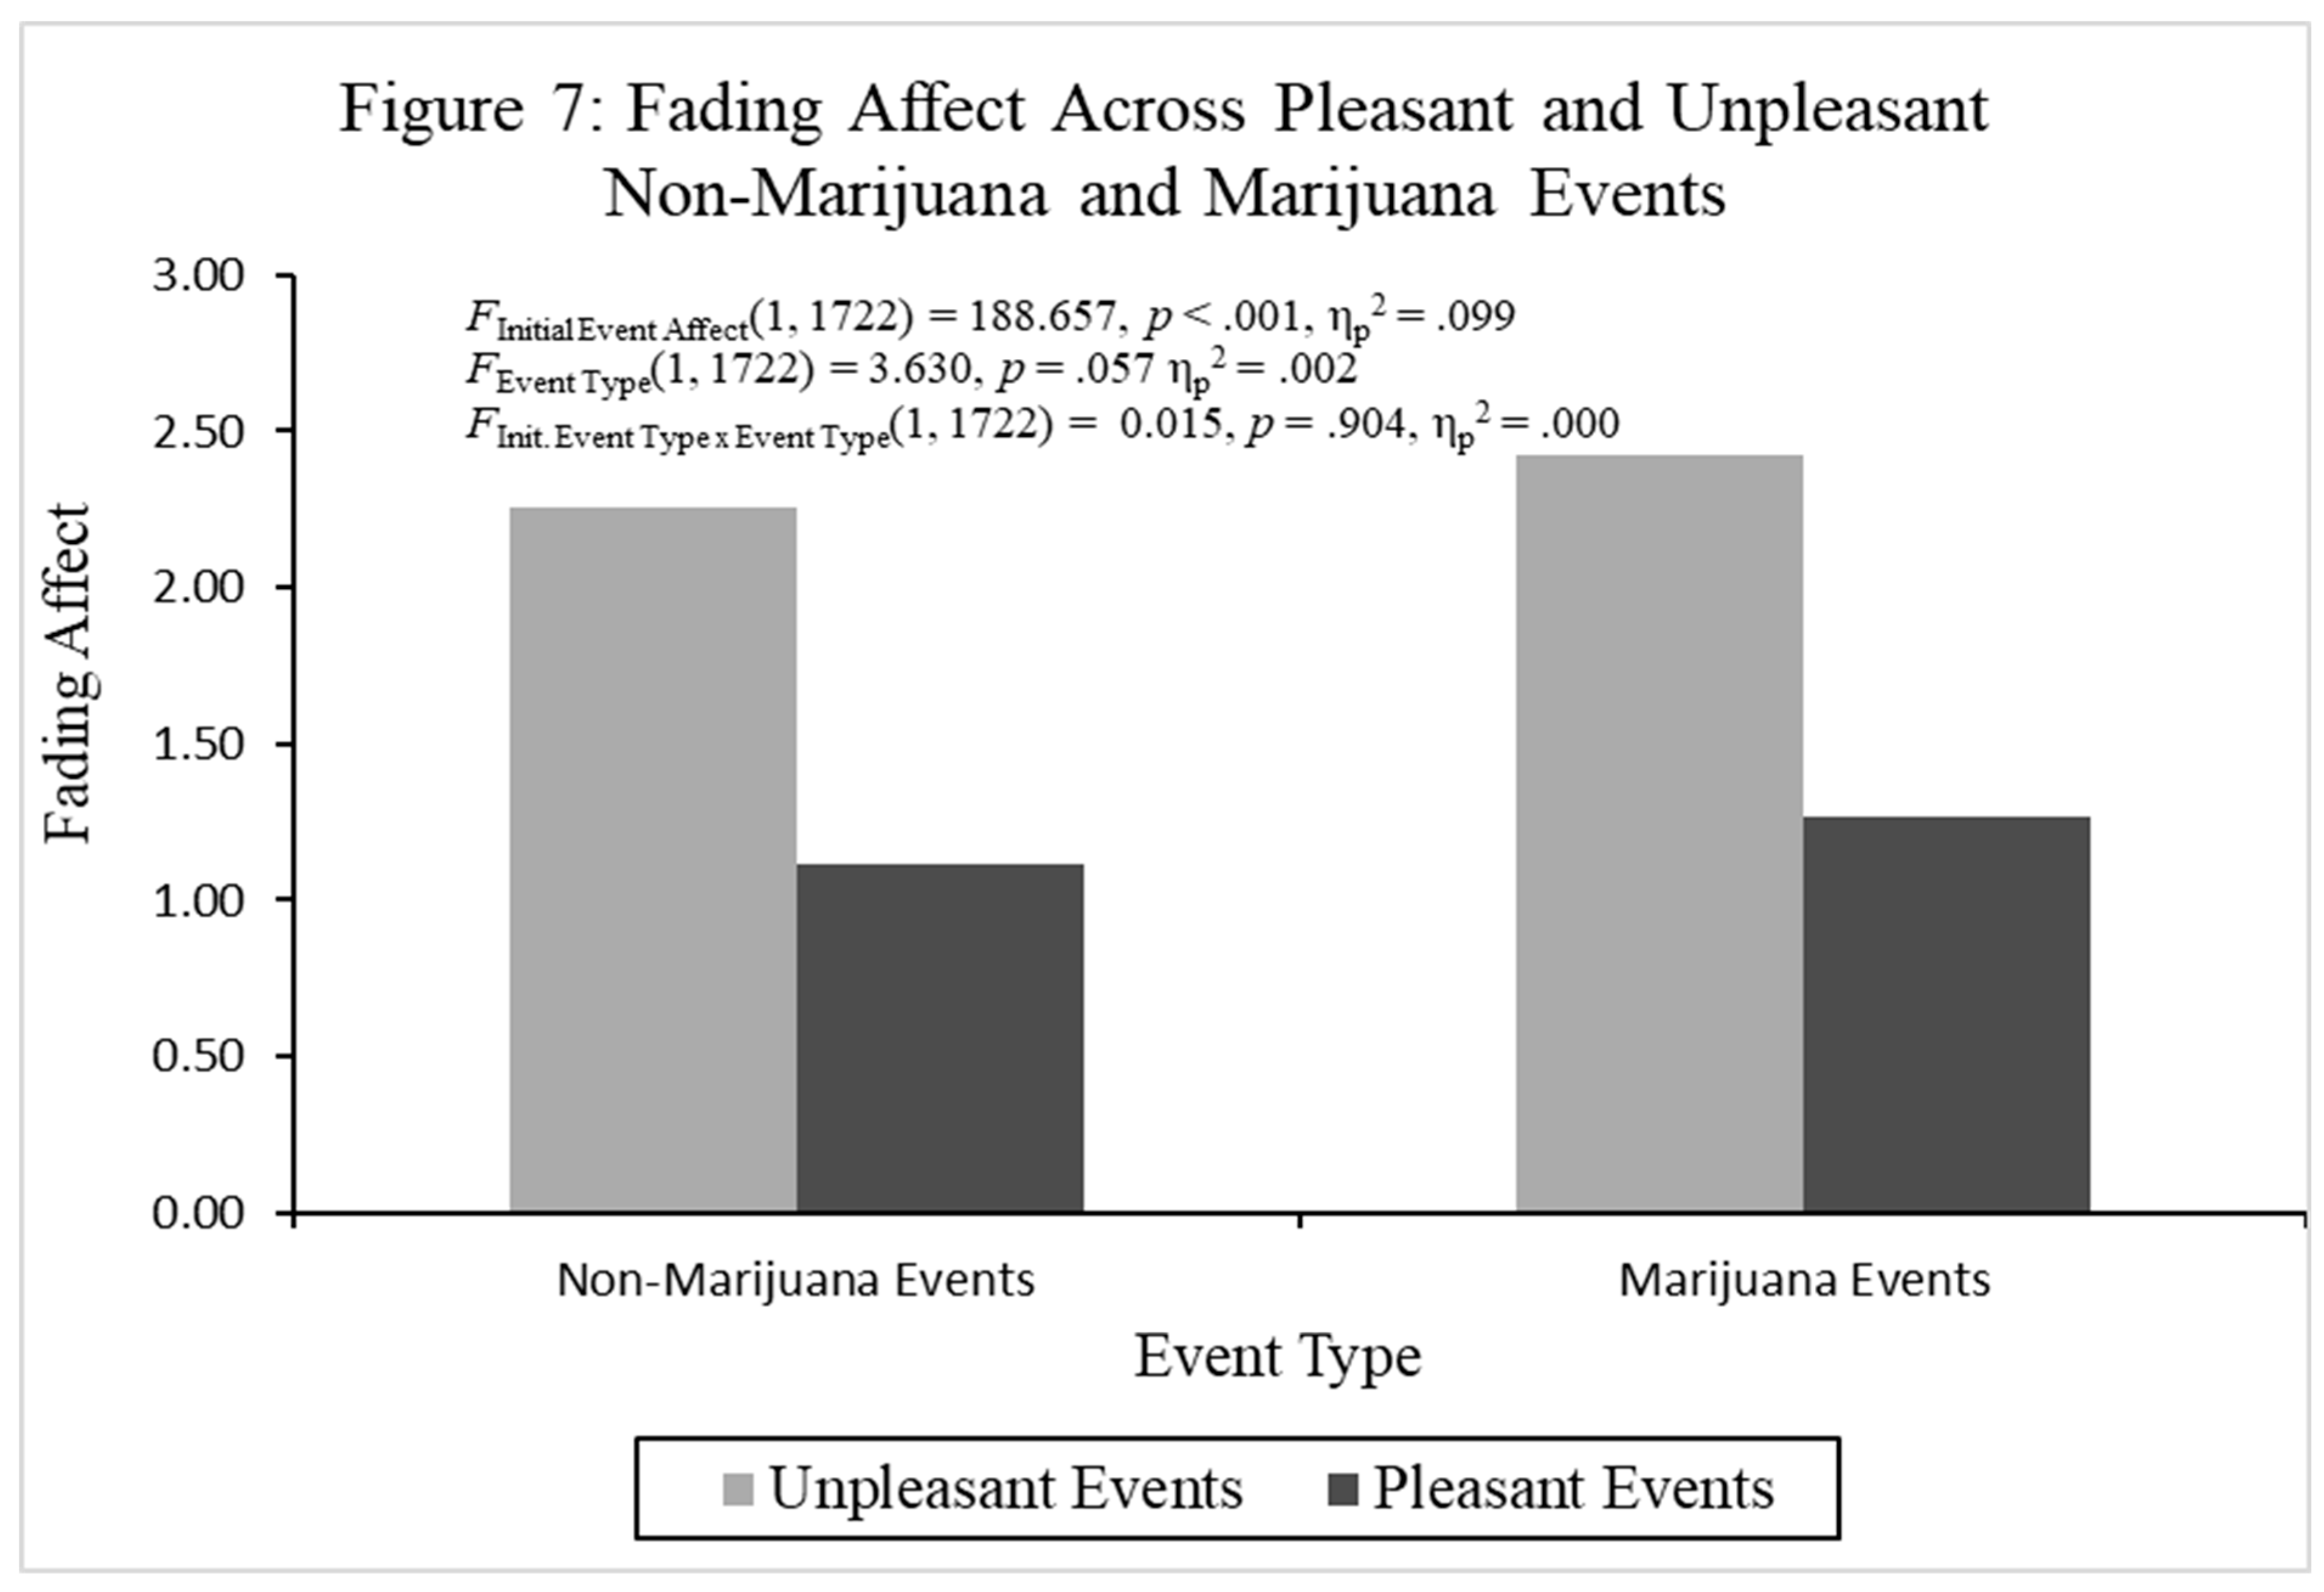
Figure 8.
Fading affect for pleasant and unpleasant events across quintiles (10th through 90th) of grit for Experiment 2.
Figure 8.
Fading affect for pleasant and unpleasant events across quintiles (10th through 90th) of grit for Experiment 2.
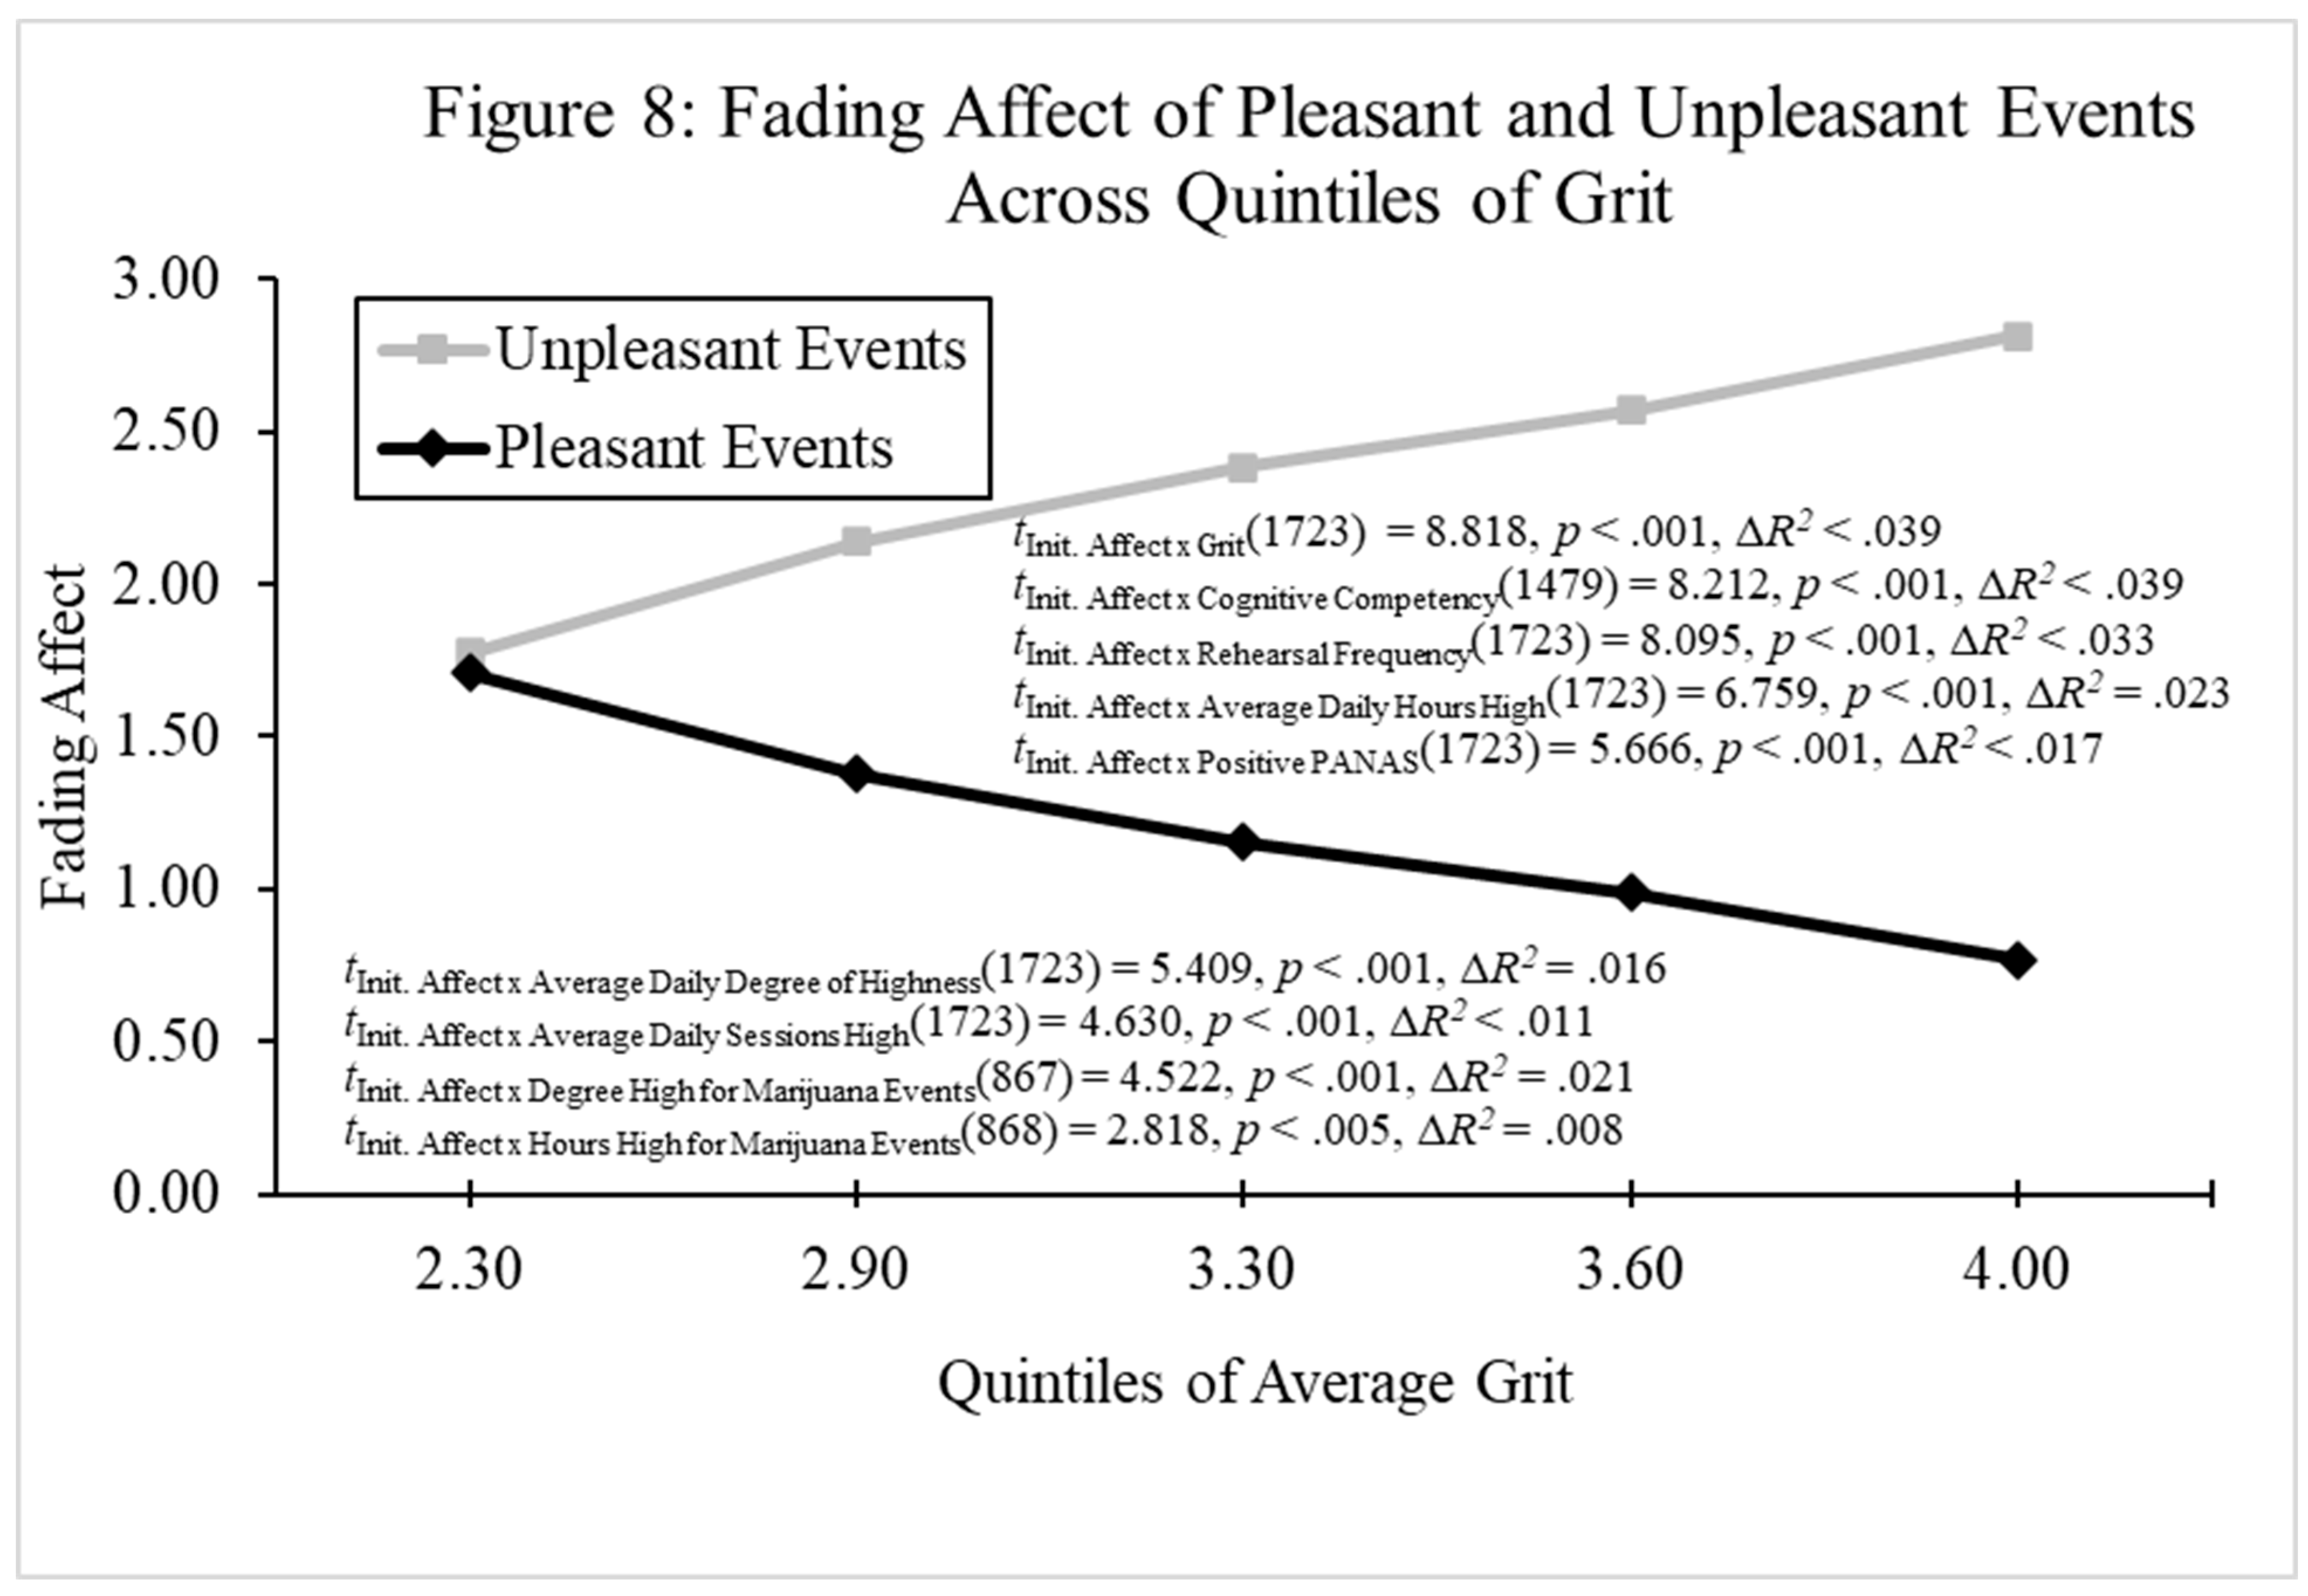
Figure 9.
Fading affect for pleasant and unpleasant events across quintiles (10th through 90th) of anxiety for Experiment 2.
Figure 9.
Fading affect for pleasant and unpleasant events across quintiles (10th through 90th) of anxiety for Experiment 2.
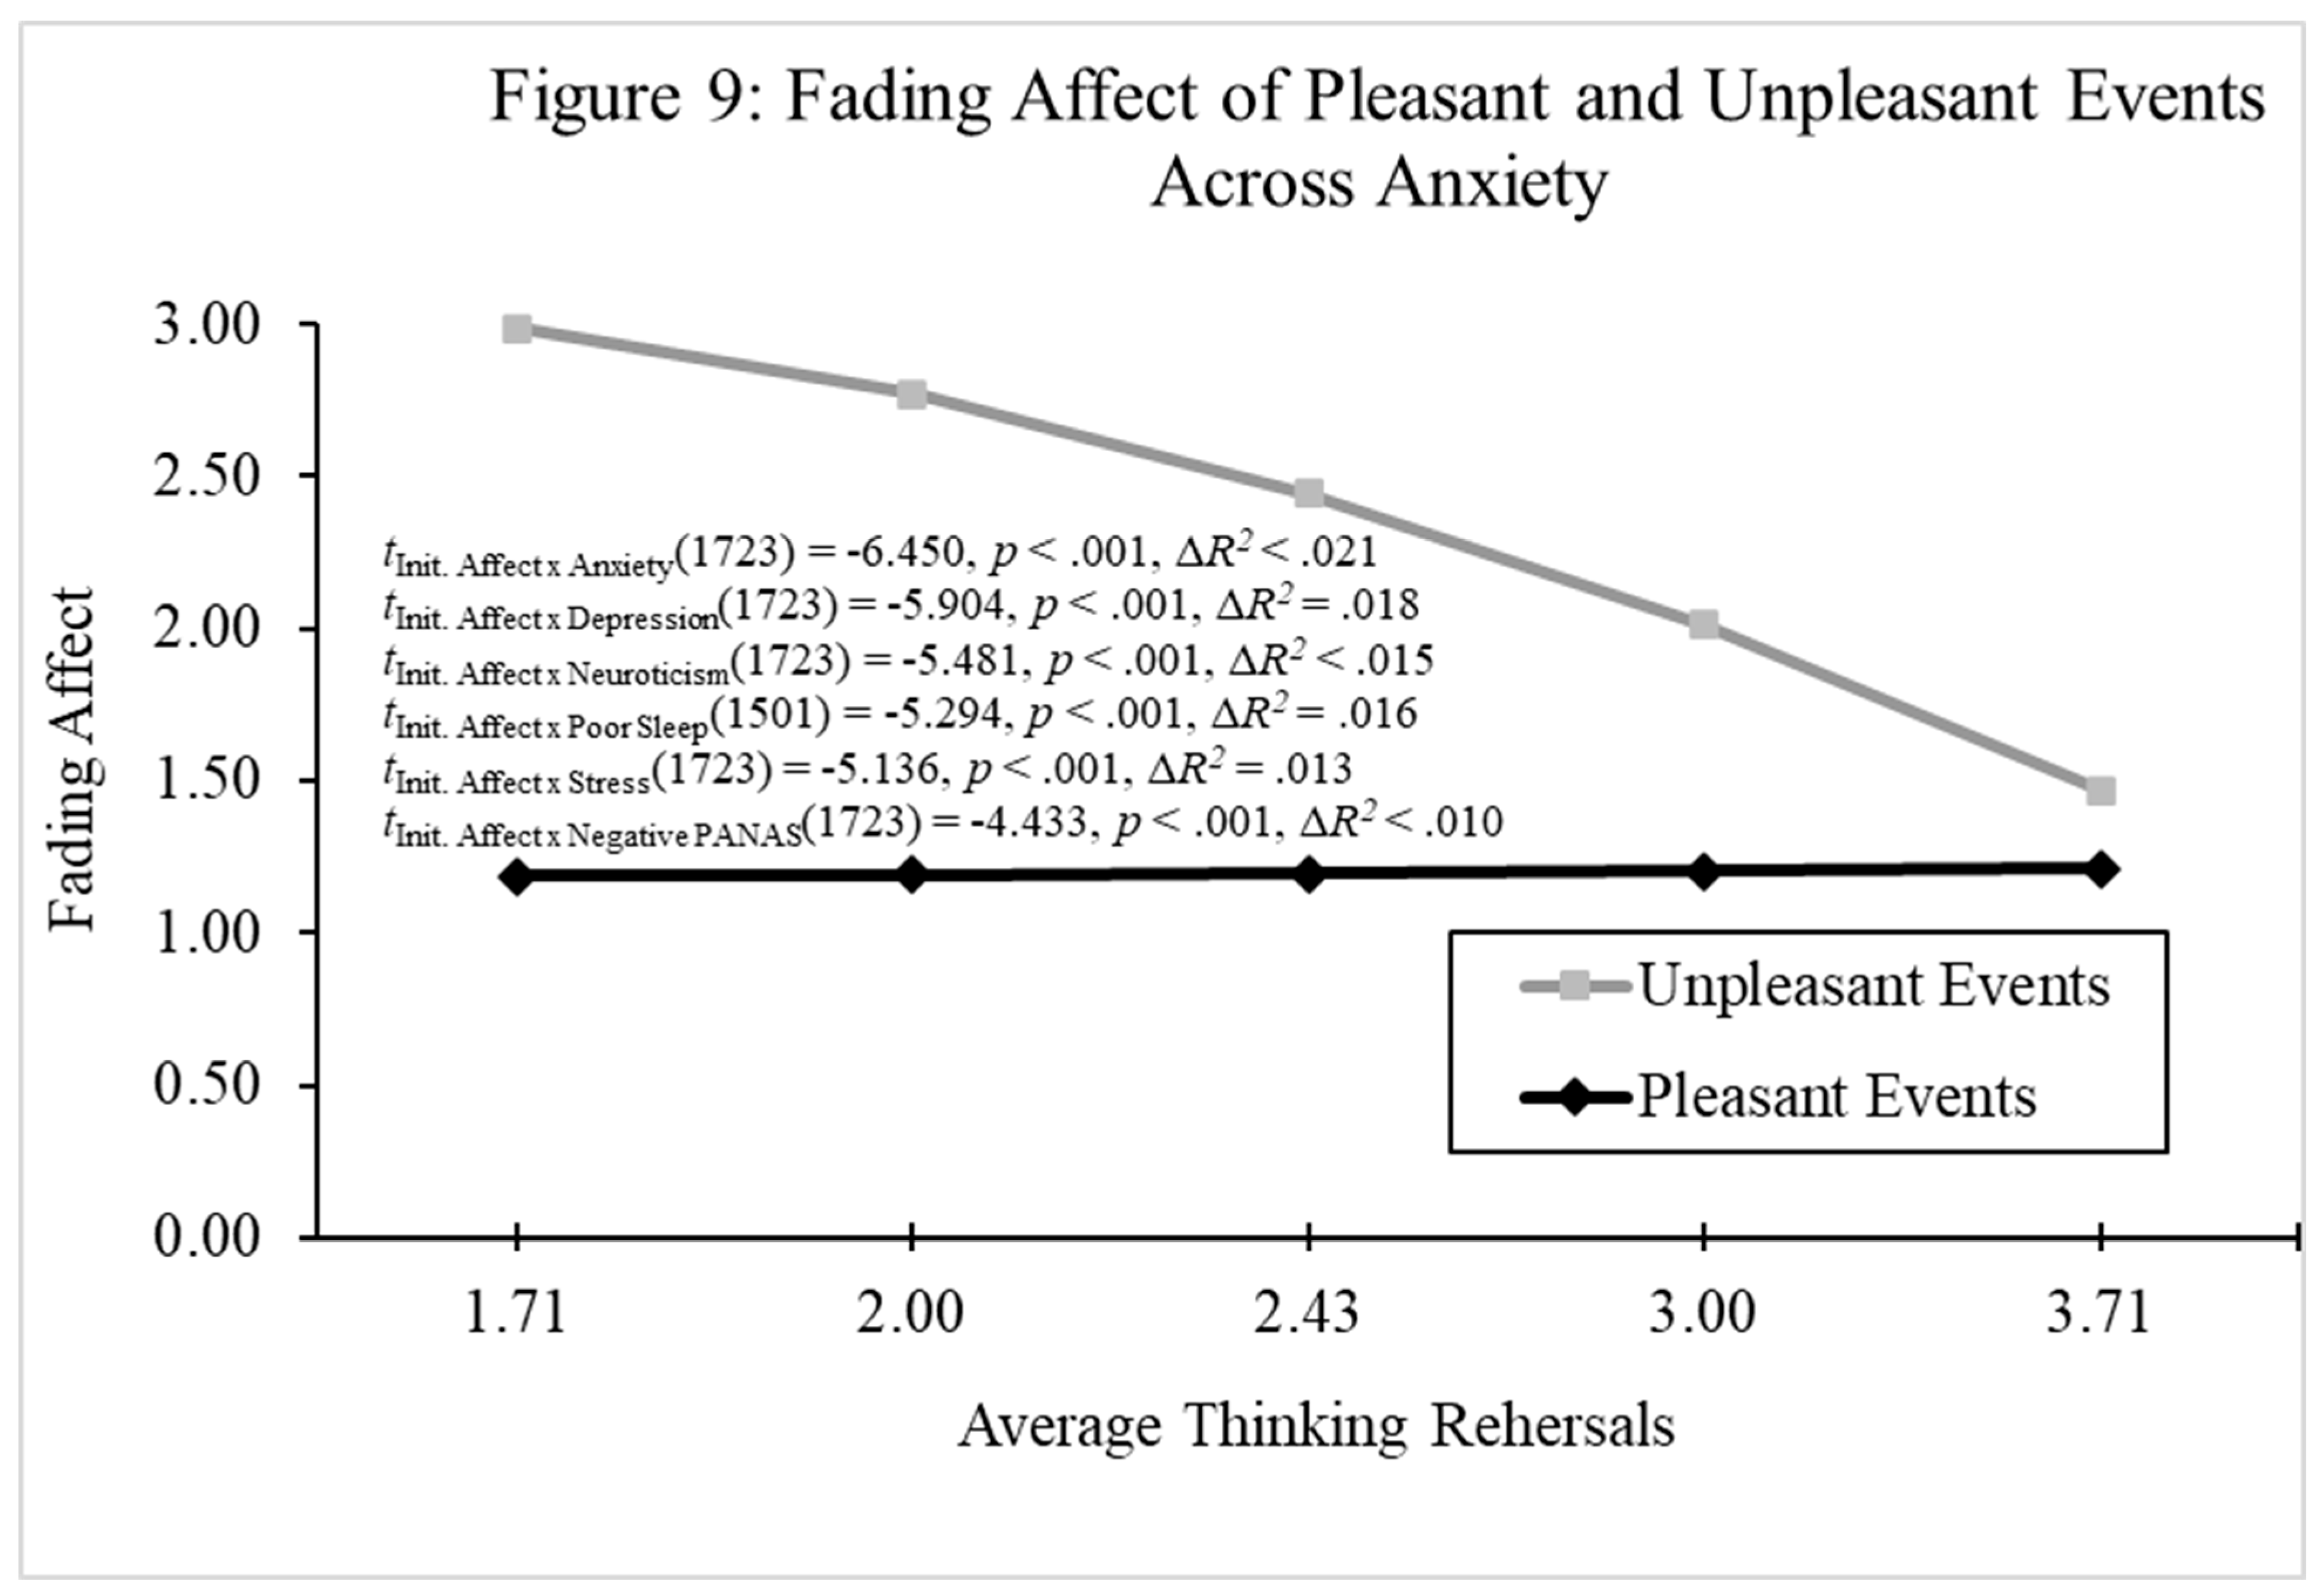
Figure 10.
Fading affect for pleasant and unpleasant events across quintiles (10th through 90th) of average daily degree high for Experiment 2.
Figure 10.
Fading affect for pleasant and unpleasant events across quintiles (10th through 90th) of average daily degree high for Experiment 2.

Figure 11.
Fading affect for pleasant and unpleasant events across quintiles (10th through 90th) of negative PANAS for Experiment 2.
Figure 11.
Fading affect for pleasant and unpleasant events across quintiles (10th through 90th) of negative PANAS for Experiment 2.
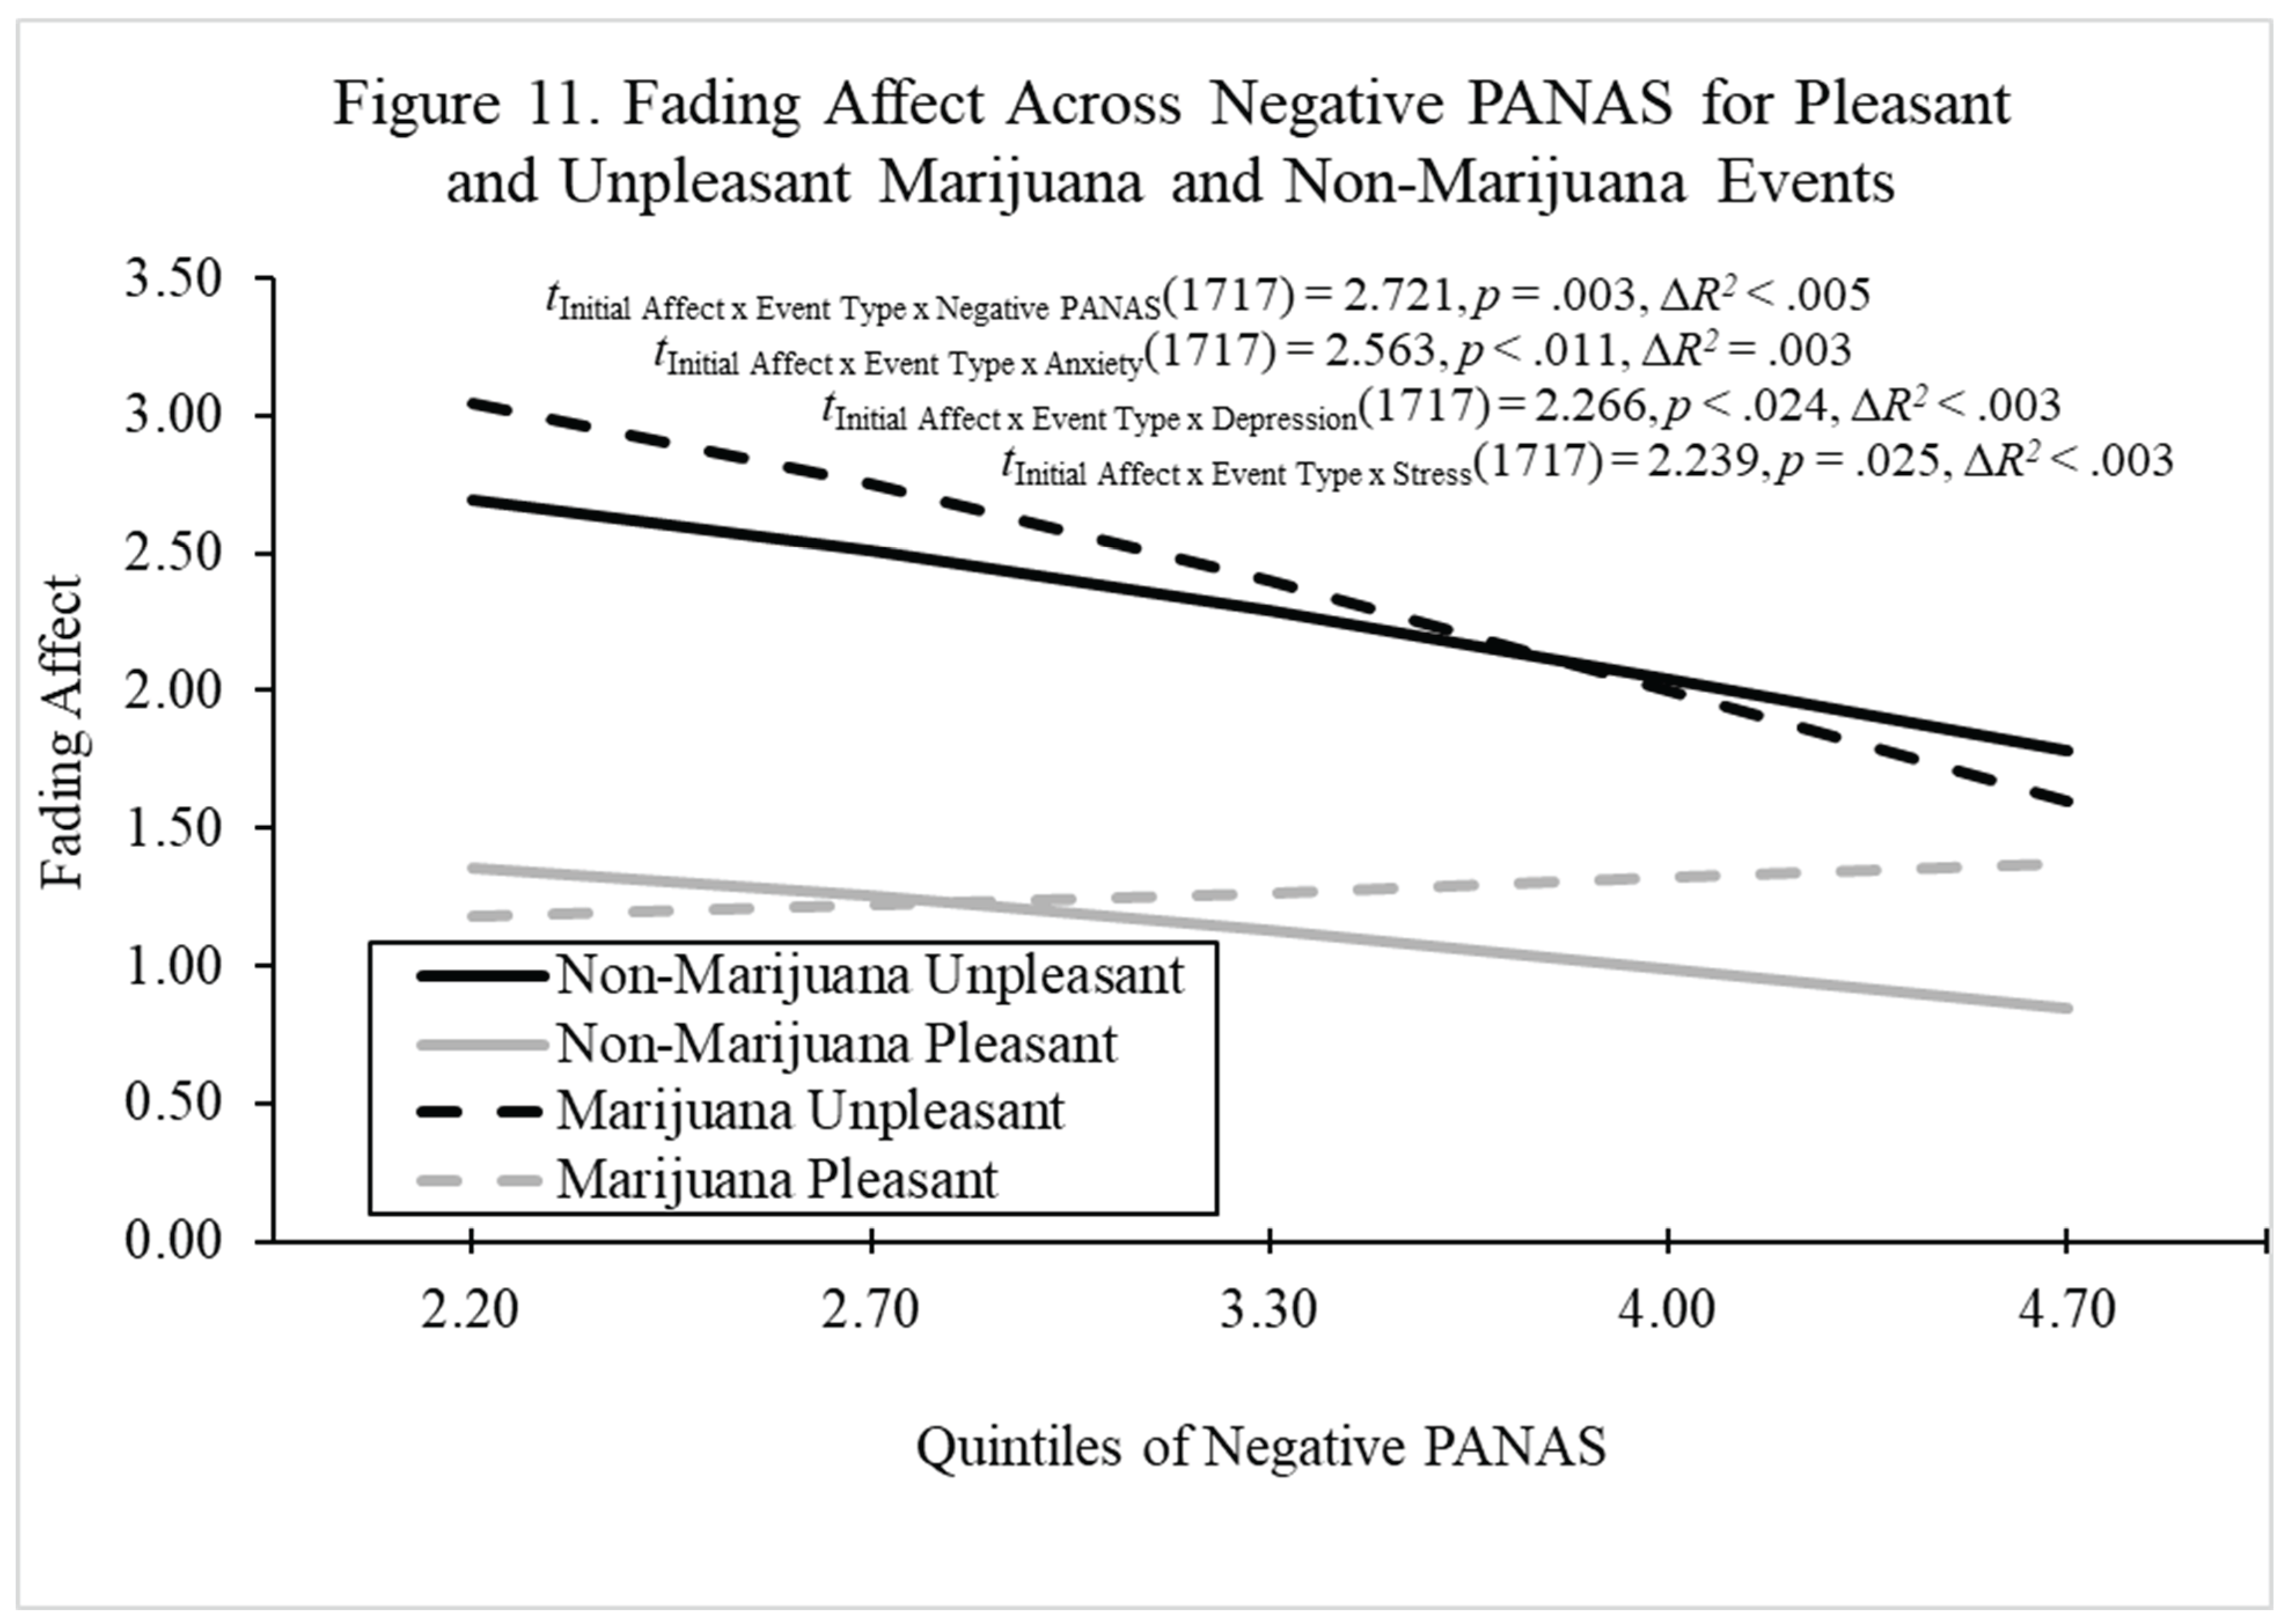
Disclaimer/Publisher’s Note: The statements, opinions and data contained in all publications are solely those of the individual author(s) and contributor(s) and not of MDPI and/or the editor(s). MDPI and/or the editor(s) disclaim responsibility for any injury to people or property resulting from any ideas, methods, instructions or products referred to in the content. |
© 2026 by the authors. Licensee MDPI, Basel, Switzerland. This article is an open access article distributed under the terms and conditions of the Creative Commons Attribution (CC BY) license (http://creativecommons.org/licenses/by/4.0/).
Copyright: This open access article is published under a Creative Commons CC BY 4.0 license, which permit the free download, distribution, and reuse, provided that the author and preprint are cited in any reuse.


