
Submitted:
03 February 2026
Posted:
04 February 2026
You are already at the latest version
Abstract
Seed germination and early root growth are decisive for crop establishment, yet responses to ionic environments can be strongly genotype-dependent. This study evaluated the effect of supplementing an agar-based in vitro system with a commercial NPK fertilizer on the germination dynamics and early morphometry of Raphanus sativus L. Three commercial varieties were tested (Agrosad, AS; Agrícola Santo Domingo, ASD; Garden Elite, GE) under two media: 1.5% agar without fertilizer (A) and 1.5% agar + NPK fertilizer at 3 g/L (AF), using a completely randomized 3×2 factorial design. Germination was recorded at 24, 48, and 72 h to compute final germination (%G), mean germination time (MGT), germination speed index (IVG), and coefficient of velocity of germination (CVG); root length was measured at 72 h. MANOVA (Pillai’s trace) indicated significant effects of Variety, Fertilization, and their interaction, confirming that fertilizer responses depended on genotype. While AS and GE maintained high %G (>88%) under AF, fertilization generally delayed germination (higher MGT) and reduced vigor (lower IVG). ASD showed the strongest inhibition, with %G dropping from 88.89% (A) to 25.93% (AF) and the lowest IVG (1.23). Root elongation was significantly reduced by fertilization in ASD and GE, whereas AS exhibited consistently shorter roots with no significant response. PCA summarized 86.36% of the total variance in the first two components, separating treatments along a vigour/architecture axis (IVG and root length positive; MGT negative) and a germination capacity axis (%G), and hierarchical clustering identified five response groups. Overall, a low-cost agar + fertilizer system effectively discriminated genotype-specific sensitivity to an ionic environment during early establishment, highlighting the need to consider variety-dependent thresholds when using commercial fertilizers for in vitro screening.
Keywords:
Raphanus sativus
; seed germination
; in vitro assay
; PCA
; phenotyping
1. Introduction
Seed germination and early seedling establishment represent a critical phase in the plant life cycle because they concentrate largely irreversible physiological decisions—metabolic reactivation, seed-cover weakening, radicle protrusion, and initial tissue differentiation—that ultimately shape seedling vigour and the probability of successful establishment. These processes are governed by the interplay between the internal status of the seed (developmental maturity, reserve mobilization capacity, membrane integrity, and dormancy level) and external drivers such as temperature, water availability, oxygen supply, and the ionic composition of the surrounding medium [1,2,3,4].
Among environmental factors, temperature is a primary regulator of germination rate and uniformity and can generate contrasting responses even within horticultural species when other conditions are held constant [5]. Therefore, seed performance is typically evaluated not only by final germination but also by the speed of emergence, which is closely related to subsequent establishment under practical conditions [6]. In addition, variation among commercial lots and varieties can be amplified by differences in seed ageing and survival, affecting both viability and early performance even before visible emergence occurs [7].
Although final germination percentage is widely used as a quality indicator, it is often insufficient to describe real seed lot performance: different treatments may reach similar final values but exhibit distinct temporal dynamics, translating into differences in synchrony, uniformity, and early vigour. For this reason, methodological frameworks emphasize quantifying the germination process as a time-dependent phenomenon rather than a single endpoint [8]. Likewise, critical evaluations of single-value germination indices show that the shape and dispersion of the cumulative curve contain biologically meaningful information that should be captured through complementary metrics [9]. This is consistent with the broader concept of seed vigour as the capacity to establish rapidly and uniformly, extending beyond mere viability [10].
Early growth—particularly the development of the primary root—constitutes another key component of vigour because it integrates reserve utilization efficiency, cell expansion, and the ability to explore the medium soon after emergence. Foundational plant physiology frameworks highlight that early root elongation is a sensitive readout of growth regulation and resource acquisition potential [11]. Because ionic and osmotic constraints can directly impair cell expansion and water relations, salinity tolerance mechanisms provide an explanatory framework for understanding how ionic stress conditions can penalize early establishment [12]. In parallel, mineral nutrition theory underscores that ions are essential to sustain metabolism and growth, yet imbalanced ionic environments can generate osmotic stress or ion-specific toxicity, compromising germination and seedling development [13,14].
In vitro systems provide a controlled platform to study these processes by minimizing environmental noise and enabling standardized comparisons across genotypes and treatments. Defined culture media have been central to plant tissue culture and early development research, with the Murashige–Skoog formulation serving as a widely adopted reference for controlled growth [15]. Comprehensive tissue culture manuals further emphasize the importance of medium composition and physical support matrices for reproducible development [16]. At the same time, low-cost approaches—including alternative gelling agents and simplified support matrices—have been explored to facilitate large-scale or resource-limited experimentation [17]. However, the interpretability of in vitro assays depends strongly on asepsis: contamination can rapidly alter local pH, oxygen availability, and nutrient dynamics, biasing treatment effects [18], and microbial hazards remain a recurrent challenge in plant tissue and cell culture systems [19].
Accordingly, robust surface-sterilization and establishment protocols are essential to ensure that observed differences reflect treatment and genotype rather than uncontrolled microbial growth. Recent work has demonstrated that optimization of in vitro sterilization and germination conditions benefits from systematic modeling and predictive approaches [20]. From a design standpoint, factorial experiments are especially valuable because they allow separation of main effects (e.g., genotype and fertilization) and their interaction under randomized conditions [21]. When multiple treatments are compared, classical multiple-comparison procedures remain standard for mean separation after ANOVA [22], while rank-based nonparametric approaches provide alternatives when normality assumptions are not met [23,24]. Moreover, controlling error rates under multiple testing is critical to preserve inferential validity, particularly when several indices and response variables are analyzed simultaneously [25].
Beyond univariate inference, early establishment is increasingly interpreted as a multivariate phenotype in which germination dynamics and growth traits covary. Principal component analysis (PCA) is a standard tool for reducing dimensionality and revealing latent axes that summarize complex trait relationships [26,27]. Practical frameworks for exploratory multivariate analysis in R provide coherent workflows for interpreting these structures and linking them to biological meaning [28]. Subsequently, hierarchical clustering—particularly Ward’s minimum-variance criterion—supports the identification of treatment groups with homogeneous phenotypic profiles, strengthening interpretation at the “profile” level rather than single-variable comparisons [29].
Radish (Raphanus sativus L.) is frequently used as a rapid and informative model for germination and early growth studies due to its short emergence time and sensitivity to metabolic and environmental modulation, making it well suited for detecting genotype-dependent responses under controlled conditions [30]. To ensure comparability and reproducibility, seed testing standards recommend rigorous sampling procedures and controlled handling, which are particularly relevant when working with commercial seed lots [31]. In addition, reproducible statistical workflows benefit from validated software ecosystems: multivariate analyses are commonly implemented with dedicated R packages for PCA and related methods [32], complemented by visualization tools for extracting and communicating multivariate results [33], all within the R statistical computing environment [34].
Mechanistic and semi-mechanistic modeling further strengthens interpretation of germination dynamics by explicitly linking rate processes to water relations and temperature constraints. Hydrothermal-time and related frameworks have been widely applied to quantify and model germination and dormancy responses under varying environmental conditions [35]. In particular, water-relations analyses of germination rates provide a physiological basis for interpreting delays or inhibition under osmotic stress [36]. Related work has formalized the joint role of time and temperature in germination processes [37], and demonstrated that constant temperatures combined with defined osmotic potentials can systematically shift germination outcomes [38]. Hydrothermal-time models have also been used to explain cardinal temperatures for germination and to predict responses across environmental gradients [39]. Extensions of these models can characterize thermoinhibition processes [40], while methodological studies emphasize that distribution-function choice can influence model performance and biological inference [41]. More recently, alternative modeling strategies such as cure models have been proposed to better represent heterogeneous germination responses when a fraction of seeds fails to germinate within the observation window [42].
Complementary to modeling, classical indices remain valuable for practical discrimination among treatments and seed lots when applied with appropriate caution. Indices combining speed and completeness, such as germination value, have long been used to integrate performance dimensions into single interpretable measures [43,44]. Moreover, frequent radicle-emergence scoring has been shown to improve the predictive value of time-based metrics for seed vigour, reinforcing the importance of high-resolution temporal data in early establishment studies [45].
In this study, we investigate early phenotypic plasticity of radish under a simplified ionic contrast in vitro by comparing three commercial varieties (two domestic and one imported) acquired in Milagro, Ecuador. We implemented a completely randomized 3 × 2 factorial design (Variety × Fertilization) using two media: 1.5% agar without fertilizer (A) and 1.5% agar supplemented with a commercial NPK fertilizer (AF). Germination was recorded at 24, 48, and 72 h, and performance was characterized through germination dynamics and vigour-related indices alongside early root growth (primary root length at 72 h). Multivariate profiling (PCA and hierarchical clustering on components) was used to integrate response variables and classify treatments according to global phenotypic patterns.
Objective. To determine the effect of supplementing a 1.5% agar-based in vitro system with a commercial NPK fertilizer on germination dynamics, vigour indices, and early root growth of three commercial Raphanus sativus L. varieties, and to classify treatments by their overall phenotypic profile using multivariate analysis (PCA and HCPC).
2. Materials and Methods
2.1. Plant Material and Experimental Conditions
Commercial radish seeds (Raphanus sativus L.) from three varieties were used: two domestic materials, Agrosad (AS) and Agrícola Santo Domingo (ASD), and one imported variety, Garden Elite (GE), purchased from local retailers in Milagro, Ecuador (Figure 1). To facilitate individual-based image assessment, nine seeds were placed per Petri dish in a 3 × 3 grid with ~2 cm spacing, minimizing physical competition among seedlings [30]. Seed sampling from 10 g commercial lots and the use of controlled incubation conditions to standardize early development followed the International Rules for Seed Testing (ISTA) [31]. All plates were incubated in darkness at 23 ± 2 °C.
2.2. Experimental Design
The experiment was conducted under a completely randomized design (CRD) with a 3 × 2 factorial arrangement, allowing estimation of the main effects of Variety and Fertilization and their interaction through random allocation of experimental units [21]. The design structure and the definition of experimental units by response variable are summarized in Table 1 and Table 2, and the sowing layout is illustrated in Figure 2.
2.3. Treatments
2.4. Assessments and Measured Variables
Germination was assessed by successive counts at 24, 48, and 72 h after sowing. To avoid ambiguity between cumulative and incremental counts, each reading recorded the number of seeds that germinated within the corresponding interval. A seed was considered germinated when radicle protrusion was ≥ 2 mm, a criterion commonly used to estimate early vigour in horticultural species [30,45]. Counts were performed per experimental unit (Petri dish; N = 9 seeds) and used to derive primary variables and vigour indices (Figure 3).
2.4.1. Primary Variables
Interval germination (G24, G48, G72) was defined as the number of seeds germinated within each evaluation period: G24 (0–24 h), G48 (24–48 h), and G72 (48–72 h). This interval-based approach characterizes emergence dynamics and discriminates treatments that may reach similar final germination but at different rates.
Root length (72 h) was defined as the length (cm) of the primary root measured at 72 h. For each plate, all germinated seedlings were measured and the plate-level mean root length was used as the experimental unit for statistical analysis. This approach yielded three replicate observations per treatment (18 plates in total) while accommodating treatment-dependent differences in germination.
2.4.2. Calculated Vigour Variables
From interval germination counts, germination-performance indicators integrating magnitude and speed were computed. Here, N = 9 is the number of seeds per plate, nᵢ is the number of seeds germinated at time tᵢ, and evaluations were performed at tᵢ = 24, 48, 72 h.
Final germination percentage (%G):
where is the total number of germinated seeds accumulated up to 72 h .
Mean germination time (MGT): computed following Ellis and Roberts [7]:
Lower values indicate faster average germination.
Germination speed index (IVG): computed following Maguire [6]. To match the evaluation frequency, time was expressed in days equivalent to 24, 48, and 72 h ():
Higher values indicate greater vigour due to earlier and more concentrated emergence.
Coefficient of velocity of germination (CVG): computed following Kotowski [5]:
where is expressed in hours. Higher values indicate faster germination.
2.5. Statistical Analysis
To ensure traceability between each response variable and the inferential method applied, the statistical approach is summarized in Table 5. Statistical significance was set at α = 0,05 for all tests, and multiple-comparison or p-value adjustment procedures were applied when appropriate to control multiplicity [21,25].
Specifically, plate-level germination variables (%G, IVG, CVG) were analyzed using a 3 × 2 factorial ANOVA with three replicates per treatment under a completely randomized design [21]. When significant effects were detected (), Tukey’s HSD test was used for mean separation [22]. Because MGT did not meet normality assumptions, global differences were tested using Kruskal–Wallis [23] and, when significant, pairwise comparisons were performed using Wilcoxon’s test for independent groups; p-values were adjusted using the Benjamini–Hochberg procedure to control the false discovery rate [24,25]. Root length was analyzed using a 3 × 2 factorial ANOVA on plate-level mean root length, with three replicate plates per treatment (N = 18 experimental units) [21]. For multivariate characterization, PCA was performed on a standardized matrix [26,27,28], followed by HCPC as a hybrid reduction-and-clustering strategy using Ward’s criterion and Euclidean distance to define homogeneous treatment profiles [28,29].
2.6. Software
All analyses were performed in the R statistical computing environment (version 4.2.1) [34]. ANOVA models, Kruskal–Wallis and Wilcoxon tests, and Tukey multiple comparisons were implemented using base R functions. PCA and hierarchical clustering workflows were conducted using FactoMineR [32], and results extraction and visualization (biplots and dendrograms) were produced with factoextra [33]. Statistical significance was set at α = 0,05 for all inferential procedures.
3. Results
3.1. Effect of Fertilization on Germination and Morphometry of Raphanus sativus L.
To determine the overall treatment effect, a MANOVA using Pillai’s trace was performed. Results showed highly significant differences for both Variety (Pillai = 1.73; p < 0.001) and Fertilization (Pillai = 0.80; p < 0.001), as well as for their interaction (V × F; Pillai = 1.18; p < 0.01).
Univariate ANOVAs confirmed these patterns for most variables, whereas for MGT the nonparametric analysis also indicated significant differences. Variety was the most influential source of variation, particularly for IVG, which showed the highest F value (F = 169.82; p < 0.001). Importantly, the V × F interaction was significant across all parameters, demonstrating that the response to fertilization was not uniform but genotype-dependent. Statistical details are summarized in Table 6.
Mean comparisons (Table 7) decomposed the interaction patterns. For final germination (%G), varieties AS and GE were stable, with no statistical differences between control and fertilized treatments, maintaining values above 88%. In contrast, ASD showed a severe negative impact under fertilization, dropping from 88.89% (control) to 25.93% (fertilized).
Regarding speed and development, fertilization tended to delay germination, evidenced by a significant increase in MGT for AS and GE, and a generalized reduction in IVG, with ASD again being the most affected (lowest value in the experiment: 1.23). Root development was strongly inhibited by fertilization in ASD and GE, both showing significant reductions compared to their controls (from 9.15 cm and 9.40 cm down to 5.20 cm and 4.00 cm, respectively). Notably, GE reduced its root length to less than half. By contrast, AS presented the shortest root length in both conditions, with no significant change due to fertilization.
3.2. Association Patterns Among Variables and Treatment Classification
To understand the structure of relationships among variables and to classify treatments based on overall response, a PCA was performed. This analysis reduced dimensionality and explained 86.36% of total cumulative variance in the first two components (Table 8).
The first component (PC1, 62.31% of variance) was interpreted as a vigour and architecture axis, showing strong positive correlations with IVG (0.92) and root length (0.82), and a strong negative correlation with MGT (−0.87). Thus, treatments located on the right side of the biplot (Figure 4) exhibited faster development and greater early root growth. The second component (PC2, 24.05% of variance) was associated with germinative capacity, dominated by %G (0.94).
Projection of treatments in the biplot (Figure 4) revealed fertilization-driven dispersion. Variety AS showed high phenotypic stability, with both control and fertilized treatments positioned close to each other and associated with high vigour (positive PC1). In contrast, fertilization produced a pronounced separation in ASD, shifting fertilized samples toward the negative quadrant for both vigour and germination, far from their respective controls.
This pattern was corroborated and formally classified by hierarchical clustering (Figure 5), which identified five groups with distinct behaviors. ASD controls clustered with the best-performing treatments (light-blue cluster), whereas fertilization segregated ASD-Fert into an independent group (red/gray clusters) characterized by low global performance. Additionally, GE (Control) formed an isolated group (dark-blue cluster), clearly differentiated from its fertilized counterpart due to moderate speed and root length.
Finally, Figure 6 shows a differential response in cumulative germination driven by the Variety × Fertilization interaction. The imported variety GE showed the fastest establishment, reaching near-maximum values by 24 h in medium A (GE_A) and remaining nearly stable up to 72 h, whereas GE_AF began slightly lower but converged to high final percentages. In contrast, domestic materials showed greater medium dependence: AS_A increased markedly between 24–48 h and achieved the highest final germination at 72 h, while AS_AF exhibited an initial delay but partially recovered by 72 h. The strongest fertilization effect was observed in ASD, where ASD_AF maintained low germination throughout the assay with higher variability (SE), suggesting an inhibitory effect of mineral supplementation on early emergence in this genotype, unlike ASD_A, which increased rapidly between 24–48 h and stabilized thereafter.
4. Discussion
The strong Variety × Fertilization interaction observed in this experiment (notably the collapse of %G and IVG in ASD under AF, together with the marked inhibition of root elongation in ASD and GE) indicates that adding a commercial NPK blend to an agar-based in vitro system acts less as a “universal nutrient boost” and more as a genotype-specific ionic/osmotic filter, where small differences in seed physiology, membrane integrity, reserve mobilization, and ion-handling capacity are amplified under controlled conditions.
A plausible mechanistic interpretation is that AF increased ionic strength and altered the balance among N forms and counter-ions, shifting water relations during imbibition and early cell expansion; this would explain why final germination could remain high in AS and GE while germination timing (MGT) and vigor (IVG) deteriorated, and why radicle growth was disproportionately penalized in ASD and GE. In radish specifically, early growth is known to respond strongly to salinity/ionic stress, and management strategies that mitigate ion toxicity can partially restore seedling performance; for example, silicon supplementation has been reported to alleviate ammonium toxicity in radish, supporting the idea that ion-form/ion-balance effects (not only “nutrient quantity”) can drive root-growth inhibition and could be leveraged in follow-up assays to test mitigation options under AF-like conditions [49].
Likewise, work in other in vitro crop systems shows that shifting NPK concentrations can redirect developmental outcomes and impose cultivar-dependent penalties, reinforcing that commercial fertilizers behave as complex inputs whose net effect depends on genotype and medium context rather than on “NPK dose” alone [50]. From a phenotyping standpoint, the separation of treatments along an integrated vigour axis (PC1 dominated by IVG/MGT/root length) is consistent with the modern view that early establishment is a multivariate phenotype and should be interpreted as a coordinated trait network rather than isolated endpoints; this argues for expanding image-based quantification (root architecture, curvature, branching proxies) to capture subtle stress signatures that precede visible failure, aligning with broader plant-phenotyping roadmaps and the routine use of reproducible image-analysis platforms to standardize trait extraction across treatments and labs [51,52].
The fact that GE exhibited rapid establishment in the control yet lost more than half of its root length under AF also fits a stress-response pattern reported in microgreen/brassicaceous systems under combined thermal/ionic constraints highlighting the importance of jointly interpreting germination curves and morphometry instead of relying on %G alone [53]. Statistically, the study’s multi-endpoint structure (several vigor indices + morphology + multivariate profiling) strengthens inference when multiplicity is explicitly controlled, and future expansions with finer temporal scoring or additional traits should consider procedures robust to dependency among tests (common in correlated vigor variables), such as FDR control under dependency and/or sequentially rejective adjustments to keep conclusions stable as the number of outcomes increases [54,55].
Biologically, the genotype dependence points to early metabolic regulation and signal integration as a likely driver: in vitro environments can shift the balance between nitrate signaling, dormancy release, and reactive nitrogen species pathways, and the literature shows that nitrate can act as a dormancy-relief signal, that nitrate-dependent regulation of dormancy/germination is genetically and physiologically structured, and that nitric oxide can break dormancy and modulate germination through interactions with hormone signaling and ROS; together, these mechanisms offer a coherent explanation for why one genotype (ASD) could be pushed into a low-germination/low-vigor state under AF while another (AS) remains comparatively stable [61,62,63,64]. At the same time, the pronounced root-length penalties under AF are consistent with the idea that early roots integrate nutrient-availability cues into architectural decisions and growth rates; nutrient deficiencies/excesses and imbalanced ion availability can reshape root system plasticity, and traits (“root phenes”) that improve soil exploration and nutrient acquisition in later stages may already be partially expressed as differential early elongation responses under in vitro ionic contrasts, suggesting that the observed patterns could be an early proxy for broader nutrient-use strategies among varieties [65,66,67,68].
Methodologically, these findings support treating commercial fertilizer–agar systems as a low-cost screening tool rather than as a replacement for defined media: classic culture-medium research emphasizes that mineral requirements and ion forms matter, and micropropagation literature shows that “commercially feasible” protocols often succeed by controlling specific medium components and interactions rather than by increasing generic fertilization; thus, a rational next step is to chemically characterize AF (EC, pH, major ion forms, N speciation) and run a small concentration series to identify thresholds where each genotype transitions from stimulation to inhibition [56,57]. In parallel, complementary pre-sowing strategies—such as priming and targeted seed treatments known to improve emergence and early growth under abiotic stress—could be tested as practical countermeasures to AF-induced inhibition, especially for ASD-like sensitive lots [58,59,60].
Finally, because PCA + hierarchical clustering are ultimately pattern-recognition frameworks, their interpretability improves when grounded in established multivariate ecology and clustering principles (distance choice, scaling, linkage effects, and cluster validity), so reporting robustness checks (e.g., sensitivity to scaling, alternative distance metrics, silhouette-like diagnostics) would further strengthen the generality of the five-group solution and its biological meaning for seed-lot screening applications [69,70].
5. Conclusions
This study demonstrates that supplementing an agar-based in vitro system with a commercial NPK fertilizer (3 g/L) produces a strong genotype-dependent response during early establishment of Raphanus sativus L. The significant Variety × Fertilization interaction confirms that fertilization effects cannot be generalized across materials: while AS and GE maintained high final germination, fertilization tended to delay germination and reduce vigor, and it strongly inhibited root elongation in GE. The national variety ASD exhibited the greatest sensitivity, showing a drastic reduction in germination and the lowest vigor under fertilization, indicating that the fertilizer-generated ionic environment can act as an inhibitory filter for specific genotypes. Multivariate profiling (PCA and hierarchical clustering) integrated germination and growth traits, separating treatments along axes of vigor/architecture and germinative capacity, and consistently classifying treatments into distinct response groups, thereby strengthening interpretation beyond single variables. Overall, a low-cost agar + fertilizer assay is a practical approach to rapidly screen varietal sensitivity to ionic environments, but its use should be supported by dose–response testing and characterization of the medium (e.g., EC/pH and ion forms) to define safe thresholds and improve reproducibility across genotypes and seed lots.
Author Contributions
For research articles with several authors, a short paragraph specifying their individual contributions must be provided. The following statements should be used “Conceptualization, L. E. C. M., K R-P, F G-V, B. P-G., S. V-A., R. P-P., I. A. A. G., E. R-N. and C. E. D. E.; methodology, L. E. C. M., K. R-P., B. P-G., R. P-P., S. P. J. J., E. R-N. and C. E. D. E.; software, I. I-V., S. V-A and I. A. A. G.; validation, I. I-V., S V-A. and I. A. A. G.; formal analysis, L. E. C. M., F. G-V., I. I-V., S. V-A; investigation, L. E. C. M., K. R-P, F. G-V. B. P-G., S.V-A., and E. R-N.; resources, L. E. C. M., F. G-V., S. P. J. J. and C. E. D. E.; data curation, I. I-V., S. V-A.; writing—original draft preparation, L. E. C. M. and C. E. D. E.; writing—review and editing, L. E. C. M., K. R-P., B. P-G., I. I-V., S. V-A., R. P-P., S. P. J. J. and E. R-N.; visualization, L. E. C. M., K. R-P., B. P-G., R. P-P., I. A. A. G., E. R-N. and C. E. D. E.; supervision, L. E. C. M., E. R-N. and C. E. D. E.; project administration, C. E. D. E.
Funding
This research received no external funding.
Data Availability Statement
The original contributions presented in this study are included in the article. Further inquiries can be directed to the corresponding author.
Acknowledgments
The authors are grateful to the Universidad Estatal de Milagro (UNEMI) for supporting our publication.
Conflicts of Interest
The authors declare no conflicts of interest.
References
- Baskin, C.C.; Baskin, J.M. Seeds: Ecology, Biogeography, and Evolution of Dormancy and Germination, 2nd ed.; Academic Press: San Diego, CA, USA, 2014. [Google Scholar]
- Bewley, J.D.; Bradford, K.J.; Hilhorst, H.W.M.; Nonogaki, H. Seeds: Physiology of Development, Germination and Dormancy, 3rd ed.; Springer: New York, NY, USA, 2013. [Google Scholar]
- Nonogaki, H.; Bassel, G.W.; Bewley, J.D. Germination—Still a mystery. Plant Sci. 2010, 179, 574–581. [Google Scholar] [CrossRef]
- Copeland, L.O.; McDonald, M.B. Principles of Seed Science and Technology, 4th ed.; Springer/Kluwer Academic: New York, NY, USA, 2001. [Google Scholar] [CrossRef]
- Kotowski, F. Temperature relations to germination of vegetable seed. Proc. Am. Soc. Hortic. Sci. 1926, 23, 176–184. [Google Scholar]
- Maguire, J.D. Speed of germination—Aid in selection and evaluation for seedling emergence and vigor. Crop Sci. 1962, 2, 176–177. [Google Scholar] [CrossRef]
- Ellis, R.H.; Roberts, E.H. The quantification of ageing and survival in orthodox seeds. Seed Sci. Technol. 1981, 9, 373–409. [Google Scholar]
- Ranal, M.A.; Santana, D.G. How and why to measure the germination process? Rev. Bras. Bot. 2006, 29, 1–11. [Google Scholar] [CrossRef]
- Brown, R.F.; Mayer, D.G. Representing cumulative germination: A critical analysis of single-value germination indices. Ann. Bot. 1988, 61, 117–125. [Google Scholar] [CrossRef]
- Finch-Savage, W.E.; Bassel, G.W. Seed vigour and crop establishment: Extending performance beyond adaptation. J. Exp. Bot. 2016, 67, 567–591. [Google Scholar] [CrossRef]
- Taiz, L.; Zeiger, E.; Møller, I.M.; Murphy, A. Plant Physiology and Development, 6th ed.; Sinauer Associates: Sunderland, MA, USA, 2015. [Google Scholar]
- Munns, R.; Tester, M. Mechanisms of salinity tolerance. Annu. Rev. Plant Biol. 2008, 59, 651–681. [Google Scholar] [CrossRef] [PubMed]
- Epstein, E.; Bloom, A.J. Mineral Nutrition of Plants: Principles and Perspectives, 2nd ed.; Sinauer Associates: Sunderland, MA, USA, 2005. [Google Scholar]
- Marschner, P. Marschner’s Mineral Nutrition of Higher Plants, 3rd ed.; Academic Press: London, UK, 2012. [Google Scholar]
- Murashige, T.; Skoog, F. A revised medium for rapid growth and bio assays with tobacco tissue cultures. Physiol. Plant. 1962, 15, 473–497. [Google Scholar] [CrossRef]
- George, E.F.; Hall, M.A.; De Klerk, G.-J. Plant Propagation by Tissue Culture, 3rd ed.; Springer: Dordrecht, The Netherlands, 2008. [Google Scholar]
- Bhattacharya, P.; Dey, S.; Bhattacharyya, B.C. Use of low-cost gelling agents and support matrices for industrial scale plant tissue culture. Plant Cell Tissue Organ Cult. 1994, 37, 15–23. [Google Scholar] [CrossRef]
- Cassells, A.C. Contamination and its impact in plant tissue culture. Methods Mol. Biol. 2012, 877, 57–80. [Google Scholar] [CrossRef]
- Leifert, C.; Cassells, A.C. Microbial hazards in plant tissue and cell cultures. In Vitro Cell. Dev. Biol.—Plant 2001, 37, 133–138. [Google Scholar] [CrossRef]
- Rezaei, H.; Mirzaie-asl, A.; Abdollahi, M.R.; Tohidfar, M. Comparative analysis of different artificial neural networks for predicting and optimizing in vitro seed germination and sterilization of petunia. PLOS ONE 2023, 18, e0285657. [Google Scholar] [CrossRef]
- Montgomery, D.C. Design and Analysis of Experiments, 8th ed.; John Wiley & Sons: Hoboken, NJ, USA, 2012. [Google Scholar]
- Tukey, J.W. Comparing individual means in the analysis of variance. Biometrics 1949, 5, 99–114. [Google Scholar] [CrossRef]
- Kruskal, W.H.; Wallis, W.A. Use of ranks in one-criterion variance analysis. J. Am. Stat. Assoc. 1952, 47, 583–621. [Google Scholar] [CrossRef]
- Wilcoxon, F. Individual comparisons by ranking methods. Biometrics Bull. 1945, 1, 80–83. [Google Scholar] [CrossRef]
- Benjamini, Y.; Hochberg, Y. Controlling the false discovery rate: A practical and powerful approach to multiple testing. J. R. Stat. Soc. Ser. B 1995, 57, 289–300. [Google Scholar] [CrossRef]
- Jolliffe, I.T. Principal Component Analysis, 2nd ed.; Springer: New York, NY, USA, 2002. [Google Scholar] [CrossRef]
- Abdi, H.; Williams, L.J. Principal component analysis. WIREs Comput. Stat. 2010, 2, 433–459. [Google Scholar] [CrossRef]
- Husson, F.; Lê, S.; Pagès, J. Exploratory Multivariate Analysis by Example Using R, 2nd ed.; Chapman and Hall/CRC: Boca Raton, FL, USA, 2017. [Google Scholar] [CrossRef]
- Ward, J.H. Hierarchical grouping to optimize an objective function. J. Am. Stat. Assoc. 1963, 58, 236–244. [Google Scholar] [CrossRef]
- Kanjevac, M.; Jakovljević, D.; Todorović, M.; Stanković, M.; Ćurčić, S.; Bojović, B. Improvement of germination and early growth of radish (Raphanus sativus L.) through modulation of seed metabolic processes. Plants 2022, 11, 757. [Google Scholar] [CrossRef] [PubMed]
- International Seed Testing Association (ISTA). International Rules for Seed Testing 2024: Chapter 2: Sampling; ISTA: Bassersdorf, Switzerland, 2024. [Google Scholar]
- Lê, S.; Josse, J.; Husson, F. FactoMineR: An R package for multivariate analysis. J. Stat. Softw. 2008, 25, 1–18. [Google Scholar] [CrossRef]
- Kassambara, A.; Mundt, F. factoextra: Extract and visualize the results of multivariate data analyses. In R package; 2020. [Google Scholar] [CrossRef]
- R Core Team. R: A Language and Environment for Statistical Computing; R Foundation for Statistical Computing: Vienna, Austria, 2022. [Google Scholar]
- Bradford, K.J. Applications of hydrothermal time to quantifying and modeling seed germination and dormancy. Weed Sci. 2002, 50, 248–260. [Google Scholar] [CrossRef]
- Bradford, K.J. A water relations analysis of seed germination rates. Plant Physiol. 1990, 94, 840–849. [Google Scholar] [CrossRef]
- García-Huidobro, J.; Monteith, J.L.; Squire, G.R. Time, temperature and germination of pearl millet (Pennisetum typhoides S. & H.). J. Exp. Bot. 1982, 33, 288–296. [Google Scholar] [CrossRef]
- Gummerson, R.J. The effect of constant temperatures and osmotic potentials on the germination of sugar beet. J. Exp. Bot. 1986, 37, 729–741. [Google Scholar] [CrossRef]
- Alvarado, V.; Bradford, K.J. A hydrothermal time model explains the cardinal temperatures for seed germination. Plant Cell Environ. 2002, 25, 1061–1069. [Google Scholar] [CrossRef]
- Watt, M.S.; Bloomberg, M.; Finch-Savage, W.E. Development of a hydrothermal time model that accurately characterises how thermoinhibition regulates germination. Ecol. Model. 2010, 221, 2591–2599. [Google Scholar] [CrossRef]
- Mesgaran, M.B.; Mashhadi, H.R.; Alizadeh, H.; Hunt, J.; Young, K.R.; Cousens, R.D. Importance of distribution function selection for hydrothermal time models of seed germination. Weed Res. 2013, 53, 89–101. [Google Scholar] [CrossRef]
- Onofri, A.; Mesgaran, M.B.; Tei, F.; Cousens, R.D. The cure model: An improved way to describe seed germination. Eur. J. Agron. 2018, 101, 129–139. [Google Scholar] [CrossRef]
- Czabator, F.J. Germination value: An index combining speed and completeness of pine seed germination. For. Sci. 1962, 8, 386–396. [Google Scholar] [CrossRef]
- Djavanshir, K.; Pourbeik, H. Germination value—A new formula. Silvae Genet. 1976, 25, 79–83. [Google Scholar]
- Lv, Y.Y.; Wang, Y.R.; Powell, A.A. Frequent individual counts of radicle emergence and mean just germination time predict seed vigour of Avena sativa and Elymus nutans. Seed Sci. Technol. 2016, 44, 189–198. [Google Scholar] [CrossRef]
- Lv, Y.; Wang, Y.; Sun, W.; Lian, S.; Du, H.; Wang, J. Insight into the functional and regulatory network of Arabidopsis seed germination and early seedling development. BMC Genom. 2016, 17, 480. [Google Scholar] [CrossRef]
- Labouriau, L.G. A Germinação de Sementes; Secretaria Geral da OEA: Brasília, Brazil, 1983. [Google Scholar]
- De Sousa Basílio, A.M.; Da Silva, M.A.M.; Santana, C.C. Potencial osmótico e concentração de cloreto de sódio na germinação de sementes de rabanete. Rev. Ciênc. Agrár. 2018, 41, 638–648. [Google Scholar]
- Viciedo, D.O.; Prado, R.M.; Martinez, H.E.P.; Gratão, P.L. Silicon supplementation alleviates ammonium toxicity in radish plants. J. Sci. Food Agric. 2020, 100, 3525–3531. [Google Scholar] [CrossRef]
- Radouani, A.; Lauer, F.I.; Abdelmajid, K. Effect of NPK media concentrations on in vitro potato tuberization of cultivars Nicola and Russet Burbank. Am. J. Potato Res. 2015, 92, 146–155. [Google Scholar] [CrossRef]
- Fiorani, F.; Schurr, U. Future scenarios for plant phenotyping. Annu. Rev. Plant Biol. 2013, 64, 267–291. [Google Scholar] [CrossRef] [PubMed]
- Schindelin, J.; Arganda-Carreras, I.; Frise, E.; et al. Fiji: An open-source platform for biological-image analysis. Nat. Methods 2012, 9, 676–682. [Google Scholar] [CrossRef]
- Toscano, S.; Romano, D.; Tribulato, A.; Rizzo, V. Annual garden rocket and radish as microgreens: Seed germination response to thermal and salt stress. Agronomy 2025, 15, 361. [Google Scholar] [CrossRef]
- Benjamini, Y.; Yekutieli, D. The control of the false discovery rate in multiple testing under dependency. Ann. Stat. 2001, 29, 1165–1188. [Google Scholar] [CrossRef]
- Holm, S. A simple sequentially rejective multiple test procedure. Scand. J. Stat. 1979, 6, 65–70. [Google Scholar]
- Gamborg, O.L.; Miller, R.A.; Ojima, K. Nutrient requirements of suspension cultures of soybean root cells. Exp. Cell Res. 1968, 50, 151–158. [Google Scholar] [CrossRef]
- Lloyd, G.; McCown, B. Commercially-feasible micropropagation of mountain laurel, Kalmia latifolia, by use of shoot-tip culture. Proc. Int. Plant Prop. Soc. 1980, 30, 421–427. [Google Scholar]
- Paparella, S.; Araújo, S.S.; Rossi, G.; et al. Seed priming: State of the art and new perspectives. Plant Cell Rep. 2015, 34, 1281–1293. [Google Scholar] [CrossRef]
- Ashraf, M.; Foolad, M.R. Pre-sowing seed treatment—A shotgun approach to improve germination and seedling growth under salt and drought stress. Adv. Agron. 2005, 88, 223–271. [Google Scholar]
- Finch-Savage, W.E.; Leubner-Metzger, G. Seed dormancy and the control of germination. New Phytol. 2006, 171, 501–523. [Google Scholar] [CrossRef]
- Alboresi, A.; Gestin, C.; Leydecker, M.-T.; Bedu, M.; Meyer, C.; Truong, H.-N. Nitrate, a signal relieving seed dormancy in Arabidopsis. Plant Cell Environ. 2005, 28, 500–512. [Google Scholar] [CrossRef] [PubMed]
- Duermeyer, L.; Khodapanahi, E.; Yan, D.; Krapp, A.; Rothstein, S.J.; Nambara, E. Regulation of seed dormancy and germination by nitrate. Seed Sci. Res. 2018, 28, 150–157. [Google Scholar] [CrossRef]
- Bethke, P.C.; Gubler, F.; Jacobsen, J.V.; Jones, R.L. Dormancy of Arabidopsis seeds and barley grains can be broken by nitric oxide. Plant Physiol. 2006, 140, 170–179. [Google Scholar] [CrossRef]
- Zhang, H.; et al. Nitric oxide regulates seed germination: Integrating hormone signaling and reactive oxygen species. Int. J. Mol. Sci. 2023, 24, 9052. [Google Scholar] [CrossRef]
- López-Bucio, J.; Cruz-Ramírez, A.; Herrera-Estrella, L. The role of nutrient availability in regulating root architecture. Curr. Opin. Plant Biol. 2003, 6, 280–287. [Google Scholar] [CrossRef] [PubMed]
- Gruber, B.D.; Giehl, R.F.H.; Friedel, S.; von Wirén, N. Plasticity of the Arabidopsis root system under nutrient deficiencies. Plant Physiol. 2013, 163, 161–179. [Google Scholar] [CrossRef] [PubMed]
- Lynch, J.P. Root phenes for enhanced soil exploration and phosphorus acquisition: Tools for future crops. Plant Physiol. 2011, 156, 1041–1049. [Google Scholar] [CrossRef]
- Ma, J.; et al. Phosphorus deficiency and root adaptive responses: An integrative perspective. Int. J. Mol. Sci. 2025, 26, 1791. [Google Scholar]
- Legendre, P.; Legendre, L. Numerical Ecology, 3rd English ed.; Elsevier: Amsterdam, The Netherlands, 2012. [Google Scholar]
- Kaufman, L.; Rousseeuw, P.J. Finding Groups in Data: An Introduction to Cluster Analysis; Wiley: New York, NY, USA, 1990. [Google Scholar]
Figure 1.
Seeds of Agrosad (AS), Agrícola Santo Domingo (ASD), and Garden Elite (GE).
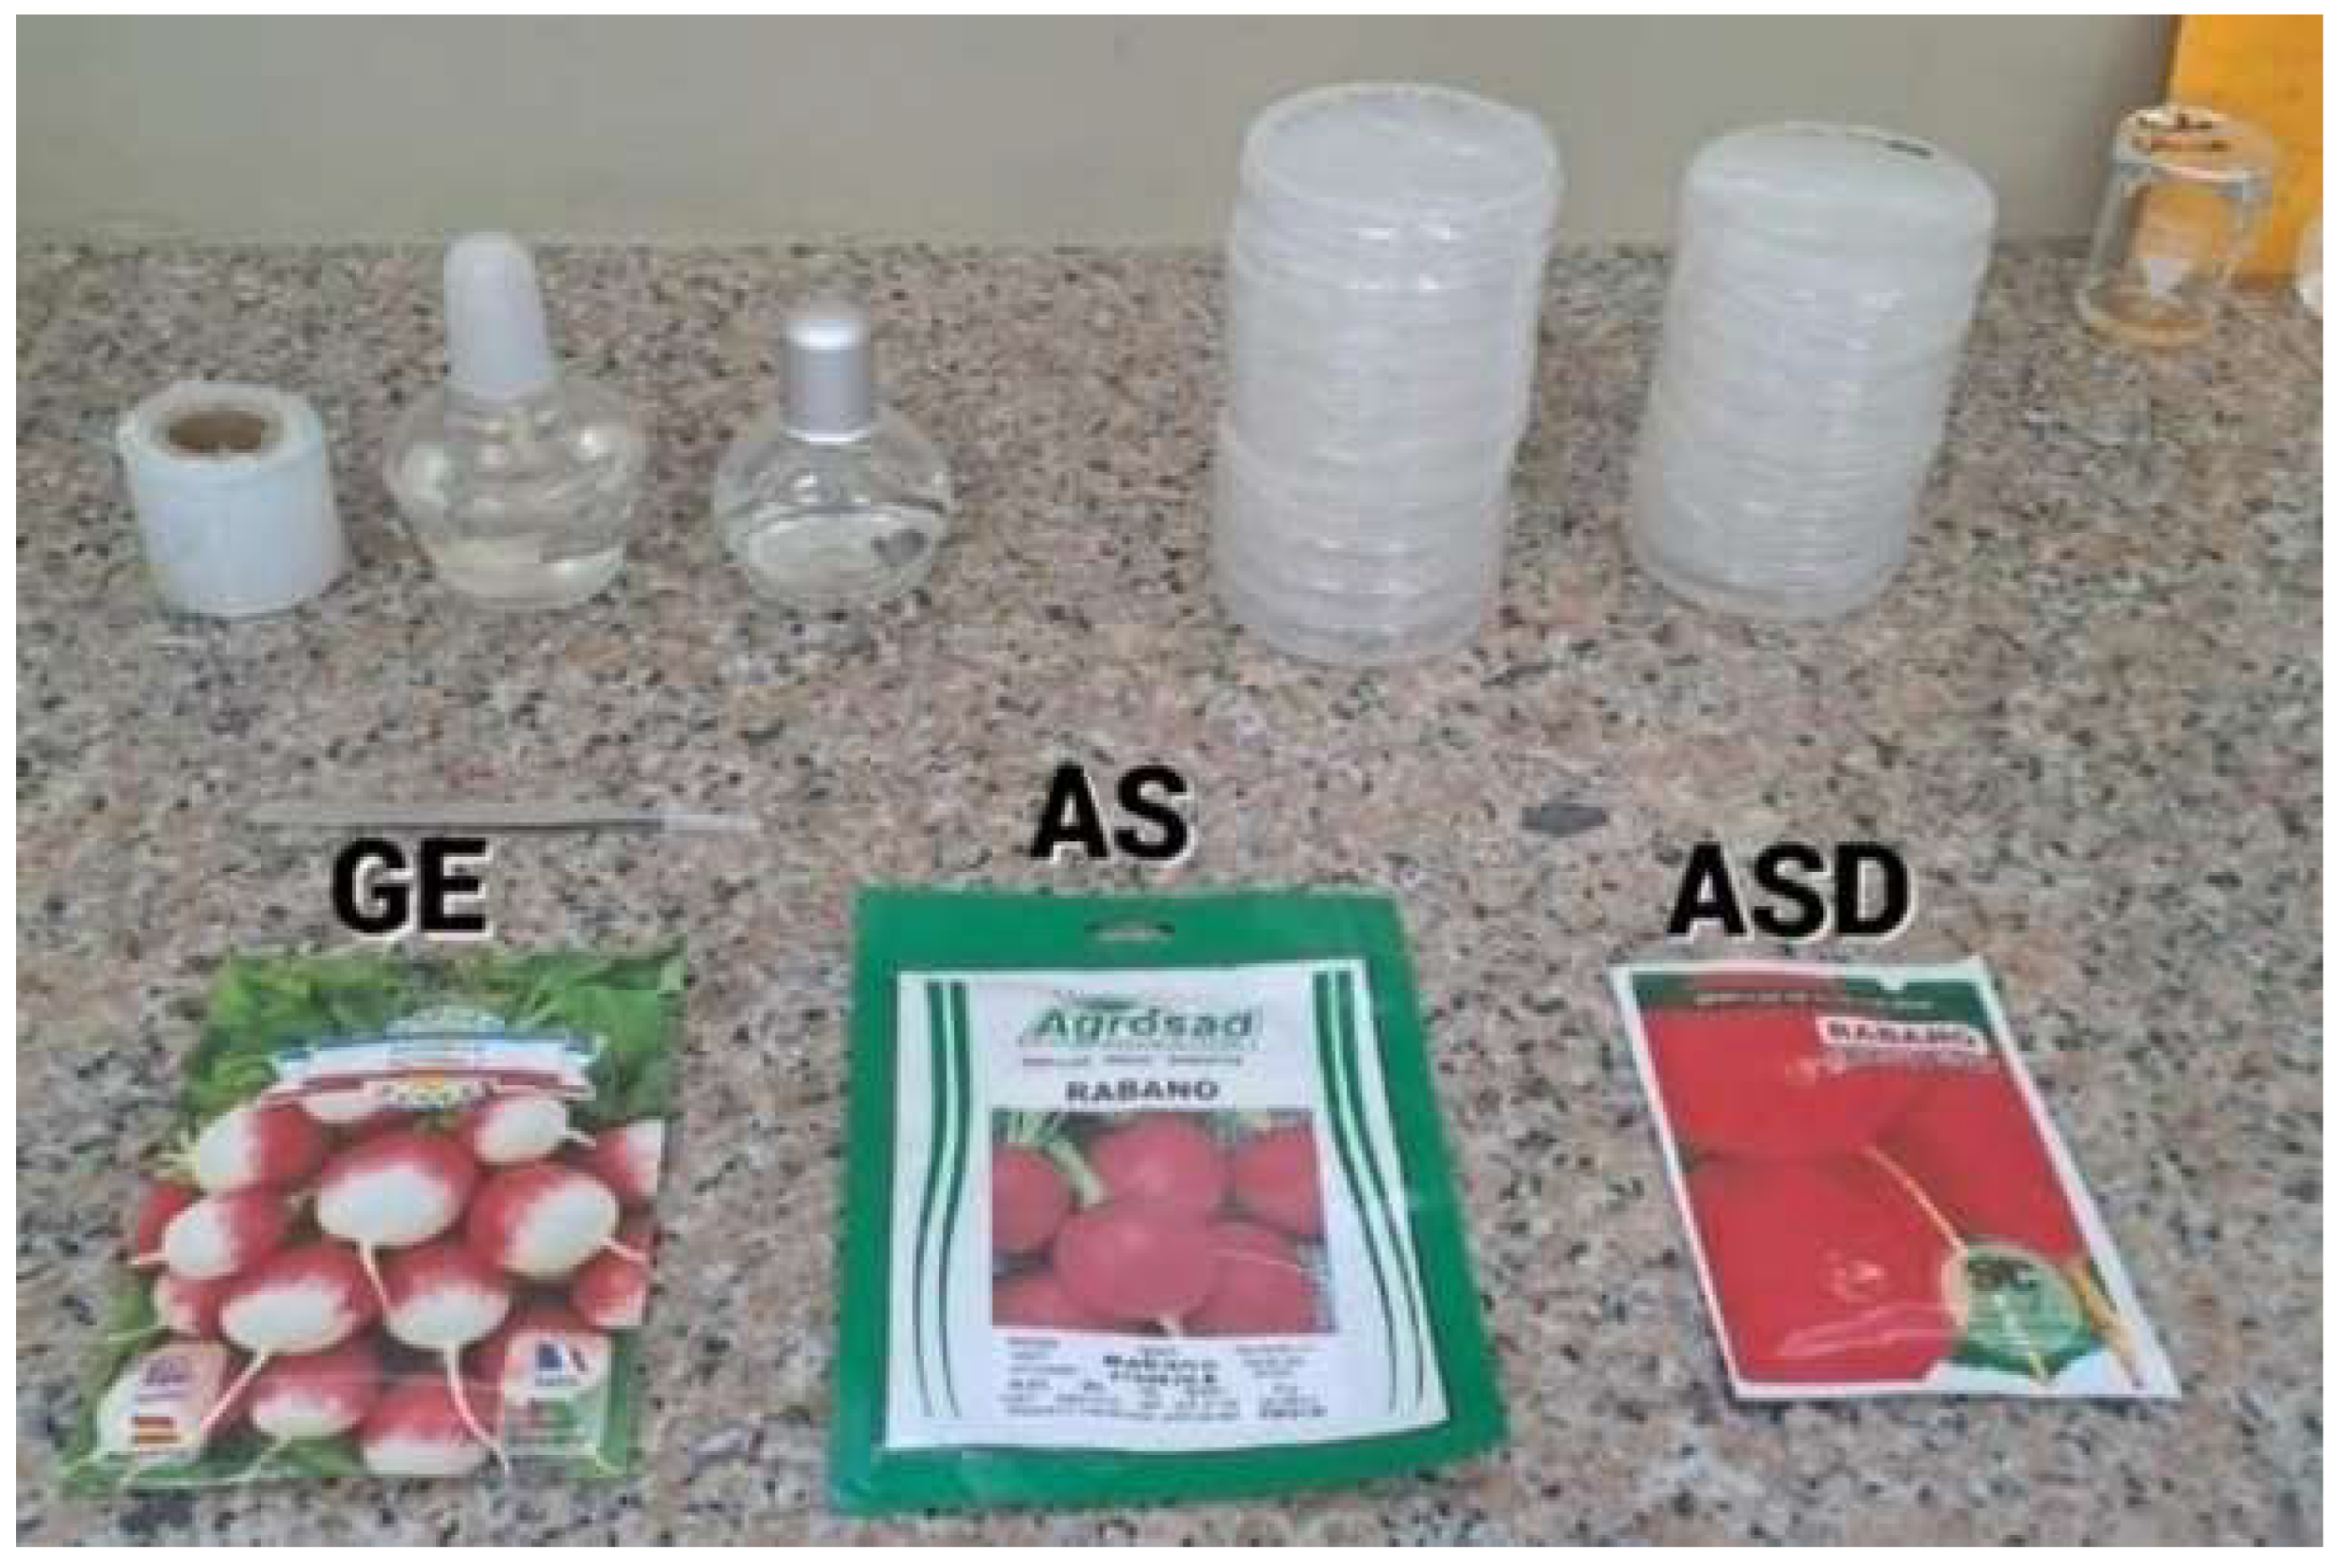
Figure 2.
Seed sowing arrangement in a 3 × 3 grid.
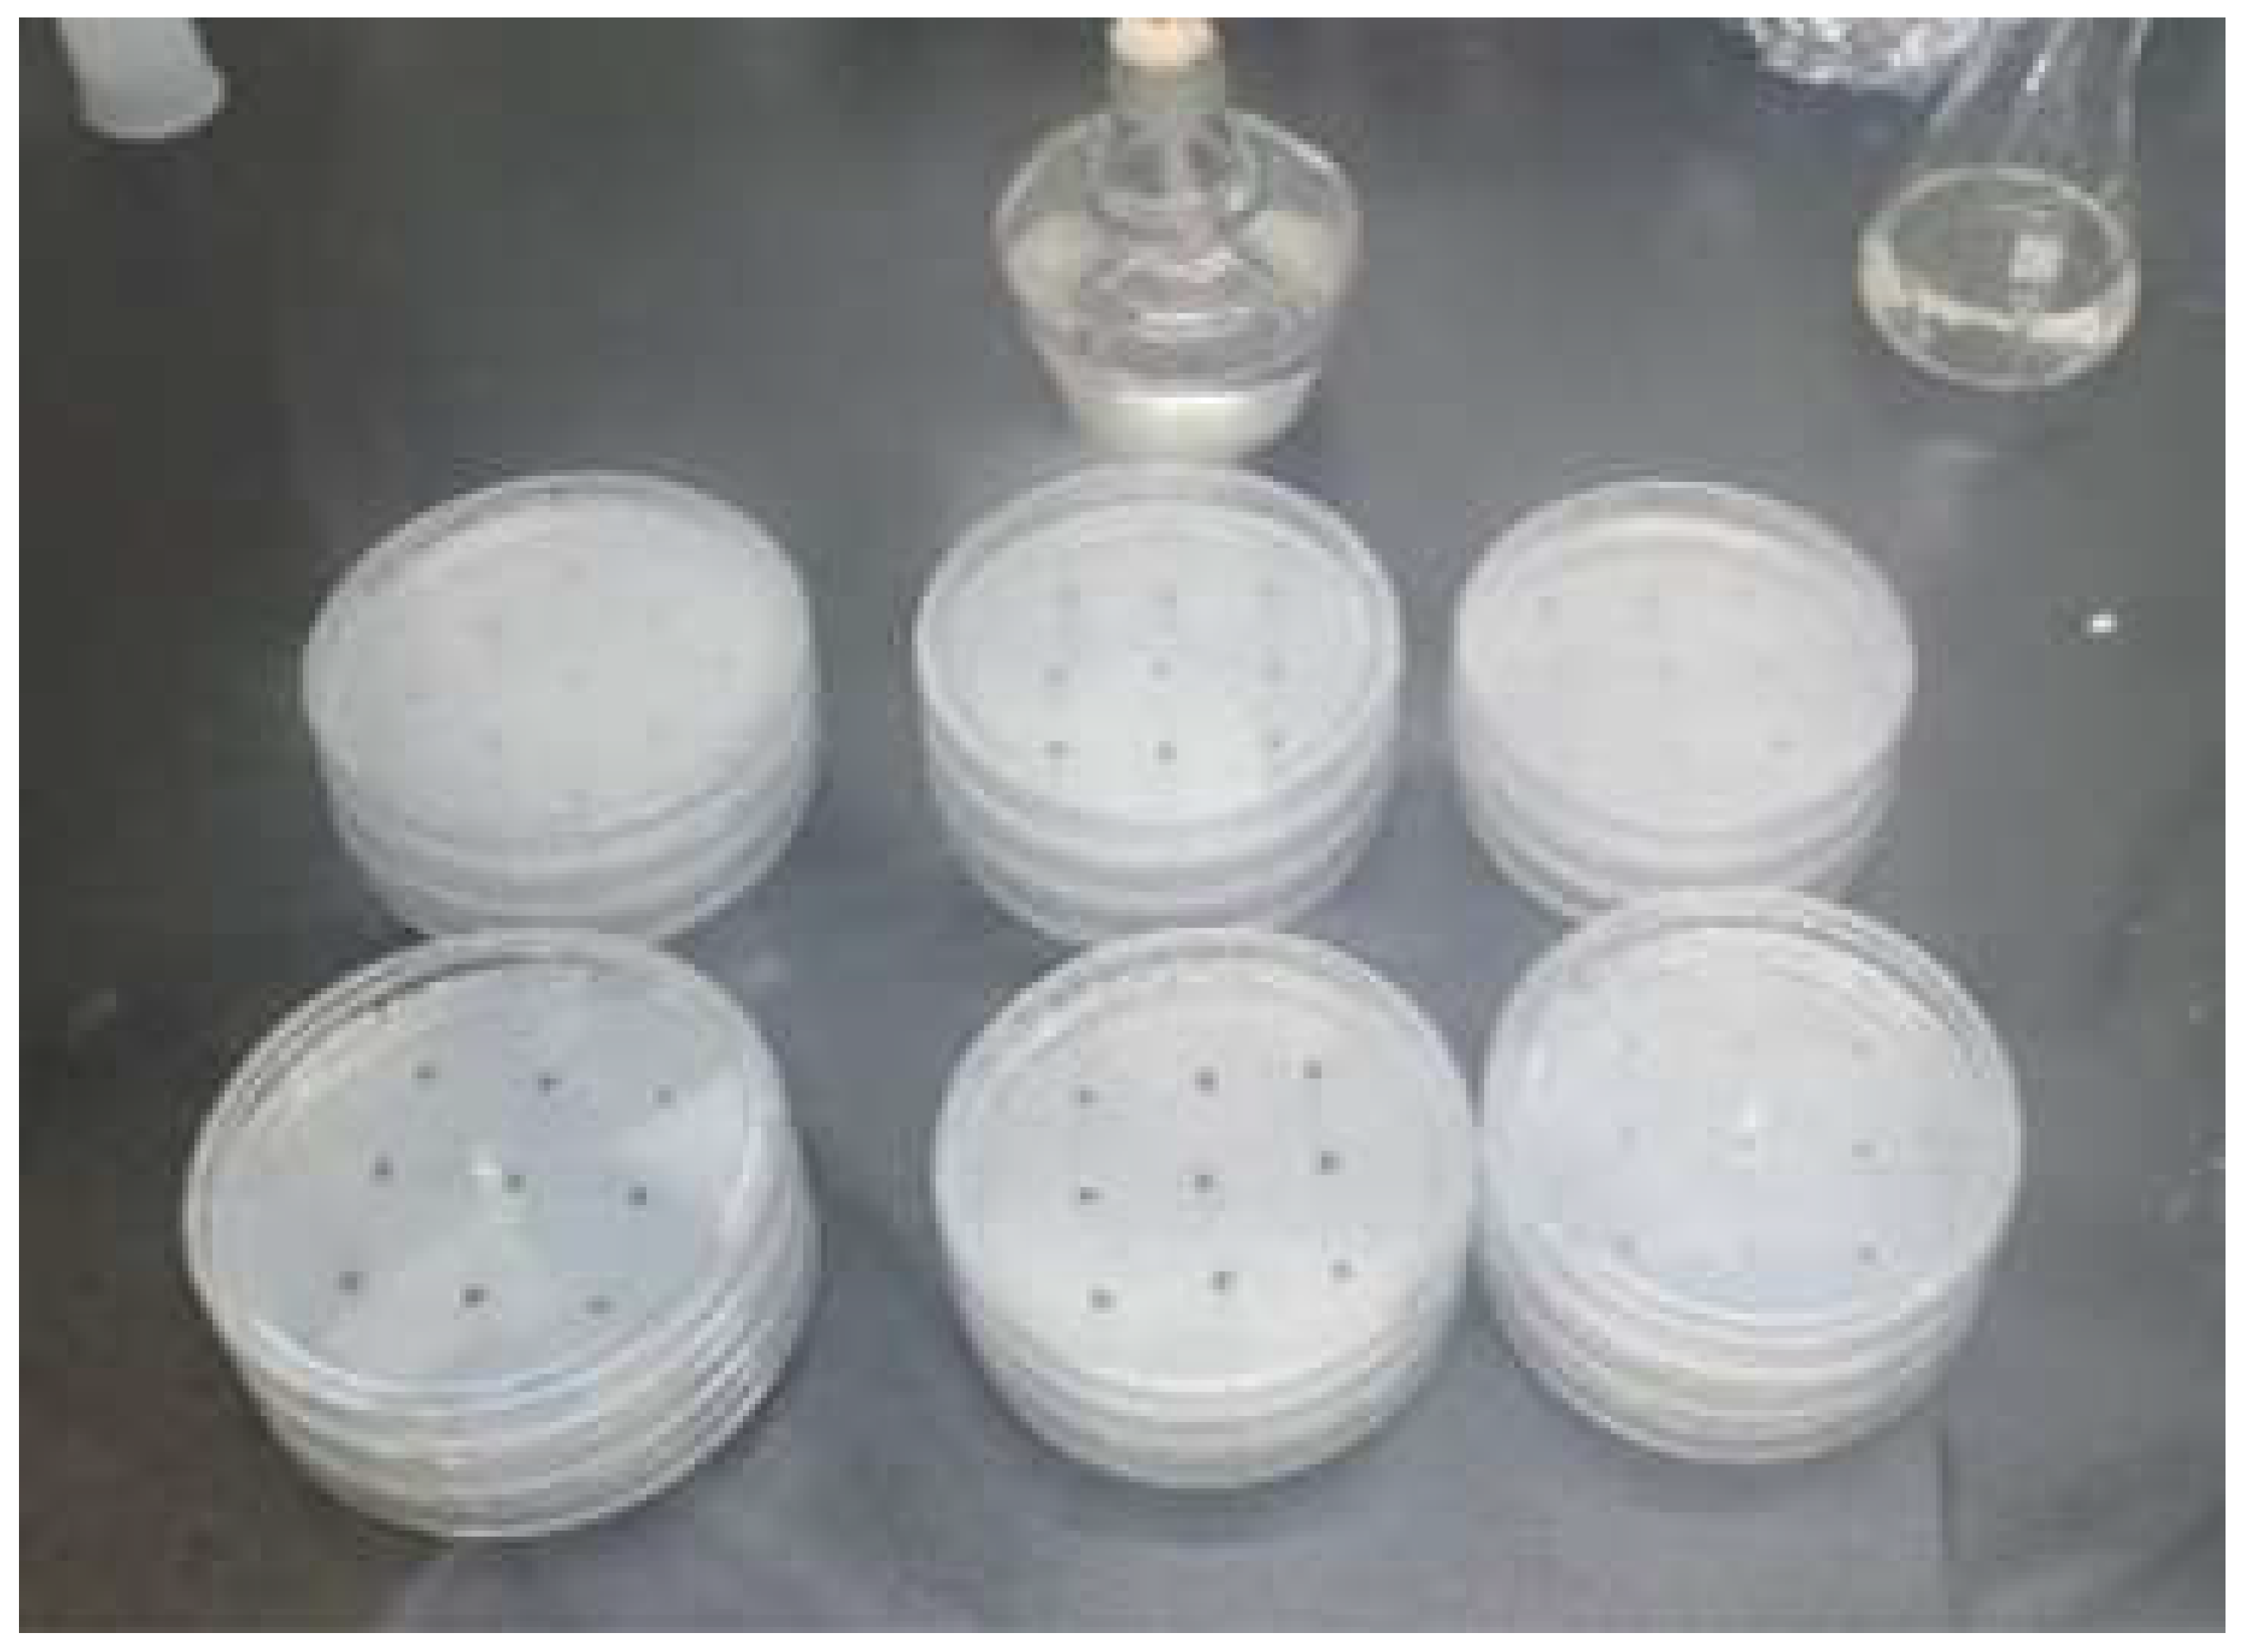
Figure 3.
Germination was recorded at 24 (A), 48 (B), and 72 (C) h of incubation. After 72 h, representative seedlings of each variety were photographed to illustrate differences in early root elongation under the evaluated conditions.
Figure 3.
Germination was recorded at 24 (A), 48 (B), and 72 (C) h of incubation. After 72 h, representative seedlings of each variety were photographed to illustrate differences in early root elongation under the evaluated conditions.
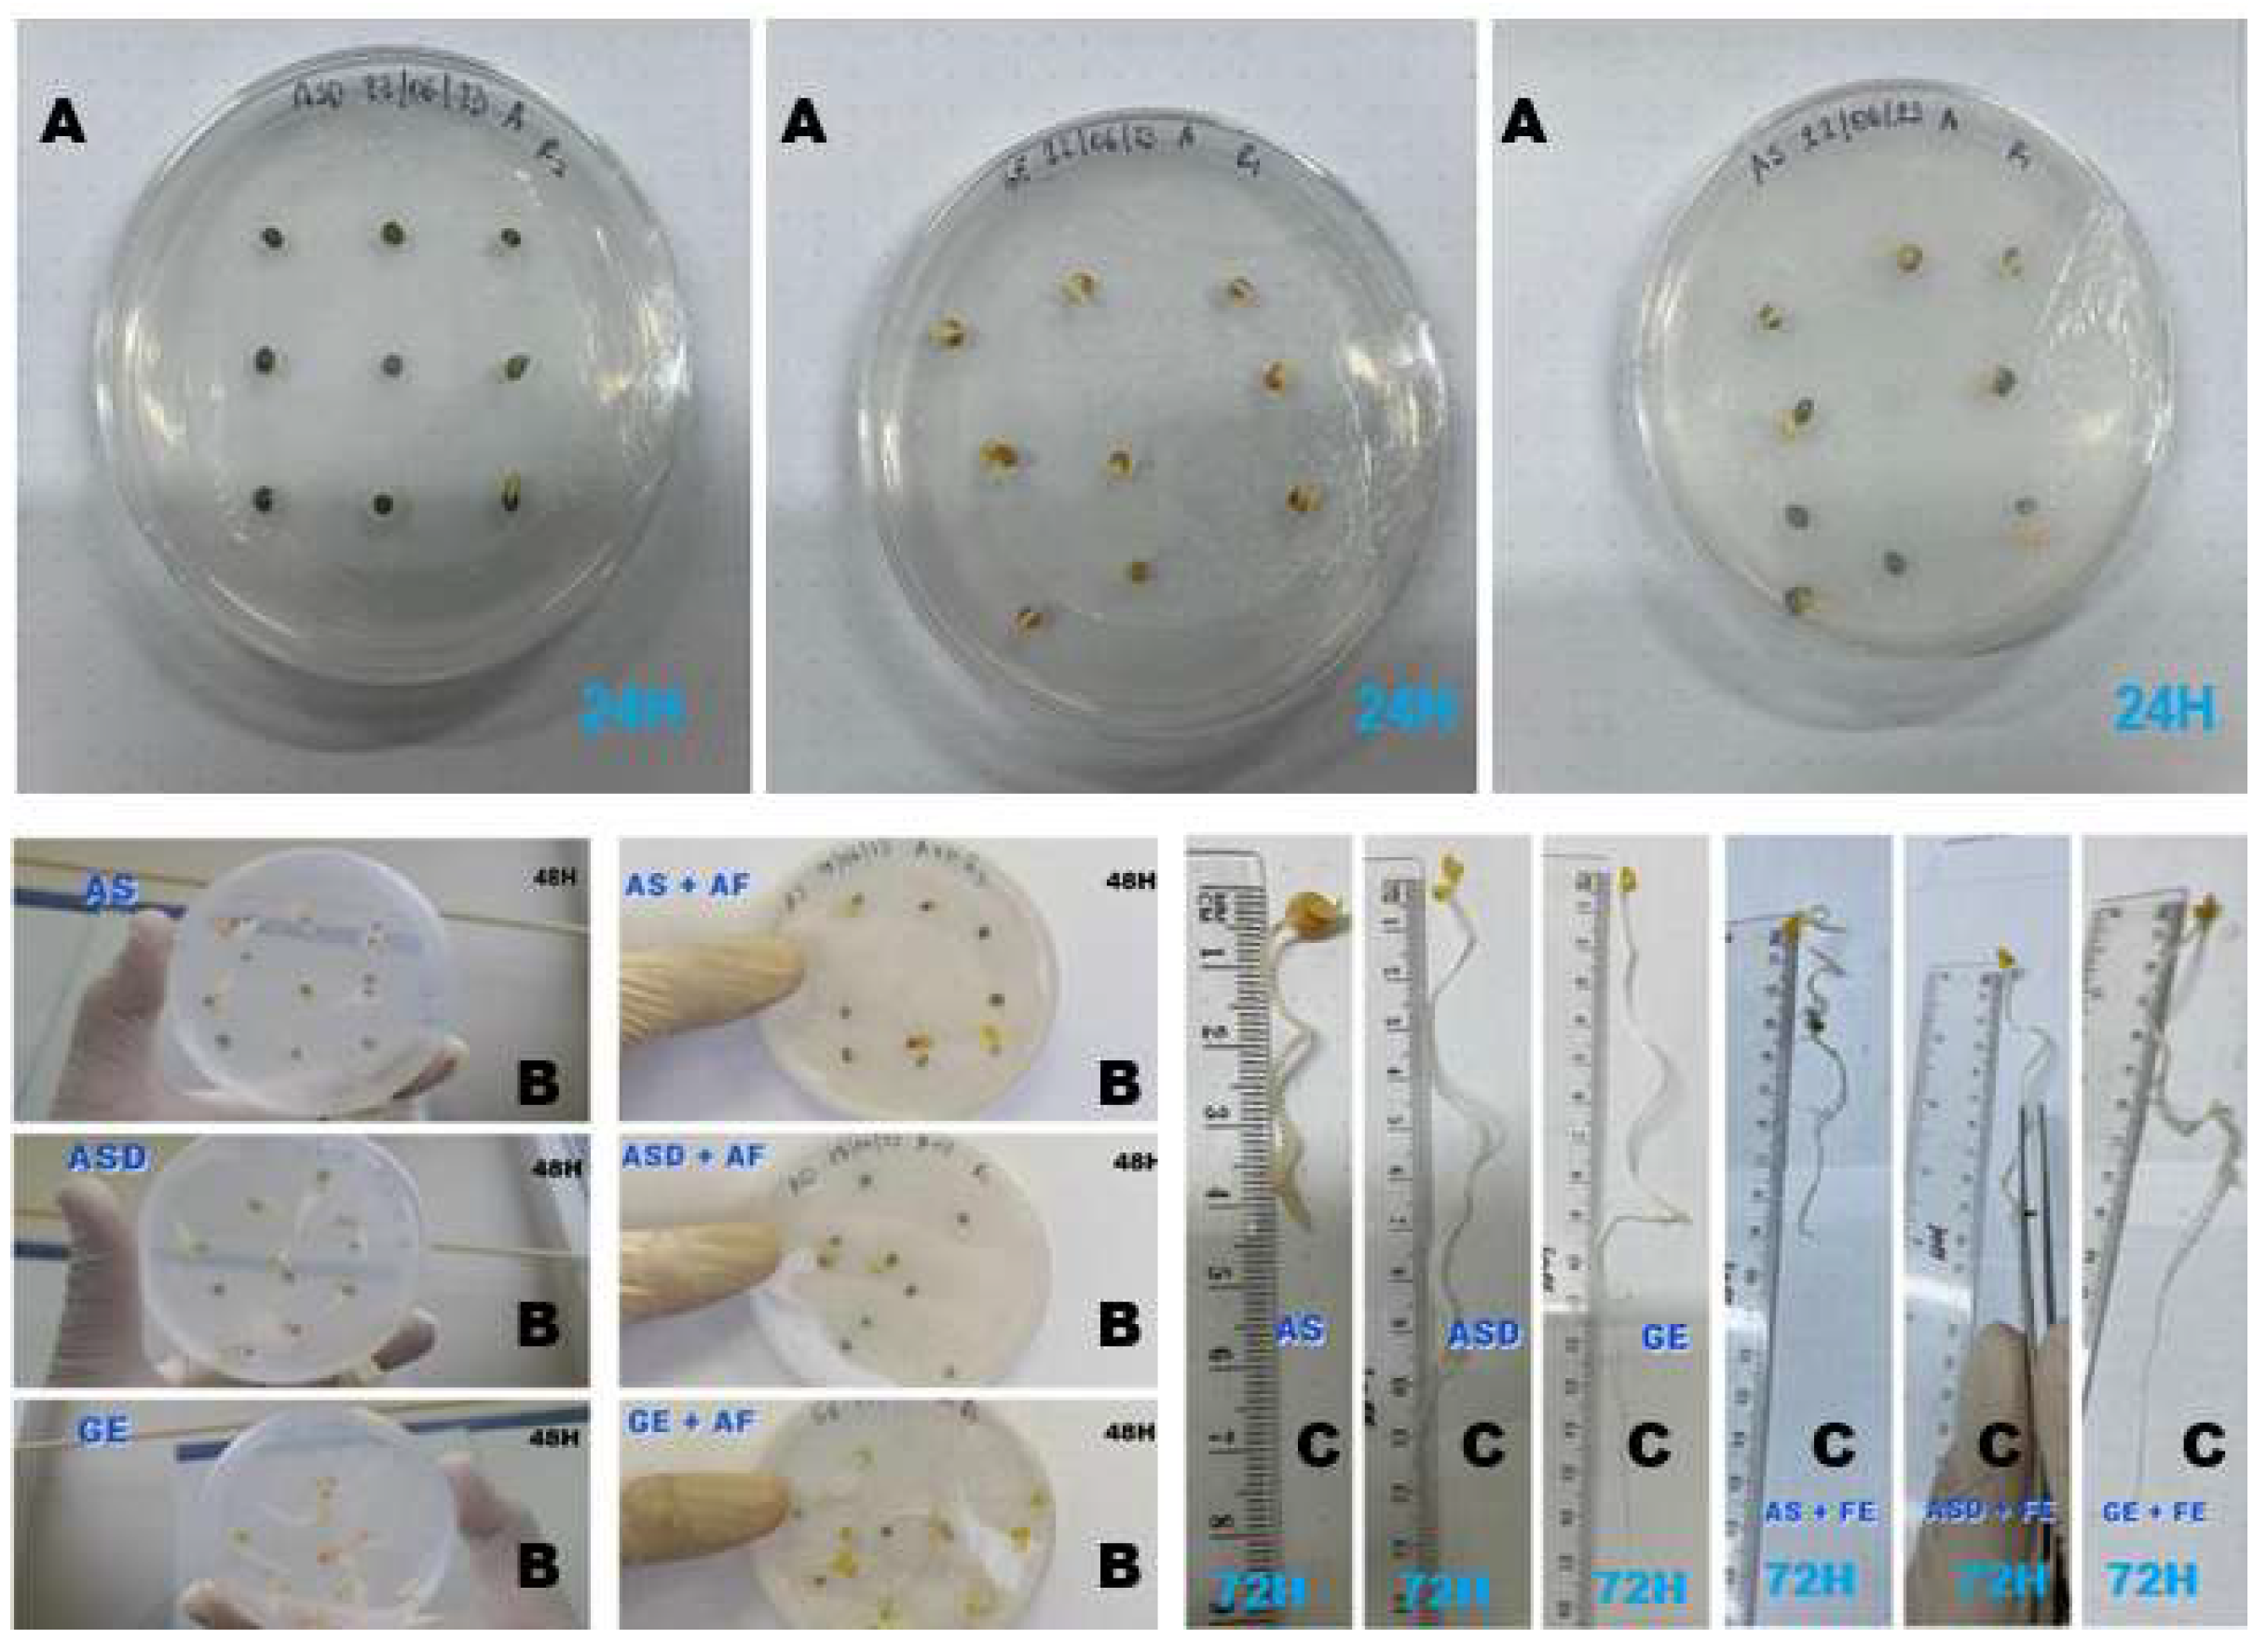
Figure 4.
PCA biplot for germination and vigour variables.
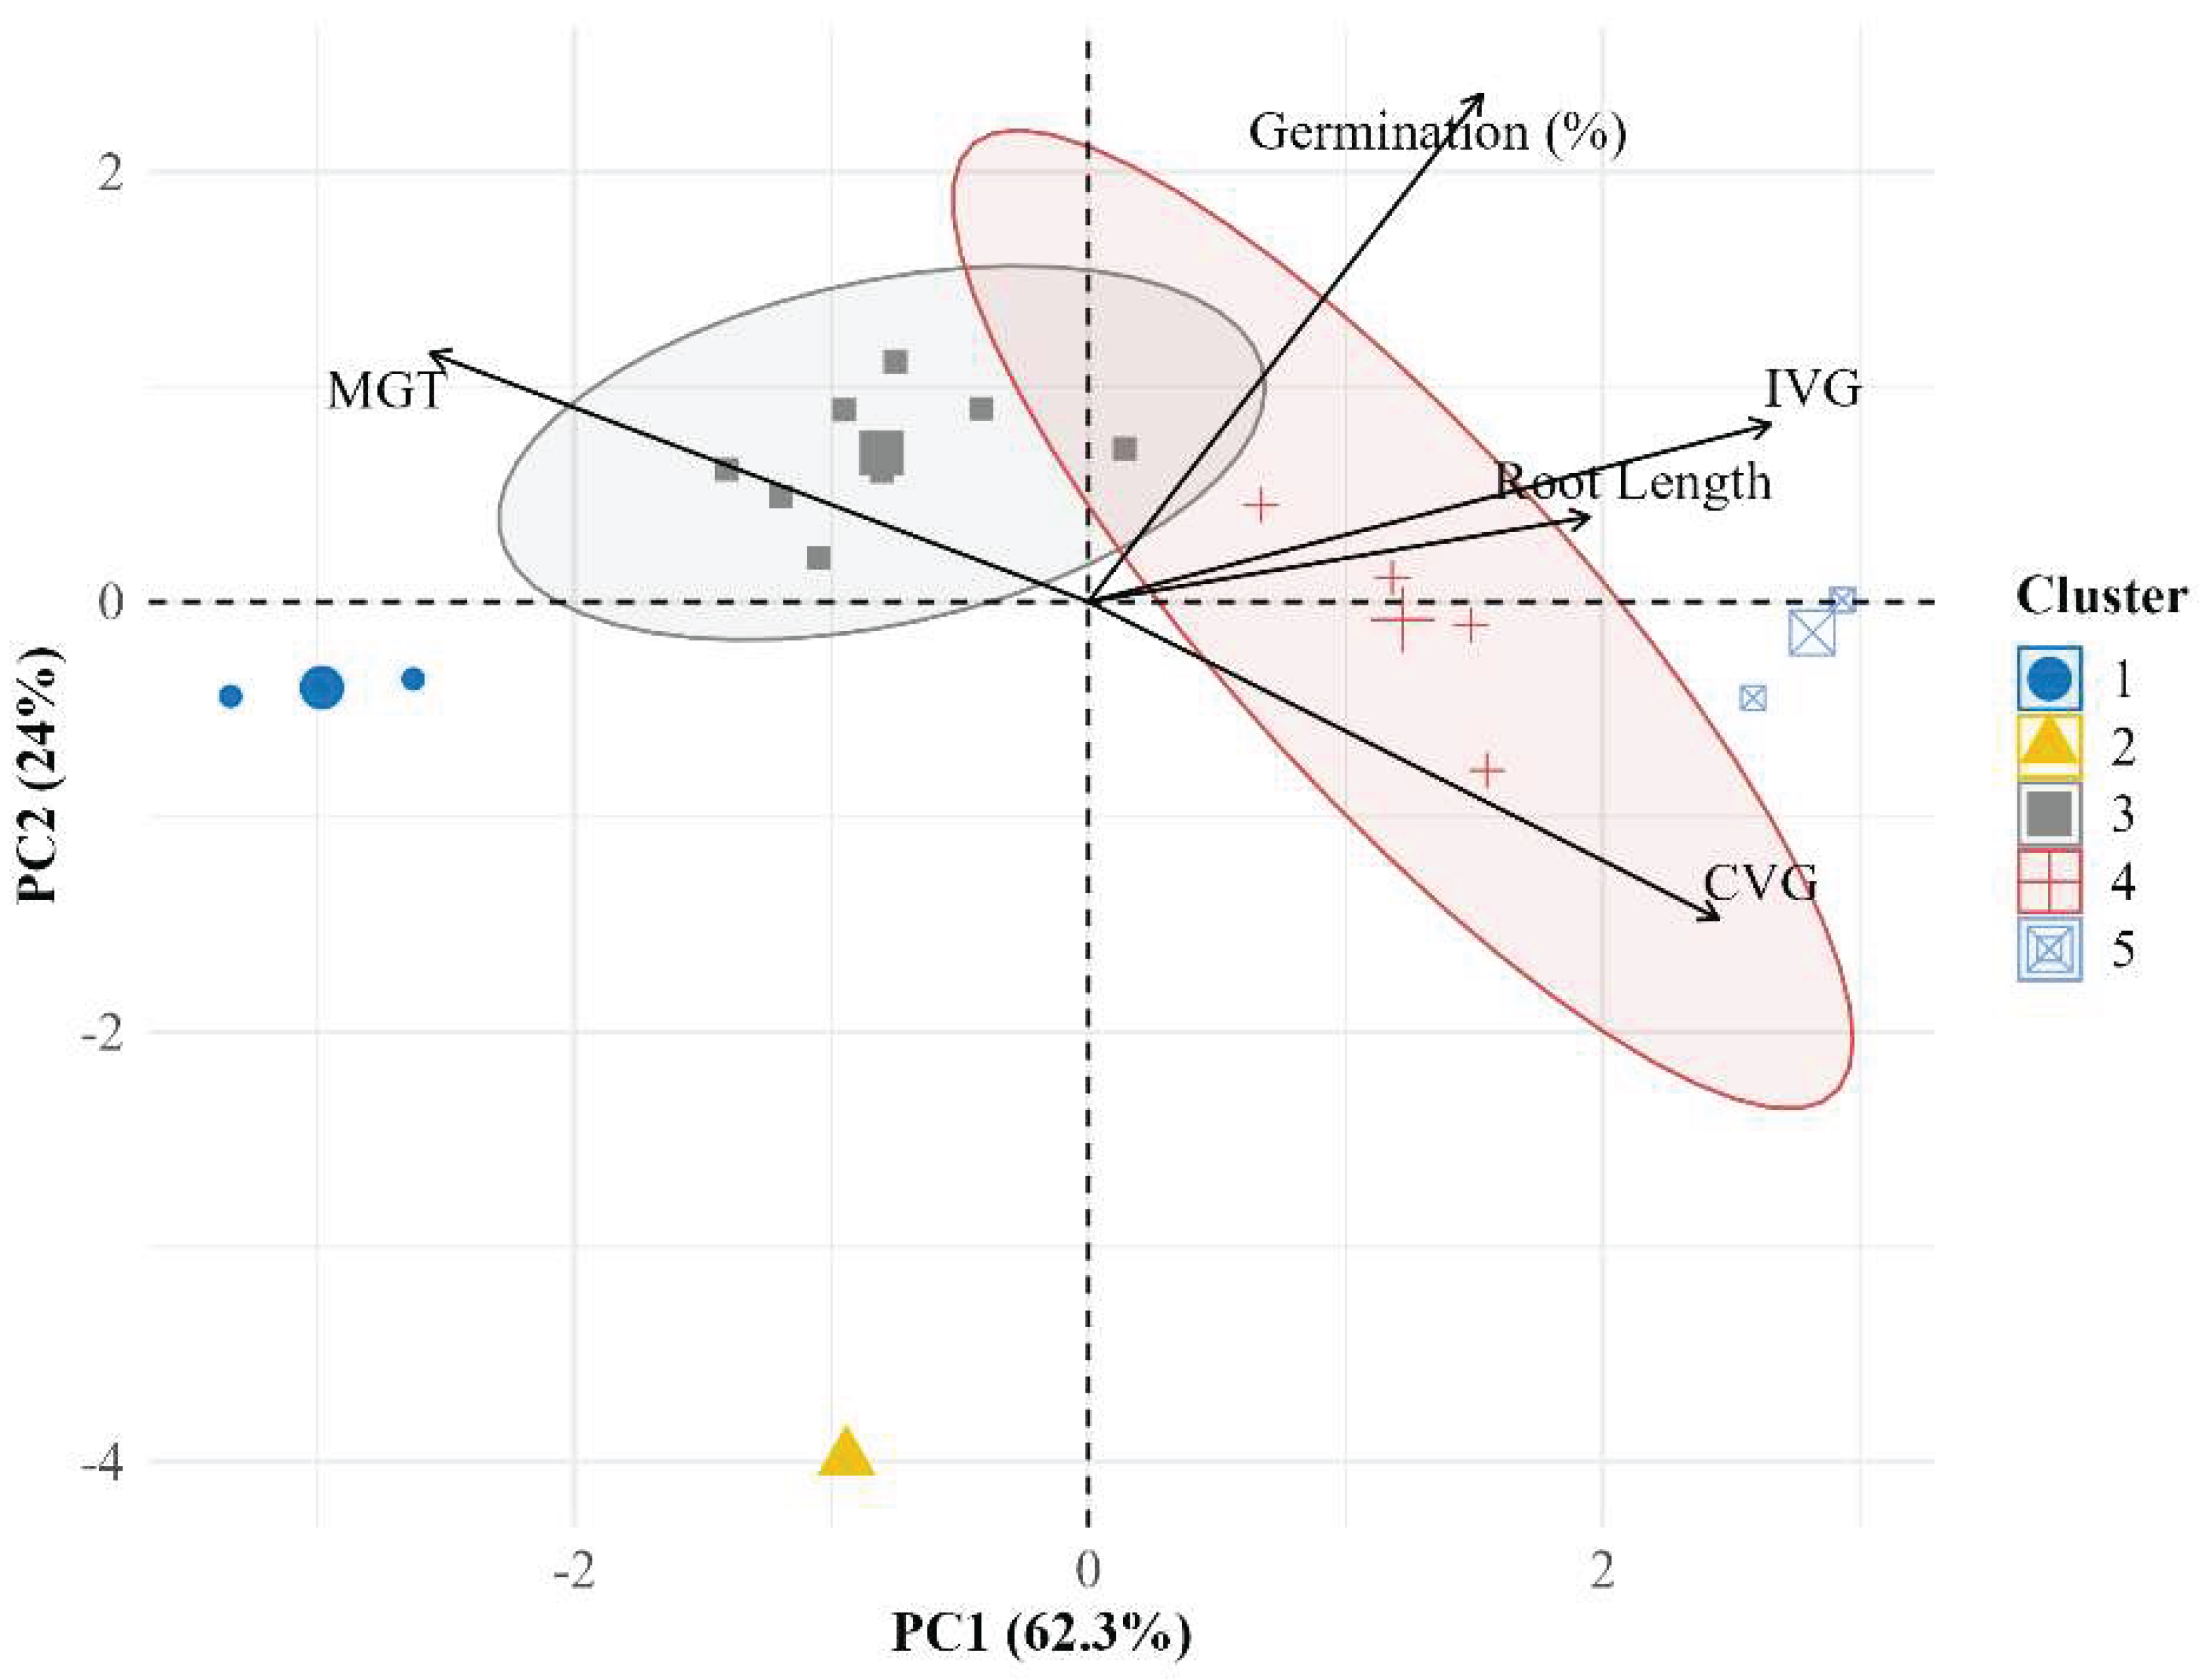
Figure 5.
Hierarchical clustering dendrogram of evaluated treatments.
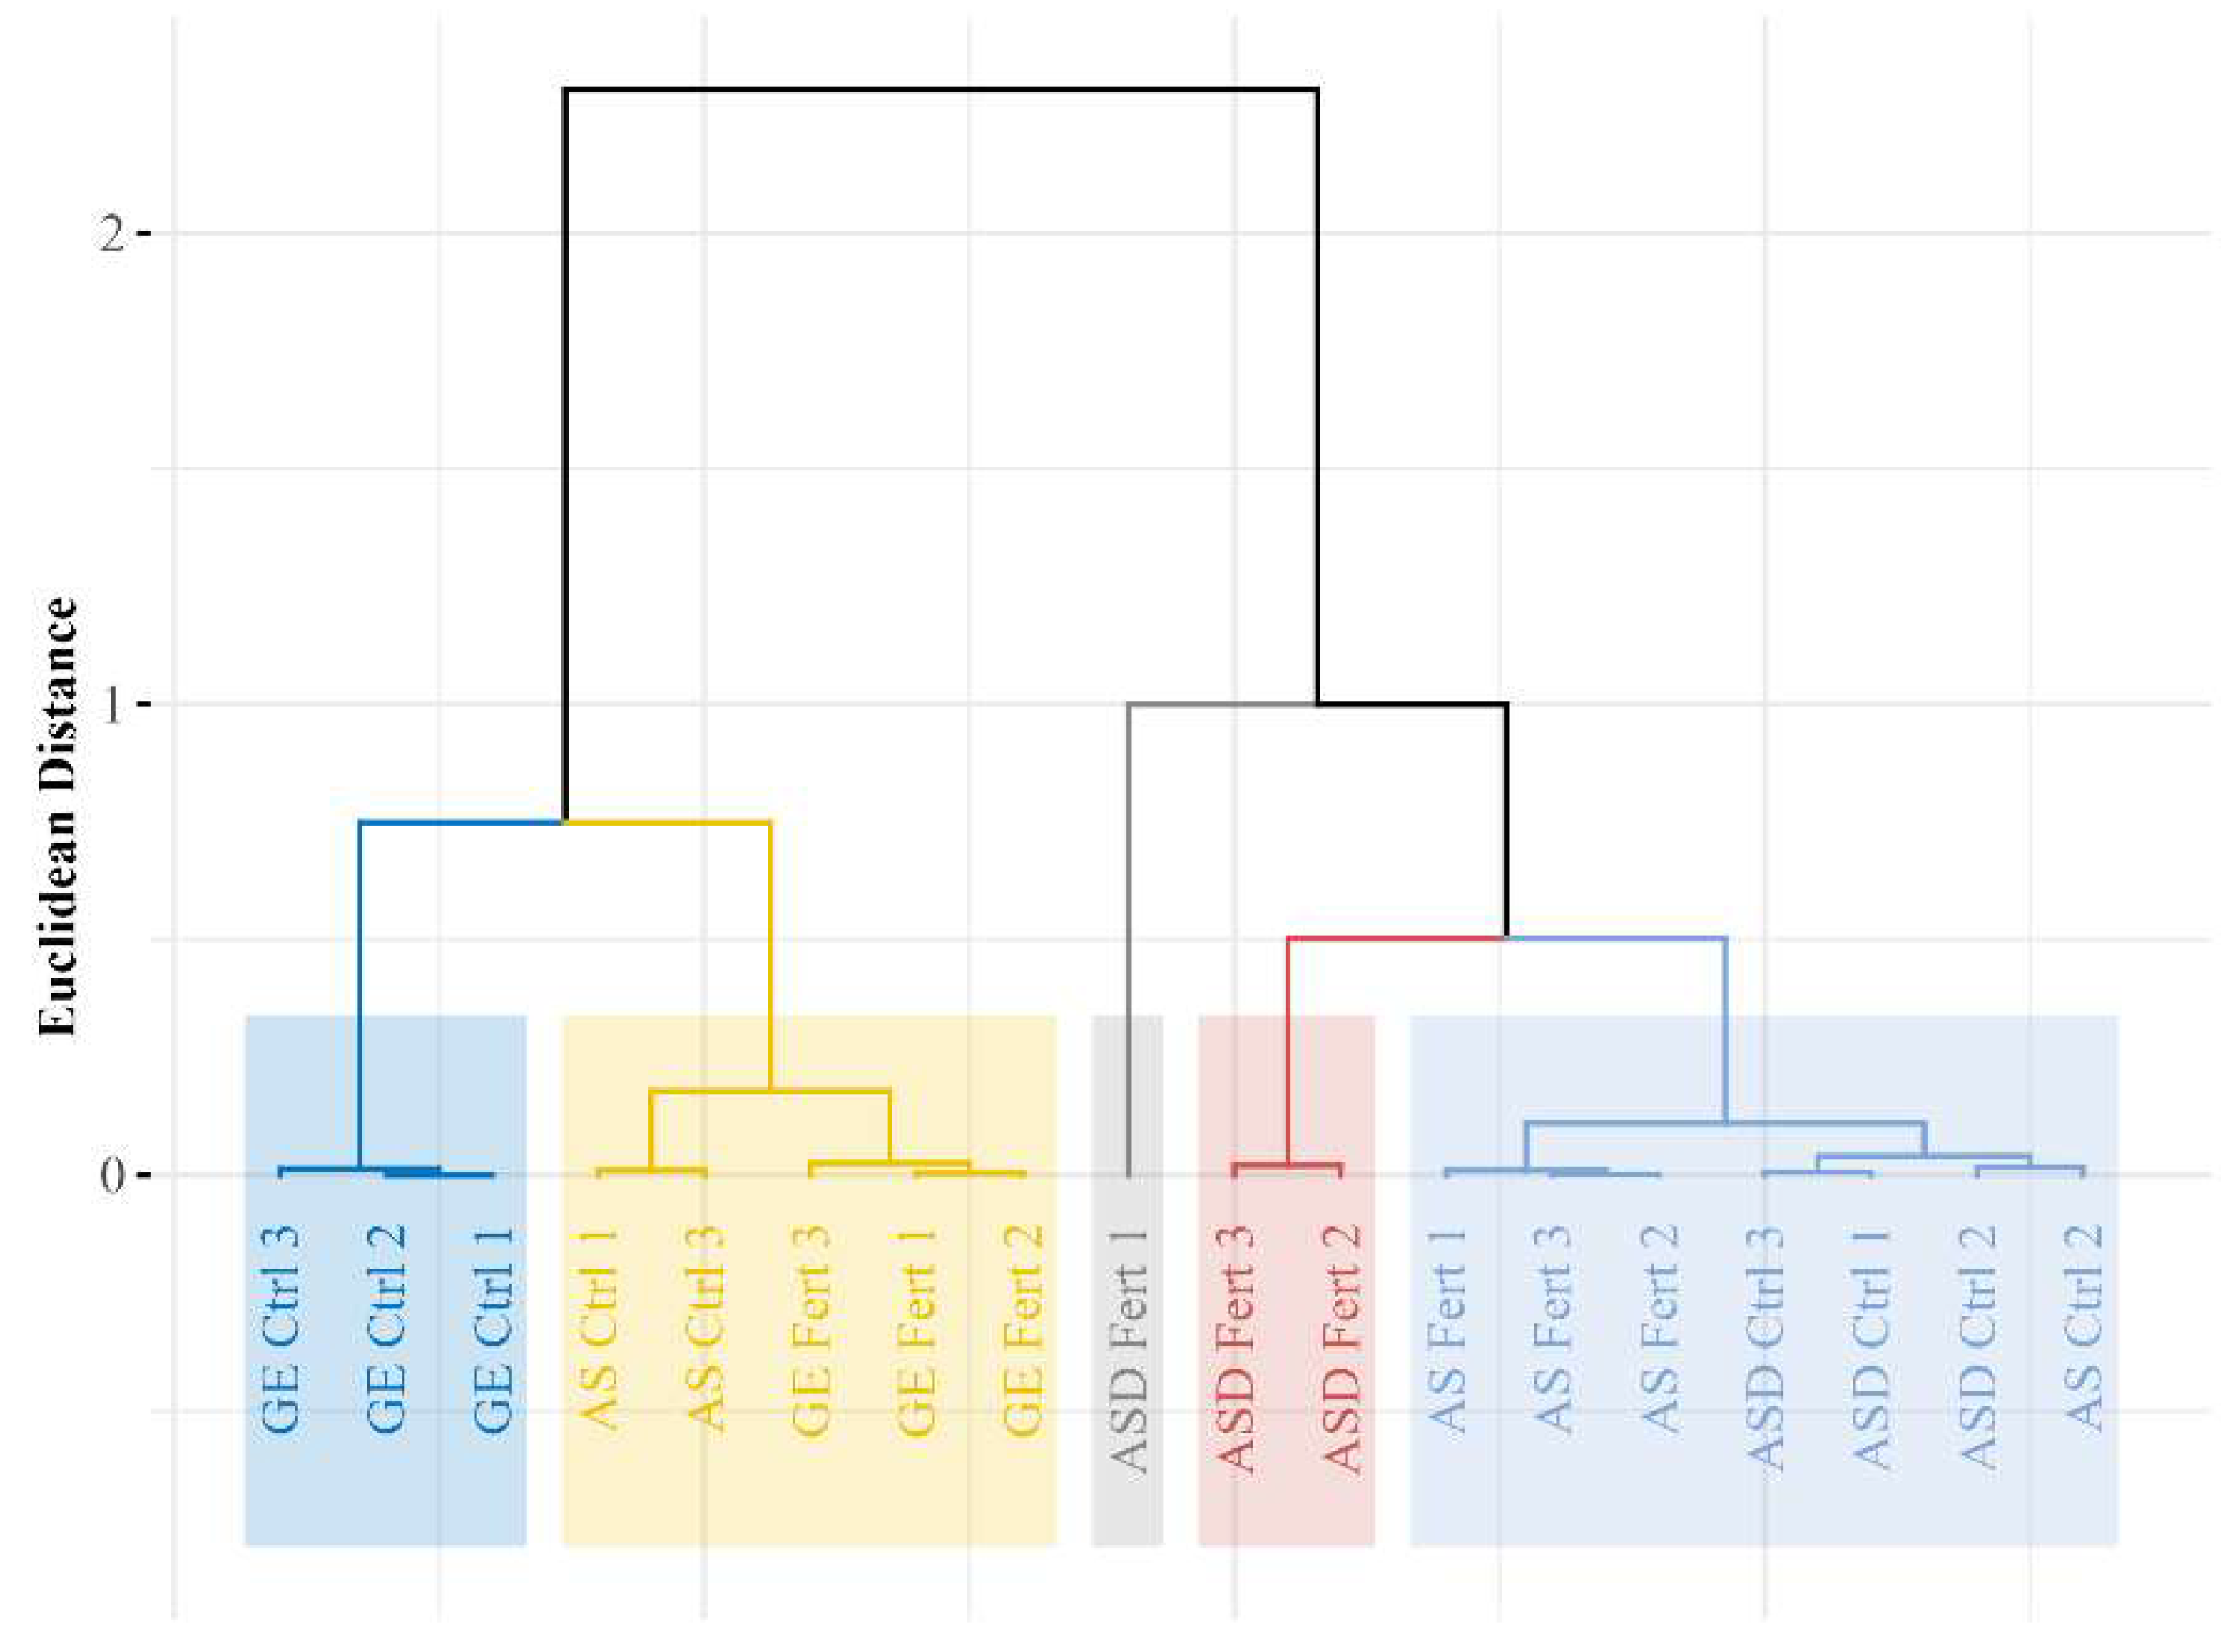
Figure 6.
Cumulative germination dynamics by treatment (mean ± SE).
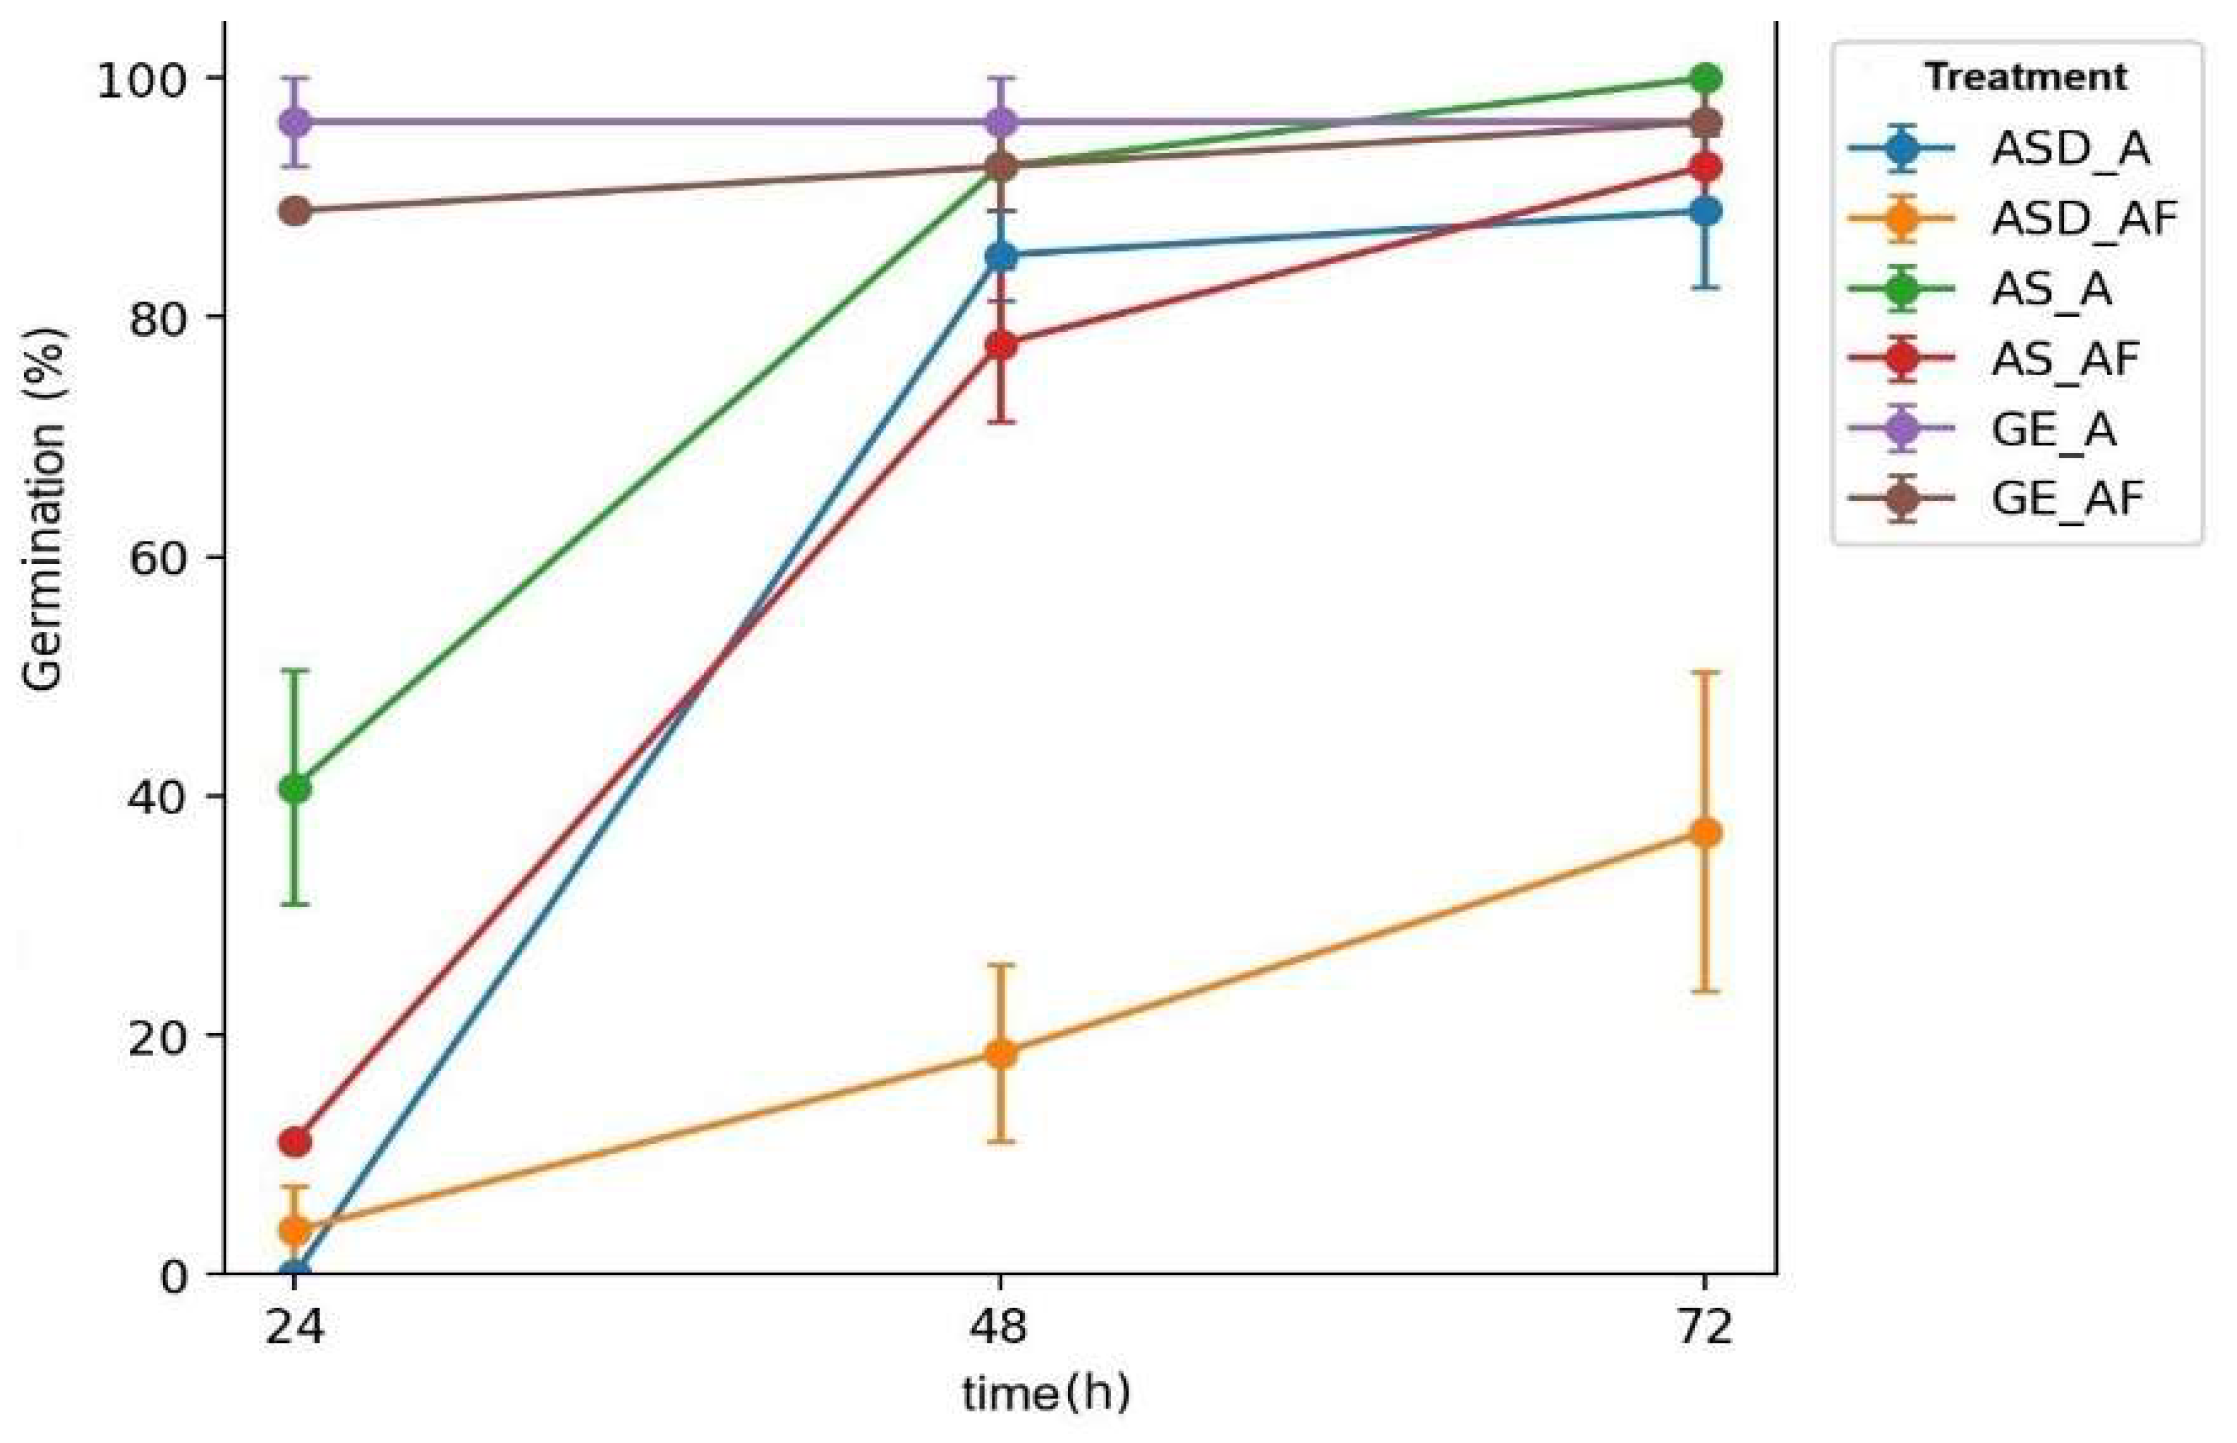

Table 1.
Structure of the 3 × 2 factorial design (CRD).
| Element | Description |
|---|---|
| Design type | Completely randomized design (CRD) |
| Arrangement | 3 × 2 factorial |
| Factor 1 | Variety (3 levels) |
| Variety levels | AS, ASD, GE |
| Factor 2 | Fertilization (2 levels) |
| Fertilization levels | A (no fertilizer), AF (supplemented) |
| Number of treatments | 3 × 2 = 6 combinations |
Table 2.
Experimental units, replication, and sample sizes by response variable.
| Response group / variable | Unit of analysis | Unit size | Replication / sampling | Per treatment | Total |
|---|---|---|---|---|---|
| Germination (counts and plate-level indices) | Petri dish | 9 seeds | 3 replicate plates per treatment | 3 plates | 6 × 3 = 18 plates |
| Root morphometry (72 h) | Petri dish | All germinated seedlings per plate (up to 9 seedlings) | 3 replicate plates per treatment; plate-level mean root length used for statistical analysis | 3 plates | 6 × 3 = 18 plates |
Table 3.
Culture media evaluated.
| Treatment | Medium | Composition (final concentration) | Preparation / sterilization | Purpose |
|---|---|---|---|---|
| A | No fertilizer | Agar-agar 1.5% (w/v) in distilled water | Dissolve and autoclave | Control (no mineral input) |
| AF | Supplemented | Agar-agar 1.5% (w/v) + commercial inorganic NPK fertilizer (3 g/L) | Prepare agar base; add NPK and homogenize before gelation; autoclave | Assess mineral supplementation effect |
Table 4.
Surface sterilization and aseptic handling prior to sowing.
| Step | Reagent / action | Condition | Purpose |
|---|---|---|---|
| 1 | Sodium hypochlorite (NaOCl) immersion | 2% for 10 min | Reduce surface microbial load |
| 2 | Rinsing | Multiple rinses with sterile distilled water | Remove disinfectant residues |
| 3 | Plate sealing | Parafilm | Maintain asepsis and humidity during incubation |
Table 5.
Summary of statistical analyses by variable.
| Variable group | Variable(s) | Unit of analysis | Model / test | Multiple comparisons / adjustment |
|---|---|---|---|---|
| Germination (plate level) | %G, IVG, CVG | Petri dish (N = 9 seeds); 3 replicates per treatment | 3 × 2 factorial ANOVA (Variety × Fertilization) | Tukey HSD if [22] |
| Germination time | MGT | Plate | Kruskal–Wallis (nonparametric) [23] | Pairwise Wilcoxon with Benjamini–Hochberg adjustment [24,25] |
| Root morphometry | Root length (72 h) | Plate-level mean root length (N = 18 plates | Independent 3 × 2 factorial ANOVA (observations not paired by plate) [21] | Tukey HSD if [22] |
| Multivariate | Standardized variable set | Treatment / observation | PCA on standardized matrix [26,27,28] | HCPC using Ward + Euclidean distance [28,29] |
Table 6.
Summary of univariate (ANOVA) and multivariate (MANOVA) analyses evaluating genotype and ionic-environment effects.
Table 6.
Summary of univariate (ANOVA) and multivariate (MANOVA) analyses evaluating genotype and ionic-environment effects.
| Source of variation | DF | MANOVA (Pillai) | ANOVA Germination | ANOVA IVG | ANOVA Root |
|---|---|---|---|---|---|
| Variety (V) | 2 | 1.73*** | F = 17.05*** | F = 169.82*** | F = 7.87*** |
| Fertilization (F) | 1 | 0.80*** | F = 13.47** | F = 35.77*** | F = 12.20*** |
| Interaction (V × F) | 2 | 1.18** | F = 9.05** | F = 5.43* | F = 7.12** |
| Residuals | 12 |
Note. DF: degrees of freedom. Values are Fisher’s F statistic, except for MANOVA (Pillai’s trace). Significance: p < 0.05 *; p < 0.01 **; p < 0.001 ***.
Table 7.
Effect of variety and fertilization on germination and morphometry parameters of Raphanus sativus L.
Table 7.
Effect of variety and fertilization on germination and morphometry parameters of Raphanus sativus L.
| Variety | Fertilization | Germination (%) | MGT (h) | IVG (index) | Root length (cm) |
|---|---|---|---|---|---|
| AS | Control | ||||
| Fertilized | |||||
| ASD | Control | ||||
| Fertilized | |||||
| GE | Control | ||||
| Fertilized |
Note. Data are mean ± SD, with n = 3 plates per treatment for both germination variables and root length (plate-level means; each plate contained up to 9 seedlings). Different letters within the same column indicate significant differences by Tukey’s HSD (p < 0.05).
Table 8.
Variable contributions to principal components (PCA) and variance explained in the phenotypic profile.
Table 8.
Variable contributions to principal components (PCA) and variance explained in the phenotypic profile.
| Component | Variable | Loading | Explained variance (%) | Cumulative variance (%) |
|---|---|---|---|---|
| PC1 (Vigour) | IVG | 0.92 | 62.31 | 62.31 |
| MGT | -0.87 | |||
| Root length | 0.82 | |||
| PC2 (Germination) | % G | 0.94 | 24.05 | 86.36 |
| CVG | 0.65 |
Note. Loadings shown are correlations ≥ 0.60. PC1 is primarily associated with speed and growth (vigour), whereas PC2 describes overall germination capacity.
Disclaimer/Publisher’s Note: The statements, opinions and data contained in all publications are solely those of the individual author(s) and contributor(s) and not of MDPI and/or the editor(s). MDPI and/or the editor(s) disclaim responsibility for any injury to people or property resulting from any ideas, methods, instructions or products referred to in the content. |
© 2026 by the authors. Licensee MDPI, Basel, Switzerland. This article is an open access article distributed under the terms and conditions of the Creative Commons Attribution (CC BY) license (http://creativecommons.org/licenses/by/4.0/).
Copyright: This open access article is published under a Creative Commons CC BY 4.0 license, which permit the free download, distribution, and reuse, provided that the author and preprint are cited in any reuse.


