
Submitted:
14 July 2023
Posted:
17 July 2023
You are already at the latest version
Abstract
Image analysis is widely applied in plant science for phenotyping and monitoring botanic and agricultural species. Although a lot of software is available, tools integrating image analysis and statistical assessment of seedling growth in large groups of plants are limited or absent, and do not cover the needs of the researchers. In this study, we developed Morley, a free, open-source graphical user interface written in Python. Morley automates the following workflow: (1) group-wise analysis of a few thousand seedlings from multiple images; (2) recognition of seeds, shoots and roots in seedling images; (3) calculation of shoot and root lengths and surface areas, (4) evaluation of statistically significant differences between plant groups, (5) calculation of germination rates, (6) visualization and interpretation. Morley is designed for laboratory studies of biotic effects on seedling growth, when molecular mechanisms underlying morphometric changes are analyzed. Performance was tested using cultivars of T. aestivum, P. sativum on seedlings of up to 1 week old. Accuracy of the measured morphometric parameters was comparable with the ones obtained using ImageJ and manual measurements. Dose-dependent laboratory tests for germination affected by new bioactive compounds and fertilizers, assuming extraction of seedlings from a substrate and/or dissection are among the suggested applications.
Keywords:
computer vision
; fertilizers
; germination
; morphometry
; wheat
; seedlings
1. Introduction
Machine learning and computer vision are at the front end of the methods that solve the multiple tasks of agriculture including seed quality control [1]. Since seed vigor and germination rates are the key factors impacting crop production [2,3], the smart assessment of germination and seedling growth remains of high interest for years [4,5,6,7,8,9,10,11]. The need for effective seed quality control drives the development of automated procedures to replace or reduce manual labor [4,12]. The software can be divided into two groups that differ by application, i.e. laboratory or in-field usage. Laboratory usage assumes research and development (R&D) of new bioactive chemicals, fertilizers and crop cultivars, including an early stage before greenhouse and field trials. The R&D step often requires analysis of multiple images taken with a photo camera under different conditions at different time points. The resulting RGB images are used to determine germination rates, lengths and shapes of shoots and roots, and other morphometric and phenotypic parameters. In-field usage suggests real-time monitoring that is implemented using video cameras and subsequent video data analysis.
Software for intra-laboratory tests can be further classified into groups depending on the tasks to be solved: germination tests, morphometry and phenotyping plant organs. Calculation of germination rates (a fraction of seeds with radicle emergence at the end of the experiment) is based on classification of seeds into the germinated and non-germinated classes [11,13,14]. This classification can be supplemented with recognition of different phenotypes [6] or specific structural subtypes of seedlings, computing the length of a seedling, growth speed and vigor index [9]. Some methods for evaluation of seed germination are grounded on usage of color threshold that requires a sufficient contrast between the seed and radicle [8]. Another option is using machine learning instead of manual color adjustment to speed up the automated estimation of seed germination [5,11]. Some software to characterize seed germination over time is species-specific [7]. Typically, the software aimed at germination tests is not supplemented with options of geometric morphometry, phenotyping and statistical analysis of differences between plant groups.
Next group of tools for image analysis covers plant morphometry and phenotyping [15,16,17,18,19,20]. Plant phenotyping toolkits are needed to provide high throughput plant species identification in databases, and functionality to classify and characterize a diversity within the species [21,22]. Phenotyping is grounded on accurate morphometric tools that boost a reproducible extraction of phenotypic features. Morphometric parameters are also widely used to detect biotic and abiotic effects from biochemicals, fertilizers and/or environmental conditions. In this case, lengths, angles, surface areas and numbers of plant organs are of interest. Literature analysis revealed that leaf, shoot and root lengths and surface areas of seedlings are often measured using ImageJ, a freely available tool for multi-purpose image analysis [23,24,25,26,27,28]. At the same time, analysis with ImageJ is often restricted to a few dozen plants due to a hard manual pre-processing of images required to select the objects of interest. Generally, a diversity of software for plant image analysis becomes obvious through launching a software database at https://www.quantitative-plant.org/software (access date May 17, 2023). Although many tools have been developed, an expert opinion emphasizes the lack of robust validation and long-term support of software [29]. In our experience, there is a lack of tools for integrating the following tasks in one automated workflow: image analysis of up to a few thousand plant objects, calculation of germination rates, measuring lengths and surface areas and statistical interpretation of the differences in geometric morphometry. Such a tool should provide on-the-fly conclusions on the differences between plant groups, accepting at input the multiple plant images and outputting the results of statistical analysis.
This need occurred in the studies of molecular mechanisms of crop response to new bioactive compounds under laboratory conditions. Preparing seedlings for molecular analyses (i.e. micro elemental, biochemical including omics technologies, etc.), the researchers have to be sure that the expected changes in germination rates and geometric morphometry are reproduced in the experiment. Therefore, software that automates estimation of germination rates and statistically significant morphometric changes induced by treatments with (bio)chemical agents is needed. To close this gap, we developed Morley, an open source tool with graphical user interface, providing measuring shoot and root lengths and surface areas, germination rates and an automated interpretation of the observed changes.
2. Materials and Methods
2.1. Seeds
Table 1 summarizes species, numbers of biological replicates and numbers of seeds per biological replicate used for different experiments. Experiments included characterization of germination rate depending on the day of growth, effect of pre-sowing seed treatment on seedling growth, and comparison of Morley with other tools for measuring morphometric parameters. Triticum aestivum L. cultivars (Zlata, Agata, Irishka, Alekseevich) were obtained from P.P. Lukyanenko National Grain Center, Krasnodar, Russia. “Raketa” peas and “Moskovskaya 39” wheat were purchased from local food stores.
2.2. Growth of Plants
The seeds were germinated for seven days in laboratory conditions using the paper roll method. A filter paper of 15 x 50 cm or 10 x 100 cm size was wet with distilled water. Total of 15, 25 or 50 seeds (Table 1) were placed on the paper in line at a distance of 2-3 cm from the top long edge. The paper strip with seeds was covered by a wet filter paper of the same size and loosely rolled. The rolls were placed into the 0.5 L glasses filled with 100 mL of distilled water and were germinated on a laboratory table at room temperature of 19° ± 2° C (experiments #2-3, and #5, Table 1) or in a thermostat TC-1/80 CPU (Smolensk SKTB SPU, Smolensk, Russia) at the temperature of 20° ± 1° C (experiments #1 and #4).
2.3. Seed Treatments
For treatment of wheat seeds (Zlata and Alekseevich cultivars) with iron (II) sulfate and iron (II, III) nanoparticles (NPs Fe), the suspensions were prepared as described previously [30]. NPs Fe of spherical shape with an average diameter of 55 nm consisted of 𝛼Fe and magnetite FeO∙Fe2O3 (70 % / 30 %, w/w). Detailed description of nanoparticles and its characterization are given in Supporting Materials, Figure S2. Preparations with iron (II) sulfate and NPs Fe were made of solutions A and B. Film-forming solution A for seed coating contained 0,56 % sodium salt of carboxymethyl cellulose (Na2-CMC), 1,4 % polyethylene glycol 400 (PEG-400), 0,0037 % chelate compound - disodium salt of ethylenediaminetetraacetic acid (Na-EDTA). Solution B was a water solution of iron (II) sulfate or a water suspension of NPs Fe prepared using the ultrasonic disintegrator UZDN-A (Akadempribor, Sumy, Ukraine) (0.5 A, 44 kHz, 30 sec on/ 30 sec off, three cycles, under ice cooling). The final iron concentration in solution B was 10 -5 %. The choice of concentrations was based on previous studies [30]. Solutions A and B were mixed at a ratio of 9:1 (v:v); the seeds were stirred with solution for 10 min (5 ml of solution per 10 g of seeds) and dried. The control seed group was treated with solution A (Na2-CMC + PEG-400 + Na-EDTA) mixed with water at a ratio 9:1 (v:v). Untreated seeds were used as an additional control.
For FeSO4 (Chemmed, Moscow, Russia) treatment of peas (cultivar Rocket, Table 1), the seeds were placed overnight in 0.01% and 0.0025% solutions of iron (II) sulfate in distilled water. The choice of concentrations was based on the 3-day germination test in paper rolls using 2-fold serial dilutions of FeSO4 stock solutions. For 2-fold dilutions of stock 1.0% FeSO4 solution, the seeds did not germinate. Therefore, 2-fold serial dilutions of stock 0.02% FeSO4 solution were tested to choose salt concentrations providing moderate inhibition. The pea seeds from the control group were treated with distilled water.
2.4. Image Acquisition
Seedlings were aligned on a black mat background avoiding overlapping between them. The number of seedlings per photo was from 13 to 20 depending on their sizes. Wheat roots were manually separated (as shown in Figure S1). Roots of pea seedlings were left as is. The paper sticker of either 79 x 79 mm or 87 x 87 mm size was placed on a background above shoots and used as a reference to convert pixels to millimeters. Images were acquired under scattered daylight using a 12 MP and 16 MP cameras inbuilt in a smartphone set on a tripod. The distance between the camera and background was 0.45 m. The smartphone was positioned parallel to the background, the camera lens was opposite the center of the background. Images were saved in JPEG format, have resolution of 72 dpi (4032x3024, WxH, pixels). The detailed procedure of image acquisition is available at https://github.com/dashabezik/Morley/blob/main/doc/appendix_a.md.
Images were processed using Morley (https://github.com/dashabezik/Morley/, accessed on 22 December 2022) and ImageJ (http://rsb.info.nih.gov/ij/, accessed on 6 February 2023) following the methods described in user guide (https://imagej.net/ij/docs/guide/146.html, accessed on 6 February 2023).
2.5. Shoot and Root Morphometry
The seedling shoot length (mm), maximum root length (mm), and total root length (mm) were measured using Morley, ImageJ and/or manually. Shoot, root and plant surface areas (mm2) were measured using Morley and ImageJ. Plant surface area was calculated as a sum of shoot and root surface areas excluding the seed surface area.
Germination rate G was calculated as follows:
where NG is the number of non-germinated seeds, TN is the total number of seeds. By default, Morley counts seeds non-germinated if shoot and root lengths are less than the seed size.
G = 1-NG/TN,
To evaluate changes in seedling sizes depending on the day of germination, the images and manual measurements of shoot and root lengths were made on the 3rd, 4th, 5th, 6th and 7th days of growth. To evaluate response to seed treatment, the images and manual measurements were taken on the 7th day of growth. Statistical analysis was performed using Scipy.stats [31]. Gauss distribution was tested using the Shapiro-Wilk test, with a p-value threshold of 0.05. Then, either parametric Unpaired T-test or nonparametric Mann-Whitney test was applied, based on the output of the Shapiro-Wilk test. The p-value below 0.05 was used as a criteria of statistical significance.
2.6. Morley Processing Algorithm and Code Availability
The general algorithm behind the developed software is presented in Figure 1. Morley requires the following input parameters: (1) paths to folders with seedling images; (2) paper sticker size; (3) blurring and color range parameters. Data processing is accomplished in several steps. First step includes recognition of seedling and paper sticker objects in images. Image analysis in Morley is based on using OpenCV library [32]. Contour recognition in Morley relies on OpenCV methods for contour finding by Canny method [33], blurring, converting an image from one color space to another and morphological transformation. The second step is the recognition of seed objects and their positions. The found seed positions are used to split the shoots from the roots in the image. The contour sorting methods from imutils library (https://pypi.org/project/imutils/) were used to recognize seed images. Next, the program calculates the object surface areas, widths, lengths and the germination rate per a given plant group. Morley converts pixels to millimeters and supports a user-defined germination threshold (in mm). All seedlings with shoot and root lengths below the germination threshold are classified non-germinated. It can be used for taking into account the seeds with delayed germination. Finally, root and shoot lengths and plant surface areas are subjected for statistical evaluation and the results are saved. Scipy.stats [31] is used by Morley for statistical assessment of morphometric data. Each sample group is tested for Gauss distribution using the Shapiro-Wilk test, with a p-value threshold of 0.05. Then, two sample groups are compared using either parametric Unpaired T-test or nonparametric Mann-Whitney test, depending on the results of normality testing. The p-value below 0.05 is used as default criteria for statistical significance. The software processes one photo containing from 13 to 20 seedlings (resolution of 72 dpi, size of 5 Mb) on a standard PC (Intel(R) Core(TM) i5-8265U CPU @ 1.60GHz 1.80 GHz, 8.00 Gb RAM) in 7 seconds.
Morley generates output files that include CSV tables with p-values corresponding to all pairwise comparisons between sample groups, the calculated germination rate, shoot lengths, maximum root lengths, total root lengths and plant surface areas, and figures characterizing distributions of measured parameters, bar plots with mean values and standard deviations (95% CI), and heatmaps visualizing the conclusions on statistical significance of the morphometric differences. Code, graphical user interface, user guide and examples are available at https://github.com/dashabezik/Morley and https://github.com/dashabezik/plants/, respectively. Morley is available as a graphical user interface and a command line tool.
3. Results
3.1. Comparison of Morley with ImageJ and Manual Measurements Demonstrates Agreement between Results
ImageJ [23] is widely applied for image analysis of plants and seedlings [24,25,26,27,28] and solves the similar tasks as Morley. ImageJ allows calculation of surface areas, lengths, mean values and standard deviations. However, image analysis of thousands of seedlings with ImageJ is time-consuming, requires manual pre-processing of images and has no in-built options for statistical analysis. Morley, on the other hand, is specifically designed for analysis of multiple images including statistical evaluation and visualization.
Figure 2 demonstrates the results of comparison between Morley, ImageJ and manual measurements. The shoot lengths, maximum root lengths and total root lengths using four cultivars of winter (Fig.2a,d) and spring (Fig.2b,c) wheat were estimated. Comparison of the shoot lengths revealed complete agreement within the standard deviations. For maximum and total root lengths of wheat seedlings, the results exhibit some variations, however, no significant differences were observed. Larger variance in root lengths can be explained by presence of hidden and/or extra-thin roots that can give low-contrast and noisy parts in the images. Since a good agreement was observed between all measurements, we further use either ImageJ or manual measurements as a benchmark for Morley in our tests. Importantly, wheat roots should be split from each other before camera imaging (compare images in Figure S1, Supporting Material), otherwise, some of them will not be detected in image analysis. Then, it can result in underestimation of root lengths with both Morley and ImageJ.
3.2. Morley Correctly Tracks Changes in Morphometry Depending on the Day of Growth
To validate Morley, two germination tests were performed: 1) using seeds of Triticum aestivum, cultivar Moskovskaya 39; and 2) using seeds of Pisum sativum, cultivar Rocket.
Wheat seeds were grown in paper rolls for four, five, six and seven days. The random examples of wheat seedlings on different days of growth are shown in Figure 3a. The results of manual and Morley measurements of shoot lengths, maximum and total root lengths coincided within the standard deviation for all comparisons (Figure 3b). Statistical testing did not reveal any differences between manual measurements and Morley (Figure 3c). Statistically significant differences between days of germination were observed for shoot, maximum and total root lengths (Figure 3c). The significance of changes in shoot and root lengths depending on growth day were in full coincidence between Morley and manual measurements (Figure 3c). The germination rates on the 4th, 5th, 6th and 7th days increased from 69 % to 84 % for both manual and digital evaluations.
Figure 4 demonstrates results obtained for the germination test of P. sativum seeds. Measurements were performed on the 3rd, 4th, 5th, 6th and 7th day of growth. Measurements of shoot and maximum root lengths (Fig.4a) and germination rates (Fig.4c) are well matched to each other. Fig.4b summarizes results of statistical testing that shows Morley and manual evaluation reveal absolutely the same morphometric differences for maximum root length. Since pea seedlings had a rod-like root system with very small lateral roots that could not be measured by hand, only the maximum root lengths were compared. In this test, pea seeds demonstrated a delayed germination, and shoot lengths were below 3 mm for the first five days. It corresponds to a data miss in Fig.4a (Shoot). Single shoot or root with length less than seed minimum length (5 mm in case of our peas) is not taken into image analysis by Morley.
3.3. Tracking Morphometric Effects in 7-Day Old Wheat Seedlings after Seed Treatments with Iron Compounds
Growth-stimulating and antifungal agents for seed treatment can affect seed quality and seedling growth. Monitoring changes in seedling morphometry is an essential question in developing new types of fertilizers and pre sowing seed treatments. Therefore, we treated wheat seeds (Zlata and Alekseevich cultivars, Table 1 in M&M) with a suspension of NP Fe (𝛼-Fe 70.1 %, FeO∙Fe2O3 29.9 %, w / w) and FeSO4 solution, and, then we tracked the morphometric changes in the 7 day old seedlings using Morley and ImageJ.
Figure 5a for Zlata cultivar compares the shoot lengths, maximum and total root lengths measured using both tools for image analysis. Statistical test proves that ImageJ and Morley are consistent in measurements (Fig.5b). Combining together the results provided by both tools, we conclude that no effects in shoot and root lengths were induced by seed treatments; all variations stay within biological variance and accuracy of the length measurements.
Figure 6a summarizes the Morley and ImageJ analyses of the shoot, maximum and total root lengths for Alekseevich cultivar. This data further shows that length measurements are well matched between tools. Here, we attract attention to a statistically significant difference between treatment groups 1 and 2 (Fig.6b). These groups are biological replicates grown from untreated seeds to demonstrate the biological variations that should not be erroneously mixed with effects from pre-sowing seed treatments. Taking into account the biological variations, we conclude no actual effects from seed treatments were observed, regardless of whether statistical tests provided some difference.
3.4. Morley Tracks Inhibition of Pea Seedling Growth Due to Seed Treatment by Iron Sulfate
Pea seeds were overnight treated with different concentrations of iron sulfate, and then the morphometric changes were measured on the 7th day of growth using Morley. Treatment with 0.01 % FeSO4 caused changes in seeds’ color from light-yellow to gray-yellow suggesting toxic effects. Inhibition of seedling growth was observed (Figure 7a). Figure 7b shows how Morley recognized seedling contours and segmented plant images into the seed, shoot and root parts. Figure 7c reveals an approximately 2.5-fold decrease in shoot length and 2-fold decrease in the maximum and total root lengths when 0.01 % FeSO4 was used. Figure 7d shows a 3-fold decrease in plant surface area revealed by both ImageJ and Morley. We only compared plant areas here because ImageJ measurements of shoots, main roots, and lateral roots of 630 pea seedlings require too much time for exhausting manual image pre-processing. Toxic effect due to 0.01 % FeSO4 treatment resulted in a 25 % decrease in germination rate (Figure 7e). Interestingly, the germination rate on the 7th day of growth in the 0.0025 % FeSO4 treatment group was not changed compared with the untreated control, although the plant sizes were significantly decreased. These data demonstrate Morley can be applied for germination tests and measuring morphometric effects from new fertilizers or pre-sowing treatments in wheat and pea seedlings.
4. Discussion
Development of new biotechnologies including nanomaterials inspirates researchers to explore new bioactive compounds for improving seed quality. Research and development of such compounds includes complex characterization of biotic effects and molecular mechanisms using morphometric, (bio)chemical, omics and other analyses. Such integrative studies assume adequate biological replicating to prove the biotic effects. At least five replicates should be performed in biochemical and omics studies to cover biological variance and to measure actual effects from a treatment. It means a time-consuming preparation of a few thousands plants that should be dissected and conserved. Tracking morphometry changes in such samples is an essential preliminary step to ensure presence or absence of biotic effects. We did not find a program that could automate measuring shoot, maximum and total root lengths, surface areas, germination rates and their statistical assessment from multiple seedling images. Then, we developed Morley, an open-source software with GUI and CLI to address the above described tasks. We demonstrated that the program achieves performance comparable with ImageJ and manual measurements of effects from the seed treatments. We propose Morley for agriculture-oriented laboratory studies integrating different analytical methods for elucidation of molecular mechanisms underlying morphometric changes.
We performed germination tests for wheat and pea seeds to demonstrate that Morley correctly tracks changes in shoot and root lengths depending on the day of growth. At the next step, we evaluated morphometric parameters of 7-day old wheat seedlings after seed treatments with iron compounds. Using two cultivars of wheat and comparison with ImageJ analysis, we demonstrated that Morley concludes correctly if morphometric effects are absent or within a biological variability. Finally, Morley was tested for measuring a decrease in pea seedling growth and germination rate due to a seed treatment with toxic concentrations of iron (II) sulfate. The results prove Morley for assessment of germination tests and measuring changes in seedling sizes induced by bioactive compounds. At the current step of development, Morley is meant for measuring shoot and root lengths that exceed the seed size. For accurate measurement of total root length in fibrous root system, a manual separation of roots before imaging is required. This step is time-consuming, but mandatory for accurate morphometry results. In total, our data confirm that Morley achieves a good accuracy for 4-7 day old seedlings of crops with hypogeal germination type, fibrous and tap root systems and rod-like shoots. The tool can be applied for plants with structures similar to wheat and peas, however, additional validation experiments are required.
Supplementary Materials
The following supporting information can be downloaded at the website of this paper posted on Preprints.org. Figure S1. Image examples with separated and not separated roots; Method of obtaining iron nanoparticles; Figure S2. Iron nanoparticles characterization by X-ray diffraction (XRD) and transmission electron microscopy (TEM); Table S1. Morley parameters for datasets used in the study.
Author Contributions
Conceptualization, IAT; methodology, IAT, ANZ, OAB and NNG; formal analysis, DDE, EMK, TTK, LIL, MLK; investigation, DDE and LIL; resources, IAT, ANZ, NNG; writing—original draft preparation, IAT and DDE; writing—review and editing, IAT, LIL, IPO, OAB; visualization, DDE; supervision, IAT; funding acquisition, IAT. All authors have read and agreed to the published version of the manuscript.
Funding
The study was supported by Russian Science Foundation, grant #22-26-00109.
Data Availability Statement
Program code, GUI, user guide and example data are available at https://github.com/dashabezik/Morley and https://github.com/dashabezik/plants/.
Acknowledgments
The authors thank Dr. Olga M. Zhigalina and Dr. Dmitri N. Khmelenin (Shubnikov Institute of Crystallography, FSRC “Crystallography and Photonics”, RAS) for collecting high-quality TEM images of iron nanoparticles and Dr. Nadezhda G. Berezkina (N.N. Semenov Federal Research Center for Chemical Physics, RAS) for professional work and outstanding diligence when processing and measuring more than 5000 particle TEM images. I.A.T. warmly thanks all volunteers for their invaluable help with extraction of seedlings from the substrate and manual morphometric measurements: Dr. Marina L. Pridatchenko, Dr. Maksim Yu. Brazhnikov, Arthur G. Yablokov, Valery Postoenko, Ivan I. Fedorov, Leila A. Garibova, Ivan Emekeev, and Leonid M. Brazhnikov.
Conflicts of Interest
Authors have no conflicts of interest to disclose.
References
- Computer Vision and Machine Learning in Agriculture; Uddin, M.S., Bansal, J.C., Eds.; Algorithms for Intelligent Systems; Springer: Singapore, 2021; ISBN 978-981-336-423-3. [CrossRef]
- Carrera-Castaño, G.; Calleja-Cabrera, J.; Pernas, M.; Gómez, L.; Oñate-Sánchez, L. An Updated Overview on the Regulation of Seed Germination. Plants Basel Switz. 2020, 9, 703. [Google Scholar] [CrossRef]
- Rajjou, L.; Duval, M.; Gallardo, K.; Catusse, J.; Bally, J.; Job, C.; Job, D. Seed Germination and Vigor. Annu. Rev. Plant Biol. 2012, 63, 507–533. [Google Scholar] [CrossRef]
- Dell’ Aquila, A. Digital Imaging Information Technology Applied to Seed Germination Testing. A Review. Agron. Sustain. Dev. 2009, 29, 213–221. [Google Scholar] [CrossRef]
- Genze, N.; Bharti, R.; Grieb, M.; Schultheiss, S.J.; Grimm, D.G. Accurate Machine Learning-Based Germination Detection, Prediction and Quality Assessment of Three Grain Crops. Plant Methods 2020, 16, 157. [Google Scholar] [CrossRef]
- Awty-Carroll, D.; Clifton-Brown, J.; Robson, P. Using K-NN to Analyse Images of Diverse Germination Phenotypes and Detect Single Seed Germination in Miscanthus Sinensis. Plant Methods 2018, 14, 5. [Google Scholar] [CrossRef]
- Masteling, R.; Voorhoeve, L.; IJsselmuiden, J.; Dini-Andreote, F.; de Boer, W.; Raaijmakers, J.M. DiSCount: Computer Vision for Automated Quantification of Striga Seed Germination. Plant Methods 2020, 16, 60. [Google Scholar] [CrossRef]
- Joosen, R.V.L.; Kodde, J.; Willems, L.A.J.; Ligterink, W.; van der Plas, L.H.W.; Hilhorst, H.W.M. GERMINATOR: A Software Package for High-Throughput Scoring and Curve Fitting of Arabidopsis Seed Germination. Plant J. Cell Mol. Biol. 2010, 62, 148–159. [Google Scholar] [CrossRef]
- Hoffmaster, A.F.; Xu, L.; Fujimura, K.; Bennett, M.A.; Evans, A.F.; McDonald, M.B. The Ohio State University Seed Vigor Imaging System (SVIS) for Soybean and Corn Seedlings. Seed Technol. 2005, 27, 7–24. [Google Scholar]
- Belsare, M.P.P.; Dewasthale, M.M.M. Application of Image Processing for Seed Quality Assessment: A Survey. Int. J. Eng. Res. Technol. 2013, 2. [Google Scholar] [CrossRef]
- Škrubej, U.; Rozman, Č.; Stajnko, D. Assessment of Germination Rate of the Tomato Seeds Using Image Processing and Machine Learning. Eur. J. Hortic. Sci. 2015, 80, 68–75. [Google Scholar] [CrossRef]
- Huang, M.; Wang, Q.G.; Zhu, Q.B.; Qin, J.W.; Huang, G. Review of Seed Quality and Safety Tests Using Optical Sensing Technologies. Seed Sci. Technol. 2015, 43, 337–366. [Google Scholar] [CrossRef]
- Nguyen, T.T.; Hoang, V.-N.; Le, T.-L.; Tran, T.-H.; Vu, H. A Vision Based Method for Automatic Evaluation of Germination Rate of Rice Seeds. In Proceedings of the 2018 1st International Conference on Multimedia Analysis and Pattern Recognition (MAPR); April 2018; pp. 1–6.
- Ducournau, S.; Feutry, A.; Plainchault, P.; Revollon, P.; Vigouroux, B.; Wagner, M.H. An Image Acquisition System for Automated Monitoring of the Germination Rate of Sunflower Seeds. Comput. Electron. Agric. 2004, 44, 189–202. [Google Scholar] [CrossRef]
- Manacorda, C.A.; Asurmendi, S. Arabidopsis Phenotyping through Geometric Morphometrics. GigaScience 2018, 7, giy073. [Google Scholar] [CrossRef]
- Bastien, R.; Legland, D.; Martin, M.; Fregosi, L.; Peaucelle, A.; Douady, S.; Moulia, B.; Höfte, H. KymoRod: A Method for Automated Kinematic Analysis of Rod-Shaped Plant Organs. Plant J. 2016, 88, 468–475. [Google Scholar] [CrossRef]
- Smith, A.G.; Han, E.; Petersen, J.; Olsen, N.A.F.; Giese, C.; Athmann, M.; Dresbøll, D.B.; Thorup-Kristensen, K. RootPainter: Deep Learning Segmentation of Biological Images with Corrective Annotation. New Phytol. 2022, 236, 774–791. [Google Scholar] [CrossRef]
- Seethepalli, A.; Guo, H.; Liu, X.; Griffiths, M.; Almtarfi, H.; Li, Z.; Liu, S.; Zare, A.; Fritschi, F.B.; Blancaflor, E.B.; et al. RhizoVision Crown: An Integrated Hardware and Software Platform for Root Crown Phenotyping. Plant Phenomics Wash. DC 2020, 2020, 3074916. [Google Scholar] [CrossRef]
- Colombi, T.; Kirchgessner, N.; Le Marié, C.A.; York, L.M.; Lynch, J.P.; Hund, A. Next Generation Shovelomics: Set up a Tent and REST. Plant Soil 2015, 388, 1–20. [Google Scholar] [CrossRef]
- Wu, J.; Wu, Q.; Pagès, L.; Yuan, Y.; Zhang, X.; Du, M.; Tian, X.; Li, Z. RhizoChamber-Monitor: A Robotic Platform and Software Enabling Characterization of Root Growth. Plant Methods 2018, 14, 44. [Google Scholar] [CrossRef]
- Xiong, J.; Yu, D.; Liu, S.; Shu, L.; Wang, X.; Liu, Z. A Review of Plant Phenotypic Image Recognition Technology Based on Deep Learning. Electronics 2021, 10, 81. [Google Scholar] [CrossRef]
- Gehan, M.A.; Fahlgren, N.; Abbasi, A.; Berry, J.C.; Callen, S.T.; Chavez, L.; Doust, A.N.; Feldman, M.J.; Gilbert, K.B.; Hodge, J.G.; et al. PlantCV v2: Image Analysis Software for High-Throughput Plant Phenotyping. PeerJ 2017, 5, e4088. [Google Scholar] [CrossRef]
- Schindelin, J.; Rueden, C.T.; Hiner, M.C.; Eliceiri, K.W. The ImageJ Ecosystem: An Open Platform for Biomedical Image Analysis. Mol. Reprod. Dev. 2015, 82, 518–529. [Google Scholar] [CrossRef] [PubMed]
- Hakla, H.R.; Sharma, S.; Urfan, M.; Yadav, N.S.; Rajput, P.; Kotwal, D.; Abdel Latef, A.A.H.; Pal, S. Gibberellins Target Shoot-Root Growth, Morpho-Physiological and Molecular Pathways to Induce Cadmium Tolerance in Vigna Radiata L. Agronomy 2021, 11, 896. [Google Scholar] [CrossRef]
- Sanada, A.; Agehara, S. Characterizing Root Morphological Responses to Exogenous Tryptophan in Soybean (Glycine Max) Seedlings Using a Scanner-Based Rhizotron System. Plants 2023, 12, 186. [Google Scholar] [CrossRef]
- Rodríguez-Lorenzo, J.L.; Martín-Gómez, J.J.; Tocino, Á.; Juan, A.; Janoušek, B.; Cervantes, E. New Geometric Models for Shape Quantification of the Dorsal View in Seeds of Silene Species. Plants 2022, 11, 958. [Google Scholar] [CrossRef]
- Rosatto, S.; Mariotti, M.; Romeo, S.; Roccotiello, E. Root and Shoot Response to Nickel in Hyperaccumulator and Non-Hyperaccumulator Species. Plants 2021, 10, 508. [Google Scholar] [CrossRef]
- Giacò, A.; De Giorgi, P.; Astuti, G.; Caputo, P.; Serrano, M.; Carballal, R.; Sáez, L.; Bacchetta, G.; Peruzzi, L. A Morphometric Analysis of the Santolina Chamaecyparissus Complex (Asteraceae). Plants 2022, 11, 3458. [Google Scholar] [CrossRef] [PubMed]
- Lobet, G. Image Analysis in Plant Sciences: Publish Then Perish. Trends Plant Sci. 2017, 22, 559–566. [Google Scholar] [CrossRef]
- Olkhovskaya, I.P.; Bogoslovskaya, O.A.; Yablokov, A.G.; Glushchenko, N.N. SPRING BARLEY YIELD AFTER PRESOWING SEED TREATMENT WITH METAL NANOPARTICLES. Nanotechnologies Russ. 2019, 14, 55–61. [Google Scholar] [CrossRef]
- Virtanen, P.; Gommers, R.; Oliphant, T.E.; Haberland, M.; Reddy, T.; Cournapeau, D.; Burovski, E.; Peterson, P.; Weckesser, W.; Bright, J.; et al. SciPy 1.0: Fundamental Algorithms for Scientific Computing in Python. Nat. Methods 2020, 17, 261–272. [Google Scholar] [CrossRef]
- Bradski, G.; Kaehler, A. Learning OpenCV: Computer Vision with the OpenCV Library. 2008.
- Canny, J. A Computational Approach to Edge Detection. In Readings in Computer Vision; Fischler, M.A., Firschein, O., Eds.; Morgan Kaufmann: San Francisco (CA), 1987; pp. 184–203. ISBN 978-0-08-051581-6. [Google Scholar]
- Zhigach, A.N.; Leipunsky, I.O.; Kuskov, M.L.; Berezkina, N.G.; Afanasenkova, E.S.; Lopez, G.W.; Skryleva, E.A.; Menushenkov, V.P.; Zhigalina, O.M.; Khmelenin, D.N. On the Production of Dispersive Single-Crystal Iron Carbide (Fe3C) Nanoparticulate. Bull. Mater. Sci. 2022, 45, 38. [Google Scholar] [CrossRef]
Figure 1.
Software algorithm. *Standard PC stands for Intel(R) Core(TM) i5-8265U CPU @ 1.60GHz 1.80 GHz, 8.00 Gb RAM. .
Figure 1.
Software algorithm. *Standard PC stands for Intel(R) Core(TM) i5-8265U CPU @ 1.60GHz 1.80 GHz, 8.00 Gb RAM. .
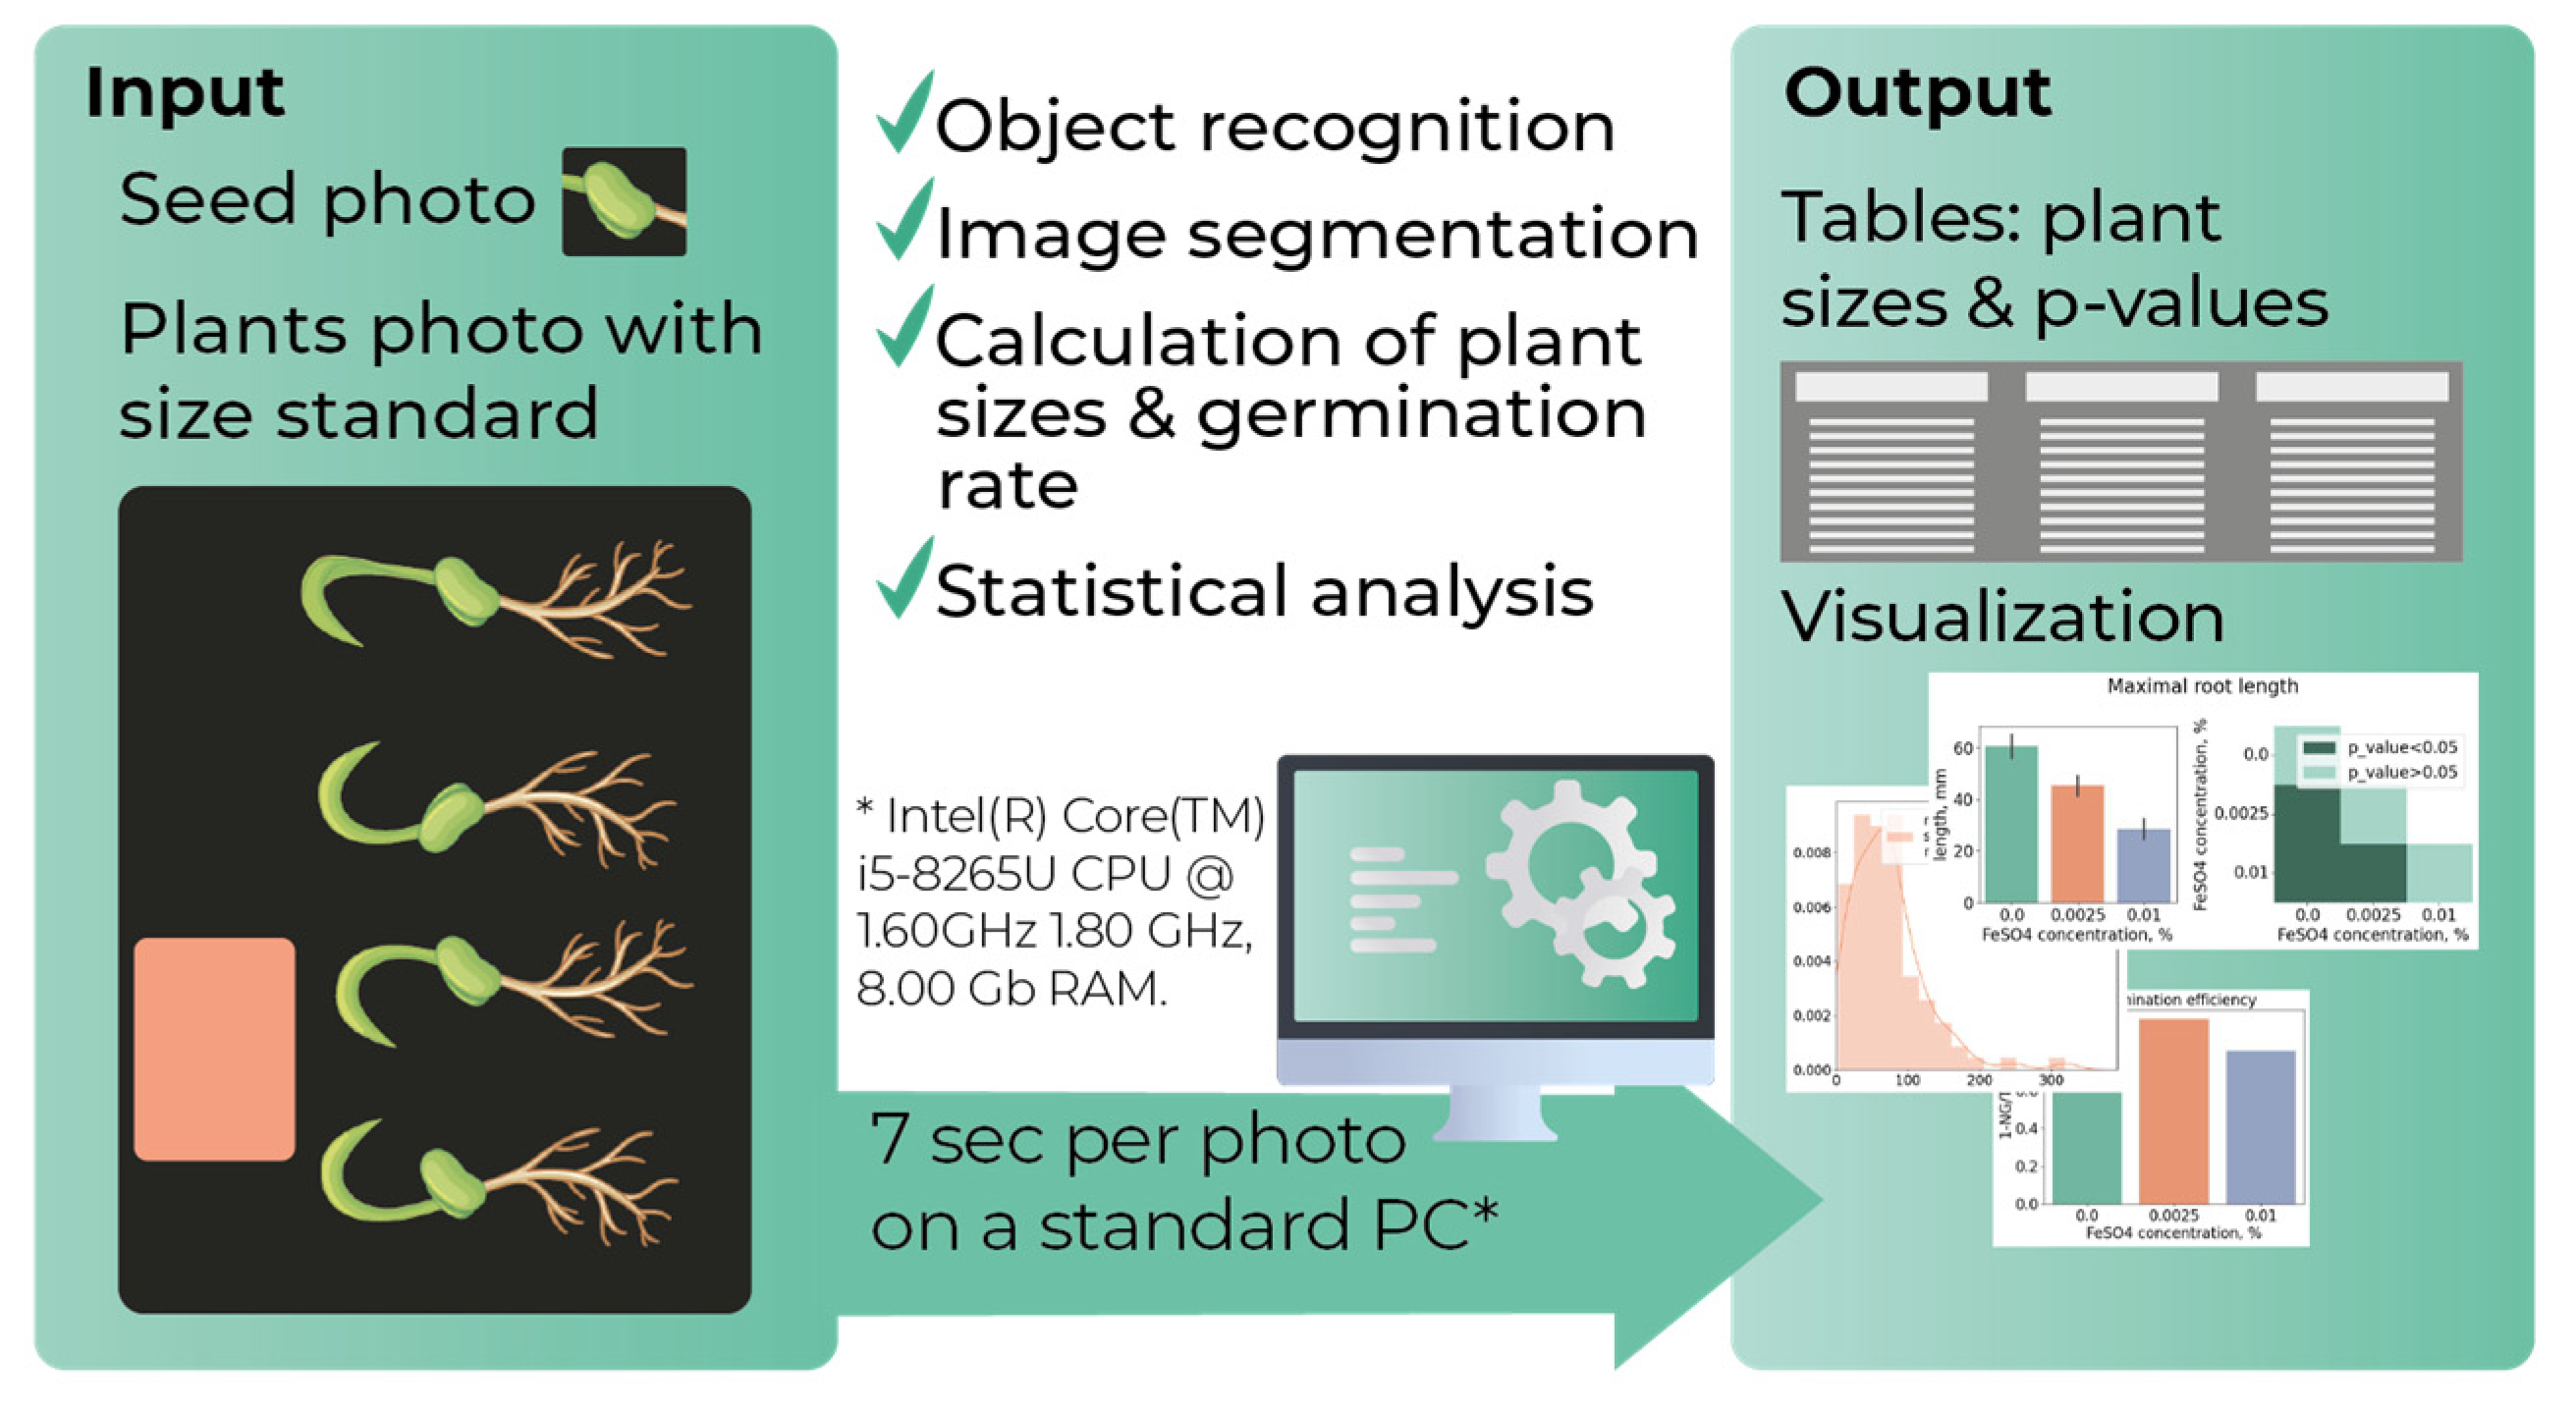
Figure 2.
Comparison of Morley, ImageJ and manual measurements by shoot, maximum and total root lengths. Bars with whiskers correspond to the mean ± SD in 95% CI. Four cultivars of T. aestivum were used: a) spring wheat, cultivar Agata, 31 seedlings; b) winter wheat, cultivar Alexeevich, 44 seedlings; c) winter wheat, cultivar Irishka, 46 seedlings; d) spring wheat, cultivar Zlata, 20 seedlings.
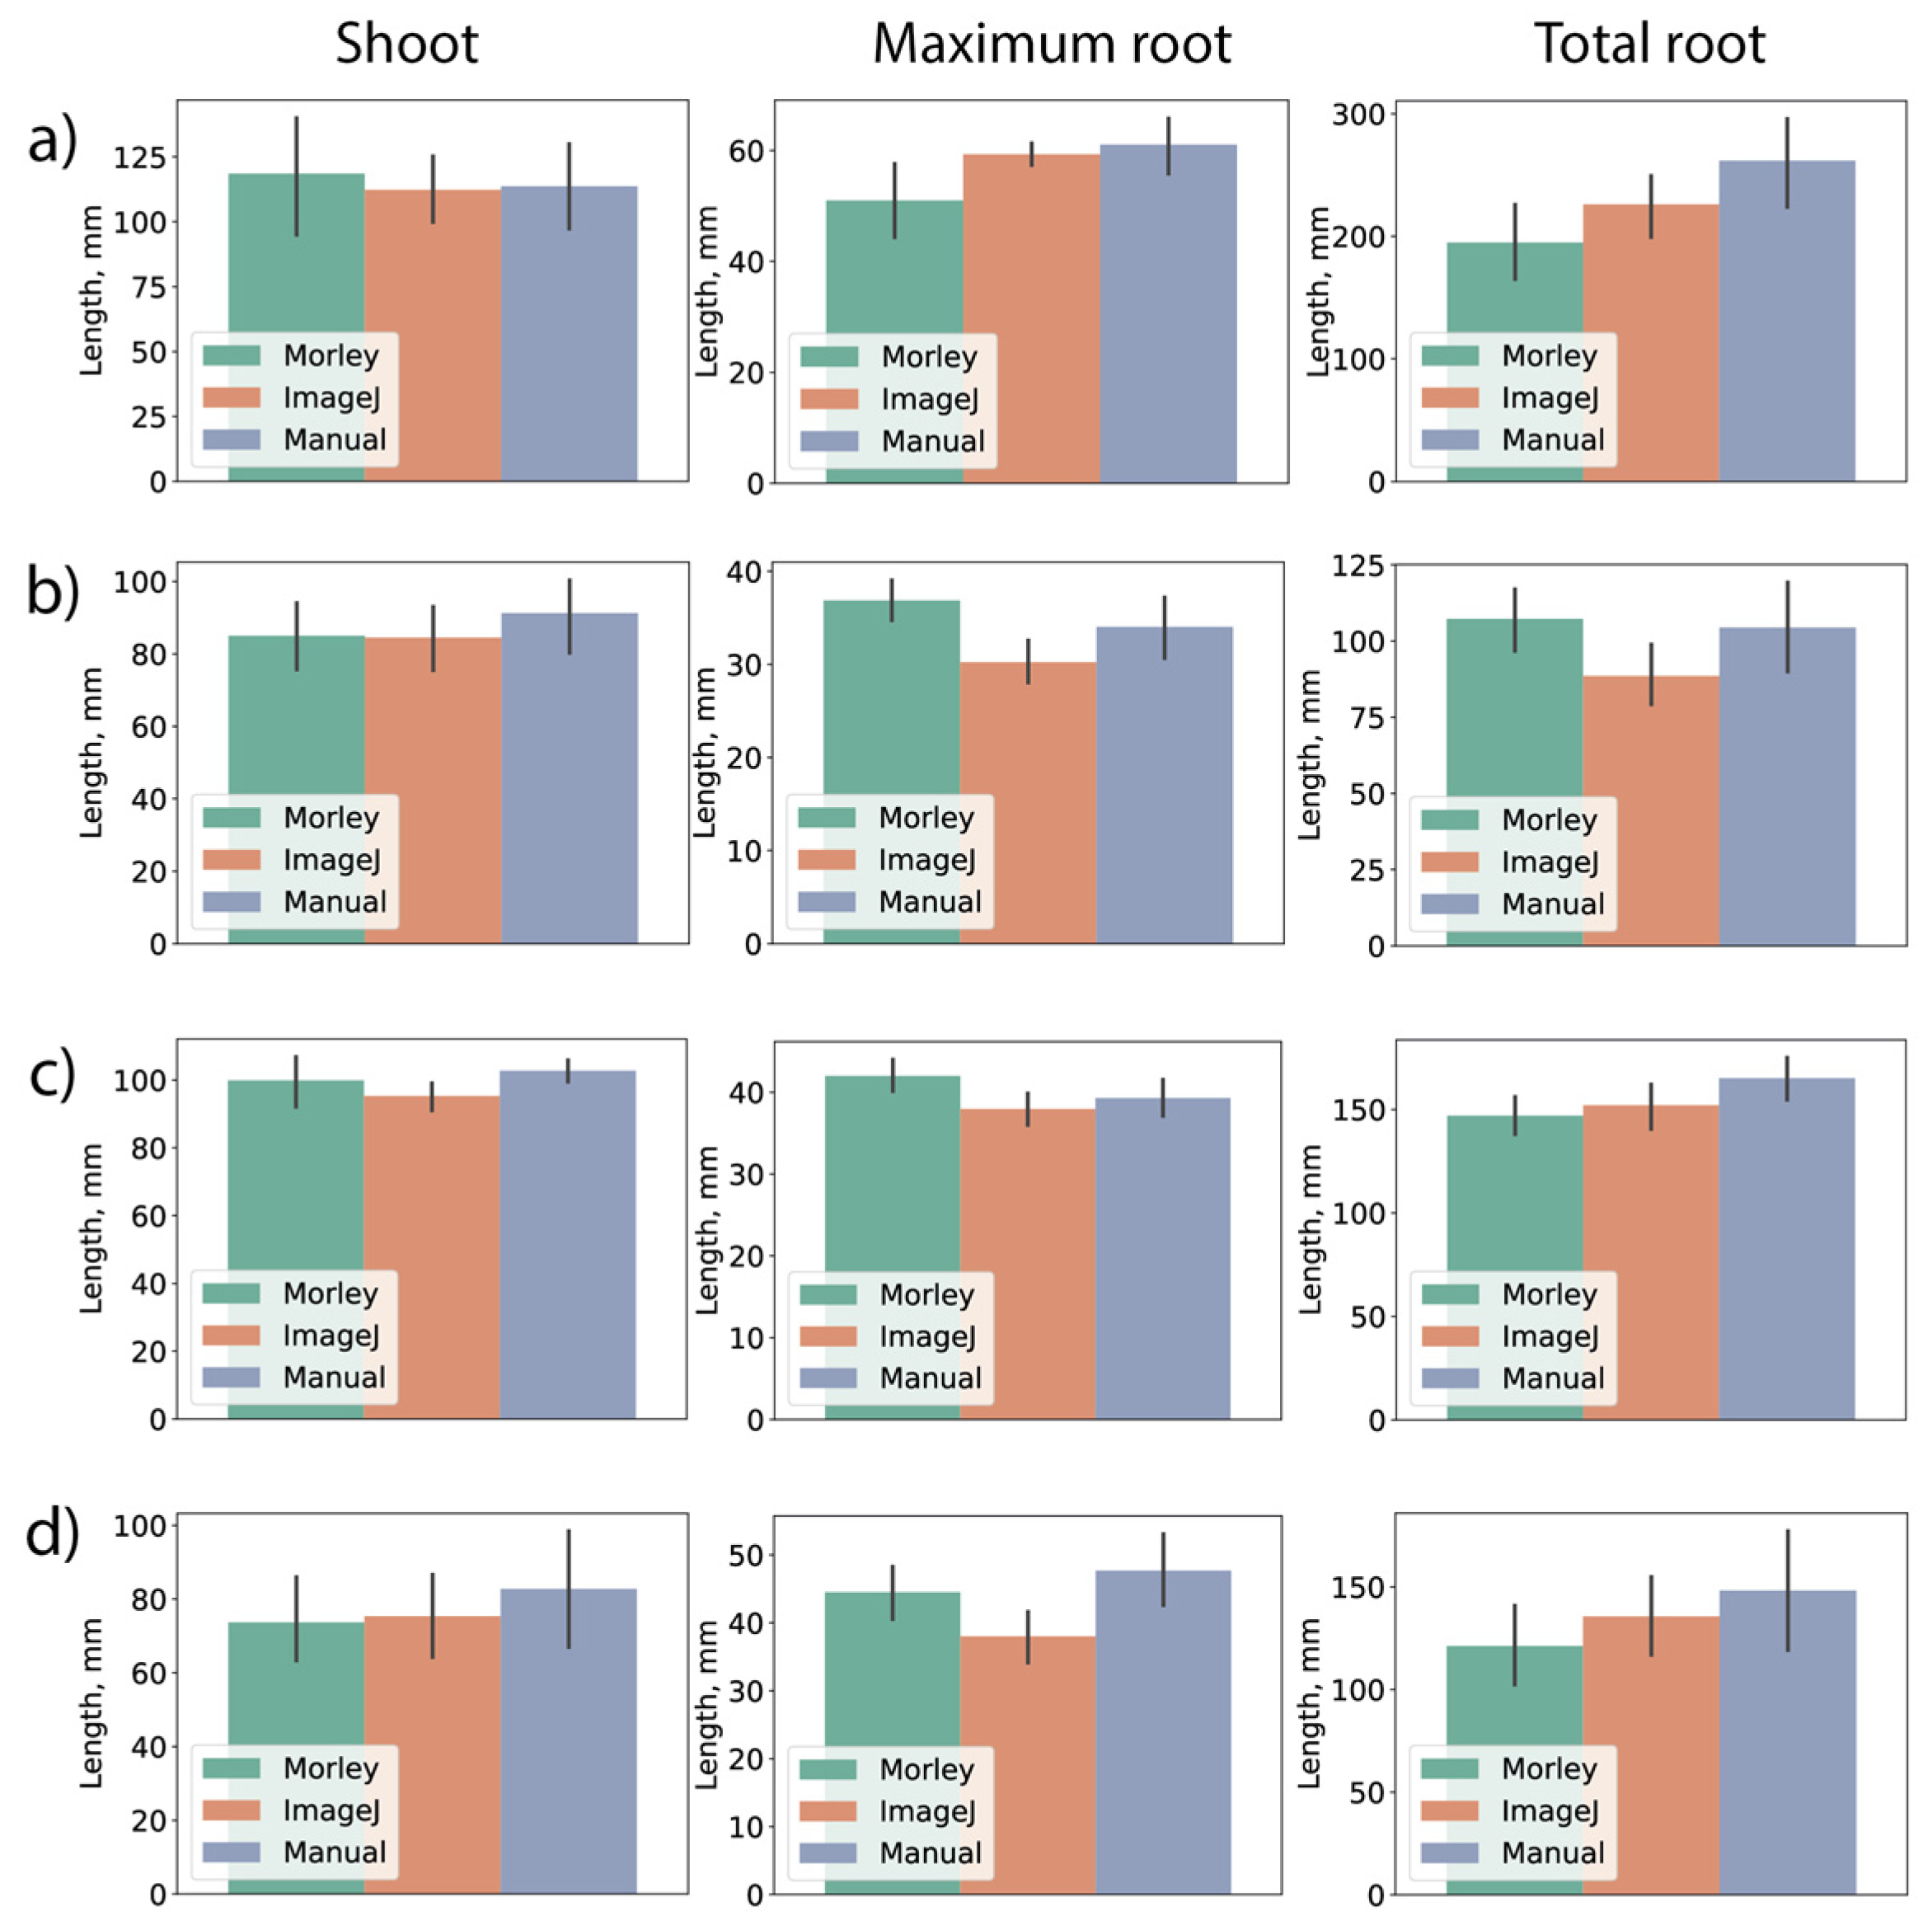
Figure 3.
Tracking changes in seedlings of Truticum aestivum depending on the day of growth. a) Photographs of seedlings depending on growth day. b) Shoot lengths, maximum and total root lengths measured using Morley and manually. Bars with whiskers correspond to the mean ± SD in 95% CI. c) Significant (p-value < 0.05) and non-significant (p-value > 0.05) differences in pairwise comparisons between growth days: manual vs. Morley. Data followed a non-Gaussian distribution (Shapiro-Wilk p-value < 0.05). Mann-Whitney test was used. Tick labels: “Mor_” or “Man_” stands for automatic or manual measurements, respectively; “4”, “5”, “6”, “7” mean growth day. Search parameters are listed in Table S1. d) germination rates measured manually and using Morley.
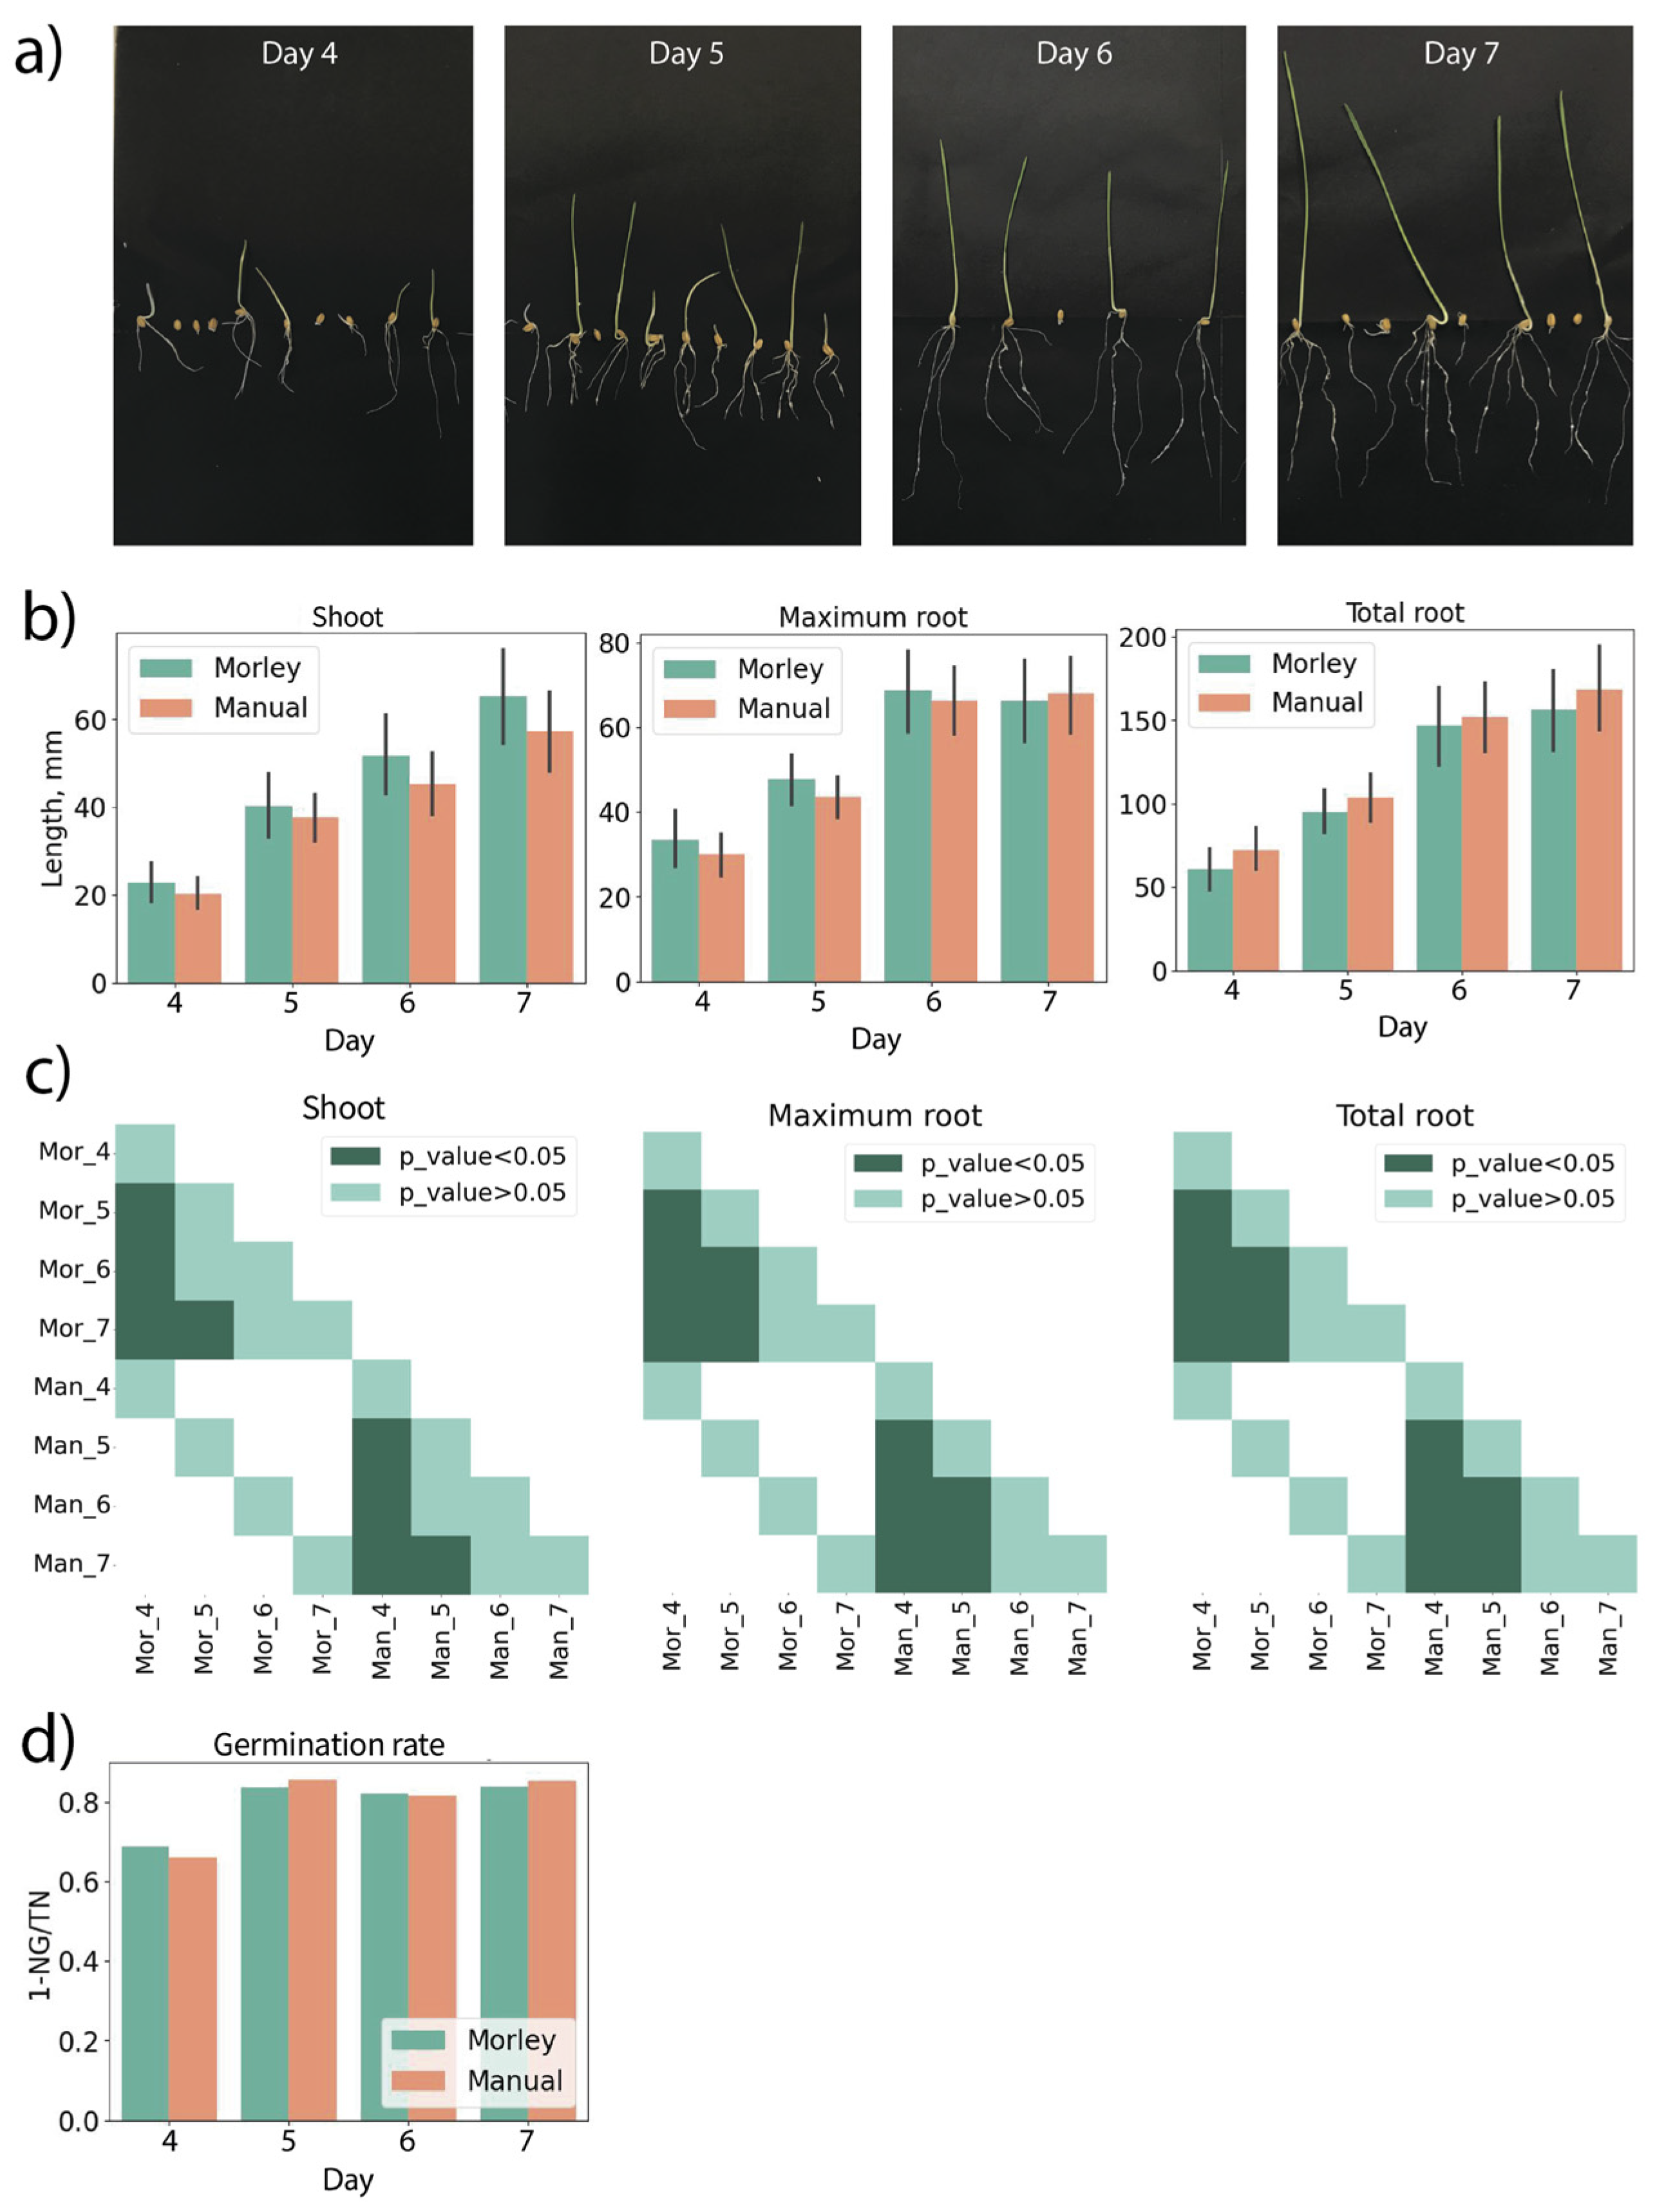
Figure 4.
Tracking changes in seedlings of P. sativum depending on the day of growth. a) Shoot and maximum root lengths. Bars with whiskers correspond to the mean ± SD. b) Significant (p-value < 0.05) and non-significant (p-value > 0.05) differences in pairwise comparisons between growth days, manual and Morley measurements. Data follow a non-Gaussian distribution (Shapiro-Wilk p-value < 0.05). Mann-Whitney test was used. c) Germination rates measured using Morley and manually. Tick labels: “Mor_” and “Man_” stands for Morley and manual measurements, respectively; “3”, “4”, “5”, “6”, “7” mean growth day.
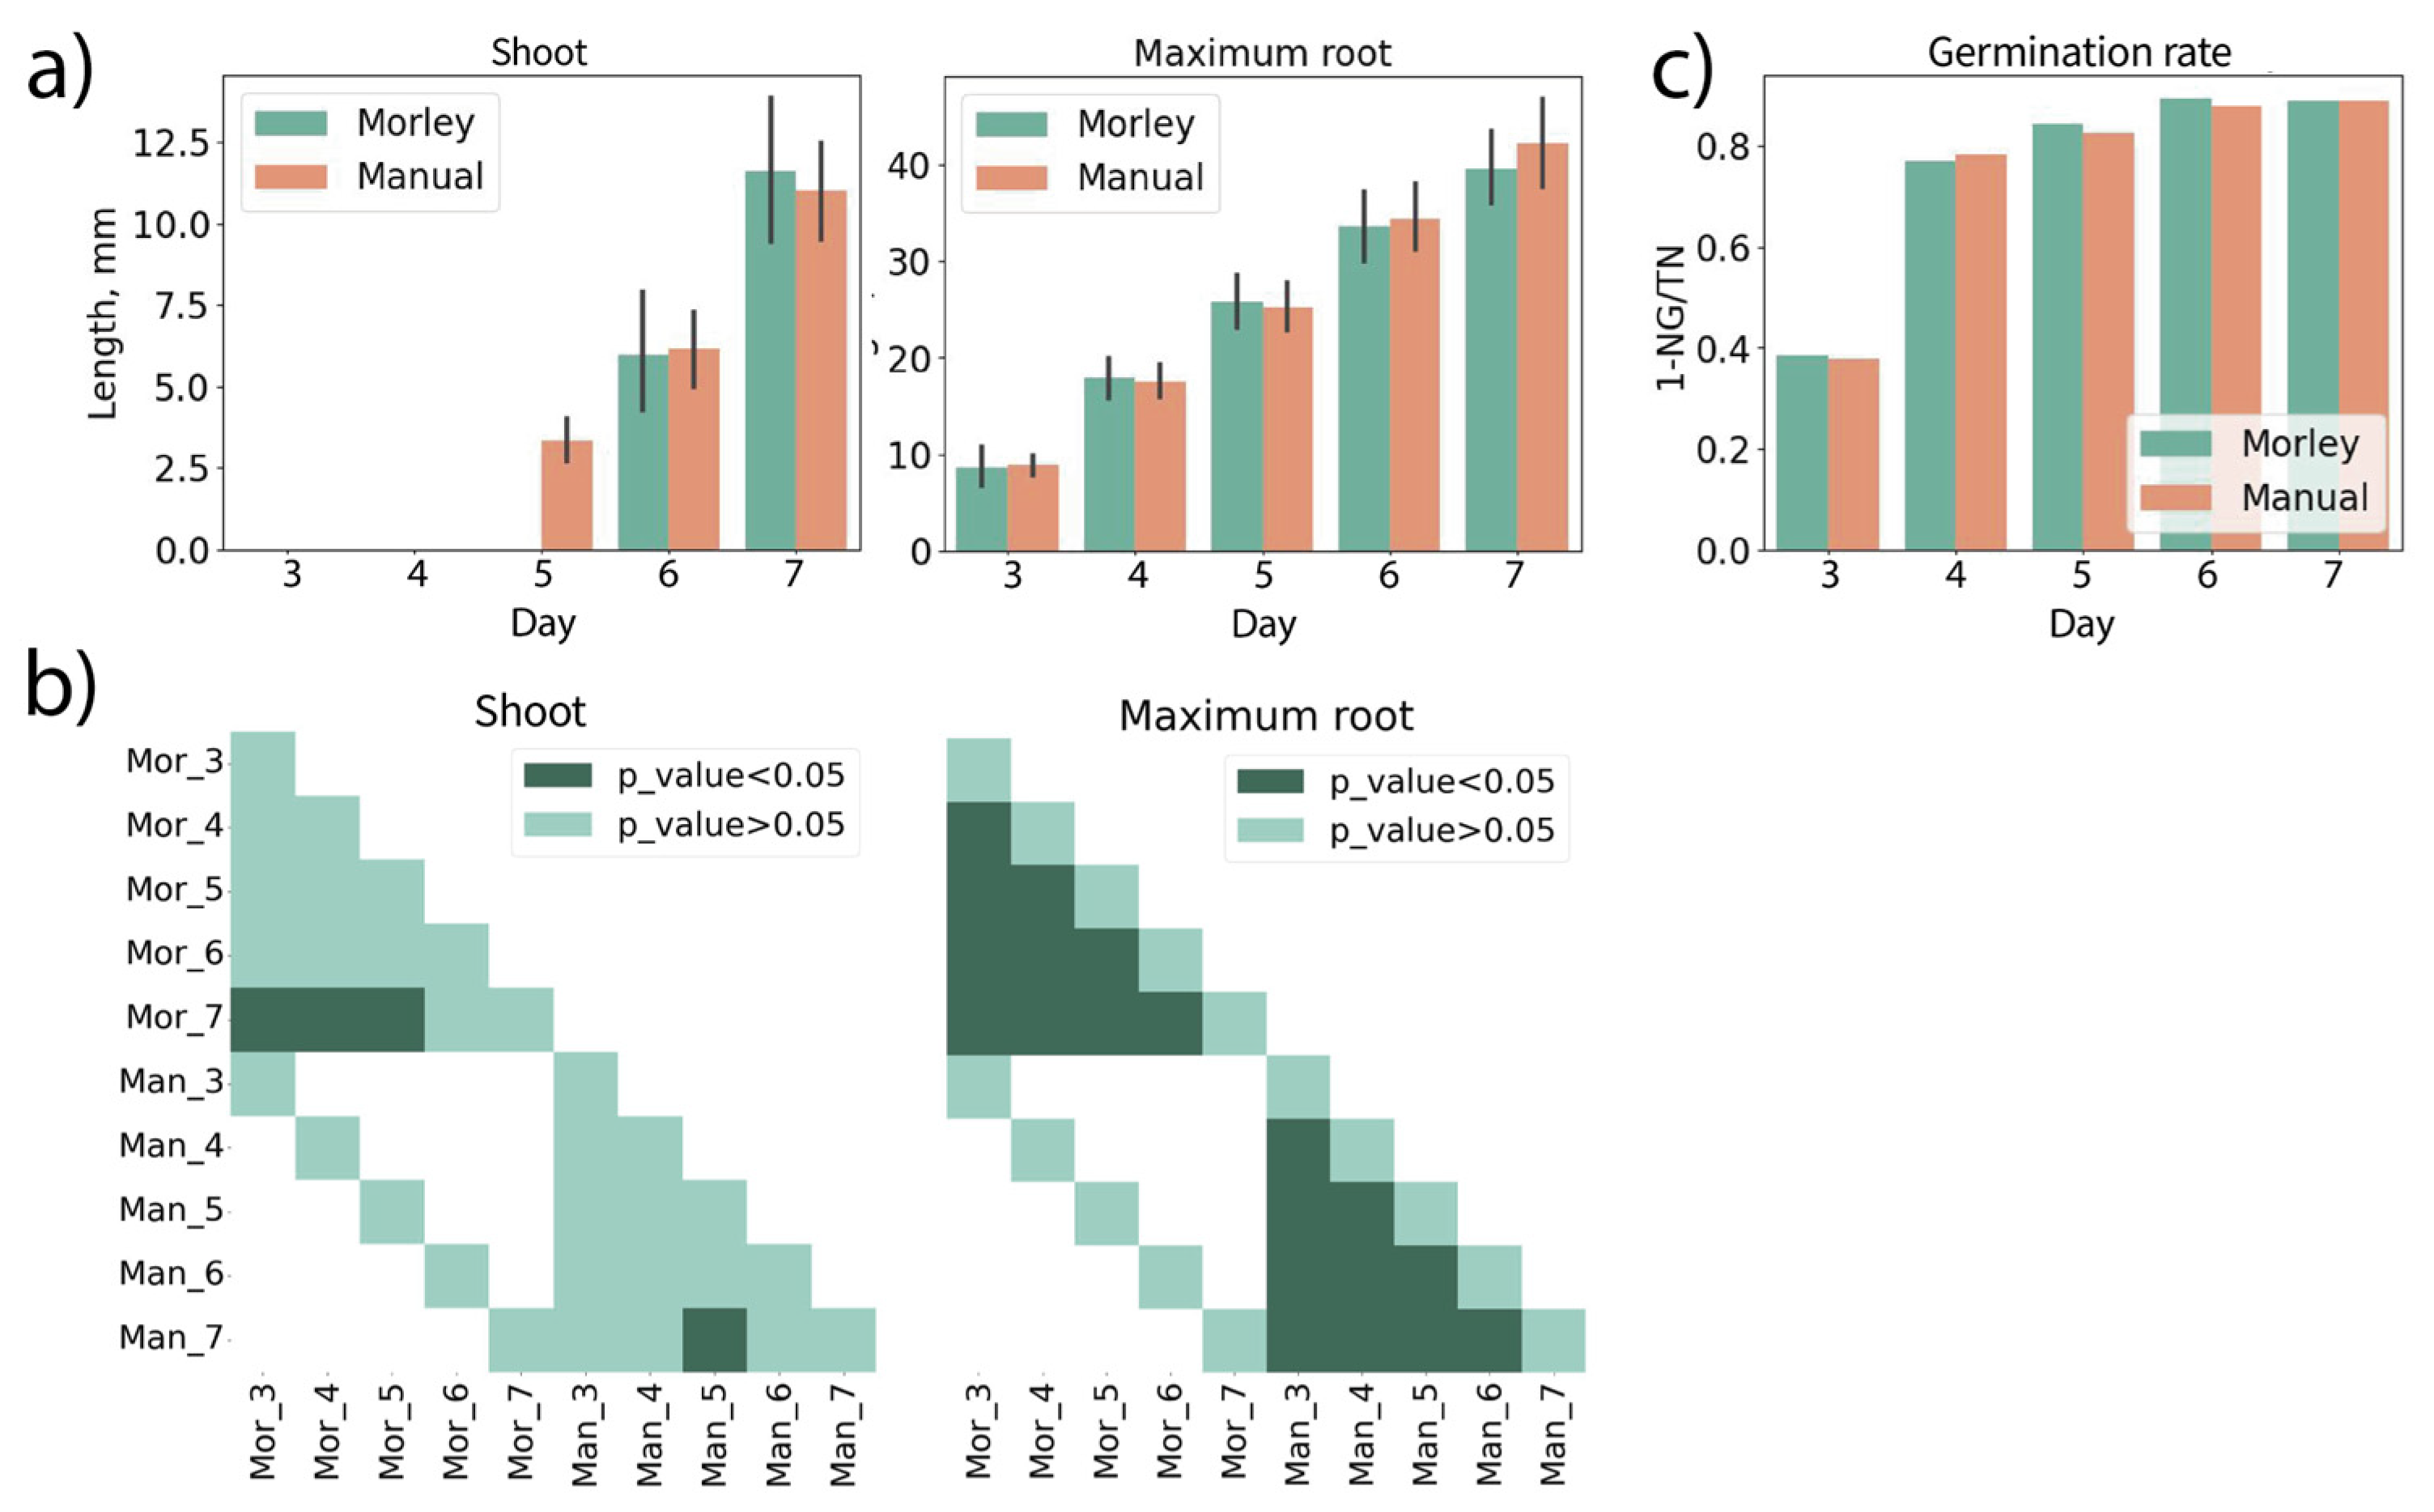
Figure 5.
Morphometry of the 7-day old seedlings of spring wheat, cultivar Zlata, grown from seeds treated with iron (II, III) compounds. a) Shoot lengths, maximum and total root lengths measured using Morley and manually. b) Significant (p-value < 0.05) and non-significant (p-value > 0.05) differences in pairwise comparisons, ImageJ (IJ_) vs. Morley (M_). Data did not conform to a normal distribution (Shapiro-Wilk p-value < 0.05). Mann-Whitney test was used. Treatment groups: 1 - untreated, 2 - film-forming solution; 3 - 10-5 % FeSO4 in film-forming solution; 4 - 10-5 % NP Fe (II, III) in film-forming solution. Search parameters are listed in Table S1.
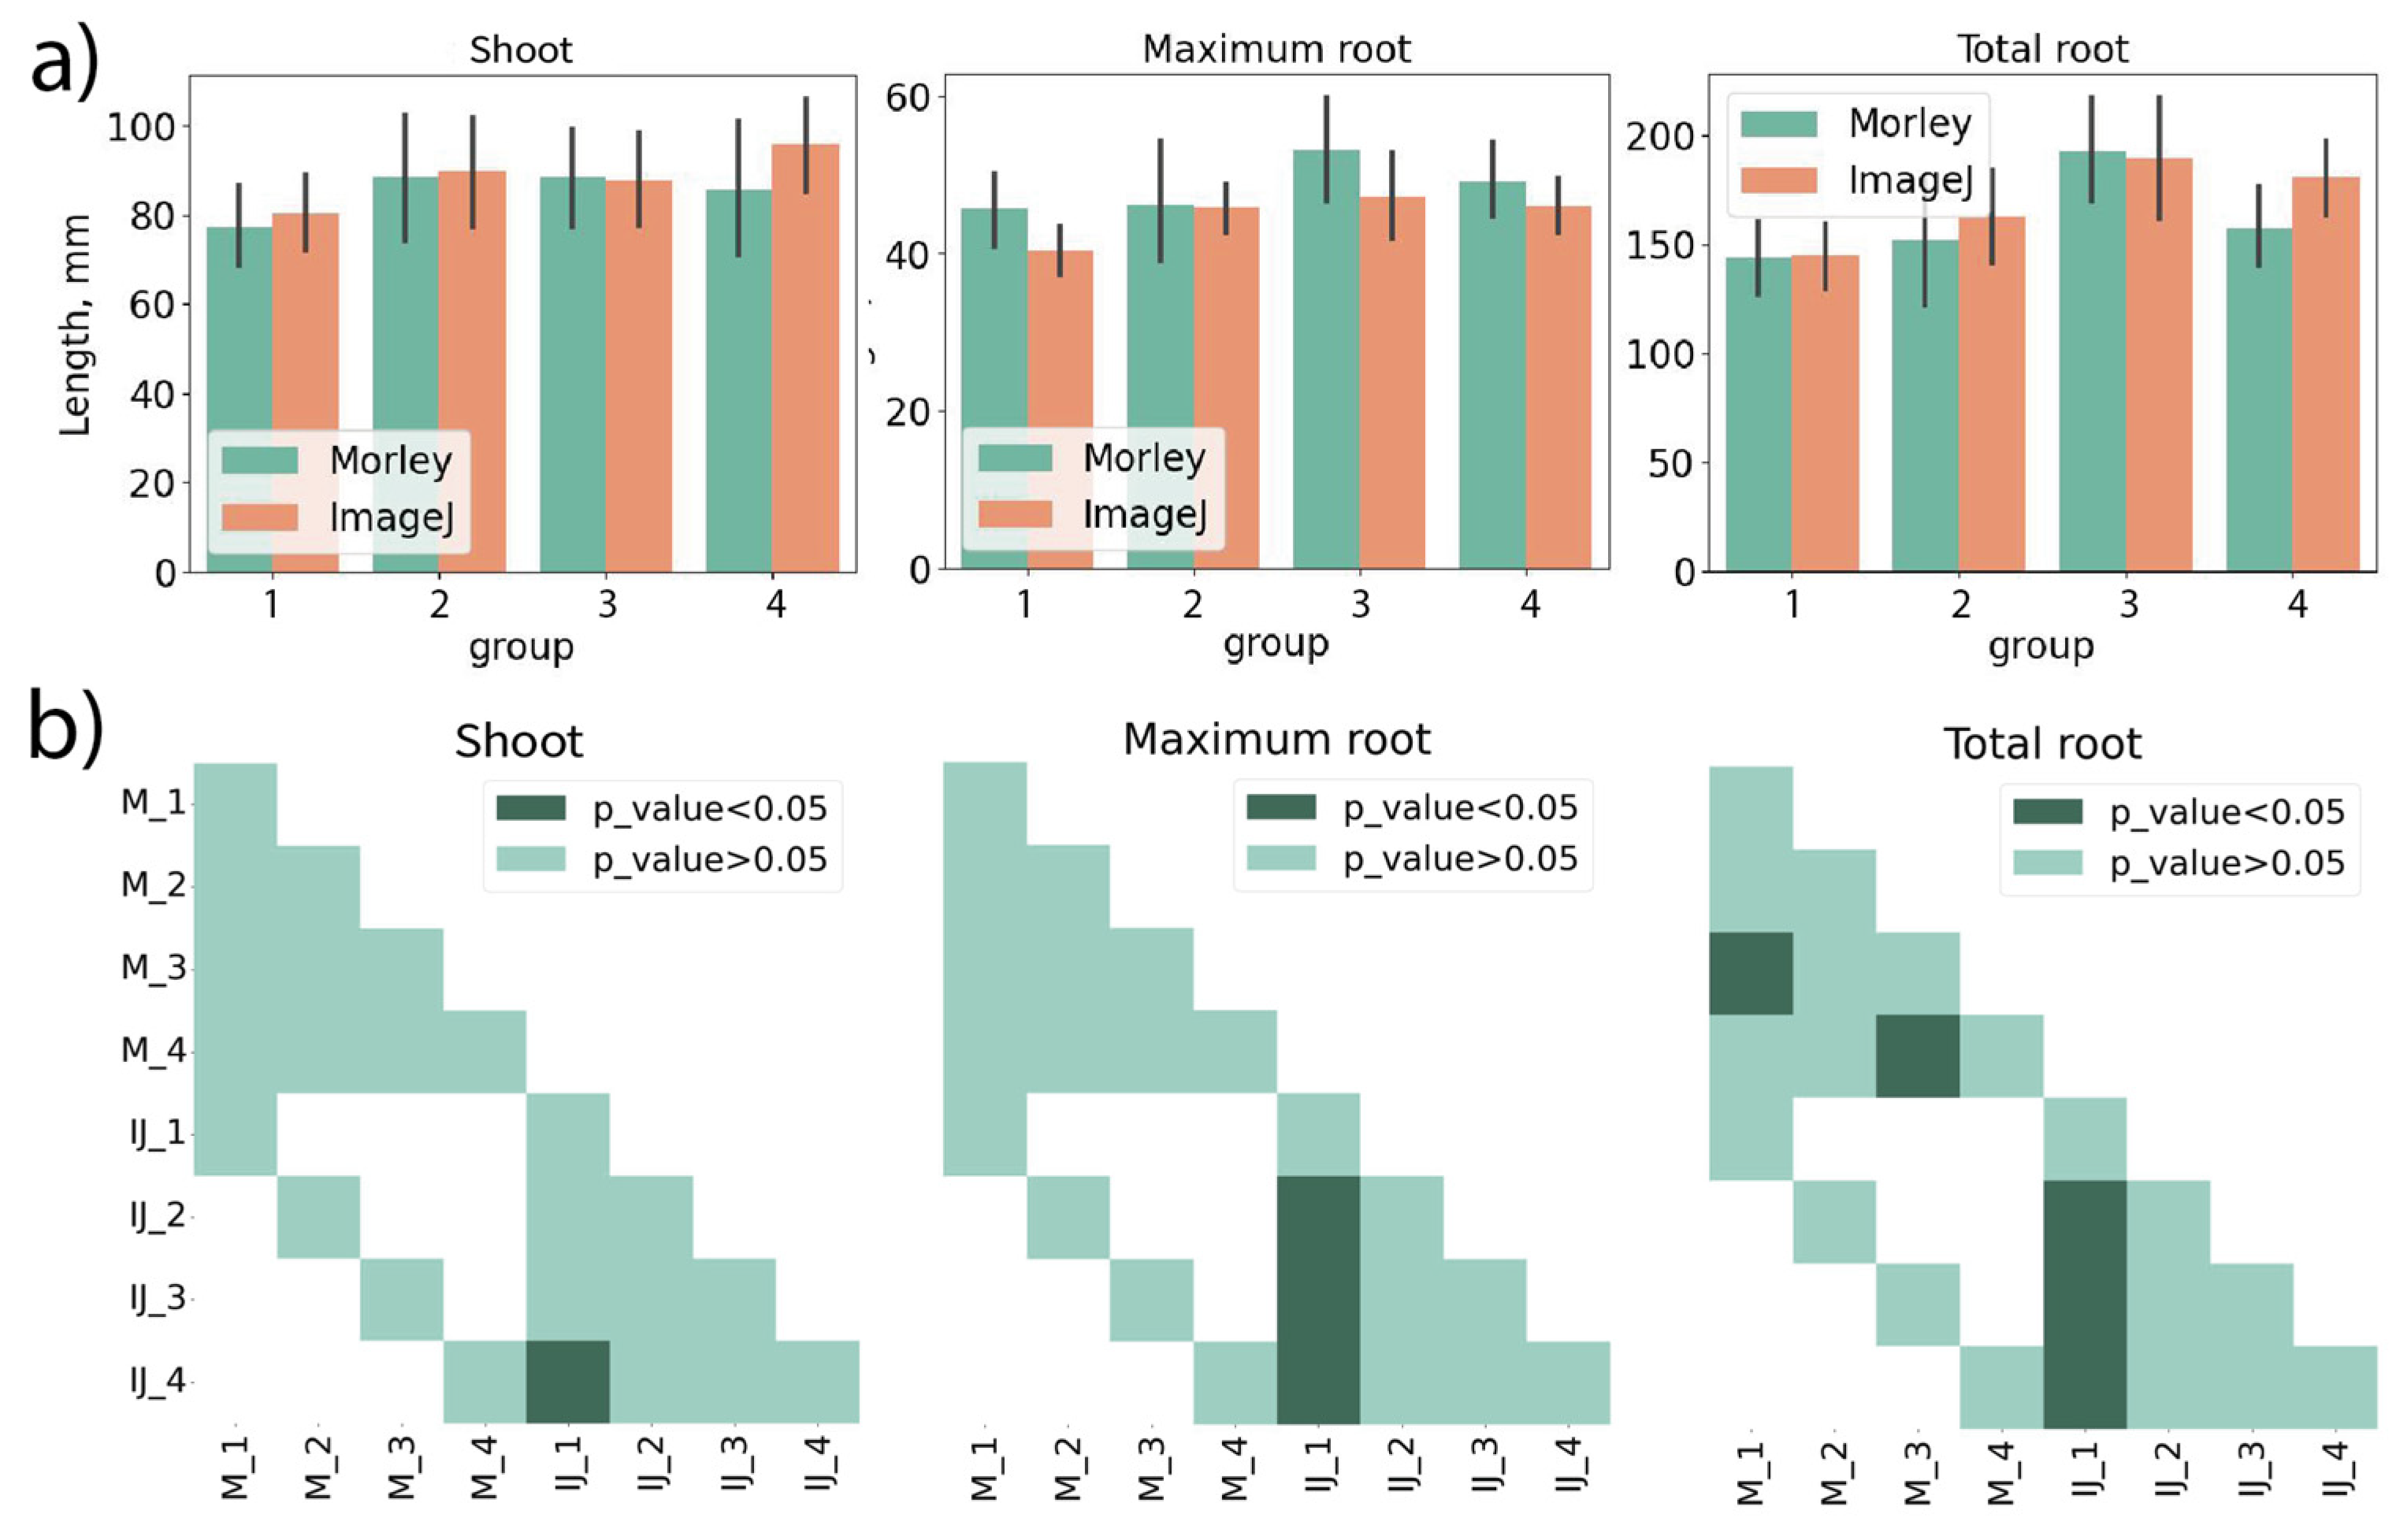
Figure 6.
Morphometry of the 7-day old seedlings of winter wheat, cultivar Alekseevich, grown from seeds treated with iron (II, III) compounds. a) Shoot lengths, maximum and total root lengths measured using Morley and ImageJ. b) Significant (p-value < 0.05) and non-significant (p-value > 0.05) differences in pairwise comparisons, Morley (M_) vs. ImageJ (IJ_). Morley measurements conform to a normal distribution (Shapiro-Wilk p-value > 0.05), Student's t-test was used. ImageJ measurements did not conform to a normal distribution (Shapiro-Wilk p-value < 0.05). Mann-Whitney test was used for Morley-to-IJ and IJ-to-IJ comparisons. Treatment groups: 1 - untreated, bio replicates #1-2; 2 - untreated, bio replicates #3-4; 3 - film-forming solution; 4 - 10-5 % FeSO4 in film-forming solution; 5 - 10-5 NP Fe in film-forming solution. Search parameters are listed in Table S1.
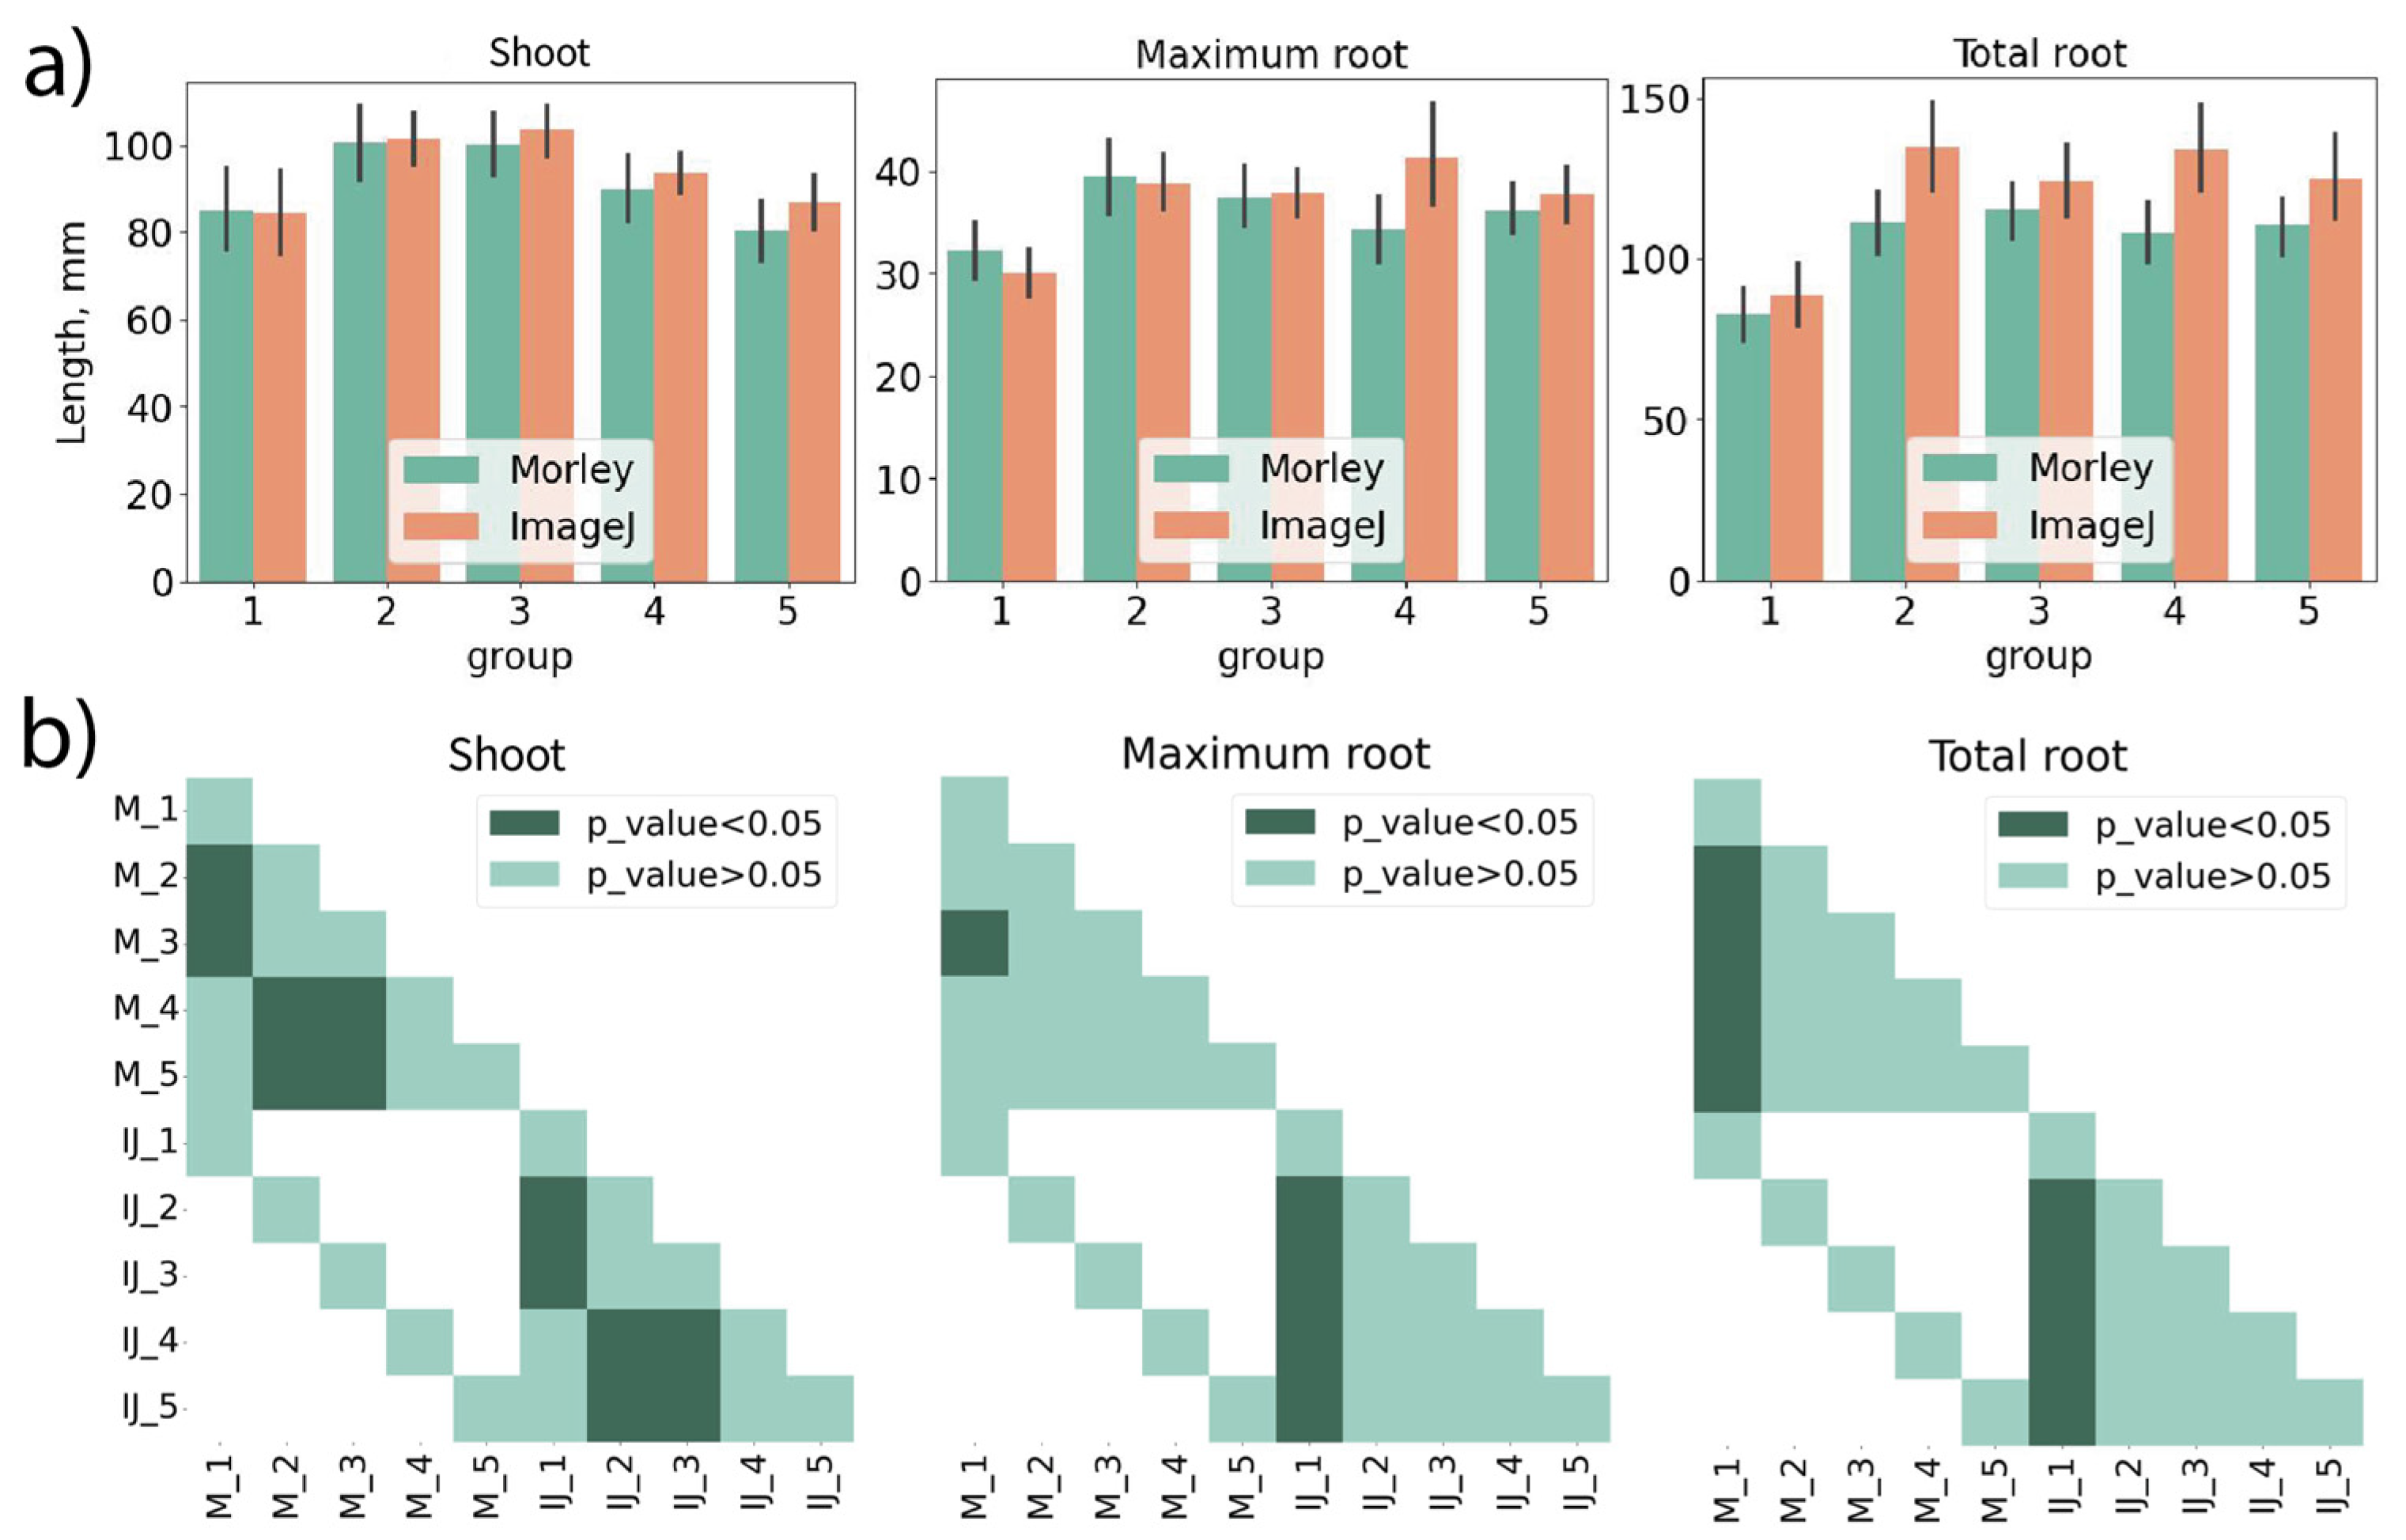
Figure 7.
Morley measures the inhibition of pea growth induced by toxic concentrations of iron sulfate applied for pre-sowing seed treatments. a) Seedling images demonstrating the growth inhibition. b) Seedling object recognition and image segmentation to seed, shoot and root. c) Shoot length, maximum root length, total root length, plant surface area, and, d) germination rate calculated using Morley. Data followed non-Gauss distribution (Shapiro-Wilk p-value < 0.05); Mann-Whitney test was used for analyses. Search parameters are available in Table S1.
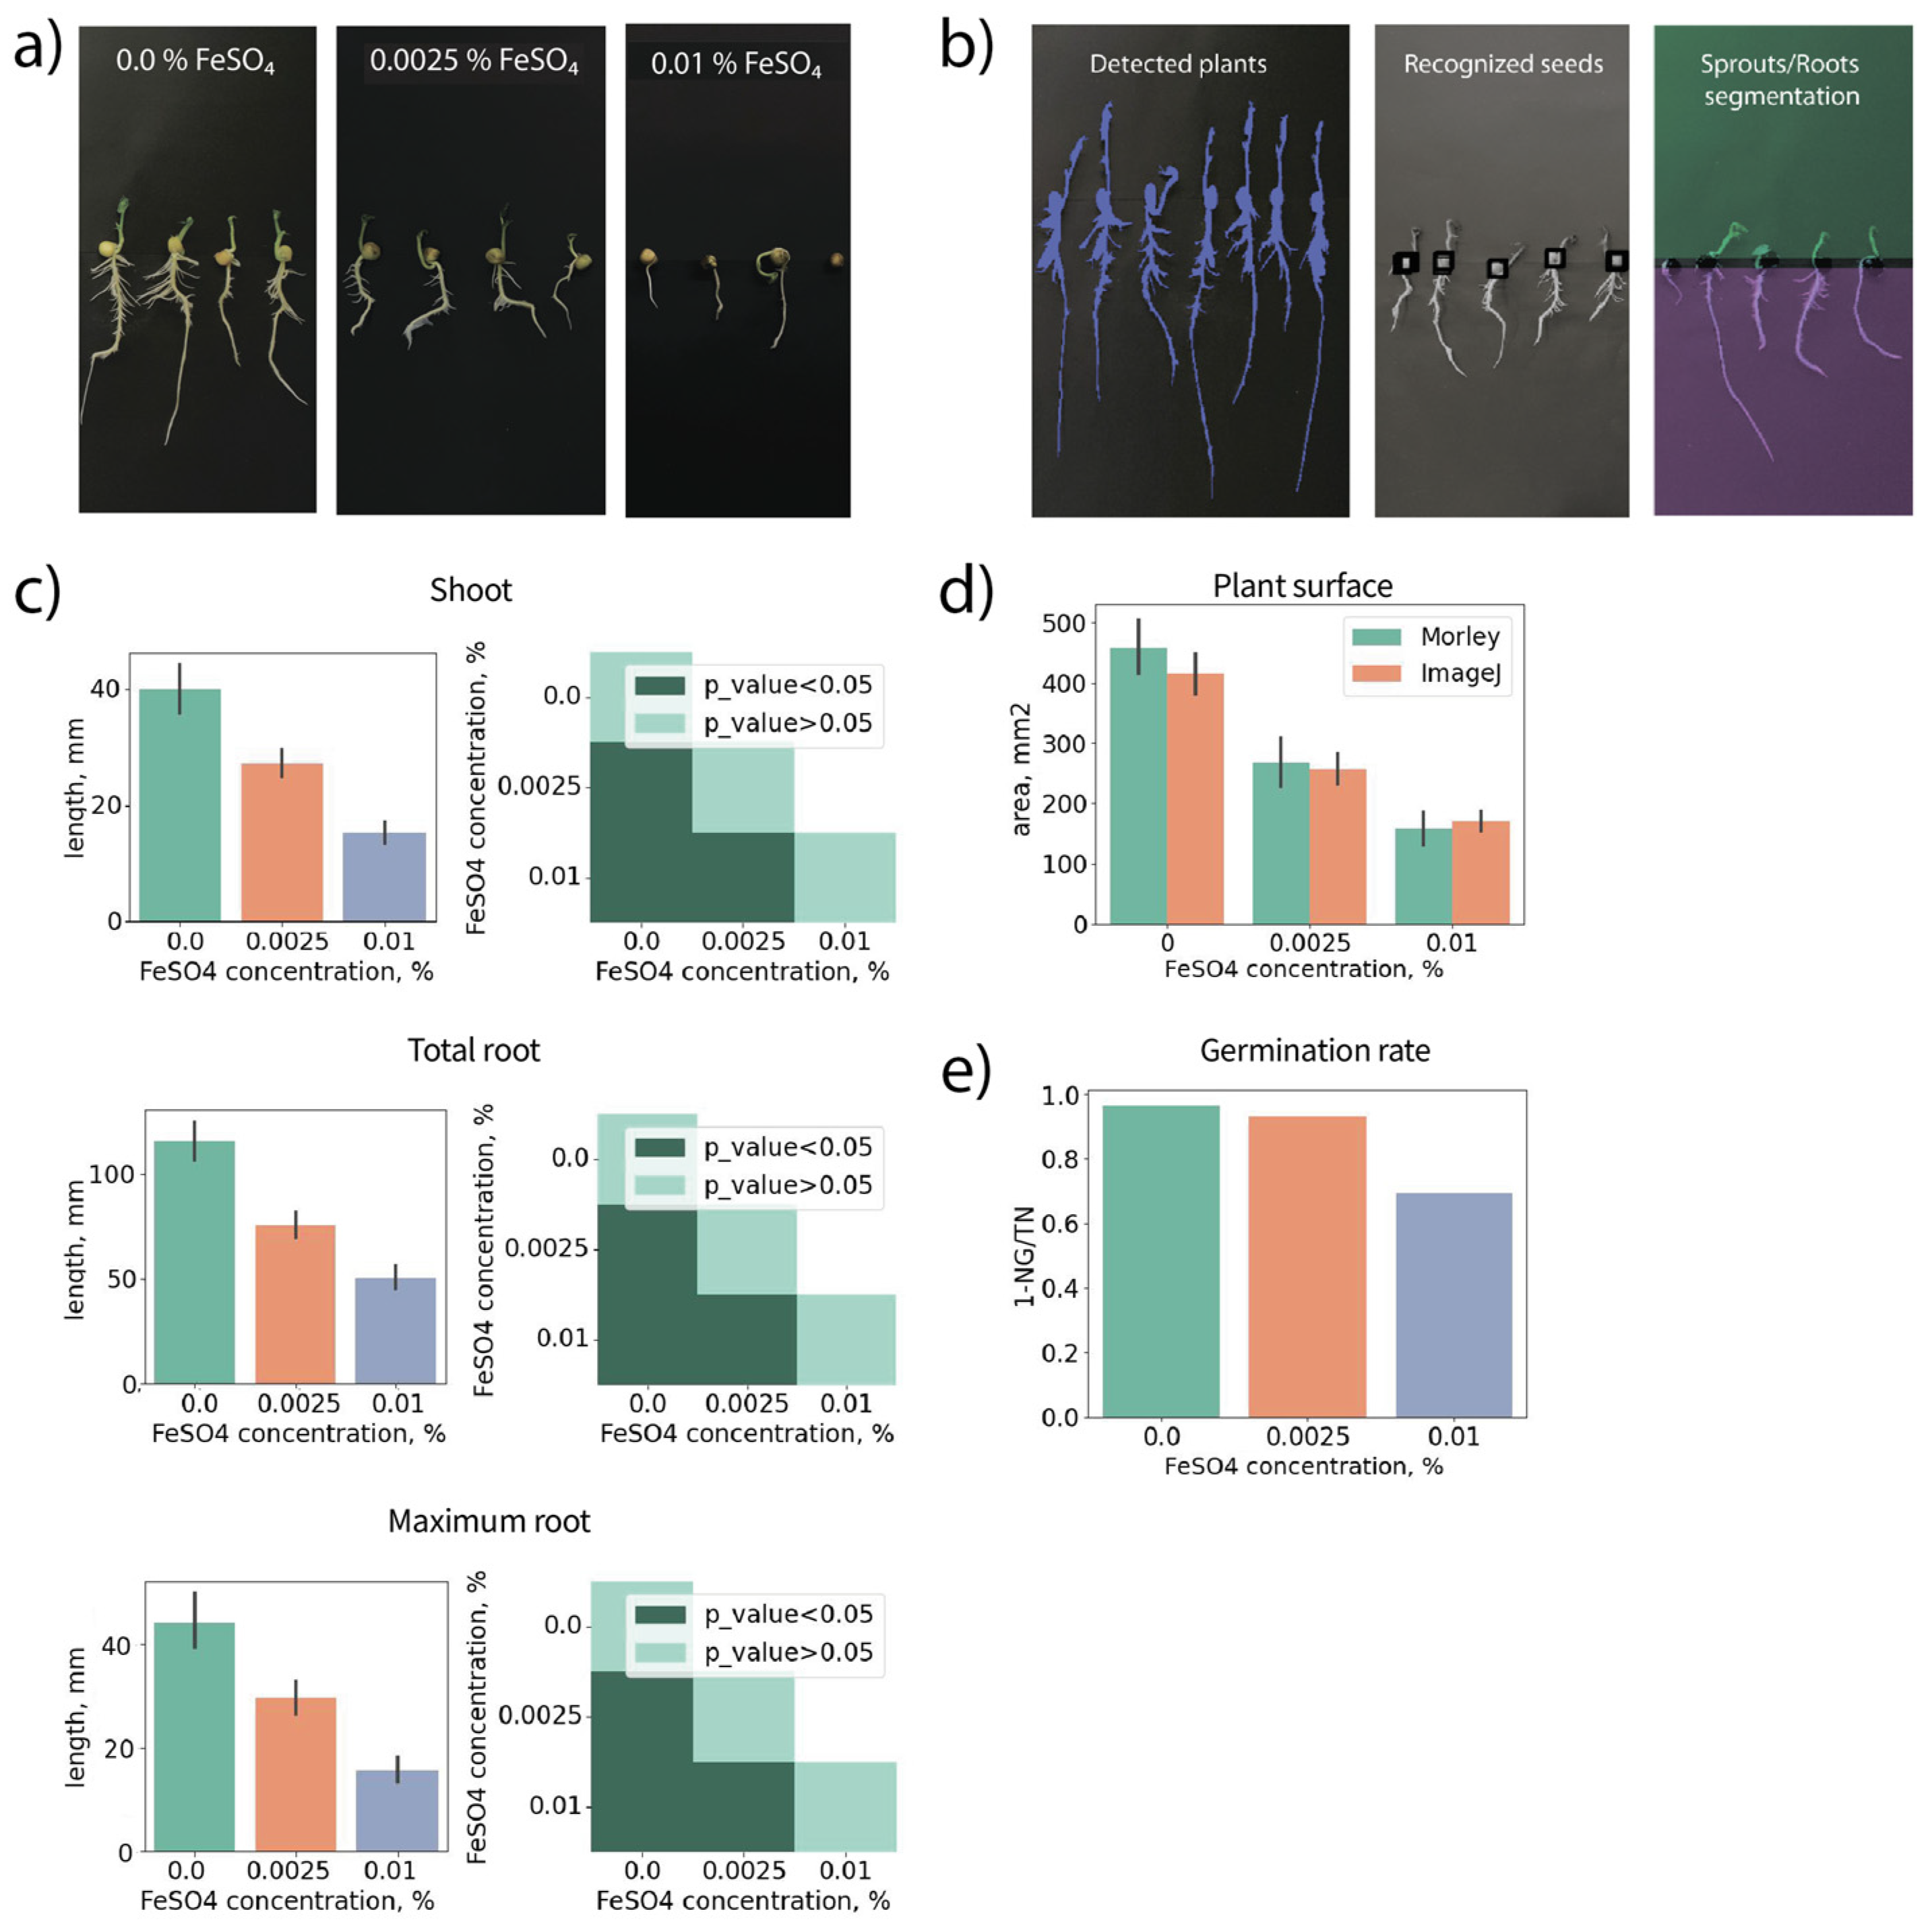

Table 1.
Seed species used in this study. NPs Fe stands for ferric nanoparticles. Seed size is represented by the maximum seed length (the longest axis of the seed) and the maximum seed width (the second longest axis, perpendicular to the length axis). Number of biological replicates (#bio.rep.) is the number of paper rolls per plant group. Each paper roll is a simplified laboratory model of a field. Number of seeds (#seeds) is the number of seeds per a paper roll.
| Species | Cultivar | Origin | Seed size, mm x mm | #bio.rep. / #seeds | Experiment type |
| Triticum aestivum L. | Zlata | Russia | 5 x 3 | 1 / 50 | 1. Comparison of Morley, ImageJ and manual measurements using the untreated wheat seeds |
| Triticum aestivum L. | Alekseevich | Russia | 5 x 3 | 1 / 50 | |
| Triticum aestivum L. | Irishka | Russia | 5 x 3 | 1 / 50 | |
| Triticum aestivum L. | Agata | Russia | 5 x 3 | 1 / 50 | |
| Triticum aestivum L. | Moskovskaya 39 | Russia | 5 x 3 | 5 / 25 | 2. Wheat germination |
| Pisum sativum L. | Rocket | Germany | 8 x 5 | 5 / 25 | 3. Peas germination |
| Triticum aestivum L. | Zlata | Russia | 5 x 3 | 2 / 50 | 4. Growth unaffected by NPs Fe (II, III) and iron (II) sulfate treatments |
| Triticum aestivum L. | Alekseevich | Russia | 5 x 3 | 2 / 50 | |
| Pisum sativum L. | Rocket | Germany | 8 x 5 | 14 / 15 | 5. Growth inhibition from iron (II) sulfate treatment |
Disclaimer/Publisher’s Note: The statements, opinions and data contained in all publications are solely those of the individual author(s) and contributor(s) and not of MDPI and/or the editor(s). MDPI and/or the editor(s) disclaim responsibility for any injury to people or property resulting from any ideas, methods, instructions or products referred to in the content. |
© 2023 by the authors. Licensee MDPI, Basel, Switzerland. This article is an open access article distributed under the terms and conditions of the Creative Commons Attribution (CC BY) license (http://creativecommons.org/licenses/by/4.0/).
Copyright: This open access article is published under a Creative Commons CC BY 4.0 license, which permit the free download, distribution, and reuse, provided that the author and preprint are cited in any reuse.


