
Submitted:
26 January 2026
Posted:
26 January 2026
You are already at the latest version
Abstract
To scientifically evaluate the effects of three environmentally friendly fumigants, dazomet, metham sodium, and calcium cyanamide, on soil microbial community changes, soil from a greenhouse with 7 years of continuous cropping was studied. Soil samples were collected from unfumigated soil (CK), dazomet-fumigated soil (DZ1), metham sodium-fumigated soil (MS1), calcium cyanamide-fumigated soil (CC1) at seedling recovery stage, dazomet-fumigated soil (DZ2), metham sodium-fumigated soil (MS2), and calcium cyanamide-fumigated soil (CC2) at fruiting stage. The effects of different fumigant treatments and treatment periods on soil microbial community changes, tomato yield, and soil-borne diseases were analyzed. The results showed that the application of soil fumigants significantly reduced the richness and diversity of soil bacterial and fungal communities at the seedling recovery stage. Three months after transplanting (at the fruiting stage), the soil microbial diversity gradually recovered. After fumigation, the relative abundance of soil bacteria and fungi at the phylum level changed. Under different fumigation treatments, the trends in the relative abundance changes of species during the seedling recovery and fruiting stages after fumigation exhibited certain differences. Analysis of the dominant soil microbial communities at the genus level revealed that fumigation effectively eliminated pathogenic genera such as Fusarium, but the inhibition rate of pathogens increased during the seedling recovery stage after fumigation. By comprehensively considering microbial community changes during the seedling recovery and fruiting stages after fumigation, as well as indicators such as yield, incidence of soil-borne diseases, and disease index, among the three fumigation treatments, the DZ treatment demonstrated the best overall performance. It increased beneficial genera while reducing the majority of pathogenic genera in the soil. Even after three months, when the plants transitioned from the seedling recovery stage to the fruiting stage, the relative abundance of harmful genera remained suppressed, and the abundance of some beneficial genera increased. However, given the broad-spectrum microbial eradication by fumigants and the time-limited suppression of pathogenic communities, it is essential to supplement beneficial microorganisms promptly after soil fumigation, such as by applying microbial fertilizers in combination.
Keywords:
dazomet
; metham sodium
; calcium cyanamide
; seedling recovery stage
; fruiting stage
; bacteria
; fungi
1. Introduction
Tomato (Solanum lycopersicum L.) is an important economic crop in China that is rich in nutrients such as carotene, vitamin C, and lycopene and is widely favored [1,2]. Compared with open-field cultivation, greenhouse cultivation of tomatoes not only significantly increases yield but also promotes early maturation, enabling year-round production and supply [3]. However, facility agriculture commonly faces challenges in terms of crop rotation, leading to the degradation of soil physicochemical properties and the accumulation of soil pathogens, resulting in increasingly severe issues such as continuous cropping obstacles and soil-borne diseases. These problems cause declines in tomato yield and quality, severely limiting the healthy development of the tomato industry [4,5,6].
The formation of soil-borne diseases is closely linked to imbalances in soil microbial communities, often manifested as a significant reduction in beneficial bacterial populations and the enrichment of pathogens. Therefore, reconstructing soil microbial communities and improving soil microecological balance are crucial for preventing and controlling soil-borne diseases in continuously cropped plants [7,8,9,10]. Currently, in practical production, soil fumigation is the most rapid and effective method for controlling soil-borne diseases. This involves the application of fumigants to sealed soil and the use of volatile active gases to suppress or kill soil-borne pathogens [11]. Dazomet, metham sodium, and calcium cyanamide are the three most common chemical fumigants in production and are characterized by low toxicity and easy decomposition. Owing to their effective control outcomes, they have been successfully used in the production of crops such as tomatoes [12], strawberries [13], potatoes [14], apples [15], and cucumbers [16].
However, evaluations of the effectiveness of different soil fumigants in continuously cropped soils vary, and some scholars have suggested that soil fumigants and their degradation metabolites may have certain negative effects on soil microbial communities and the soil environment, particularly on beneficial microorganisms. After dazomet fumigation, Chen et al. reported that the relative abundance of biocontrol bacteria such as Mortierella in the soil increased, whereas the relative abundance of pathogenic fungi such as Fusarium decreased [17]. Wu et al. reported that after dazomet fumigation, the relative abundance of pathogenic genera such as Ilyonectria and Fusarium in the soil significantly decreased, but the relative abundance of beneficial genera such as Streptomyces, Flavobacterium, Mortierella, and Talaromyces also decreased [18]. Liu et al. reported that calcium cyanamide effectively controlled bacterial wilt and had a relatively small adverse effect on soil microbial activity and community structure [19].
Additionally, fumigation cannot completely eliminate harmful microorganisms in the soil. A certain number of pathogens may survive and proliferate, potentially leading to disease outbreaks [20]. However, research on the duration of disease suppression efficacy by fumigants is limited. Therefore, this study focuses on severely monocropped tomato greenhouses with replanting issues. Three fumigants—dazomet, metham sodium, and calcium cyanamide—were selected. Soil samples were collected during the tomato seedling recovery stage and fruiting period to analyze changes in microbial communities at different postfumigation intervals, as well as direct indicators such as yield and major soil-borne diseases. The aim of this study is to scientifically evaluate the effects of dazomet, metham sodium, and calcium cyanamide fumigation on soil microecosystems and provide theoretical support for the selection of environmentally friendly fumigants.
2. Materials and Methods
2.1. Experimental Materials
The tested tomato variety was ‘Provence’, a locally predominant cultivar. Dazomet (purity ≥98%) was produced by Nantong Shizhuang Chemical Co., Ltd., China. Metham sodium aqueous solution (purity ≥42%) was manufactured by Shenyang Fengshou Pesticide Co., Ltd., China. Calcium cyanamide (purity ≥60%) was obtained from Shizuishan Pengsheng Chemical Co., Ltd., China.
2.2. Experimental Design
The experiments were conducted from July 15, 2024, to February 15, 2025, at Shupeng Farm in Luquan District, Shijiazhuang city, China. Prior to the experiment, the greenhouse had undergone 7 years of continuous tomato cropping, resulting in severe continuous cropping obstacles. The site is located at an altitude of 52 m (35°74′57″N, 105°36′70″E), with basic soil physicochemical properties as follows: organic matter content of 45.63 g·kg-1, total nitrogen content of 2.34 g·kg-1, alkali-hydrolyzable nitrogen content of 186.14 mg·kg-1, available phosphorus content of 109.98 mg·kg-1, available potassium content of 461.23 mg·kg-1, and a pH value of 6.17.
Before soil fumigation, soil samples were collected from the test area using the five-point method. The collected samples were thoroughly mixed and placed in sampling bags and then stored at -80 °C until microbial analysis. Soil fumigation was conducted as follows: On July 30, 2025, dazomet, metham sodium, and calcium cyanamide were applied uniformly in the experimental plots at rates of 20 kg·667 m-2, 40 kg·667 m-2, and 80 kg·667 m-2, respectively. Three fumigation treatments were implemented, each with three replicates. Each plot covered an area of 50 m-2, with a 1 m buffer between plots. The soil was then tilled to a depth of 30 cm using a rotary tiller to ensure thorough mixing of the fumigants with the soil. Subsequently, drip irrigation tubes were laid, and the plots were covered with polyethylene film (thickness ≥0.8 mm) to ensure airtightness. After sealing, water was applied via drip irrigation to achieve a soil moisture content of 50–70%. The film remained in place for 30 days. After fumigation, the film was removed, and the soil was aerated for 20 days before healthy tomato seedlings were transplanted. During the seedling recovery period (September 20), soil samples were collected using the prefumigation method, labeled dazomet fumigation (DZ1), metham sodium fumigation (MS1), and calcium cyanamide fumigation (CC1). Three months after transplanting, when the tomatoes entered the fruiting stage (December 25), soil samples were collected again and labeled as dazomet fumigation (DZ2), metham sodium fumigation (MS2), and calcium cyanamide fumigation (CC3), with nonfumigated soil serving as the control (CK). The collected soil samples were ventilated in a fume hood to remove residual fumigants and then stored at -80 °C until analysis.
2.3. Tomato Soil-Borne Disease Survey
Throughout the growth period of the tomatoes in each fumigation treatment, 5 random sampling points were selected per treatment, with 30 plants per point, to investigate tomato Fusarium wilt, bacterial wilt, and root rot. The incidence rate of each disease was calculated, and the disease index was determined. Incidence rate (%) = (number of infected plants/total number of plants surveyed) × 100; disease index = (Σ(disease severity level × number of plants at that level)/maximum disease severity level × total number of plants) × 100.
2.4. Tomato Yield Survey
Within each fumigation treatment plot, 30 tomato plants were randomly selected. The entire harvest process of these plants was recorded, with the yield of each harvest documented. After uprooting, the number of fruits per plant, single-fruit weight, and plot yield were tallied, and the yield per 667 m² was calculated (total yield = theoretical yield × 85%).
2.5. Data Analysis
The analysis of microbial diversity was performed by Shanghai Personal Biotechnology Co., Ltd., in China. On the basis of the Illumina platform, QIIME2 (2019.4), R language, and the ggplot2 package were used to analyze alpha diversity; R scripts and the VennDiagram package were used to construct Venn diagrams; R language and pheatmap were used to construct species composition heatmaps; and QIIME2 (2019.4) and other software programs were used to compare and perform differential significance analysis on the abundance of taxonomic units at the phylum and genus levels across different soil treatments. Excel 2021 and SPSS 22.0 were used to conduct variance analysis and significance tests for differences between treatments in terms of single-fruit weight, number of fruits per plant, yield, disease incidence, and disease index.
3. Results
3.1. Effects of Different Fumigant Treatments on Soil Bacterial and Fungal Communities
3.1.1. Soil SamplesDepth Evaluation and ASV Clustering Analysis
A total of 1,317,895 pairs of reads were obtained from the bacterial sequencing of 7 soil treatment samples. After clustering at 100% similarity, splicing, and chimera removal, 682,814 high-quality sequences were obtained following paired-end read splicing and filtering, resulting in 46,062 ASVs. Fungal sequencing yielded 1,378,166 pairs of reads. After clustering at 100% similarity, splicing, chimera removal, paired-end read splicing, and filtering, 1,154,809 high-quality sequences were obtained, which were subsequently clustered into 4,887 ASVs. Random subsampling of sequencing sequences was performed, and rarefaction curves were constructed using the number of sampled sequences and the species they represented. As shown in Figure 1, the rarefaction curves for species numbers gradually flattened, indicating sufficient sequencing depth and reasonable data quantity for subsequent analysis.
As shown in Figure 2a, the 7 treatments shared 405 bacterial ASVs, with the number of unique ASVs in the CK treatment (3,849) being the greatest. The unique ASVs for DZ1, MS1, CC1, DZ2, MS2, and CC2 were 11.56%, 24.06%, 33.31%, 16.24%, 24.4%, and 20.11% lower than those of the CK, respectively, with MS2 having the fewest unique ASVs. The data in Figure 2b indicate that the 7 treatments shared 34 fungal ASVs, with DZ2 having the greatest number of unique ASVs, which was 44.56% greater than that in the CK. During the fruiting period, the unique ASV counts for the DZ, MS, and CC treatments were 50.64%, 6.62%, and 28.47% greater, respectively, than those during the seedling acclimation period.
3.1.2. Effects of Different Fumigation Treatments on the α Diversity of Soil Bacteria and Fungi
As shown in Table 1, compared with those in the other treatments, the Chao1 index and observed species index in the CK treatment were significantly greater. The Chao1 index and observed species index of MS2 and CC2 were significantly greater than those of MS1 and CC1. In terms of the bacterial community diversity indices, the Shannon index of the CK treatment was significantly greater than that of the other treatments. The Shannon index and Simpson index of MS2 and CC2 were significantly greater than those of MS1 and CC1. These findings indicate that soil fumigation significantly reduces the richness and diversity of soil bacterial communities. Three months after fumigation, the richness and diversity indices of the bacterial communities in the soils treated with MS and CC increased.
In terms of the fungal community richness indices, compared with those in the CK treatment, the Chao1 index and observed species index in the DZ1, MS1, and CC1 treatments were significantly lower (by 31.53%, 27.96%, and 37.35% and by 32.13%, 27.98%, and 37.55%, respectively). Compared with those of DZ1, MS1, and CC1, the Chao1 index and observed species index of DZ2, MS2, and CC2 significantly increased by 36.88%, 17.07%, and 20.35% and by 37.36%, 16.98%, and 20.5%, respectively. Among the fungal community diversity indices, compared with those in the CK treatment, the Shannon indices in the DZ1, MS1, and CC1 treatments were significantly lower (by 8.7%, 7.75%, and 14.24%, respectively). The Shannon index of DZ2 and MS2 was significantly greater than that of DZ1 and MS1. The Simpson index of MS2 was significantly greater than that of MS1. These findings indicate that soil fumigation can significantly reduce the richness and diversity of soil fungal communities. Compared with those in the slow seedling stage, the soil fungal community richness indices increased during the fruiting stage in the DZ, MS, and CC treatments, and the soil fungal community diversity indices increased in the DZ and MS treatments.
3.1.3. Analysis of Bacteria and Fungi in Soil Under Different Fumigation Treatments at the Phylum Level
As shown in Figure 3a, at the bacterial phylum level, Actinobacteria and Proteobacteria were the predominant phyla across all the treatments, accounting for 43.7%~61.25% of the total. The relative abundance of Actinobacteria was greatest in the DZ1, DZ2, and CC1 treatments, at 40.59%, 30.38%, and 28.65%, respectively. Proteobacteria was most abundant in the CK, MS1, MS2, and CC2 treatments (28.28%, 27.42%, 27.69%, and 33.86%, respectively). Compared with those in the CK treatment, the relative abundance of Actinobacteria in all the treatments except MS1 was greater, whereas the relative abundance of Proteobacteria was lower in all the treatments except CC2 than in the CK. The relative abundance of Actinobacteria in DZ2 and CC2 decreased by 10.21% and 1.26%, respectively, compared with that in DZ1 and CC1, whereas that in MS2 increased by 10.92% compared with that in MS1. Compared with those in DZ1 and MS1, the relative abundance of Proteobacteria in DZ2 and MS2 did not significantly change, whereas that in CC2 increased by 10.24% compared with that in CC1.
As shown in Figure 3b, at the fungal phylum level, Ascomycota was the dominant phylum common to all the treatments, accounting for 56.16%~80.61%. Compared with that in the CK treatment, the relative abundance of Ascomycota in the DZ1, MS2, and CC2 treatments increased by 7.43%, 13.33%, and 1.58%, respectively, whereas in the DZ2, MS1, and CC1 treatments, it decreased by 0.42%, 8.37%, and 11.11%, respectively. The relative abundance of Ascomycota in DZ2 decreased by 7.85 compared with that in DZ1, whereas in MS2 and CC2, the relative abundance of Ascomycota increased by 21.7% and 12.68% compared with that in MS1 and CC1, respectively. In summary, after soil fumigation, the relative abundances of bacterial and fungal phyla in the soil changed. Under different fumigation treatments, the trends in relative abundance changes during the recovery and fruiting periods postfumigation exhibited certain differences.
3.1.4. Analysis of the Dominant Bacterial and Fungal Genera in Soil Under Different Fumigation Treatments
The relative abundance > 1% was used as the dominant genus standard. According to Table 2, there were 16,17,12,19,16,16 and 18 dominant bacterial genera in CK, DZ1 ~ CC2, respectively. The abundance of dominant bacterial genera accounted for 32.88%, 44.71%, 42.05%, 39.63%, 33.12%, 41.84% and 35.95%, respectively. Among the seven treatments, six common dominant bacterial communities were identified: Subgroup_6, Micromonospora, KD4-96, Gitt-GS-136, MND1, and AKYG1722. With respect to the dominant fungal genera, the seven treatments (CK, DZ1 to CC2) had 13, 11, 11, 9, 10, and 7 dominant fungal genera, respectively, accounting for 56.71%, 65.59%, 53.43%, 52.53%, 55.44%, 49.17%, and 52.04% of the total, respectively. Among the seven treatments, three common dominant fungal communities were identified: Aspergillus, Mortierella, and Remersonia.
After fumigation, the relative abundance of beneficial and harmful bacterial genera in the dominant flora of each treatment also changed. Two beneficial bacterial genera, Bacillus and Streptomyces, were detected among the dominant bacterial genera. Compared with that of the control, after the DZ fumigation treatment, the relative abundance of Bacillus increased by 1.28% during the seedling recovery stage but further increased to 11.76% upon entering the fruiting stage. Compared with that of the control, the relative abundance of Streptomyces increased by 0.53% and 0.73% after the DZ and CC treatments, respectively, during the seedling recovery stage. After the seedling recovery stage, the relative abundance of Streptomyces in the DZ treatment increased to 1.58%, whereas that in the CC treatment decreased to 0.95%.
Beneficial fungal genera such as Aspergillus, Remersonia, Talaromyces, Chaetomium, Penicillium, Humicola, and Trichoderma were detected among the dominant fungal genera. Compared with those in the CK treatment, the relative abundances of Remersonia and Penicillium increased to varying degrees after fumigation during the seedling recovery period. Compared with that in the seedling recovery period, the relative abundance of Penicillium in the fruiting period decreased, whereas the relative abundance of Remersonia significantly increased by 5.07% in the DZ treatment. The relative abundance of Aspergillus increased by 10.86% and 10.02% in the DZ and MS fumigation treatments, respectively, during the seedling recovery period but rapidly decreased after the fruiting period began. The relative abundances of Chaetomium, Humicola, and Trichoderma decreased during the seedling recovery period after fumigation, but in the CC treatment during the fruiting period, the relative abundance of Trichoderma increased from 0.25% to 1.2%. Harmful fungal genera such as Amesia, Fusarium, Rhizopus, and Ascobolus were detected among the dominant fungal genera. Compared with those of the control, the relative abundances of these four harmful genera decreased during the seedling recovery period after fumigation. Amesia decreased by 2.79%, 8.4%, and 10.75% in DZ1, MS1, and CC1, respectively. Fusarium decreased by 3.09%, 0.39%, and 3.06% in DZ1, MS1, and CC1, respectively. During the seedling recovery period, the relative abundances of Rhizopus and Ascobolus in the three fumigation treatments decreased to 0%. Compared with that in the control treatment, the relative abundance of Amesia in all the fumigation treatments continued to decrease, with a reduction of 6.24% in the DZ treatment compared with that in the seedling recovery period. However, the relative abundance of Fusarium gradually recovered in all the fumigation treatments, although it remained significantly lower than that in the CK in the DZ and CC treatments but increased to 8.25% in the MS treatment. The relative abundance of Ascobolus in the CC treatment group recovered to 0.9% during the fruiting period, which was still 0.58% lower than that in the CK group. The results indicate that among the three fumigation treatments, the DZ treatment increased the abundance of beneficial genera while reducing the abundance of most of the pathogenic genera in the soil. Even after three months, which transitioned from the seedling recovery period to the fruiting period, the relative abundance of harmful genera remained suppressed.
In terms of the abundance of soil bacteria and fungi, the main bacteria and fungi in the soil of each treatment were concentrated in the top 30 genera. Therefore, a heatmap of the abundance of the top 30 genera was constructed, and a cluster analysis was conducted. The bacterial community composition at the genus level in the different treatments can be divided into three categories: DZ1 and MS1 cluster closely as the first category; DZ2 and CC1 cluster closely as the second category; and MS2, CC2, and CK cluster closely as the third category (Figure 4a). The fungal community composition at the genus level in different treatments can be divided into five categories: DZ1 and CC1 cluster closely as the first category; MS1 and MS2 cluster closely as the second category; and CC2, CK, and DZ2 cluster as the third to fifth categories (Figure 4b). The results indicate that after the MS and CC treatments, the bacterial community structure gradually approached the prefumigation level during the fruiting stage. The fungal communities in the fumigated treatments significantly differed from those in the CK treatment during both the seedling recovery stage and the fruiting stage. Additionally, the fungal communities in the MS treatments remained similar between the seedling recovery and fruiting stages.
3.1.5. Special Communities of Soil Bacteria and Fungi Under Different Fumigation Treatments
LEfSe was used to study the biomarkers with significant differences at different taxonomic levels in the bacterial and fungal communities under different treatments, as shown in Figure 5a, revealing that the bacterial community (LDA threshold of 3.61) generated a total of 100 differential indicator species, among which 9 were from the CK treatment, including Acidobacteria, Subgroup_6 (from class to genus), Sphingomonadales (from order to family), and Myxococcales. The DZ treatment resulted in the identification of 10 differential indicator species during the seedling recovery period and 15 during the fruiting period. DZ1 included Acidobacteria (from phylum to class), Propionibacteriales, Streptosporangiales, Nocardioidaceae, Thermomonosporaceae, Thermopolyspora, Actinomadura, Brevibacillus, and Vulcaniibacterium; DZ2 included Firmicutes, Bacilli, Micromonosporales, Streptomycetales, Bacillales, Micromonosporaceae, Streptomycetaceae, Streptosporangiaceae, Bacillaceae, Methylophilaceae, Micromonospora, Streptomyces, Bacillus, and MM2. The MS treatment resulted in 16 differential indicator species during the seedling recovery period and 8 during the fruiting period. MS1 included Deinococcus_Thermus, Rhodothermia, Deinococci, Clostridia, S0134_terrestrial_group (from class to genus), Actinomarinales, Deinococcales, Clostridiales, Rhodothermaceae, Trueperaceae, Paenibacillaceae, Xanthomonadaceae, and Truepera; MS2 included Acidimicrobiia, Thermoleophilia, Deltaproteobacteria, Solirubrobacterales, Micrococcaceae, Solirubrobacteraceae, and MND1. The CC treatment resulted in 14 differential indicator species during the seedling recovery period and 28 during the fruiting period. CC1 included Chloroflexi, Anaerolineae, Gemmatimonadetes, SBR1031 (from order to genus), Thermales, Thermaceae, Burkholderiaceae, Chryseolinea, and Schlegelella; CC2 included Bacteroidetes, Patescibacteria, Proteobacteria, Bacteroidia, Saccharimonadia, Saccharimonadales (from order to genus), Dongiales, Rhizobiales, and CCD24 (from order to genus), and Xanthomonadales, Xanthobacteraceae, Microbacteriaceae, Microscillaceae, Dongiaceae, Rhodomicrobiaceae, Nitrosomonadaceae, Virgisporangium, Dongia, Rhodomicrobium, and Lysobacter.
As shown in Figure 5b, the fungal community (LDA threshold of 2) produced a total of 33 differential indicator species, among which 8 were differential indicator species for the CK treatment, namely, Mucoromycota, Mucoromycetes, Mucorales, Sporormiaceae, Rhizopodaceae, Chaetomium, Humicola, and Rhizopus. For the DZ treatment, there were 12 differential indicator species during the seedling recovery stage and 10 during the fruiting stage. DZ1 included Eurotiomycetes, Wallemiomycetes, Eurotiales, Wallemiales, Trichomeriaceae, Aspergillaceae, Wallemiaceae, Aspergillus, Penicillium, Thermomyces, Myceliophthora, and Wallemia; DZ2 included Orbiliomycetes, Orbiliales, Xylariales, Orbiliaceae, Lasiosphaeriaceae, Microdochiaceae, Curvularia, Arthrobotrys, Schizothecium, and Idriella. For the MS treatment, there was 1 differential indicator species each during the seedling recovery stage and fruiting stage, namely, Leotiomycetes and Ascomycota, respectively. For the CC treatment, there was 1 differential indicator species during the fruiting stage, identified as Naganishia. The above species influence the structural composition of microbial communities in soils subjected to different fumigation treatments.
3.2. Effects of Different Fumigation Treatments on Tomato Yield
As shown in Table 3, the single-fruit weight, number of fruits per plant, and yield were significantly greater in the fumigated treatments than in the CK treatment. Compared with those in the CK treatment, the yields in the DZ, MS, and CC treatments increased by 24.76%, 29.2%, and 35.41%, respectively. Among the soil fumigation treatments, the CC treatment resulted in the highest single-fruit weight (172.2 g), number of fruits per plant (21), and yield (6719.03 kg), but these parameters did not significantly differ between the DZ and MS treatments.
3.3. Effects of Different Fumigation Treatments on Major Soil-Borne Diseases of Tomato
As shown in Table 4, no bacterial wilt occurred in any of the fumigated treatments. The incidence and disease index of Fusarium wilt and root rot in the DZ and CC fumigation treatments were significantly lower than those in the CK, while the incidence of Fusarium wilt in the MS treatment was not significantly different from that in the CK. The results indicate that the DZ treatment had the lowest incidence and disease index for soil-borne diseases.
4. Discussion
The occurrence and exacerbation of crop continuous cropping obstacles are related to the combined effects of multiple factors within the plant–soil–microbial system. Among these factors, the imbalance of soil microecology is a significant cause of frequent soil-borne diseases [21]. An imbalance in soil microecology is manifested mainly by a reduction in beneficial microorganisms, enrichment of pathogenic bacteria, and transformation of microbial community characteristics from “bacterial-type” to “fungal-type” [22]. Soil fumigation can eliminate target microorganisms in the soil, reconstruct soil microbial community structures, effectively control soil-borne diseases in crops, and alleviate continuous cropping obstacles [23]. Therefore, evaluating and clarifying the impact and persistence of different fumigants on soil microbial communities are important for the prevention and control of continuous cropping obstacles.
In this study, three fumigants—dazomet, metham sodium, and calcium cyanamide—were selected. Soil samples were collected during the tomato seedling recovery period and fruiting period to analyze changes in microbial diversity and community structure after fumigation. After fumigation, the richness and diversity of the soil bacterial and fungal communities decreased to varying degrees, which is consistent with the findings of Chen et al. [24]. Compared with those during the seedling recovery period, the soil fungal community richness index increased during the fruiting period, and the richness and diversity indices of the soil bacterial communities in the MS and CC treatments increased. These findings indicate that three months after fumigation, the soil microbial diversity gradually recovered, which aligns with the results of De et al.
The soil in continuously cropped fields contains a large number of pathogenic bacteria, and soil fumigation can eliminate most of them. After fumigation, the relative abundances of Amesia, Fusarium, Rhizopus, and Ascobolus decreased during the seedling recovery period. Amesia can cause root rot, stem rot, and leaf spot symptoms in plants [25]. Fusarium is a common plant pathogen, and multiple species within this genus are closely related to soil-borne diseases in crops [26,27]. For example, wilt pathogens (Fusarium oxysporum) can invade the young roots or wounds of tomato plants, leading to yellowing and wilting of leaves. This pathogen has a wide host range and is infectious [28]. Fusarium graminearum causes root rot, and once the disease occurs, it is difficult to eliminate in the short term [29]. Rhizopus can cause root rot in plants [30]. Ascobolus accumulates in the soil over time and is strongly positively correlated with disease incidence [31]. However, after entering the fruiting period, the abundance of Amesia continued to decline in the DZ treatment, with a decrease of 6.24% compared with that in the seedling recovery period, while the relative abundance of Fusarium gradually recovered in all the fumigation treatments. Nevertheless, compared with those in the CK treatment, the relative abundance in the DZ and CC treatments remained significantly lower, while that in the MS treatment increased to 8.25%. The results of these experiments revealed that fumigation can effectively control Fusarium species, but the inhibition rate of pathogens is greater during the seedling recovery period. This finding is also consistent with the findings of this study, which revealed that fumigation significantly reduced the incidence and disease index of wilt and root rot.
Soil microorganisms are key for maintaining the stability of soil ecosystems, and an increase in the number of beneficial microorganisms is crucial for maintaining the dynamic balance of soil microecology. However, the broad-spectrum nature of fumigation leads to the suppression of some beneficial microbial communities while eliminating pathogenic bacteria. However, some studies have shown that the relative abundance of certain soil microbial communities does not decrease after soil fumigation but instead increases [32]. Compared with those in the CK treatment, the relative abundances of Remersonia and Penicillium increased to varying degrees during the seedling recovery period after the fumigation treatment. Compared with that in the seedling recovery period, the relative abundance of Penicillium in the fruiting period decreased, whereas the relative abundance of Remersonia significantly increased by 5.07% in the DZ treatment. Remersonia can promote soil nutrient absorption and inhibit the development of pathogenic bacteria in the soil [33]. Penicillium can secrete broad-spectrum antimicrobial compounds and has the potential to promote plant growth [34,35]. The relative abundance of Aspergillus increased by 10.86% and 10.02% in the DZ and MS fumigation treatments, respectively, during the seedling recovery period but rapidly decreased after the fruiting period began. After fumigation, the relative abundances of Chaetomium, Humicola, and Trichoderma decreased during the seedling recovery period. However, in the CC treatment during the fruiting period, the relative abundance of Trichoderma increased from 0.25% to 1.2%. After the DZ fumigation treatment, the relative abundance of Bacillus increased by 1.28% during the seedling recovery period but further increased to 11.76% upon entering the fruiting period. The relative abundance of Streptomyces increased by 0.53% and 0.73% in the DZ and CC treatments, respectively, during the seedling recovery period. After the seedling recovery period, the relative abundance of Streptomyces in the DZ treatment increased to 1.58%, whereas that in the CC treatment decreased to 0.95%. Aspergillus can purify soil contaminated by microbial toxins [36]. Chaetomium has been reported to act as a broad-spectrum fungicide for controlling plant diseases [37]. Humicola can reduce the incidence of wilt and black spot diseases [38,39]. Talaromyces can inhibit various pathogenic microorganisms [40,41]. Trichoderma is widely used as a plant growth promoter and biocontrol agent in crop production [42]. Bacillus can secrete antimicrobial peptides to suppress soil-borne pathogens, such as those causing wilt and bacterial wilt [43]. Streptomyces can secrete multiple antibiotics and has significant effects on the prevention and control of tomato bacterial wilt and Fusarium wilt [44].
Through genus-level cluster analysis, this study revealed that the bacterial communities treated with MS and CC gradually approached prefumigation levels after they entered the fruiting stage. The fungal communities in the fumigation treatments significantly differed from those in the CK treatment during both the seedling recovery stage and the fruiting stage. Therefore, the three fumigation treatments (DZ, MS, and CC) effectively eliminated most of the pathogenic bacterial genera in the soil during the seedling recovery stage. However, by the fruiting stage, only the DZ treatment continued to suppress the relative abundance of harmful bacterial genera while increasing the abundance of some beneficial genera. The enrichment of these beneficial genera is important for reducing soil pathogen abundance, inhibiting population rebound, and maintaining a stable and healthy soil microecosystem. Under the experimental conditions, the DZ treatment performed optimally. However, given the broad-spectrum microbial eradication and time-limited suppression of pathogenic communities by fumigants, it is essential to supplement beneficial microorganisms promptly after soil fumigation, such as by applying microbial fertilizers.
Author Contributions
S.L. conceived and designed the research and finished writing the article; Y.L. contributed to the research data analysis; R.W. conducted the experiments; S.L., F.F. and H.J. contributed to the data collection. All the authors have read and agreed to the published version of the manuscript.
Funding
This research was funded by earmarked fund for Hebei Agriculture Research System (HARS) (HBCT2024130214 / HBCT2024140211); the science and technology innovation special project of the Hebei Academy of Agriculture and Forestry Sciences (2022KJCXZX-NXS-4); Hebei Province Agricultural Science and Technology Achievement Transformation Fund Project (2025JNZ-S05).
Institutional Review Board Statement
Not applicable.
Informed Consent Statement
Not applicable.
Data Availability Statement
The manuscript contains all data that were created or examined during the research.
Acknowledgments
We thank all the colleagues that helped with the development of different parts of this manuscript.
Conflicts of Interest
The authors declare no conflicts of interest.
References
- Bhowmik, D.; Kumar, K.S.; Paswan, S.; Srivastava, S. Tomato-A Natural Medicine and Its Health Benefits. Journal of Pharmacogn and Phytochem. 2012, 1, 33–43. [Google Scholar]
- Collins, E.J.; Bowyer, C.; Tsouza, A.; Chopra, M. Tomatoes: An Extensive Review of the Associated Health Impacts of Tomatoes and Factors That Can Affect Their Cultivation. Biology 2022, 11, 239. [Google Scholar] [CrossRef] [PubMed]
- Ally, N.M.; Neetoo, H.; Ranghoo-Sanmukhiya, V.M.; Coutinho, T.A. Greenhouse-grown tomatoes: microbial diseases and their control methods: a review. International Journal of Phytopathology 2023, 12, 99–127. [Google Scholar] [CrossRef]
- Su, L.; Li, H.; Wang, J.; Gao, W.; Shu, X.; Sun, X.; Wang, K.; Duan, Y.; Liu, Y.; Kuramae, E.; Zhang, R.; Shen, B. Composition, function and succession of bacterial communities in the tomato rhizosphere during continuous cropping. Biol Fertil Soils 2023, 59, 723–732. [Google Scholar] [CrossRef]
- Liu, T.; Cheng, Z.; Meng, H.; Ahmad, I.; Zhao, H. Growth, yield and quality of spring tomato and physicochemical properties of medium in a tomato/garlic intercropping system under plastic tunnel organic medium cultivation. Scientia Horticulturae 2014, 170, 159–168. [Google Scholar] [CrossRef]
- Fu, H.; Zhang, G.; Zhang, F.; Sun, Z.; Geng, G.; Li, T. Effects of Continuous Tomato Monoculture on Soil Microbial Properties and Enzyme Activities in a Solar Greenhouse. Sustainability 2017, 9, 317. [Google Scholar] [CrossRef]
- Berendsen, R.L.; Pieterse, C.M.; Bakker, P.A. The rhizosphere microbiome and plant health. Trends Plant Science 2012, 17, 478–486. [Google Scholar] [CrossRef]
- Olanrewaju, O.S.; Ayangbenro, A.S.; Glick, B.R.; Babalola, O.O. Plant health: Feedback effect of root exudates-rhizobiome interactions. Appl Microbiol Biotechnol. 2019, 103, 1155–1166. [Google Scholar] [CrossRef]
- Chaparro, J.M.; Sheflin, A.M.; Manter, D.K.; Vivanco, J.M. Manipulating the soil microbiome to increase soil health and plant fertility. Biology and Fertility of Soils 2012, 48, 489–499. [Google Scholar] [CrossRef]
- Pieterse, C.M.; Zamioudis, C.; Berendsen, R.L.; Weller, D.M.; Van Wees, S.C.; Bakker, P.A. Induced systemic resistance by beneficial microbes. Annu Rev Phytopathol. 2014, 52, 347–375. [Google Scholar] [CrossRef] [PubMed]
- Panth, M.; Hassler, S.C.; Baysal-Gurel, F. Methods for Management of Soilborne Diseases in Crop Production. Agriculture 2020, 10, 16. [Google Scholar] [CrossRef]
- Mao, L.; Liu, X.; Sial, M.U.; Zhang, L.; Zhu, L.; Wu, C.; Cao, A. Soil application of dazomet combined with 1, 3-dichloropropene against soilborne pests for tomato production. Scientific Reports 2024, 14, 31439. [Google Scholar] [CrossRef]
- Wang, L.; Hu, T.; Ji, L.; Cao, K. Inhibitory efficacy of calcium cyanamide on the pathogens of replant diseases in strawberry. Frontiers of Agriculture in China 2007, 1, 183–187. [Google Scholar] [CrossRef]
- Triky-Dotan, S.; Austerweil, M.; Steiner, B.; Peretz-Alon, Y.; Katan, J.; Gamliel, A. Generation and dissipation of methyl isothiocyanate in soils following metam sodium fumigation: impact on Verticillium control and potato yield. Plant disease 2007, 91, 497–503. [Google Scholar] [CrossRef]
- Nicola, L.; Turco, E.; Albanese, D.; Donati, C.; Thalheimer, M.; Pindo, M.; Insam, H.; Cavalieri, D.; Pertot, I. Fumigation with dazomet modifies soil microbiota in apple orchards affected by replant disease. Applied Soil Ecology 2017, 113, 71–79. [Google Scholar] [CrossRef]
- Wang, Y.; Jin, Y.; Han, P.; Hao, J.; Pan, H.; Liu, J. Impact of soil disinfestation on fungal and bacterial communities in soil with cucumber cultivation. Frontiers in microbiology 2021, 12, 685111. [Google Scholar] [CrossRef] [PubMed]
- Chen, R.; Jiang, W.; Xu, S.; Fan, H.; Chen, X.; Shen, X.; Yin, C.; Mao, Z. An emerging chemical fumigant: two-sided effects of dazomet on soil microbial environment and plant response. Environmental Science and Pollution Research 2022, 29, 3022–3036. [Google Scholar] [CrossRef]
- Wu, R.; Li, Y.; Meng, J.; Han, J. Effects of Dazomet Fumigation Combined with Trichoderma harzianum on Soil Microbial Community Structure of Continuously Cropped Strawberry. Horticulturae 2025, 11, 35. [Google Scholar] [CrossRef]
- Liu, L.; Sun, C.; Liu, X.; He, X.; Liu, M.; Wu, H.; Tang, C.; Jin, C.; Zhang, Y. Effect of calcium cyanamide, ammonium bicarbonate and lime mixture, and ammonia water on survival of Ralstonia solanacearum and microbial community. Scientific reports 2016, 6, 19037. [Google Scholar] [CrossRef] [PubMed]
- De Ceuster, H.; Pauwels, F. Soil Disinfestations in the Belgian Horticulture- A Practice View. Acta Hortic. 1995, 382, 37–50. [Google Scholar] [CrossRef]
- Pervaiz, Z.H.; Iqbal, J.; Zhang, Q.; Chen, D.; Wei, H.; Saleem, M. Continuous Cropping Alters Multiple Biotic and Abiotic Indicators of Soil Health. Soil Systems 2020, 4, 59. [Google Scholar] [CrossRef]
- Dong, L.; Xu, J.; Zhang, L.; Yang, J.; Liao, B.; Li, X.; Chen, S. High-throughput sequencing technology reveals that continuous cropping of American ginseng results in changes in the microbial community in arable soil. Chinese medicine 2017, 12, 18. [Google Scholar] [CrossRef]
- Meszka, B.; Malusà, E. Effects of soil disinfection on health status, growth and yield of strawberry stock plants. Crop Protection 2014, 63, 113–119. [Google Scholar] [CrossRef]
- Chen, L.; Xie, X.; Kang, H.; Liu, R.; Shi, Y.; Li, L.; Xie, J.; Li, B.; Chai, A. Efficiency of calcium cyanamide on the control of tomato soil-borne disease and their impacts on the soil microbial community. Applied Soil Ecology 2022, 176, 104522. [Google Scholar] [CrossRef]
- Larki, R.; Mehrabi-Koushki, M.; Farokhinejad, R. Identification of Chaetomium and Amesia species associated with different diseases of some herbaceous ornamentals in Ahvaz. Journal of Microbial Biology 2019, 8, 33–50. [Google Scholar]
- Ma, L.J.; Geiser, D.M.; Proctor, R.H.; Rooney, A.P.; O’Donnell, K.; Trail, F.; Gardiner, D.M.; Manners, J.M.; Kazan, K. Fusarium pathogenomics. Annual review of microbiology 2013, 67, 399–416. [Google Scholar] [CrossRef] [PubMed]
- Zhao, J.; Mei, Z.; Zhang, X.; Xue, C.; Zhang, C.; Ma, T.; Zhang, S. Suppression of Fusarium wilt of cucumber by ammonia gas fumigation via reduction of Fusarium population in the field. Scientific Reports 2017, 7, 43103. [Google Scholar] [CrossRef]
- Zhu, J.; Ren, Z.; Huang, B.; Cao, A.; Wang, Q.; Yan, D.; Ouyang, C.; Wu, J.; Li, Y. Effects of Fumigation with Allyl Isothiocyanate on Soil Microbial Diversity and Community Structure of Tomato. Journal of agricultural and food chemistry 2020, 68, 1226–1236. [Google Scholar] [CrossRef] [PubMed]
- Sutton, J.C. Epidemiology of wheat head blight and maize ear rot caused by Fusarium graminearum. Canadian Journal of Plant Pathology 1982, 4, 195–209. [Google Scholar] [CrossRef]
- Uwaremwe, C.; Bao, W.; Daoura, B.G.; Mishra, S.; Zhang, X.; Shen, L.; Xia, S.; Yang, X. Shift in the rhizosphere soil fungal community associated with root rot infection of Plukenetia volubilis Linneo caused by Fusarium and Rhizopus species. International microbiology: the official journal of the Spanish Society for Microbiology 2024, 27, 1231–1247. [Google Scholar] [CrossRef]
- Xiang, D.; Wu, Y.; Li, H.; Liu, Q.; Zhou, Z.; Chen, Q.; Zhang, N.; Xu, L. Soil Fungal Diversity and Community Composition in Response to Continuous Sweet Potato Cropping Practices. Phyton-International Journal of Experimental Botany 2021, 90, 1247–1258. [Google Scholar] [CrossRef]
- Dangi, S.R.; Gerik, J.S.; Tirado-Corbalá, R.; Ajwa, H. Soil microbial community structure and target organisms under different fumigation treatments. Applied and Environmental Soil Science 2015, 1, 673264. [Google Scholar] [CrossRef]
- Jia, H.; Khashi-ur-Rahman, M.; Wu, F.; Zhou, X. Effects of rotation of Indian mustard on cucumber seedling rhizosphere fungal community composition. International Journal of Agriculture and Biology 2020, 23, 757–762. [Google Scholar] [CrossRef]
- Nielsen, J.C.; Grijseels, S.; Prigent, S.; Ji, B.; Dainat, J.; Nielsen, K.F.; Frisvad, J.C.; Workman, M.; Nielsen, J. Global analysis of biosynthetic gene clusters reveals vast potential of secondary metabolite production in Penicillium species. Nature microbiology 2017, 2, 17044. [Google Scholar] [CrossRef]
- Wakelin, S.A.; Gupta, V.V.; Harvey, P.R.; Ryder, M.H. The effect of Penicillium fungi on plant growth and phosphorus mobilization in neutral to alkaline soils from southern Australia. Canadian Journal of Microbiology 2007, 53, 106–115. [Google Scholar] [CrossRef]
- Nayak, S.; Samanta, S.; Mukherjee, A.K. Beneficial role of Aspergillus sp. in agricultural soil and environment. In Frontiers in soil and environmental microbiology; 2020; pp. 17–36. [Google Scholar]
- Soytong, K.; Kanokmedhakul, S.; Kukongviriyapa, V.; Isobe, M. Application of Chaetomium species (Ketomium) as a new broad spectrum biological fungicide for plant disease control. Fungal Divers. 2001, 7, 1–15. [Google Scholar]
- Ko, W.H.; Yang, C.H.; Lin, M.J.; Chen, C.Y.; Tsou, Y.J. Humicola phialophoroides sp. nov. from soil with potential for biological control of plant diseases. Botanical Studies 2011, 52, 197–202. [Google Scholar]
- Yang, C.H.; Lin, M.J.; Su, H.J.; Ko, W.H. Multiple resistance-activating substances produced by Humicola phialophoroides isolated from soil for control of Phytophthora blight of pepper. Botanical studies 2014, 55, 40. [Google Scholar] [CrossRef]
- Yilmaz, N.; Visagie, C.M.; Houbraken, J.; Frisvad, J.C.; Samson, R.A. Polyphasic taxonomy of the genus Talaromyces. Studies in Mycolog 2014, 78, 175–341. [Google Scholar] [CrossRef]
- Visagie, C.M.; Jacobs, K. Three new additions to the genus Talaromyces isolated from Atlantis sandveld fynbos soils. Persoonia-Molecular Phylogeny and Evolution of Fungi 2012, 28, 14–24. [Google Scholar] [CrossRef]
- Oskiera, M.; Szczech, M.; Stępowska, A.; Smolińska, U.; Bartoszewski, G. Monitoring of Trichoderma species in agricultural soil in response to application of biopreparations. Biological Control. 2017, 113, 65–72. [Google Scholar] [CrossRef]
- Saxena, A.K.; Kumar, M.; Chakdar, H.; Anuroopa, N.; Bagyaraj, D.J. Bacillus species in soil as a natural resource for plant health and nutrition. Journal of applied microbiology 2020, 128(6), 1583–1594. [Google Scholar] [CrossRef] [PubMed]
- Jahan, T.; Rabbee, M.F.; Islam, M.M.; Habib, M.A.; Rana, M.S.; Basak, A.; Zaki, R.M.; Hasan, M.M.; Baek, K.H. Biocontrol and beyond: the versatile roles of Streptomyces in agriculture. Reviews in Environmental Science and Bio/Technology 2025, 24, 861–884. [Google Scholar] [CrossRef]
Figure 1.
Dilution curves of bacteria (a) and fungi (b) in soils under different fumigation treatments. Note: DZ1: Soil during the seedling recovery period after dazomet fumigation; DZ2: Soil during the fruiting period after dazomet fumigation; MS1: Soil during the seedling recovery period after metham sodium fumigation; MS2: Soil during the fruiting period after metham sodium fumigation; CC1: Soil during the seedling recovery period after calcium cyanamide fumigation; CC2: Soil during the fruiting period after calcium cyanamide fumigation. The following charts and figures use the same representations.
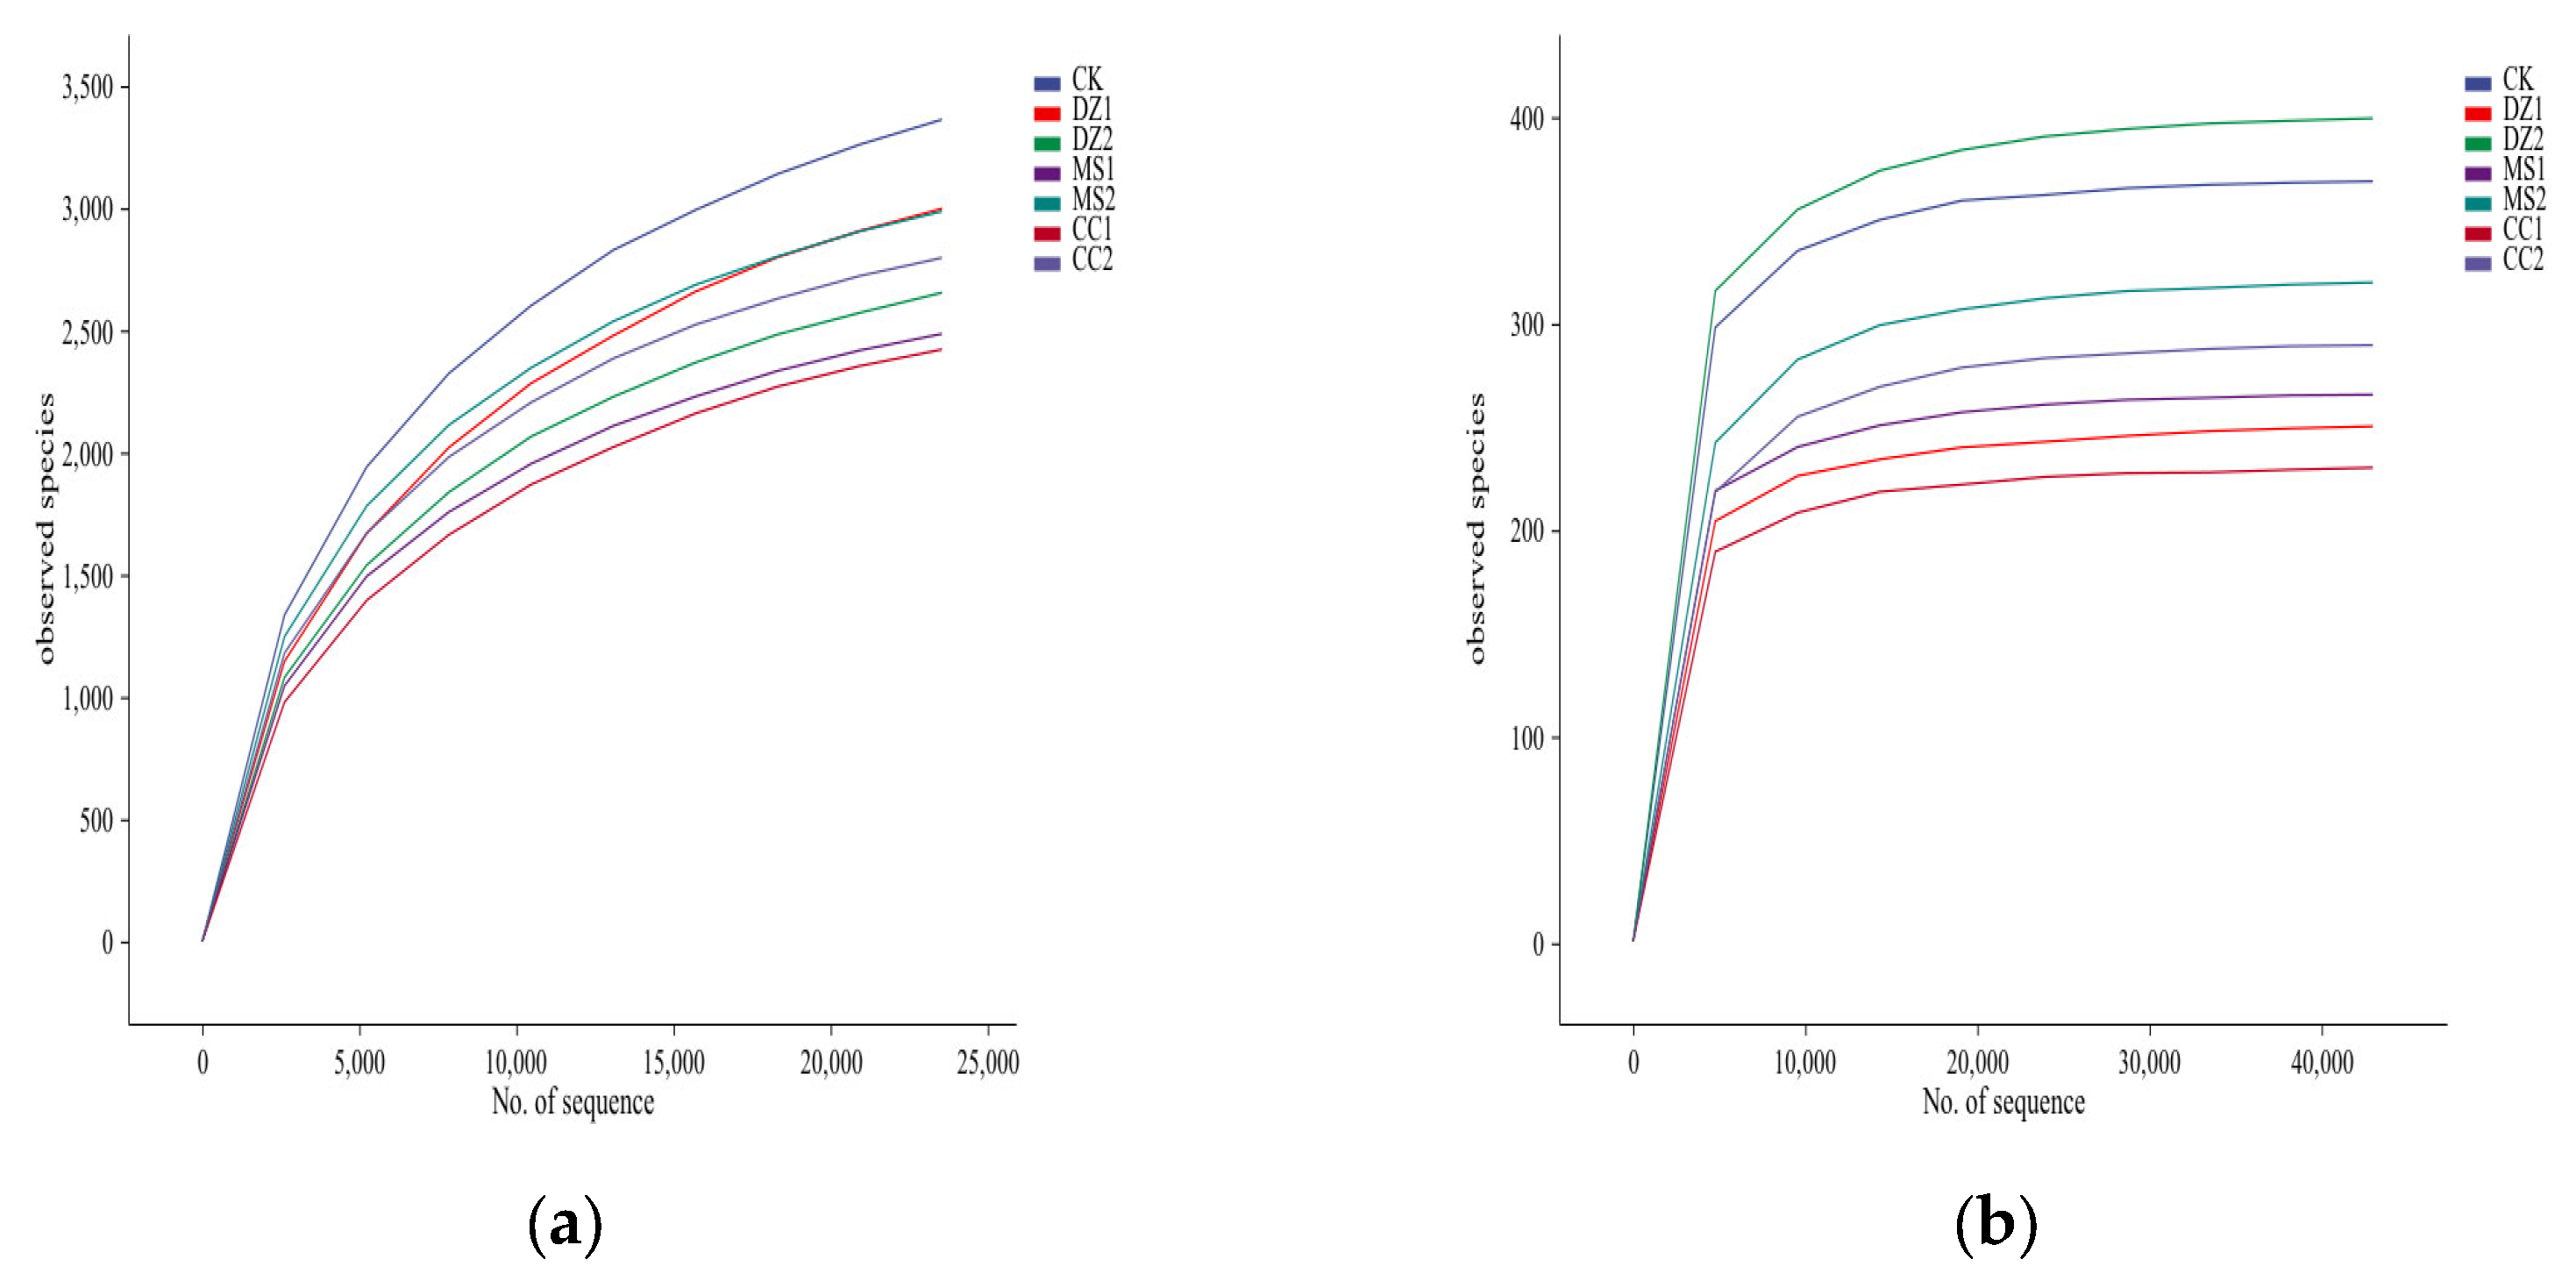
Figure 2.
Effects of different fumigation treatments on the distribution of soil bacteria (a) and fungal (b) ASVs.
Figure 2.
Effects of different fumigation treatments on the distribution of soil bacteria (a) and fungal (b) ASVs.
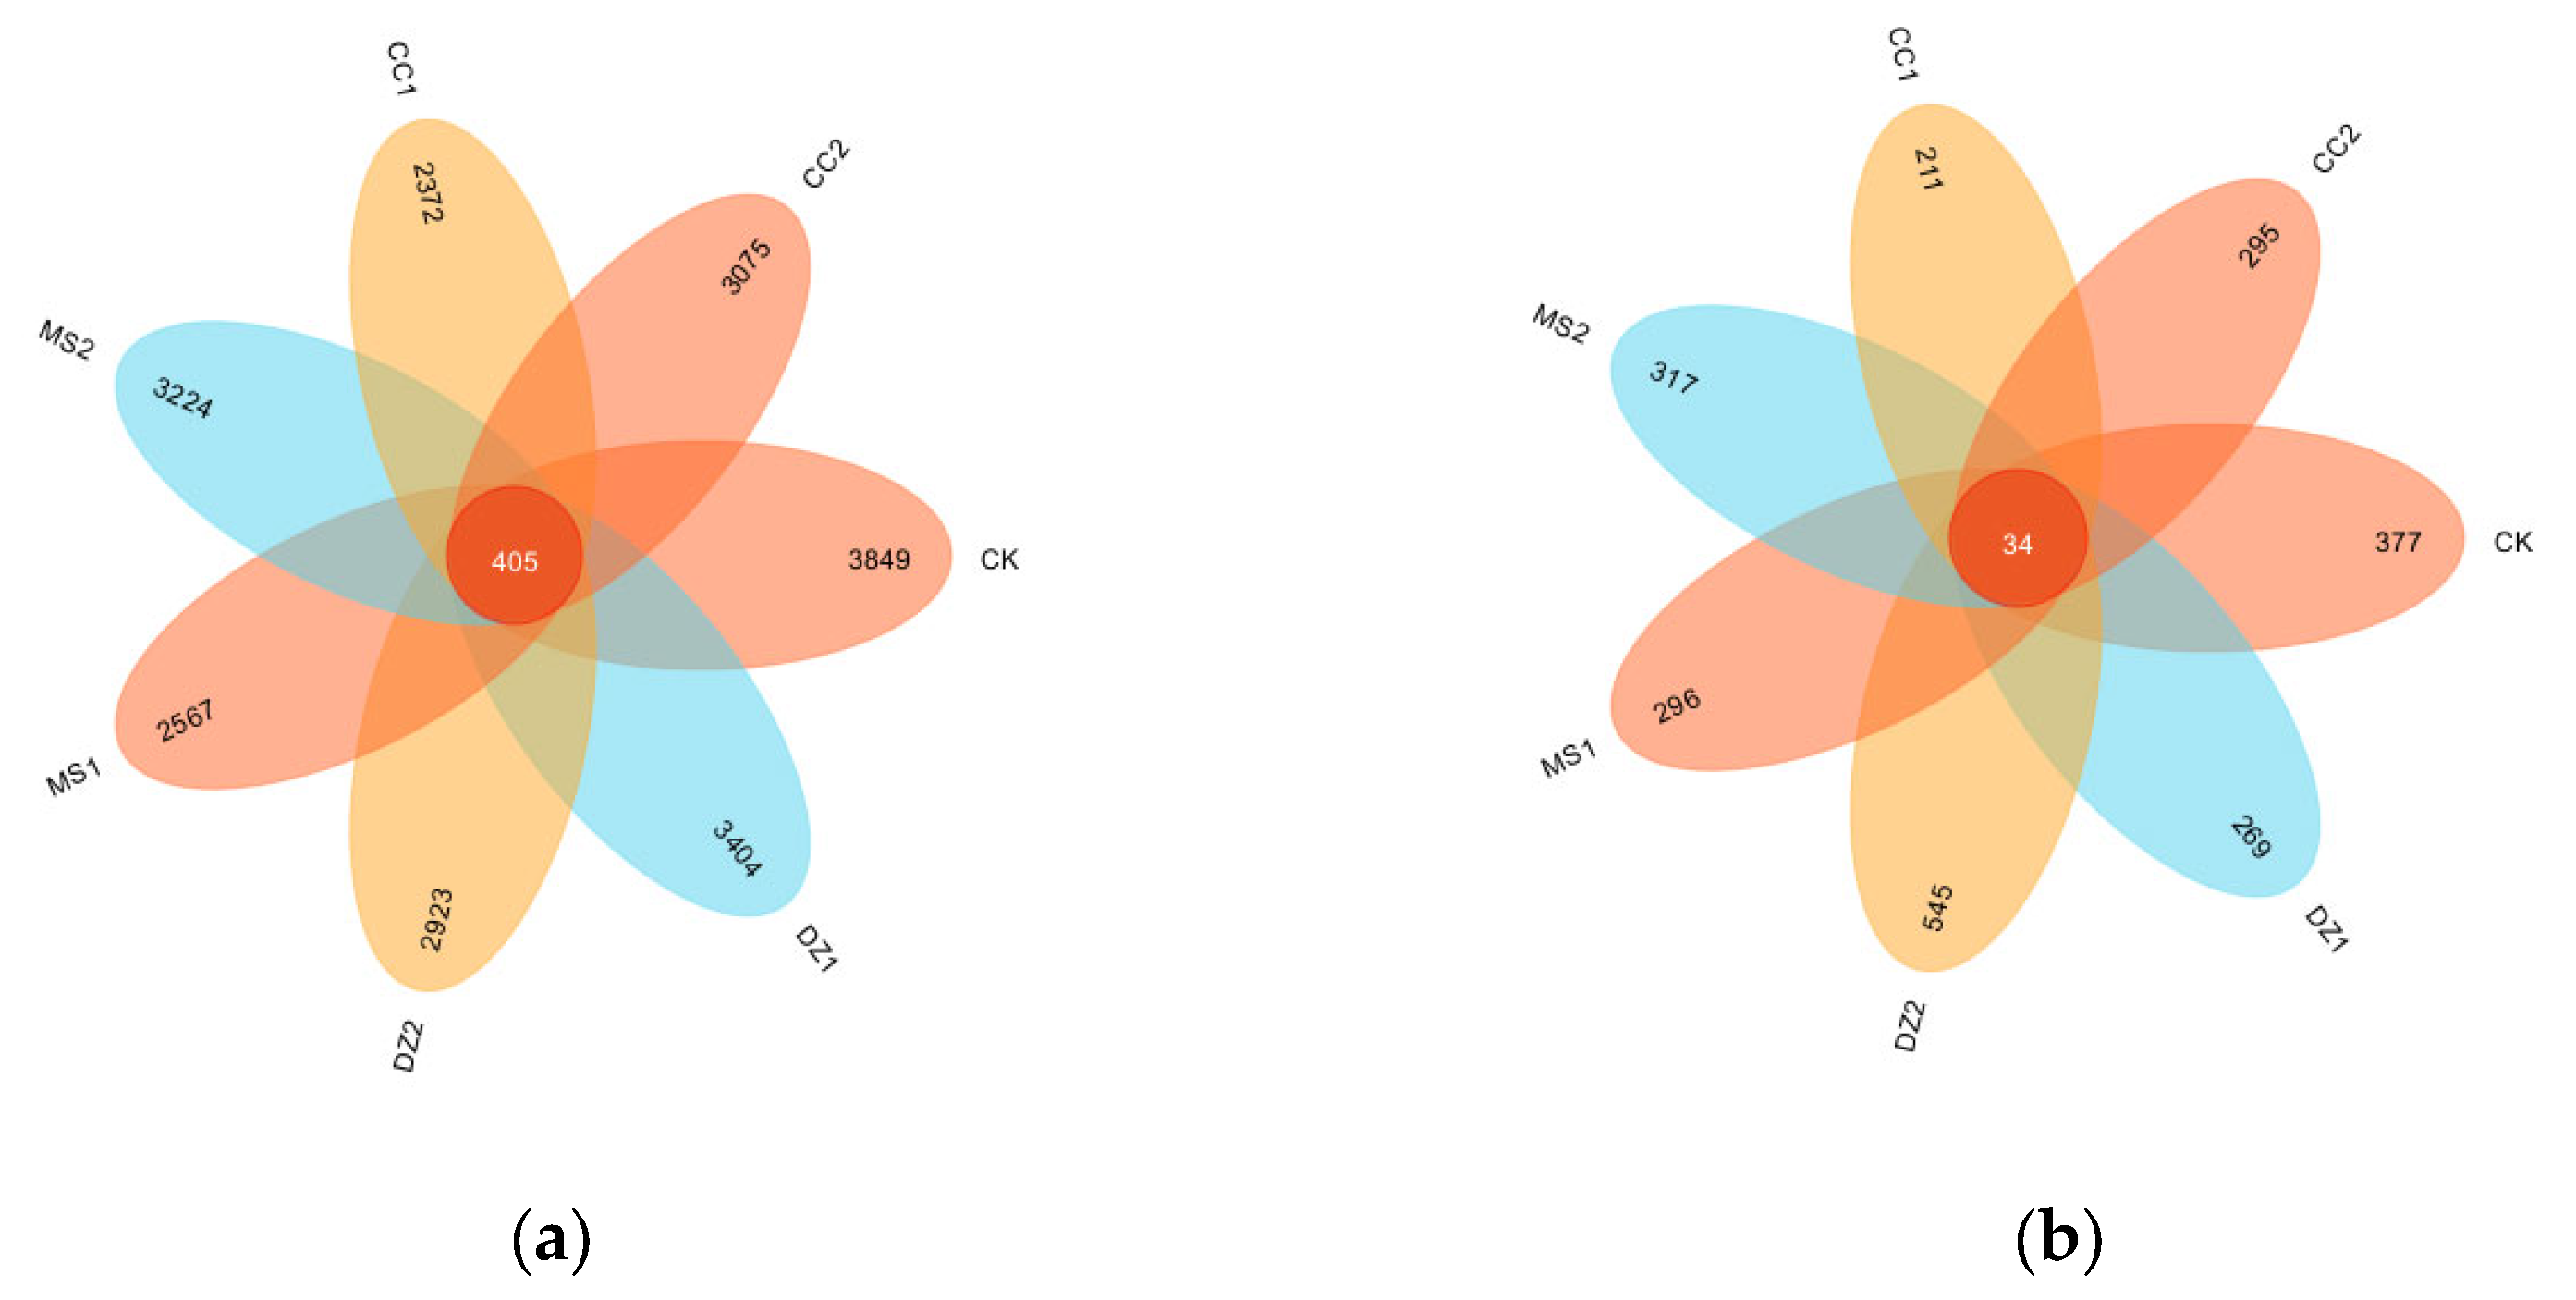
Figure 3.
Community structure of soil bacteria (a) and fungi (b) at the phylum level under different treatments.
Figure 3.
Community structure of soil bacteria (a) and fungi (b) at the phylum level under different treatments.
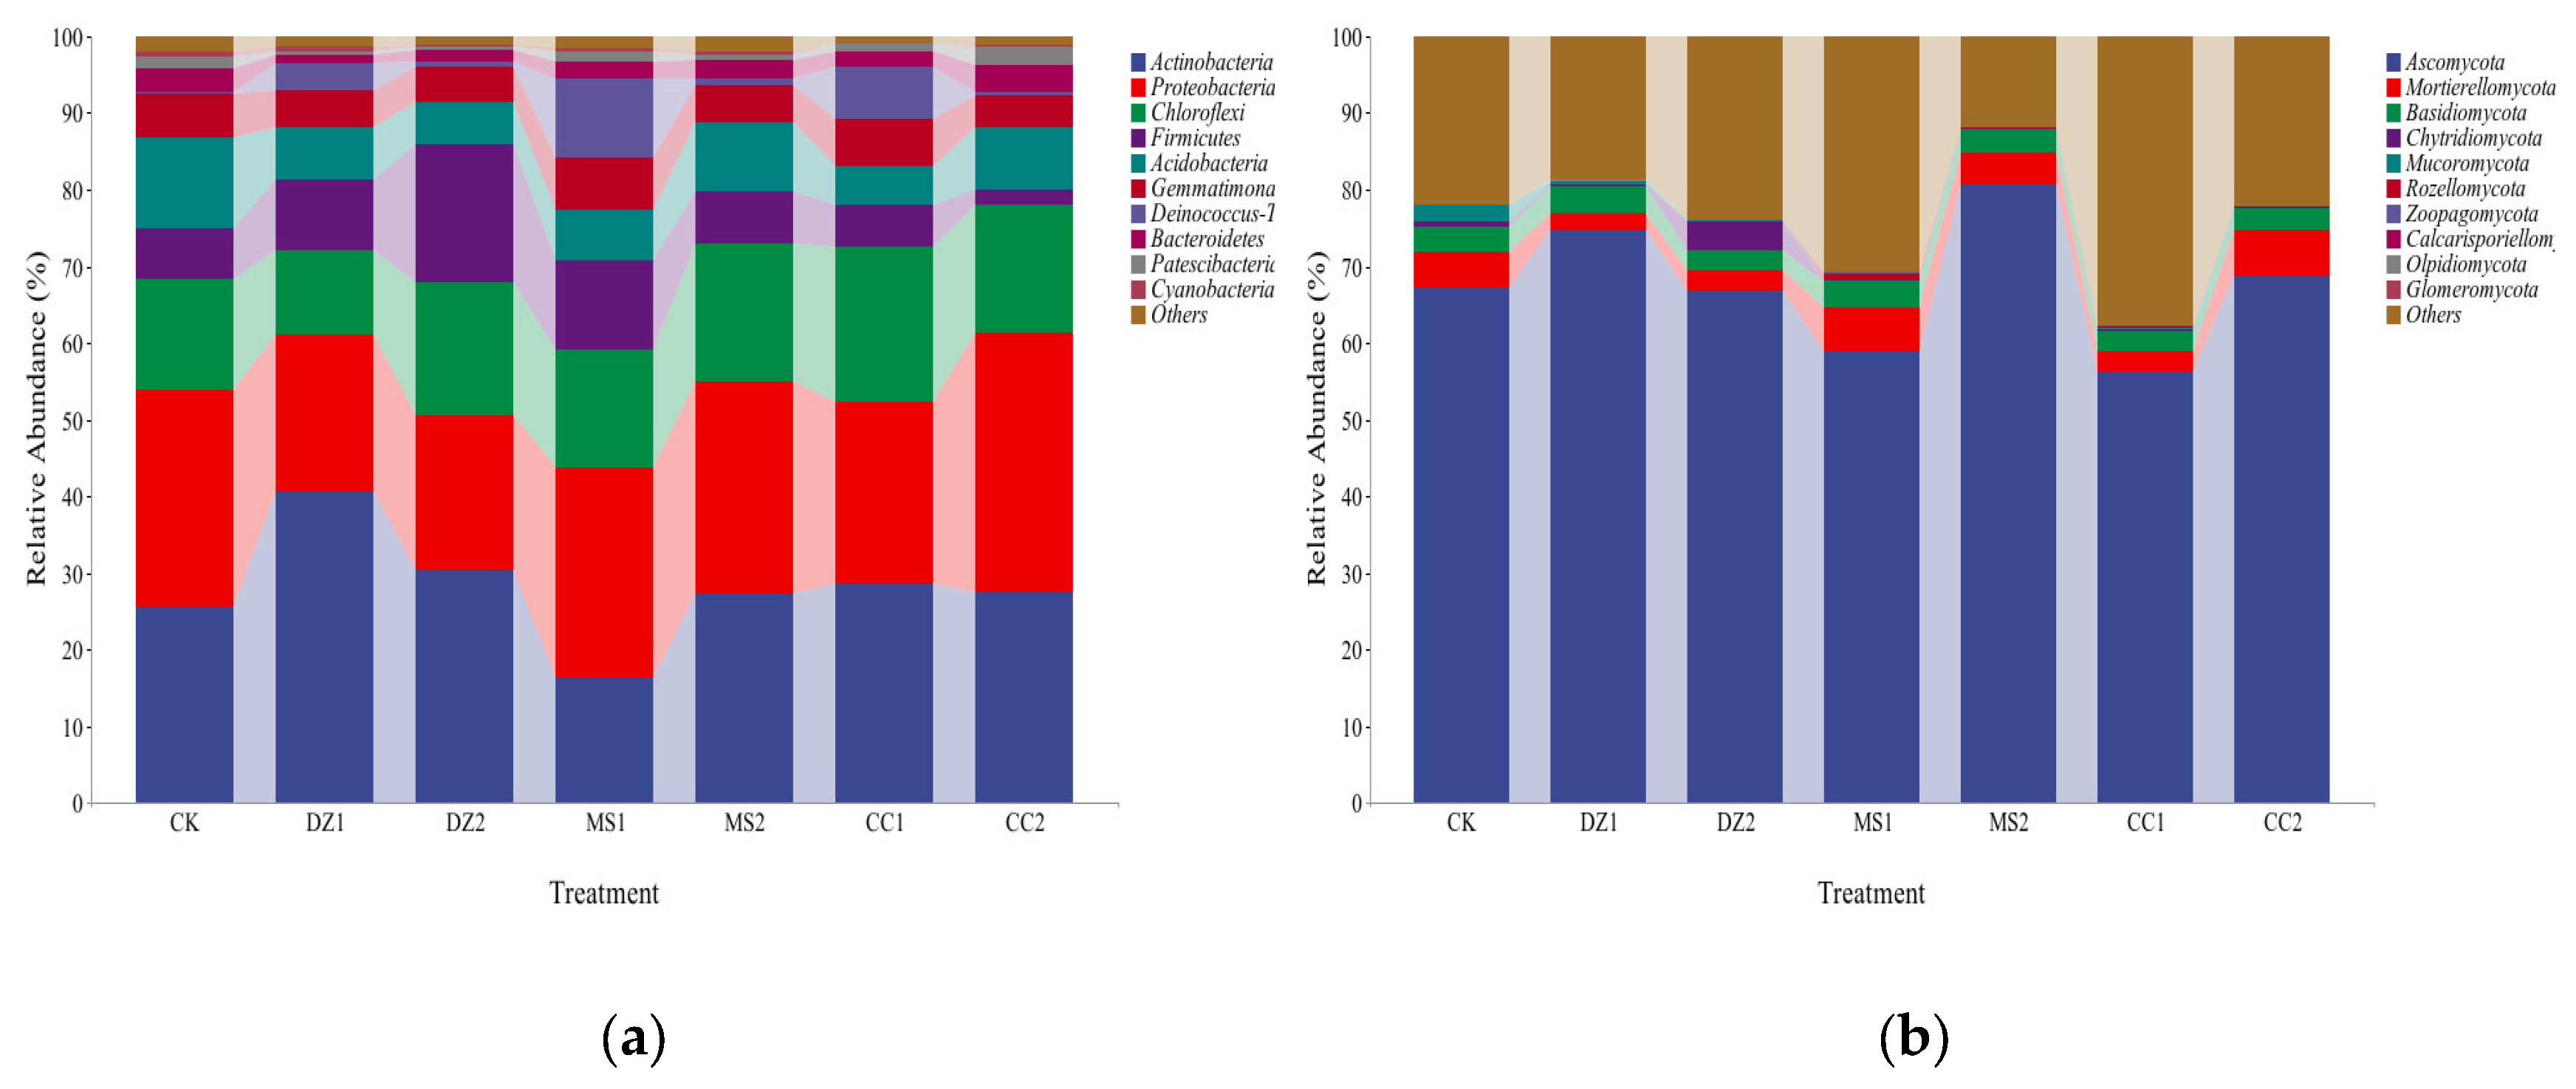
Figure 4.
Cluster analysis of soil bacteria (a) and fungi (b) at the genus level under different treatments.
Figure 4.
Cluster analysis of soil bacteria (a) and fungi (b) at the genus level under different treatments.
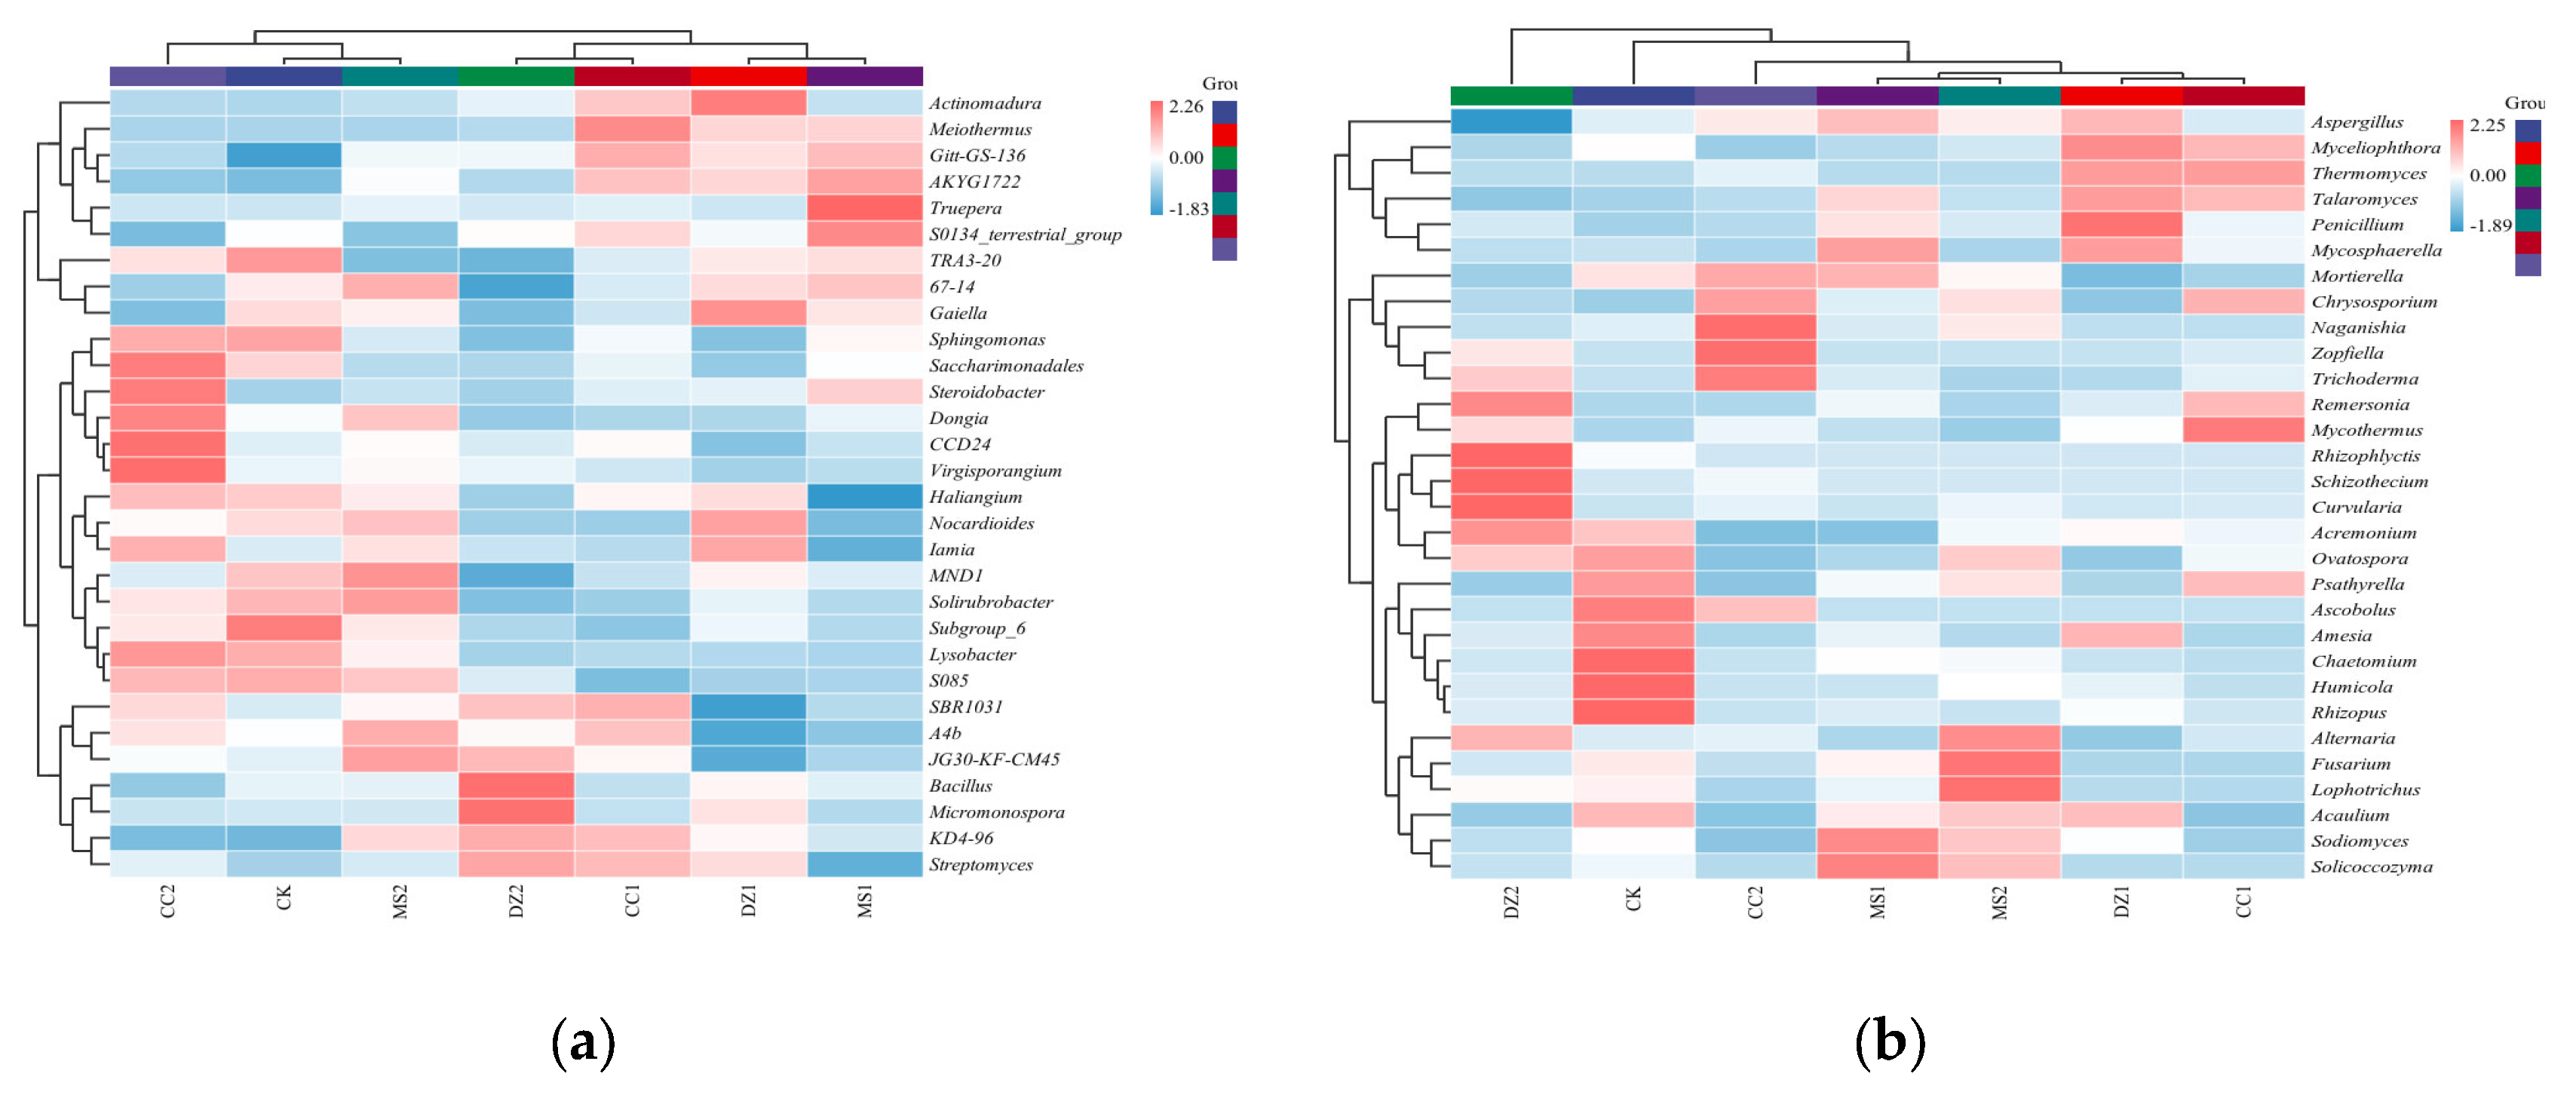
Figure 5.
Special communities and influence of bacteria (a) and fungi (b) in soil after treatment with different soil fumigants. Nodes of different colors represent microbial taxa that are significantly enriched in the corresponding groups and have a significant effect on intergroup differences; lowercase letters represent differential indicator species, where p represents phylum, c represents class, o represents order, f represents family, g represents genus, and s represents species.
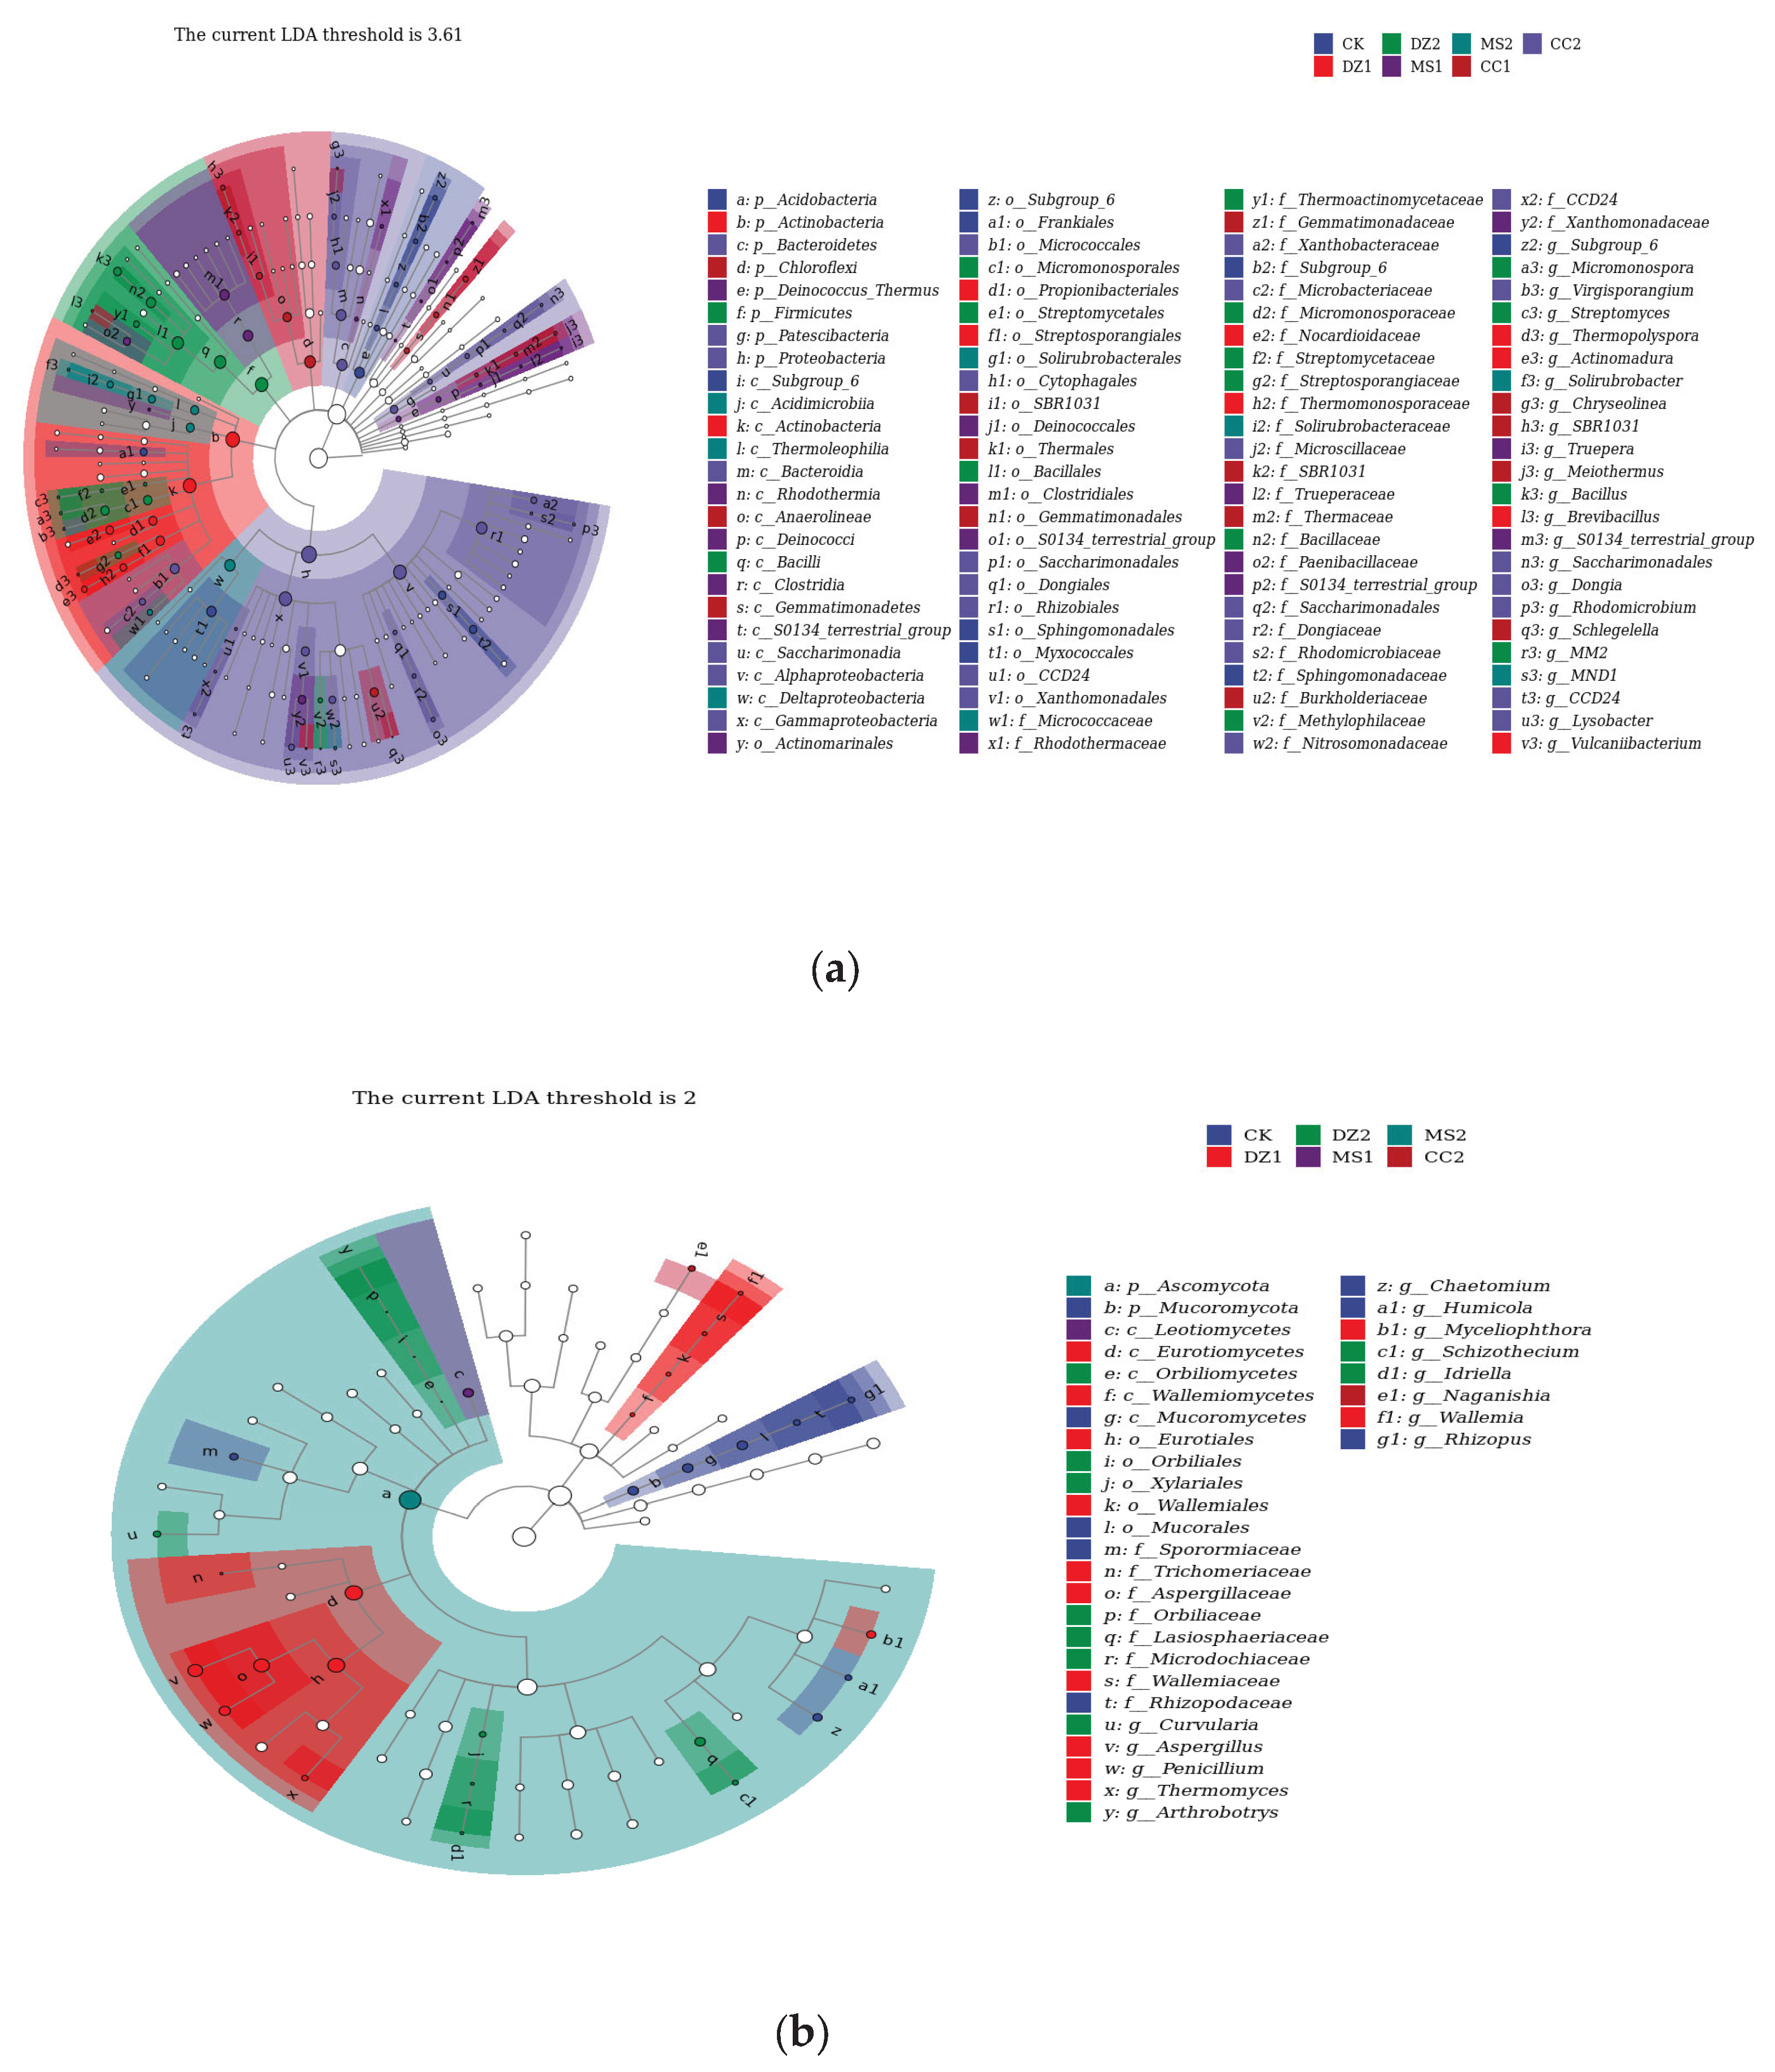

Table 1.
This is a table.
| Kingdom | treatment | Community abundance index | Community diversity index | ||
|---|---|---|---|---|---|
| Chao1 index | Observed species | Shannon | Simpson | ||
| Bacteria | CK | 3882.77±211.97a | 3366.47±88.34a | 10.73±0.05a | 0.9989±0.0001a |
| DZ1 | 3466.94±134.27b | 3001.10±162.29b | 10.00 ±0.15c | 0.9961±0.0008bc | |
| DZ2 | 3019.60±98.12cd | 2653.87±51.71cd | 9.88±0.12cd | 0.9964±0.0007b | |
| MS1 | 2892.61±259.11d | 2488.50±168.63d | 9.73±0.24de | 0.9949±0.0017c | |
| MS2 | 3354.01±134.27bc | 2988.30±65.43b | 10.49±0.04ab | 0.9986±0.0001a | |
| CC1 | 2845.14±275.04d | 2426.53±226.33d | 9.50 ±0.16e | 0.9950±0.0007bc | |
| CC2 | 3105.69±215.78cd | 2801.47±132.86bc | 10.29±0.07b | 0.9982±0.0001a | |
| Fungi | CK | 369.17±16.94a | 368.83±17.02a | 6.32±0.10ab | 0.9676±0.0051a |
| DZ1 | 252.78±36.41cd | 250.33±33.30cd | 5.77±0.14cd | 0.9577±0.0091ab | |
| DZ2 | 400.45 ±22.41a | 399.63±21.60a | 6.62±0.46a | 0.9745±0.0082a | |
| MS1 | 265.94 ±11.48cd | 265.63±11.47cd | 5.83±0.16bc | 0.9571±0.0079ab | |
| MS2 | 320.68±40.62b | 319.97±40.94b | 5.22±0.33e | 0.9202±0.0222c | |
| CC1 | 231.30±19.48d | 230.33±19.16d | 5.42±0.23cde | 0.9403±0.0064bc | |
| CC2 | 290.40±9.46bc | 289.73±9.48bc | 5.28±0.37de | 0.9324±0.0209c | |
Note: Significant (P < 0.05) differences are expressed with different letters.
Table 2.
Changes in the relative abundance of dominant bacterial and fungal genera in soil under different fumigation treatments.
Table 2.
Changes in the relative abundance of dominant bacterial and fungal genera in soil under different fumigation treatments.
| Kingdom | Serial Number | Genus | CK | DZ1 | DZ2 | MS1 | MS2 | CC1 | CC2 |
|---|---|---|---|---|---|---|---|---|---|
| % | |||||||||
| Bacteria | 1 | Subgroup_6 | 8.10 | 5.01 | 4.19 | 4.23 | 5.72 | 3.74 | 5.72 |
| 2 | Bacillus | 3.48 | 4.76 | 11.76 | 3.29 | 3.41 | 2.27 | 0.89 | |
| 3 | SBR1031 | 3.04 | 0.99 | 4.95 | 2.58 | 3.77 | 5.33 | 4.44 | |
| 4 | Actinomadura | 0.26 | 11.08 | 2.31 | 1.02 | 0.91 | 6.57 | 0.48 | |
| 5 | Micromonospora | 1.88 | 3.82 | 7.63 | 1.29 | 1.91 | 1.58 | 1.73 | |
| 6 | A4b | 2.01 | 0.84 | 2.12 | 1.26 | 2.95 | 2.73 | 2.35 | |
| 7 | KD4-96 | 1.53 | 1.91 | 2.22 | 1.77 | 2.03 | 2.15 | 1.55 | |
| 8 | Meiothermus | 0.00 | 3.32 | 0.28 | 3.43 | 0.00 | 6.05 | 0.01 | |
| 9 | Gitt-GS-136 | 1.40 | 1.91 | 1.77 | 2.04 | 1.78 | 2.09 | 1.65 | |
| 10 | MND1 | 1.91 | 1.70 | 1.17 | 1.54 | 2.14 | 1.48 | 1.54 | |
| 11 | AKYG1722 | 1.11 | 1.67 | 1.26 | 1.90 | 1.46 | 1.75 | 1.17 | |
| 12 | Truepera | 0.25 | 0.28 | 0.38 | 6.90 | 0.82 | 0.70 | 0.29 | |
| 13 | CCD24 | 1.11 | 0.83 | 1.09 | 1.03 | 1.23 | 1.24 | 1.95 | |
| 14 | Sphingomonas | 1.64 | 0.77 | 0.76 | 1.21 | 1.03 | 1.12 | 1.60 | |
| 15 | Streptomyces | 0.73 | 1.26 | 1.58 | 0.50 | 0.90 | 1.46 | 0.95 | |
| 16 | Saccharimonadales | 1.33 | 0.41 | 0.54 | 0.95 | 0.59 | 0.85 | 2.07 | |
| 17 | S0134_terrestrial_group | 0.95 | 0.92 | 0.97 | 1.57 | 0.59 | 1.16 | 0.54 | |
| 18 | Steroidobacter | 0.71 | 0.88 | 0.70 | 1.17 | 0.80 | 0.87 | 1.54 | |
| 19 | Haliangium | 1.07 | 1.02 | 0.75 | 0.55 | 0.98 | 0.94 | 1.11 | |
| 20 | Virgisporangium | 0.73 | 0.19 | 0.75 | 0.37 | 1.01 | 0.53 | 2.80 | |
| 21 | 67-14 | 0.96 | 1.02 | 0.54 | 1.09 | 1.16 | 0.82 | 0.71 | |
| 22 | Gaiella | 0.98 | 1.19 | 0.66 | 0.95 | 0.92 | 0.80 | 0.67 | |
| 23 | Nocardioides | 1.06 | 1.43 | 0.47 | 0.33 | 1.23 | 0.47 | 0.87 | |
| 24 | Dongia | 0.69 | 0.45 | 0.38 | 0.64 | 1.03 | 0.45 | 1.38 | |
| 25 | Solirubrobacter | 1.12 | 0.61 | 0.26 | 0.43 | 1.26 | 0.36 | 0.85 | |
| 26 | Lysobacter | 1.08 | 0.37 | 0.33 | 0.35 | 0.71 | 0.38 | 1.21 | |
| 27 | Brevibacillus | 0.06 | 1.19 | 0.87 | 1.02 | 0.02 | 0.85 | 0.00 | |
| 28 | Acidibacter | 0.46 | 0.30 | 0.63 | 0.53 | 0.52 | 0.47 | 1.07 | |
| 29 | Vulcaniibacterium | 0.00 | 1.27 | 0.03 | 0.94 | 0.0 | 1.11 | 0.00 | |
| 30 | Paenisporosarcina | 0.19 | 0.17 | 0.17 | 1.28 | 0.68 | 0.09 | 0.33 | |
| 31 | Thermopolyspora | 0.00 | 1.17 | 0.51 | 0.09 | 0.00 | 0.80 | 0.00 | |
| 32 | Rhodomicrobium | 0.26 | 0.10 | 0.19 | 0.18 | 0.41 | 0.24 | 1.07 | |
| The relative abundance > 1% of the genus number. | 16 | 17 | 12 | 19 | 16 | 16 | 18 | ||
| Dominant genus proportion / % | 32.88 | 44.71 | 42.05 | 39.63 | 33.12 | 41.84 | 35.95 | ||
| Fungi | 1 | Aspergillus | 15.67 | 26.53 | 2.89 | 25.69 | 20.14 | 15.05 | 20.55 |
| 2 | Alternaria | 3.70 | 0.59 | 10.78 | 1.69 | 13.56 | 3.38 | 4.16 | |
| 3 | Mortierella | 4.65 | 2.16 | 2.67 | 5.75 | 4.24 | 2.78 | 5.96 | |
| 4 | Zopfiella | 0.00 | 0.00 | 5.99 | 0.00 | 0.00 | 1.23 | 17.65 | |
| 5 | Myceliophthora | 3.54 | 9.16 | 0.87 | 1.16 | 1.96 | 7.01 | 0.29 | |
| 6 | Amesia | 10.75 | 7.96 | 1.72 | 2.35 | 0.30 | 0.00 | 0.00 | |
| 7 | Remersonia | 1.39 | 2.39 | 7.46 | 2.87 | 1.28 | 5.70 | 1.41 | |
| 8 | Fusarium | 3.30 | 0.21 | 1.15 | 2.91 | 8.25 | 0.24 | 0.69 | |
| 9 | Talaromyces | 0.57 | 4.93 | 0.18 | 3.33 | 1.06 | 4.10 | 0.92 | |
| 10 | Acremonium | 3.15 | 2.25 | 4.01 | 0.85 | 2.01 | 1.96 | 0.78 | |
| 11 | Sodiomyces | 1.75 | 1.68 | 0.82 | 4.26 | 2.94 | 0.38 | 0.11 | |
| 12 | Thermomyces | 0.04 | 4.52 | 0.08 | 0.00 | 0.00 | 4.48 | 0.87 | |
| 13 | Schizothecium | 0.00 | 0.00 | 8.82 | 0.00 | 0.00 | 0.00 | 0.96 | |
| 14 | Mycothermus | 0.25 | 1.15 | 1.82 | 0.49 | 0.07 | 3.50 | 0.96 | |
| 15 | Chaetomium | 3.16 | 0.17 | 0.25 | 0.76 | 0.65 | 0.05 | 0.15 | |
| 16 | Rhizophlyctis | 0.51 | 0.00 | 3.56 | 0.00 | 0.00 | 0.00 | 0.00 | |
| 17 | Penicillium | 0.05 | 1.62 | 0.29 | 0.74 | 0.30 | 0.41 | 0.14 | |
| 18 | Humicola | 2.24 | 0.00 | 0.00 | 0.00 | 0.00 | 0.00 | 0.01 | |
| 19 | Mycosphaerella | 0.2 | 1.24 | 0.1 | 1.23 | 0.03 | 0.3 | 0.03 | |
| 20 | Rhizopus | 1.92 | 0.00 | 0.00 | 0.00 | 0.00 | 0.00 | 0.00 | |
| 21 | Trichoderma | 0.12 | 0.06 | 0.70 | 0.20 | 0.02 | 0.25 | 1.20 | |
| 22 | Solicoccozyma | 0.28 | 0.00 | 0.07 | 1.30 | 0.84 | 0.00 | 0.00 | |
| 23 | Ascobolus | 1.48 | 0.00 | 0.00 | 0.00 | 0.00 | 0.00 | 0.9 | |
| 24 | Curvularia | 0.00 | 0.04 | 1.44 | 0.00 | 0.16 | 0.06 | 0.14 | |
| 25 | Naganishia | 0.12 | 0.00 | 0.00 | 0.09 | 0.36 | 0.00 | 1.11 | |
| 26 | Idriella | 0.00 | 0.00 | 1.11 | 0.00 | 0.05 | 0.00 | 0.00 | |
| The relative abundance > 1% of the genus number. | 13 | 11 | 13 | 11 | 9 | 10 | 7 | ||
| Dominant genus proportion / % | 56.71 | 65.59 | 53.43 | 52.53 | 55.44 | 49.17 | 52.04 | ||
Table 3.
Effects of different fumigation treatments on the yield of tomato.
| Treatment | Average fruit per plant (units) | Average single fruit weight (g-1) | Yield kg·667 m-2 |
|---|---|---|---|
| CK | 18.00±1.00b | 145.67±6.6b | 4962.08±119.40b |
| DZ | 20.33±1.53a | 163.8±3.72a | 6190.66±428.39a |
| MS | 20.67±0.58a | 166.57±3.45a | 6402.03±247.83a |
| CC | 21.00±1.00a | 172.2±7.65a | 6719.03±280.19a |
Note: Significant (P < 0.05) differences are expressed with different letters.
Table 4.
Effects of Different Fumigation Treatments on Tomato Soil-borne Diseases.
| Treatment | Incidence % | Disease Index | ||||
|---|---|---|---|---|---|---|
| Fusarium Wilt | Bacterial Wilt | Root Rot | Fusarium Wilt | Bacterial Wilt | Root Rot | |
| CK | 17.33±2.67a | 4.67±1.70a | 15.33±1.70a | 9.60±2.14a | 4.60±2.04a | 12.60±1.54a |
| DZ | 4.00±1.94b | 0.00±0.00b | 2.67±1.24c | 1.60±0.86b | 0.00±0.00b | 0.80±0.39c |
| MS | 12.67±2.86a | 0.00±0.00b | 8.67±1.33b | 6.00±1.67ab | 0.00±0.00b | 4.53±1.85b |
| CC | 5.33±1,70b | 0.00±0.00b | 4.67±1,33bc | 2.4±0.78b | 0.00±0.00b | 1.47±0.68c |
Note: Significant (P < 0.05) differences are expressed with different letters.
Disclaimer/Publisher’s Note: The statements, opinions and data contained in all publications are solely those of the individual author(s) and contributor(s) and not of MDPI and/or the editor(s). MDPI and/or the editor(s) disclaim responsibility for any injury to people or property resulting from any ideas, methods, instructions or products referred to in the content. |
© 2026 by the authors. Licensee MDPI, Basel, Switzerland. This article is an open access article distributed under the terms and conditions of the Creative Commons Attribution (CC BY) license.
Copyright: This open access article is published under a Creative Commons CC BY 4.0 license, which permit the free download, distribution, and reuse, provided that the author and preprint are cited in any reuse.


