
Submitted:
23 January 2026
Posted:
26 January 2026
You are already at the latest version
Abstract
For many decades the performance of ships was optimized at their design speed and con-firmed by ship trials upon delivery to the shipowner, when the hull and all systems are in perfect condition. However, during operation both the underwater hull and the propeller are appended by biofouling and become progressively rough. Roughness constitutes a major resistance component superimposed on the frictional ship resistance and deteriorates its performance leading to increased power requirements and CO2 emissions to retain a specified speed or to a speed reduction at the same power delivered by the main engine ME. Sailing at reduced speed either due to adverse sea conditions, when the excessive dynamic responses of the ship compel the operator to reduce speed, or for fuel economy is a quite common situation, occurring for a major part or even the whole period of charter contracts to reduce the cost of transportation. In this paper the effect of roughness is investigated and the overall performance of a ship at reduced speeds is assessed directly affecting its techno-economic management. Currently the speed dependence of fouling resistance is evaluated only once at the beginning of the charter contract being valid throughout the whole charter period. The study uses full-scale records and CFD calculations available in the literature to demonstrate the effect of fouling in the overall performance of ships.
Keywords:
resistance
; propulsion
; fouling
; roughness
; frictional resistance
; power
; charter contract
; emissions
1. Introduction
The performance of ship is evaluated during the delivery by a set of sea trials which currently are carried out in accordance with ISO 15016: 2015 [1]. The preparation, execution and analysis of the sea trials are described in detail in the above ISO Standard, so that the actual behavior of the new building is precisely represented by the reported outcome of the sea trials. With the time passing the performance of the vessel deteriorates mainly due to the increase of roughness on the wetted surface of the hull, while roughness on the propeller deteriorates its efficiency and consequently overall propulsive performance of the ship. Due to the fouling appending on the hull, its roughness increases progressively with the passing time between successive dry dockings of the ship. Usually ship owners by the classification societies every 4 or 5 years. In addition, they clean and polish the propeller using modern underwater technology once or twice per year. However, the smoothness of the hull plating is not any more at the high standard of the new building. Erosion and ageing of steel as well as slight local buckling of the plates between the stiffeners deteriorate the smoothness of the external hull plating and lead to increased frictional resistance.
Traditionally, frictional resistance refers to the clean hull of a new building, while roughness resistance represents the resistance component due to fouling, erosion and ageing. The hull form doesn’t affect roughness resistance (Hakim et al, 2023) [2] (Oliveira et al, 2018) [3].
Roughness resistance constitutes a major portion of the total resistance of ships in deep (Choi et al, 2024) [4} and in shallow waters (Song et al, 2023) [5] (Song et al, 2020) [6] and affects significantly the economic management of ships. The shipping companies examine alternative plans for cleaning the hull, accounting for the properties of the applied coatings to conclude with the optimum one. Furthermore, ship owners sign charter contracts with the charterers who operate the ships in waterborne transportation of goods. In these documents, there is always a clause that in case the service speed or the consumption at the promised service speed deviates from the agreed one, a penalty or an award (bonus) is due to the ship owners depending on whether the actual service speed is higher or lower than the one stated in the contract, respectively. A similar clause holds true also with respect to the consumption at the agreed service speed. Following the findings of this paper, the current common practice of the charterers to evaluate the ship speed and/or the consumption at the agreed service speed in calm water at the beginning of the hiring period and to extend their penalty or bonus over the whole hiring period (one or more years) should certainly be revised.
To be more specific, during the hiring period the ship may sail at a reduced speed for one of the following reasons:
- to reduce consumption or emissions to confront the strict IMO (International Maritime Organization) regulations for the protection of the environment (slow steaming) (IMO/MEPS 83/6, 2025) [7], or
- to operate safely and avoid excessive dynamic responses in waves violating internationally accepted criteria in rough waters (voluntary speed reduction) (Lloyds, 1989) [8], or,
- When the installed onboard resources can’t afford to cover the additional resistance at service speed due to the dynamic responses of the ship, it slows down and keeps sailing at a reduced speed (involuntary speed loss) [8].
Slow steaming in calm water is a common practice in the last two decades of ever-increasing cost of fuel in conjunction with the IMO restrictions on the Green House Gases (GHG) emissions, currently imposed on shipping. Currently it constitutes the most realistic measure to reduce emissions and a strong competitor to alternative emission reduction methods, such as ESD (Energy Saving Devices), WAP (Wind Assisted Propulsion) and Blue/Green fuels.
Slow down in adverse sea and weather conditions mainly due to the limited available power onboard, or to avoid excessive dynamic ship motions is quite often situation for ocean going ships sailing for long periods (many days or weeks) in various adverse sea environments, covering a considerable percentage of the hiring period.
This manuscript reviews the available literature on the effect of roughness on the performance of ships and provides evidence on the way it correlated with the speed of the vessel. In this way, the overall performance of a basis and the power consumption at reduced speed will be assessed based on the respective data at the service speed. This will form a more reasonable basis for specifying the clauses in the charter contracts, as well as lead shipping companies to a realistic revision of their dry-docking policy.
2. State-of-the-Art Review
Already in the 19th century Froude (1888) [9] realized the importance of friction as a major component of the resistance of ships. By mid-20th century hydrodynamicists focused more on the mechanics of friction and the boundary layer intervening between the solid body surface and the free advancing fluid. Both the friction and the shape of the boundary layer are correlated with the viscosity of the fluid, and the non-dimensional Reynolds number Re. Hoerner (1965) [10] presents in detail the layout of the fluid-solid interface in the case of laminar (low Re) and turbulent (high Re) flows. However, in the case of merchant ships turbulent flow prevails (Re > 106) and the flow velocity at distance y from the solid surface is proportional to (y/δ)1/n, where δ is the thickness of the boundary layer and exponent n increases with Re. For 106 < Re < 107, n=7 approximately, and the frictional resistance coefficient CF is estimated by the ITTC 1957 formula:
where:
RF : frictional resistance
ρ : density of fluid
WS : wetted surface
V : ship speed
Roughness of a ship’s hull, mainly caused by hull fouling (Townsin, 2003) [11] and corrosion (Tezdogan and Demirel, 2014) [12], can significantly increase ship resistance and hence its fuel consumption and greenhouse gas emissions, as well as the cost associated with drydocking (Schultz et al., 2011) [13]. Accordingly, there have been numerous investigations into the roughness effect on ship resistance from the earliest times to the present. A milestone was the work of Schultz et al. (2007) [14], succeeded by the papers of Oliveira et al. (2018) [3], Demirel et al. (2019) [15] and Chung et al. (2021) [16] to mention some of them. Recently Choi et al. (2024) [2] used CFD calculations on to demonstrate that the roughness resistance coefficient defined in the way as the frictional resistance coefficient CF on equation (1) is a percentage of that, independently of the ship speed. They found that it can range from 10% up to 85% of CF depending on the extent of fouling for DTMB 5415 surface combatant. Analogous results were found by Song et al (2023) [5] using CFD calculations for KCS containership in shallow water. Hakim et (2023) [2] and Oliveira et al (2018) [3] concluded that the hull form does not affect roughness resistance coefficient. Mohsen and Abozar (2012) [17] used the scaled model of a Panamax bulk carrier to demonstrate that CFD is in close agreement with the experimental results at model scale. tested. These references provide the major contributions regarding the consequences of fouling on the resistance and powering of ships.
The starting point of the literature on the effect of roughness on ship resistance is the principle of similarity between plates and actual ships proposed by Granville (1958) [18], which postulates that the horizontal distance of the two curves depicting the frictional resistance coefficient CF as functions of the Reynolds Number Re, is (Figure 1):
In (Figure 1) and in relation (2):
Lplate = the plate length
Ls = the ship length
ΔU+ is related to the increase in the frictional resistance coefficient at ship scale. It is determined from the laboratory hydrodynamic tests.
κ = 0.41, the von Karman constant
ΔCF = CFrough-CFsmooth is the respective vertical distance at a specific Re and speed V between a rough and a smooth surface.
Figure 1.
Granville’s similarity law for the effect of roughness at model and ship scale.
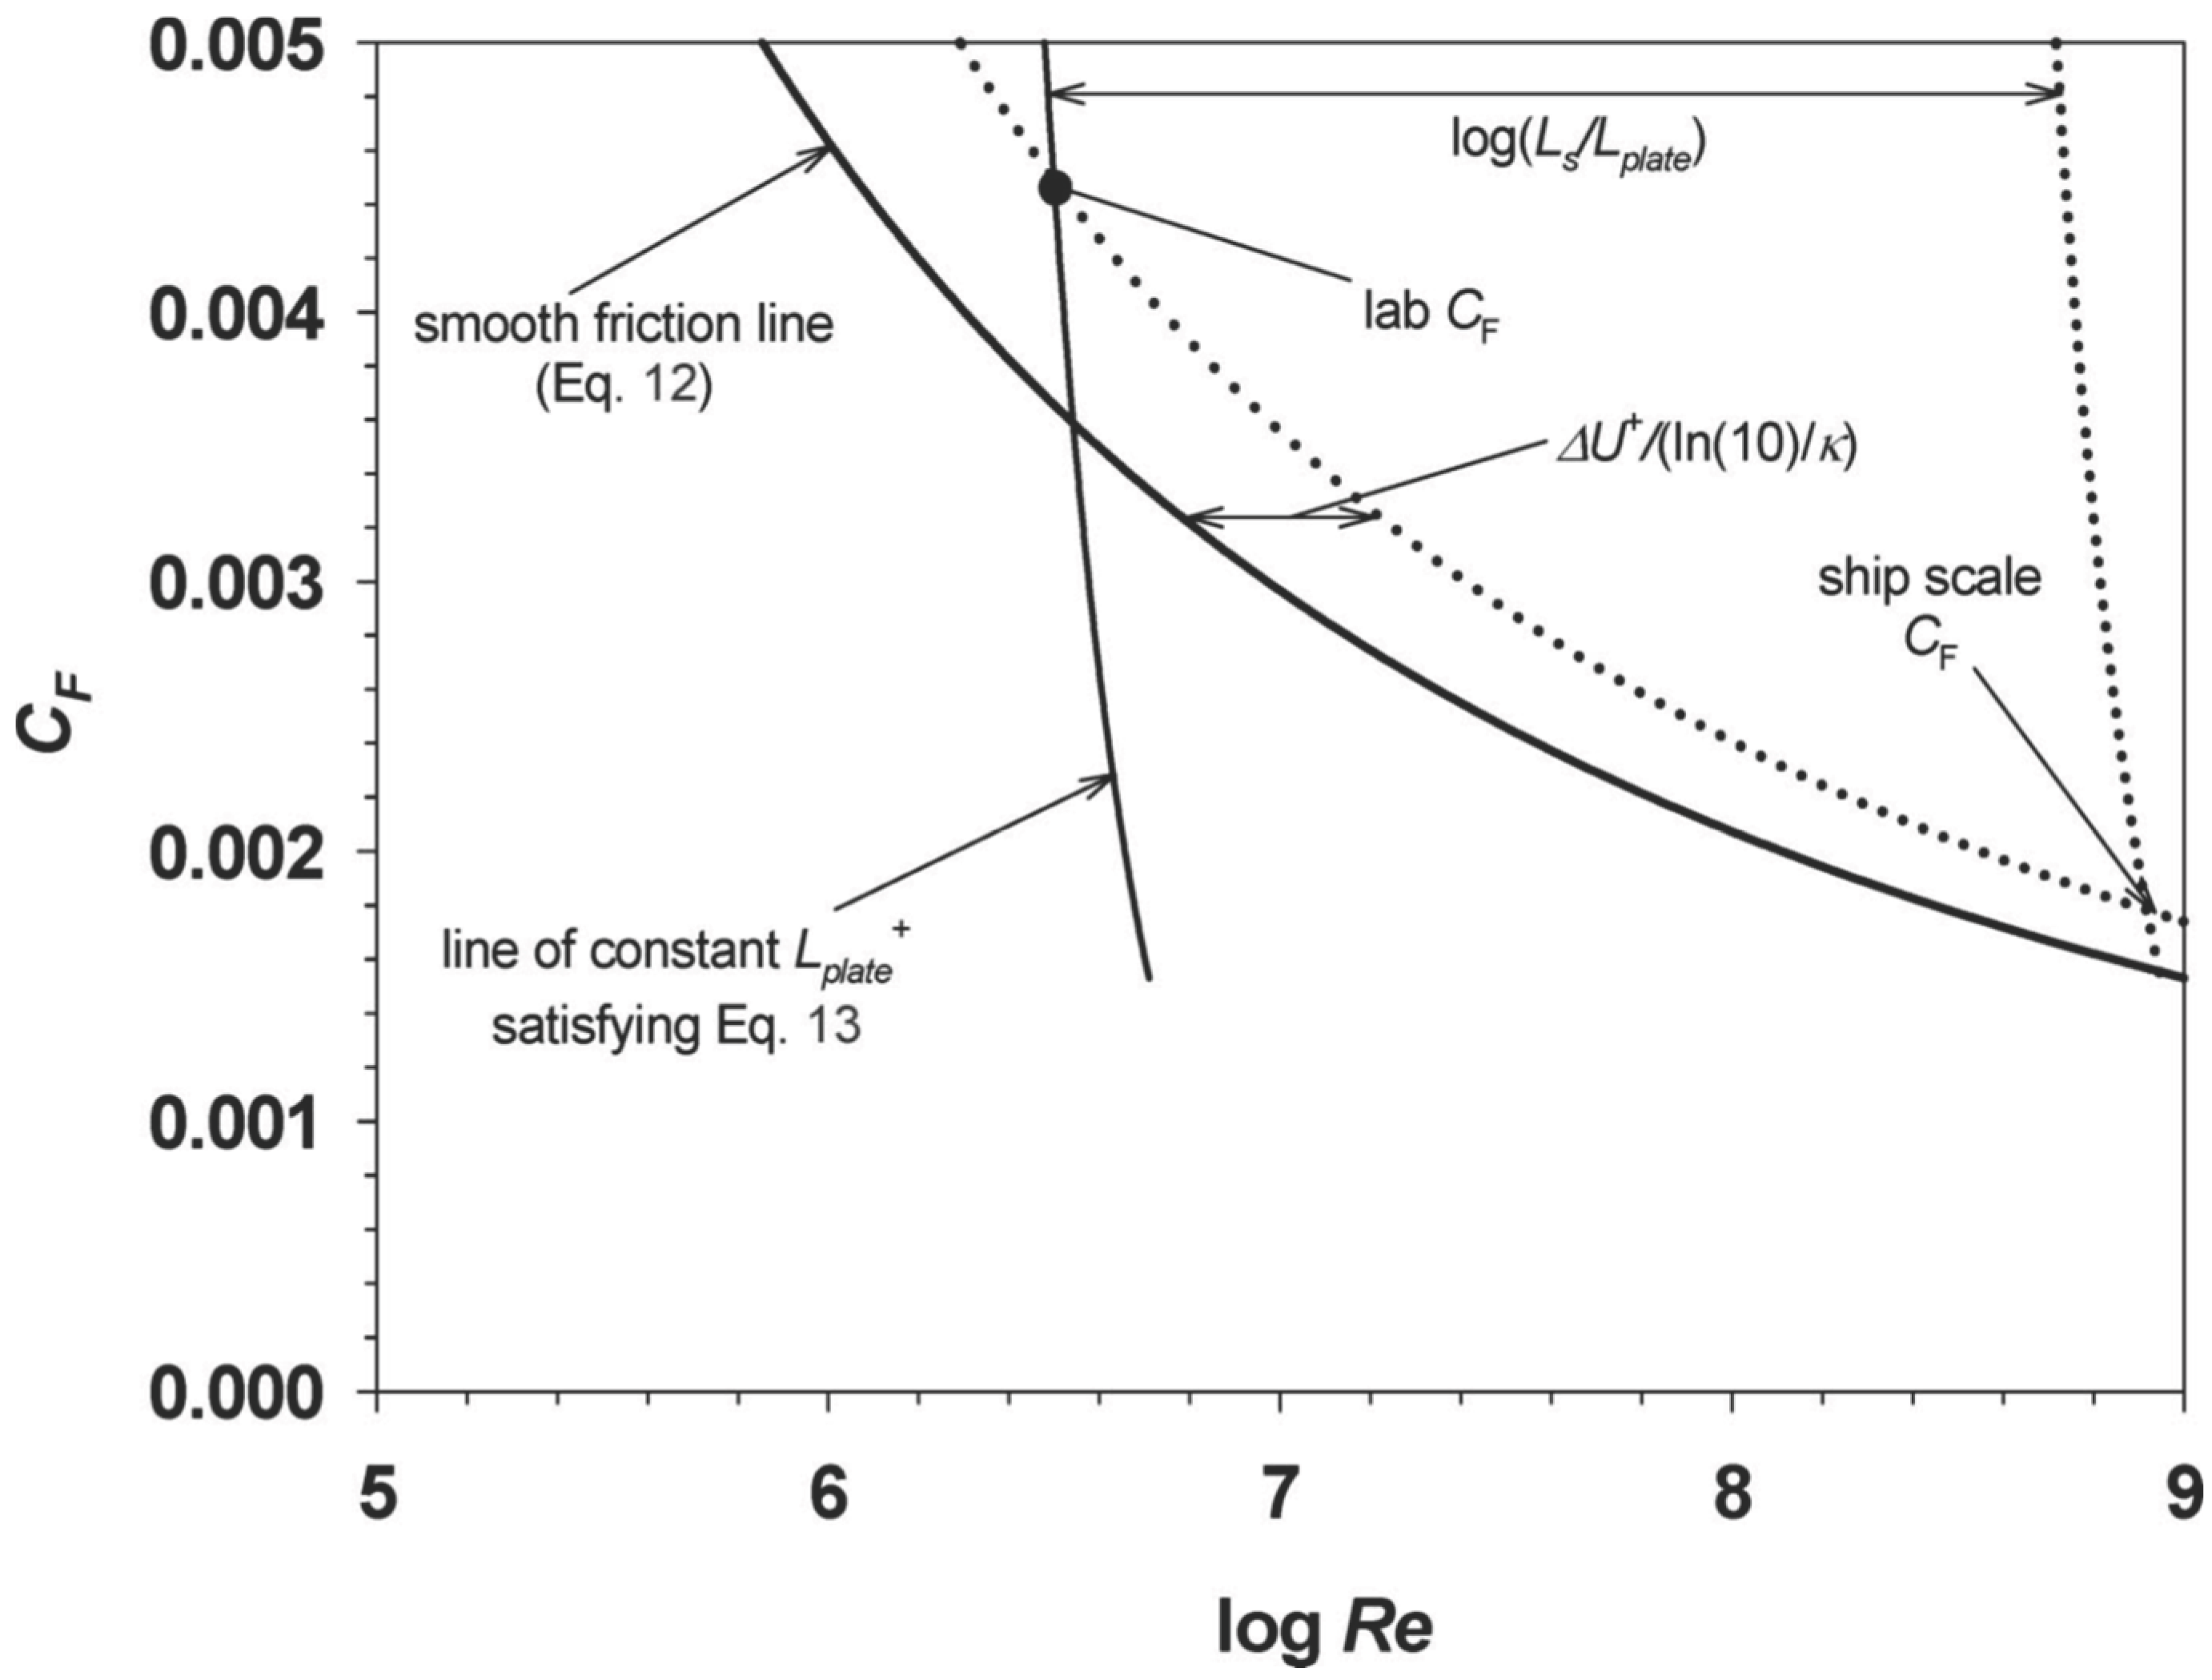
The increase of CF due to hull (and plate) roughness depends on the average peak to trough heights of the roughness topography. The ΔCF results in an equal increase in the total resistance coefficient of ships CT and, consequently, to the total resistance of the ship RT related to it by an expression like that for CF:
The scope of this paper is not to investigate the relation between hull roughness topology and increase in frictional resistance but to assess the variation of the effect of hull roughness with ship speed. The proposed methodology is described in the next section.
3. Methodology
A vessel is designed to sail at a service speed, depending on its size, its hull form, its type (containership, bulk carrier, tanker, passenger ship, ferry, etc.) and its mission. At this service speed the main engine of the vessel operates using 85%-90% of its Maximum Continuous Rating (MCR), allowing for a margin of 10%-15% to compensate for fouling and adverse weather and sea conditions.
Although the above is a reasonable design condition, it can’t be used to manage the ship throughout its service life. A more realistic approach should exploit available statistical data regarding the weather and sea states prevailing along its route of operation to derive the distribution of speeds along a trip or per year. In the study the extent of fouling should be also accounted. A similar procedure should be implemented when a charter contract is formed to reflect the average performance of the vessel and not a temporal situation. The latter is currently the standard practice in the hiring of ships, since the performance of a vessel is evaluated on a day with good weather, corresponding to wind strength up to 4 Beaufort (BF) and significant wave height HS up to 1.5 meters. and compared with that stated in the contract to specify whether a penalty or a bonus is applied on the hiring rate.
To be more specific, an oceangoing ship sails a significant portion, if not most of its service in winds stronger than 4 BF and in sea states with HS higher than 1.5 m. In these adverse sea and weather conditions the ship reacts with dynamic responses in all six degrees-of-freedom, transitional (surge, sway heave) and rotational (roll, pitch, yaw). These ship motions disseminate part of the power delivered by the main engine of the ship to the sea by generating waves. Especially in the case of head or bow seaways, a significant portion of the engine power is spent to motion generated waves, while only the remaining installed power is used to propel the ship. The latter is quite limited, resulting in an unavoidable involuntary speed loss.
To tackle formally the problem, the mean added resistance in waves is assessed based on dynamic responses of the ship, which is superimposed on the calm water resistance. It has been found that added resistance in head waves is proportional to the square of vertical motion and, within linear theory, it is proportional to the square of the significant wave height (Lloyd, 1989) [8]. The added resistance in severe sea states may even exceed the calm water resistance of the ship at a specific speed, thus resulting in a significant speed reduction for the given installed power. In Figure 1 and Figure 2 the total resistance (calm water resistance and added resistance in waves) in fully developed seas are presented for two well-known hull forms in the open literature, the US frigate of Perry class, known as FFG-7 (Toxopeus et al, 2018) [19], and KRISO containership, a 232.5 m long ship with breadth 32 m and depth 10.8 m, known as KCS (Tokyo 2015 Workshop) [20,21].
Wind resistance is ignored in the above calculations as constituting a minor part of the added resistance, which however, should be superimposed on the added resistance due to the waves. The two selected vessels are well-known test cases referred to in plenty of scientific papers. In addition, they are the only ones for which information about the effect of roughness on their performance for an extensive range of speeds is investigated in the open literature. Following their results, the total resistance at the (higher) service speed is increased by 38% and by 25%, for FFG-7 and KCS, respectively when the HS of the sea state rises from 1.5 m to 5 m (Sanada et al, 2022) [22]. Thus, the installed main engines of the naval ship FFG-7 sooner and of the KCS later, after spending the available power margin (10%-15%), reduce the pitch in the case of the naval vessel or start operating at a reduced RPM for the KCS.
The voluntary operation of ships at reduced RPM and speed even in calm water (slow steaming) is a common practice nowadays to reduce CO2 emissions and the fuel cost on a trip which constitutes the prime component of the operational expenses (Schultz et al, 2011) [13].
Reverting now to the roughness, the Naval Ships’ Technical Manual (NSTM, 2002) [23] provides the following index:
| Description of condition | NSTM rating | Equivalent sand roughness (μm) | Average sand roughness (μm) |
| Hydraulically smooth surface | 0 | 0 | 0 |
| Typical as applied AF coating | 0 | 30 | 150 |
| Deteriorated coating or light slime | 10-20 | 100 | 300 |
| Heavy slime | 30 | 300 | 600 |
| Small calcareous fouling or weed | 40-60 | 1000 | 1000 |
| Medium calcareous fouling | 70-80 | 3000 | 3000 |
| Heavy calcareous fouling | 90-100 | 10000 | 10000 |
Schulz (2007) [16] found that FFG-7 with a calm water resistance of 186 KN (Kilo-Newton) and 1160 KN, at 15 kn (knots) and 30 kn, respectively, require about 29.000 KW of power to sail at 30 kn. The effect of the worst fouling condition is to increase resistance by 162 KN and 677 KN, respectively. Since 30 kn = 2 * 15 kn and 677 KN ~ 22 *162 KN, it can be concluded that for the same roughness condition, its effect on resistance is proportional to VS2. Denoting by CFF the roughness resistance coefficient in line with definition of the frictional resistance coefficient CF, we can state:
and since
we can conclude that:
ΔRFF =CFF ρ WS VS2
ΔSHPFF = ΔEHPFF / PC = ΔRFF VS / (75 PC)
ΔSHPFF = CFF ρ WS VS3 / (75 PC)
In the above relations:
WS = wetted surface of the ship
ρ = sea water density
ΔEHP = increase of Effective Horsepower
ΔSHP = increase of Shaft Horsepower
PC = propulsive coefficient including propeller efficiency
CFF = roughness resistance coefficient
FF = index to indicate the effect of roughness on the respective quantity
Following relation (6) the increase in SHP due to fouling ΔSHPFF, and, therefore, the fuel consumption is proportional to the cube of the ship speed.
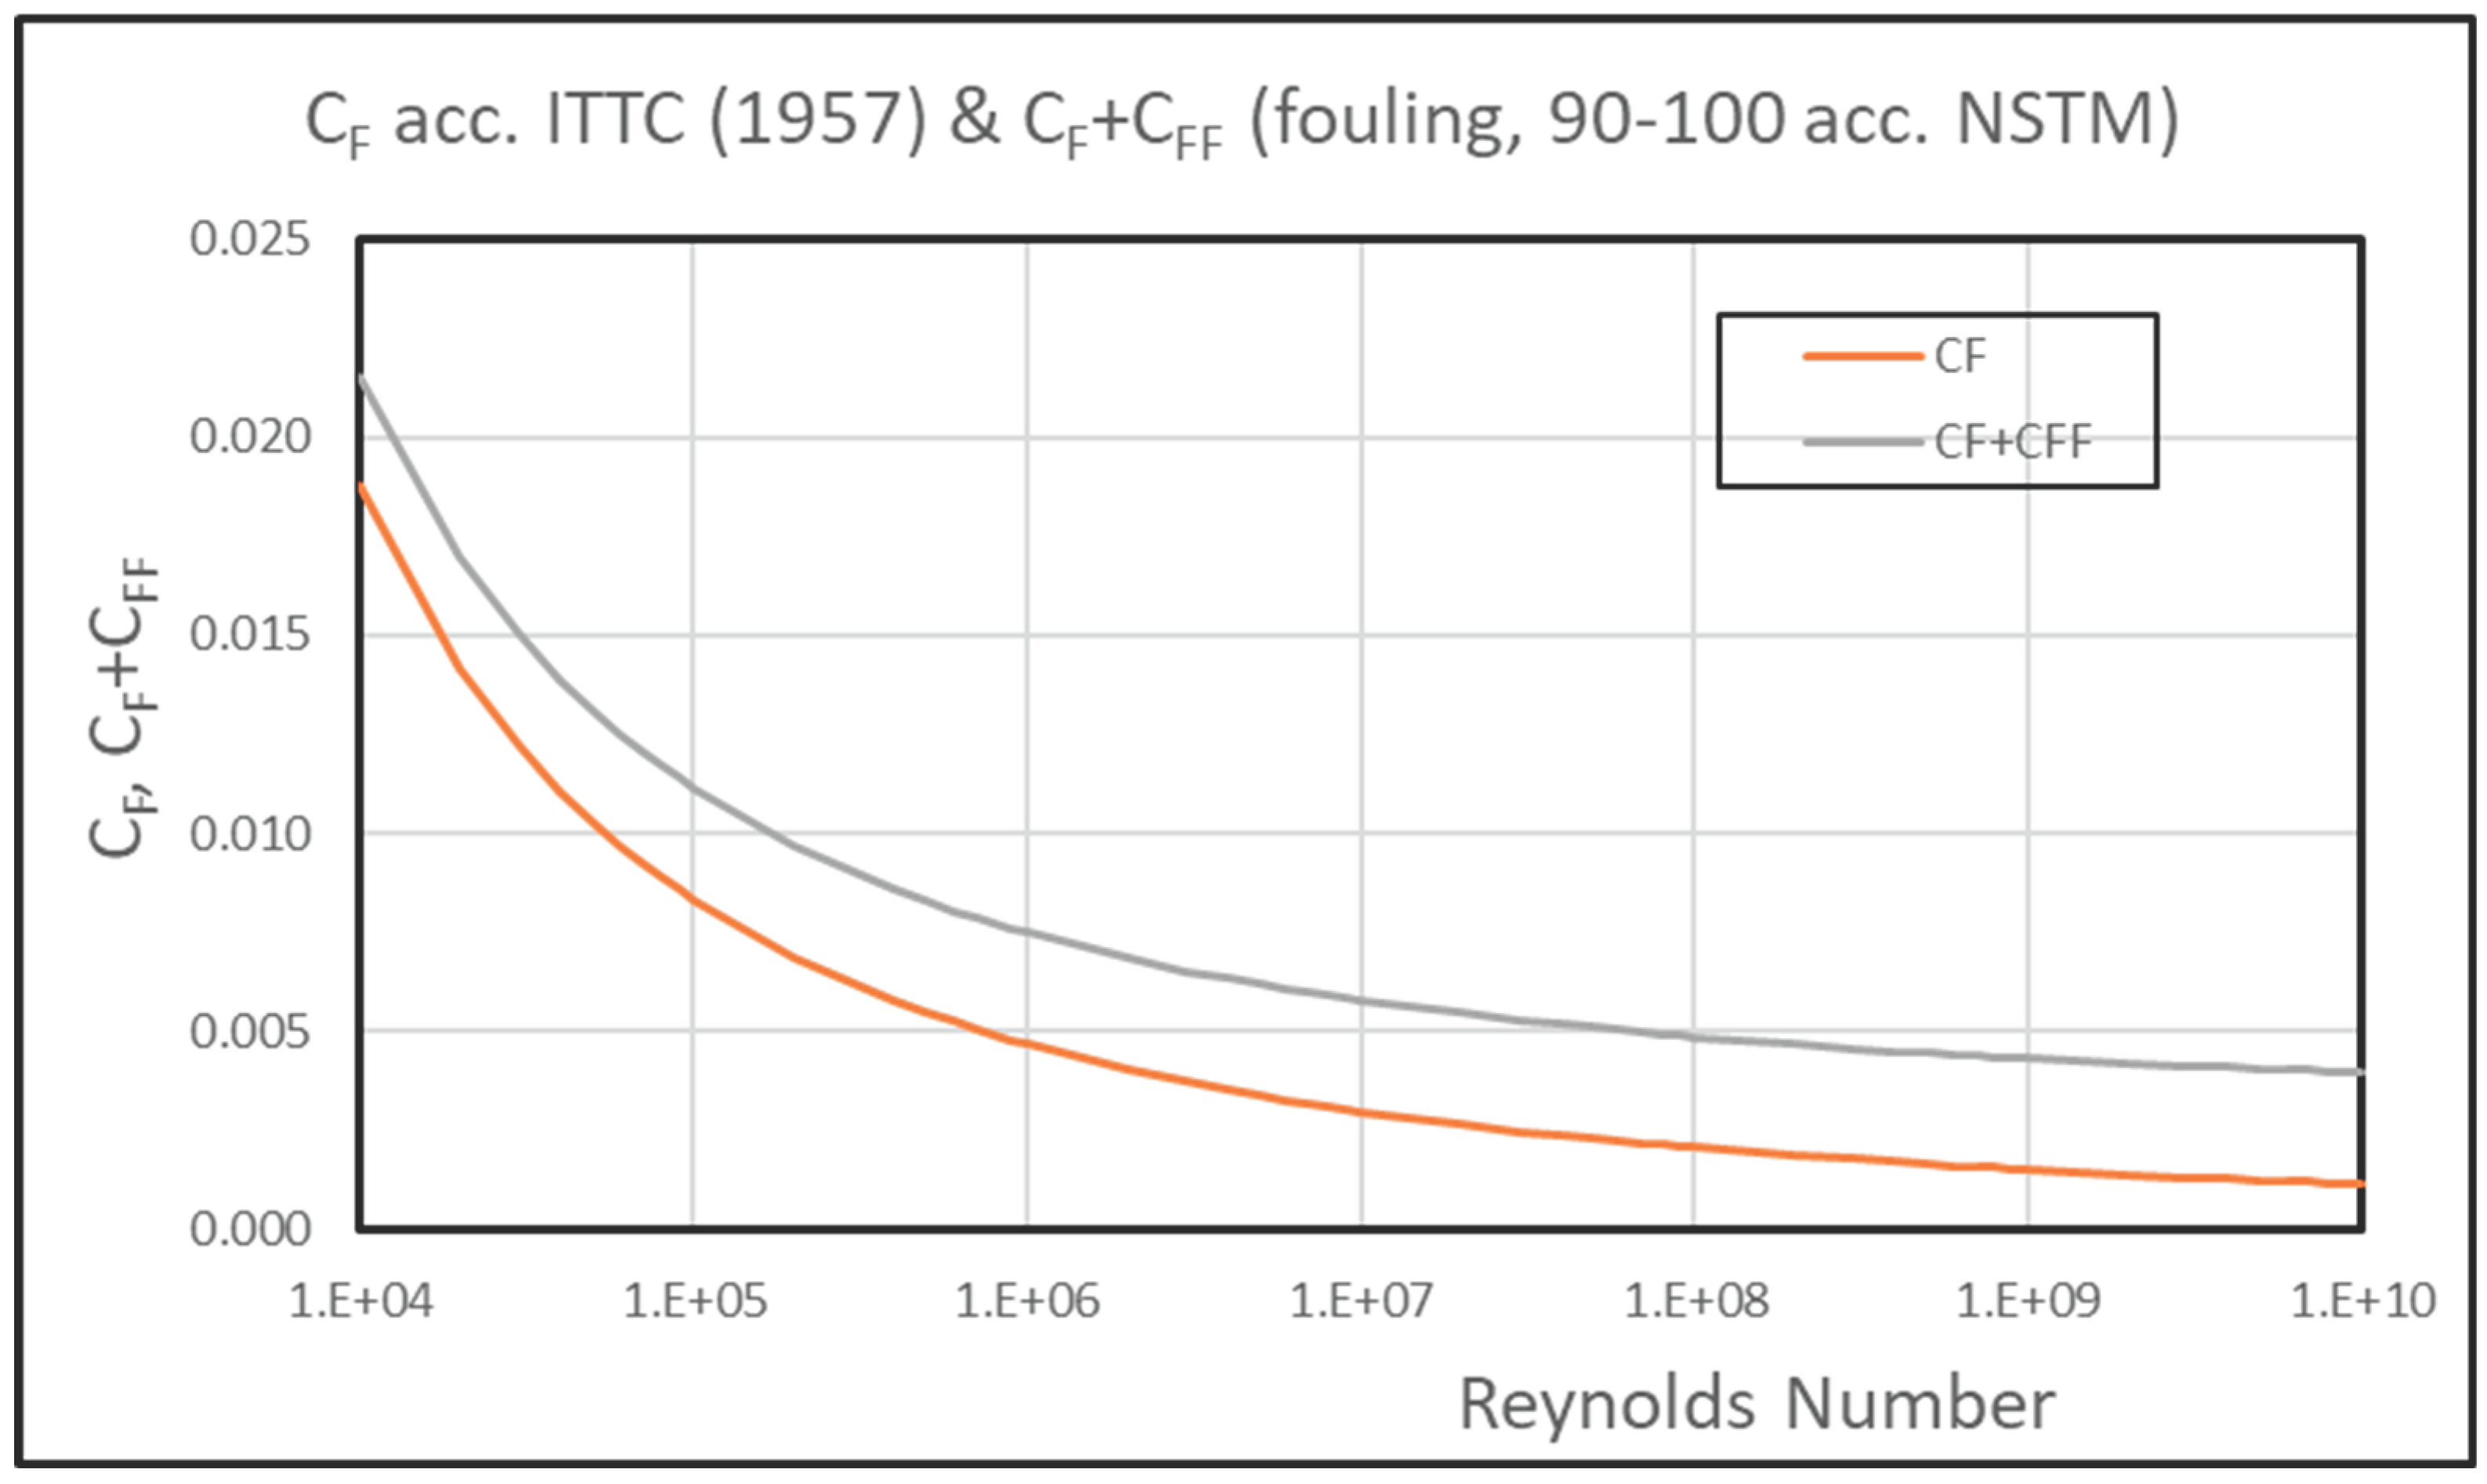
This conclusion is supported by the theoretical background presented by Schulz (2007) [16] who presented the relation between CF, CFF and Reynolds No Re, as in Figure 3. Following this figure, the curves of coefficients CF and CF+CFF are almost horizontal for the high Re range (108 to 109), where ships operate. Thus, CFF is nearly constant in this range of speeds.
Effect of Fouling at Reduced Speeds
Based on the above analysis in case an increased fuel consumption ΔFC1 is reported at a specific ship speed V1, the corresponding reduction at a reduced speed V2 should be estimated by the following relation:
ΔFC2 = ΔFC1 * (V2/V1)3
In case the ship achieves a reduced speed at the MCR of the main engine due to fouling, the speed reduction ΔV1 = V1,EXP(ECTED) – V1,ACT(UAL) should correspond to the additional power ΔSHP1 necessary to overcome the resistance due fouling and reach the expected speed VEXP, or, equivalently, to the fuel consumption ΔFC1 spent due to fouling. Following equation (3):
ΔSHP1,FF = K (V1,ACT)3
At the same time, SHP is proportional to the cube of VS and therefore:
or, equivalently:
SHP1,EXP / SHP1,ACT = (V1,EXP / V1,ACT)3
(SHP1,EXP - SHP1,ACT) / SHP1,ACT = [(V1,EXP)3 – (V1,ACT)3] / V1,ACT)3
By setting:
in equation (9) we conclude with the following relation:
or equivalently:
ΔSHPFF = SHP1,EXP - SHP1,ACT
ΔSHP1,FF / SHP1,ACT = [(V1,EXP)3 – (V1,ACT)3] / V1,ACT)3
ΔFC1,FF / FC1,ACT = [(V1,EXP)3 – (V1,ACT)3] / V1,ACT)3
Thus, the power and fuel consumption due to hull roughness are analogous to the cube of speed. Similar results have been presented by Plessas (2023) [25] based on observed fouling categorized into five stages form light slime to heavy barnacles. Similar is the relation of the power and fuel consumption to the rest of the components of the total resistance of a ship in calm water, i.e. wave, viscous pressure and frictional resistance (Molland et al, 2011) [26]. However, the wave resistance and the frictional resistance vary also with Froude number and Reynolds number, respectively, in a more complicated way.
Equation (11) should be used by the shipping companies and the charterers to assess the actual required power and the fuel consumption of ships during the periods of sailing at reduced speed, independently of the reason of this speed reduction (down steaming or severe sea conditions). It should be also considered in the preparation of charter contracts to specify the performance of hired vessels and the clauses for over- or under-performance.
To demonstrate the significance of the above statements, the results for two test cases are presented:
- The ΔSHPFF and hence the ΔFCFF of KRISO Containership are reduced between speeds V1 =24 kn and V2 = 19 kn by 50.4%.
- The ΔSHPFF and hence the ΔFCFF of a Bulk Carrier or Tanker are reduced between speed V1 =15 kn and V2 = 11 kn by 60.6%.
4. Effect of Roughness on Added Resistance and Added Power in Waves
When a ship sails in waves, it responds dynamically by unsteady motions in all six degrees of freedom. The ship motions generate additional waves (see Lloyds, 1989) [8] dissipating energy to the sea at the expense of the installed power. Hull roughness increases the damping of at least the main oscillatory dynamic ship responses of heave, pitch and roll and, therefore, reduce their amplitudes. Damping due to hull roughness should be imposed in the equations for heave and pitch motion, the latter being the major contributor to added resistance of a ship in a head seaway. In the case of roll, on the other hand, a frictional damping component is always included in the roll equation of motion, even for potential flow calculations, to provide realistic results for roll motion. An estimate is provided by Schmitke (1978) [24]. This damping component is enhanced by the contribution of fouling. Thus, contrary to the effect of damping on calm water performance of a ship, as it is described and quantified in the previous sections, hull roughness has a positive effect on the dynamic responses of a ship in a seaway. Consequently, the added resistance and the added power in waves, which are directly related to the square of vertical dynamic ship responses (heave, pitch), and to roll motion, and which is superimposed on the calm water resistance is reduced.
The roughness effect on ship motions, added resistance and added power in waves haven’t yet been quantified in the literature. The respective investigation requires extensive use of time-consuming CFD codes to consider the interaction between the hull and the propeller and intricate experiments (EFD) for validation purposes.
However, the positive effect of hull roughness on added power in waves compensates, at least partly, for its small, at reduced speed negative effect on calm water resistance, a component of the total resistance in a seaway. The effect of hull roughness on the damping of the oscillatory responses of ships in waves should be quantified by researchers in the future.
5. Conclusions
In this paper it is demonstrated that the effect of fouling on the performance of ships reduces rapidly with speed, and it becomes negligible when they operate at reduced speed due to a voluntary slow steaming or adverse sea and weather conditions. Thus, it should be ignored for the percentage of the hiring period when they sail at speeds well below their service one. The results presented are based on the single available reliable data from full scale records of a naval combatant and extensive CFD calculations for a standard containership used for comparative studies by the scientific community on ship hydrodynamics. Tests with scaled models are used to validate CFD calculations only at low Reynolds numbers, while actual ships operate at Re 102 to 103 times higher.
Nowadays when the cost of fuel is quite high and the strict regulations issued by the maritime organizations impose taxes on excessive fuel consumption, maritime companies have a tool to estimate precisely it at any time, based on the actual roughness condition of the hull fouling at that time. The effect of fouling on the propeller is much more easily monitored and remedied by underwater cleaning, whenever it is necessary, and in general, more frequently than the cleaning of the hull which necessitates dry-docking. Thus, it is assumed that the propulsive performance doesn’t vary throughout the operation of the ship.
The findings of this study should be considered by the shipping companies:
- to optimize the dry-docking plan of the vessel in conjunction with the properties of the coatings used,
- to estimate the overall fuel consumption of a ship on a specific trip and respective the annual fuel consumption
- to prepare realistic charter contracts and present them to the charterers,
- There is a positive effect of hull roughness on the added resistance and the respective increase of required power in a seaway, due to the increase of damping and the associated reducing of the dynamic ship motions, which should be quantified in the future.
- In adverse sea conditions (heavy sea states) the effect of waves on the overall performance of the vessel and its fuel consumption is much more severe than that of hull roughness.
These findings confirm that the overall performance of a cargo vessel in terms of fuel consumption and emission of GHG depends mainly on the optimization of its hull form design to achieve minimum resistance (and propulsion) in calm water and in sea states where added resistance is superimposed on the one in calm sea. The ship owner should keep track of the extent of fouling, especially when the ship operates in calm sea most of the hiring period. Finally, the underwater cleaning of the propeller should be scheduled once or twice per year, since it leads to significant benefits at relatively low expenses.
References
- ISO 15016:2015 standard. Guidelines for the assessment of speed and power performance by analysis of speed trial data. ISO Technical Committee TC 8, Ships and Marine Technology, 2015.
- Hakim, M.L.; Suastika, K.; Utama, K.A.P.; Purnamasari, D.; Muryadin, M. Frictional Resistance Increase Due to Hull Roughness: An Analysis of the Hull Form Parameters Influence, Trans. on Maritime Science ToMS, Vol. 12, No. 2, 2023, Faculty of Maritime Studies ~ Univ. of Split, October 2023.
- Oliveira, D.; Larsson, A.I.; Granhaga, L. Effect of ship hull form on the resistance penalty from biofouling. Biofouling Vol. 34, 3, 262–272, 2018, Taylor & Francis Group. [CrossRef]
- Choi, W.; Min, G.; Han, S.; Yun, H.; Terzlev, M.; Dai, S.; Kim, D.; Song, S. Resistance and speed penalty of a naval ship with hull roughness, Ocean Engineering, Vol. 312, 2024. [CrossRef]
- Song, S.; Terziev, M.; Tezdogan, T.; Demirel, Y.K.; Muscat-Fenech, C.M.; Incecik, A. Investigating roughness effects on ship resistance in shallow waters, Ocean Engineering, Vol. 270, 2023. [CrossRef]
- Song, S.; Dai, S.; Demirel, K.; Atlar, M; Day, S.; Turan, O. (2020) Experimental and theoretical study of the effect of hull roughness on ship resistance, Journal of Ship Research, Vol. 64. [CrossRef]
- MEPC 83/6, Energy efficiency of ships, IMO/MEPC (Marine Environment Protection Committee), 83th session, November 2024.
- Lloyd, A.R.J. Seakeeping: Ship behaviour in rough weather, Ellis Horwood Ltd. Publ., 1989, John Wiley & Sons, N. York.
- Froude, W. The Resistance of Ships. Professional Papers, No. 23, Bureau of Navigation, Washington, 1888.
- Hoerner, S.F. Practical Information on Aerodynamic Drag and Hydrodynamic Resistance. Published by the Author, 1965, Brick Town, New Jersey, 455 pp.
- Townsin, R.L. The Ship Hull Fouling Penalty. Biofouling, Vol. 19 (Supplement), 9-15, 2003, Taylor & Francis Group. [CrossRef]
- Tezdogan, T.; Demirel, Y.K. An overview of marine corrosion protection with a focus on cathodic protection and coatings. Brodogradnja, Vol. 65, 49–59, 2014.
- Schultz, M.P.; Bendick, J.A.; Holm, E.R.; Hertel, W.M. Economic impact of biofouling on a naval surface ship. Biofouling Vol. 27, 87–98, January 2011, Taylor & Francis Group. [CrossRef]
- Schultz, M.P. Effects of coating roughness and biofouling on ship resistance and powering. Biofouling, Vol. 23, 5, 31-41, 2007. [CrossRef]
- Demirel, Y.K.; Song, S.; Turan, O.; Incecik, A. Practical added resistance diagrams to predict fouling impact on ship performance. Ocean Engineering, Vol. 186, 2019, 106112.
- Chung, D.; Hutchins, N.; Schultz, M.P.; Flack, K.A. Predicting the Drag of Rough Surfaces, Annual Review of Fluid Mechanics, Vol. 53, 4, 39–71, 2021. [CrossRef]
- Mohsen, K.; Abozar, E. Numerical Study on Resistance of a Bulk Carrier Vessel using CFD method, 10th Intl. Conf. on Coasts, Ports and Marine Structures ICOPMAS 2012, Tehran, Iran, 19-21 Nov. 2012.
- Granville, P.S. The frictional resistance and turbulent boundary layer of rough surfaces. Journal of Ship Research, Vol. 1, 2, 52–74, 1958.
- Toxopeus, S.; Sadat-Hosseini, H.; Visonneau, M.; Guilmineau, E.; Yen, T.-G.; Lin, W.-M.; Grigoropoulos, G.J.; Stern, F. (2018). CFD, Potential Flow and System-Based Simulations of Fully Appended Free Running 5415M in Calm Water and Waves, International Shipbuilding Progress, Vol. 65, No. 4, pp. 227-256.
- Tokyo 2015. A Workshop on CFD in Ship Hydrodynamics, Tokyo, Japan, 2-4 December 2015.
- Takinori, H.; Stern, F.; Larsson, L.; Visonneau, M. (2021). Numerical Ship Hydrodynamics. An Assessment of the Tokyo 2015 Workshop. ISBN 978-3-030-47571-0. [CrossRef]
- Sanada, Y.; Kim, D.-H.; Sadat-Hosseini, H.; Stern, F.; Hossain, A.; Wu, P.-C.; Toda, J.; Otzen, J.; Simonsen, C.; Abdel-Maksoud, M.; Scharf, M; Grigoropoulos, G. (2022). Assessment of EFD and CFD capability for KRISO Container Ship added power in head and oblique waves, Ocean Engineering, Vol. 243, Jan. 2022, 110224.
- Naval Ships’ Technical Manual, Chapter 081– Waterborne underwater hull cleaning of Navy ships. Publication # S9086-CQ-STM-010/CH-081 Revision 5, 2006, Washington (DC): Naval Sea Systems Command.
- Schmitke, R.T. (1978). Ship sway, roll and yaw motions in oblique seas, Trans. SNAME, Vol. 86.
- Plessas, T. Ship Performance Assessment, based on Observed Fouling, Sealion Engineering. ISBN 978-618-00-4740-0.
- Molland, A.F; Turnock, S.R.; Hudson, D.A. Ship Resistance and Propulsion. Practical estimation of ship propulsive power, Cambridge University Press, 2011. ISBN 978-0-521-76052-2.
Figure 1.
Total Resistance of FFG-7 in fully developed seaways.
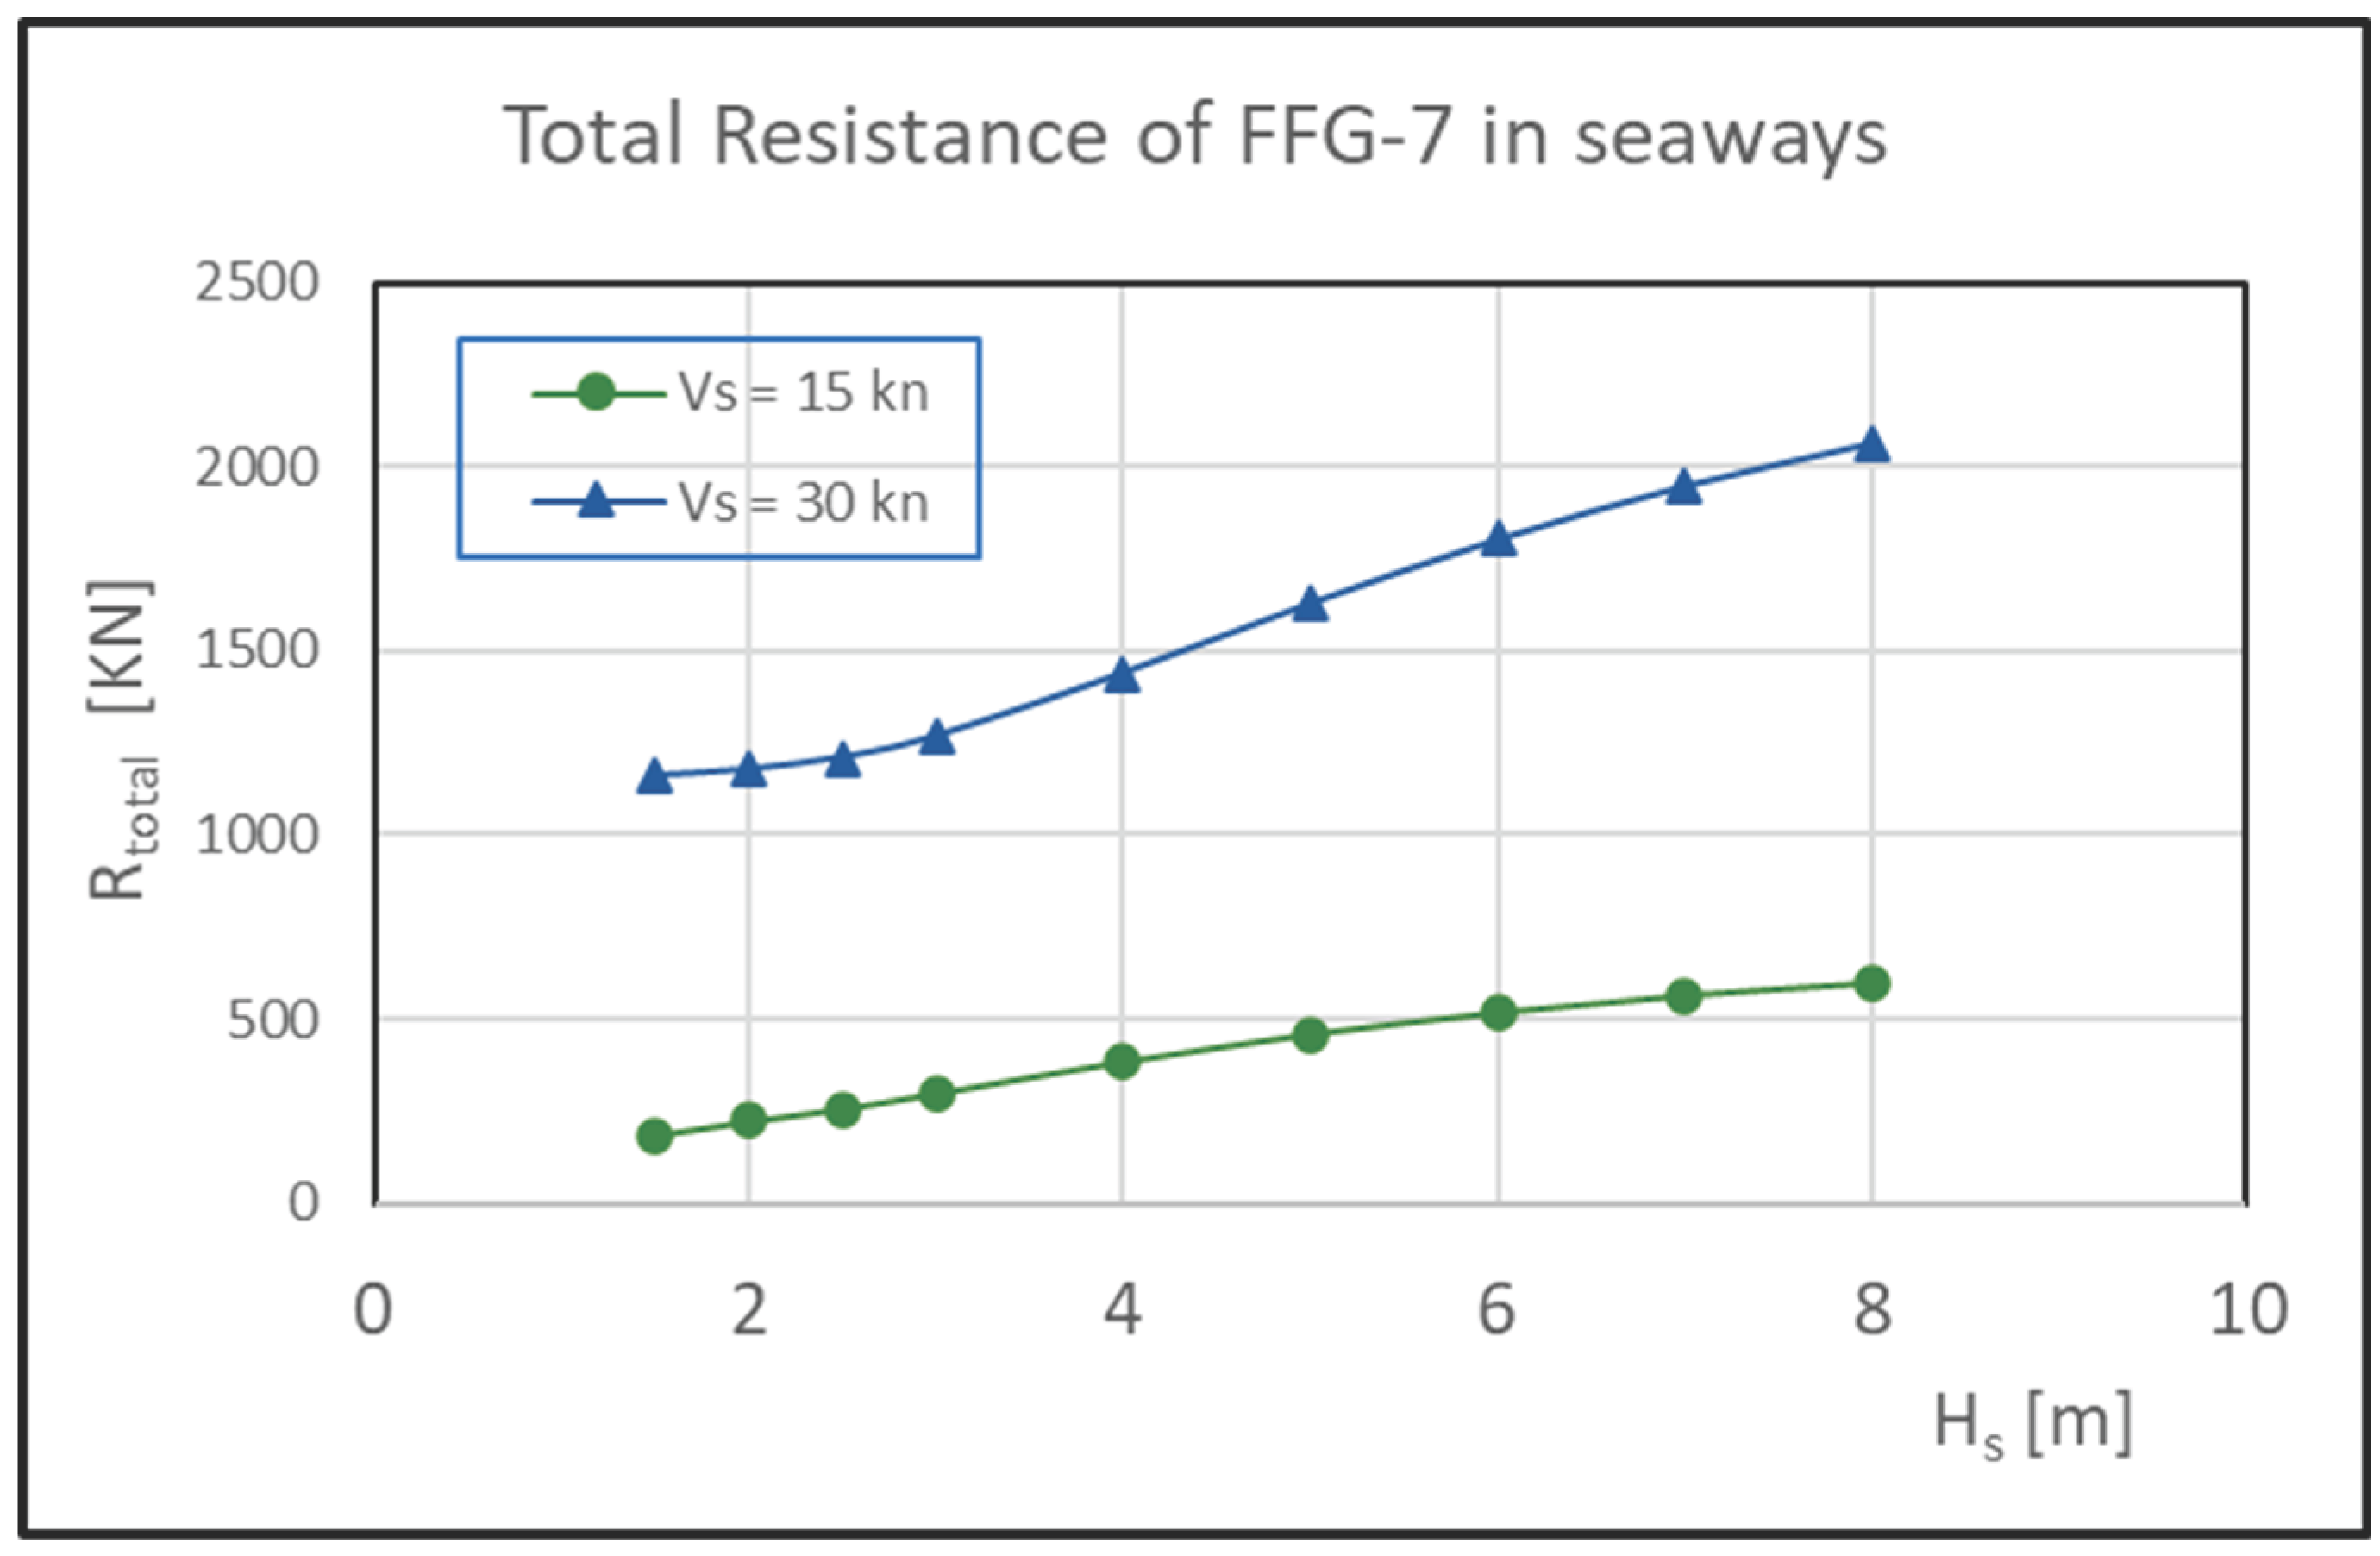
Figure 2.
Total Resistance of KCS in fully developed seaways.
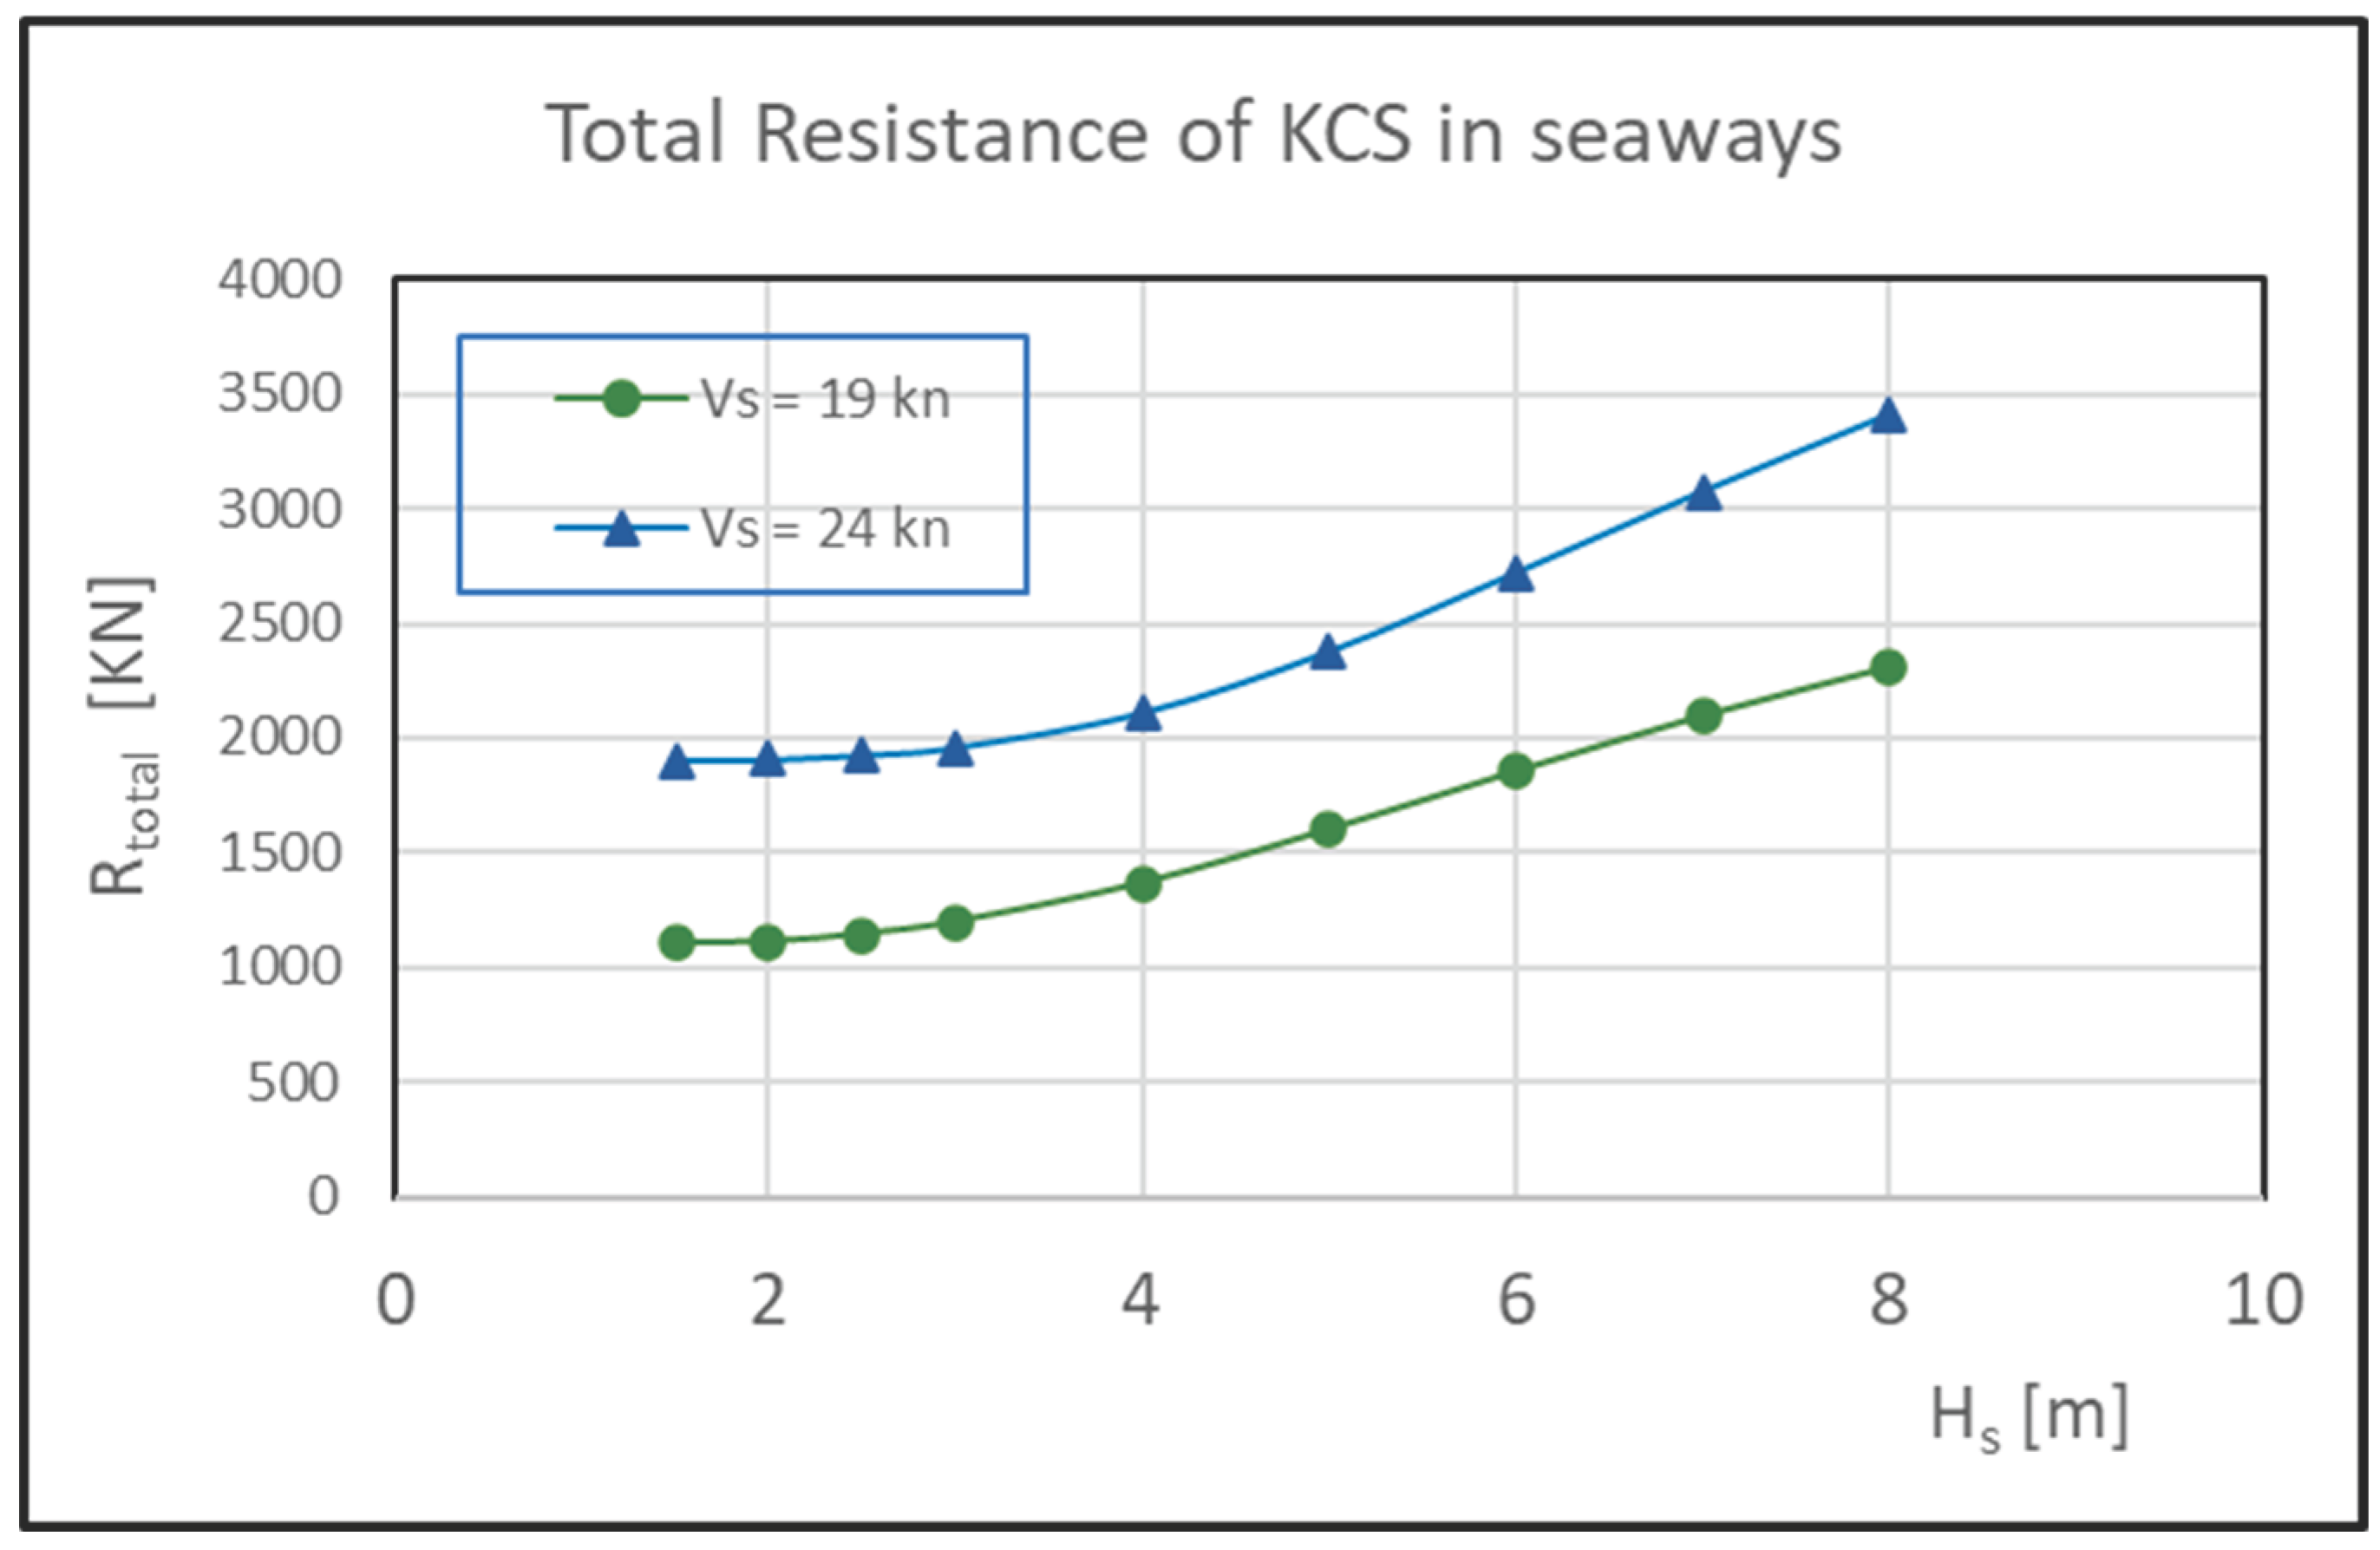
Figure 3.
Frictional (ITTC, 1957) and roughness resistance coefficients.
Disclaimer/Publisher’s Note: The statements, opinions and data contained in all publications are solely those of the individual author(s) and contributor(s) and not of MDPI and/or the editor(s). MDPI and/or the editor(s) disclaim responsibility for any injury to people or property resulting from any ideas, methods, instructions or products referred to in the content. |
© 2026 by the authors. Licensee MDPI, Basel, Switzerland. This article is an open access article distributed under the terms and conditions of the Creative Commons Attribution (CC BY) license (http://creativecommons.org/licenses/by/4.0/).
Copyright: This open access article is published under a Creative Commons CC BY 4.0 license, which permit the free download, distribution, and reuse, provided that the author and preprint are cited in any reuse.


