
Submitted:
03 May 2025
Posted:
06 May 2025
You are already at the latest version
Abstract
Reduction of emissions and gain of fuel efficiency have always been a desirable
goal to be achieved in the shipping industry. Several energy-saving devices have been
proposed and implemented on new-built ships as well as existing fleets over the past few
decades. However, most of the studies are focused on seagoing ships, with hardly any
studies available on inland ships. In this present study, a benchmark hull, JBC, without and
with WED (wake equalizing duct) is first validated with experimental results. A verification
study is performed for the assessment of numerical uncertainty. The numerical analyses
are conducted in OpenFOAM. The study is further elaborated through a stepped design
process by altering some key parameters associated with the sectional shape of the duct to
achieve improvement in results. The result shows maximum reduction in resistance up to
2 %. To avoid the complexity associated with the propeller, the study is limited to hulls
with ESD only. Finally, the selected optimal WED is implemented in an existing inland
bulk carrier and the result shows a significant reduction in resistance up to 5 %. The study
reveals that the effect of energy-saving is pronounced in fuller ships with compact WED,
particularly at low speeds.
Keywords:
JBC
; WED
; OpenFOAM
; resistance
; propeller
; ESD
; inland bulk carrier
1. Introduction
The saving of fuel cost and attaining high energy efficiency have been a key challenge to the ship owners and engineers to reach the business goal. Modification of hull form may provide good results, but it requires time and experience. Most of the cases it not possible with existing vessels. In this case energy-saving devices play an important role in reducing emissions to comply with IMO’s energy efficiency index [1]. They have been applied to the new building fleet as well as the existing fleet. There are numerous experimental and numerical studies available on energy saving devices.
The energy saving action of both circular and semi-circular duct were experimentally evaluated by Yasuhiko et al. [2] The propulsive performance experiment was conducted on a 300,000 tonnes DWT crude oil tanker model. It was found that the energy saving effect of semi-circular duct was higher than conventional circular duct. A study was performed by Shin et al. [3] to show the effects of conventional circular duct and unconventional half circular duct on large block coefficient VLCC ship both experimentally and numerically. The numerical calculations were carried out by HSVA code FreSCo+ based on Finite Volume Method. Based on their study the unconventional half circular duct performed slightly better than conventional circular duct. The optimum configuration of half circular duct saved energy upto 5.4 % while the conventional circular duct saved energy up to 5.1 % in self propulsion test. Sun et al. [4] performed a verification and validation study of the Japan Bulk Carrier without and with a wake equalizing duct. An in-house solver named naoe-FOAM-SJTU was used for numerical simulations. The deviation for the total resistance coefficient was less than 1 % for the resistance coefficient with fine grid, whereas for the trim and sinkage case, relatively higher deviation values were observed. A higher value of uncertainty is obtained for trim and sinkage. From their analysis, it was seen that the low-pressure area created in front of the duct had a positive impact on reattaching the separated flow. A verification and validation study were performed by Visonneau et al. [5] of the JBC (Japan Bulk Carrier) test case. The effect of ESD on bare hull and hull with propeller were investigated. ISIS-CFD flow solver developed by the team was used. The numerical results showed close approximation with the experimental results provided by NMRI (National Maritime Research Institute). Two different turbulence models were used SST k-omega and EASM wall resolved model. Higher uncertainty was associated with SST k-omega model, while EASM model showed less uncertainty and more pronounced bilge vortex. In their study, only RANSE calculations were performed and it was recommended to perform LES simulations to produce better flow physics. Martinas et al. [6] numerically optimize the geometry of a wake equalizing duct by altering the angle of attack, duck length, cones radios and relative position of the duct with respective to the propeller. Based on their study, better results were obtained for duct with a smaller and more compact geometry. Effect of wake equalizing duct on bare hull resistance was shown by Wu et al. [7] for JBC hull. The effect of WED is to accelerate the flow to the propeller and reduce the bilge induced vortex. In their study only, the angle of attack of the hydrofoil section was altered from 2 degree to 24 degree. The maximum reduction of resistance was about 2.49 % found at 7 degree angle of attack. The analysis was carried out in OpenFOAM. The combined effect of ESDs on ship’s delivered power was investigated by Lee et al. [8] by experiment. Here, pre-swirl stator, tip rake propeller and wavy twisted rudder were used with KCS hull model. The results obtained from combined ESD were also compared with each individual ESDs. The combined ESD saved delivered power up to 5.4 % which was slightly lower than the sum of energy-saving actions of each ESDs. Nowruzi et al. [9] investigated the effects of three pre-swirl ducts respectively Mewis duct, Becker twisted fins and unconventional semi-circular duct on propulsive performance of a series 60 hull model by means of both experimental and CFD analysis. Based on their study Backer twisted fins showed higher thrust and torque coefficient at lower values of advance coefficients on the other hand Mewis duct provided supreme thrust and torque coefficient at higher advance coefficients. It should be added that highest hull efficiency is obtained with unconventional semi-circular duct and case with no ducts. However, their study concluded that the efficiency of pre-swirl ducts significantly depends on the stern form of the hull. So, it is difficult to set the geometrical parameters of the ducts to get optimum results in terms of hydrodynamic efficiency. Furcas et al. [10] proposed an integrated approach by combining the geometrical parameters of wake equalizing duct and RANSE based CFD simulation in Star CCM+ to optimize the design of the duct. They selected JBC hull case for the availability of experimental results. The geometrical parameters include the average diameter of the duct, sectional hydrofoil shape handled by NACA 4- digit family, angle of attack and the position of the duct with respect to propeller plane. The aim of the study was to reduce the ship resistance by using a genetic optimization algorithm. The maximum reduction of total resistance was about 4 % when asymmetric configuration was considered from propeller center line while maximum 2 % improvement was achievement by working on the angle of attack. Nicorelli et al. [11] adopted a simulation-based optimization method to minimize the resistance of hull. A modern container ship hull named DTC (Duisburg Test Case) was chosen. In this study three different energy saving devices pre-swirl fin (PSF), pre-swirl duct (PSD) and wake equalizing duct (WED) were considered. A simple optimization process was used by considering several geometrical parameters of ESDs together with CFD analysis in Star CCM+. Throughout the optimization process RANSE analysis was used for Ship resistance calculation and BEM calculation for propeller. The maximum reduction in delivered power was found for pre-swirl fin with WED of 4 % on the other hand the reduction was only 0.5 % with WED alone. Later RANSE analysis was carried out for both hull and propeller which showed that a reduction of delivered power of 2.6 % for pre-swirl fin alone. PSD showed similar result to PSF, while in case of WED a decrement in performance was seen (1.5 % energy saving with PSD). The scale effect on ESD particularly on wake field was also analyzed. The tangential disturbance of full-scale calculations was higher than model scale. For extrapolation of effective wake ITTC’99 method provides closer results to full-scale CFD simulation, though the ITTC’21 method is more flexible.
However, most of the researches are concentrated on sea-going ships and carried out either by experiments or using commercial CFD codes, which are not publicly available. To the author’s best knowledge, the research for inland ships is still limited. Due to the unique nature of inland waterways and increasing demand for water transport, the fullness of inland bulk carriers and tankers is increasing continuously, but improvement in propulsive performance is limited. As a result, there is a scope to improve the energy efficiency of the existing vessels without modifying the hull form. The present study aims to integrate a wake equalizing duct to an existing bulk carrier ship in Bangladesh to reach this goal by utilizing an open-source framework. A systematic verification and validation study are performed for the JBC test case after that, a stepped design evaluation process is followed to reach the optimum shape of the WED, which is further incorporated in the inland bulk carrier ship.
2. Methods
The study starts with validation and verification of CFD code. An open-source CFD toolkit, OpenFOAM version 11 is used for all the numerical simulations. The simulations are run at calm water condition. For JBC test case 2 DOF (heave and pitch) is given. An inbuilt library named libsixDoFRigidBpdyMotion is used to accommodate the hull motion. Actually, the mesh morphing technique is used for the motion of the hull. A three-stage design process is followed to improve the design of the reference wake equalizing duct. Since there is no experimental data available for the inland bulk carrier ship, only priority is given to resistance results. Hence, simulations for inland bulk carrier ship are run under static condition.
2.1. Solver
The solution technique in OpenFOAM has already been described by Jasak in 2009 [12]. The governing equations in OpenFOAM are based on continuity equation and Navier-Stokes equation for incompressible flow. The continuity and Navier-Stokes equations are given by:
Where, is the density of the fluid, is the velocity vector, t is time, p is the pressure, is the gravitational acceleration, ∇ is the gradient operator, and is the Laplacian operator.
The Volume of Fluid (VOF) method [13] is used to model the multiphase case. The free surface is captured using the following equation:
Here, vary between 0 and 1. For free surface = 0.5.
The governing equations are discretized by the finite volume method (FVM). Pressure velocity coupling is obtained by the PIMPLE [14] algorithm, which is a combination of the SIMPLE and PISO algorithms. There are several turbulence models available in Open-FOAM. For the present study, the Reynolds averaged stress SST k-omega turbulence model [15] is used.
2.2. Turbulance Parameters
Turbulence parameters used in the study are calculated by Labanti et. al. [16] defined by the following equations:
Where, I is turbulence intensity, is Reynolds number, u is fluid velocity, k is turbulence kinetic energy, is boundary layer height, l is ship length, is specific turbulence dissipation rate, is turbulence kinetic eddy viscosity, and is an empirical constant.
2.3. Boundary Conditions
The inbuilt boundary condition for multiphase simulation in OpenFOAM is used in the current study. For the velocity field, the inlet, outlet and the hull are defined as constant velocity (fixedValue), mean flow velocity with non-return inflow (outletPhaseMeanVelocity) and movingWallvelocity respectively. Regarding the pressure field, the inlet, outlet and hull are defined as fixedFluxPressure, zeroGradient and fixedFluxPressure correspondingly. For top boundary (atmosphere) the velocity field is defined as pressureInletOutletVelocity and the pressure field is defined as totalPressure. A non-reflecting type symmetryPlane boundary condition is used for sides and bottom, as all the simulations are considered as deep-water condition. Since it is a multiphase simulation so, the apla.water condition is applied to the boundaries. The value of alpha is 0.5 for free surface. For alpha.water boundary condition the inlet is defined as fixedValue, the outlet is defined as variableHeightFlowRate, the atmosphere is defined as inletOutlet and the hull is defined as zeroGradient. For turbulence parameters, the inlet, outlet and top boundaries are defined as zeroGradient. For the hull WallFunction is used regarding turbulence parameters. Details about the boundary conditions are defined in OpenFOAM’s website.
2.4. Meshing
The size of domain for numerical simulation mainly depends on the type of simulation and the physical phenomenon to be represented. For the present study the calm water simulation is performed following the ITTC-2011 [17] guidelines. The inlet of the domain is placed one ship length from the fore perpendiculars, the outlet of the domain is placed two ship length from the aft perpendiculars, the side of the domain is placed one and half ship length from the centerline of the ship model for proper generation of kelvin wave pattern. The bottom and top (atmosphere) of the domain are placed one and half ship length and half ship length from the free surface respectively. Only half hull is simulated to reduce the computational time. General mesh distribution inside the domain and the hull are shown in Figure 1.
The simulation domain for all the simulations are created using OpenFOAM’s built in mesh generation utilities like blockMeshDict, topoSetDict, refineMeshDict and snappyhexMeshDict. The blockMeshDict is used to generate hexahedral block and boundary of the domain. The topoSetDict is used to define a region in the domain which will be further used by refineMeshDict for refinement by splitting the cells equally half in x and y directions. Six successive refinements are done depending on the complexity of the geometry. Grid density near the draft of the ship in z direction is increased to capture the free surface. Next, the snappyhexMeshDict is used to accommodate the hull into the domain, generating three-dimensional body-fitted unstructured meshes around the hull surface. Three boundary layers are created around the hull for proper capturing of the viscous effect. Grid density around the bow and stern of the hull is increased. Since wall function is used so, the y+ value is kept between 30 and 300. The mesh configuration for fine, medium and coarse grids are shown in Table 1 below.
The mesh configuration of JBC hull with WED is shown in Figure 2.
Additional local refinement is done around the duct and strut where the grid density around the other parts of the hull is kept same with and without duct. This increases the overall cell no. to 2.6 million.
2.5. Computational Resources
A desktop computer is used to run the simulations. It has a single node 8-core Intel (R) Core i7 processor, 16 GB of DDR4 RAM, and 2 GB of integrated graphics. Simulations for the JBC hull are run up to 60 seconds to get a stable result, and simulations for the inland bulk carrier ship are run up to 40 seconds for convergence. The required computational time for the present set up is about 24 to 96 hours depending on the case type. The simulation convergence curves are shown below in Figure 3 and Figure 4.
3. Results
The study presents a three-step design evaluation process of a WED (wake equalizing duct) as an ESD (energy saving device) to reduce the resistance of bulk carrier ships. First, the JBC test case is validated with experimental results provided by NMRI. This includes both a bare hull and a hull integrated with a wake equalizing duct. Three key design parameters (camber, position of maximum camber and angle of attack) of the sectional hydrofoil profile of the duct are altered within a specified range in each design phase, respectively. After that, a shape providing minimum resistance is selected as the optimum one. Finally, that shape is incorporated into an inland bulk carrier ship of 4000 DWT capacity. The analysis of the inland bulk carrier is carried out at both design and off-design speeds.
3.1. The JBC Test Case
The test case hull was developed by NRMI (National Maritime Research Institute) in 2015. It is a capesize slow streaming bulk carrier ship having round bilge, flat bottom, blunt bow and transom at the aft. Experimental studies were carried out at 1:40 scale model. The principal particulars of the hull is mentioned in Table 2 .The profile view and sectional view of the hull are shown in Figure 5.
In the present study both JBC hull without and with ESD are studied. The ESD is mainly a wake equalizing duct having sectional hydrofoil profile belonging to NACA 4-digit family (NACA 4420). The hydrofoil section is aligned with 20-degree angle with the horizontal plane. The duct is located ahead 0.25 % Lpp from the propeller plane. The inner and outer diameter of the duct are 55 % and 30 % of the propeller diameter respectively. The side view of the duct near the stern of the hull is shown in Figure 6.
3.2. Verification and Validation Study
Now a days the ship design industry depends on CFD analysis to a great extent. However, the accuracy and consistency of the CFD codes are still questionable due to lack of knowledge and its continual development. Verification study is performed to check the consistency of computer code where validation study confirms that the physical phenomenon is accurately implemented in computer code. It should be noted that verification study is case independent extensively used in scientific computing problem. On the other hand, validation study is case specific. The validation of JBC hull is carried out at Froude number 0.142 without duct and with duct against the experimental result provided by NMRI [18]. For validation study resistance coefficient, trim and shinkage are considered. Validation of JBC hull with and without duct with experimental results are shown in Table 3 and Table 4 respectively.
The numerical results show very close approximation with experimental results specially for total resistance coefficient. However, small deviation is observed for trim and sinkage. The possible reasons are exact location of COG (center of gravity) in experimental condition of the model are not known and insufficient mesh resolution. Increasing mesh resolution in z-direction may improve the results.
The verification study is performed using Celik et al. [19]. To the authors best knowledge the method proposed by Celik et al. is popular among the researchers and used in hundreds of CFD cases. The reason behind choosing of the method is that ITTC [20] provides the equation for calculation of order of accuracy (p) only for monotonous convergence.
Firstly, the convergence of the numerical solutions has been performed. For convergence study a systematic grid refinement ratio has been used to produce at least three solutions. Though there is no appropriate value for industrial CFD application but care should be given. Too small value may cause insignificant change among the solutions, where larger value may leads to higher computational time due to finest grid size. Stern et. al. [21] recommended r= for industrial application and Roache [22] showed that even 1.1 is enough for simple cases. For our study, a uniform grid refinement ratio r=1.187 has been used. The verification study for JBC hull test case is mentioned in Table 5.
Here, , and define the solutions for fine, medium and coarse grid respectively.The relative difference between the medium-fine and coarse-medium grid’s solutions are represented by , respectively. The grid convergence ratio is estimated by the following equation:
For monotonic convergence, oscillatory convergence and divergence.The order of accuracy (p) and grid convergence index are estimated using the following equations:
Where,
For constant grid refinement ratio, .
Where, approximate relative error .
Similarly, is estimated.
Here, total resistance coefficient and trim show oscillatory convergence, where the sinkage shows divergence. However, lower value of GCI indicates the reliability of numerical results.
3.3. Design Evaluation of ESD
The design evaluation of an energy-saving device requires an efficient fluid dynamics solver, parametric description of duct geometry and a stepped design process. In the present study, three-stage stepped design process has been considered. Only the sectional hydrofoil shape of the wake equalizing duct is parametrized by camber, position of maximum camber and angle of attack (AoA). Since the original duct profile belong to NACA 4-digit family so, the study is limited to 4 digit foamily only. The three parameters are varied in a range mentioned detailed in Table 6. Total 13 shapes are generated along with original (NACA 4420 5 deg. AoA) shape shown in below Figure 7.
Camber of the NACA section is varied from 0 to 6 % of chord length with 2 % of interval, position of maximum camber is varied from 30 % to 70 % with an increment of 10 % and only 5 variation of angle of attack is considered 2.5, 5, 10,15,20,25 degrees respectively. The results obtained from each design stage are shown in the below Figure 8.
The decrement of the total resistance coefficient () is seen up to 2 % of camber, after that it increases sharply. An oscillatory graph is obtained for the variation of the position of the maximum chamber. The minimum resistance coefficient is observed at 5 degree AoA, then a stepped increment is observed up to 15 degree AoA, after that a sudden increment occurs up to 25 degree AoA. The improvement of resistance achieved by the WEDs through CFD analysis are shown in Table 7.
The improvement of resistance of the WEDS is with respect to bare hull resistance based on CFD analysis. Here, all the shapes excluding NACA 0020 (20 deg. AoA) and NACA 2620 (25 deg. AoA) show better result than the reference shape NACA 4420 (20 deg. AoA). The possible reasons are camber and angle of attack. In case of NACA 0020 (20 deg AoA) shape is symmetrical but cambered profile is important to accelerate the flow towards the propeller and to avoid the flow separation. NACA 2620 (25 deg. AoA) instead of reducing the resistance, shows detrimental effect on resistance due to severe flow separation for higher angle of attack. After the three design evaluation stages, among the 13 different shapes maximum reduction in resistance is possible with NACA 2620 (5 deg. AoA) hydrofoil shape up to 2 %. So, it is considered as an optimal WED based on the present study. A comparison of total resistance of the optimal WED with original shape (NACA 4420 20 deg. AoA) and bare hull is shown in Figure 9 .
4. Discussion
The main effect of wake equalizing duct is to accelerate the flow toward the propeller, reduce the non-uniformity of the wake field and flow separation. In the current study, only the bare hull is considered. Although the investigations are carried out without a propeller, the study will still help researchers to understand how the flow field will affect the performance of the propeller. For a better understanding of energy energy-saving mechanism of wake equalizing duct the nominal wake field and the pressure distribution on duct are analyzed.The nominal wake field of bare hull and hull with original duct (NACA 4420 20 deg. AoA) are illustrated below Figure 10:
The wake field of the JBC hull without (a) and with duct (b) is shown above. Low velocity field is more pronounced near the core in the wake field in the case of a hull with a duct. In case of hull with WED, the flow is accelerated towards the propeller plane, and the low velocity core is diminished. However, the low-speed area at the bottom of the propeller is not eliminated. The homogeneity of the wake field about the upper and lower sides of the propeller is not achieved yet. These findings show the necessity of improving the design of the WESD.The comparison of nominal wake field between original duct (NACA 4420 20 deg. AoA) and optimal duct NACA 2620 (5 deg. AoA) is shown below in Figure 11
One of the main objectives is to integrate the wake equalizing duct with the hull is to compensate the upper and lower asymmetry of bare hull wake field. The homogeneity of the wake field is obtained in the upper and lower parts of the propeller with WED 2620 (5 deg AoA). A noticeable acceleration effect is observed inside the duct radios than the original shape. The low velocity U-shaped region at the lower part of the duct is still not completely eliminated, but this time the scenario is somehow better. However, a very small core of low velocity region is noticeable at the center due to the separation of the flow. The wake equalizing duct providing minimum resistance of the ship from each design phase has been analyzed along with original duct for a better understanding of the energy-saving mechanism. The evidence of the acceleration effect of the duct is pronounced in the pressure distribution over the duct surface is illustrated in Figure 12.
From the above pressure field analysis, it is seen that the stagnation point almost coincides with the leading edge of the ducts. The region of lower pressure is prolonged from the leading edge to the inner surface. At the inner surface of the ducts, the effect of acceleration is dominant, but it does not noticeably decline at the outlet of the duct, which facilitates the flow to go to the outlet without any separation. This is the crucial point of design, that how the camber of the section is adjusted inside the duct to provide a suction effect to guide the flow to the propeller. A small area of low pressure outside the duct surface near the leading edge is seen, which is difficult to eliminate due to the non-circular shape of the wake distribution. This is evident that flow is accelerated not only inside the duct but also outside the duct. The optimal duct NACA 2620 (5 deg. AoA) has considerably much lower pressure near the leading which significantly accelerate the flow and reattached the flow separation.
5. Case Study of an Inland Bulk Carrier
The presently studied bulk carrier is a RINA-class existing bulk carrier ship plying in Bangladesh. The capacity of the ship is 4000 DWT and the design speed is 10 knots. The hull form is fuller with a blunt bow and transom stern. The vessel is propelled by twin screw propeller. The numerical simulations are performed at a 1:20 scale model. The specifications of the ship is mentioned in the Table 8 and the profile and sectional views are shown in Figure 13.
A similar type of computational domain is used for the numerical simulation as the JBC hull. The same type of boundary condition and mesh topology is used. However, for the study of inland vessels the simulations are performed at static condition. The main focus is given to the results of resistance.The mesh assembly and the mesh configuration for three different meshes (fine, medium and coarse) are mentioned in Table 9 are shown in the Figure 14 and Table 9 respectively.
It is unfortunate that, no experimental data for the inland bulk carrier hull is currently available which limits the study. So, a systematic verification study is performed. Three different mesh resolutions have been selected for the verification study with a uniform refinement ratio of 1.187. The verification study of the inland bulk carrier at Froude number 0.184 is mentioned in Table 10.
The lower values of GCI (Grid Convergence Index) for (viscous resistance), (pressure resistance) and (total resistance) suggest that the numerical estimations are quite reliable. For the simulations medium mesh resolution have been used.
The density of the mesh is increased near the duct like JBC hull with the WED case which increases the cell no. to 1.93 million. The general mesh assembly for inland hull with WED shown in Figure 15 .
The wake equalizing duct having sectional hydrofoil shape of NACA 2620 (5 deg. AoA) which provide minimum resistance in case of JBC hull is selected for present study. The duct is placed at 0.25 % ahead of the propeller plane. The side view of inland bulk carrier with WED is shown in Figure 16.
The result of the flow field analysis for the inland bulk carrier is shown in the Figure 17 below.
Only the port side of the ship is simulated so the wake field at the port side is shown. From the nominal wake field analysis significant increase in flow velocity is noticeable, especially at the lower part of the duct’s radius. The flow towards the stern of the hull is a combination of flow consisting of bilge vortices and flow passed by the hull. From velocity field analysis, it is seen that the straightening of the flow is seen near the stern of the hull. The complicated bilge vortices are reduced, which significantly controls the flow separation. However, the flow is accelerated more at the lower part than the upper part, which is opposite to the JBC hull. The possible reason is a difference in the stern tube shape.
In the present study, besides the design speed of 10 knots, off-design speeds 8 knots (-20 %) and 12 (+20 %) knots are also considered to check the validity of the proposed design. The speeds 8,10 and 12 knots correspond to Froude numbers 0.147, 0.184 and 0.220, respectively. Comparison of resistance hull without and with ESD (energy saving device) is shown in below bar chart diagram below in Figure 18.
The wake equalizing duct reduces the resistance at design speed as well as off-design speeds. The reduction of resistance is a maximum of 5 %, especially at a low fFroude number 0.147 which corresponds to speed of 8 knots. A probable explanation of this nature of the duct is that at low speed, flow separation is more vulnerable. So, wake equalizing duct provides its best performance instead of having an optimized shape, particularly for this inland bulk carrier.
6. Conclusions
In the present research, the performance of a wake equalizing duct has been evaluated systematically. The wake equalizing duct is selected as an energy-saving device due to its simplified geometrical configuration. Three different parameters, ie, camber, position of max camber and angle of attack of the sectional hydrofoil profile of WEDs have been varied within a defined range, one at a time across the three stages of the study. A base reduction of bare hull resistance up to 2 % is possible with the best configuration (NACA 2620 5 deg. AoA). Among the three parameters, the influence of AoA is much more significant in reducing the resistance of the ship. Though the complete elimination of the low velocity region is not possible with that shape but the improvement in inflow velocity and upper and lower symmetry of the wake field is noticeable than other cases.
In the next section, a wake equalizing duct having the same sectional hydrofoil shape (NACA 2620 5-deg. AoA) has been integrated into an inland bulk carrier ship. Due to the unique nature of inland waterways (shallow depth, current speed in monsoon, heavy marine traffic) and time-limited voyage schedule, it is not possible to maintain the design speed of the vessels. As a result, off-design speeds are also considered. After incorporating the WED into the bare hull, the maximum reduction in resistance up to 5 % is achieved at Froude number 0.147 corresponding to a speed of 8 knots. Which is good enough for such a fuller ship. A noticeable detrimental effect on flow separation is observed at low speeds, opposing the behavior at high speeds. In case of an inland bulk carrier ship, the experimental data is not available, so a verification study is performed, showing reasonable consistency in the numerical solutions.
However, the present study is not free of limitations. The study is performed in a limited mesh resolution, which may affect the results qualitatively. Besides, the propeller and rudder are not considered, which may seem unrealistic with respect to a real-life scenario. So, it is recommended to incorporate the propeller and rudder in future studies.
Author Contributions
Conceptualization, S.S.S. and M.M.R.; methodology, S.S.S. and M.M.R.; software, S.S.S.; validation, S.S.S. and M.M.R.; formal analysis, S.S.S. and M.M.R.; investigation, S.S.S. and M.M.R.; resources, M.M.R.; data curation, S.S.S. and M.M.R.; writing—original draft preparation, S.S.S.; writing—review and editing, M.M.R.; visualization, S.S.S.; supervision, M.M.R. All authors have read and agreed to the published version of the manuscript.
Funding
This research received no external funding.
Institutional Review Board Statement
Not applicable.
Informed Consent Statement
Not applicable.
Data Availability Statement
The generated data for the study are presented within the article.
Conflicts of Interest
The authors declare no conflicts of interest.
References
- International Maritime Organization. Guildelines on the Method of Calculation of the Attained Energy Efficiency Desing Index (EEDI) for New Ships, Annex 5, Resolution MEPC.245(66); International Maritime Organization; London, UK, 2014.
- Yasuhiko, I.; Masahiro, I.; Yasuhiro, S.; Takeshi, T.; Fumitoshi, O. Energy Saving Device for Ship – IHIMU Semicircular Duct. Ishikawajima-Harima Eng. Rev. 2007, 40, 59–63. [Google Scholar]
- Shin, H.-J.; Lee, J.-S.; Lee, K.-H; Han, M.-R; Hur, E.-B., Shin. Numerical and experiment investigation of conventional and un-conventional pre swirl duct for VLCC. Int. J. Nav. Archit. Ocean Eng. 2013, 05, 414–430. [Google Scholar] [CrossRef]
- Sun, T.; Yin, J.; Wu, D.; Wan, D. Numerical computations of resistance for japan bulk carrier in calm water. In Proceedings of the Tokyo 2015 CFD Workshop, Tokyo, Japan, 2-4 December 2016. [Google Scholar]
- Visonneau, M.; Deng, G.; Quenty, P.; Guomineau, E.; Lorens, A.D.T. High-Fidelity Computational Analysis of an Energy-Saving Device at Model. In Proceedings of the Hull Performance and Insight Conference, Turin, Italy, 13-15 April 2016. [Google Scholar]
- Martinas, G.; Cupsa, O.S. Numeric Wake Equalizing Duct Geometry Optimization for a Given Ship. TransNav. 2015, 09, 243–248. [Google Scholar] [CrossRef]
- Wu, P.C.; Chang, W.C.; Huang, Y.C. Design of Energy-Saving Duct for JBC to Reduce Ship Resistance by CFD Method. Energies 2022, 15, 1–21. [Google Scholar] [CrossRef]
- Lee, J.-H.; Kim, M.-C.; Shin, Y.-J.; Kang, J.-G. Study on the Performance of Combined Energy Saving Devices For Container Ship by Experiments. In Proceedings of the Fifth International Symposium on Marine Propulsors, Espoo, Finland, 12-15 June 2017. [Google Scholar]
- Nowruzi, H.; Najifi, A. An experimental and CFD study on the effects of different pre-swirl ducts on propulsion performance of series 60 ship. Ocean Eng. 2019, 173, 142–149. [Google Scholar] [CrossRef]
- Furcas, F.; Gaggero, S.; Vila, D. Duct-type ESD:a design application using RANSE-based SBDO. In Proceedings of the Sixth International Symposium on Marine Propulsors, Rome, Italy, 30 May 2019. [Google Scholar]
- Nicorelli, G.; Villa, D.; Gaggero, S. Pre-Swirl Ducts, Pre-Swirl FIns and Wake-Equalizing Ducts for the DTC Hull: Design and Scale Effects. J. Mar. Sci. Eng. 2023, 11, 1–23. [Google Scholar] [CrossRef]
- Jasak, H. OpenFOAM: Open Source CFD in research and industry. Int. J. Nav. Archi. Ocean Eng. 2009, 01, 89–94. [Google Scholar]
- Hirt, C.W.; Nichols, B.D. Volume of Fluid Method for the Dynamics of Free Boundaries. J. Comput. Phys. 1981, 39, 201–225. [Google Scholar] [CrossRef]
- Holzmann, T. Mathematics, Numerics, Derivations and OpenFOAM(R), 7th ed.; Holzmann CFD: Bad Wörishofen, Germany, 2019; pp. 99–122. [Google Scholar]
- Menter, F.R.; Kuntzm, M.; Langtry, R. Ten years of industrial experience with the SST turbulence model. In Proceedings of the 4th International Symposium on Turbulence, Heat and Mass Transfer, Antalya, Turkey, 12-17 October 2003. [Google Scholar]
- Labanti., J.; Islam, H.; Soares, C.G. CFD assessment of Ropax hull resistance with various initial drafts and trim angles. In Proceedings of the 3rd International Conference on Maritime Technology and Engineering, Heat and Mass Transfer, Lisbon, Portugal, 4–6 July 2016. [Google Scholar]
- ITTC. ITTC-Recommended Procedures and Guidelines: Practical Guidelines for Ship CFD Application (2011). Available online: https://ittc.info/media/1357/75-03-02-03.pdf (accessed on 16 April 2025).
- Tokyo 2015 A Workshop on CFD in Ship Hydrodynamics. Available online: https://t2015.nmri.go.jp/jbc.html (accessed on 16 April 2025).
- Celik, I.; Ghia, U.; Roache, P.J.; Feritas, C.J.; Coloman, H.; Raad, P.E. Procedure of Estimation and Reporting of Uncertainty Due to Discretization in CFD Applications. J. Fluids Eng. 2008, 130, 1–4. [Google Scholar]
- ITTC. ITTC-Recommended Procedures and Guidelines:Uncertainty Analysis in CFD Verification and Validation Methodology and Procedures (2017). Available online: https://www.ittc.info/media/8153/75-03-01-01.pdf (accessed on 16 April 2025).
- Stern, F.; Wilson, R.; Shao, J. Quantitative V & V of CFD simulations and certification of CFD codes. Int. J. Numer. Meth. Fluids 2006, 50, 1335–1355. [Google Scholar]
- Roache, P.J. Verification and Validation in Computational Science and Engineering, 1st ed.; hermosa: New Mexico, USA, 1998; pp. 99–122. [Google Scholar]
Figure 1.
Mesh distribution inside the computational domain and around the JBC hull.
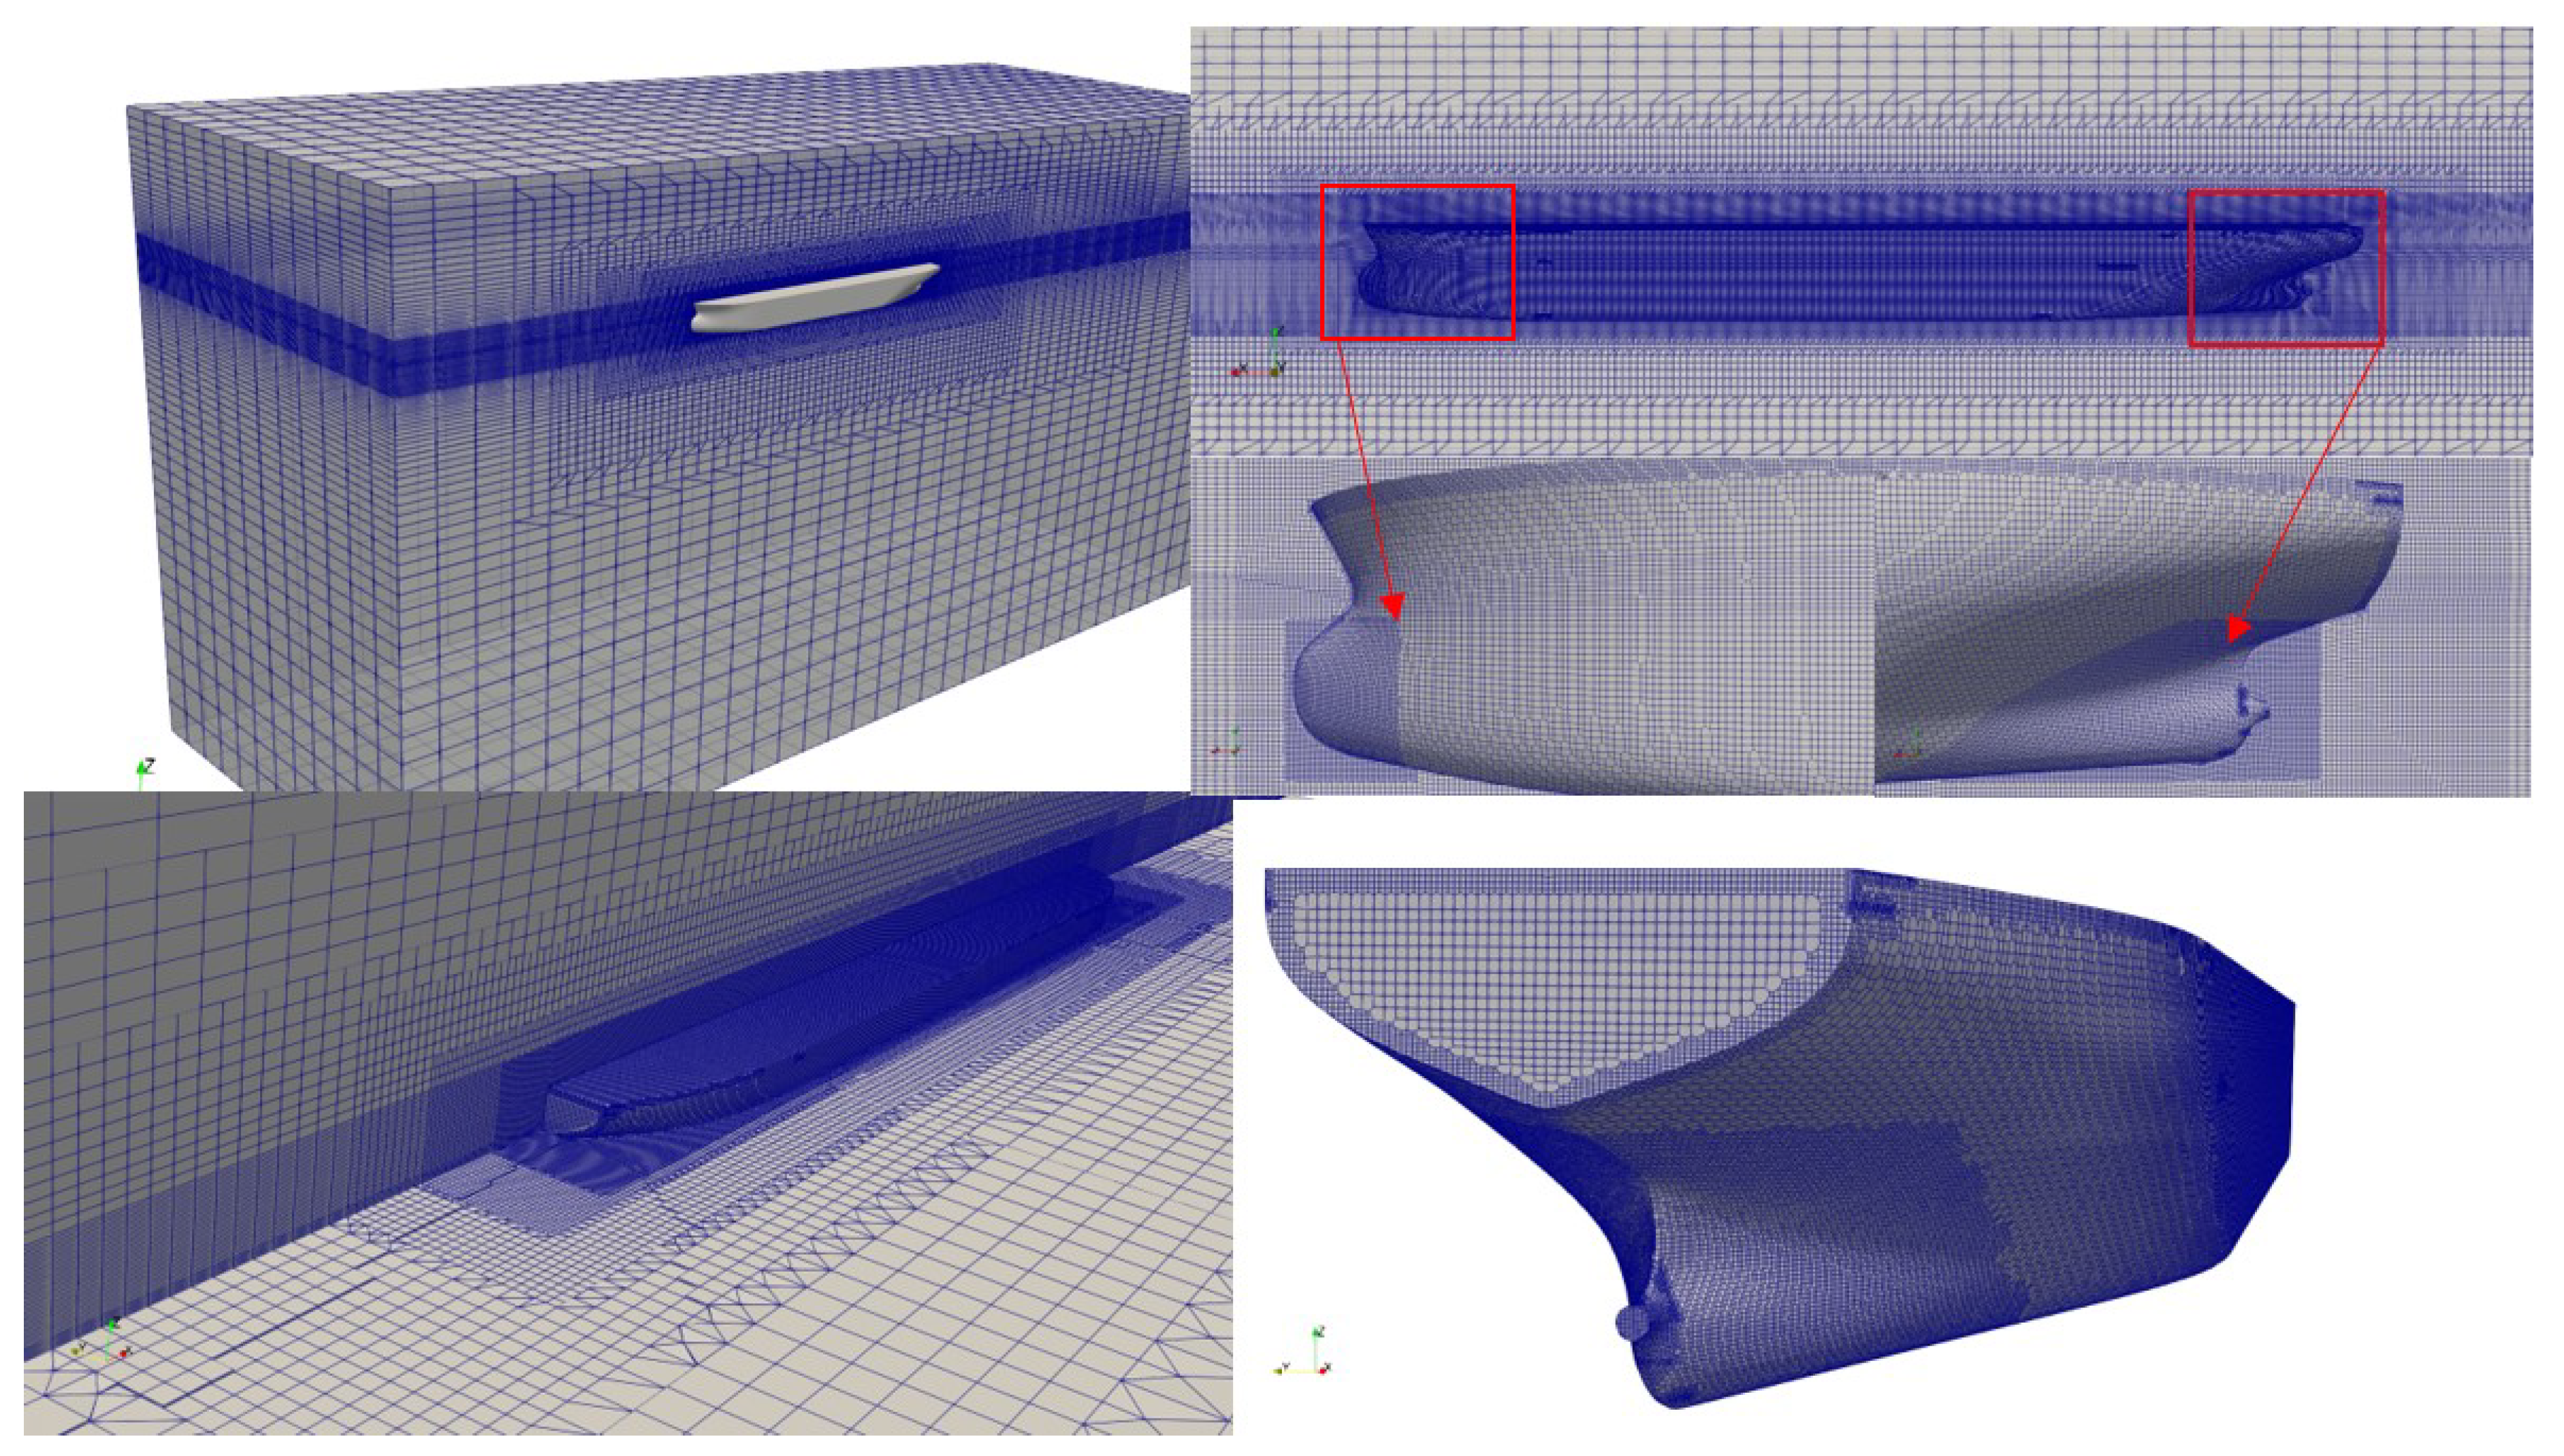
Figure 2.
Mesh distribution inside the computational domain and around the JBC hull with WED.
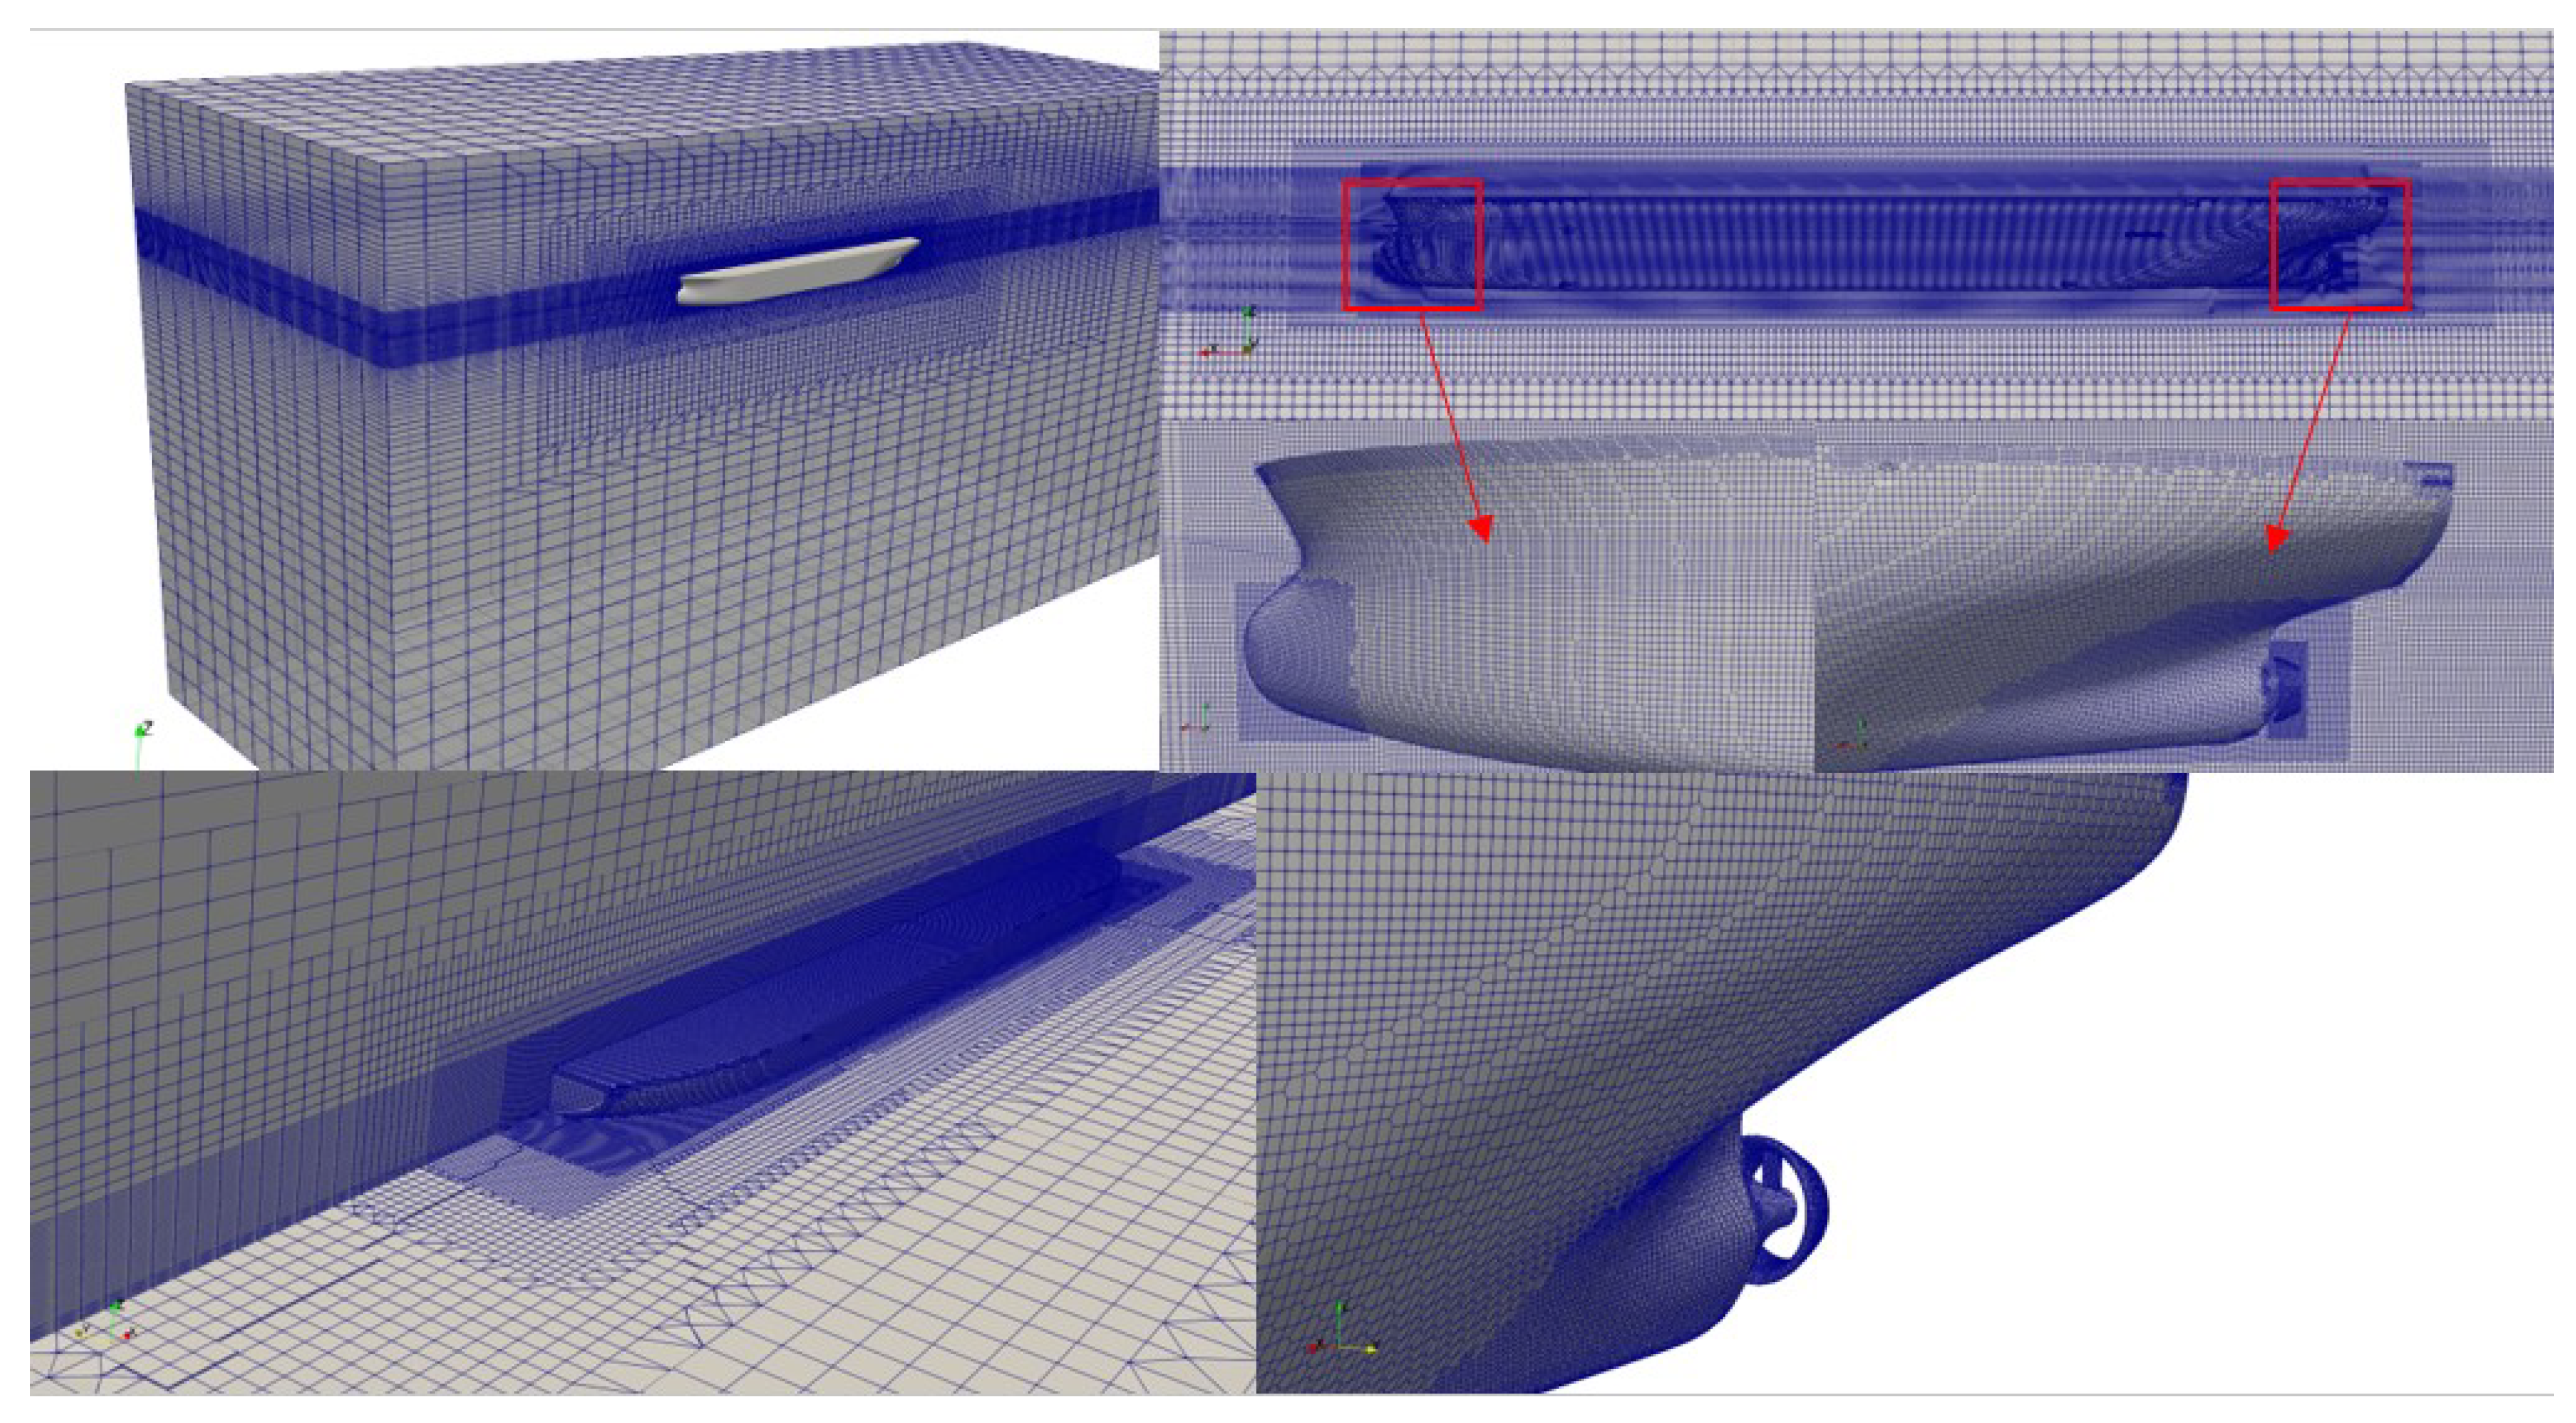
Figure 3.
Simulation convergence curves for (a) JBC hull without WED (b) JBC hull with WED.
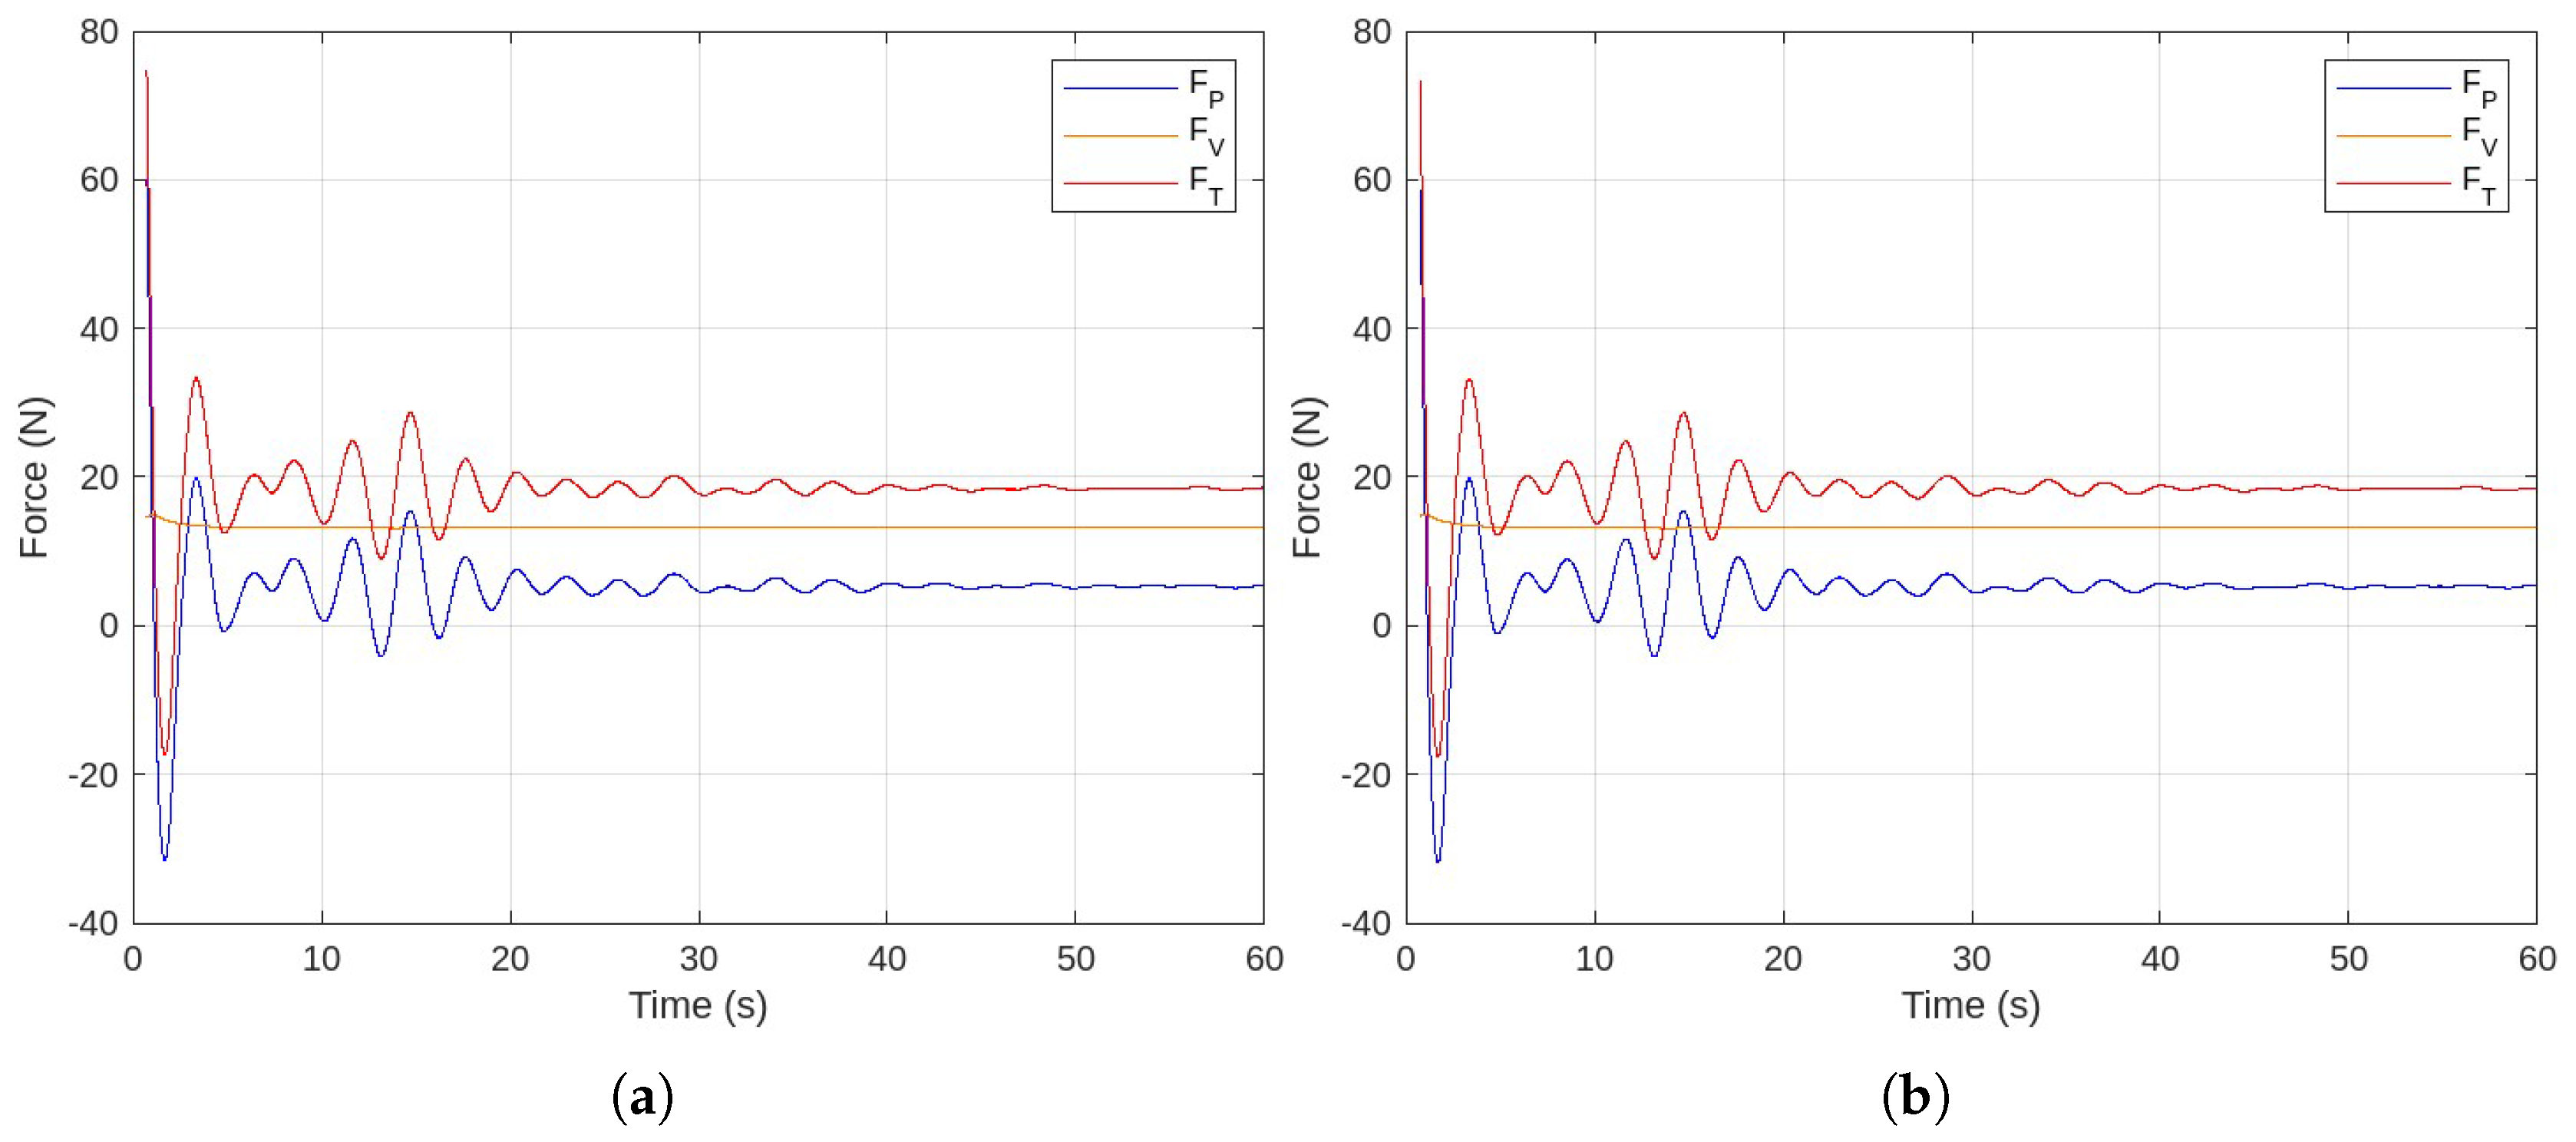
Figure 4.
Simulation convergence curves for (a) inland bulk carrier without WED (b) inland bulk carrier with WED.
Figure 4.
Simulation convergence curves for (a) inland bulk carrier without WED (b) inland bulk carrier with WED.
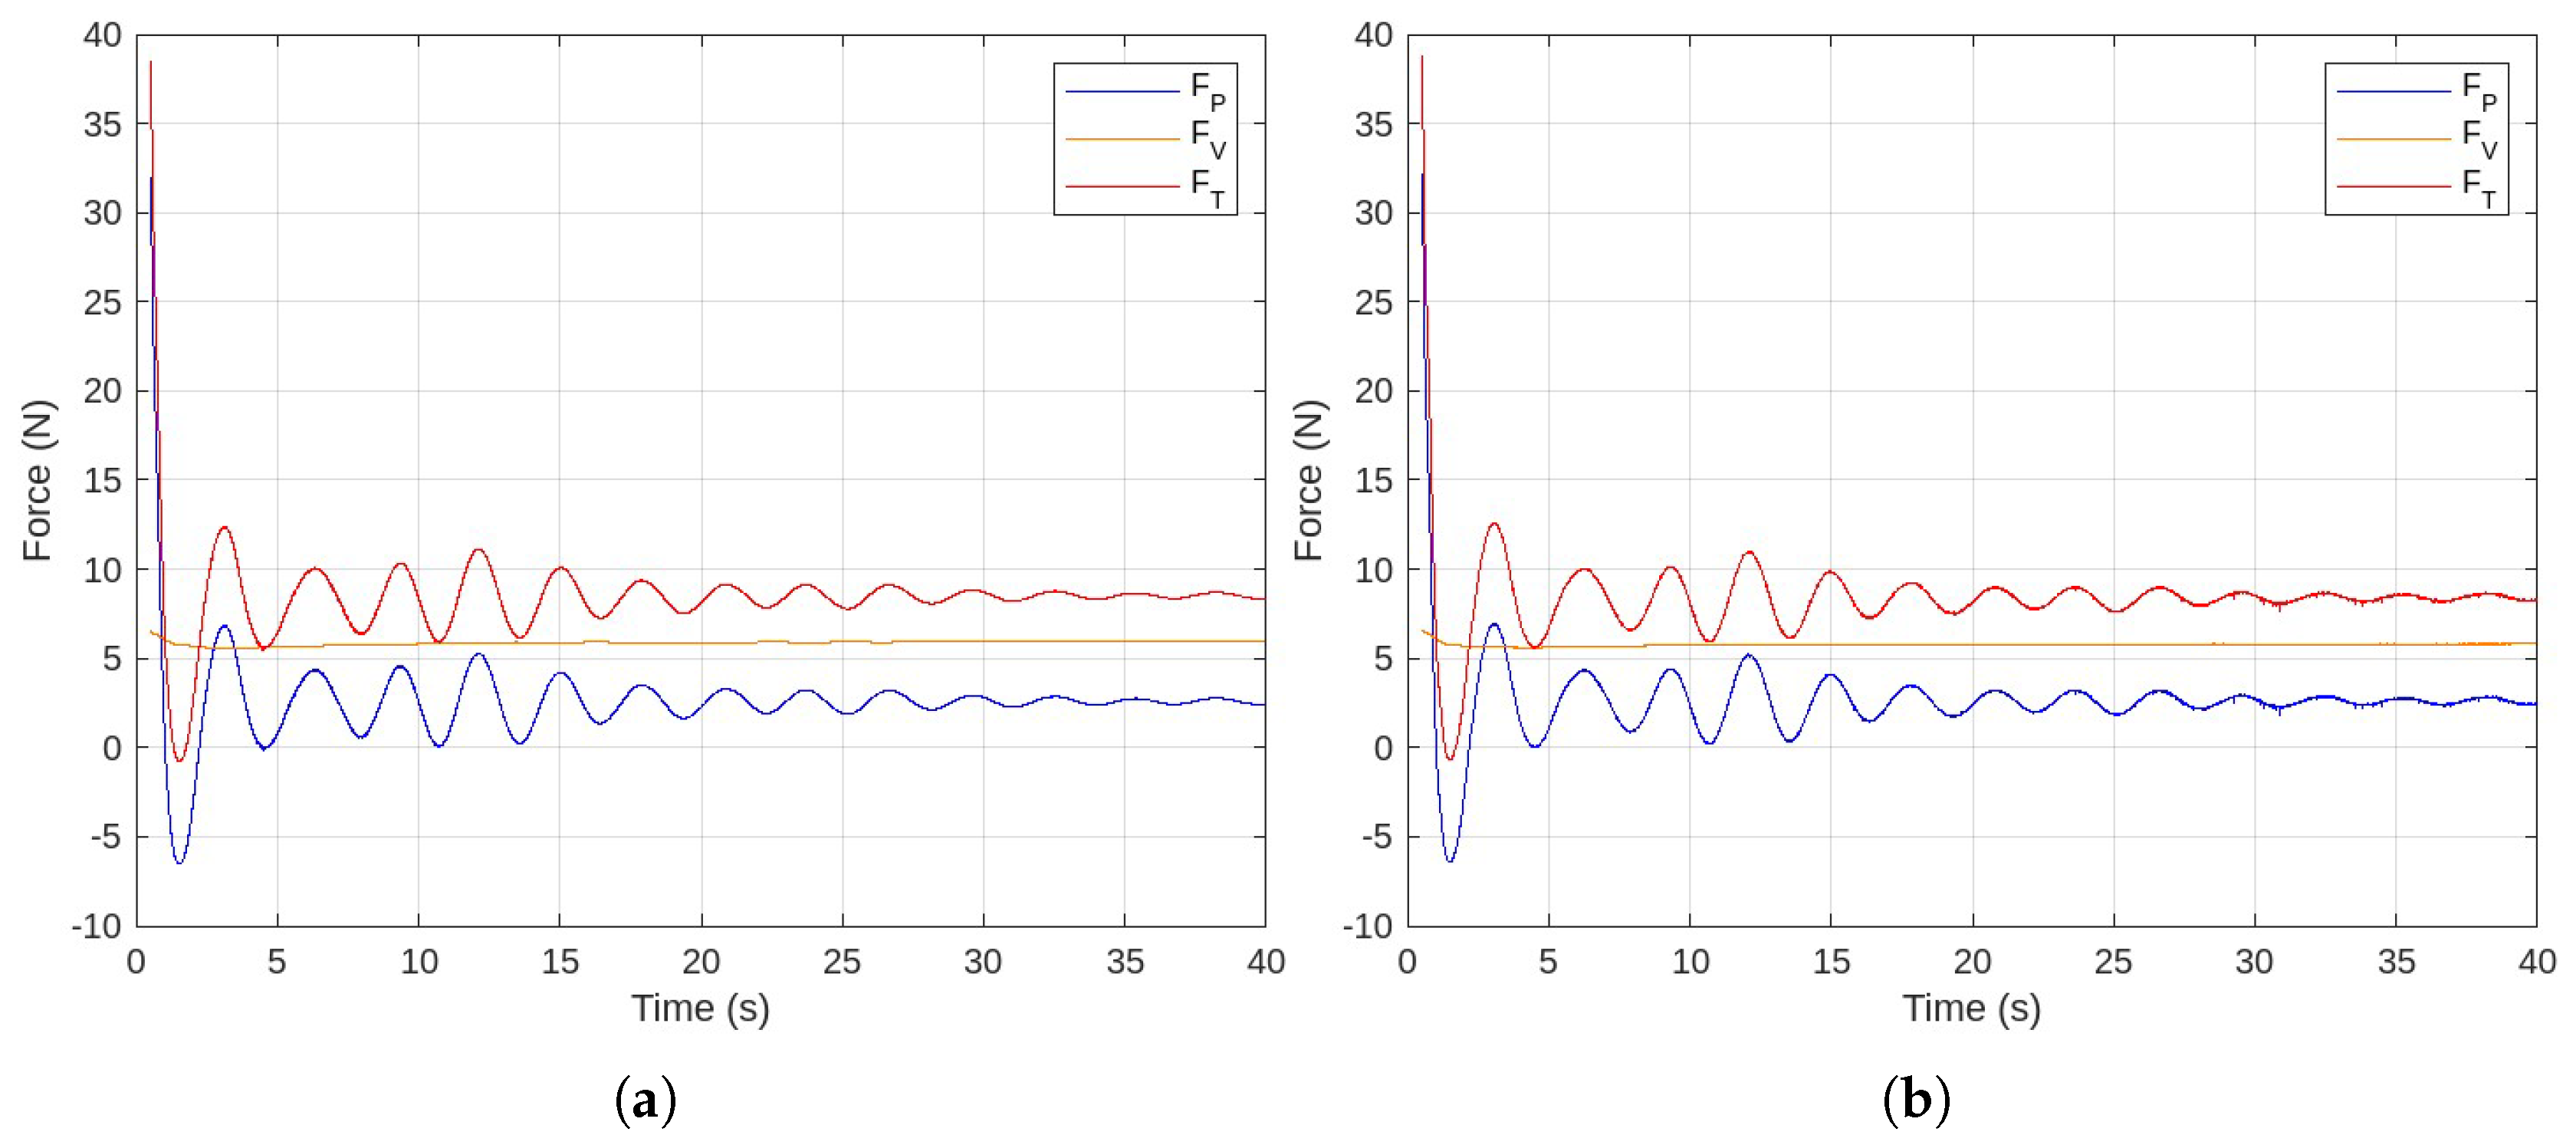
Figure 5.
(a) Profile view and (b) body plan of JBC hull.
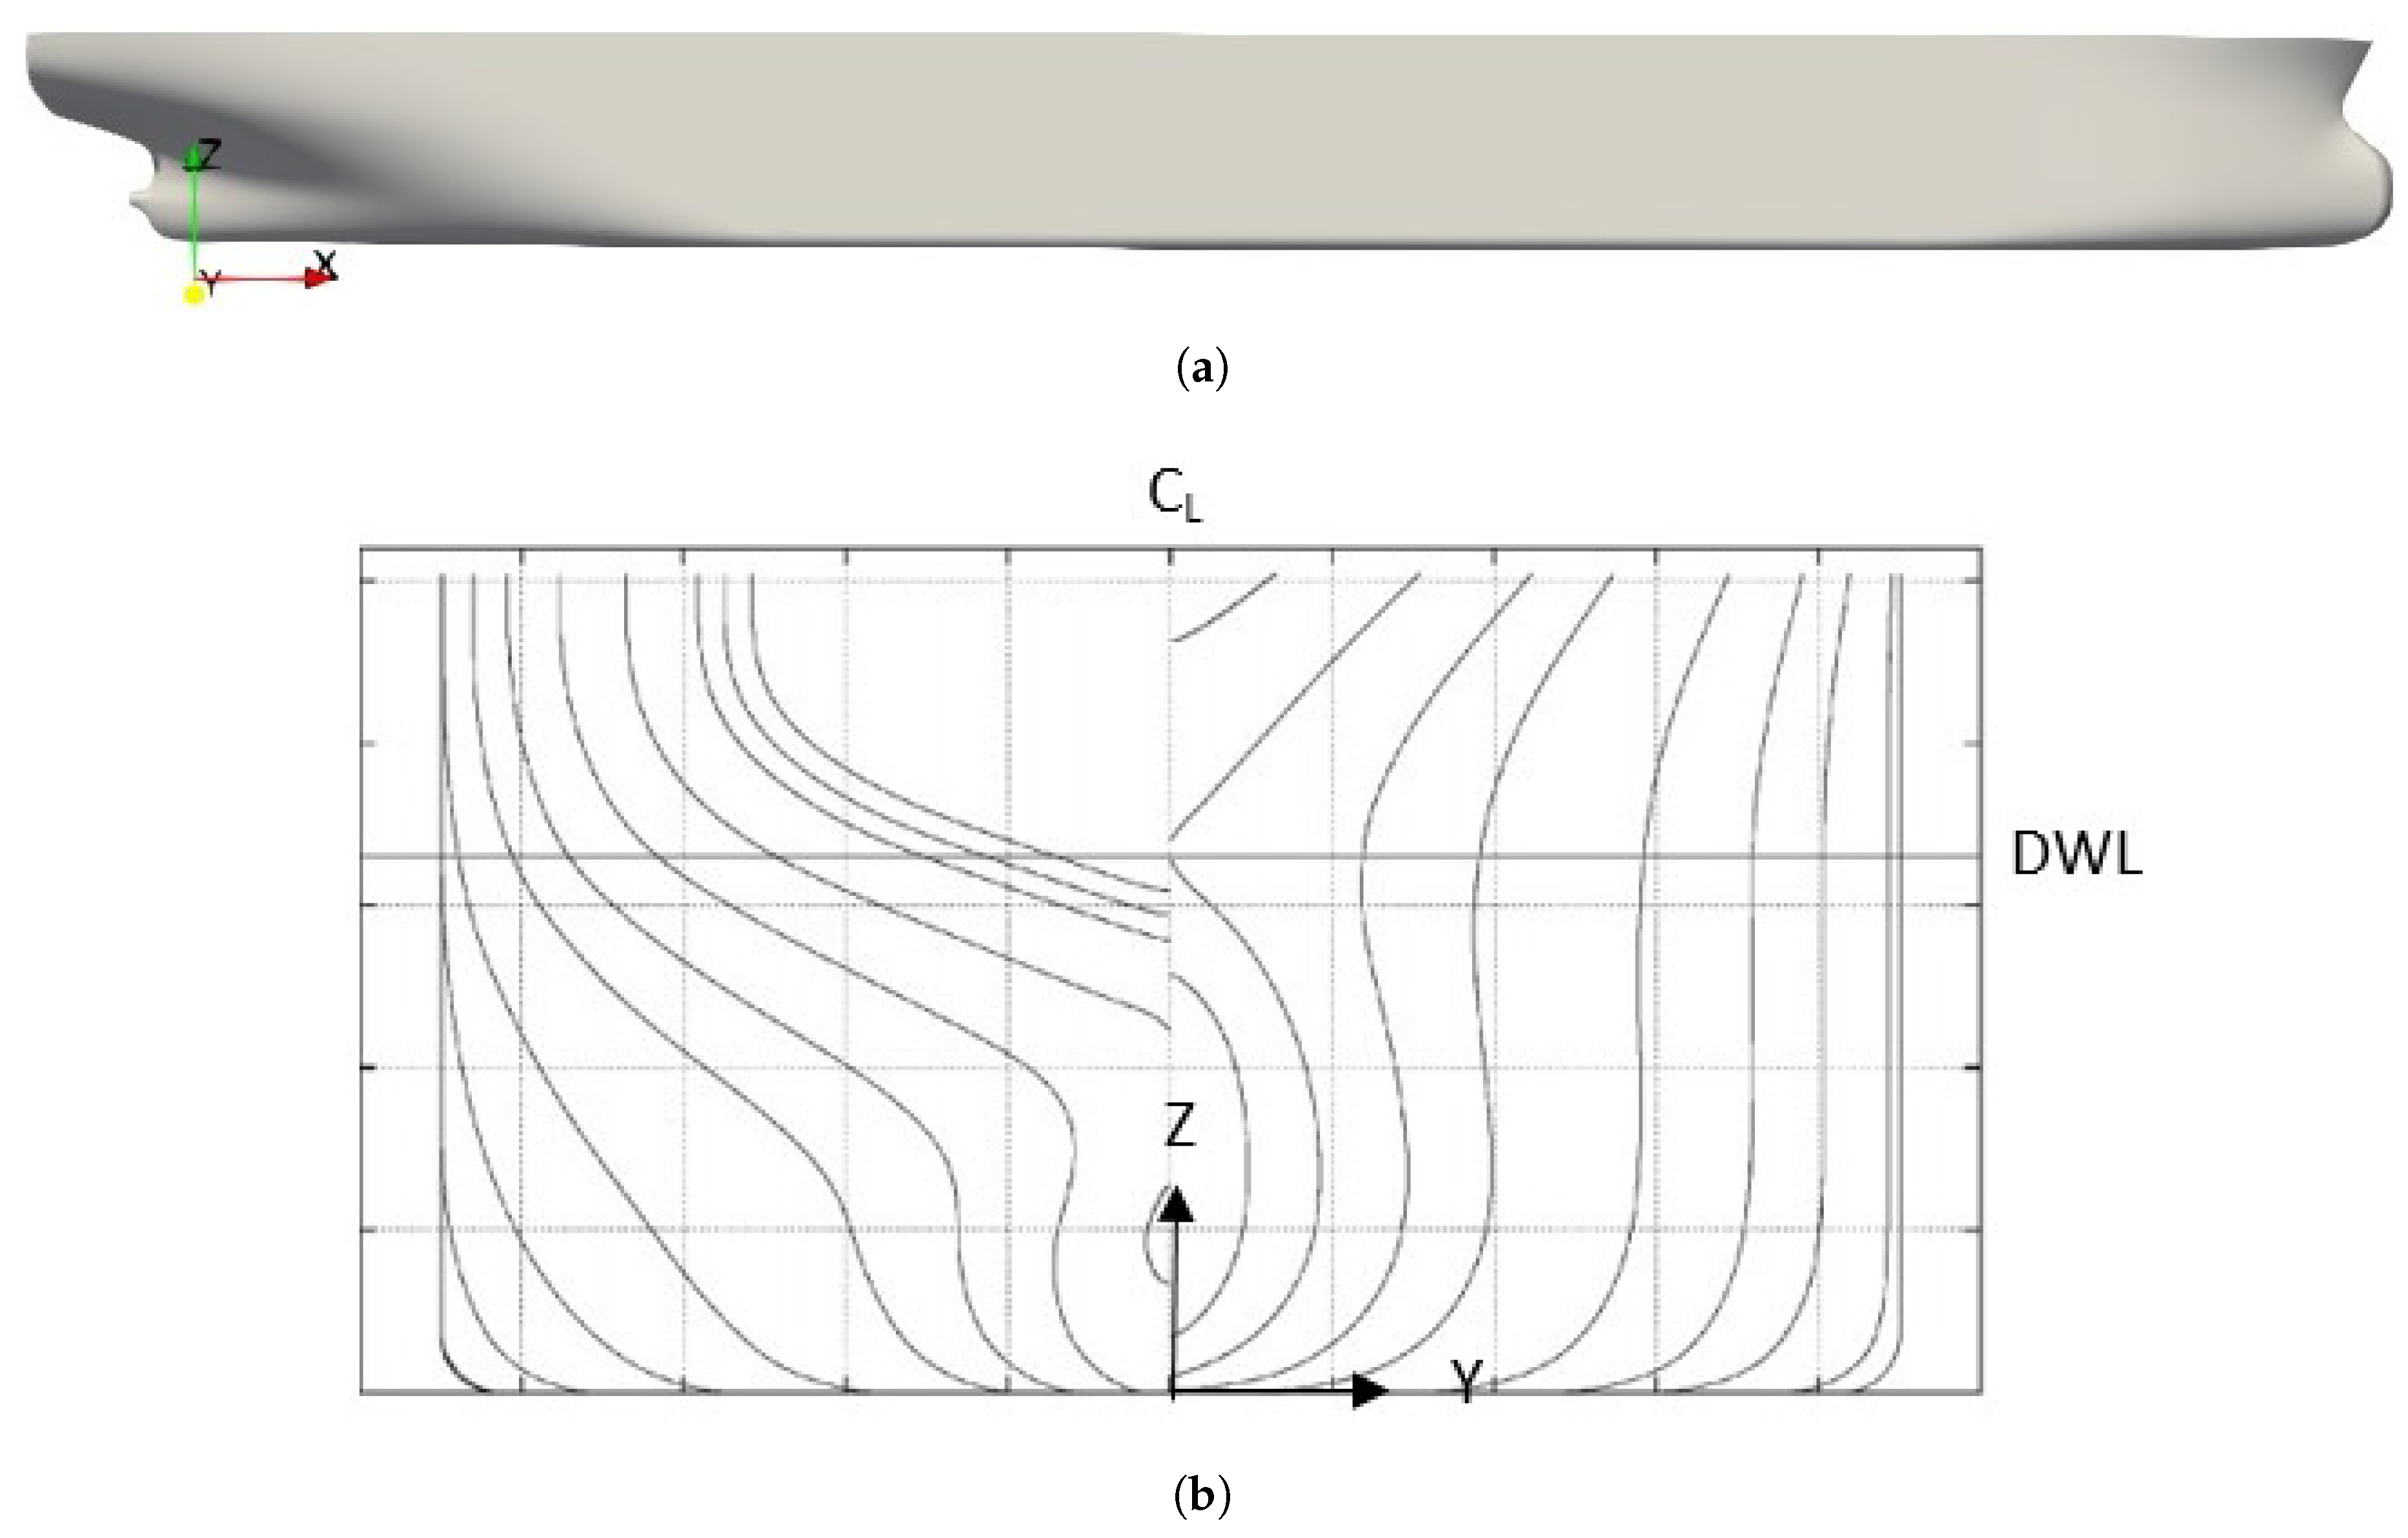
Figure 6.
Side view of wake equalizing duct near the stern of JBC hull.
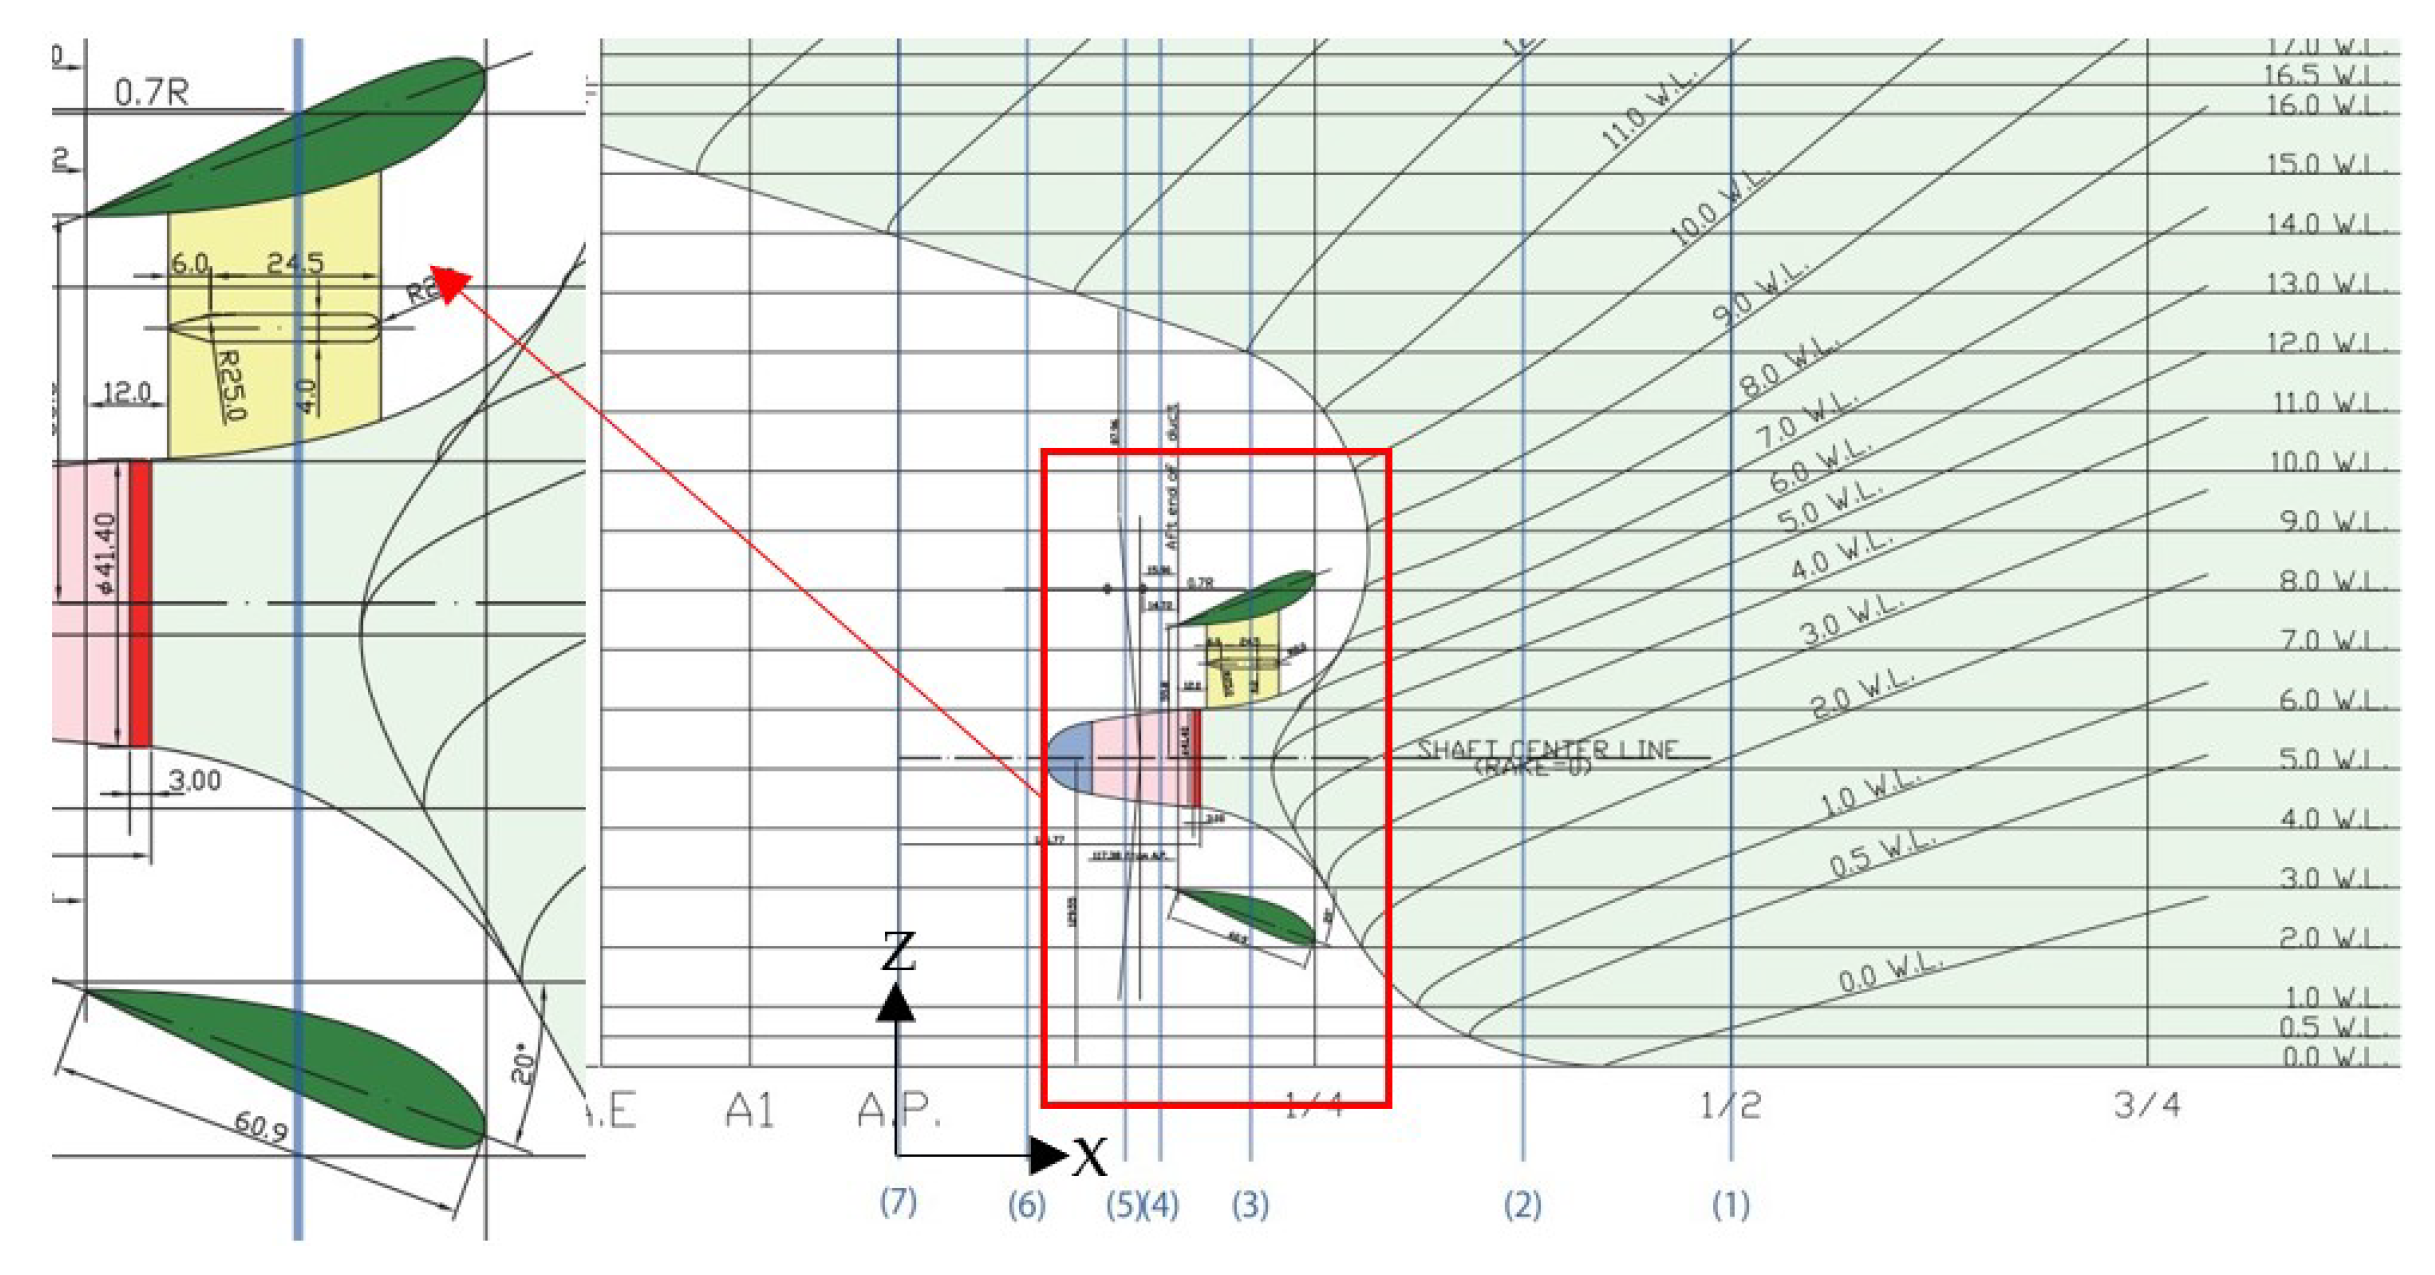
Figure 7.
Designed sectional shape of WED from (a) design stage 1 (b) design stage 2 and (b) design stage 3.
Figure 7.
Designed sectional shape of WED from (a) design stage 1 (b) design stage 2 and (b) design stage 3.
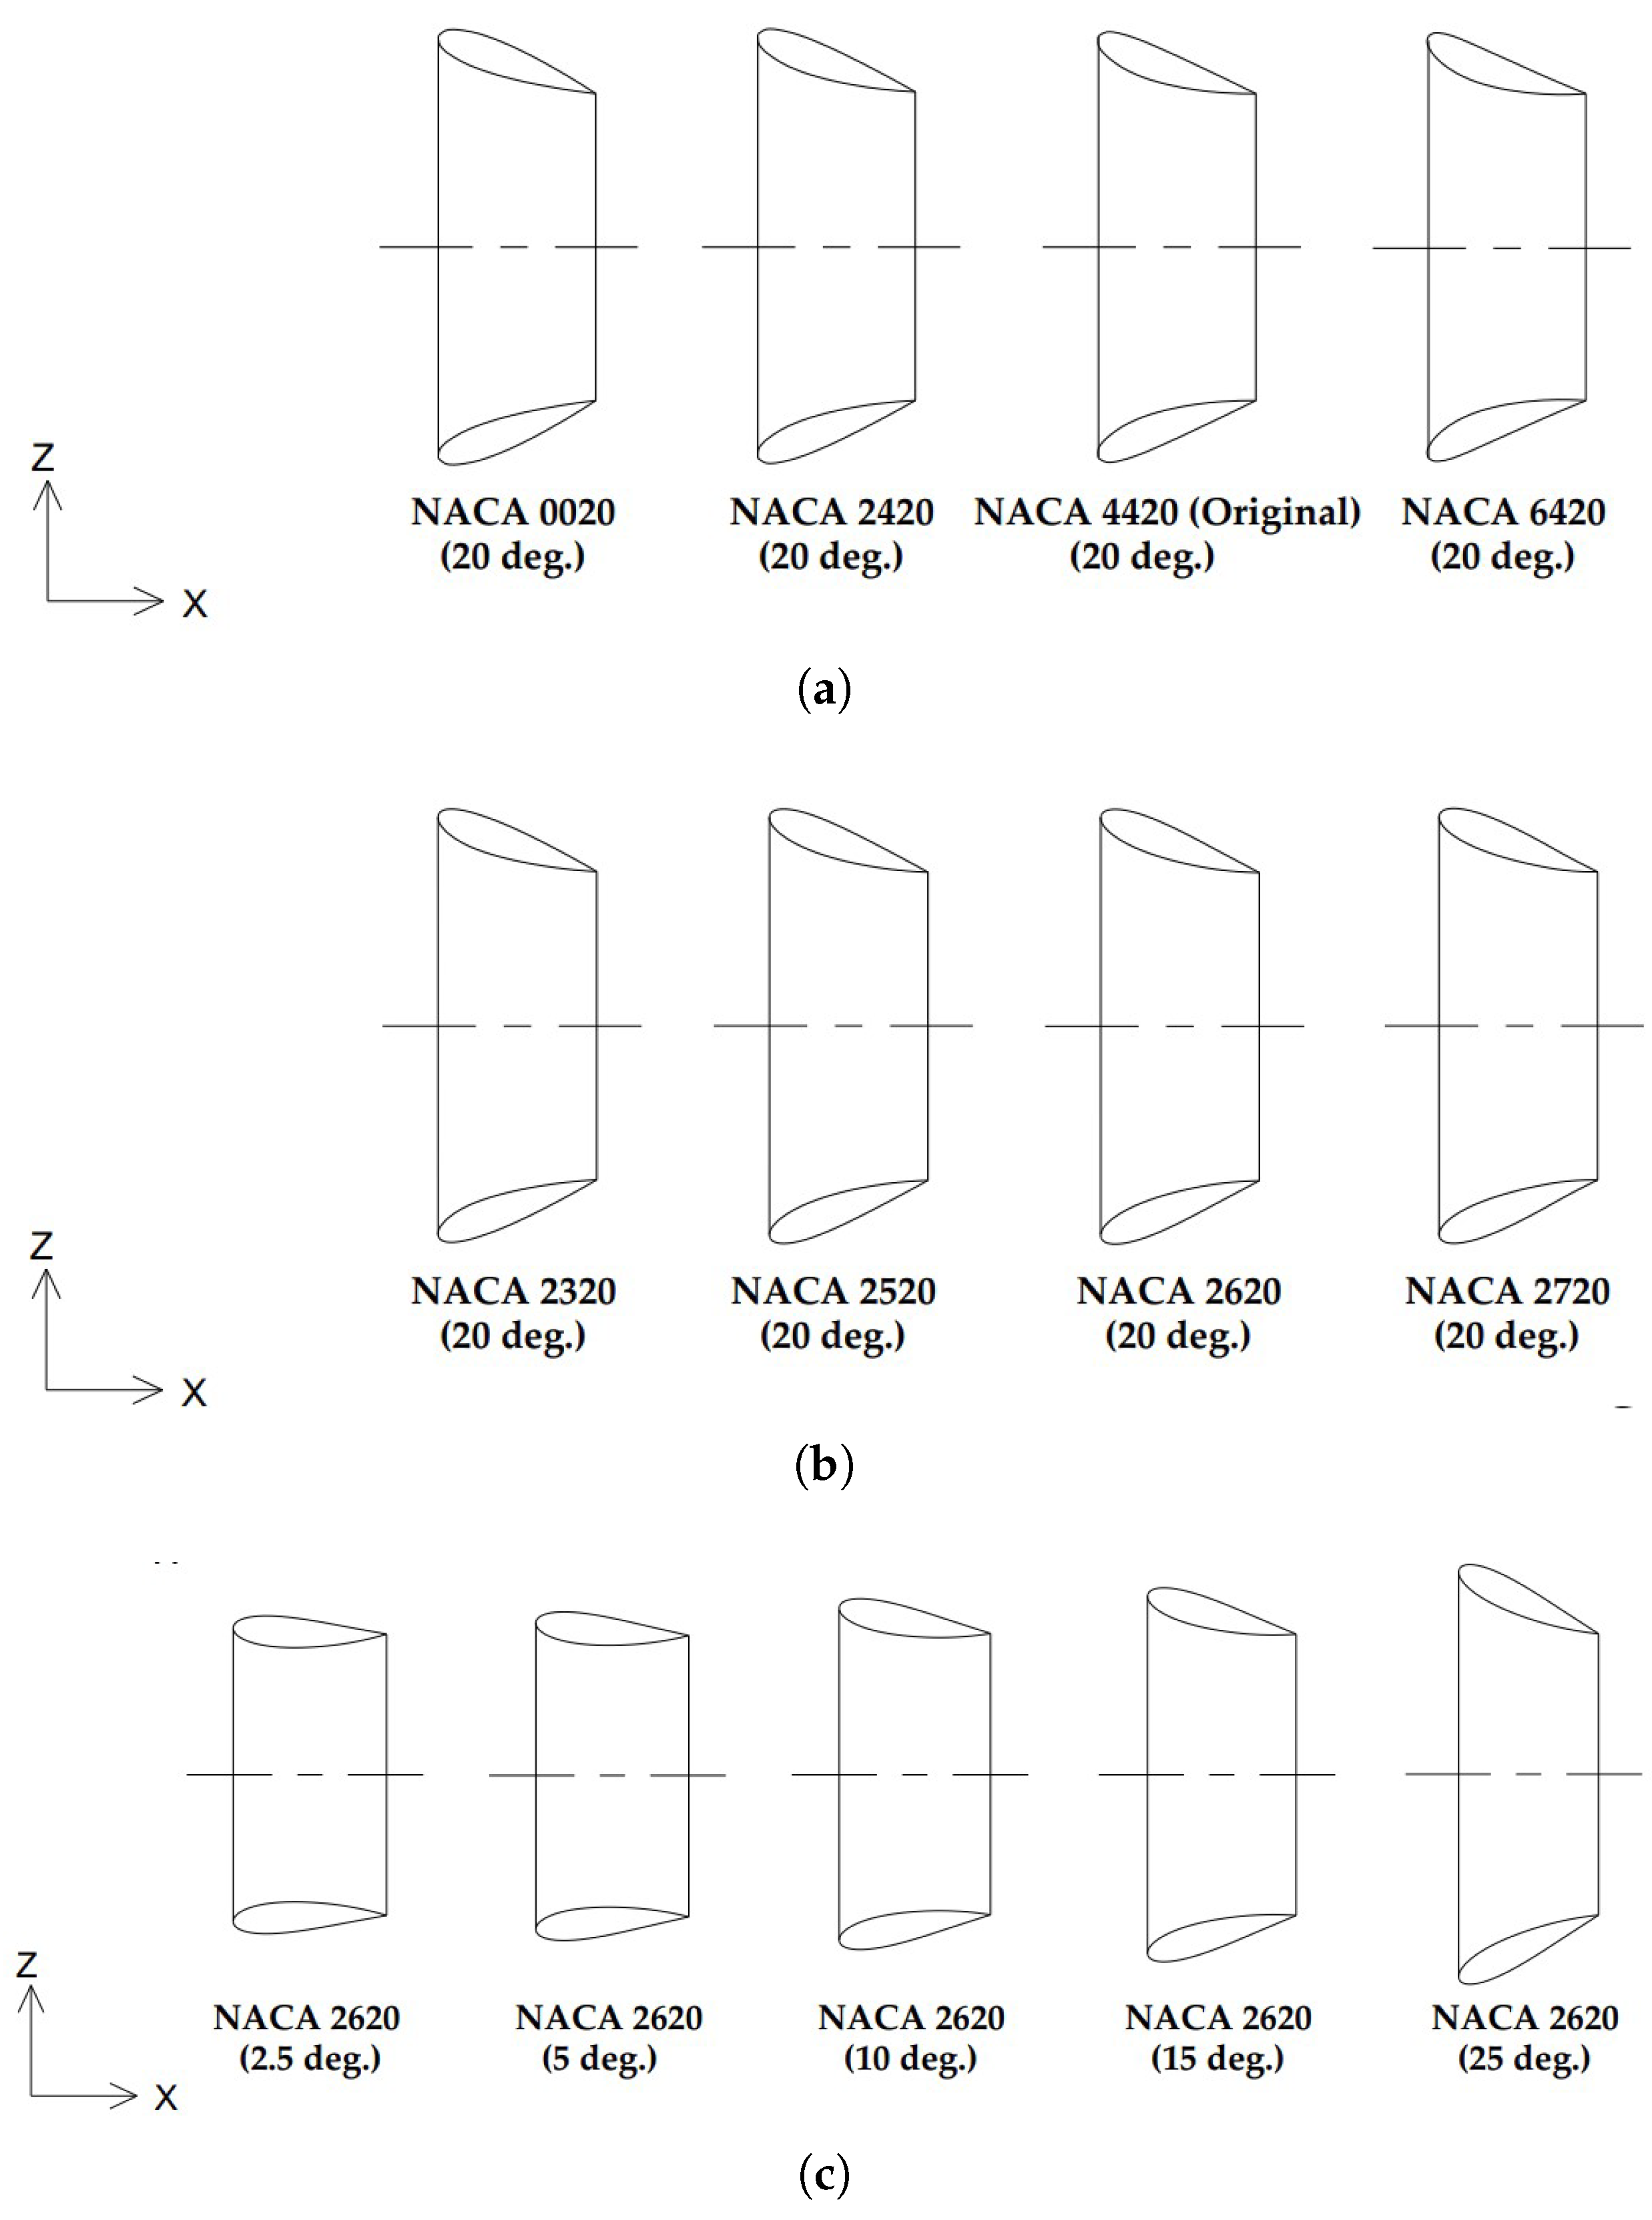
Figure 8.
Variation of total resistance coefficient with (a) camber (b) position of maximum camber and (b) angle of attack (AoA).
Figure 8.
Variation of total resistance coefficient with (a) camber (b) position of maximum camber and (b) angle of attack (AoA).
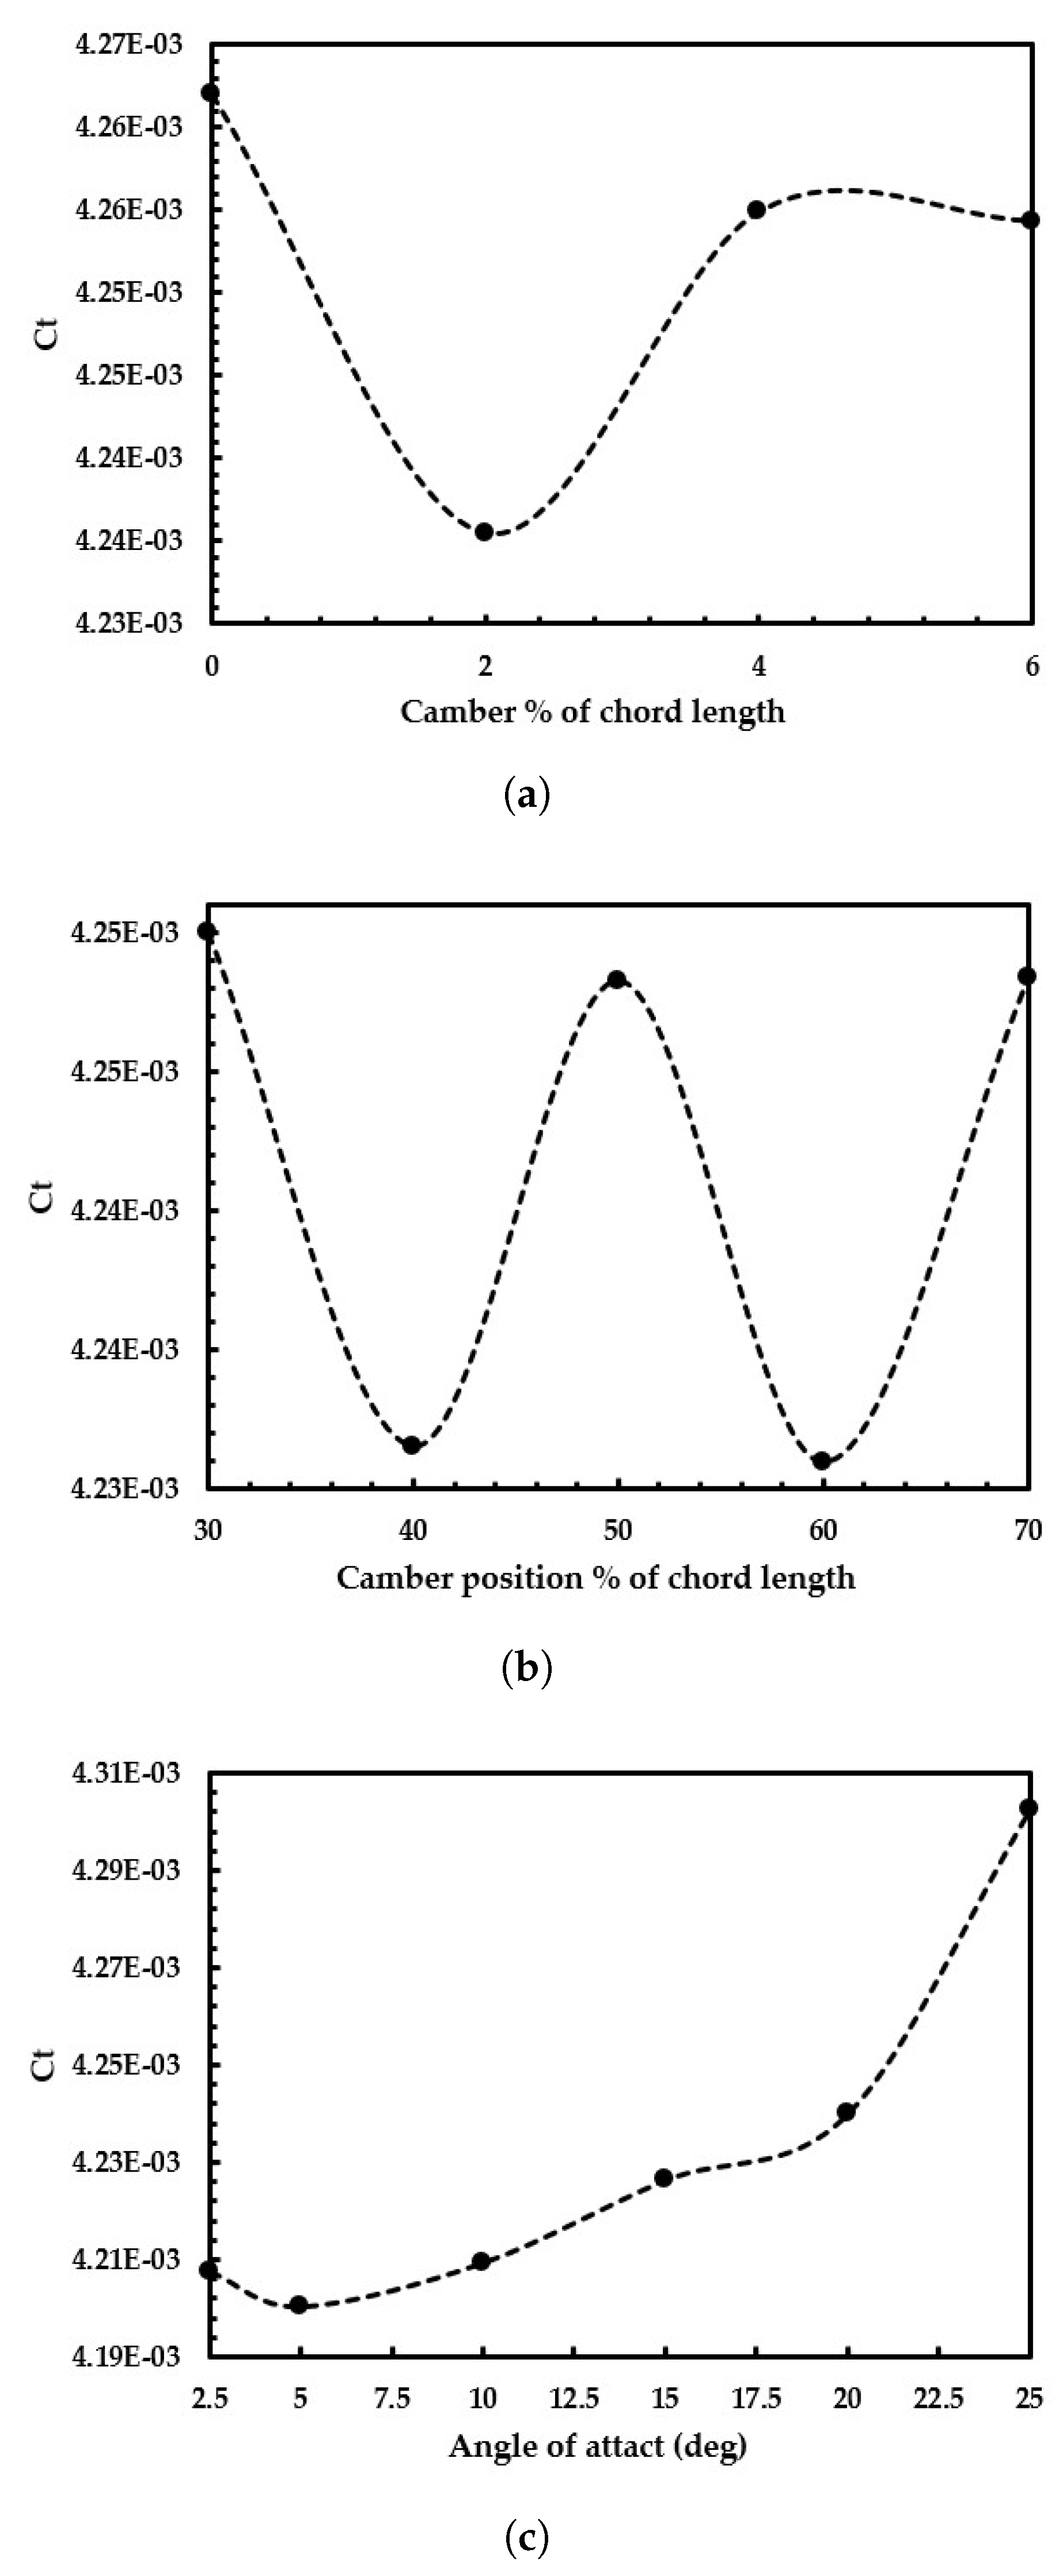
Figure 9.
Comparison of to total resistance among JBC bare hull, JBC hull with original WED and JBC hull with optimal WED.
Figure 9.
Comparison of to total resistance among JBC bare hull, JBC hull with original WED and JBC hull with optimal WED.
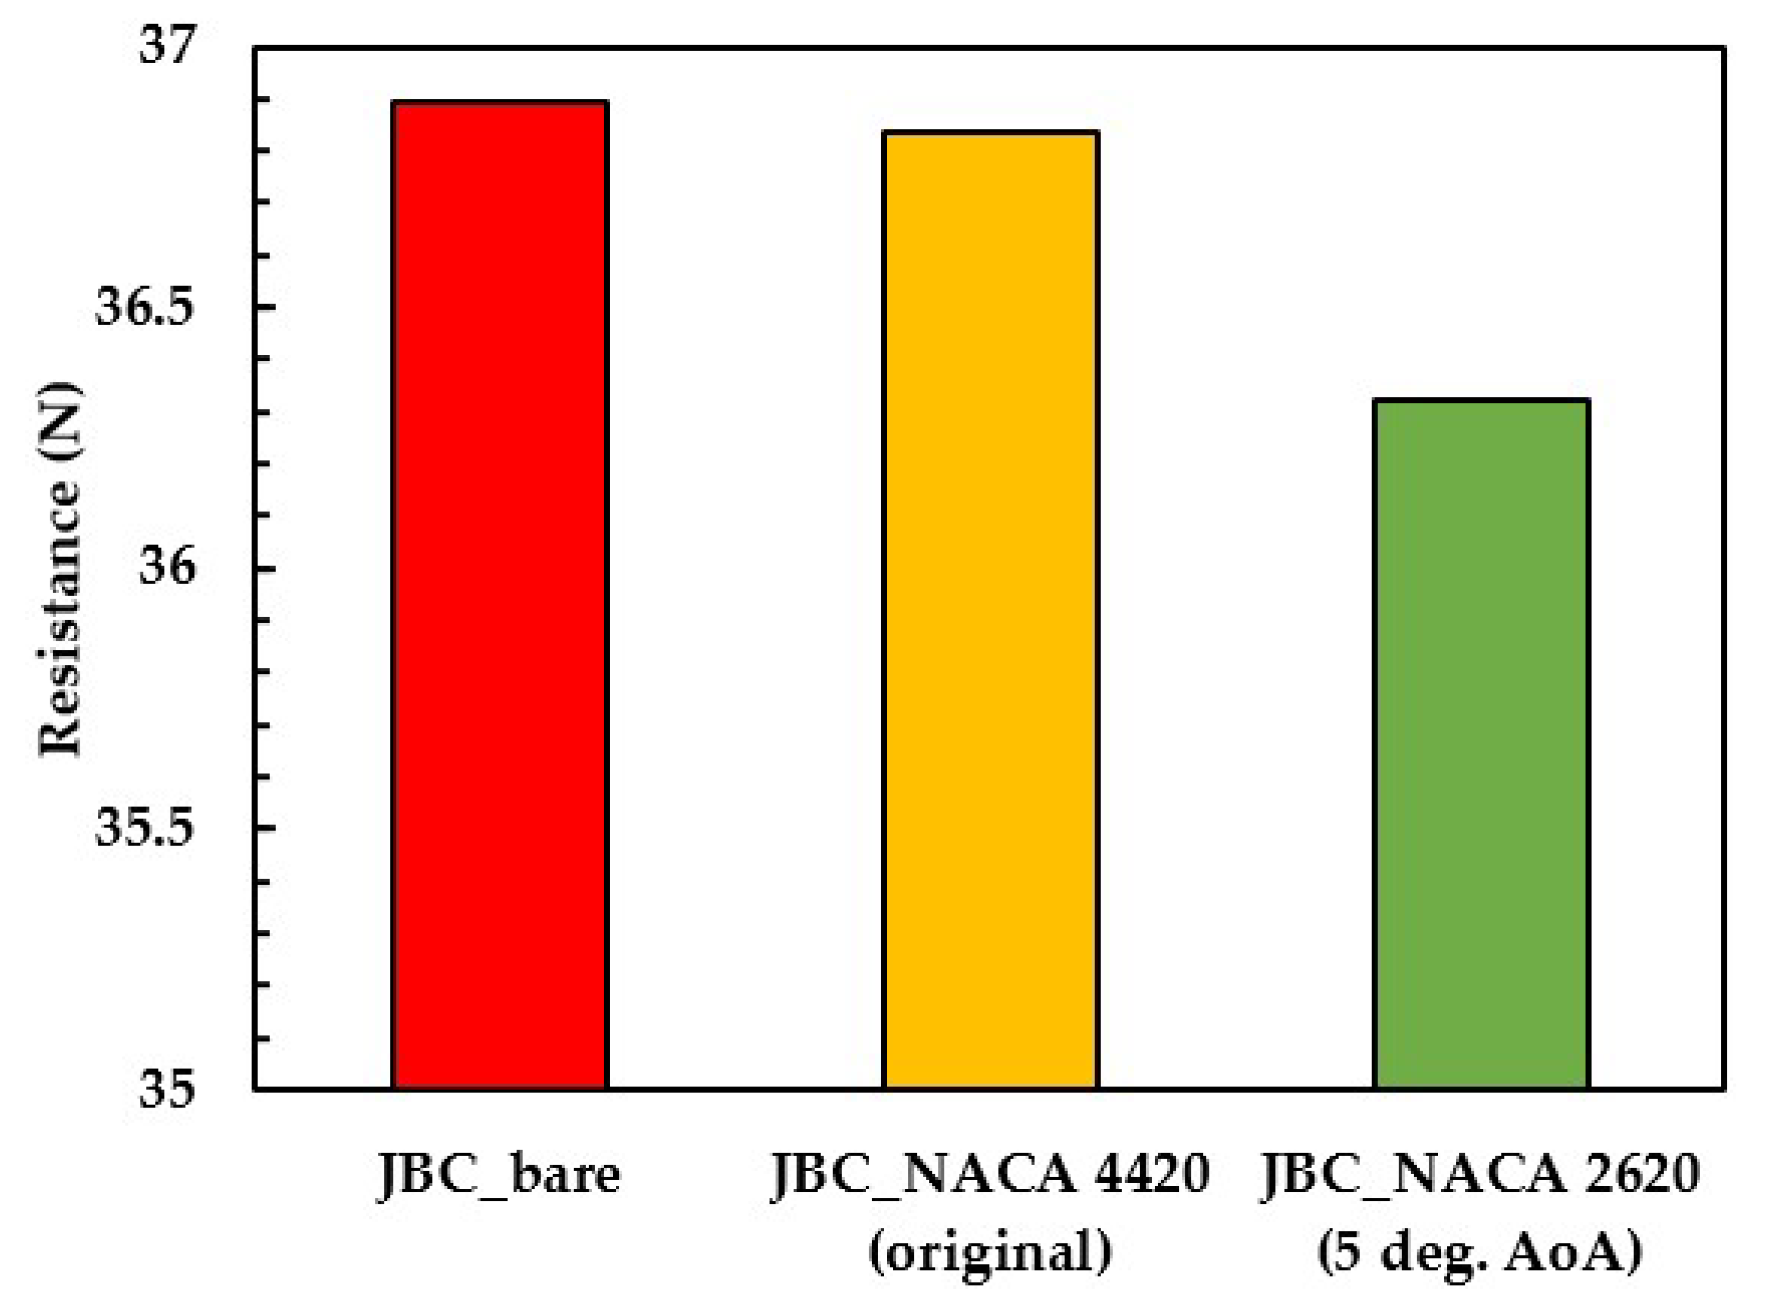
Figure 10.
Wake field of (a) JBC bare hull and (b) JBC hull with original WED.
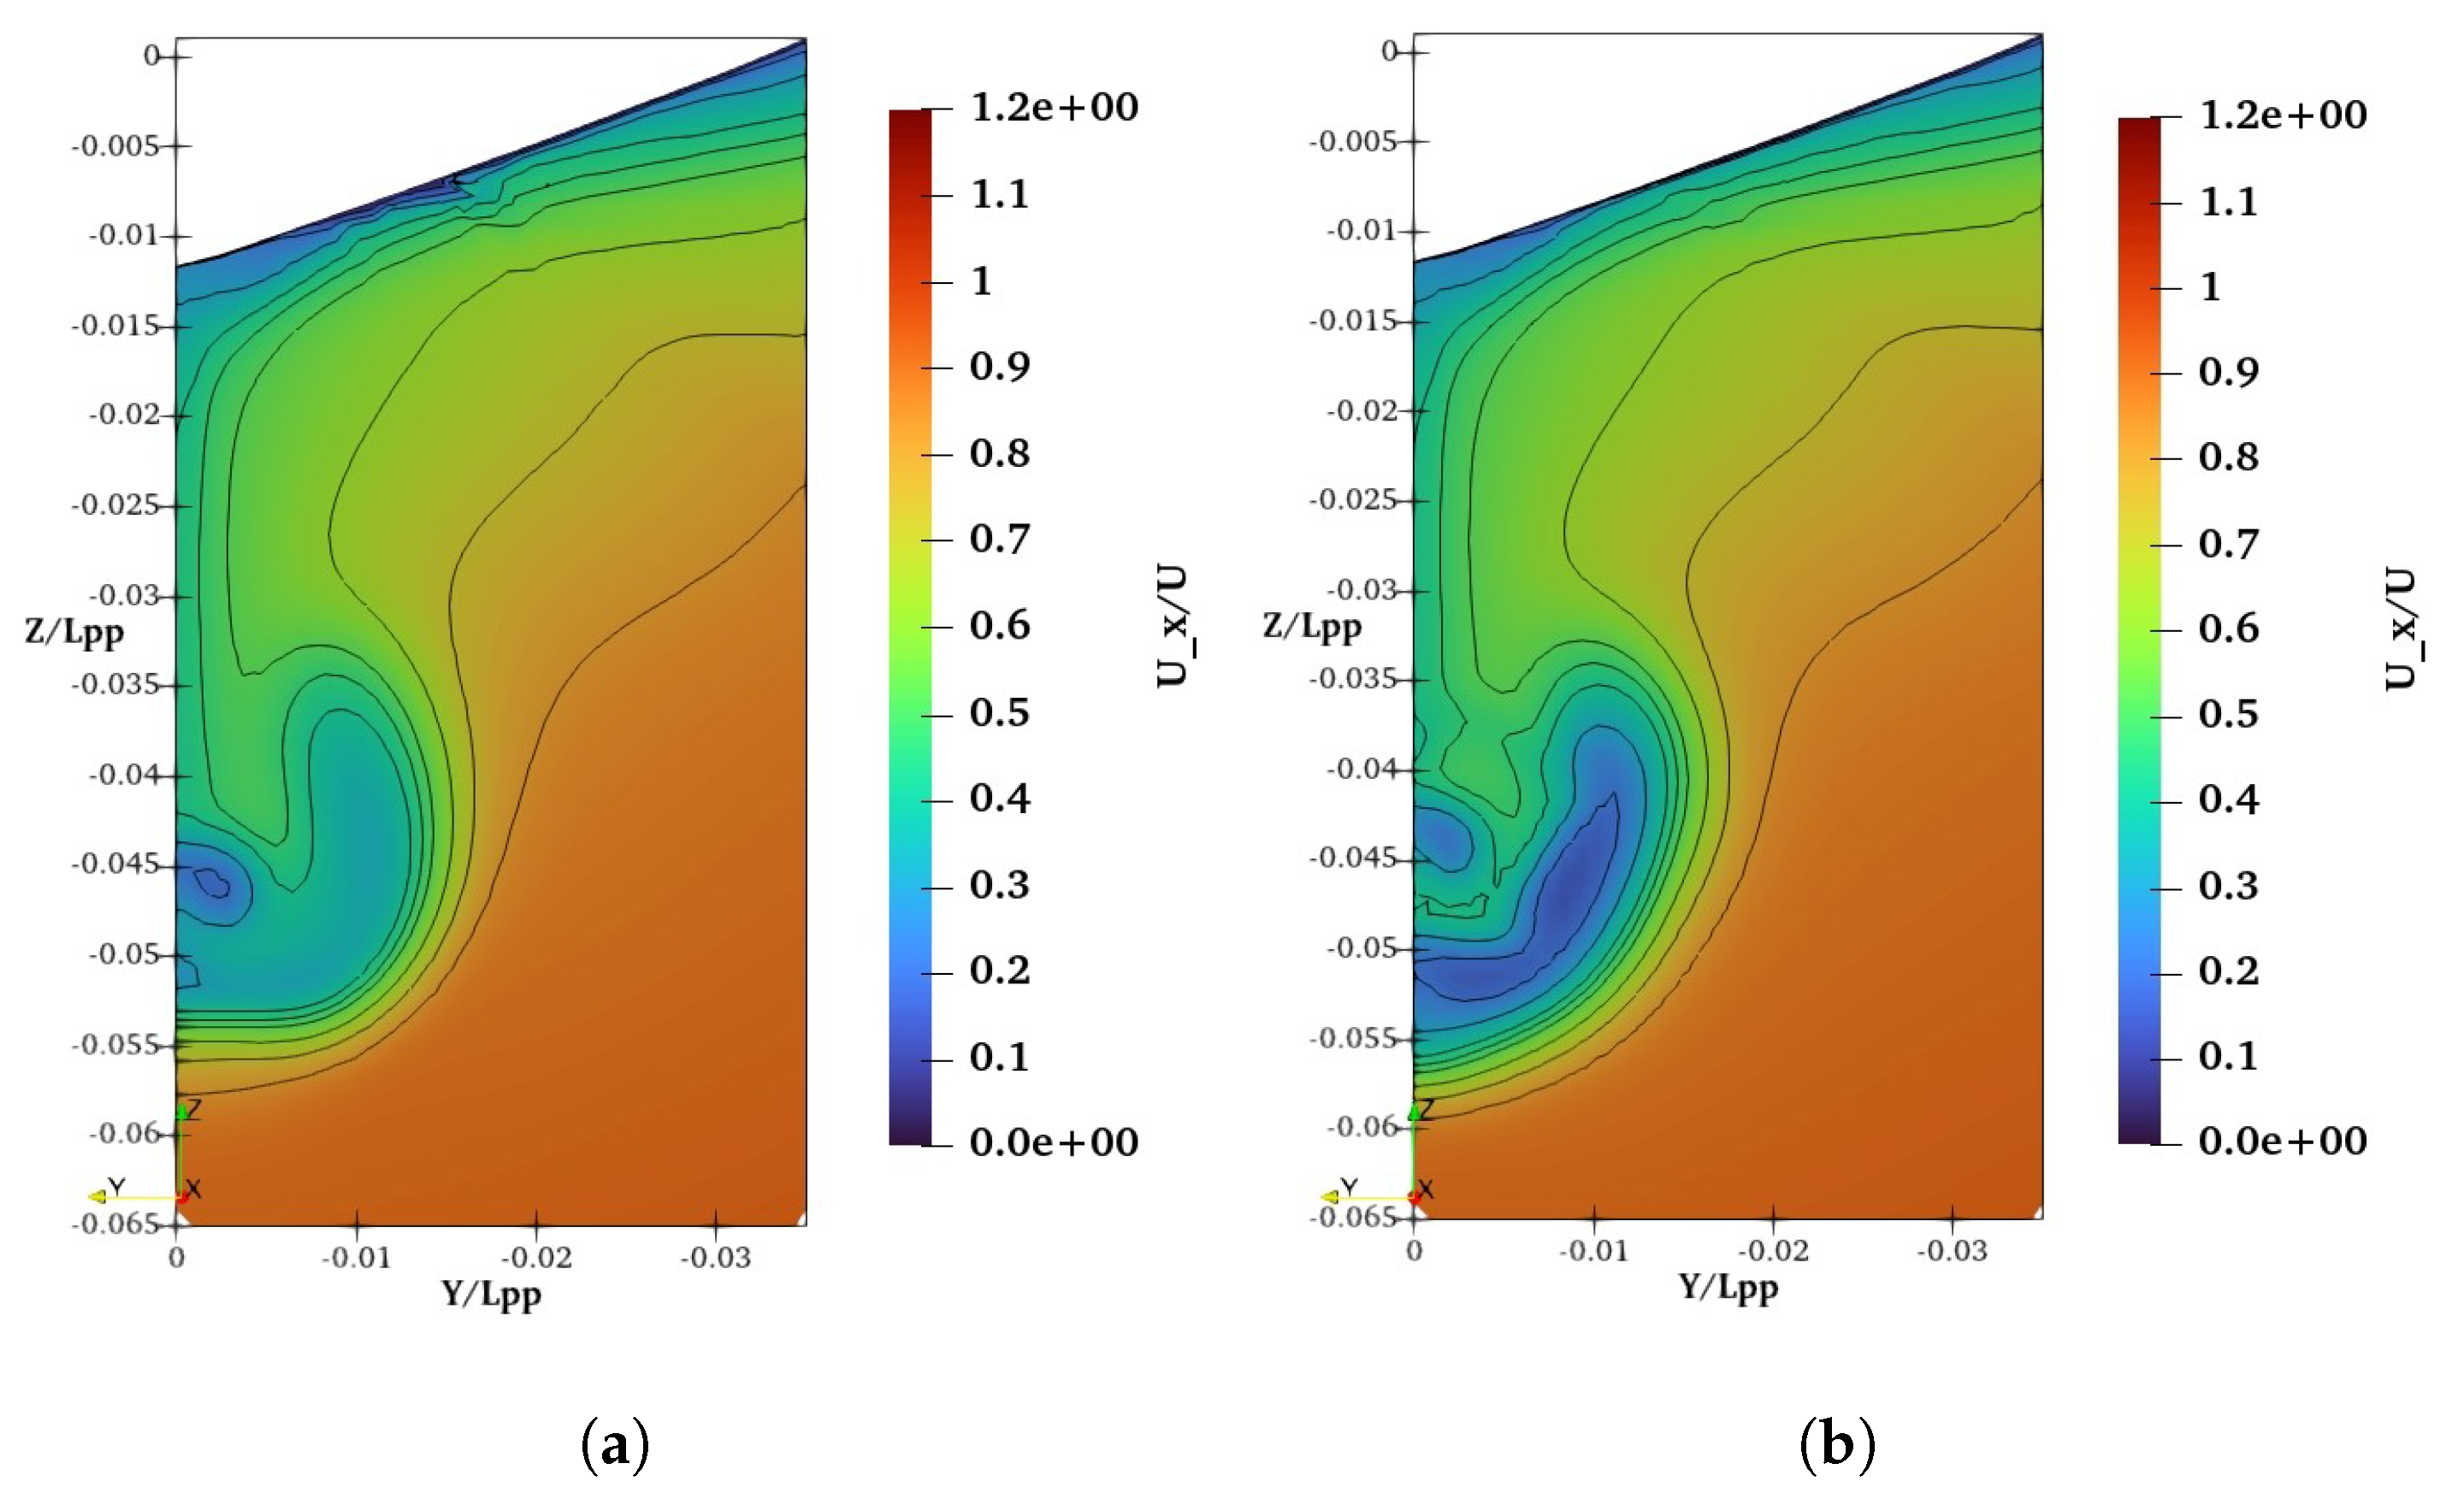
Figure 11.
Wake field of (a) JBC bare hull with original WED (NACA 4420 20 deg. AoA) and (b) JBC hull with WED (NACA 2620 5 deg AoA).
Figure 11.
Wake field of (a) JBC bare hull with original WED (NACA 4420 20 deg. AoA) and (b) JBC hull with WED (NACA 2620 5 deg AoA).
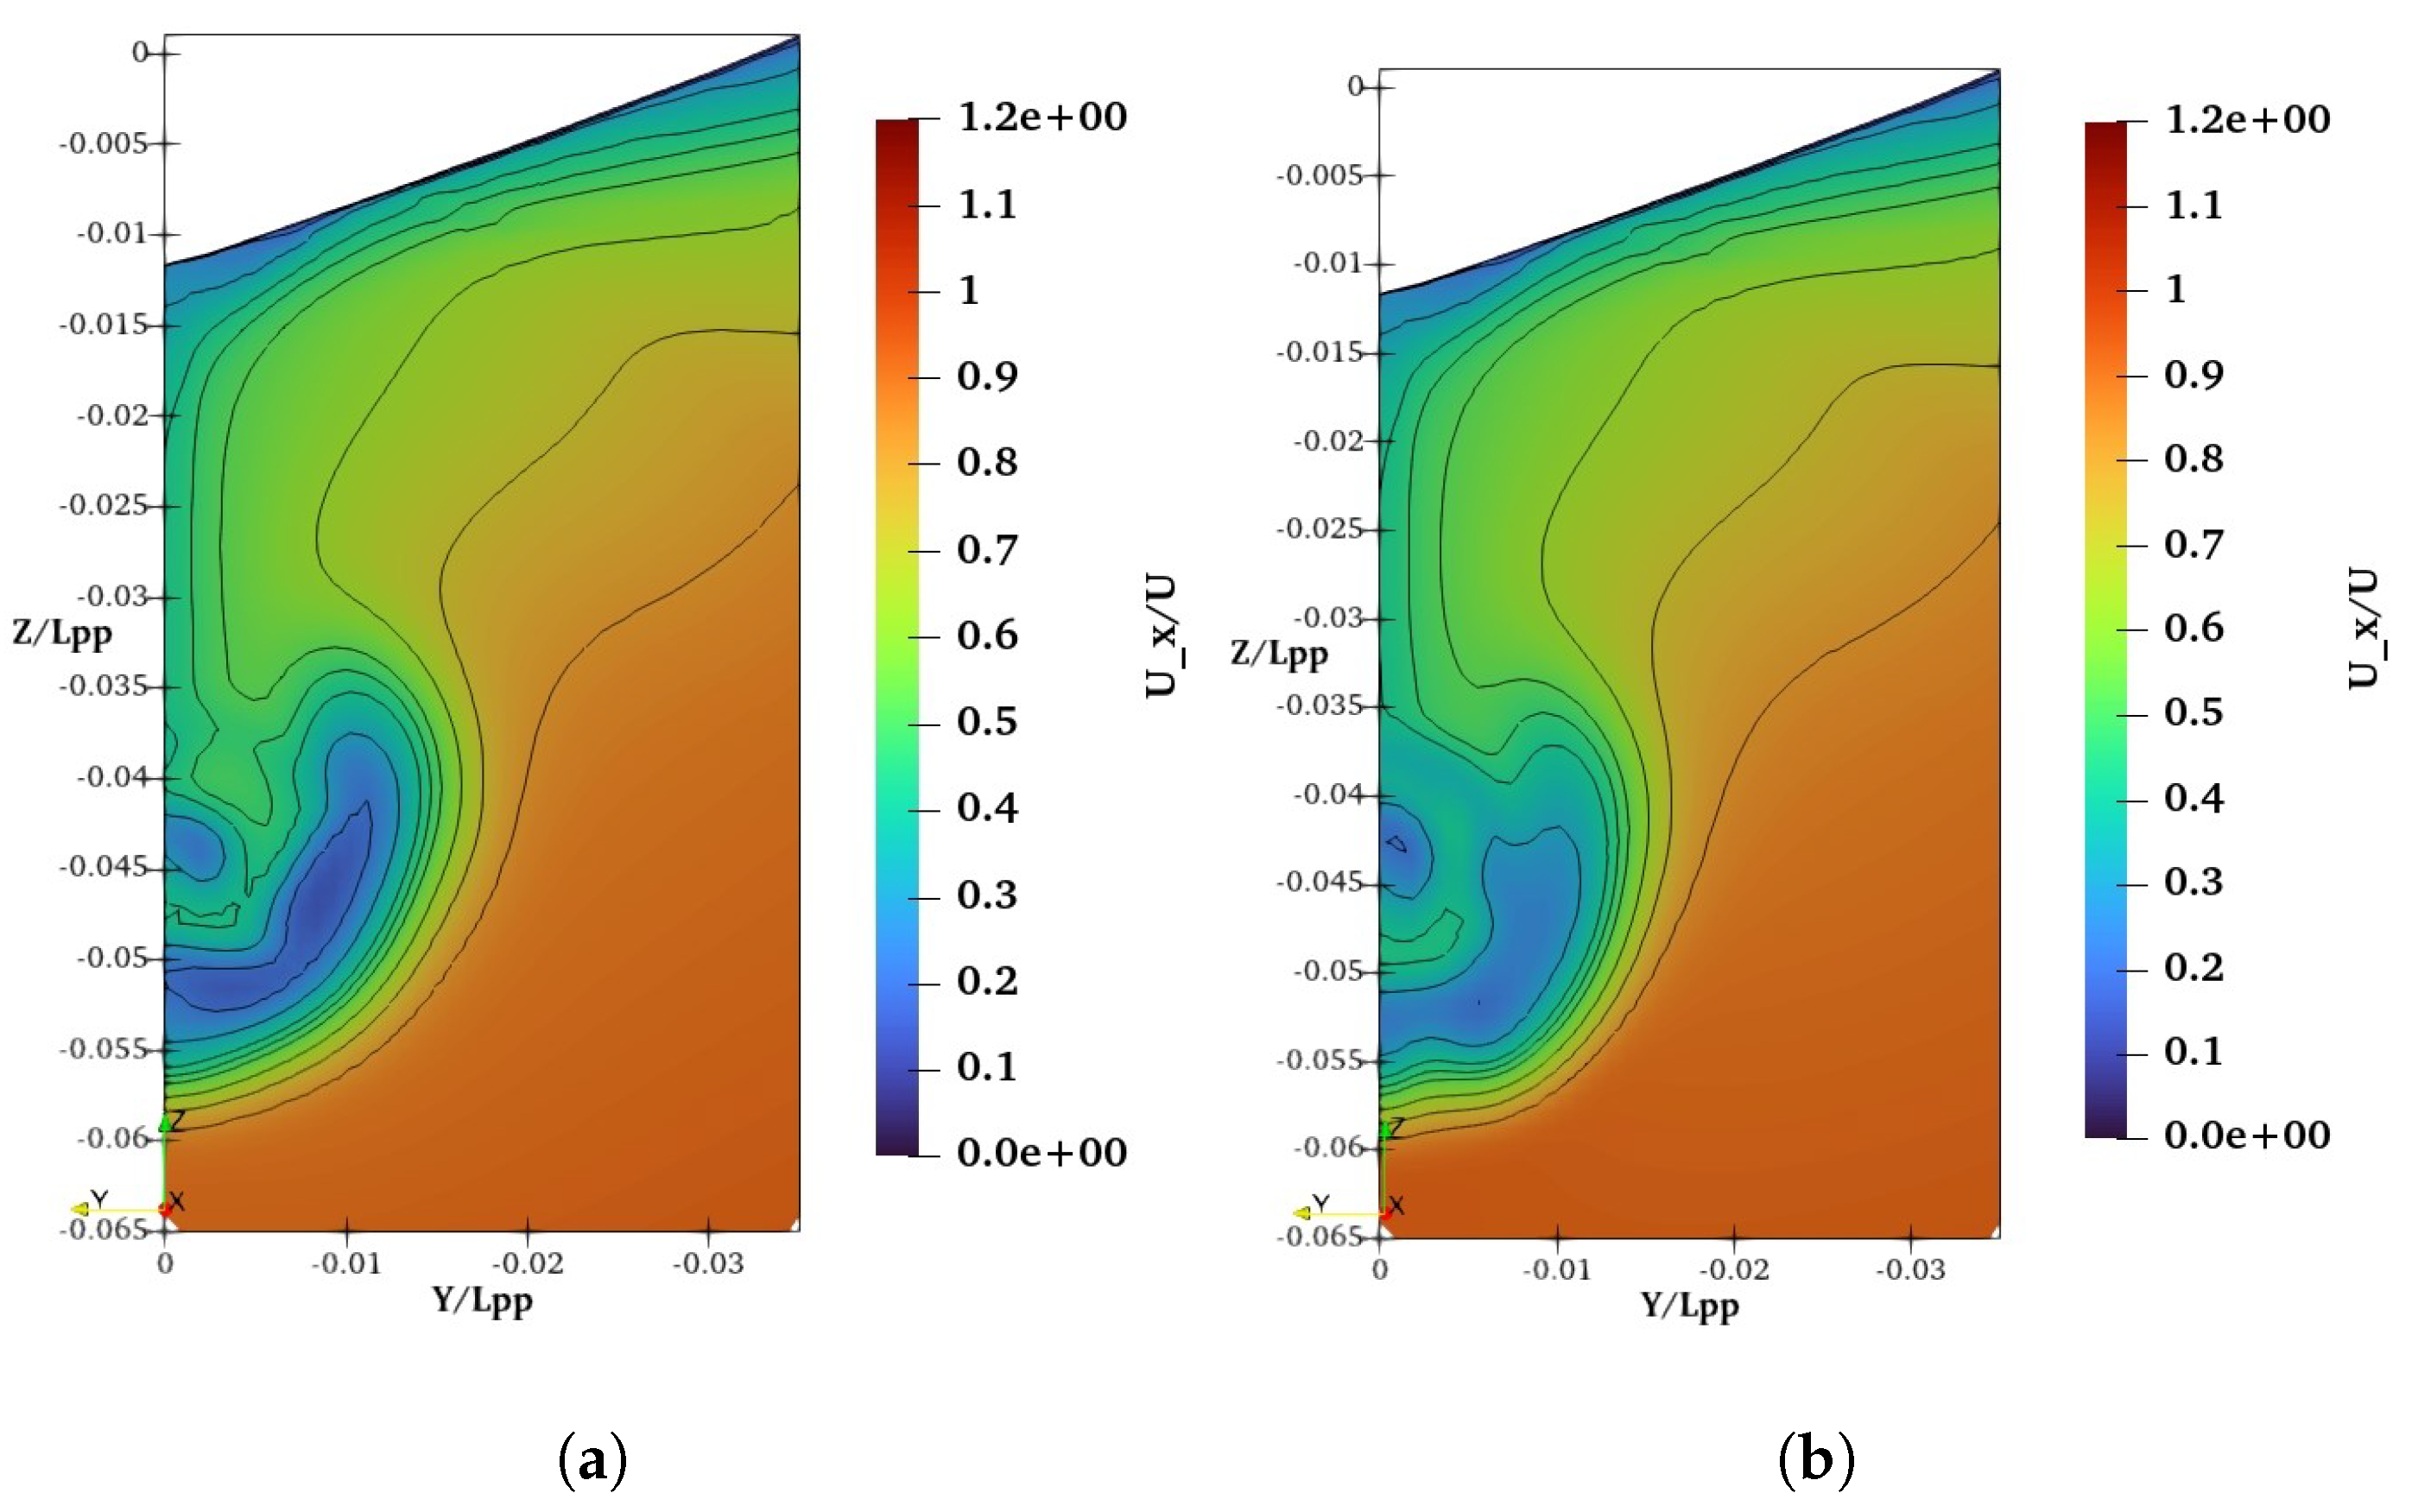
Figure 12.
Pressure distribution on (a) original WED (NACA 4420 20 deg. AoA) (b) WED (NACA 2420 20 deg. AoA), (c) WED (NACA 2620 20 deg. AoA) and (d) WED (NACA 2620 5 deg. AoA).
Figure 12.
Pressure distribution on (a) original WED (NACA 4420 20 deg. AoA) (b) WED (NACA 2420 20 deg. AoA), (c) WED (NACA 2620 20 deg. AoA) and (d) WED (NACA 2620 5 deg. AoA).
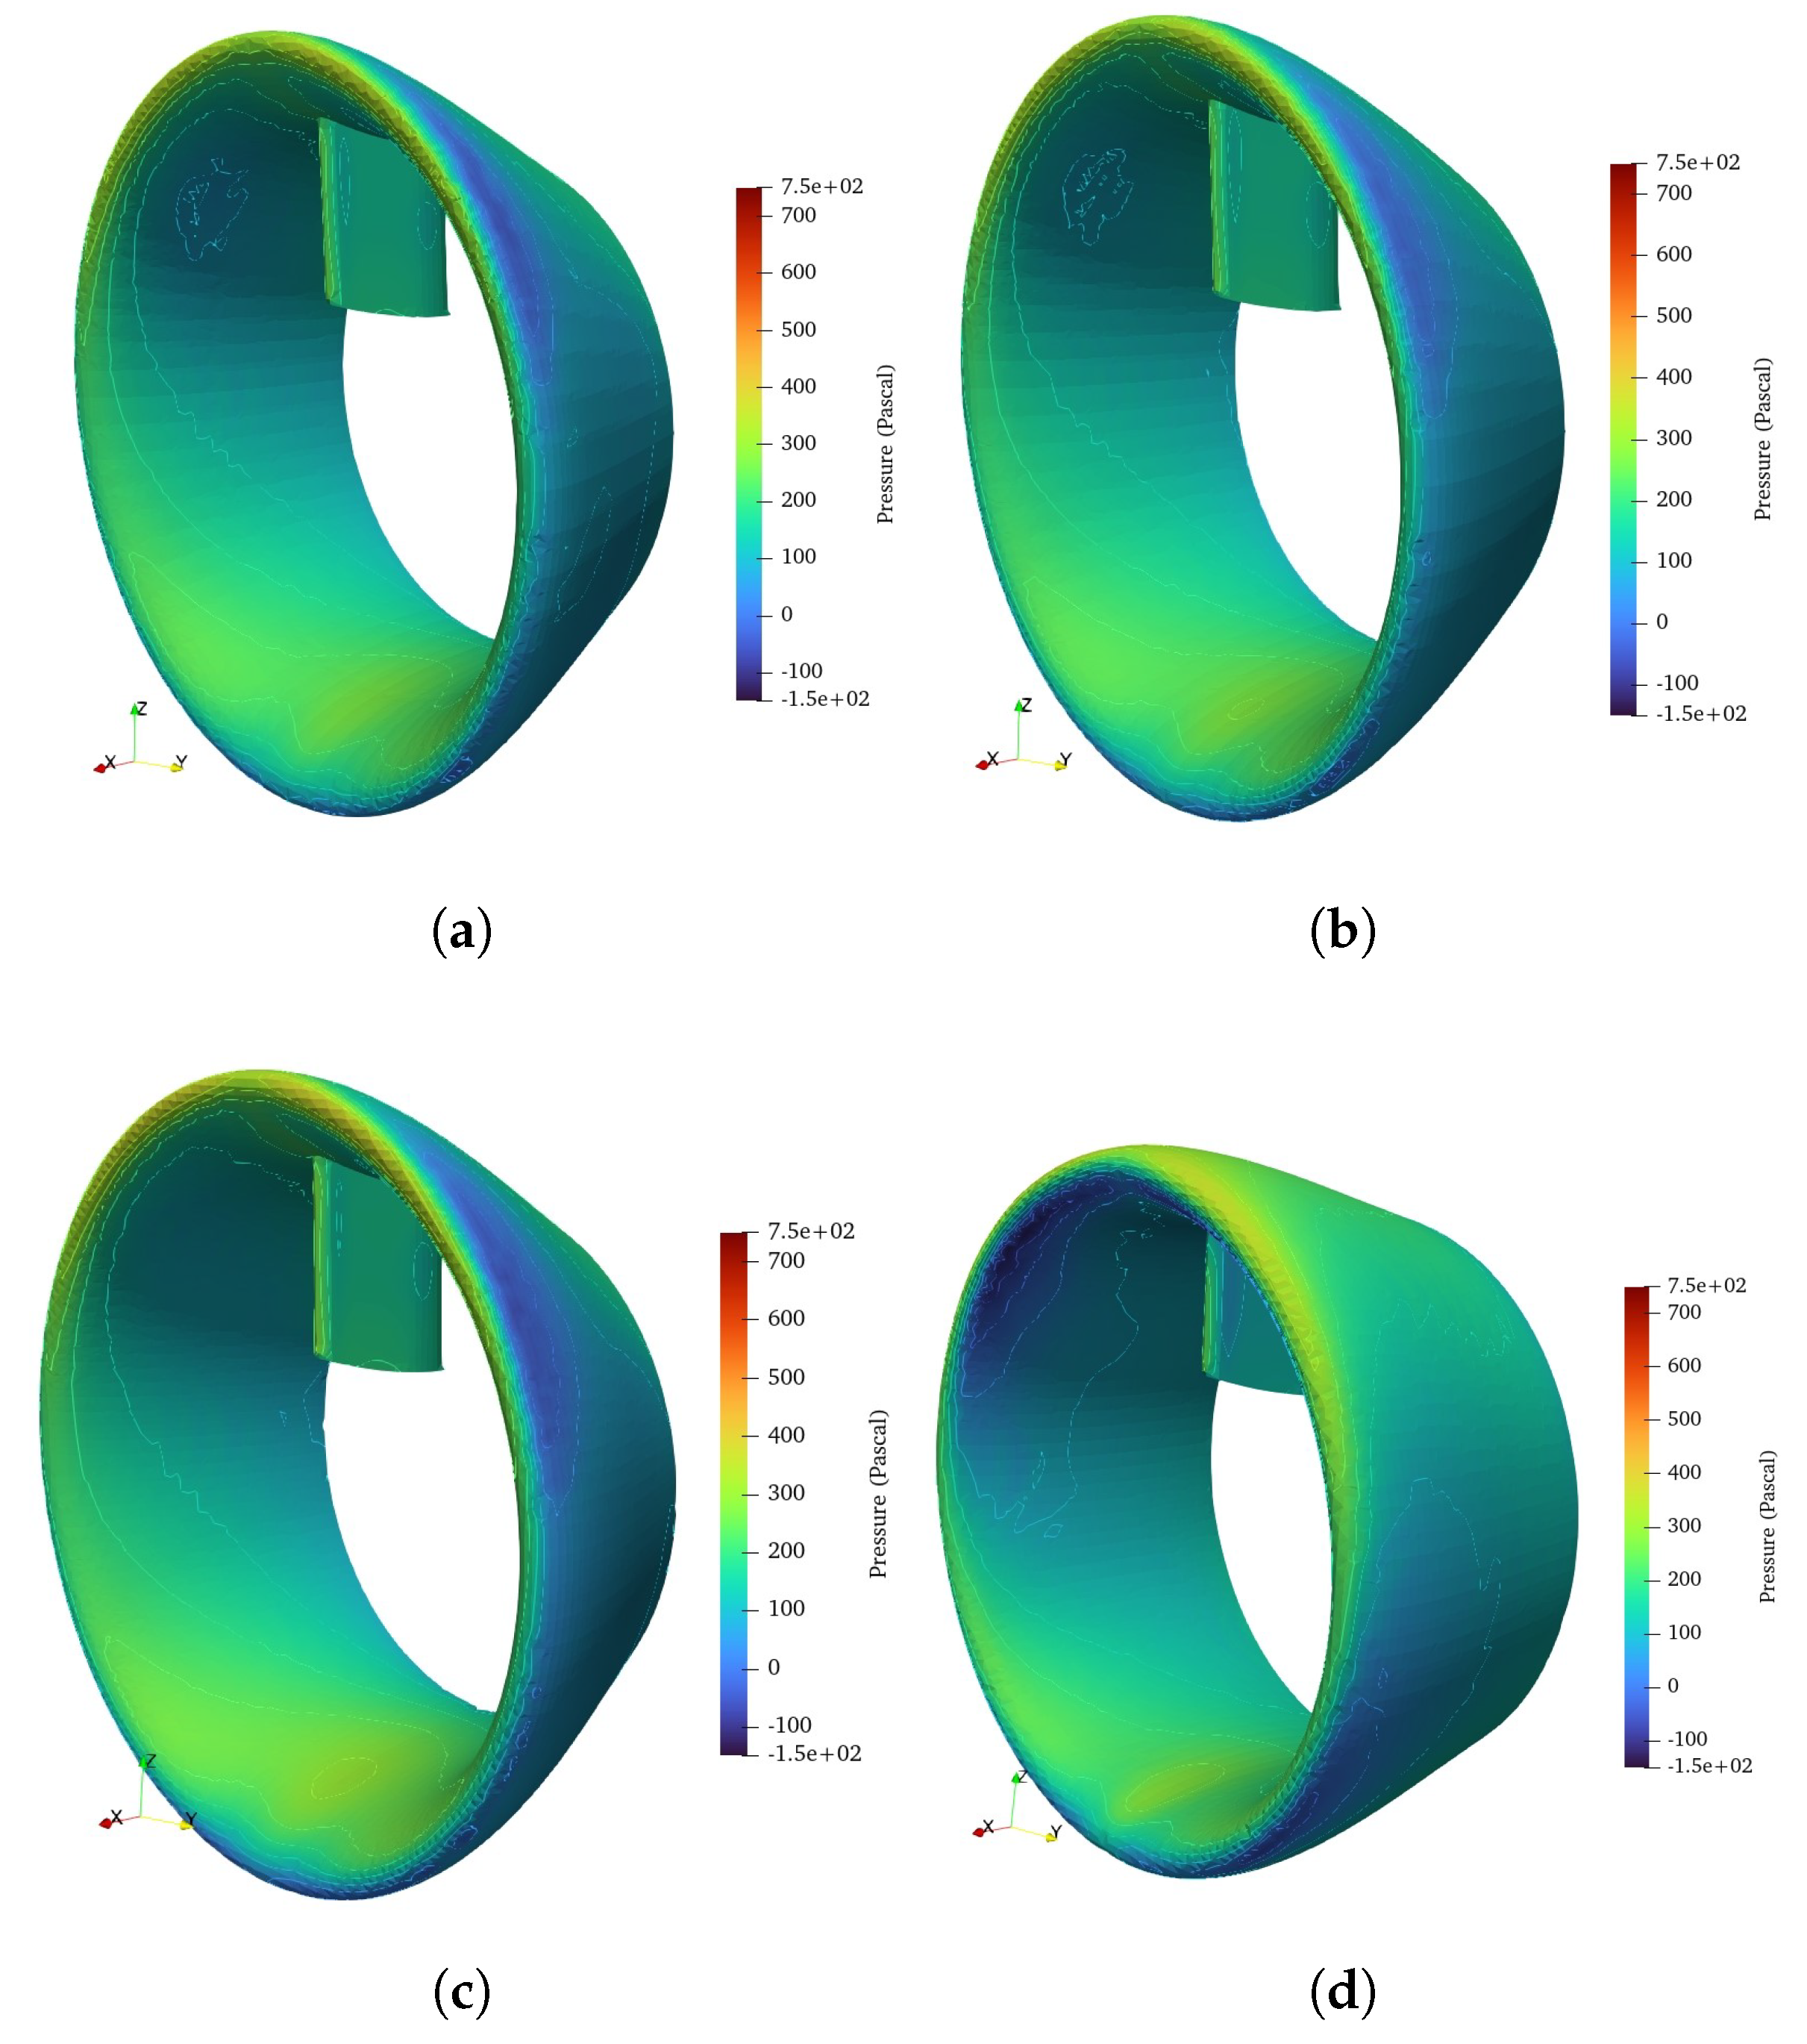
Figure 13.
(a) Profile view and (b) body plan of inland bulk carrier.
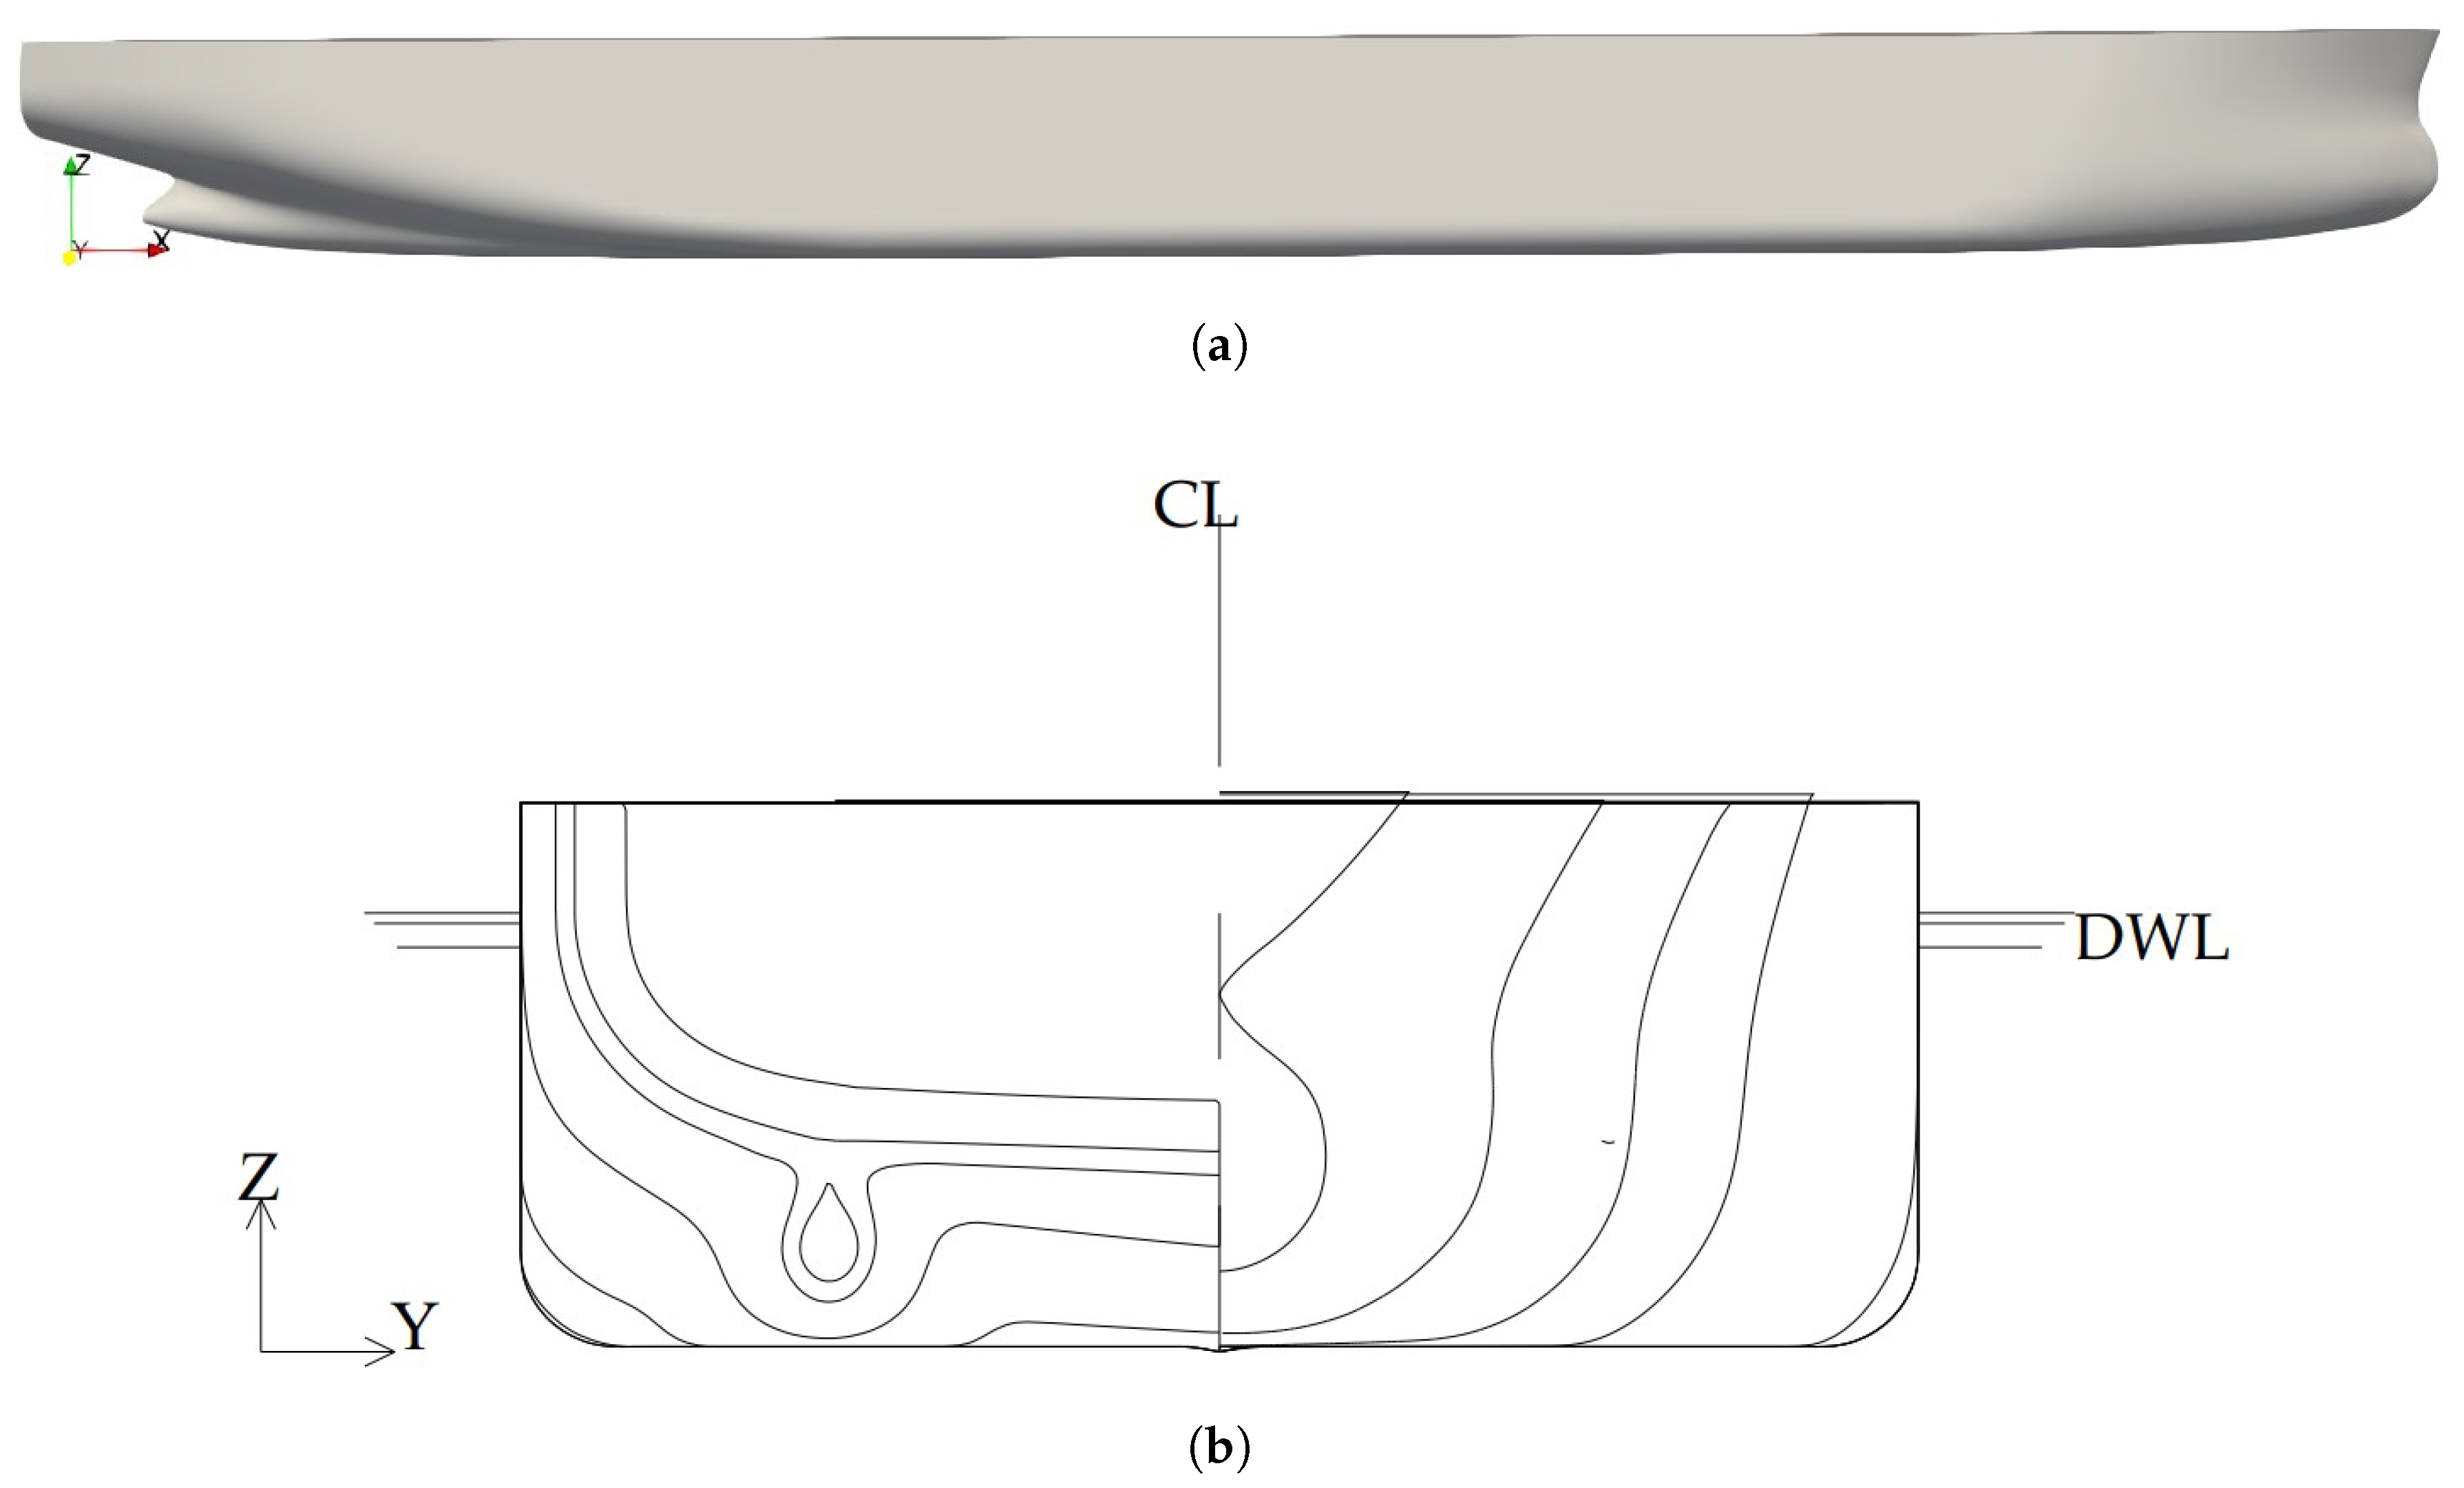
Figure 14.
Mesh distribution inside the computational domain and around the hull of inland bulk carrier with out WED
Figure 14.
Mesh distribution inside the computational domain and around the hull of inland bulk carrier with out WED
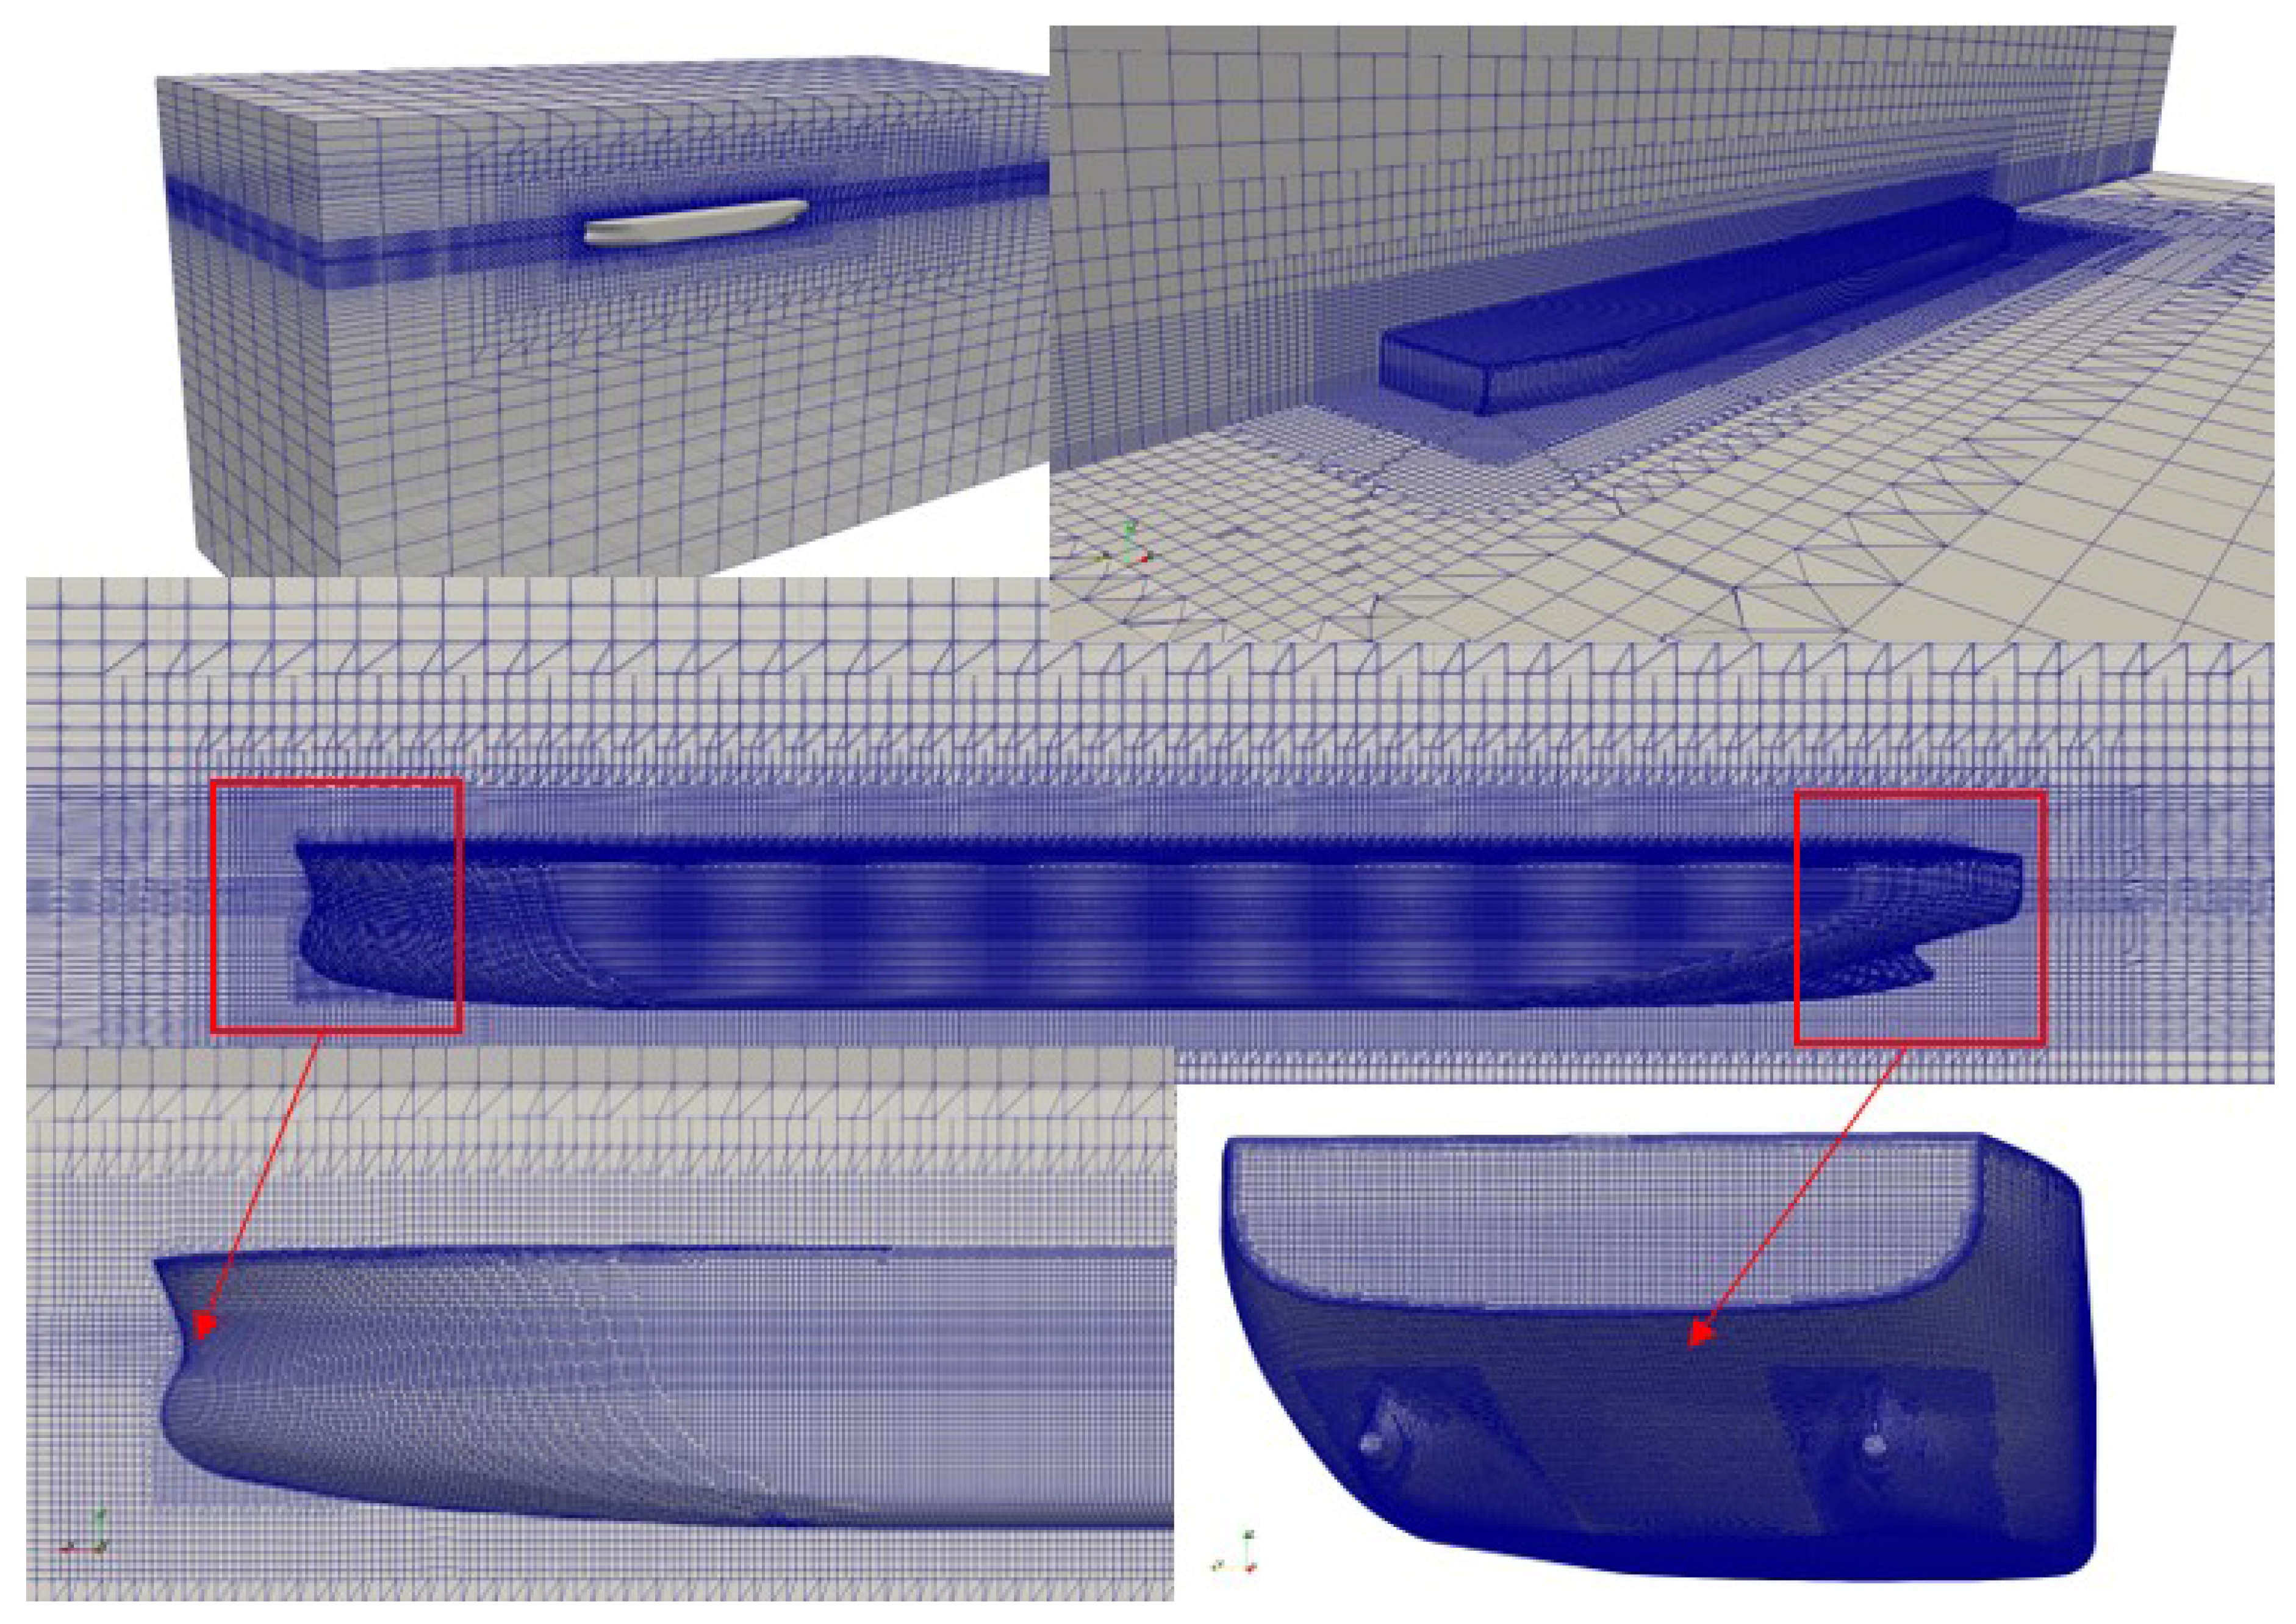
Figure 15.
Mesh distribution inside the computational domain and around the hull of inland bulk carrier with WED
Figure 15.
Mesh distribution inside the computational domain and around the hull of inland bulk carrier with WED
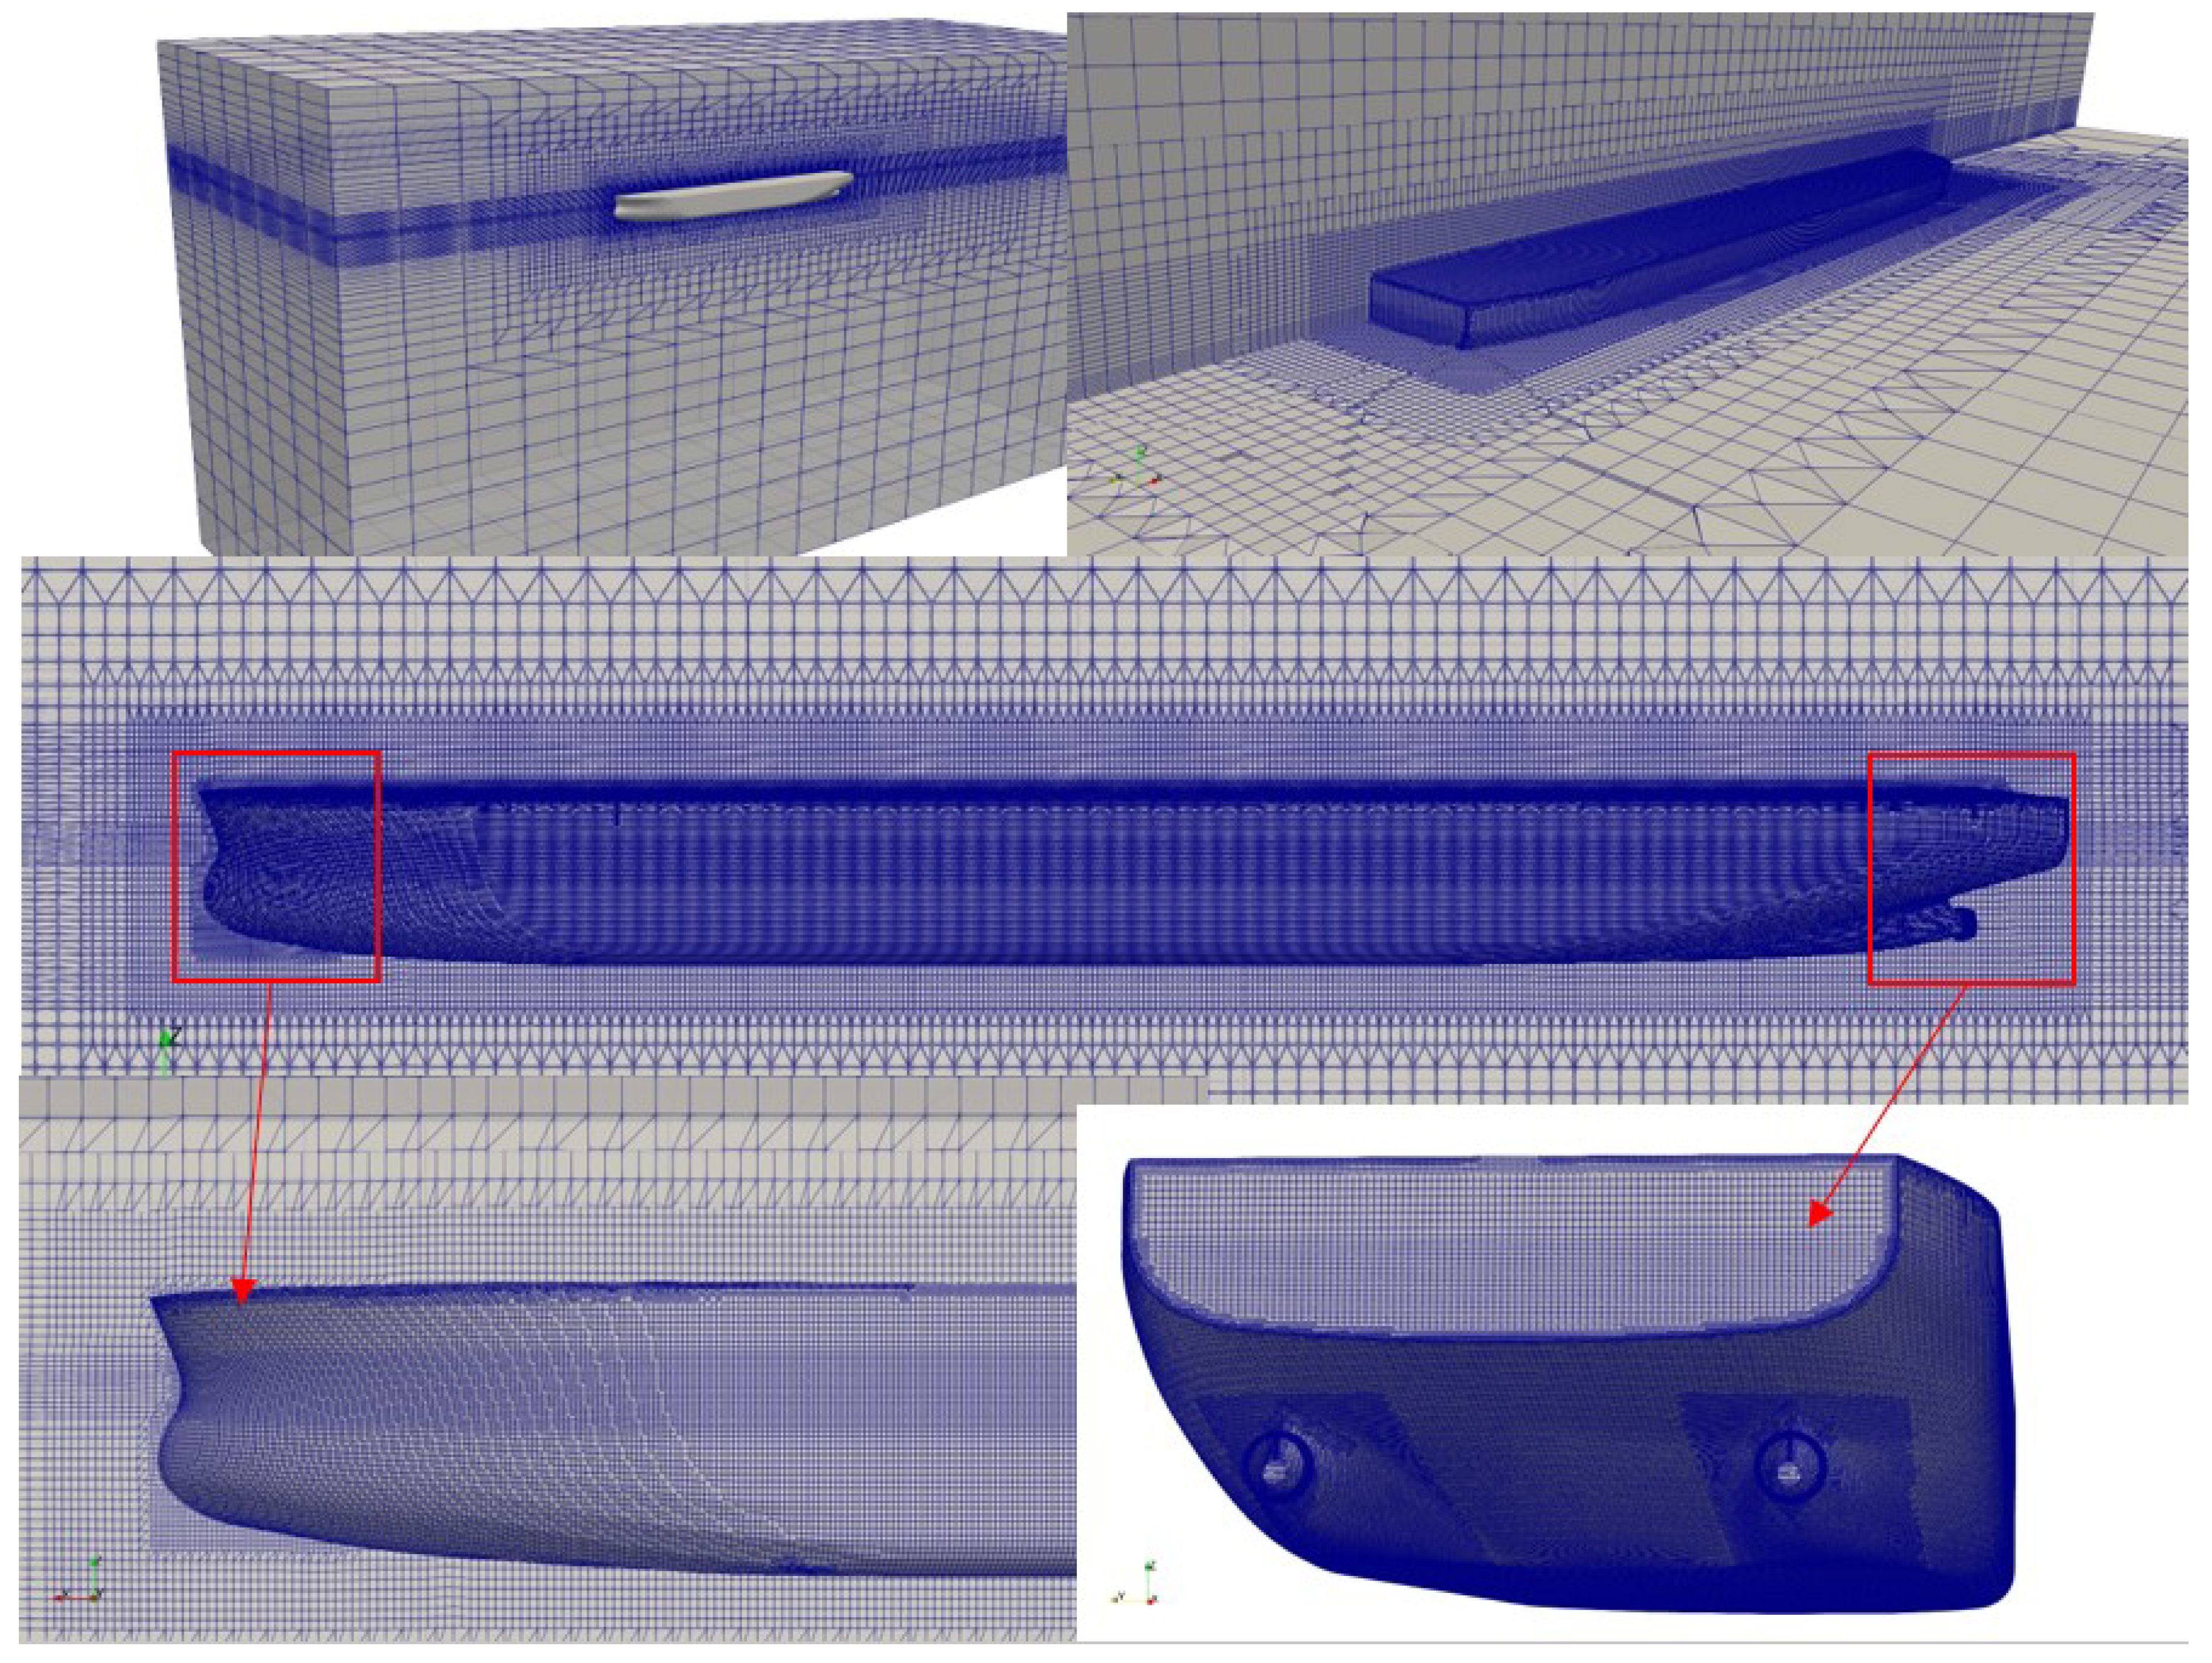
Figure 16.
Side view of wake equalizing duct near the stern of inland bulk carrier hull.
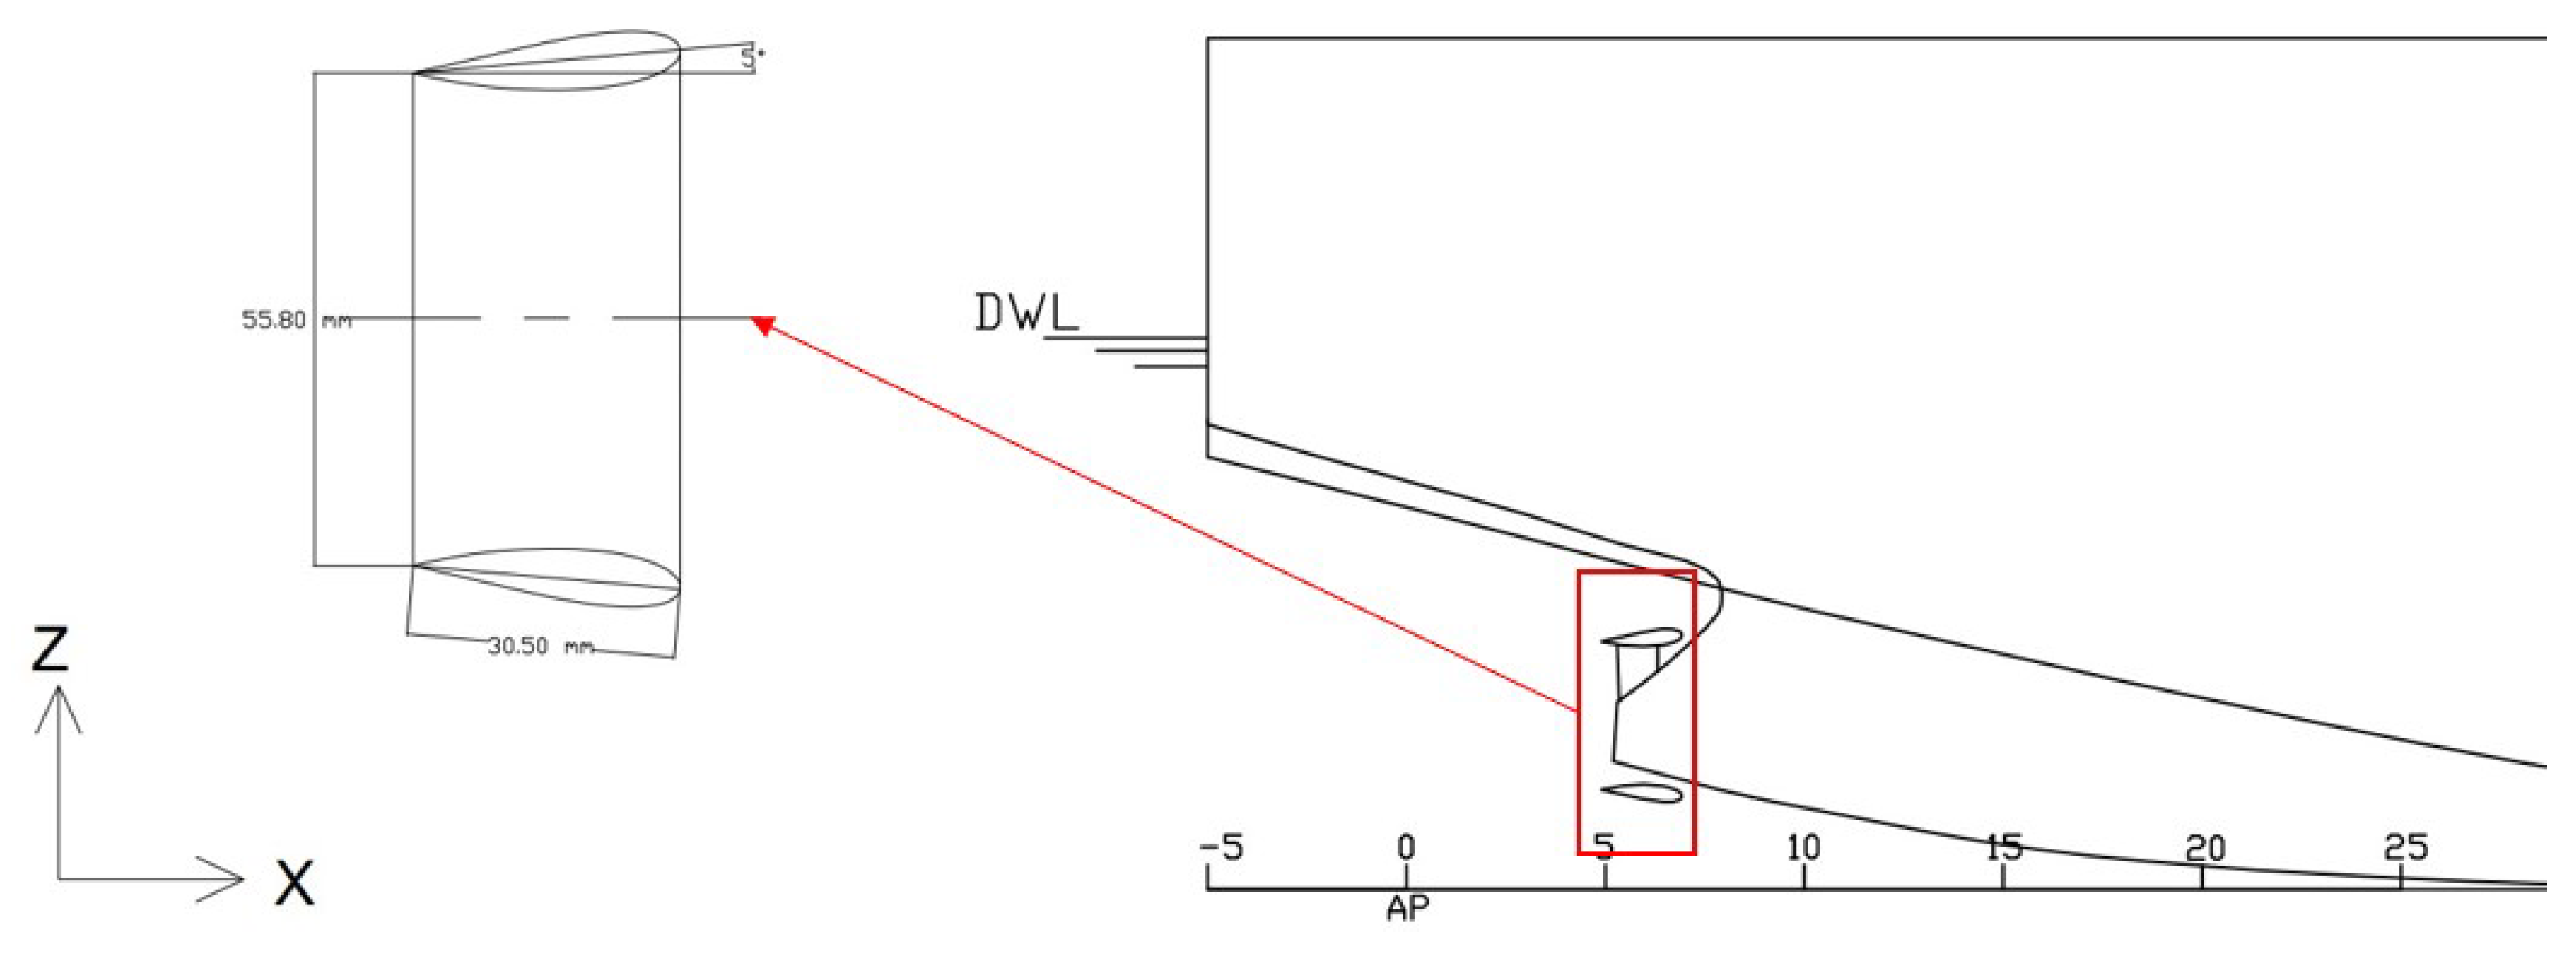
Figure 17.
Wake field visualization of (a) inland bulk carrier without WED, (b) inland bulk carrier with WED and stern velocity field of (c) inland bulk carrier without WED, (d) inland bulk carrier with WED.
Figure 17.
Wake field visualization of (a) inland bulk carrier without WED, (b) inland bulk carrier with WED and stern velocity field of (c) inland bulk carrier without WED, (d) inland bulk carrier with WED.
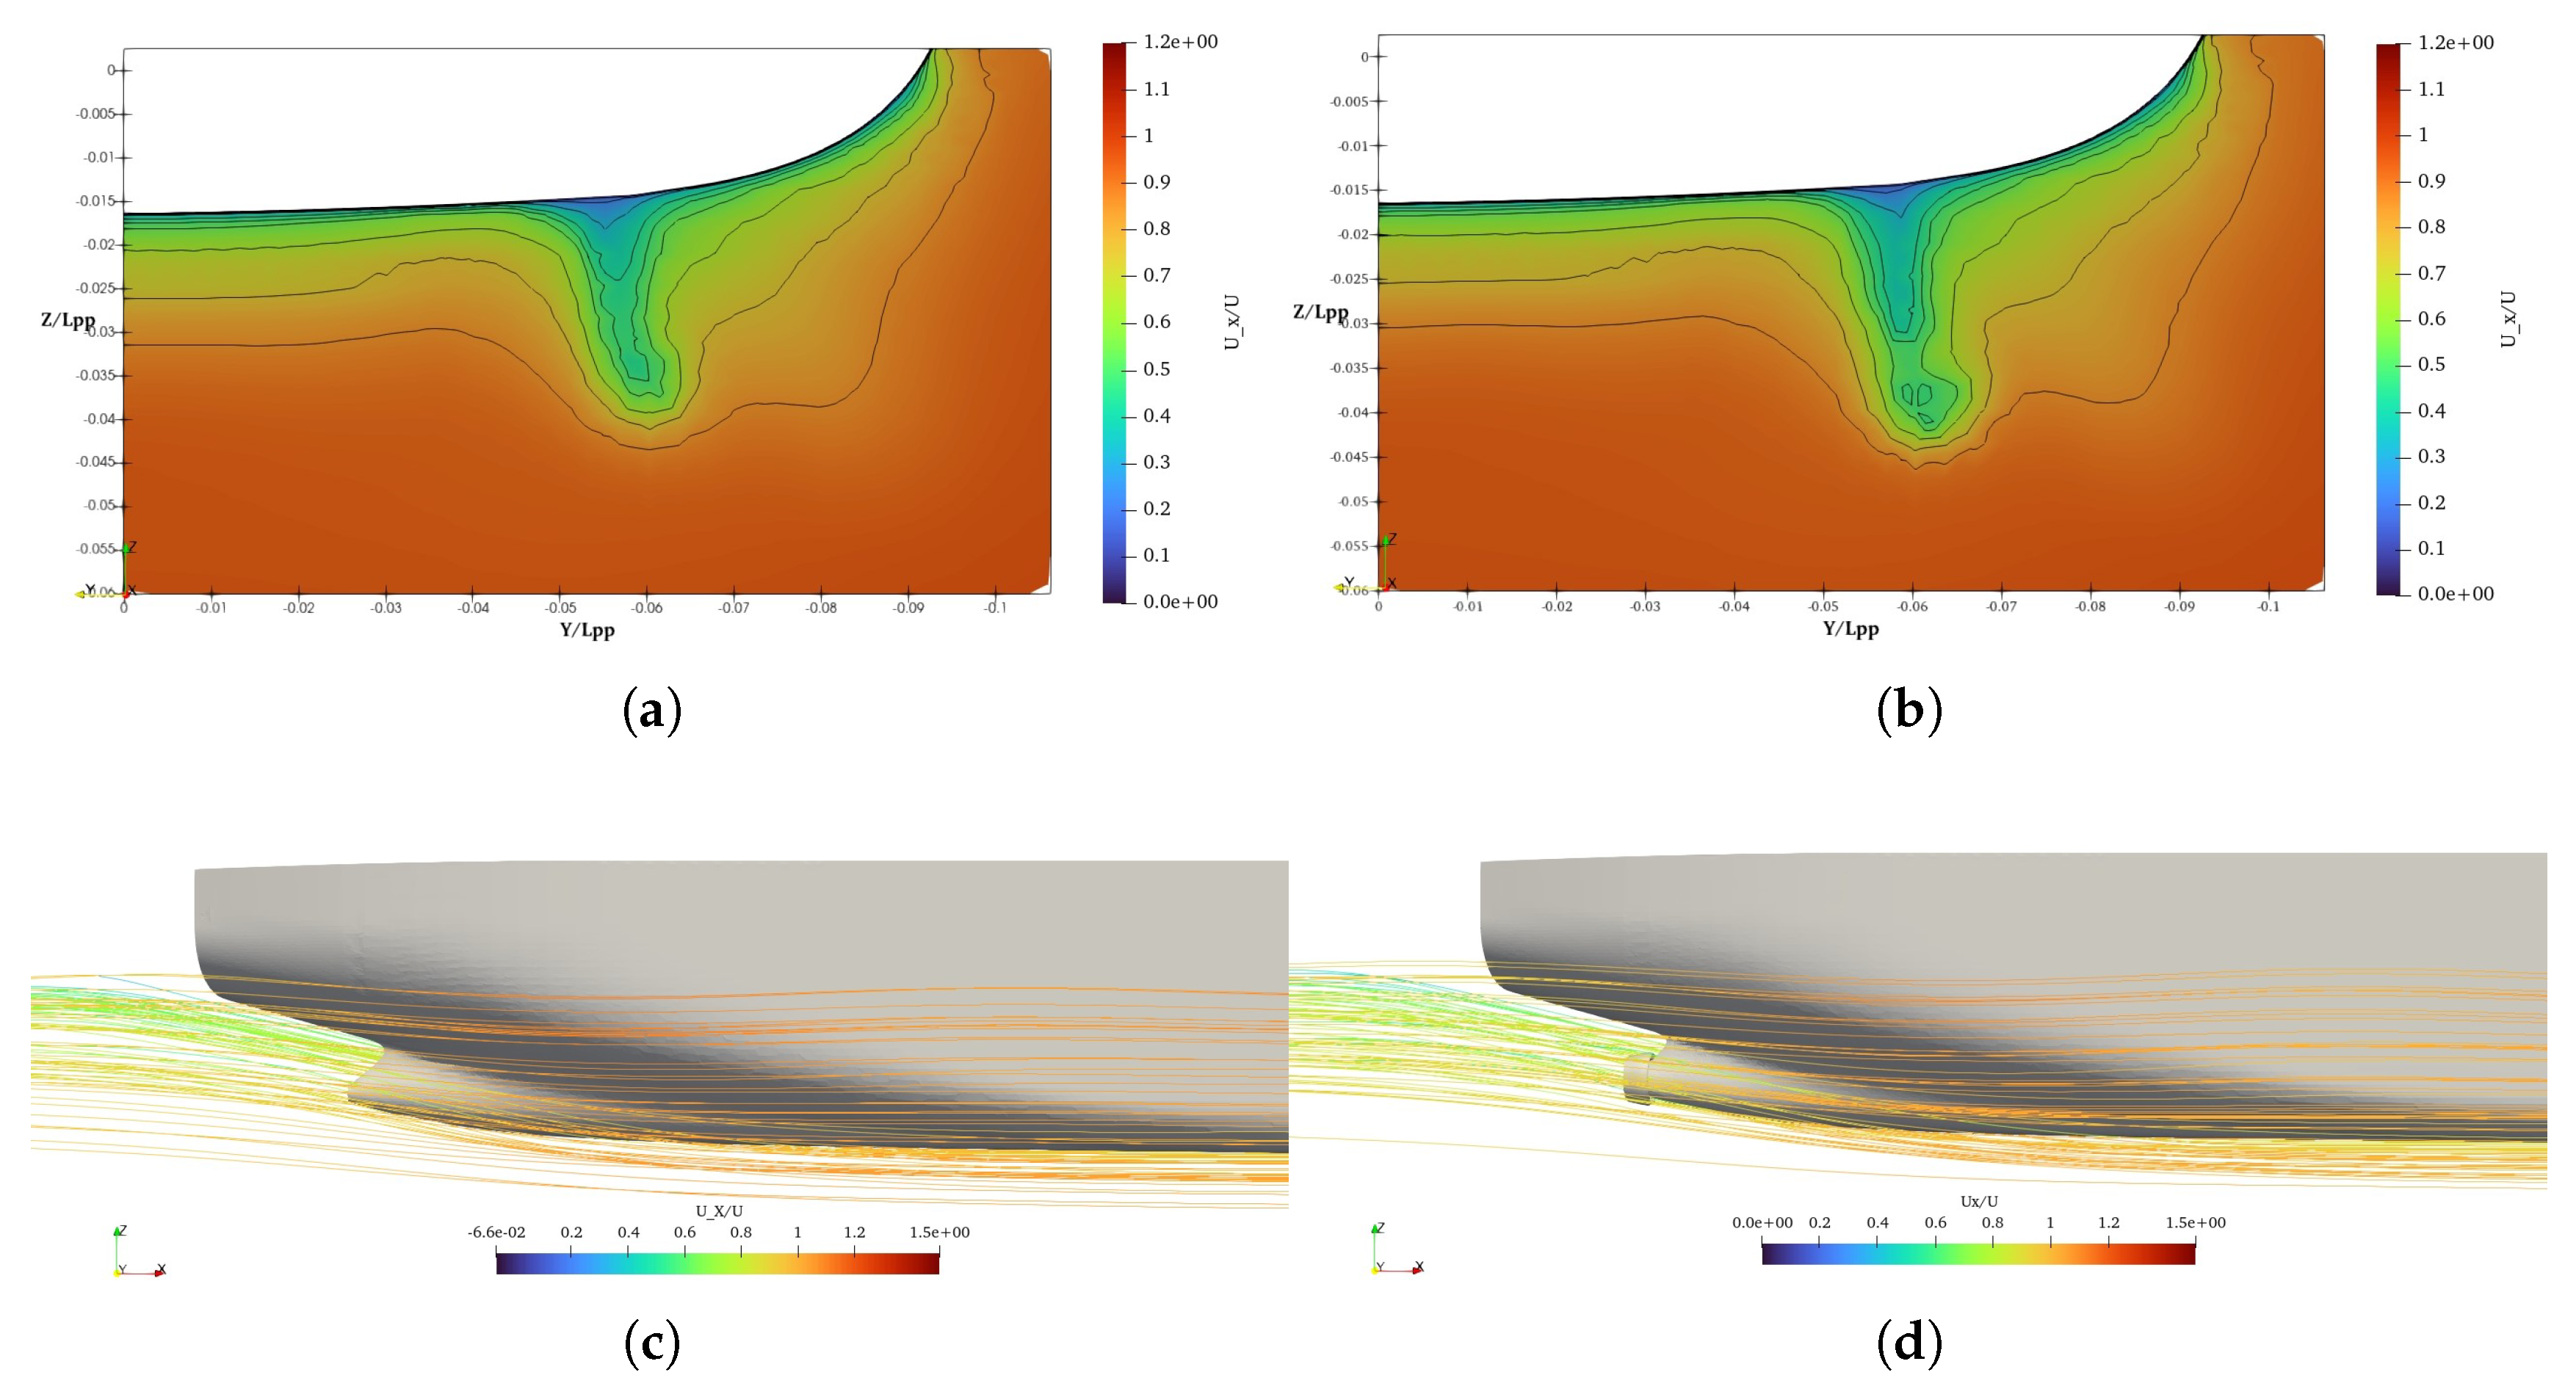
Figure 18.
Comparison of to total resistance between inland bulk carrier without and with ESD at different Froude numbers.
Figure 18.
Comparison of to total resistance between inland bulk carrier without and with ESD at different Froude numbers.
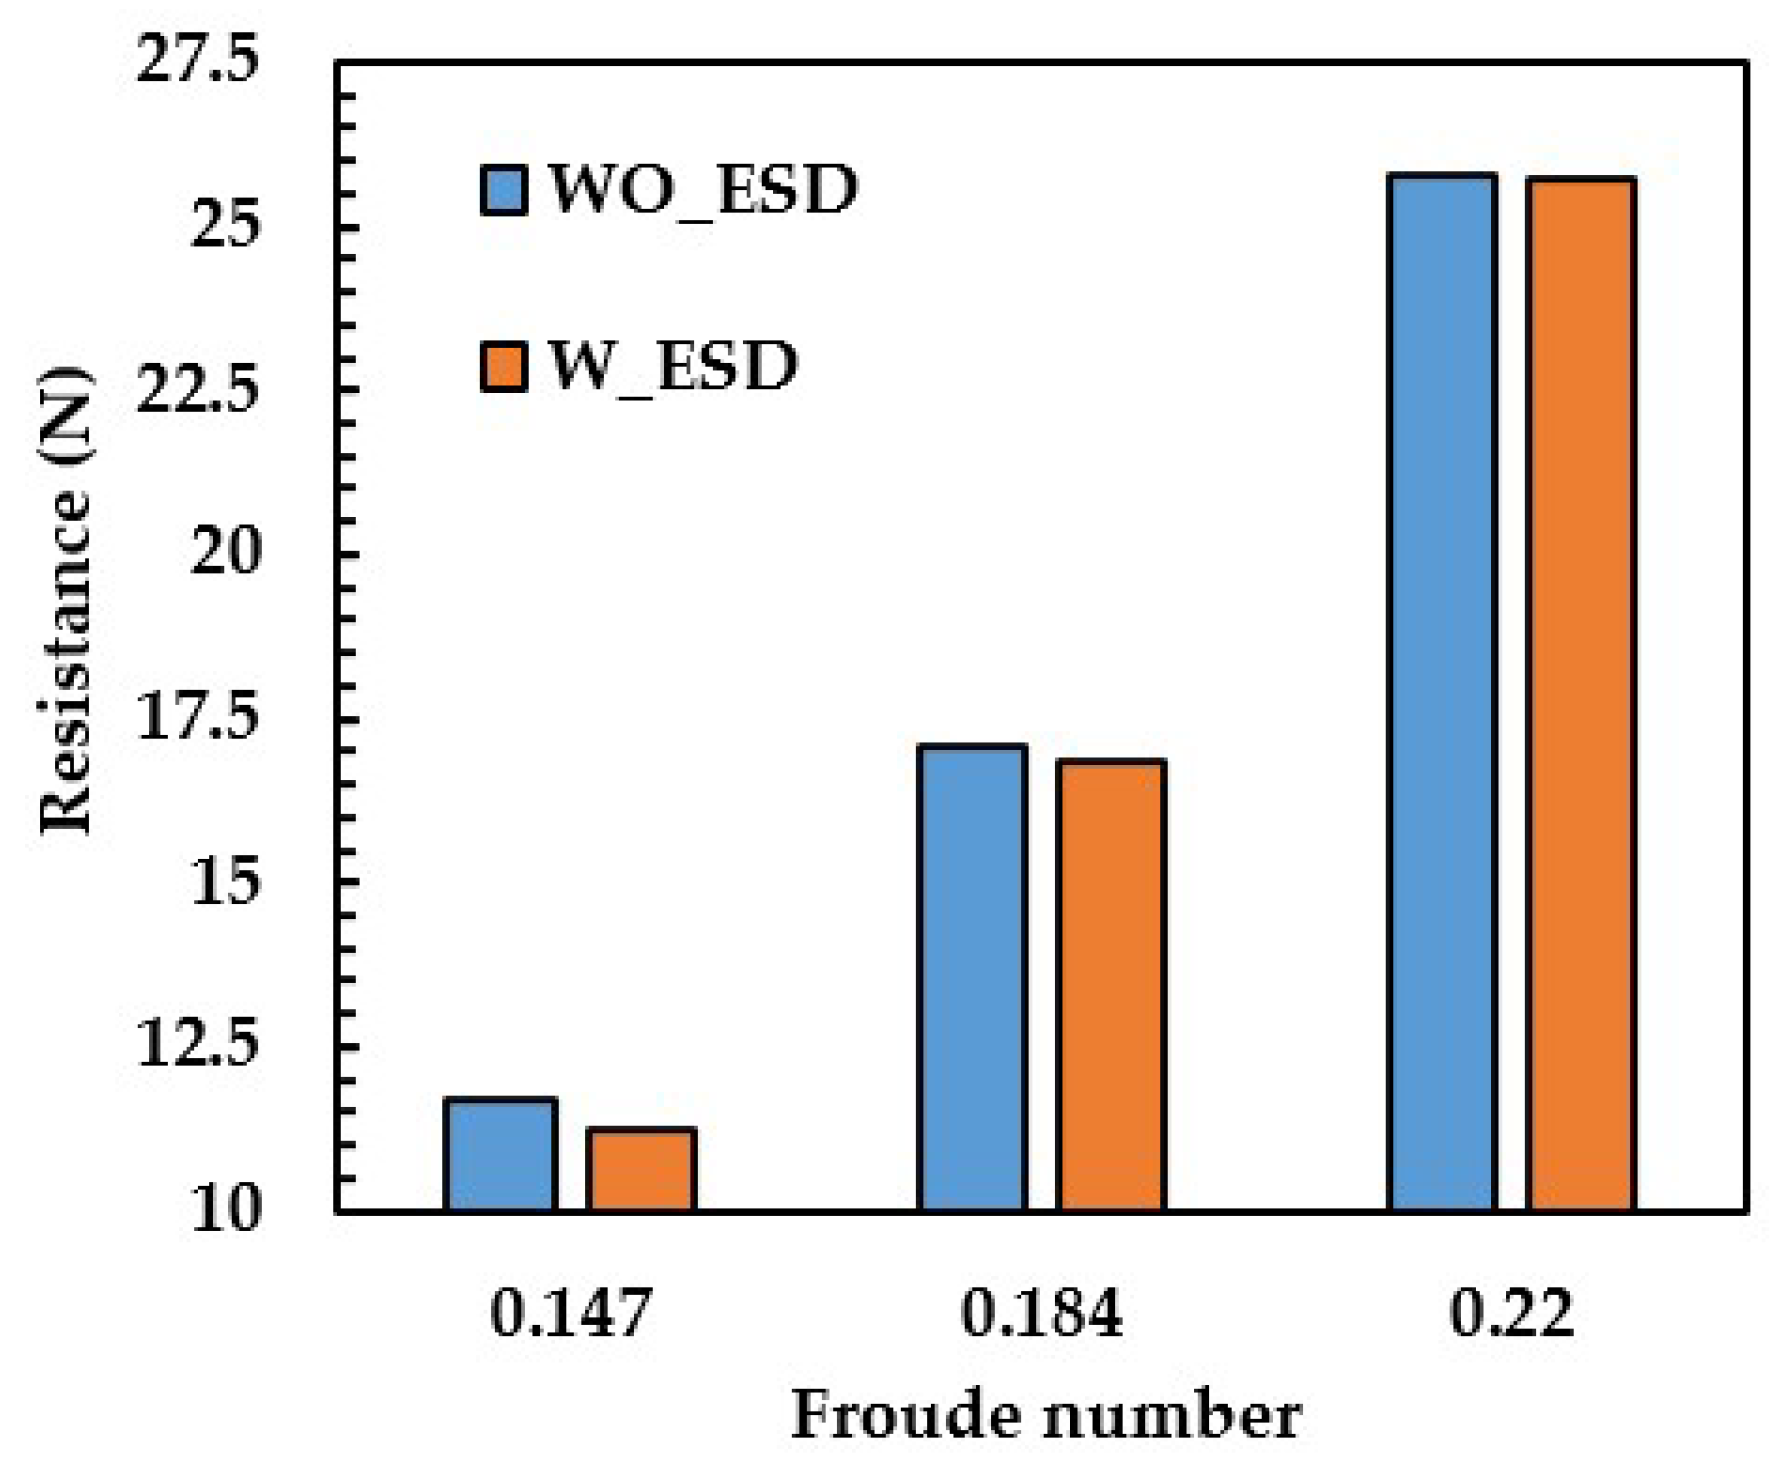

Table 1.
Mesh configuration for fine, medium and coarse grids.
| Mesh | Cell No. (million) | [X x Y x Z] (mm) | Minimum cell size (mm) | Layers | Layer coverage |
|---|---|---|---|---|---|
| FIne | 2.51 | 0.0132 x 0.0132 x 0.0085 | 0.0028 | 3 | 97.6 |
| Medium | 1.52 | 0.0156 x 0.0156 x 0.0100 | 0.0033 | 3 | 96.5 |
| Coarse | 1.02 | 0.0185 x 0.0185 x 0.0118 | 0.0039 | 3 | 95.8 |
Table 2.
Principal particulars of JBC hull.
| Specification | Symbol | Full Scale | Model Scale | Unit |
|---|---|---|---|---|
| Length between perpendiculas | 280.00 | 7.00 | meter | |
| Length waterline | 285.00 | 7.125 | meter | |
| Beam | B | 45.00 | 1.125 | meter |
| Depth | D | 24.00 | 0.625 | meter |
| Draft | T | 16.50 | 0.4125 | meter |
| Wetted surface area without ESD | 19556.10 | 12.222 | meter2 | |
| Wetted surface area with ESD | 19633.90 | 12.270 | meter2 | |
| Block coefficient | 0.858 | 0.858 | – | |
| Scale factor | 1 | 40 | – |
Table 3.
Validation of JBC hull without WED.
| Result | () | Trim (% ) | Sinkage ( %) |
|---|---|---|---|
| EFD | 4.289 | -0.180 | -0.086 |
| CFD | 4.280 | -0.189 | -0.093 |
| % Error | -0.20 | 5.179 | 8.803 |
Table 4.
Validation of JBC hull with WED.
| Result | () | Trim (% ) | Sinkage ( %) |
|---|---|---|---|
| EFD | 4.263 | -0.185 | -0.085 |
| CFD | 4.255 | -0.191 | -0.093 |
| % Error | -0.19 | 3.253 | 9.680 |
Table 5.
Verification study of JBC hull.
| Parameter | Cell No. (million) | () | Trim (% ) | Sinkage ( %) |
|---|---|---|---|---|
| (Fine) | 2.51 | 4.280 | -0.189 | -0.0935 |
| (Medium) | 1.52 | 4.374 | -0.191 | -0.0932 |
| (Coarse) | 1.02 | 4.330 | -0.190 | -0.0928 |
| Order of accuracy (p) | – | 4.425 | 18.05 | 0.873 |
| – | 0.0220 | 0.0089 | 0.0034 | |
| – | 0.0101 | 0.0004 | 0.0040 | |
| – | 0.0242 | 0.0005 | 0.0027 | |
| – | 0.0111 | 0.00002 | 0.03153 |
Table 6.
Variation of geometrical parameters of duct.
| Parameter | Range | Remark |
|---|---|---|
| Camber | 0 - 6 % | % of chord length (1st digit of NACA profile) |
| Position of camber | 30 - 70 % | % of chord length (2nd digit of NACA profile) |
| AoA | 2.5 - 25 deg. | angle of attack |
Table 7.
Results obtained from generated duct shape.
| Design stage | Sectional profile | Improvement |
|---|---|---|
| 1 | NACA 0020 (20 deg. AoA) | +0.430 |
| NACA 2420 (20 deg. AoA) | +1.05 | |
| NACA 4420 (20 deg. AoA) | +0.596 | |
| NACA 6420 (20 deg. AoA) | +0.609 | |
| 2 | NACA 2320 (20 deg. AoA) | +0.617 |
| NACA 2520 (20 deg. AoA) | +0.658 | |
| NACA 2620 (20 deg. AoA) | +1.062 | |
| NACA 2720 (20 deg. AoA) | +0.655 | |
| 3 | NACA 2620 (2.5 deg. AoA) | +1.26 |
| NACA 2620 (5 deg. AoA) | +2.01 | |
| NACA 2620 (10 deg. AoA) | +1.78 | |
| NACA 2620 (15 deg. AoA) | +1.38 | |
| NACA 2620 (25 deg. AoA) | -0.40 |
Table 8.
Principal particulars of inland bulk carrier.
| Specification | Symbol | Full Scale | Model Scale | Unit |
|---|---|---|---|---|
| Length between perpendiculas | 79.900 | 3.995 | meter | |
| Length waterline | 81.521 | 4.076 | meter | |
| Beam | B | 18.000 | 0.900 | meter |
| Depth | D | 6.000 | 0.300 | meter |
| Draft | T | 4.500 | 0.225 | meter |
| Wetted surface area without ESD | 1986.856 | 4.967 | meter2 | |
| Wetted surface area with ESD | 1999.108 | 4.997 | meter2 | |
| Block coefficient | 0.857 | 0.857 | – | |
| Scale factor | 1 | 20 | – |
Table 9.
Mesh configuration for fine, medium and coarse grids for inland bulk carrier.
| Mesh | Cell No. (million) | [X x Y x Z] (mm) | Minimum cell size (mm) | Layers | Layer coverage |
|---|---|---|---|---|---|
| FIne | 2.992 | 0.0108 x 0.0108 x 0.0070 | 0.0023 | 3 | 97.6 |
| Medium | 1.649 | 0.0131 x 0.0131 x 0.0085 | 0.00283 | 3 | 96.00 |
| Coarse | 1.30 | 0.0156 x 0.0156 x 0.010 | 0.0033 | 3 | 95.8 |
Table 10.
Verification study of inland bulk carrier hull.
| Parameter | (N) | ( (N) | (N) |
|---|---|---|---|
| (Fine) | 12.373 | 5.559 | 17.932 |
| (Medium) | 11.859 | 5.195 | 17.054 |
| (Coarse) | 11.559 | 5.153 | 16.712 |
| Order of accuracy (p) | 3.140 | 12.684 | 5.511 |
| 0.0415 | 0.0655 | 0.0489 | |
| 0.0259 | 0.0655 | 0.0489 | |
| 0.0727 | 0.0105 | 0.0389 | |
| 0.0443 | 0.0010 | 0.0159 |
Disclaimer/Publisher’s Note: The statements, opinions and data contained in all publications are solely those of the individual author(s) and contributor(s) and not of MDPI and/or the editor(s). MDPI and/or the editor(s) disclaim responsibility for any injury to people or property resulting from any ideas, methods, instructions or products referred to in the content. |
© 2025 by the authors. Licensee MDPI, Basel, Switzerland. This article is an open access article distributed under the terms and conditions of the Creative Commons Attribution (CC BY) license (http://creativecommons.org/licenses/by/4.0/).
Copyright: This open access article is published under a Creative Commons CC BY 4.0 license, which permit the free download, distribution, and reuse, provided that the author and preprint are cited in any reuse.


