
Submitted:
27 September 2025
Posted:
28 September 2025
You are already at the latest version
Abstract
The aerodynamic performance of a ship plays a crucial role in determining its efficiency, safety, and economic viability. While traditional ship design has primarily focused on optimizing hull forms to minimize water resistance acting on the hull, recent research highlights the growing importance of aerodynamic performances and wind drag acting on the ships, especially for ships with large accommodation above the water surface. In this study, aerodynamic performances of a cargo river ship were investigated by using Computational of Fluid Dynamics (CFD). From the results of analysis aerodynamic performance and wind drag acting on the original ship, several accommodation shapes have proposed for the ship to improve aerodynamic performances and reduce wind drag. The results were found that proposed accommodation shape for the ship, proposed a bow cover, modifed hatch cover and accommodation, which makes small change the ship structure, but it can improve aerodynamic performances and drastically reduce wind drag acting on the ship. Study on reducing wind drag acting on the ship is leading to lower fuel consumption, saving energy and improving economic efficiency.
Keywords:
hull
; resistance
; aerodynamic performance
; CFD
; wind drag
1. Introduction
Improving the energy efficiency of cargo ships has become a central objective in modern marine transportation, with the reduced resistance acting on the ship representing a key component of this effort [1,2,3,4,5]. While wind drag is typically the dominant factor in a ship’s total resistance, ships with large projected area above the waterline may experience significant wind drag, which in some cases constitutes a considerable proportion of the total resistance. For instance, a fully loaded container ship encountering headwinds can have wind drag accounting for nearly 10% of its total resistance. Inland waterway cargo ships, which are widely operated in Vietnam, often feature pronounced accommodation and wide, flat decks, resulting in a high windage area. Consequently, wind drag becomes especially critical for river ships, directly influencing fuel consumption, maneuverability, and operational safety under strong wind conditions.
Traditionally, standard ship design methodologies have primarily focused on refining hull shapes to minimize wind drag, often neglecting aerodynamic influences. The above-water hull, such as hatch cover, accommodation, is generally engineered for functional and stability criteria, with minimal aerodynamic optimization. In numerous instances, the wind load was regarded as a minor consideration, constituting merely a few percent of the total resistance under mild conditions. Nonetheless, as the demand for enhanced fuel efficiency and reduced emissions increases, there is a growing acknowledgment that wind drag acting on the accommodation must not be overlooked for high-windage ships. Blunt-fronted structures and protruding cargo, such as container stacks, can function as sails in the wind, generating considerable wind drag that increases fuel consumption and adversely affects handling in crosswinds.
In recent years, various studies have examined methods to mitigate wind drag acting on ships' hulls and accommodation. Wind tunnel experiments and Computational of Fluid Dynamics (CFD) models have been extensively utilized to examine ship aerodynamics. CFD, in particular, has proven to be a reliable tool for evaluating aerodynamic performance with good agreement with experimental results [1,2,3,4,6,7,8,9]. A focus of many studies has been on large ocean ships like container ships, which have extensive above-water hulls. Researchers have found that smoothing or streamlining the external shape of these ships can yield substantial wind drag reductions. Andersen et al. showed that an optimized container stacking configuration by presenting a smoother face to the wind significantly lowers wind forces on a 900 TEU container ship [1]. Kim et al. likewise tested various add-on devices on a container ship’s accommodation, such as gap protectors between container stacks and bow visors, and reported wind drag reductions up to 56% in certain headwind conditions [10]. Other modifications, including fitting side covers along the deck edges or adding a dome-shaped fairing at the bow, have been shown to cut the wind drag by roughly 30–40% [2,10]. These findings underscore that relatively simple design changes to the above-water hull can markedly improve a ship’s aerodynamic performance.
Beyond container carriers, studies have extended to ships with large accommodations, such as passenger vessels and specialty ships. Wind drag acting on high-profile passenger ships such as ro-ro ferries or cruise liners is a critical concern, and recent CFD analyses and wind tunnel tests confirm that aerodynamic performance optimizations can yield significant. Research by Ngo et al. examined a passenger ship with a tall frontal accommodation and proposed redesigned bow shapes that substantially reduced wind drag [3]. In other research, Ngo et al. have conducted a series of studies on hull accommodation interaction effects [4,11]. Their work on a wood-chip carrier demonstrated that reshaping the accommodation block and adding features like side guards can lessen the adverse interaction and lower the overall wind resistance acting on the ship. Related investigations by other authors have similarly confirmed that modifying the geometry of the accommodation or adding appendages can lead to appreciable reductions in wind forces on the hull [11,12]. Collectively, these works highlight that both the shape of a ship’s exposed profile and its heading relative to the oncoming wind are critical factors governing wind drag.
Despite the growing body of research on ship aerodynamics, relatively little attention has been given to inland waterway cargo ships. River ships often operate at lower velocities and in confined channels, yet they frequently encounter strong crosswinds over open stretches, making them susceptible to wind drag and lateral drift. In this study, we address this gap by evaluating the aerodynamic performance of a typical Vietnamese river cargo ship and analyzing how various orientations affect the pressure distribution around the ship. We employ CFD simulations using ANSYS Fluent version 19.2 with a RANS k–ε turbulence viscous model to compute the wind drag and pressure distribution acting on the hull and accommodation of the ship. By examining various wind angles and conditions, we identify the areas of high pressure and flow separation around the accommodation that contribute most to wind drag. The overall objective is to quantify the potential drag reduction from these design modifications and thereby demonstrate how aerodynamic refinement of the superstructure can improve the energy efficiency of river ships. This research contributes new knowledge on aerodynamic optimization and reducing wind drag for inland river ships, a topic that has seen limited study, and the findings can inform future ship design standards and retrofitting strategies for better performance in Vietnam’s inland waterway fleet.
2. Methodology
2.1. River Ship Model
2.2. Numerical Setup
In CFD simulations, the Reynolds-Averaged Navier–Stokes (RANS) equations are among the most widely applied approaches. The detailed methodologies and governing equations for numerical modeling have been extensively described in previous studies [1,3,6,7,13,14,15]. In this research, the aerodynamic performances of the ship are analyzed using the commercial CFD package ANSYS Fluent v.19.2, employing the k–ε turbulence viscous model [16,17,18]. The computational domain was defined with dimensions of 6.5L in length, L in width, and L in height, where L denotes the ship length. For this research, with an actual ship length of 43.25 m, the domain dimensions were determined as 200 m in length, 40 m in width, and 40 m in height. The domain was discretized using an unstructured mesh consisting of approximately 2.683 million cells.
Boundary conditions were imposed corresponding to wind velocities ranging from Beaufort level 1 to level 5, which represent Reynolds numbers between 6 × 10⁶ and 2.2 × 10⁷. The detailed input parameters are summarized in Table 2, and Figure 3 illustrates the computational domain and the mesh configuration.
In CFD simulations, each step of the modeling process can significantly influence the results. To obtain reliable results, all stages of the computation must strictly follow validated guidelines and best practices documented in authoritative references [2,5,7,11,19,20,21,22,23]. Moreover, the accuracy of numerical predictions can be verified by comparing the simulation results with experimental model tests or benchmark data from recognized studies. Grid convergence assessment, together with prior experience in applying CFD to similar problems, also serves as an important approach to evaluate the reliability of the simulation results [2,3,4,11,15,24,25].
In this study, a mesh convergence analysis was conducted using seven different mesh numbers, with corresponding y⁺ values ranging from 4.786 to 128.262. The simulations were carried out under identical boundary conditions, with a flow velocity corresponding to a Reynolds number of Rn = 6.26 × 10⁶. Table 3 and Figure 4 present the comparison of wind drag acting on the ship for the different mesh configurations. The results confirm that the selected mesh provides sufficient numerical accuracy and stability for the CFD simulations.
The comparison of wind drag coefficients acting on the ship, as illustrated in Figure 4, indicates that the deviation resulting from varying the mesh density in the investigated region remains below 2.63%. As the y+ value decreases, the deviation is significantly reduced, reaching below 0.5%. These results confirm the mesh convergence and provide a reliable basis for the subsequent numerical simulations conducted in this study.
2.3. Results of Aerodynamic Performance Acting on the Original River Cargo Ship
Based on the calculation of the aerodynamic performances of the original model, Figure 5 shows the results of the pressure distribution around the hull and wind drag acting on the ship in the different Reynolds numbers. The pressure distribution around and over the hull surface of the ships shows that the bow shape and the accommodation have higher-pressure areas than other areas. Thus, the concentration of pressure areas occurs in areas with large and sharply changing wind surfaces on the hull. These are the areas that may need to be improved in design to reduce the area of this high-pressure area. The pressure exerted on the hull causes wind drag, so it is essential to reduce the areas of high pressure during the ship's design process. In addition, it is possible to change the ship's operating posture or adjust the wind direction acting on the ship to control and change the areas of high pressure acting on the ship, helping to reduce the wind drag acting on the ship.
Figure 6 shows that as the velocity increases, the wind drag coefficient acting on the ship tends to decrease. In the velocity range corresponding to Reynolds numbers below 18.6 x 10⁶, the wind drag coefficient acting on the hull tends to stabilize and change less than when the velocity increases beyond the Reynolds limit of 18.6 × 10⁶. The results of wind drag acting on the ship surveyed above are consistent with the CFD calculation results obtained on the pressure distribution and flow around the ship, as shown. Table 4 shows the detailed wind drag acting on the ship.
In the calculation, the wind drag coefficient is defined as:
Cd = Cd(f) + Cd(p)
Where: Cd is the total wind drag coefficient
Cd(f) is the component of the frictional viscous wind drag
Cd(p) is the component of the pressure viscous wind drag
Rd is the total wind drag acting on the ship, N
V is the velocity of the ship, m/s
3. Effect of Ship Operating Attitude on Aerodynamic Performances
In this section, the effect of the ship’s operating attitude on its aerodynamic performance and the wind drag acting on the vessel is comparatively analyzed. The objective is to clarify how operating attitude influences wind drag and to assess the potential for reducing wind drag through attitude adjustment. Two scenarios are considered: the ship operating in a balanced condition with a 0° bow angle, and the ship operating with a 3-degree bow angle. Aerodynamic performance is evaluated for both cases across the ship’s operating velocity range, corresponding to wind levels from 1 to 5. Figure 7 shows a model of the ship in computation.
Figure 8 presents the simulation results of the pressure distribution around the hull when the ship operates with a 3-degree bow angle. Compared to the balanced position (0° bow angle), the high-pressure region on the bow surface increases, while part of the high-pressure area on the accommodation decreases due to the effect of the bow angle. These changes in pressure distribution directly influence the wind drag acting on the hull.
Figure 9 compares the wind drag between the balanced position and the 3-degree bow angle cases. At low velocity (Rn < 8.67 × 10⁶), the wind drag components are nearly identical in both cases. As the velocity increases, differences become more noticeable, with a maximum of up to 5.33%. In the intermediate range (Rn = 11.2 × 10⁶ to 18.60 × 10⁶), the 3-degree bow angle reduces the total wind drag acting on the ship compared to the balanced position. At high velocity (Rn=22.30 × 10⁶), the wind drag acting on the ship increases at the 3-degree bow angle condition.
In practice, research on ship design indicates that the vessel’s operating posture has a significant influence on its stability and balance. Therefore, to ensure safety, the ship must not only be operated in a posture that minimizes wind drag acting on the hull but also in one that maintains sufficient stability and balance, thereby safeguarding both crew and cargo. The results show that to reduce the wind drag acting on the ship, we can develop a new accommodation for the ship to minimize the effect on its aerodynamic performance during transportation. Table 5 and Table 6 show the detailed wind drag acting on the ship in the 3-degree bow angle condition, and compare with those of the balanced condition.
The results indicate that the frictional viscous wind drag component acting on the ship remains nearly identical under both operating conditions, with a difference of less than 3.88%. In contrast, the pressure-induced wind drag component shows a clear variation, as presented in Table 6. This discrepancy is likely attributable to differences in the pressure and velocity distributions around the ship under the two operating conditions.
4. Developed Accommodation to Reduce Wind Drag Acting on the Ship
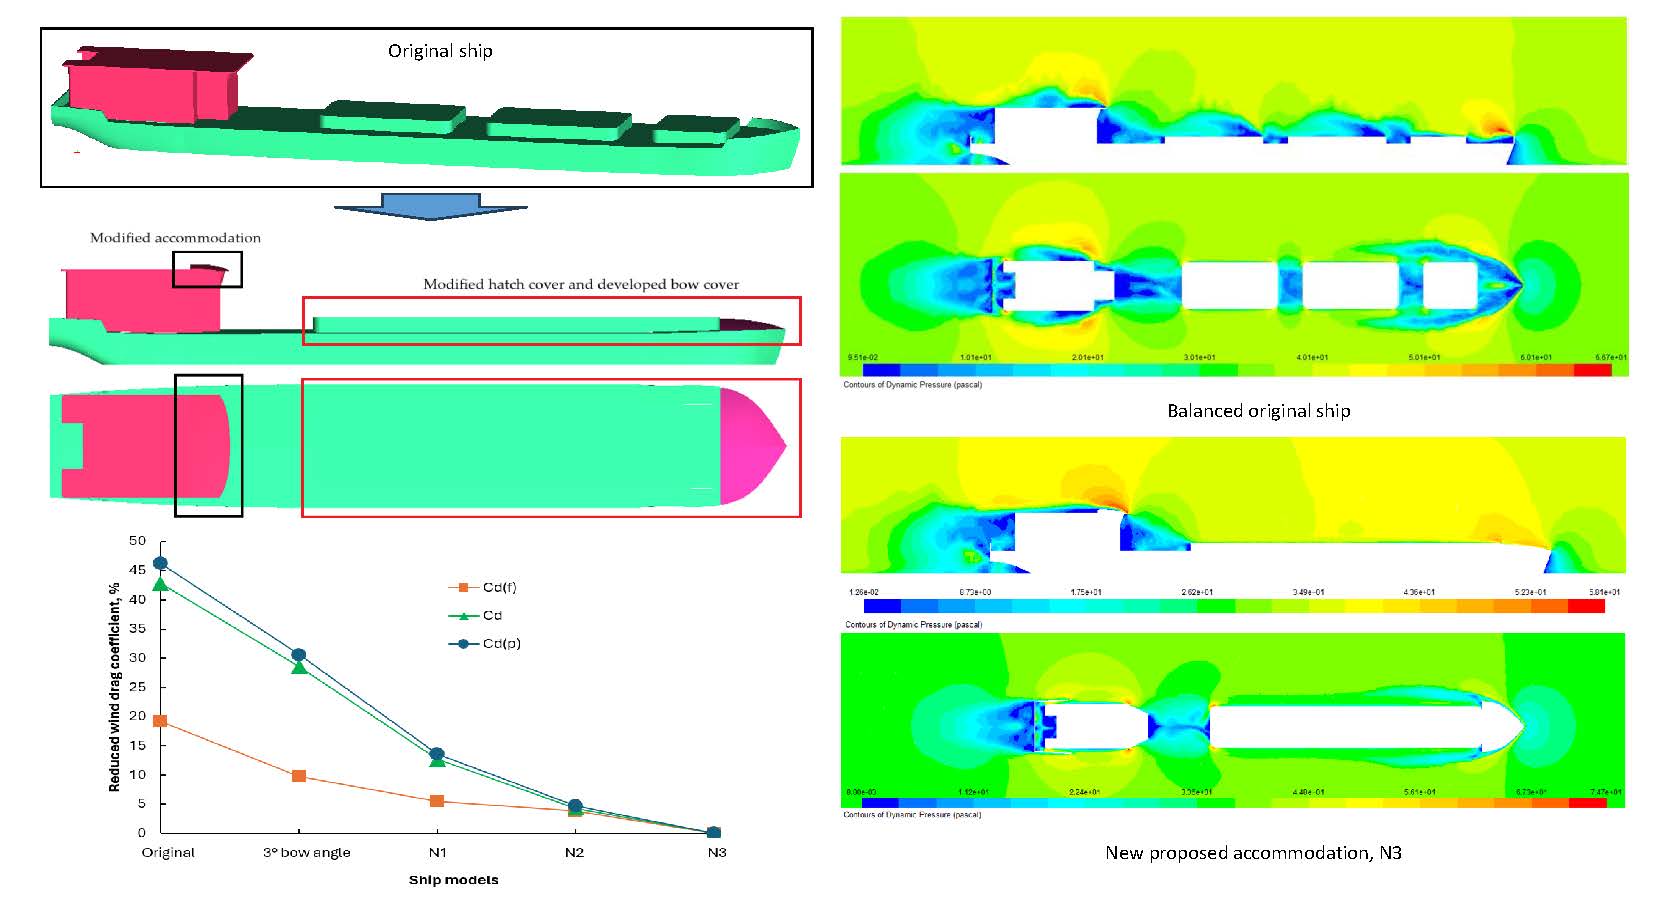
In this section, several structural modifications to the ship’s accommodation are proposed to reduce wind drag. The pressure distribution around the ships (Figure 5 and Figure 8) reveals pronounced flow separation occurring behind the accommodation and bow cover, which contributes significantly to aerodynamic resistance. This observation suggests that refining these structures to improve pressure recovery and mitigate flow separation could effectively lower wind drag.
Accordingly, three design models were developed from the original ship: hull with a bow cover (N1), hull with a modified hatch cover (N2), and a redesigned accommodation structure to enhance aerodynamic performance (N3). The proposed designs are illustrated in Figure 10. CFD simulations were conducted for all configurations under identical operating conditions to evaluate their aerodynamic performances and wind drag acting on the new ships. In this study, the simulations were done for all models at the Reynolds number of 18.6 x 10⁶ in head wind.
Figure 11 and Figure 12 present the pressure distribution around and over the hull surface for the investigated ship configurations. The CFD results of the pressure distribution corresponding to the different modifed model, N1: hull with a bow cover, N2: hull with a modified hatch cover, and N3: hull with a modified accommodation, serve as a basis for elucidating the effects of accommodation shape on the ship’s aerodynamic performances, as well as the underlying mechanisms contributing to variations in wind drag acting on the ship.
The results presented in Figure 11 illustrate the distribution of dynamic pressure around the investigated ships. The yellow and red regions indicate areas of high dynamic pressure, while the blue regions represent areas of low dynamic pressure. As shown in the figure, the pressure distribution changes noticeably with different accommodations. When the hull is equipped with a bow cover and hatch cover, the low-pressure regions (blue colour) around the hull, particularly behind the bow cover and around the hatch cover area, are significantly reduced compared to the original configuration. This reduction in low dynamic pressure regions may contribute to lowering the wind drag acting on the hull. Figure 12 shows the pressure distribution over the hull surface of the ships.
The pressure distribution results over the hull surface, as shown in Figure 12, clearly illustrate the variation of pressure regions corresponding to different accommodations. The red and yellow regions represent areas of high static pressure, while the blue regions indicate low-pressure zones acting on the ships. These results highlight the significant changes in surface pressure distribution caused by the modified accommodation, which consequently affect the wind drag acting on the hull. Table 7 and Table 8 show the wind drag acting on the ships with different accommodation shapes, and compared with those of the original ship in balanced condition.
The results presented in Table 7 and Table 8 clearly demonstrate that the developed bow cover, modified hatch cover, and redesigned accommodation significantly reduced the wind drag acting on the ship. Among the proposed configurations, the N3 model achieved the greatest improvement, showing a reduction of up to 42.82% in total wind drag compared to the original design. Figure 13 provides a comparison of the wind drag coefficients for the different accommodations, highlighting the substantial aerodynamic benefits achieved through these design modifications.
The reduction in wind drag can be attributed to the improved pressure distribution and reduced flow separation around the proposed accommodations, as previously observed in the pressure distribution results. By streamlining the bow and upper deck, the modified designs mitigate high-pressure accumulation on the windward surfaces and promote smoother airflow along the hull, thereby decreasing wind drag and enhancing the ship’s overall performance. The results in Figure 14 clearly show a substantial reduction in the pressure wind drag component of wind drag acting on the ship, with a decrease of up to 46.21% compared to the original configuration. In contrast, the frictional component of wind drag shows only a slight reduction compared to the pressure wind drag component.
5. Conclusions
In this study, the aerodynamic performances of an inland cargo ship were investigated. Based on the CFD analysis results of pressure distribution and wind drag acting on the original ship, several accommodations were proposed for the ship to improve aerodynamic performance and reduce wind drag acting on the ship. The main conclusions are as follows:
The CFD simulations clarified the pressure distribution and wind drag acting on the ship in both operating conditions, the balanced condition and the 3° bow angle condition. These results provide a useful basis for further studies on improving aerodynamic performance and reducing wind drag acting on the ships.
Within the investigated velocity range of Reynolds numbers from 6.2 × 10⁶ to 22.3 × 10⁶, the wind drag acting on the ship is slightly different between the two conditions, less than 5.33%.
The addition of design features such as a bow cover, modified hatch covers, and modified accommodation can significantly enhance the aerodynamic performance of the original ship. In particular, the N3 model, which fully proposed a bow cover, modified hatch cover, and accommodation, achieved up to a 42.82% reduction in total wind drag acting on the ship.
The results demonstrate that a simple and easily applicable accommodation shape can be implemented on existing ships to effectively reduce wind drag. These findings could be valuable for the future design and development of new inland cargo ships with improved aerodynamic efficiency and fuel savings.
Author Contributions
Conceptualization, N.V.He, L.D.An; methodology, N.V.He, H.C.Liem and B.T. Danh; software, B.T. Danh, H.C.Liem and L.D.An; validation, N.V.He, L.D.An; writing—original draft preparation, N.V.He, L.D.An and B.T.Danh; writing—review and editing N.V.He, H.C.Liem; supervision, N.V.He; project administration, N.V.He. All authors have read and agreed to the published version of the manuscript.
Funding
Hanoi University of Science and Technology (HUST).
Acknowledgments
This research is funded by Hanoi University of Science and Technology (HUST) under project number T2023-PC-015. The authors would like to warmly express their thanks for the support.
Conflicts of Interest
The authors declare no conflict of interest.
References
- Andersen, I.M.V. , Wind loads on post-panamax container ship. Ocean engineering 2013, 58, 115–134. [Google Scholar] [CrossRef]
- Van He, N., K. Mizutani, and Y. Ikeda, Reducing air resistance acting on a ship by using interaction effects between the hull and accommodation. Ocean engineering 2016, 111, 414–423. [Google Scholar] [CrossRef]
- Van He, N., N. Van Hien, and N.-T. Bui, Analyis of aerodynamic performance of passenger ship with different frontal accommodations using CFD. Ocean engineering 2023, 270, 113622. [Google Scholar] [CrossRef]
- He, N.V. , et al., Interaction effect between hull and accommodation on wind drag acting on a container ship. Journal of Marine Science and Engineering 2020, 8, 930. [Google Scholar] [CrossRef]
- Fujiwara, T. , et al. Experimental investigation and estimation on wind forces for a container ship. in ISOPE International Ocean and Polar Engineering Conference. 2009. ISOPE.
- Wang, P., F. Wang, and Z. Chen, Investigation on aerodynamic performance of luxury cruise ship. Ocean Engineering 2020, 213, 107790. [Google Scholar] [CrossRef]
- Janssen, W., B. Blocken, and H. van Wijhe, CFD simulations of wind loads on a container ship: Validation and impact of geometrical simplifications. Journal of wind engineering and industrial aerodynamics 2017, 166, 106–116. [Google Scholar] [CrossRef]
- Kalassov, N. , et al. , Integrated Approach to Aerodynamic Optimization of Darrieus Wind Turbine Based on the Taguchi Method and Computational Fluid Dynamics (CFD). Applied Sciences 2025, 15, 5739. [Google Scholar]
- İnan, A.T. and M. Ceylan, Aerodynamic analysis of fixed-wing unmanned aerial vehicles moving in swarm. Applied Sciences 2024, 14, 6463. [Google Scholar] [CrossRef]
- Kim, Y. , et al. Design and performance evaluation of superstructure modification for air drag reduction of a container ship. in ISOPE International Ocean and Polar Engineering Conference. 2015. ISOPE.
- Van He, N., K. Mizutani, and Y. Ikeda, Effects of side guards on aerodynamic performances of the wood chip carrier. Ocean engineering 2019, 187, 106217. [Google Scholar] [CrossRef]
- Toan, N.C. and N. Van He, Effect of hull and accommodation shape on aerodynamic performances of a small ship. Vietnam Journal of Marine Science and Technology 2018, 18, 413–421. [Google Scholar] [CrossRef]
- Zhou, L. , et al., Computational fluid dynamic (CFD), in Discrete Element Method for Multiphase Flows with Biogenic Particles: Agriculture Applications. 2024, Springer. p. 65-82.
- Bhaskaran, R. and L. Collins, Introduction to CFD basics. Cornell University-Sibley School of Mechanical and Aerospace Engineering, 2002: p. 1-21.
- Zhang, Y., P. Ke, and P. Hong, Aerodynamic drag reduction analysis of race walking formations based on CFD numerical simulations and wind tunnel experiments. Applied Sciences 2023, 13, 10604. [Google Scholar] [CrossRef]
- Sodja, J. and R. Podgornik, Turbulence models in CFD. University of Ljubljana, 2007: p. 1-18.
- Piquet, J. , Turbulent flows: models and physics. 2013: Springer Science & Business Media.
- Collie, S., M. Gerritsen, and P. Jackson, A review of turbulence modelling for use in sail flow analysis. 2001: Department of Engineering Science, University of Auckland Auckland, New Zealand.
- Wnęk, A. and C.G. Soares, CFD assessment of the wind loads on an LNG carrier and floating platform models. Ocean engineering 2015, 97, 30–36. [Google Scholar] [CrossRef]
- Viola, I.M. , Downwind sail aerodynamics: A CFD investigation with high grid resolution. Ocean engineering 2009, 36, 974–984. [Google Scholar] [CrossRef]
- Van He, N. , Effect of mesh on CFD aerodynamic performances of a container ship. Vietnam Journal of Marine Science and Technology 2020, 20, 343–353. [Google Scholar]
- Watanabe, I. , et al. In A study on reduction of air resistance acting on a large container ship. in Proceedings of the 8th Asia-Pacific Workshop on Marine Hydrodynamics in Naval Architecture, Ocean Technology and Constructions, Hanoi, Vietnam. 2016. [Google Scholar]
- Lisowski, F. and E. Lisowski, Determination of aerodynamic drag coefficients of longitudinal finned tubes of LNG ambient air vaporizers using CFD and experimental methods. Applied Sciences 2022, 12, 10865. [Google Scholar] [CrossRef]
- Nguyen, T. , et al. Numerical studies on air resistace reduction methods for a large container ship with fully loaded deck-containers in oblique winds. in MARINE VII: proceedings of the VII International Conference on Computational Methods in Marine Engineering. 2017. CIMNE.
- Sugata, K. , et al. In Reduction of wind force acting on Non Ballast Ship. in Proceedings of the 5th Asia Pacific Workshop on Marine Hydrodynamics-APHydro2010, Osaka, Japan. 2010. [Google Scholar]
Figure 1.
Body plan of the traditional river cargo ship in Vietnam.
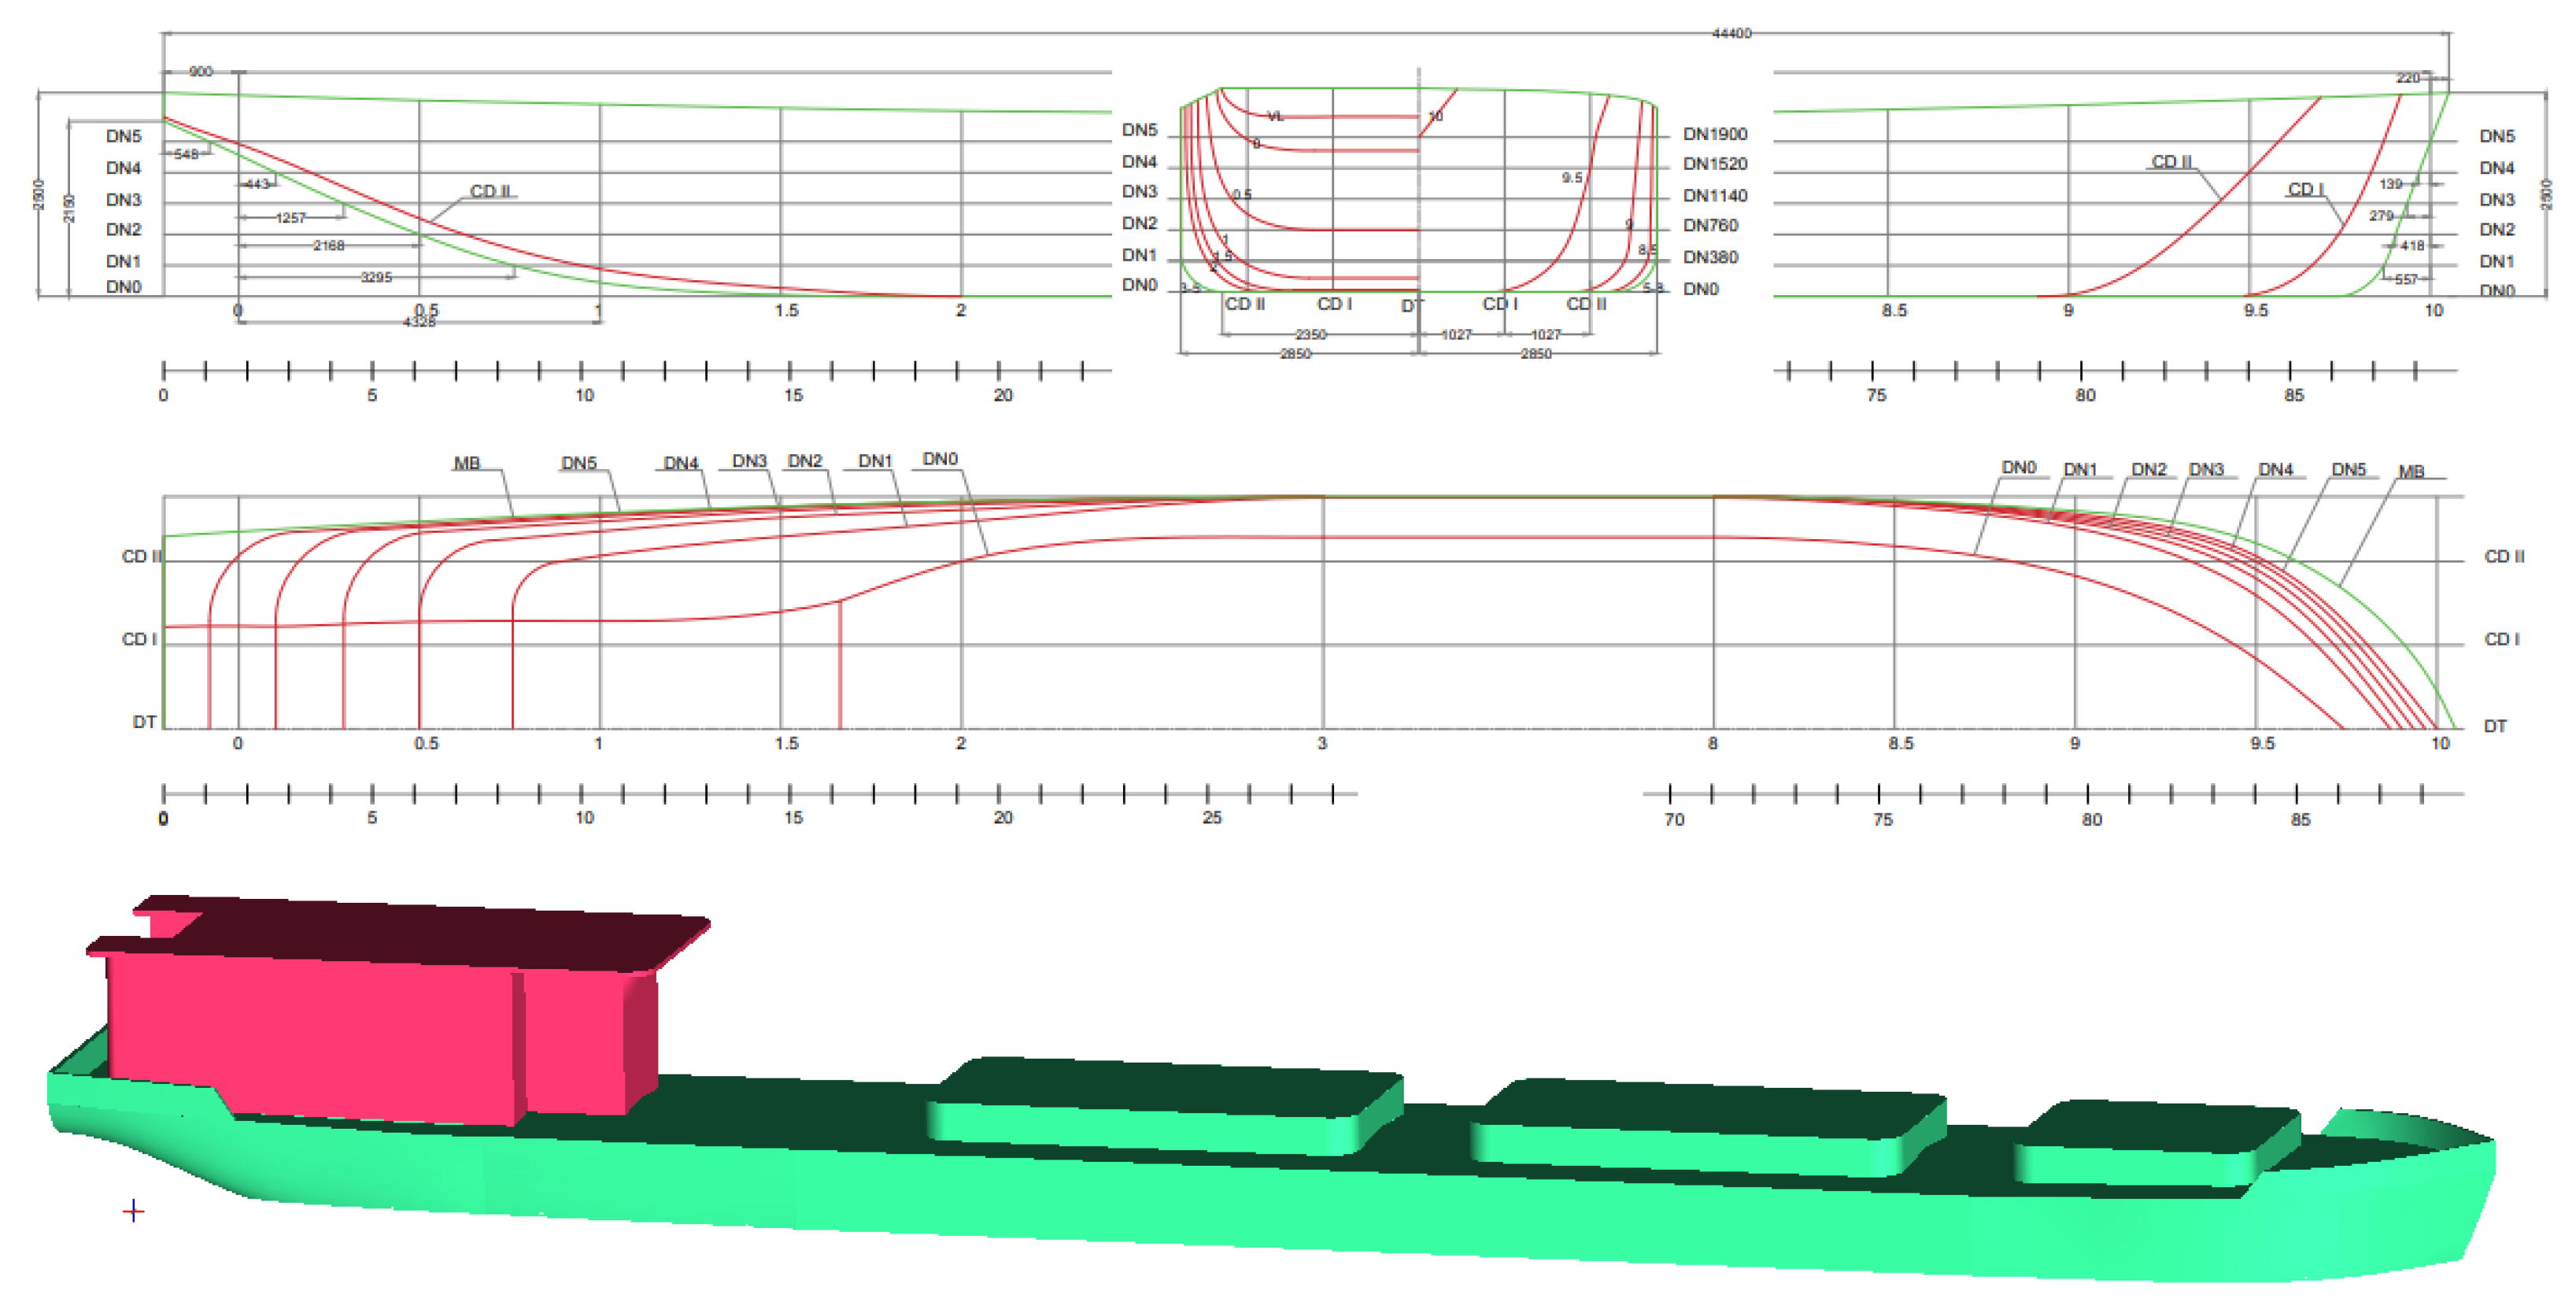
Figure 2.
Accommodation of the original river cargo ship.
Figure 3.
Computational domain and mesh.
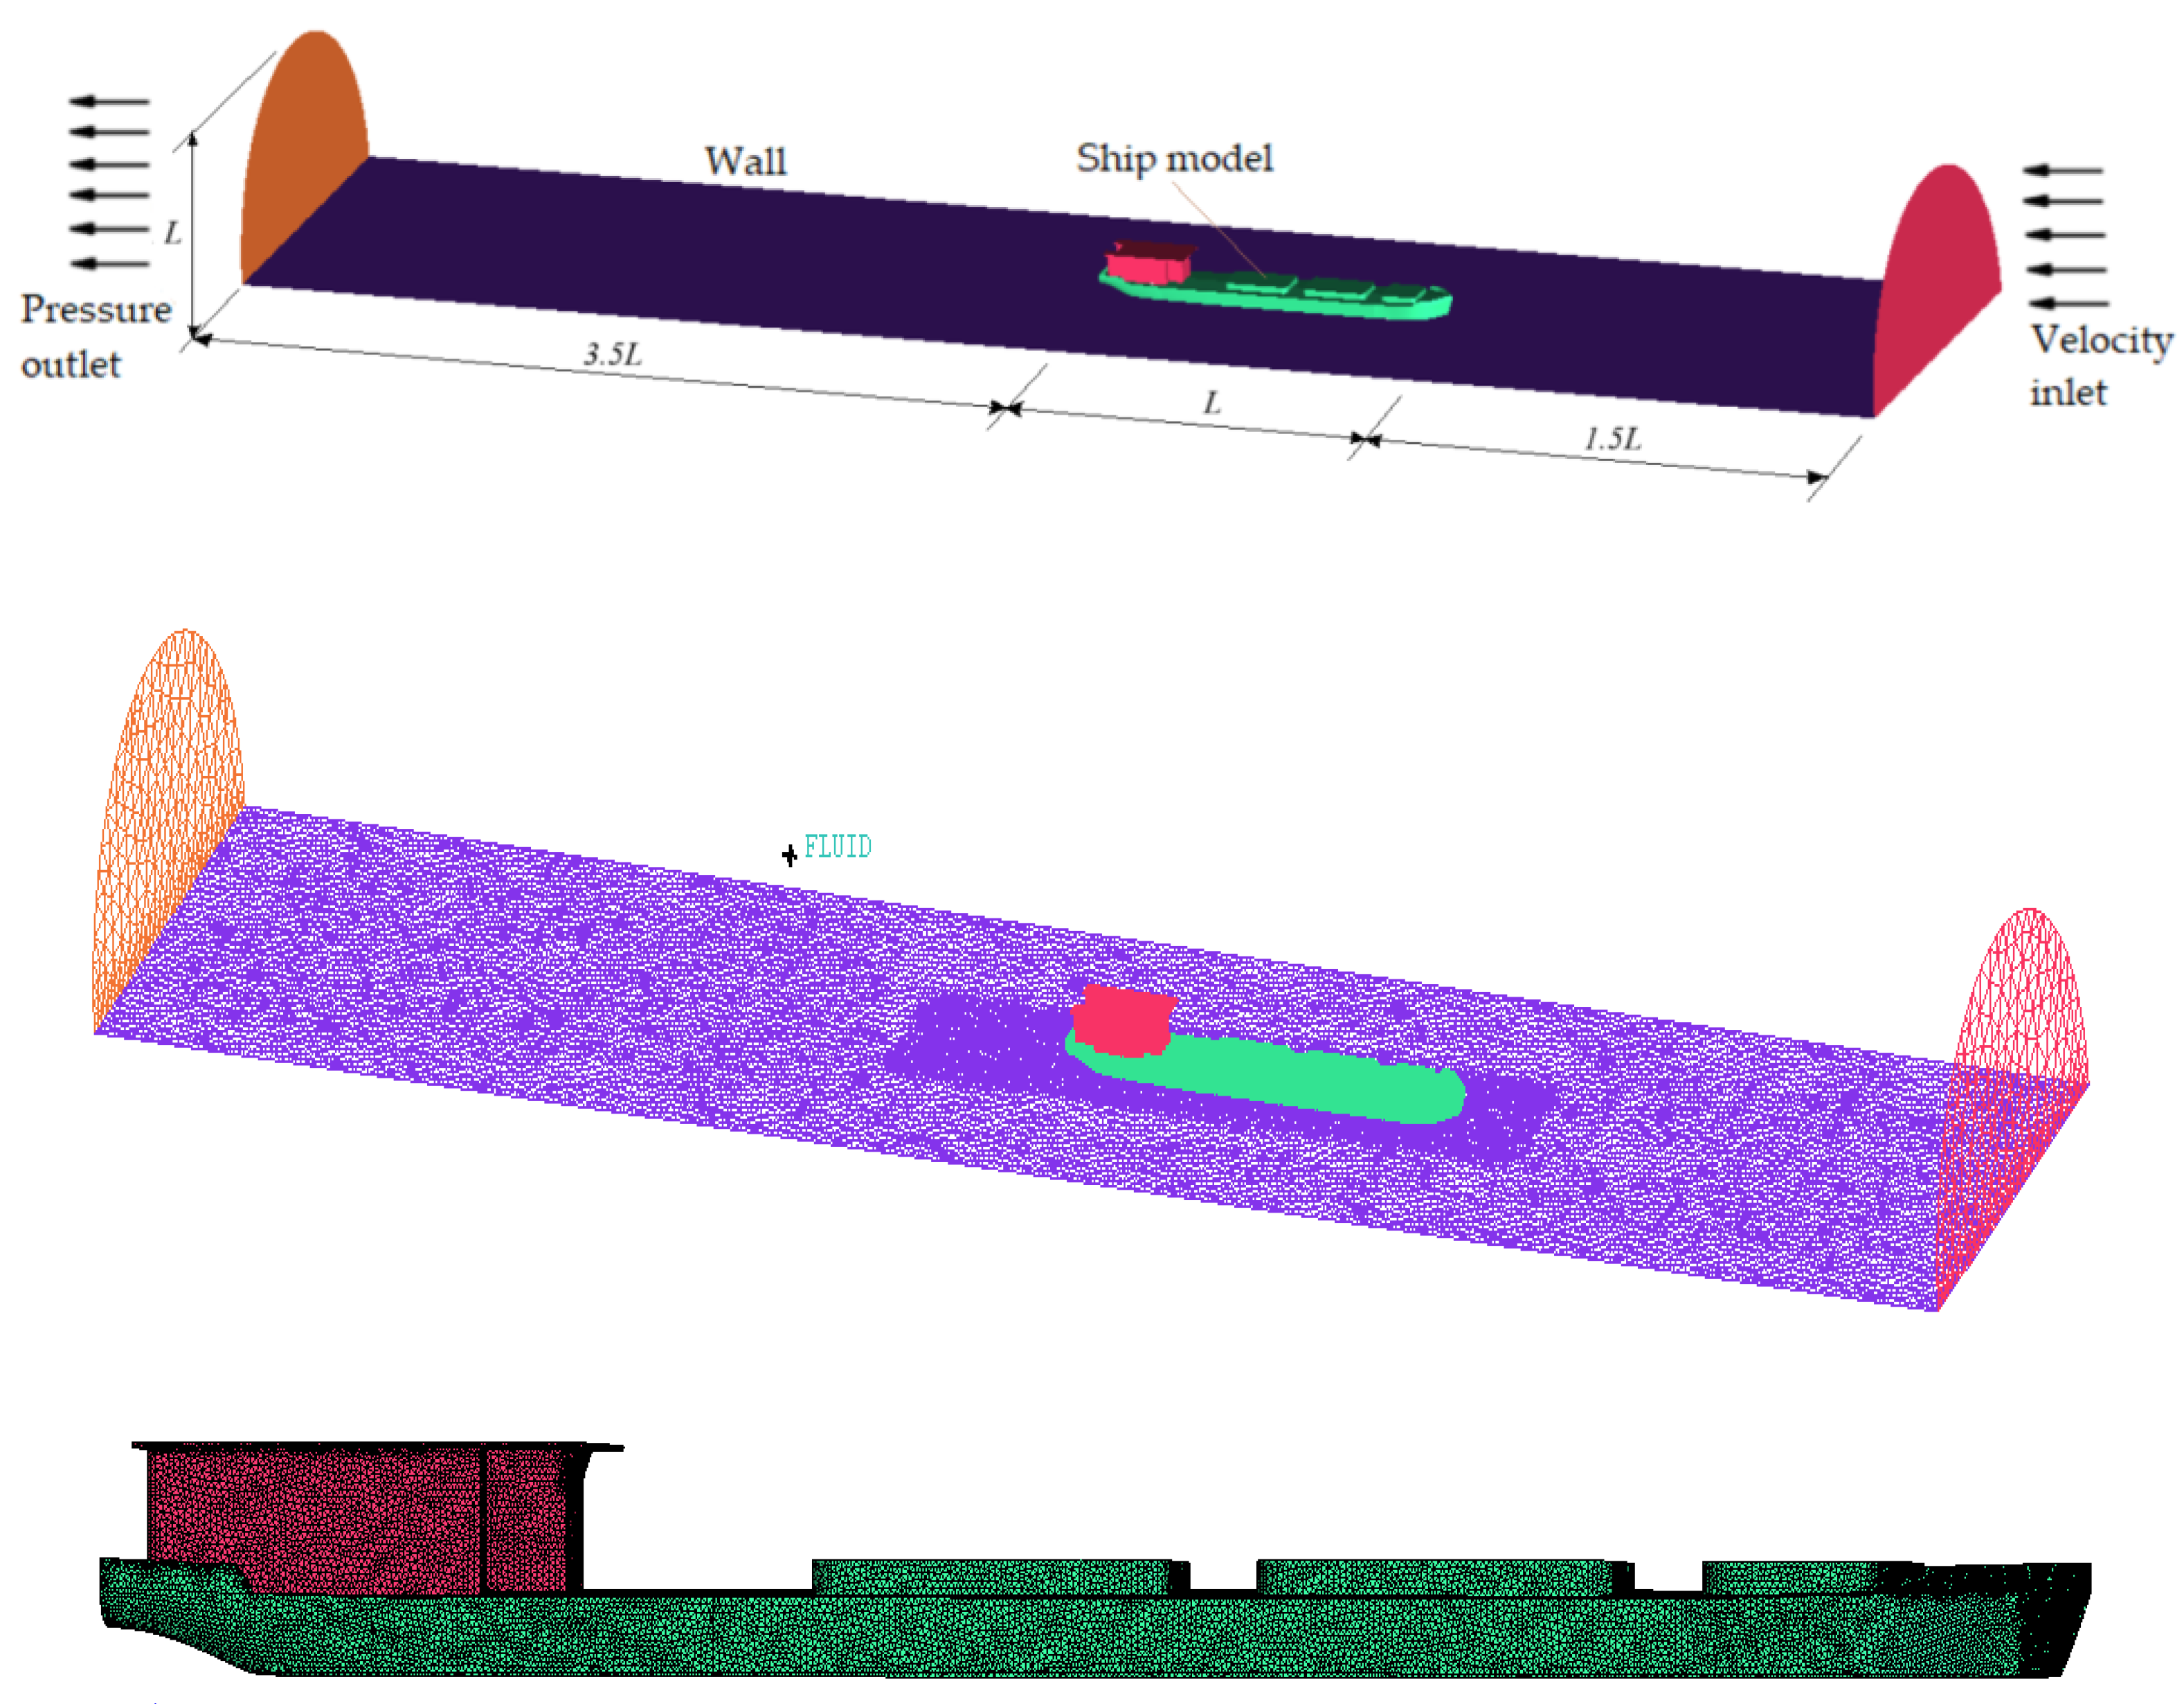
Figure 4.
Effect of mesh number on wind drag acting on the ship in head wind, at Rn=6.26 × 10⁶.
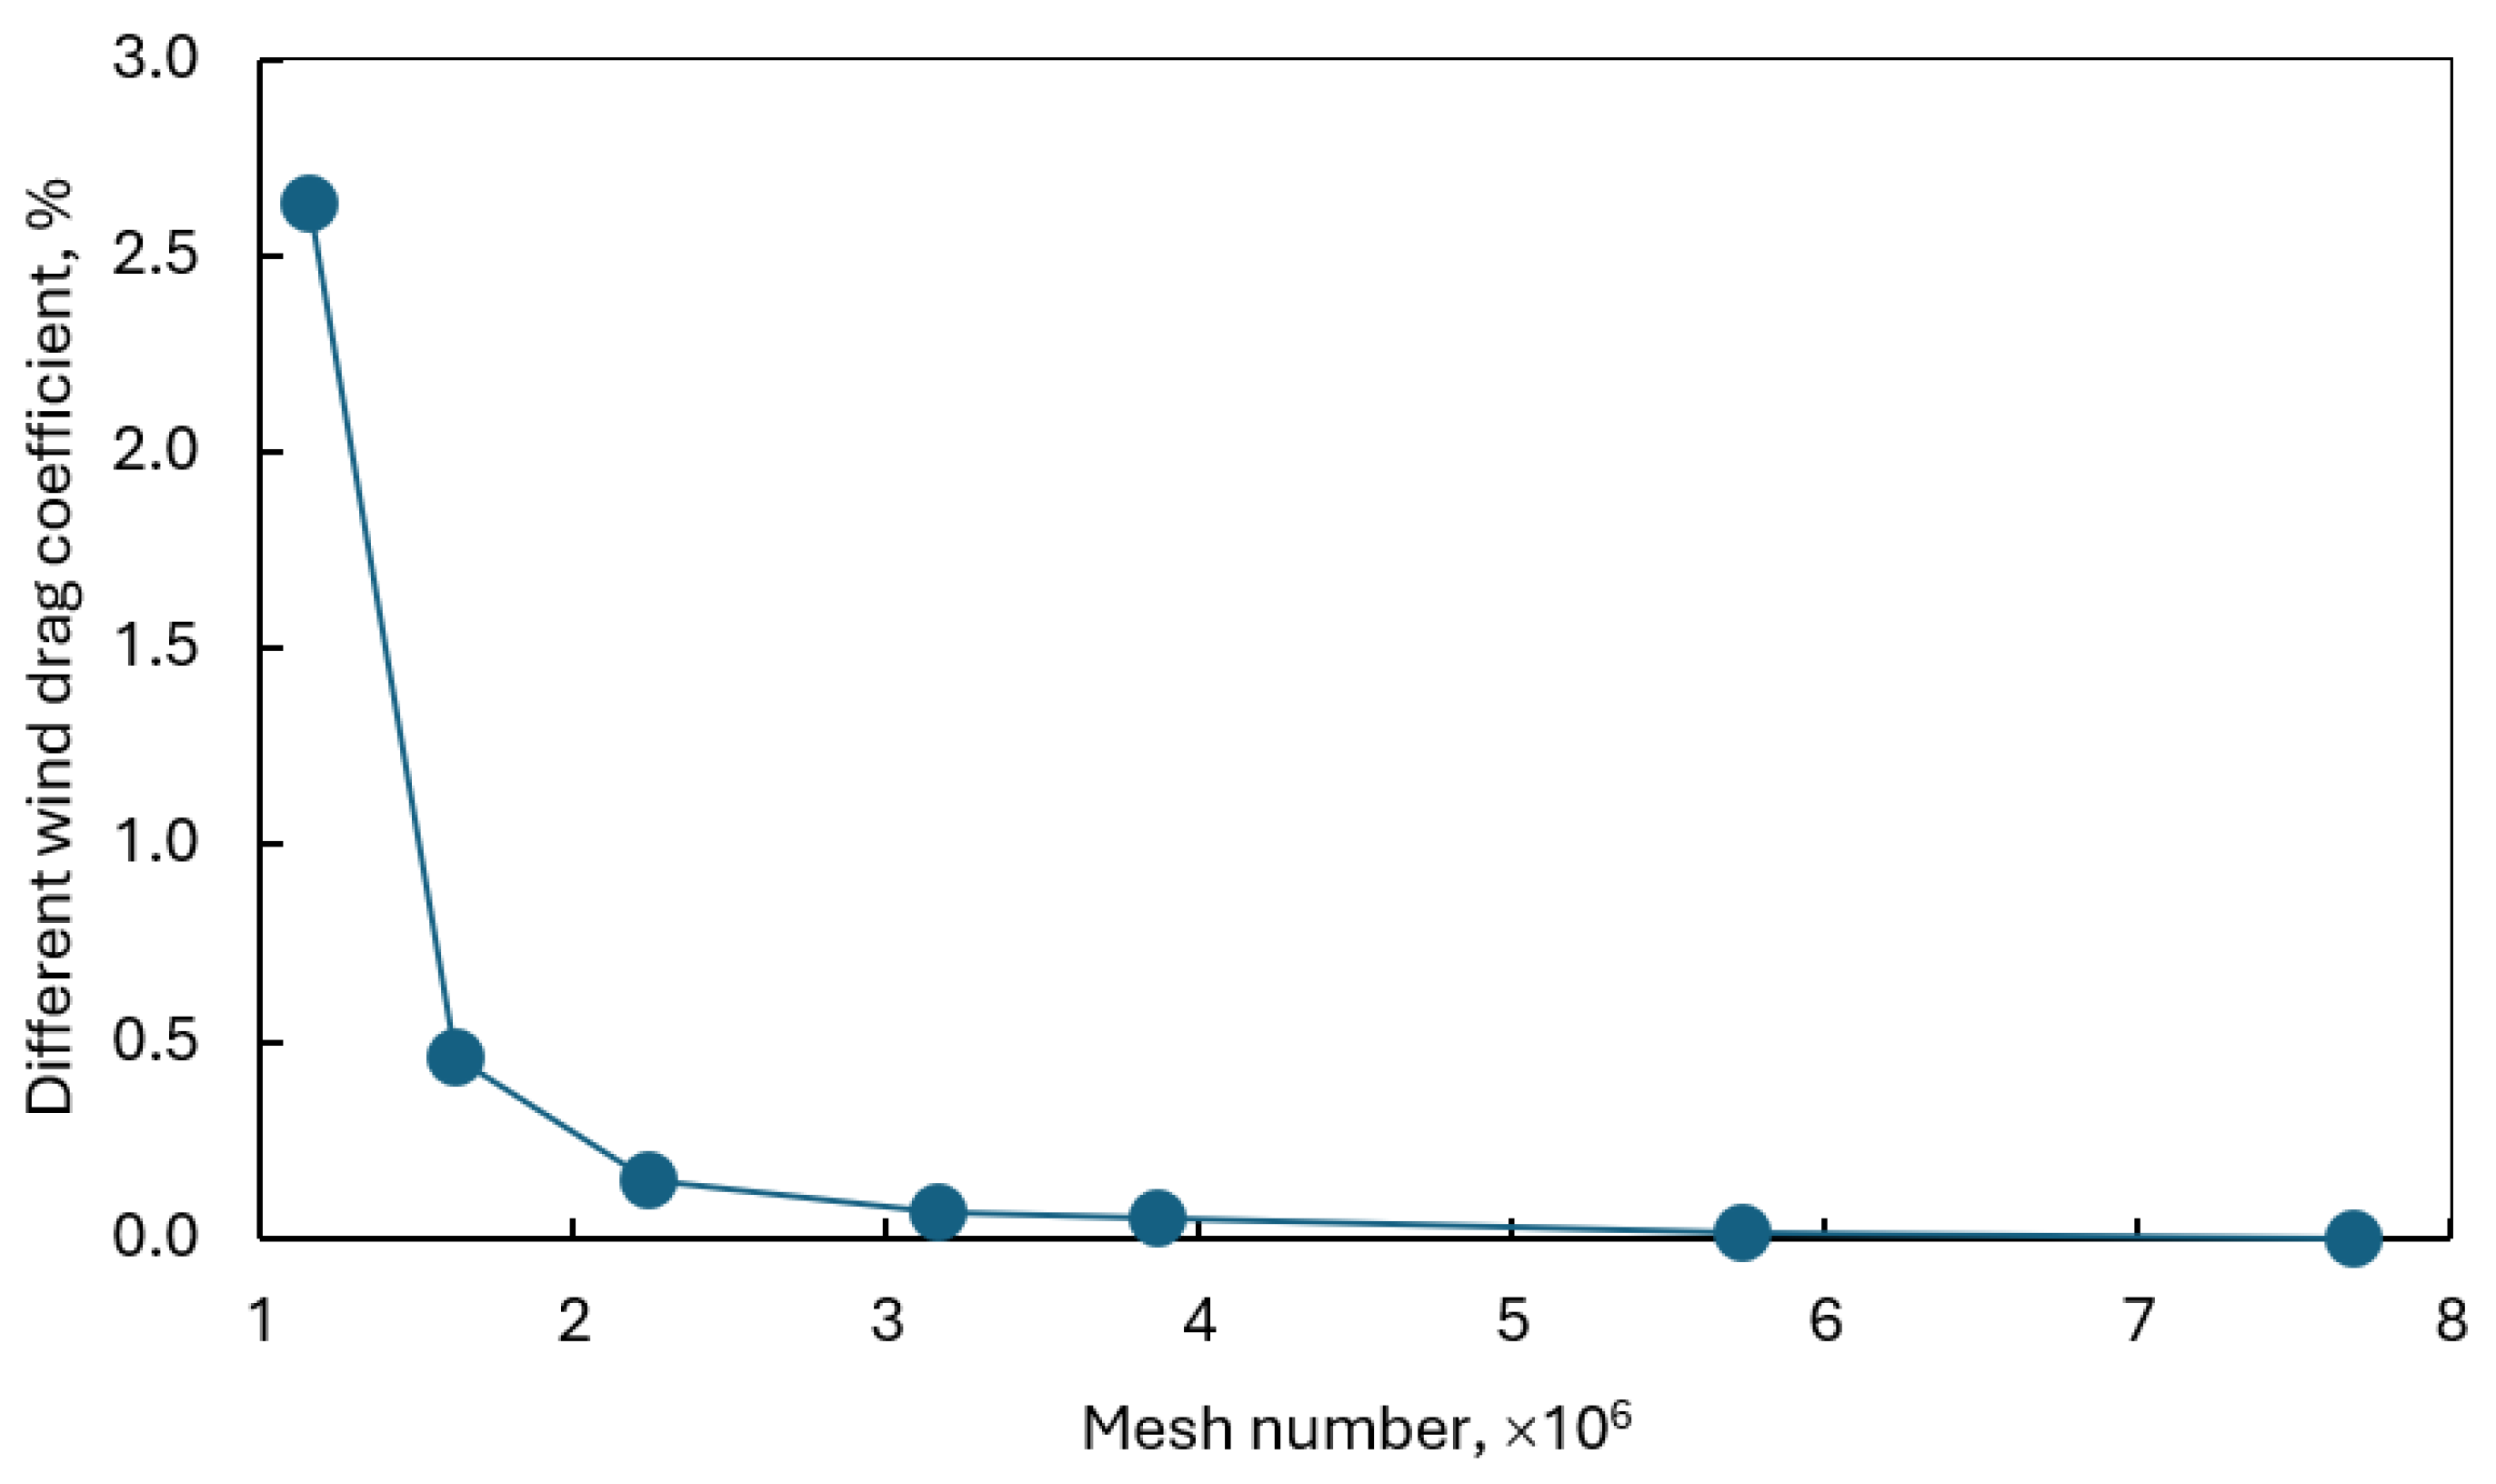
Figure 5.
Pressure distribution around the hull and over the hull surface of the ship.
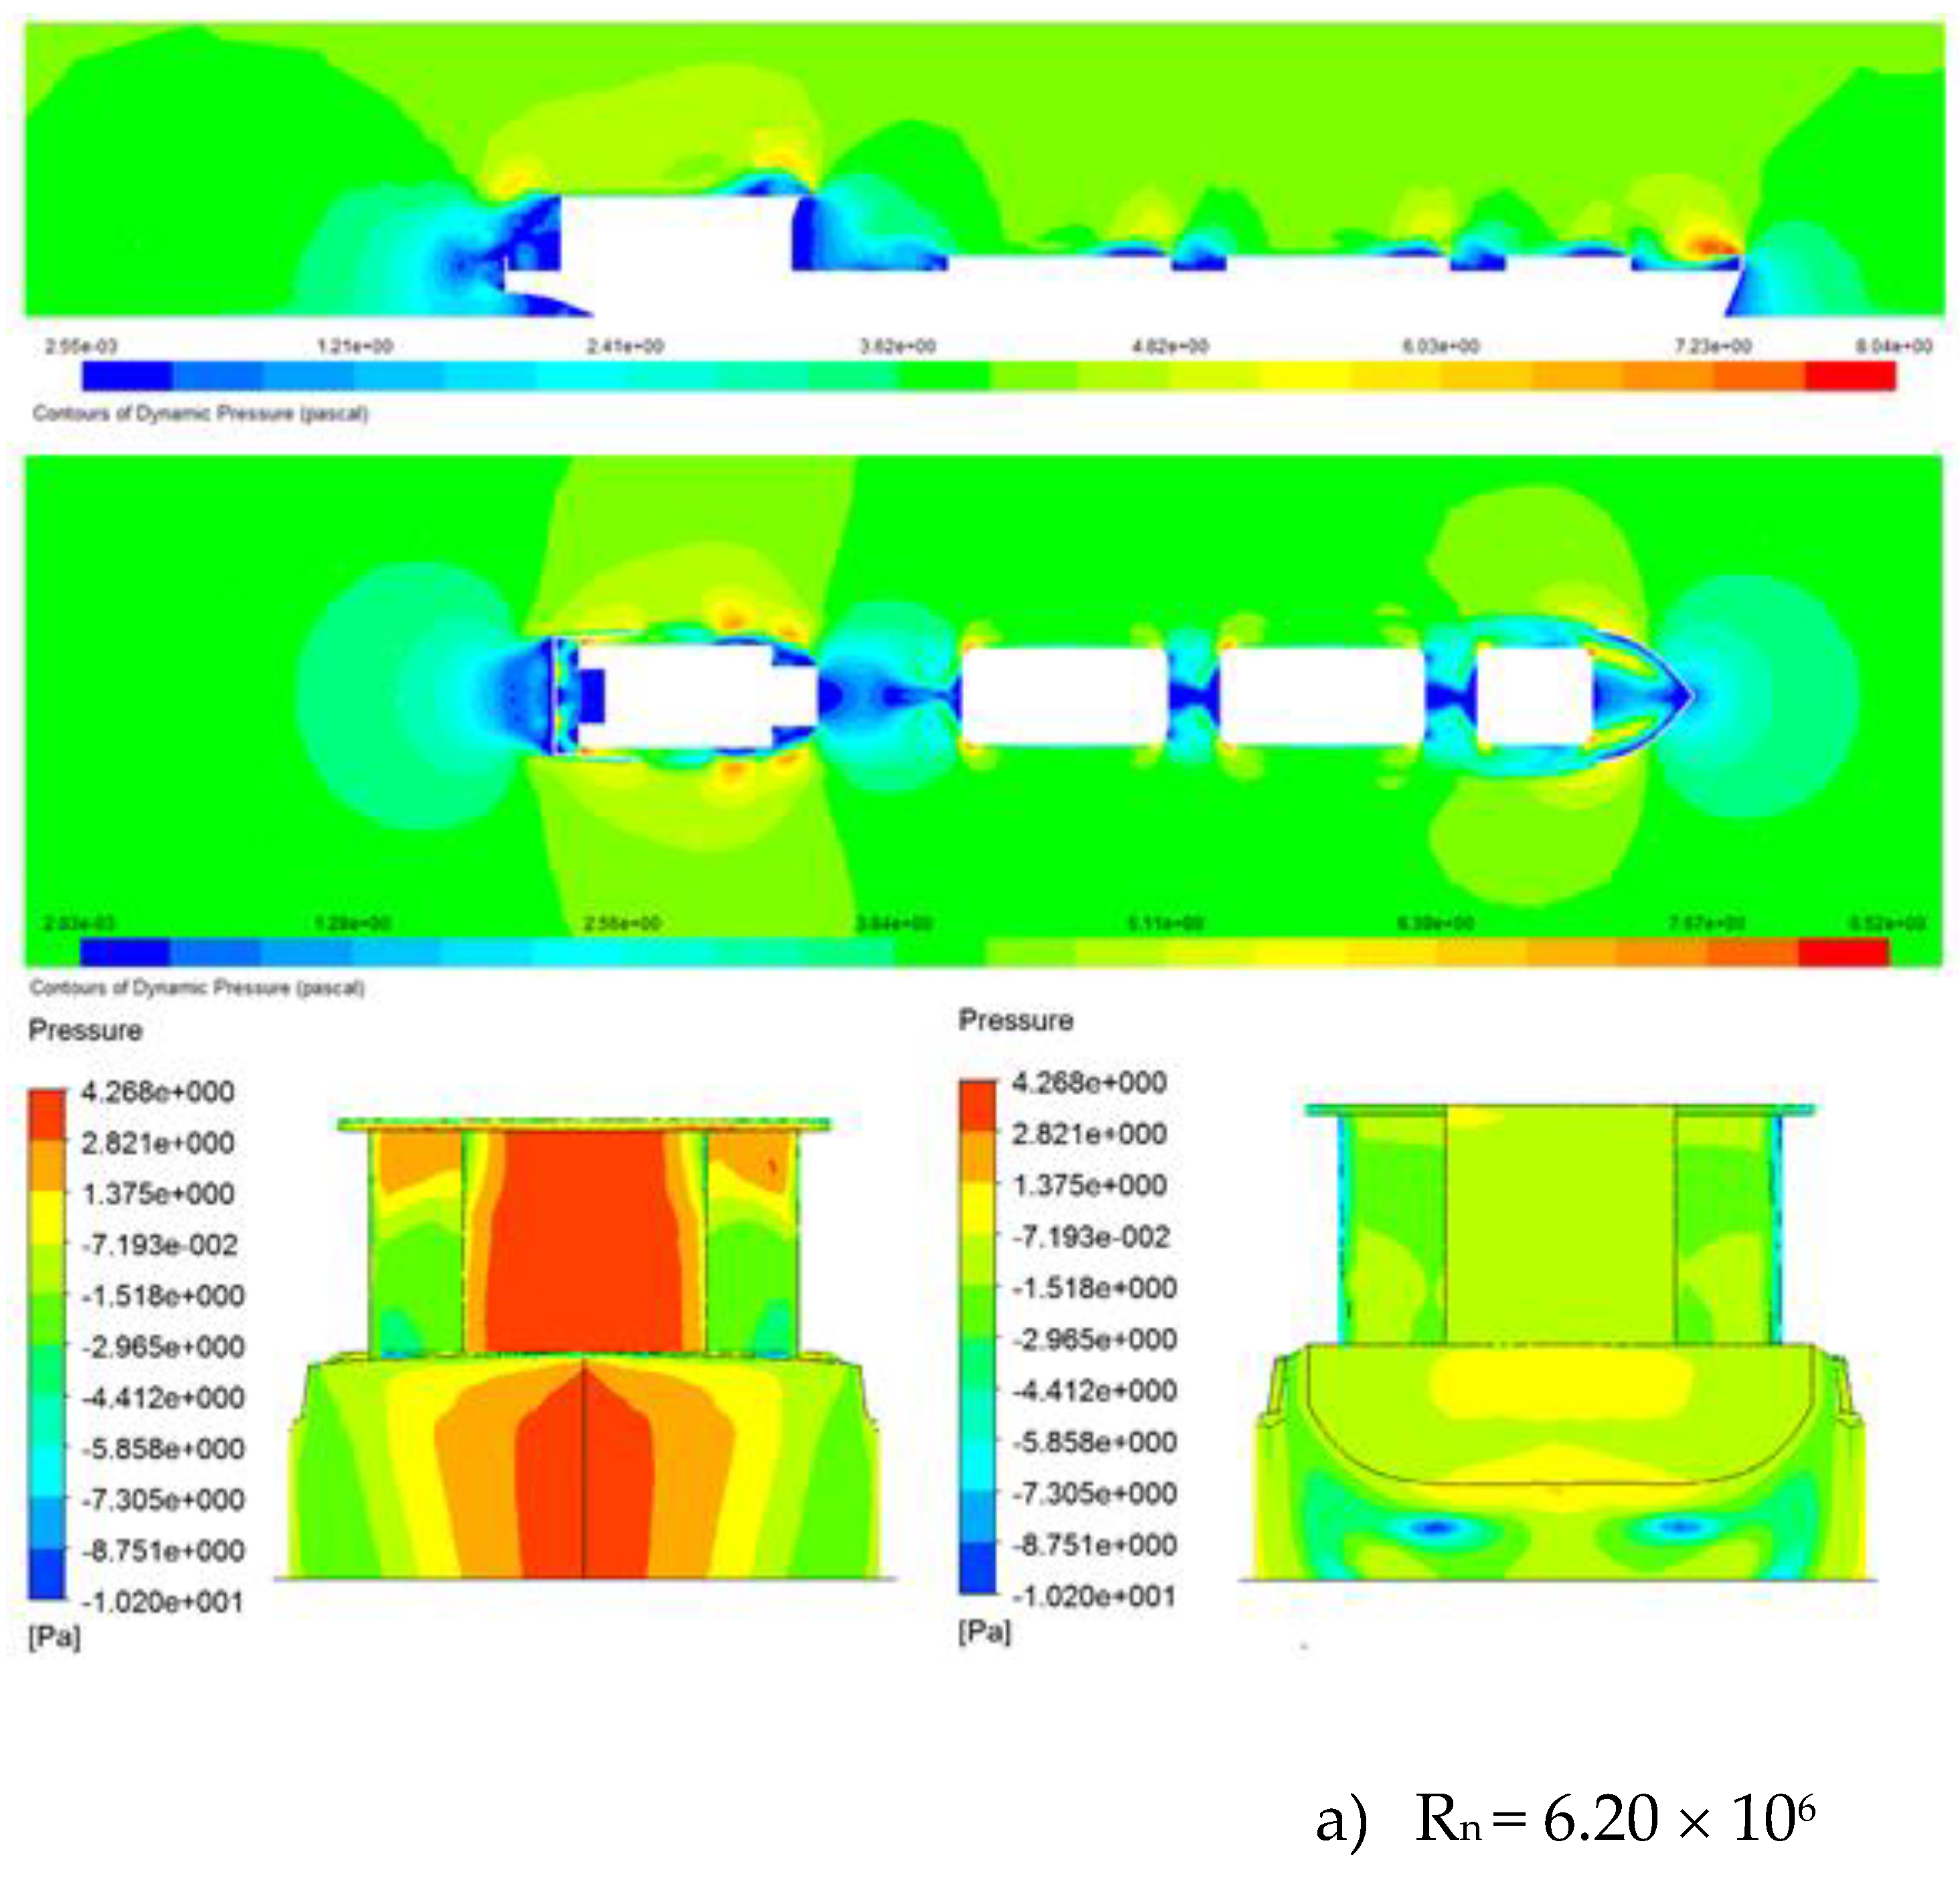
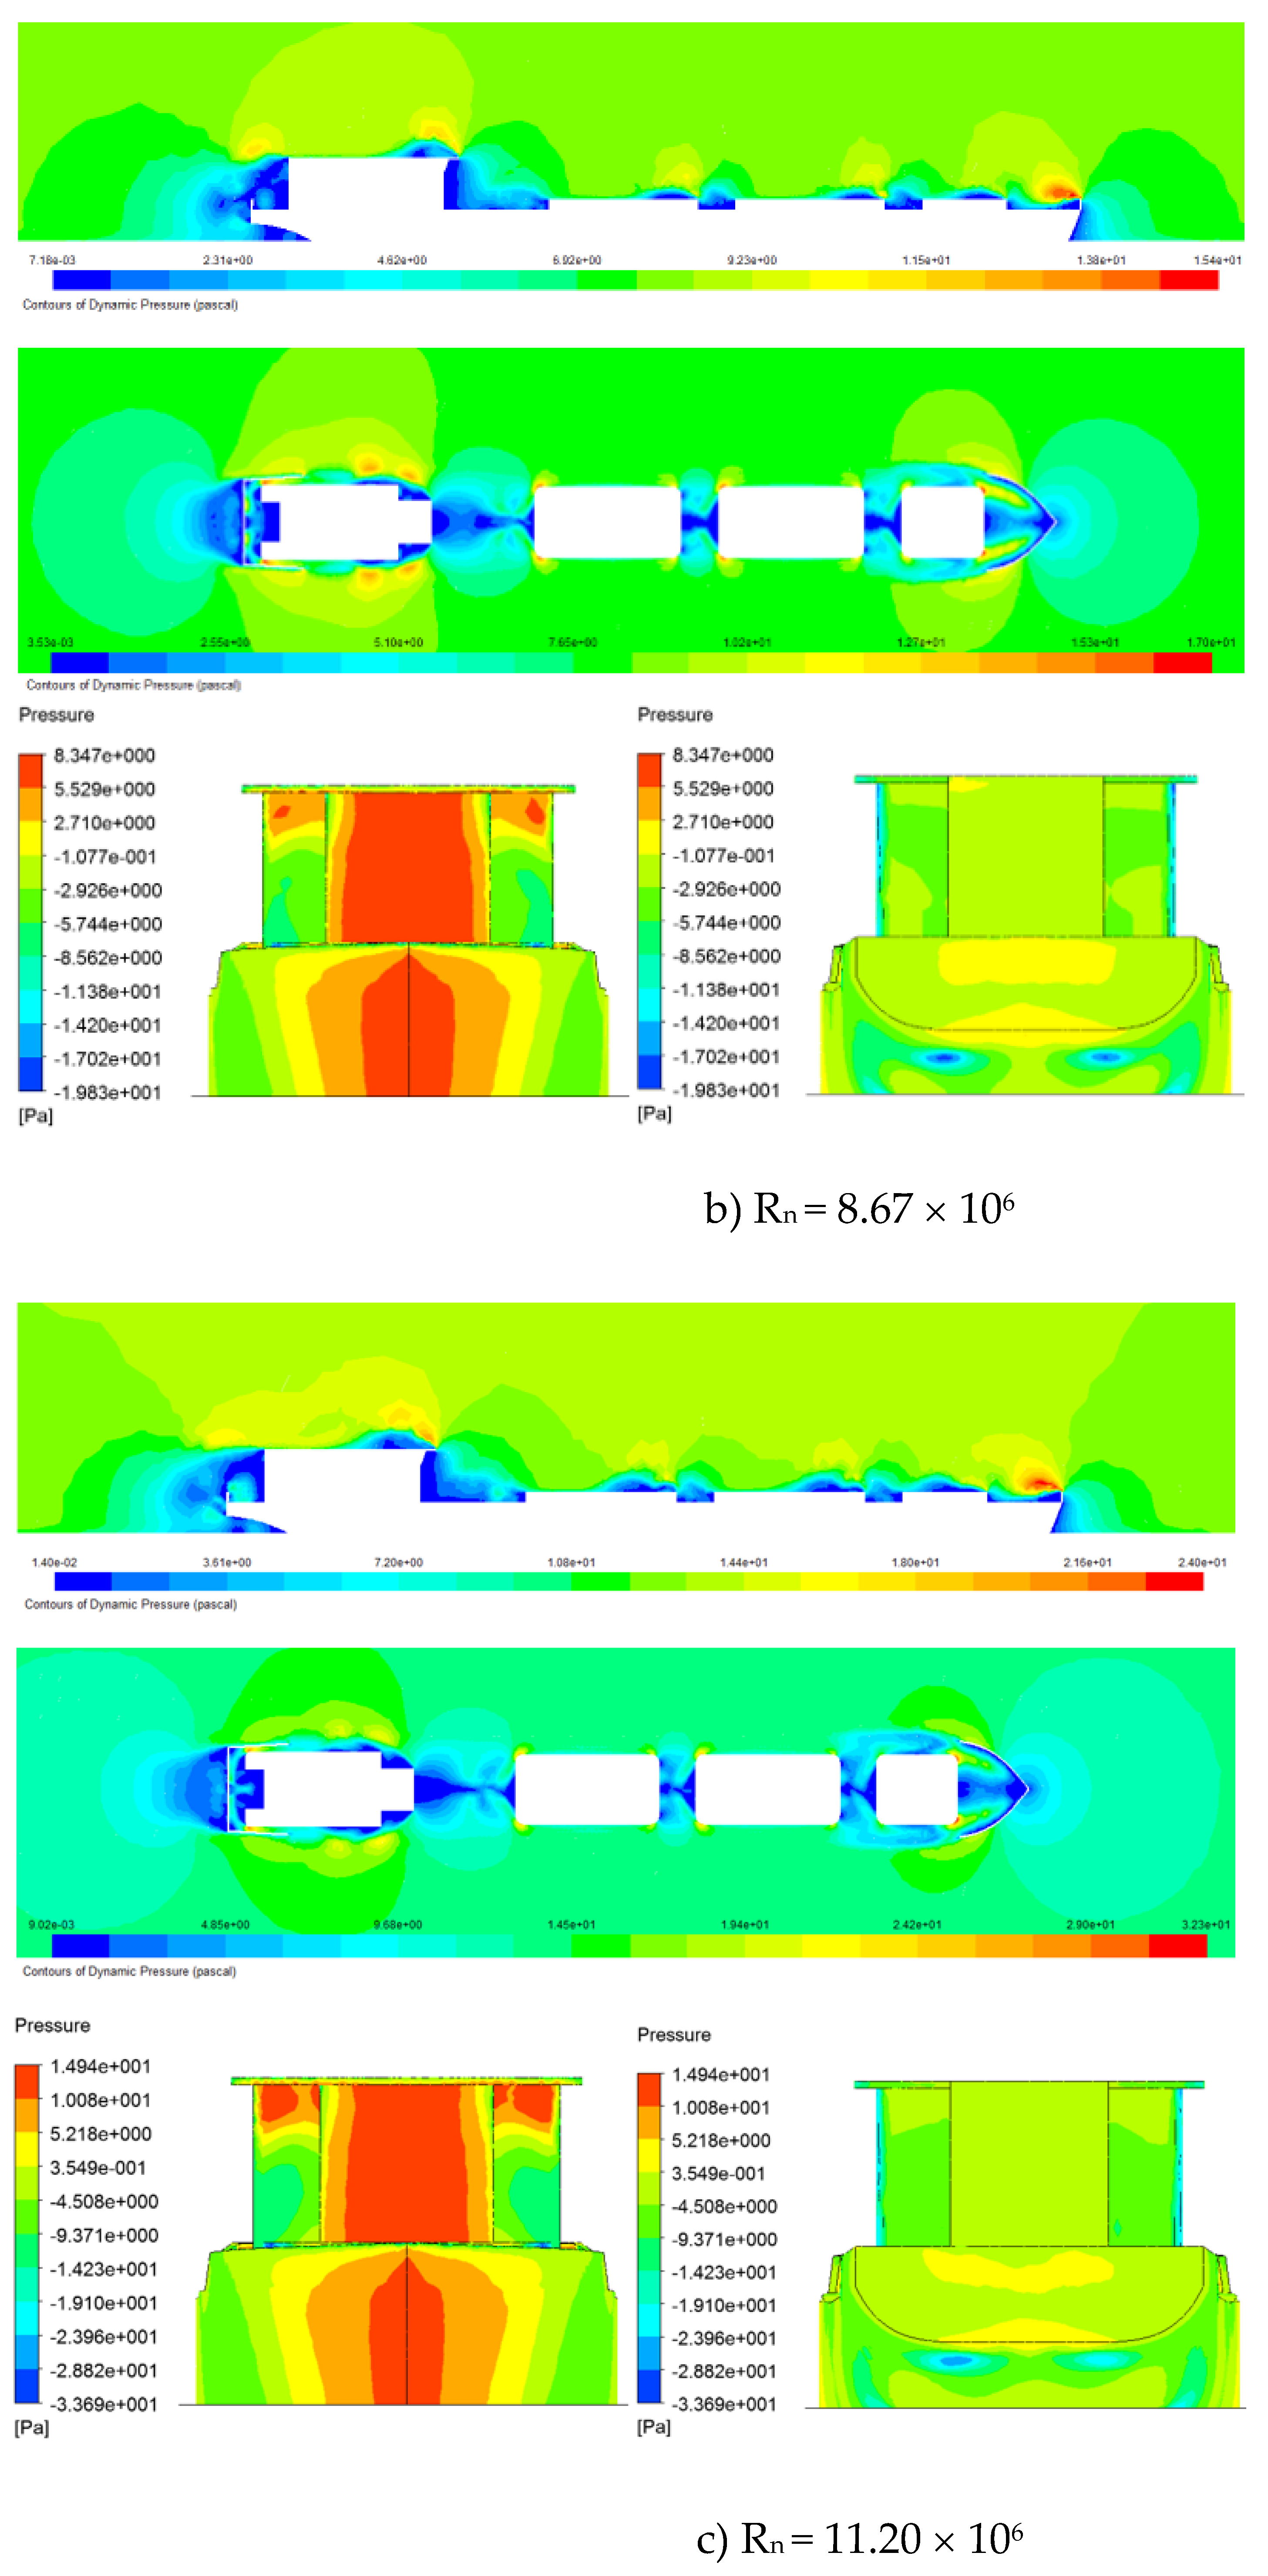
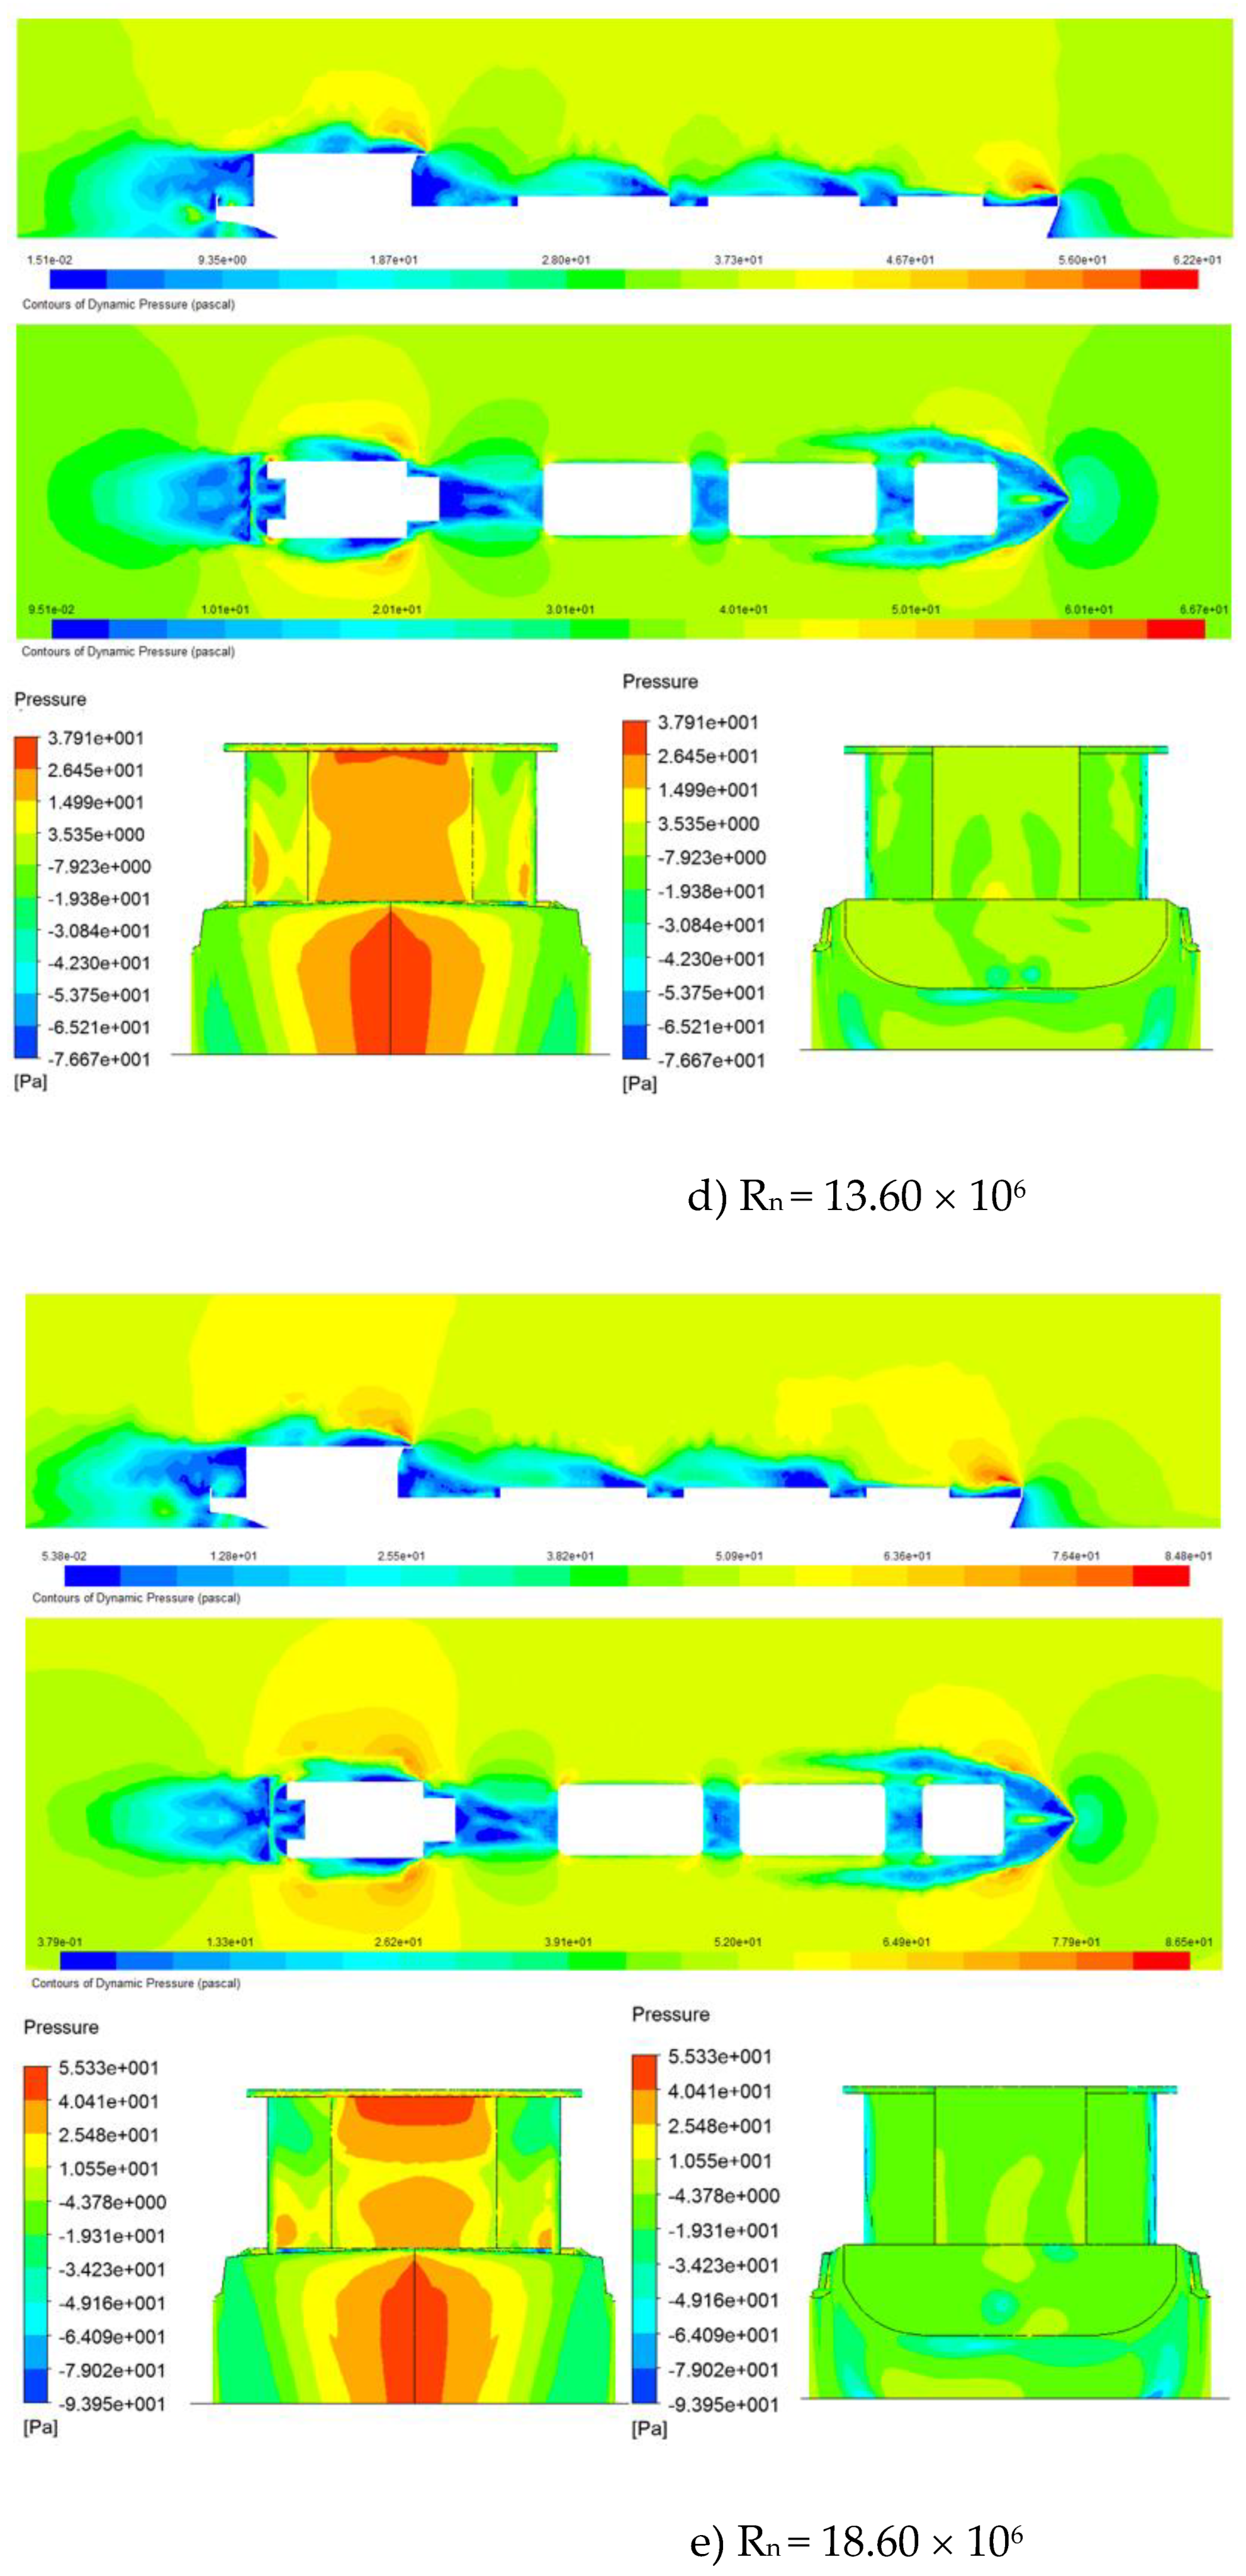
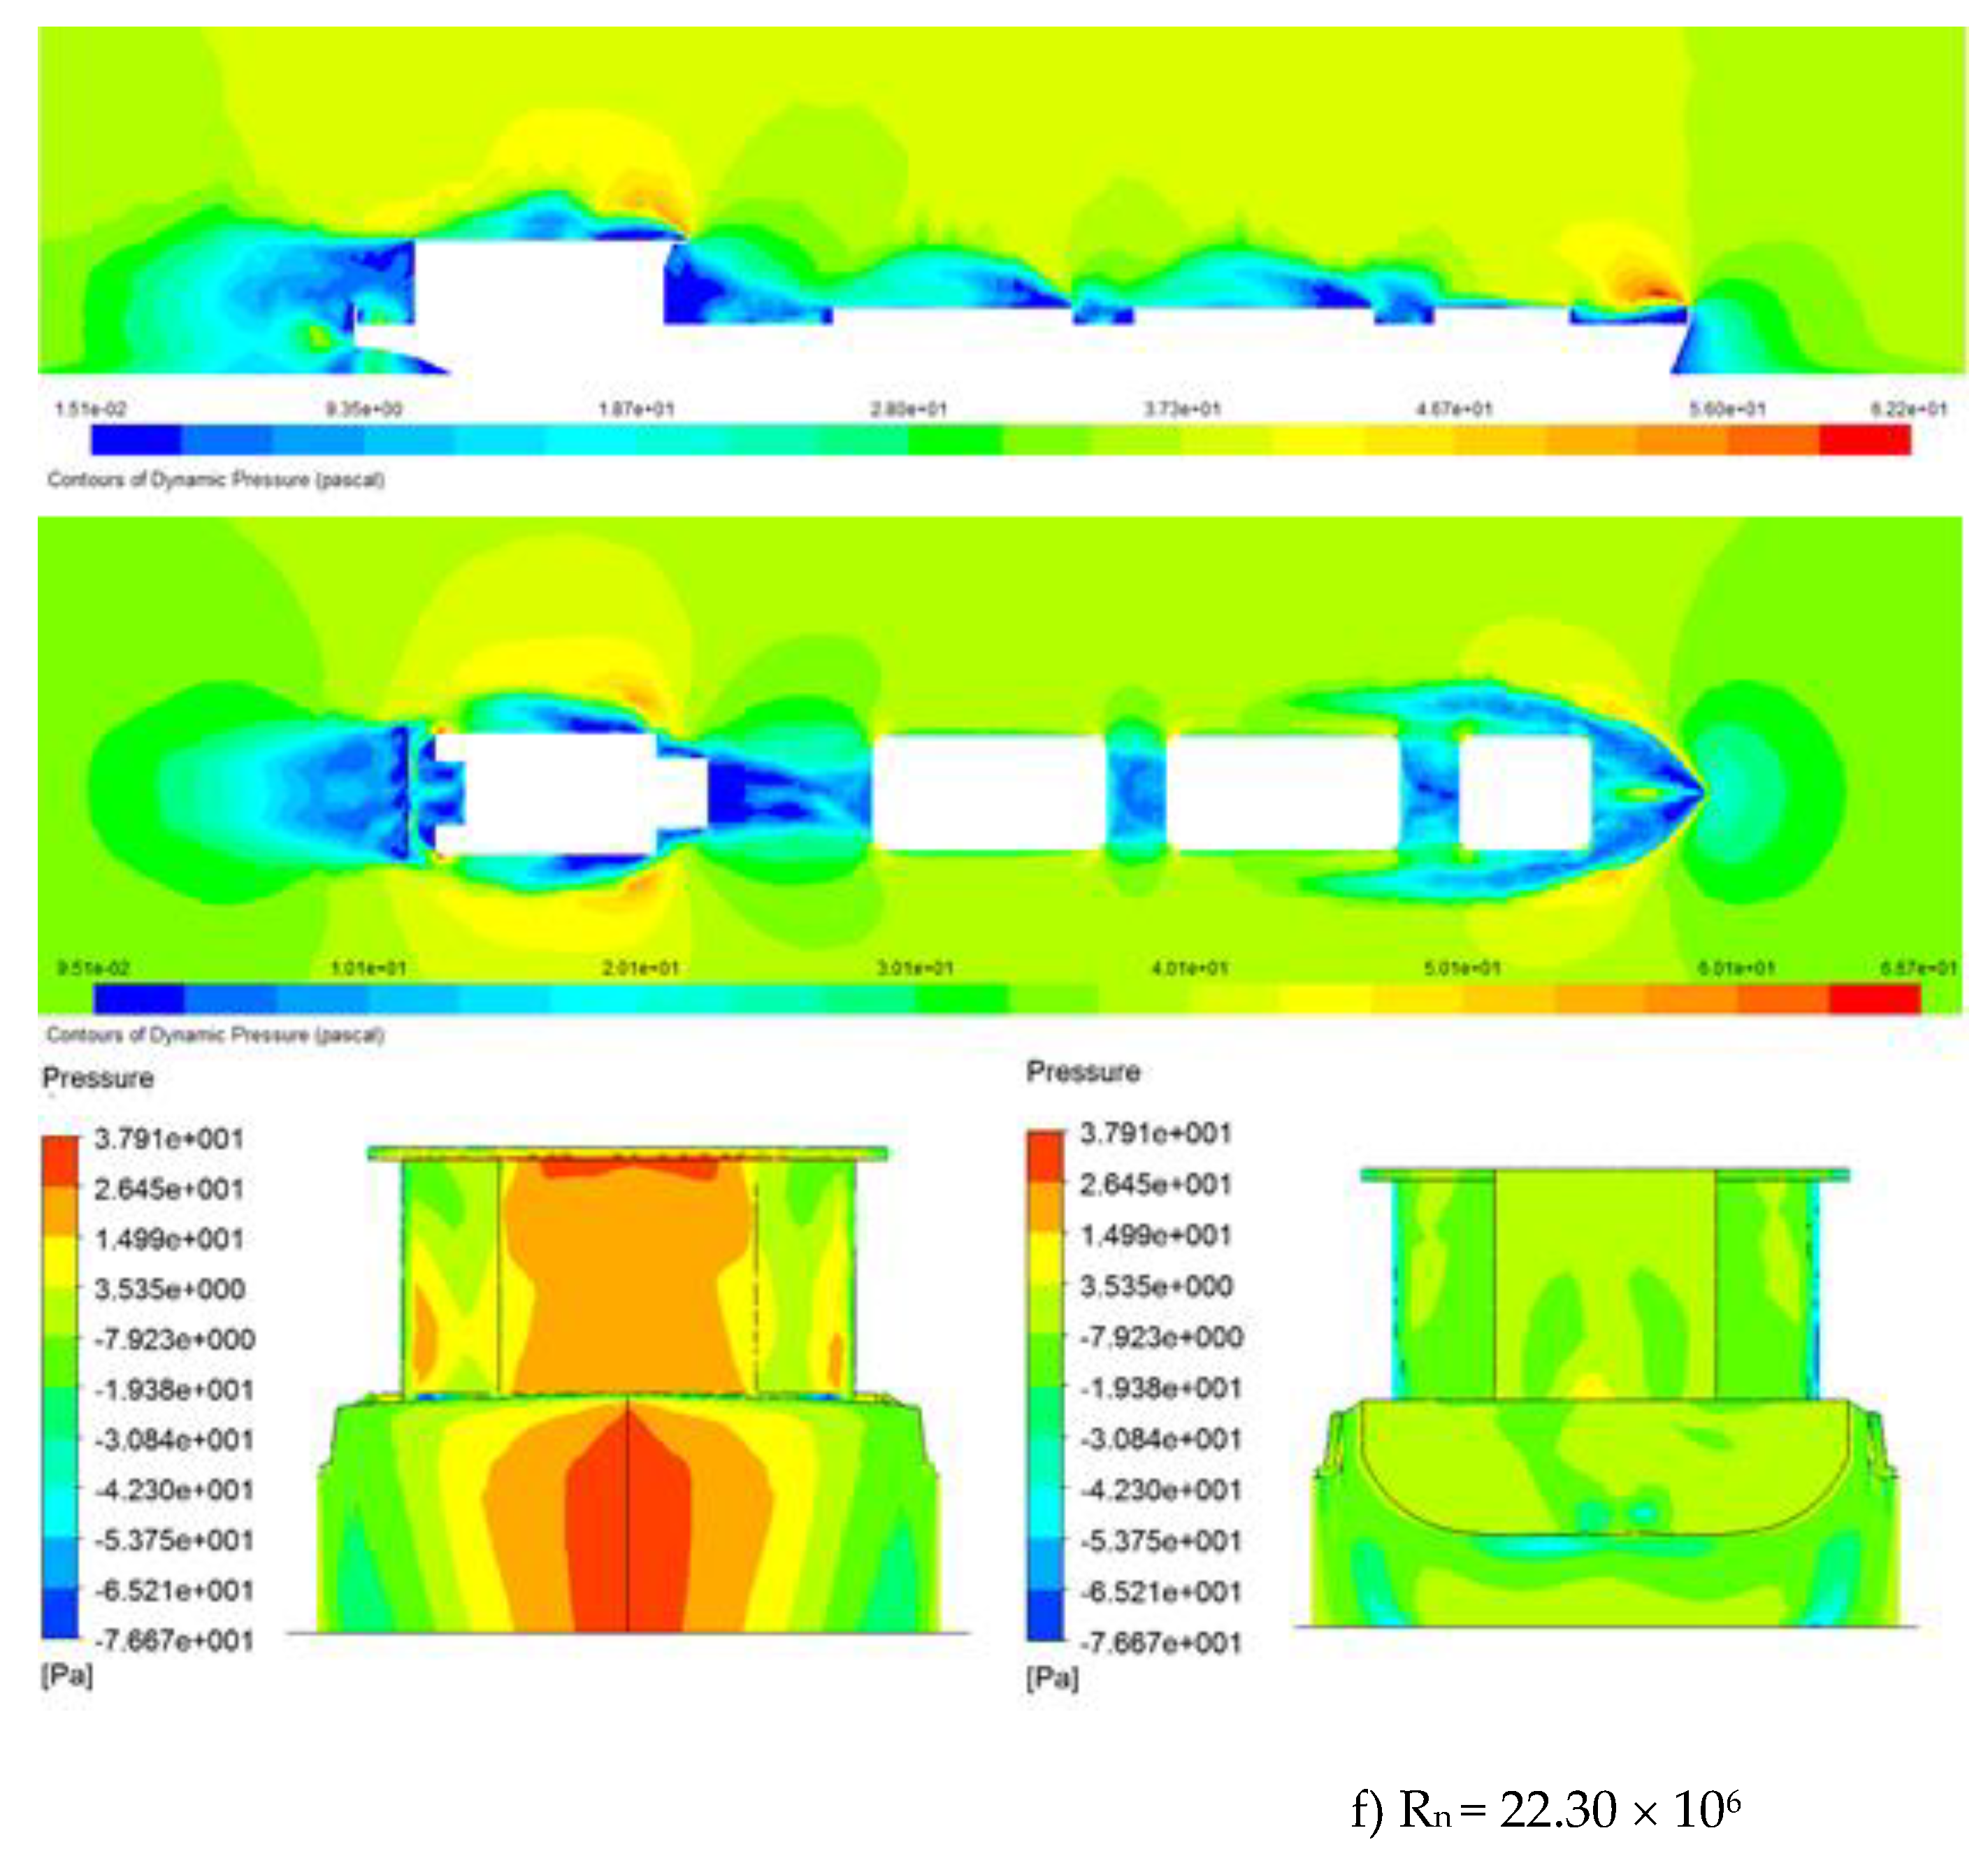
Figure 6.
Wind drag coefficient acting on the ship.
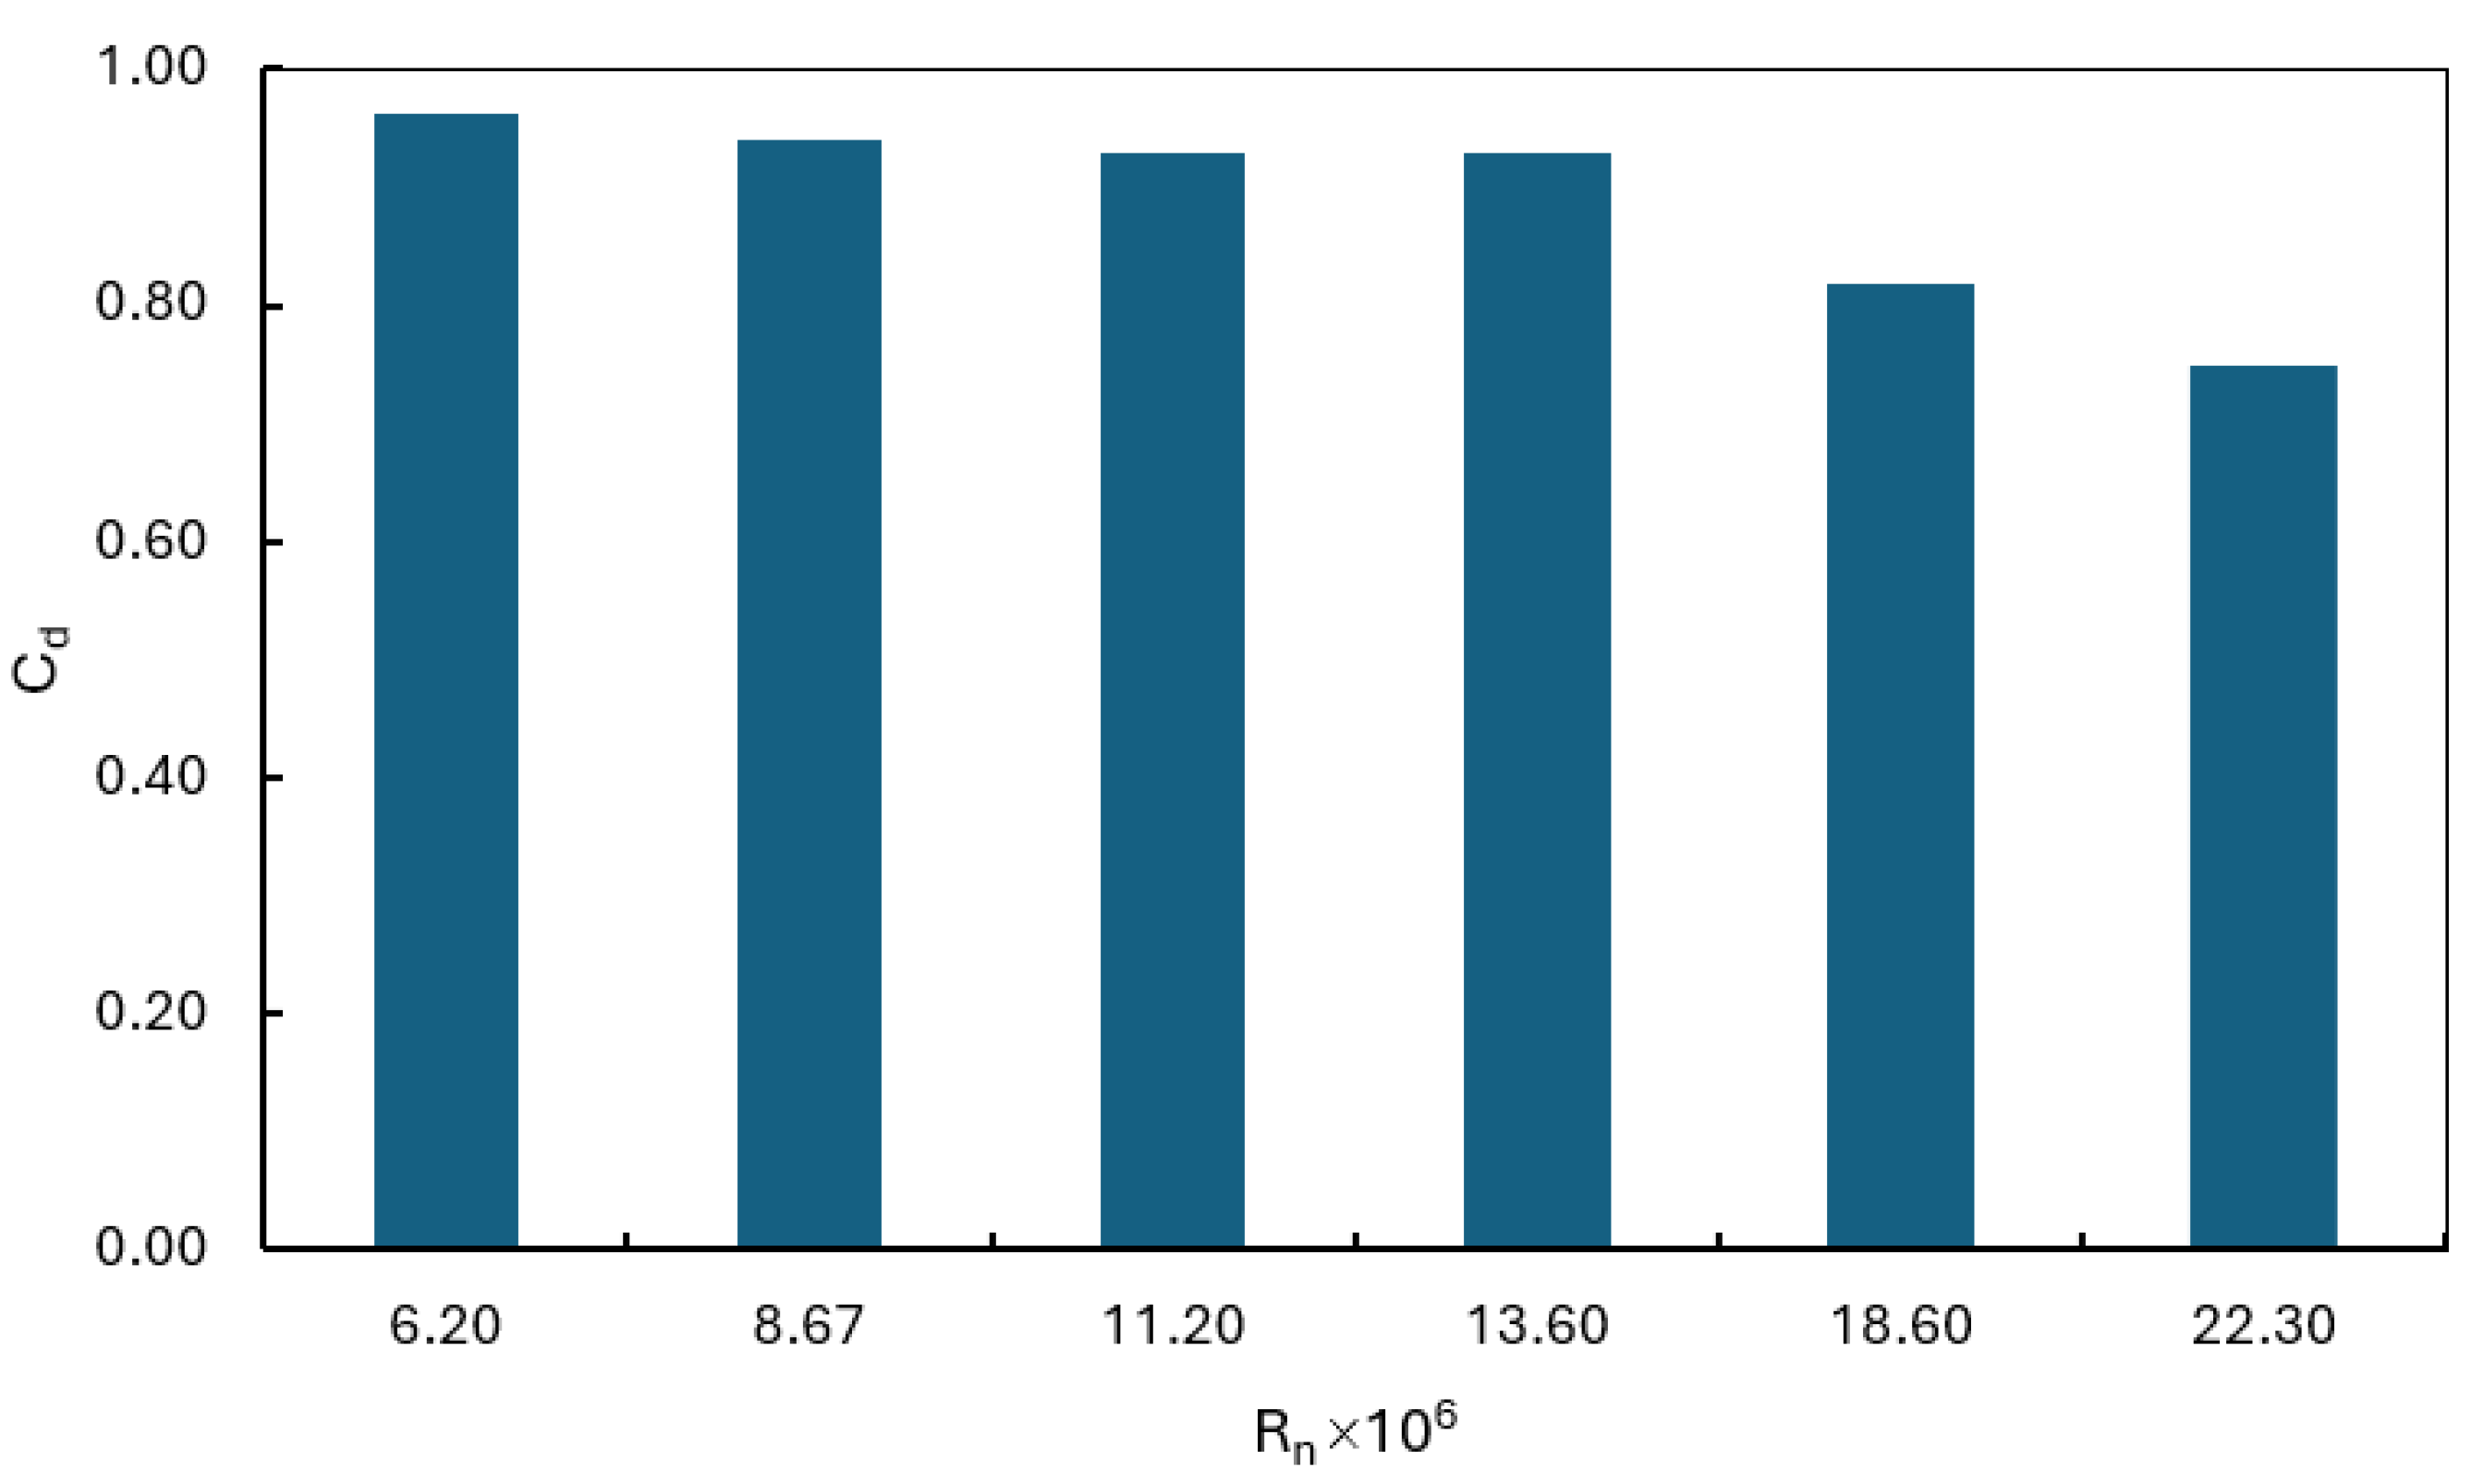
Figure 7.
Ship model used in the study of the influence of ship attitude with bow pitch angles of 0 and 3 degrees
Figure 7.
Ship model used in the study of the influence of ship attitude with bow pitch angles of 0 and 3 degrees
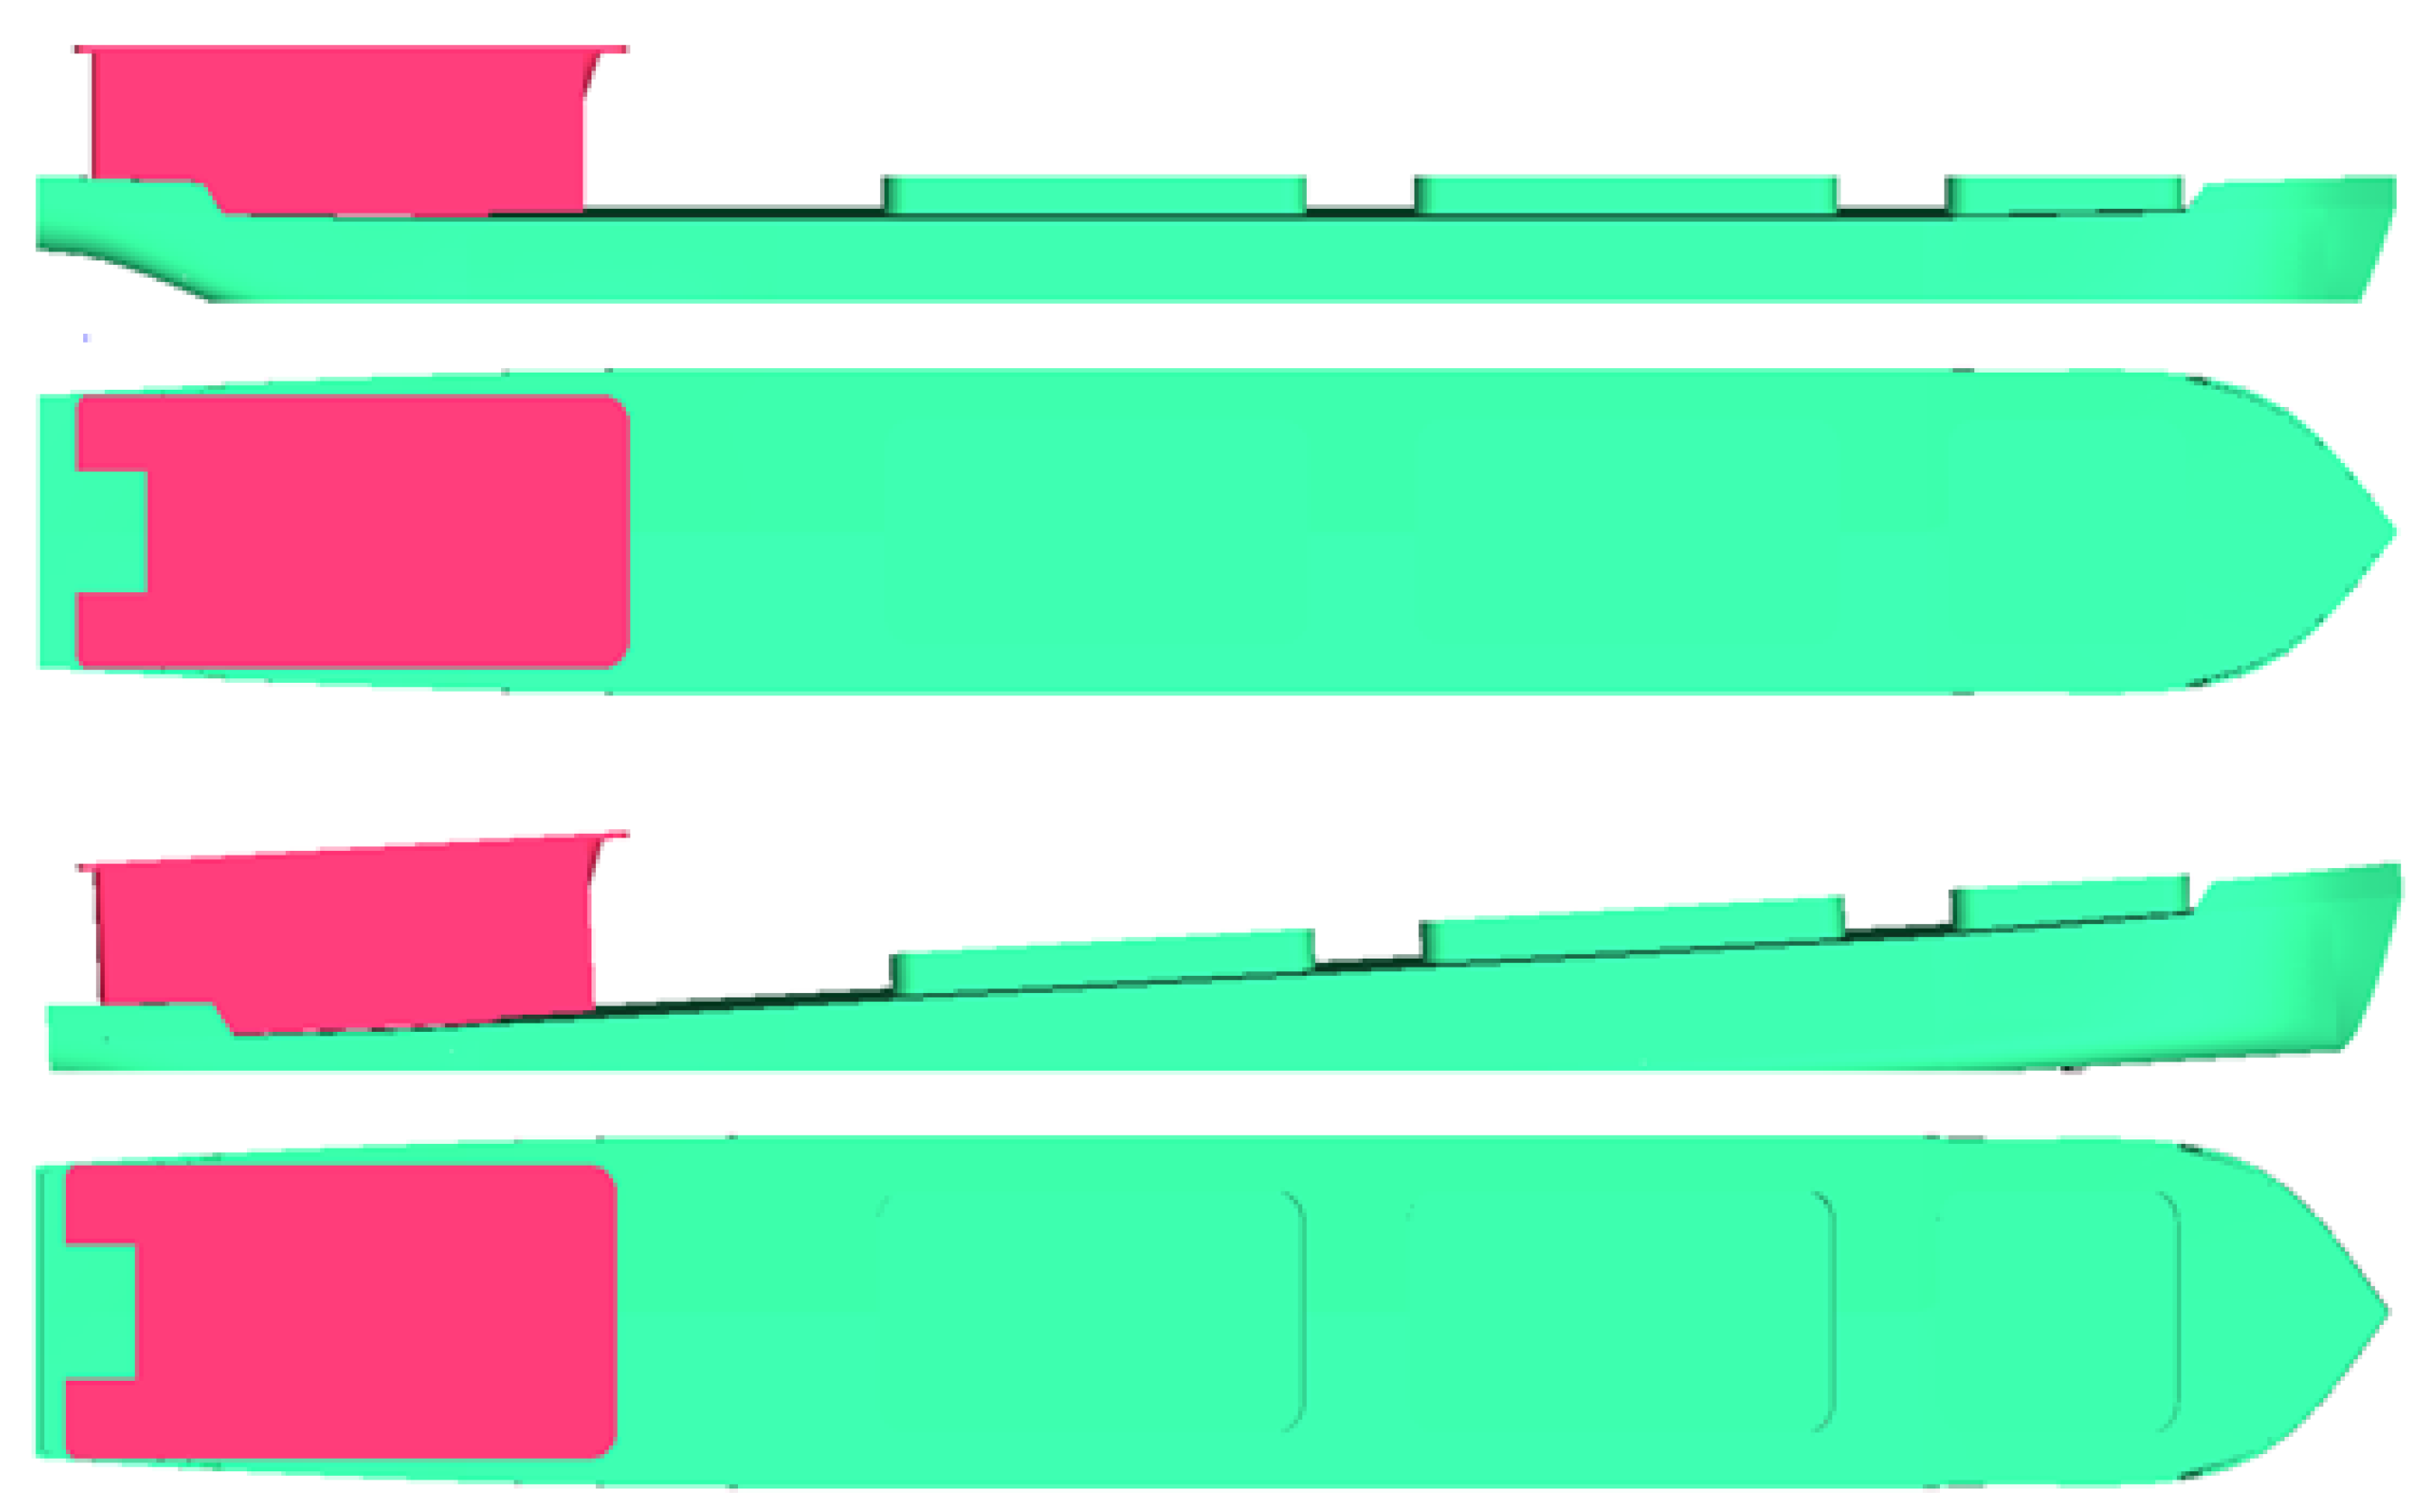
Figure 8.
Pressure distribution around the hull and over the hull surface of the ship with a 3-degree bow angle operating condition.
Figure 8.
Pressure distribution around the hull and over the hull surface of the ship with a 3-degree bow angle operating condition.
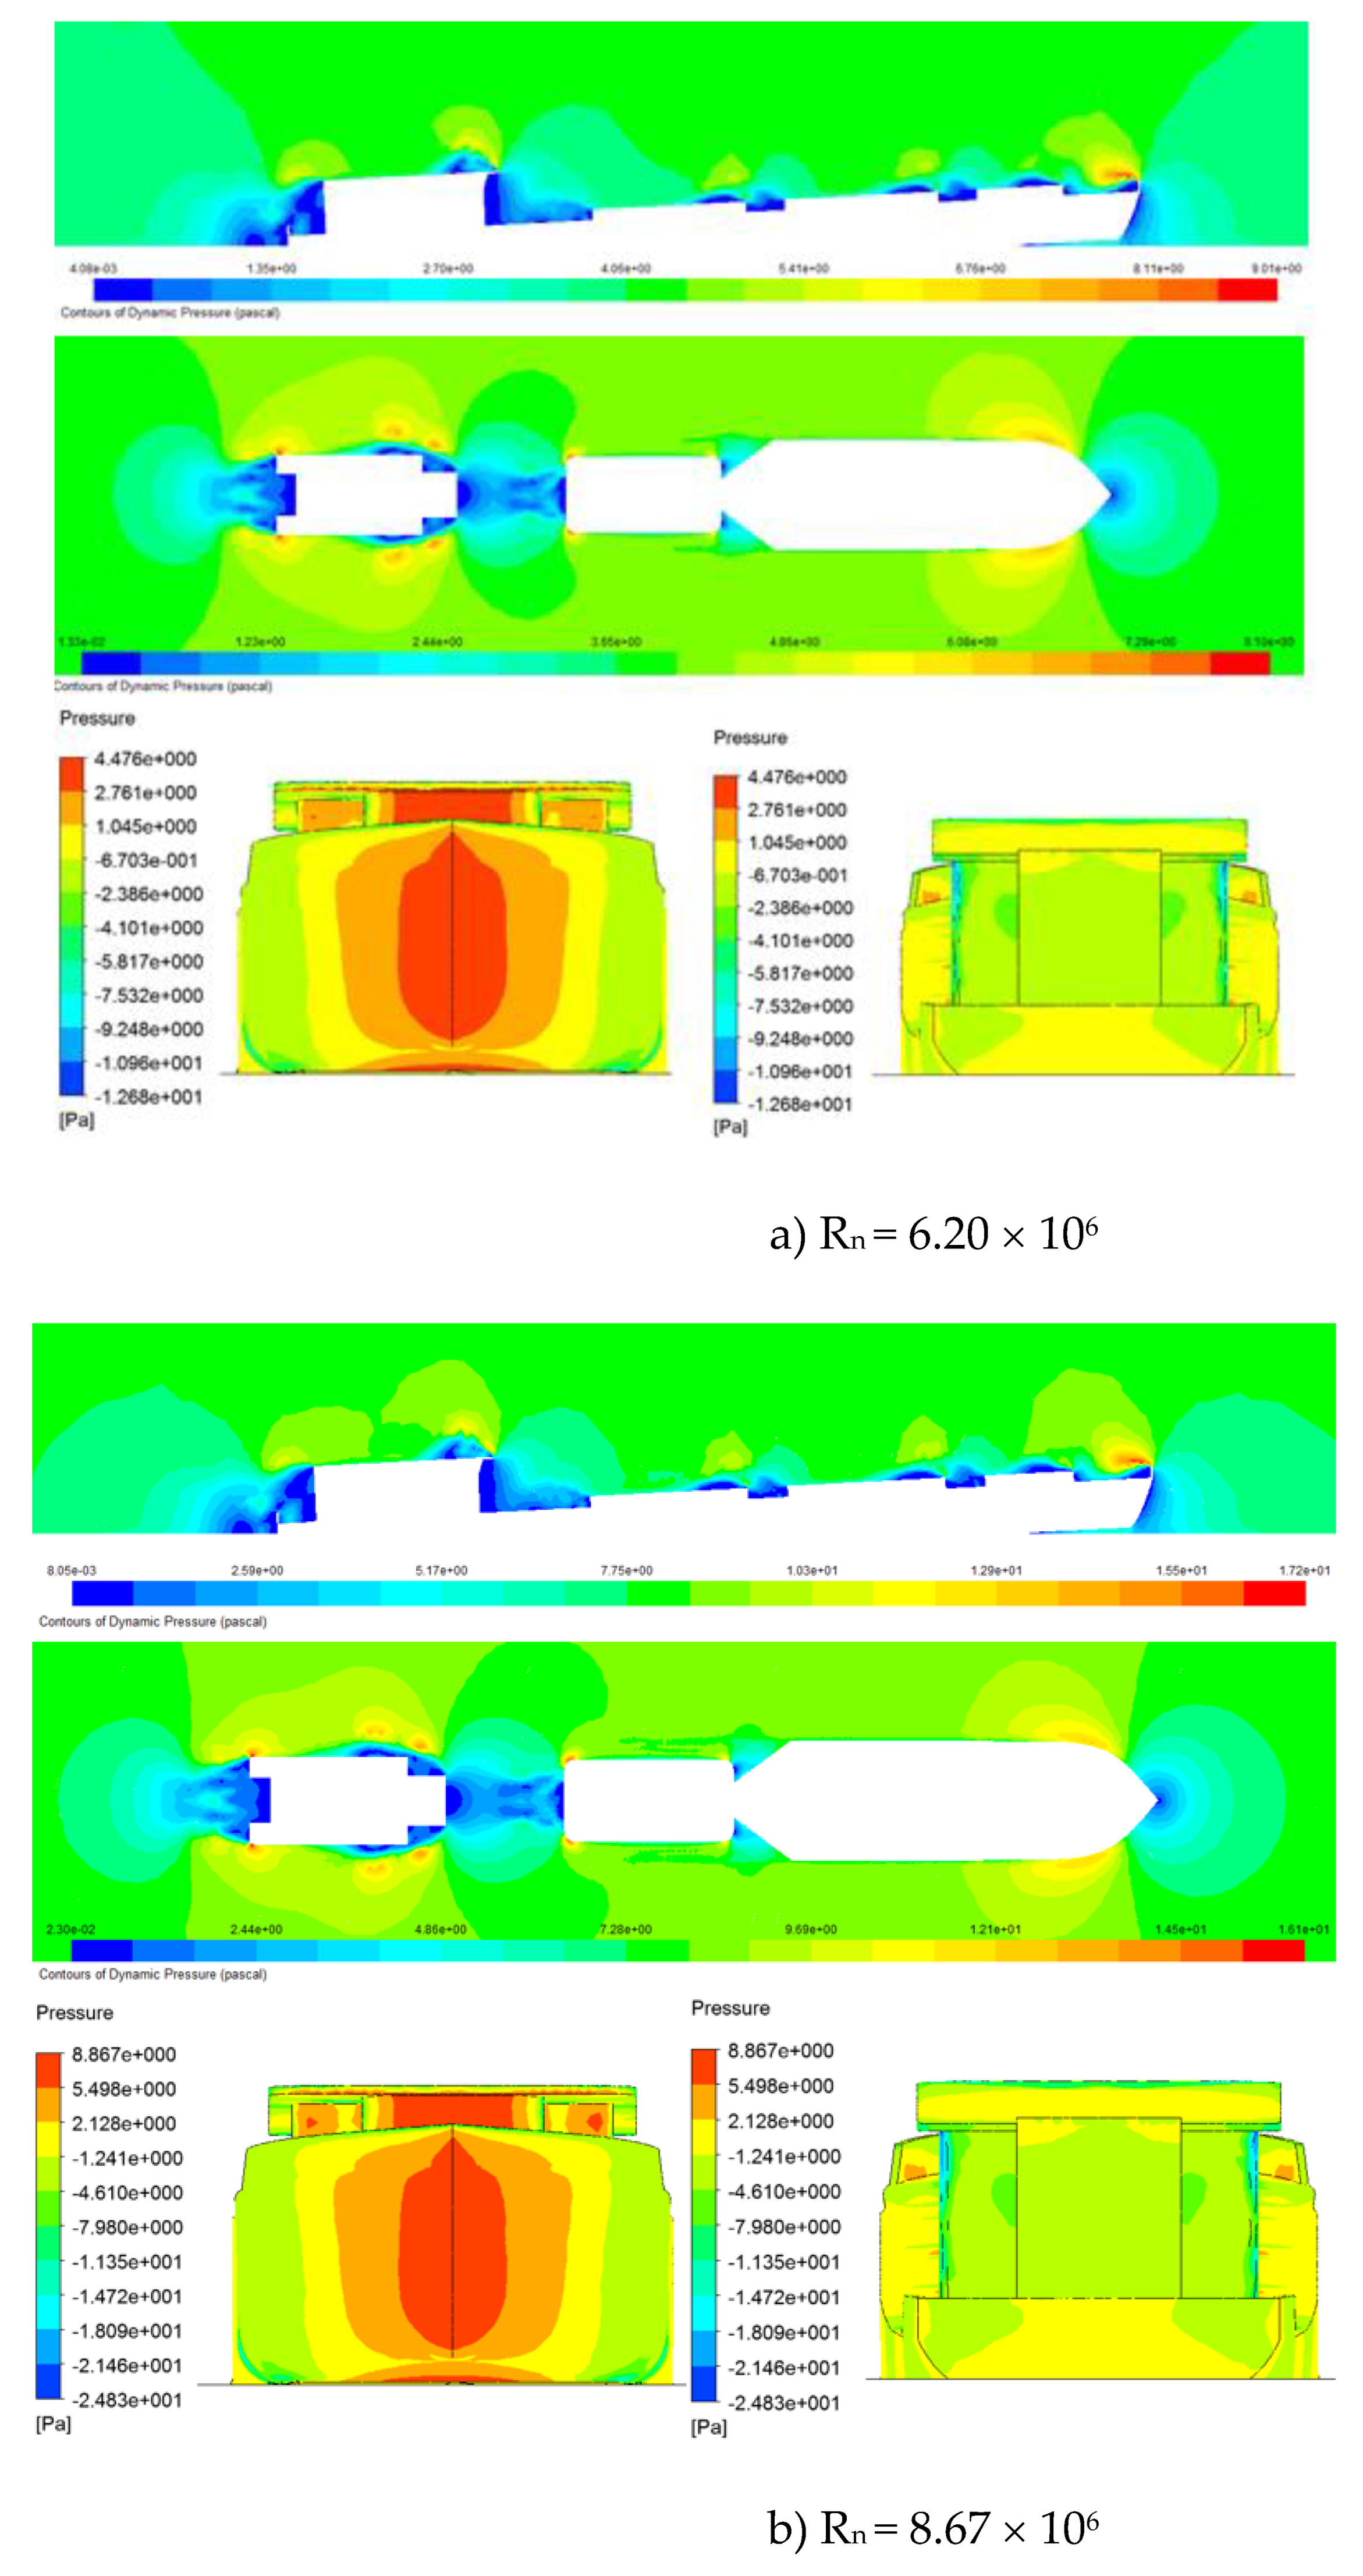
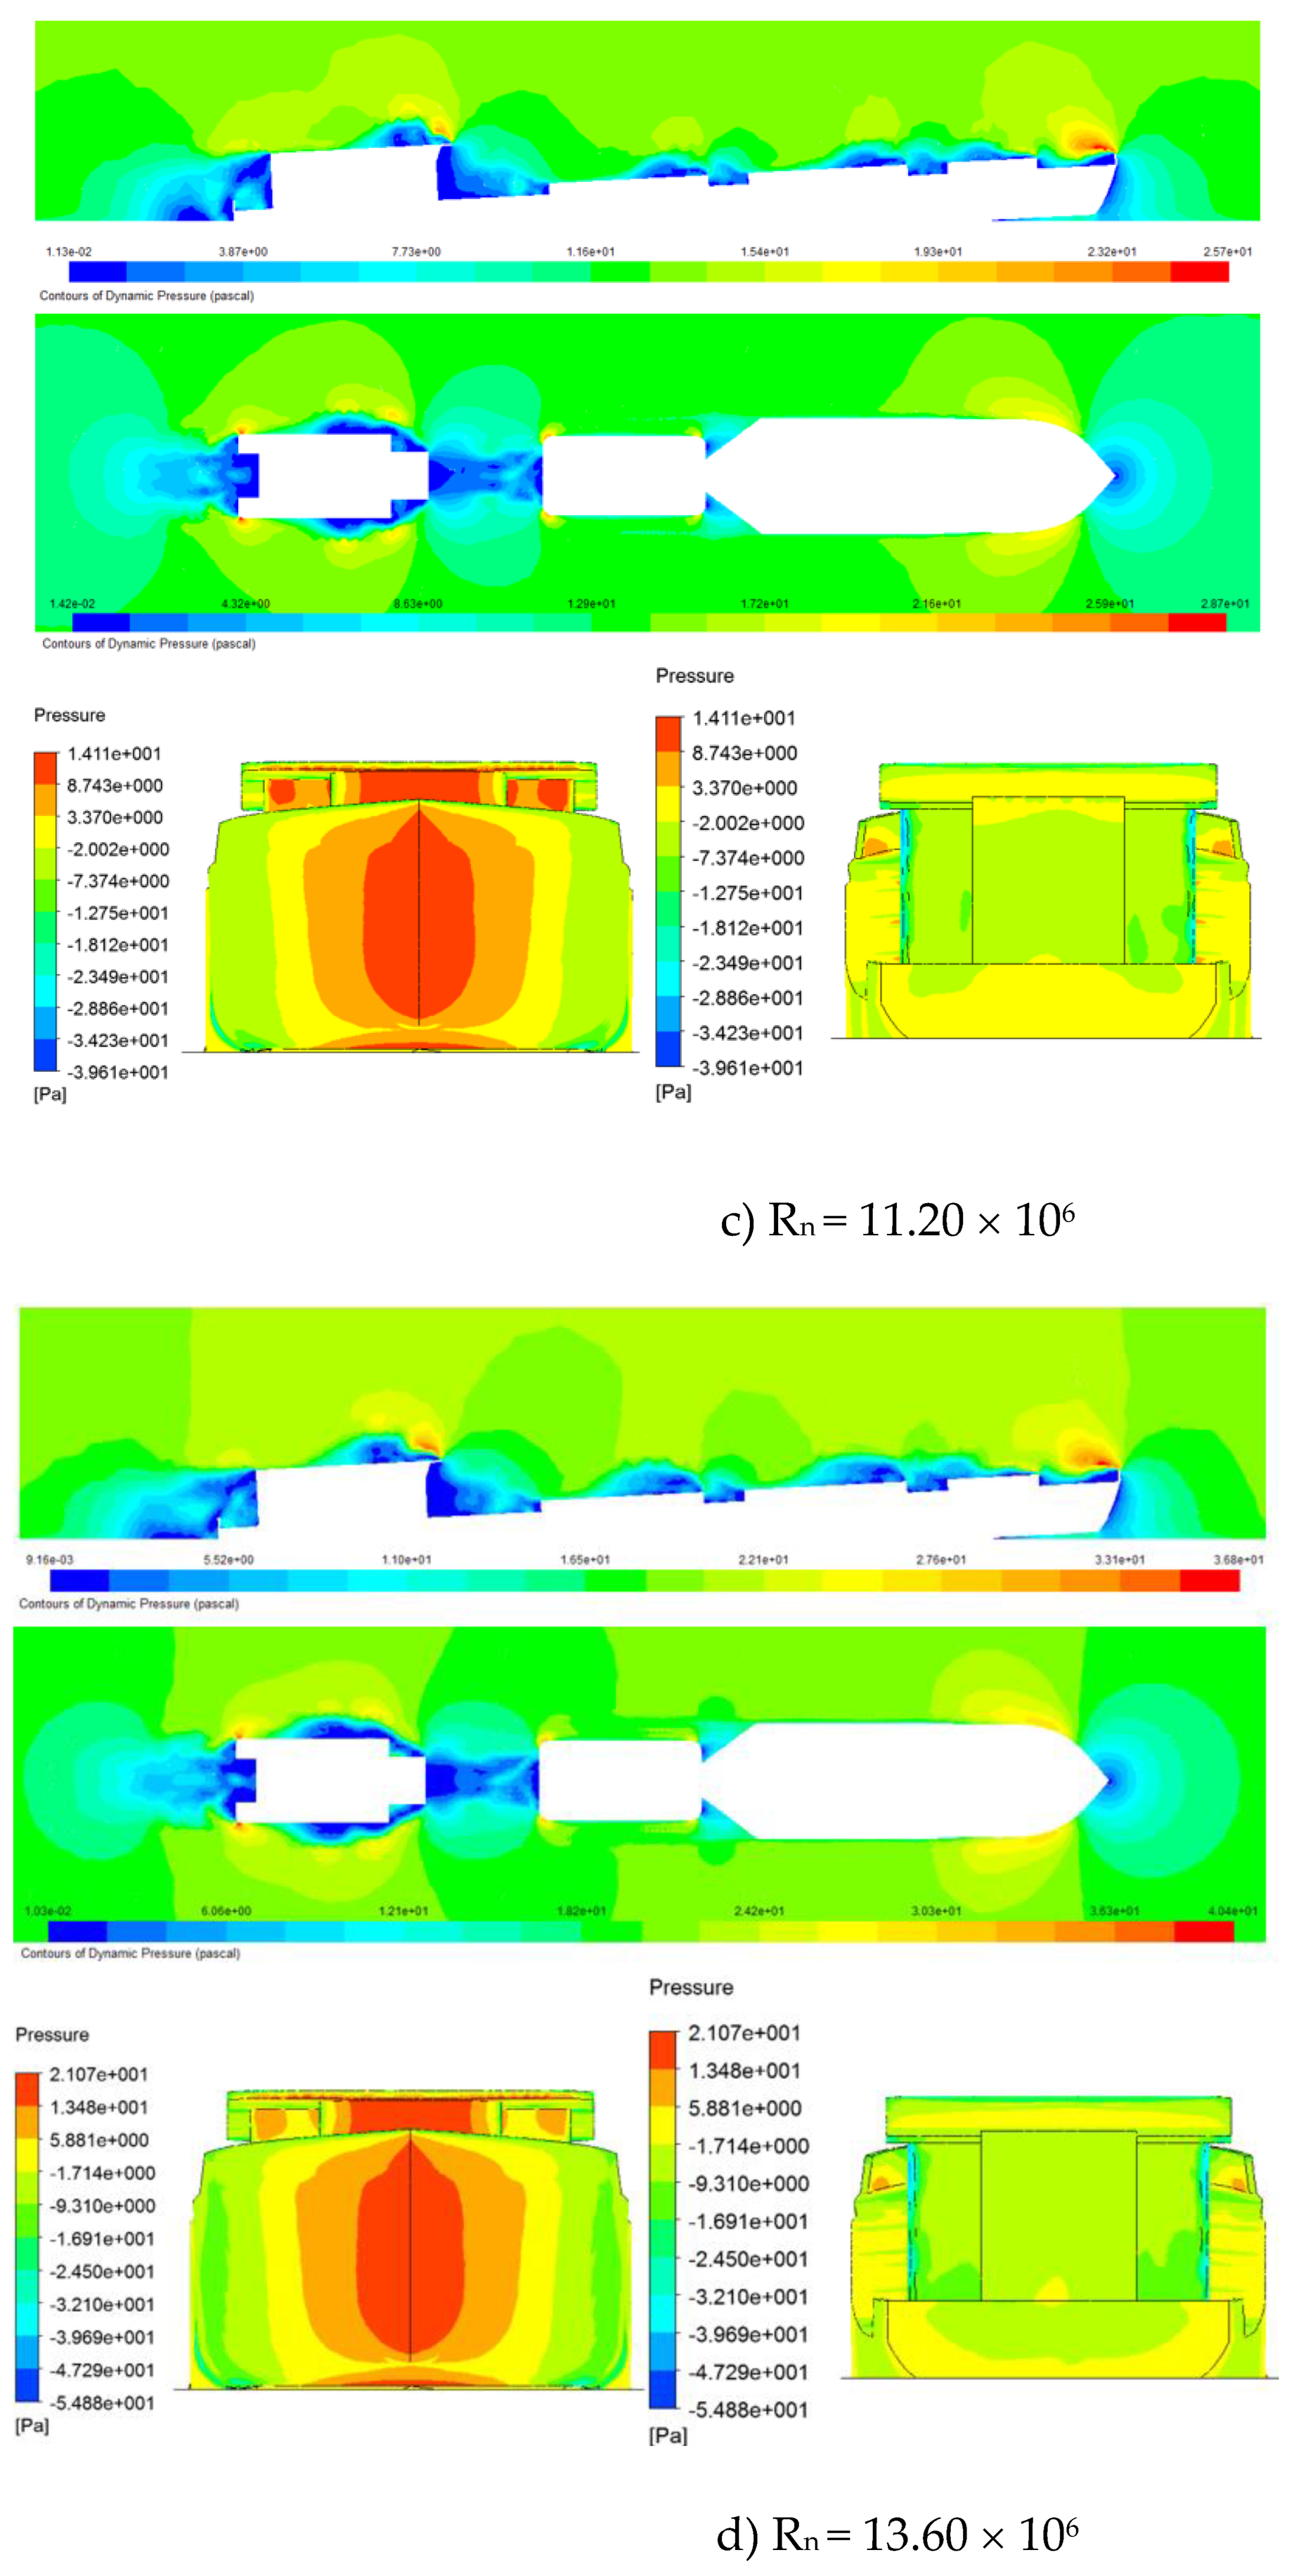
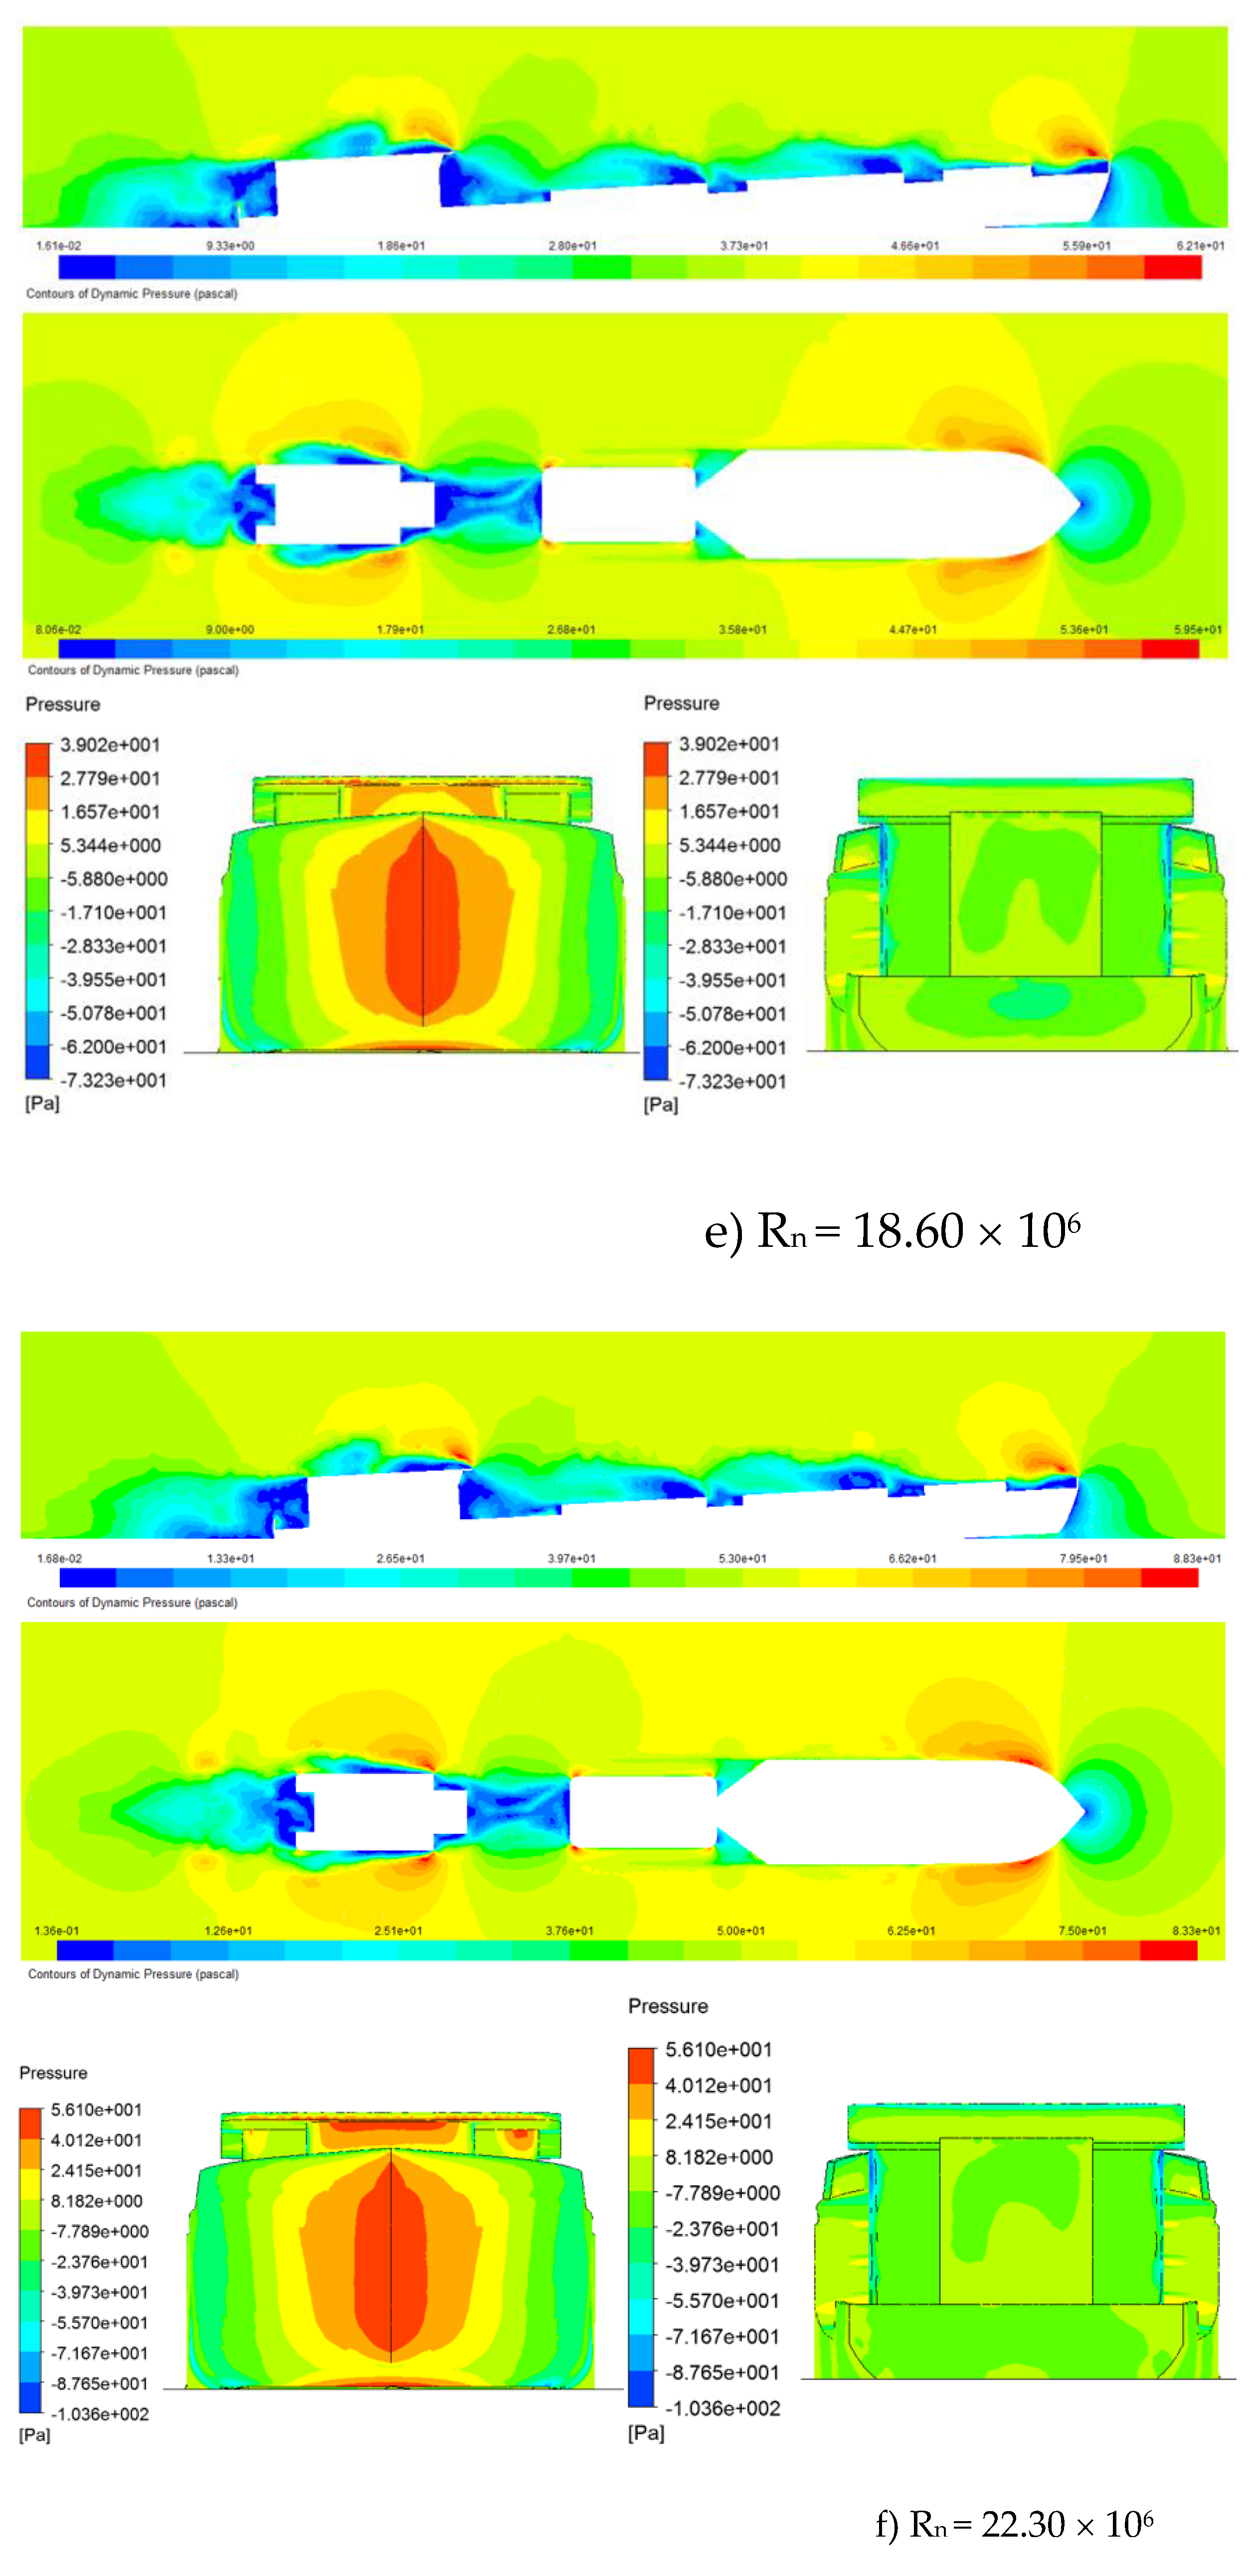
Figure 9.
Wind drag acting on the hull in the balanced condition and the 3-degree bow angle condition
Figure 9.
Wind drag acting on the hull in the balanced condition and the 3-degree bow angle condition
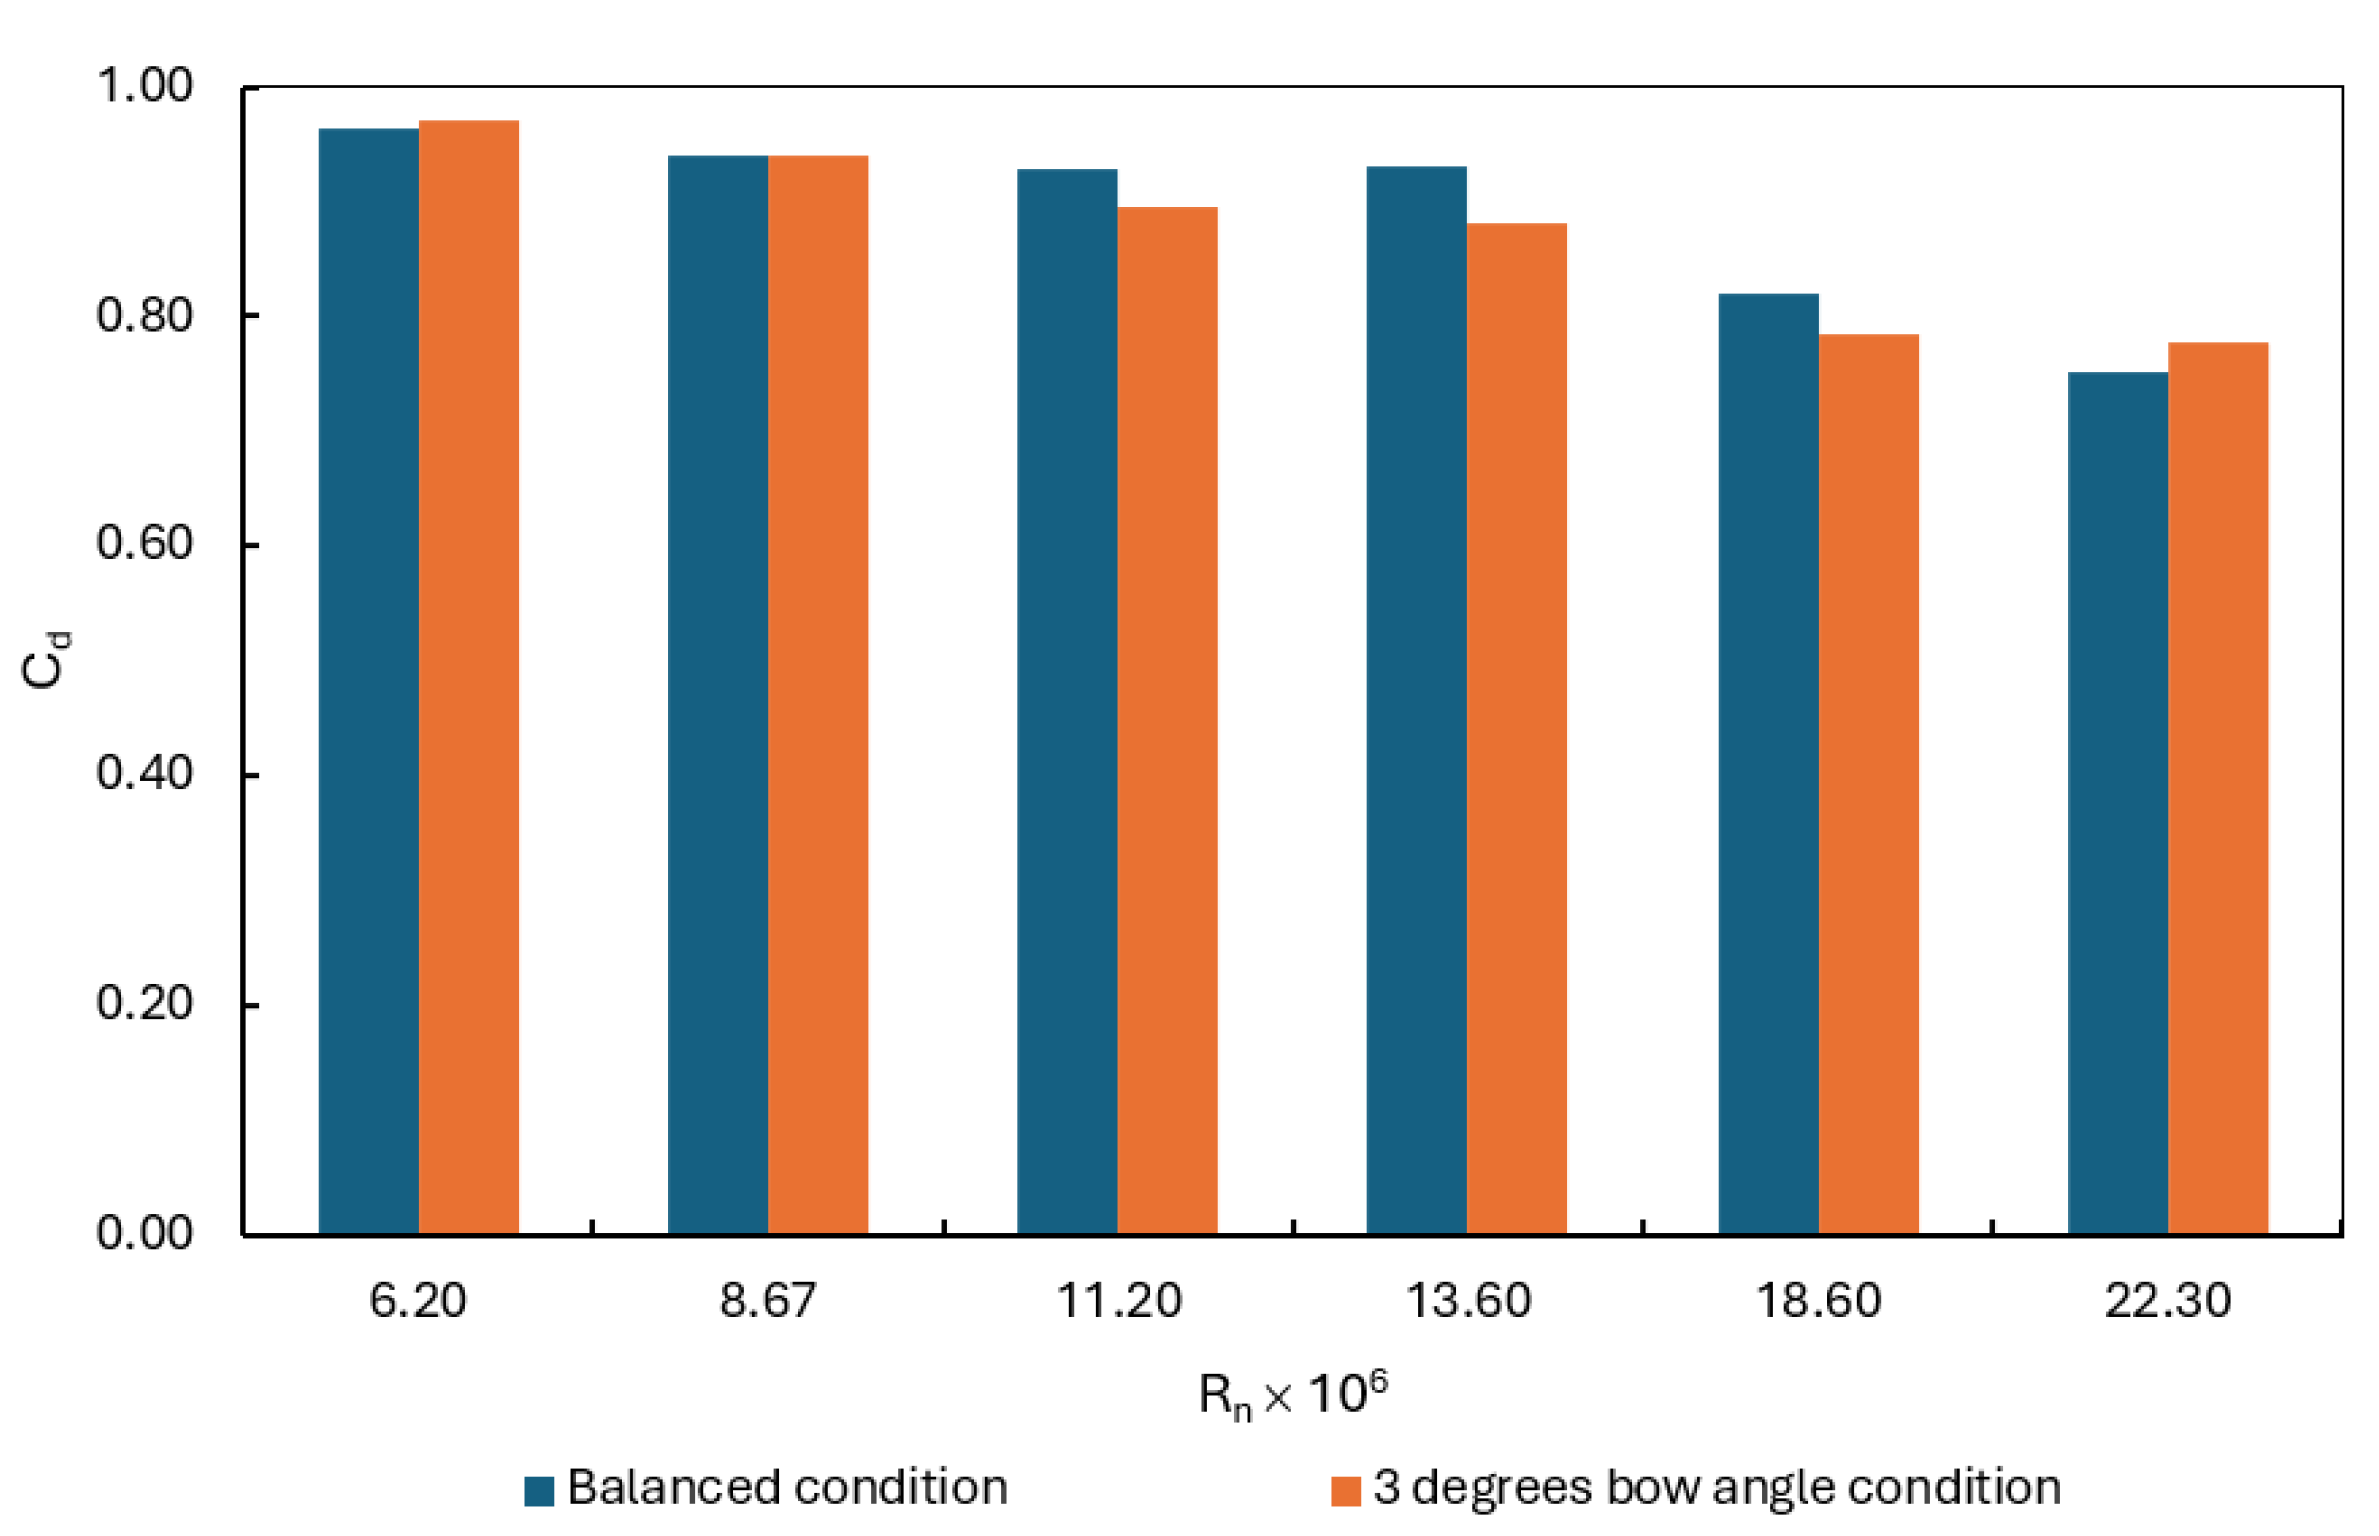
Figure 10.
Model of the ship with a proposed bow cover, modified hatch cover, and accommodation
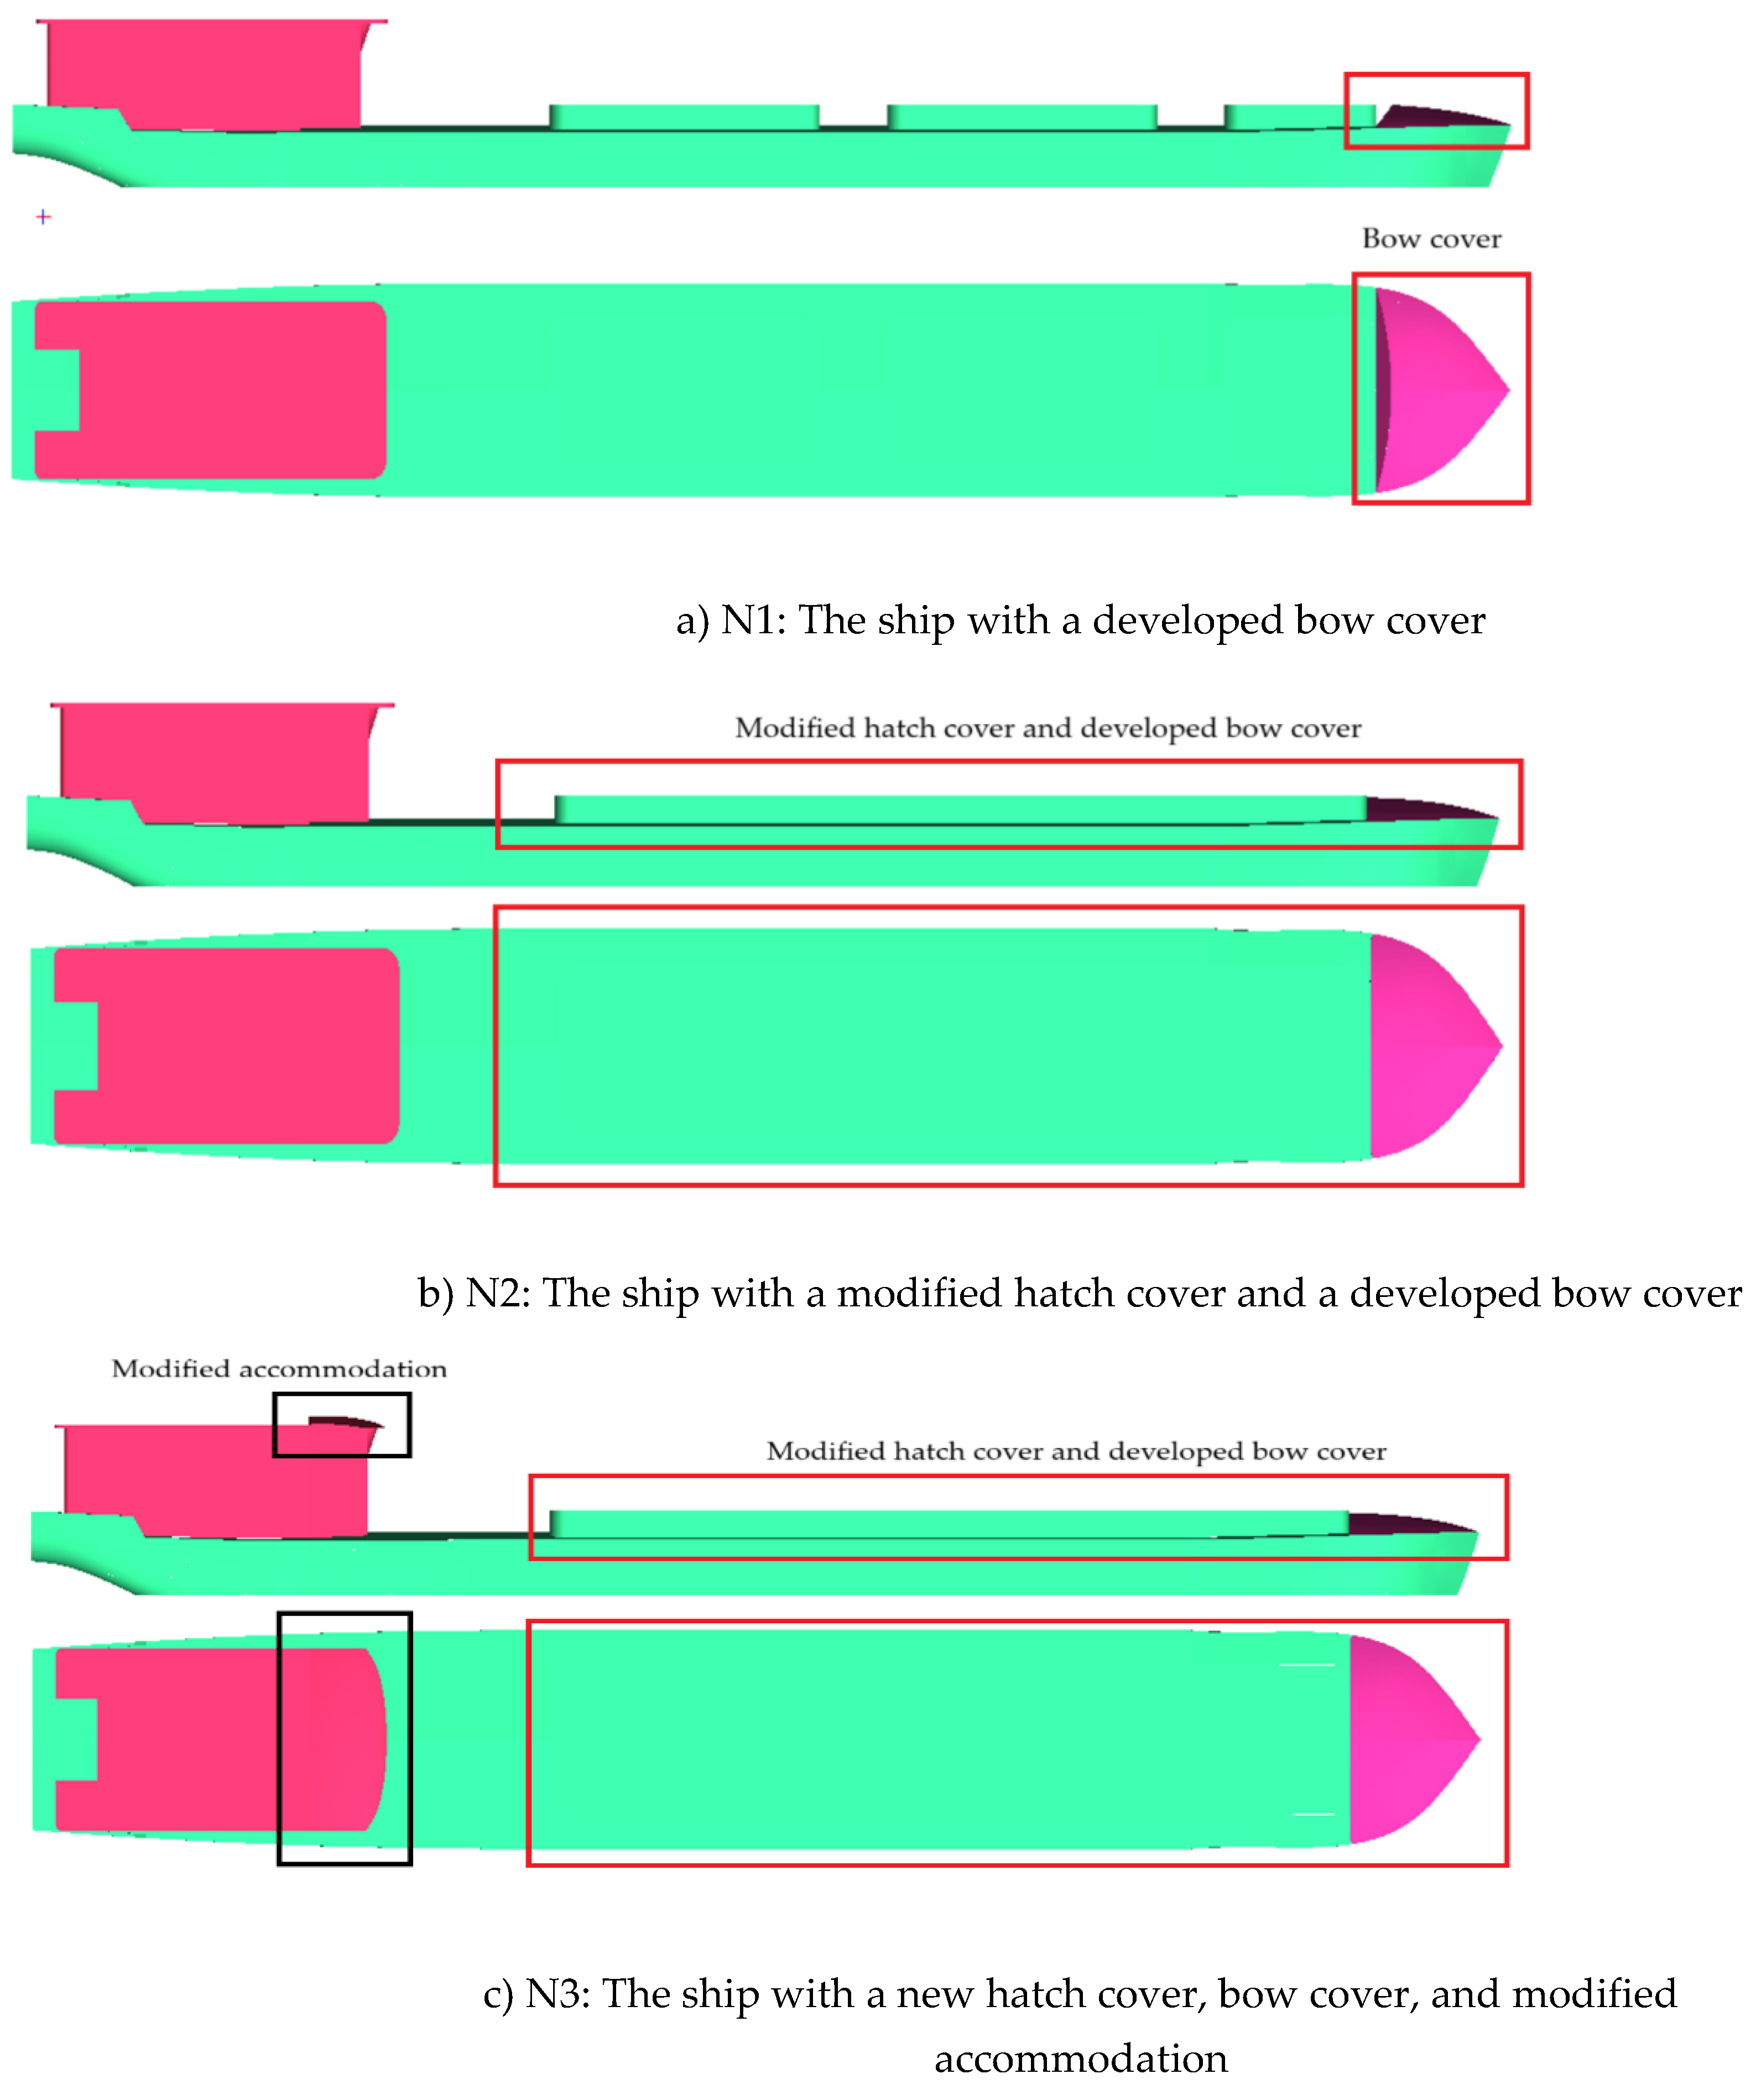
Figure 11.
Dynamic pressure distribution around the ships in the different accommodations

Figure 12.
Dynamic pressure distribution around the ships in the different accommodations
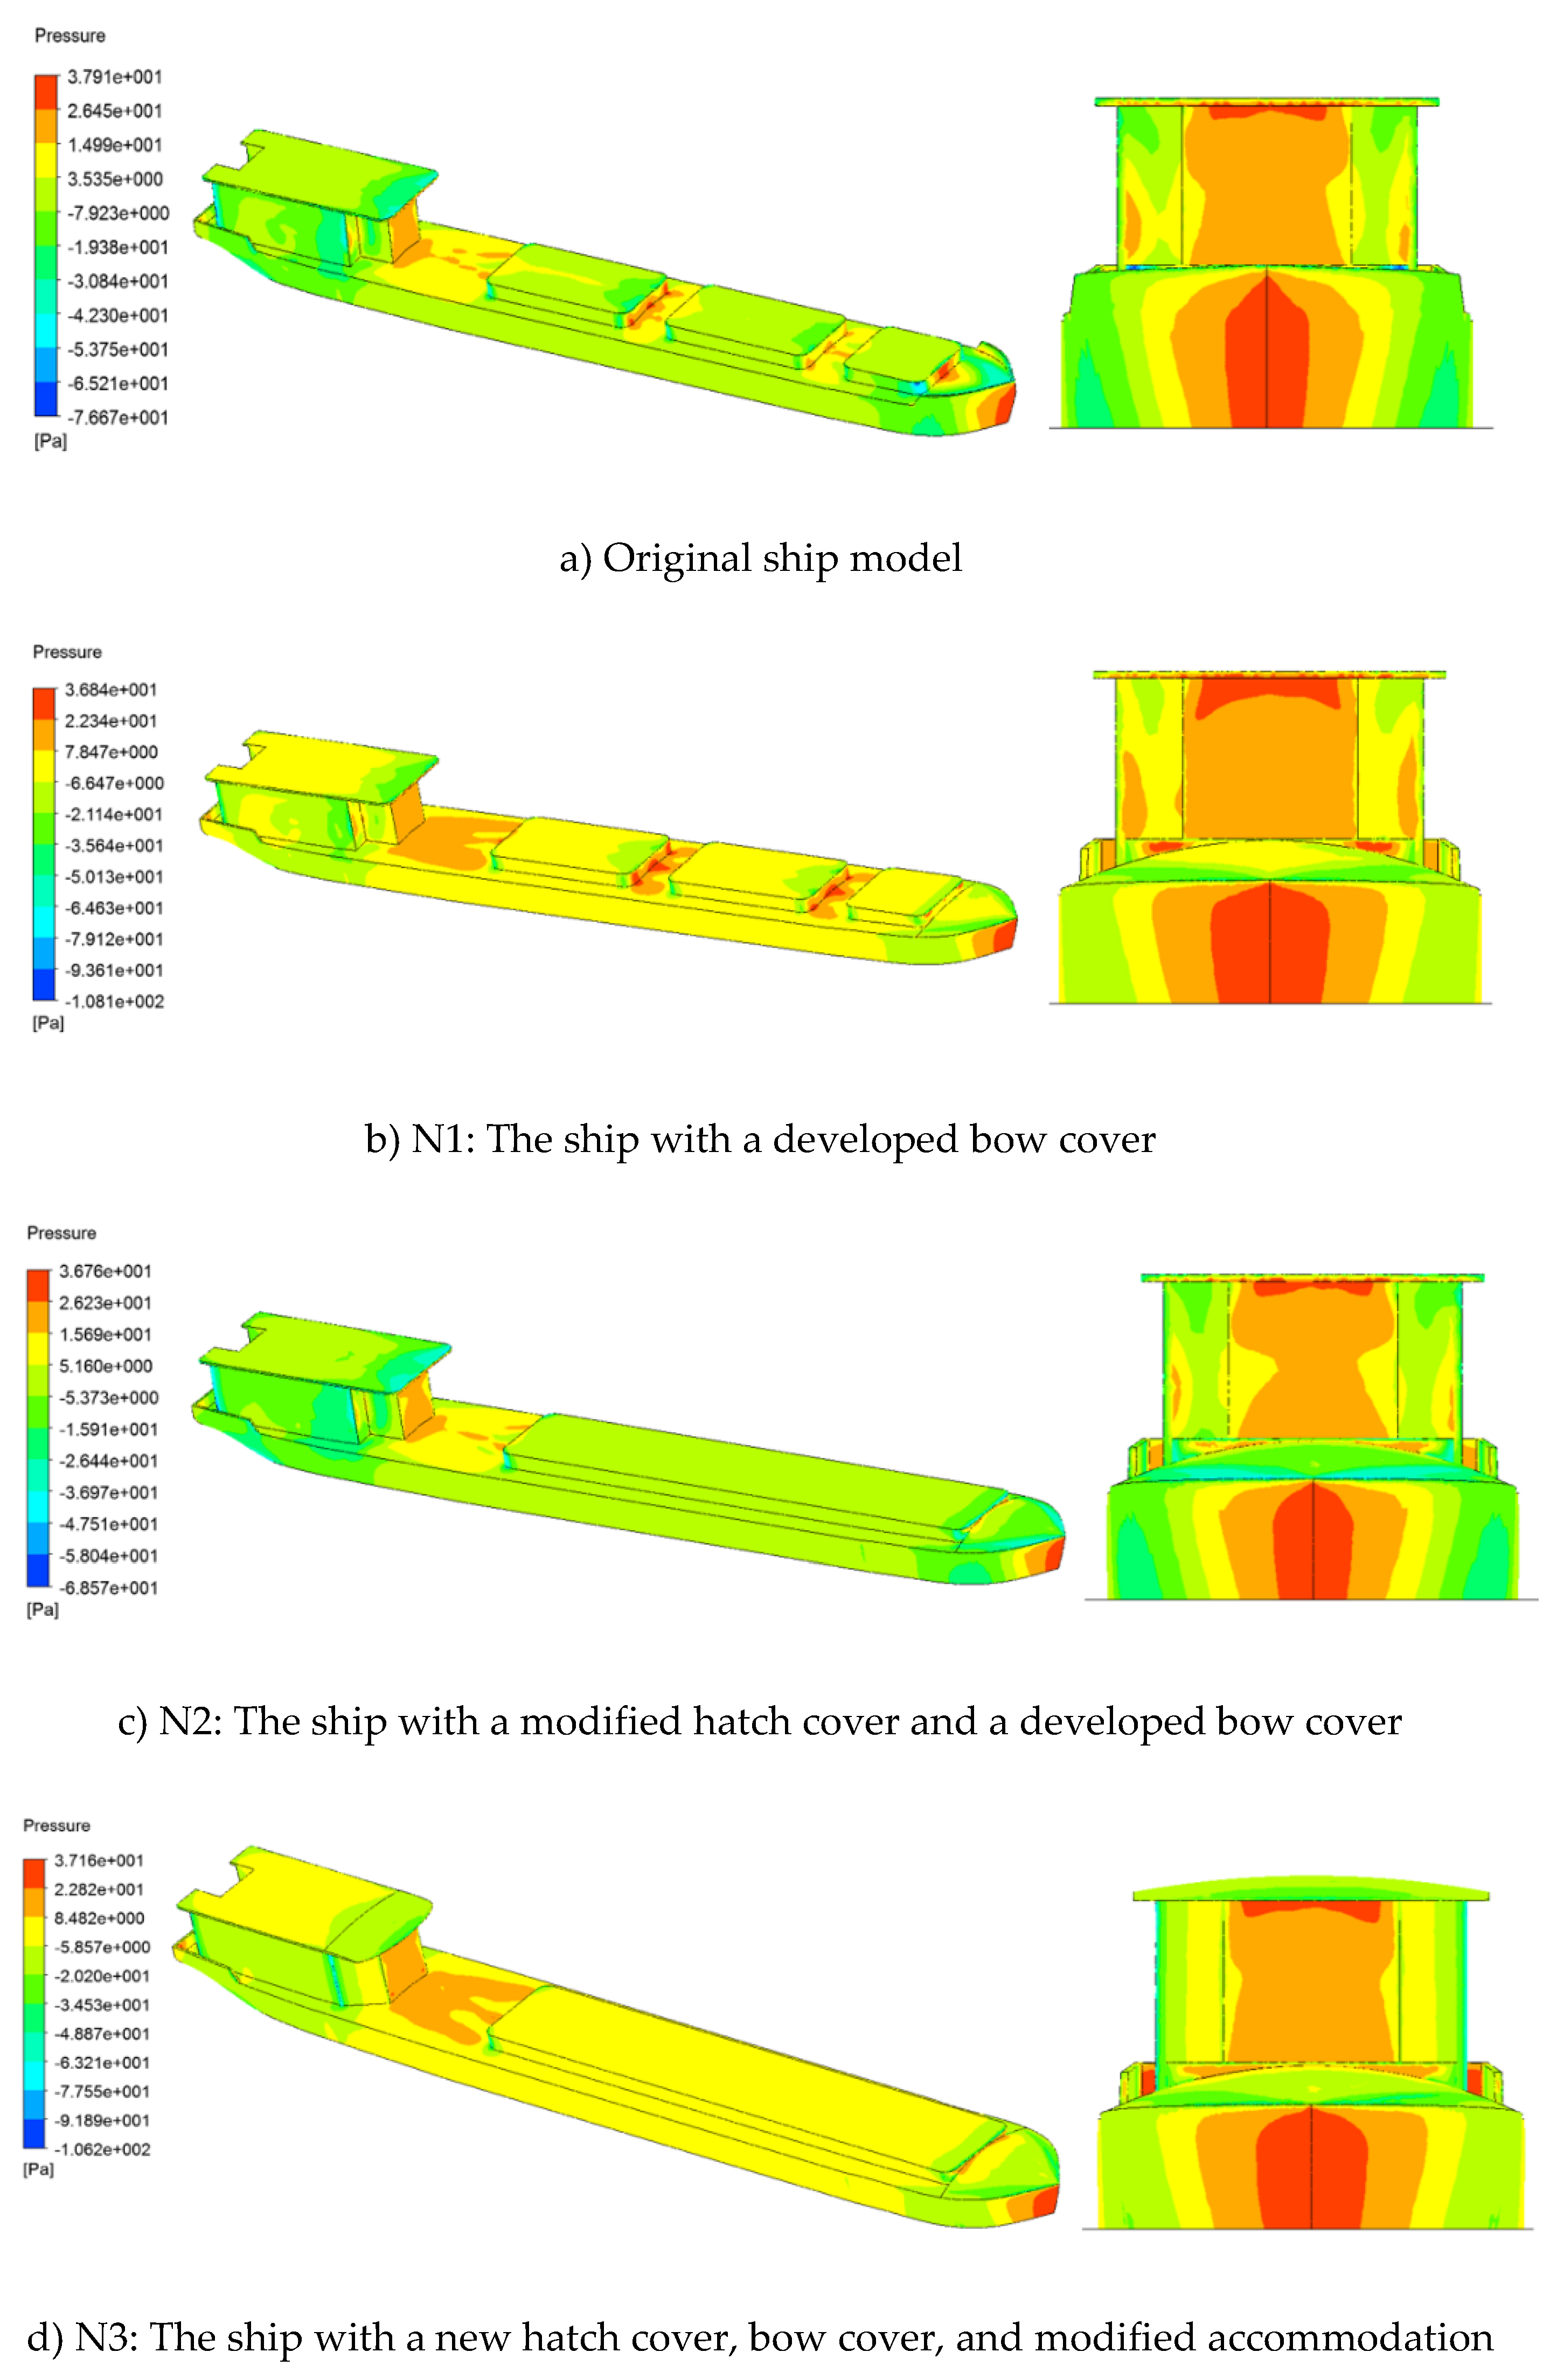
Figure 13.
Comparison of the wind drag coefficient acting on the ships with the different accommodation shapes
Figure 13.
Comparison of the wind drag coefficient acting on the ships with the different accommodation shapes
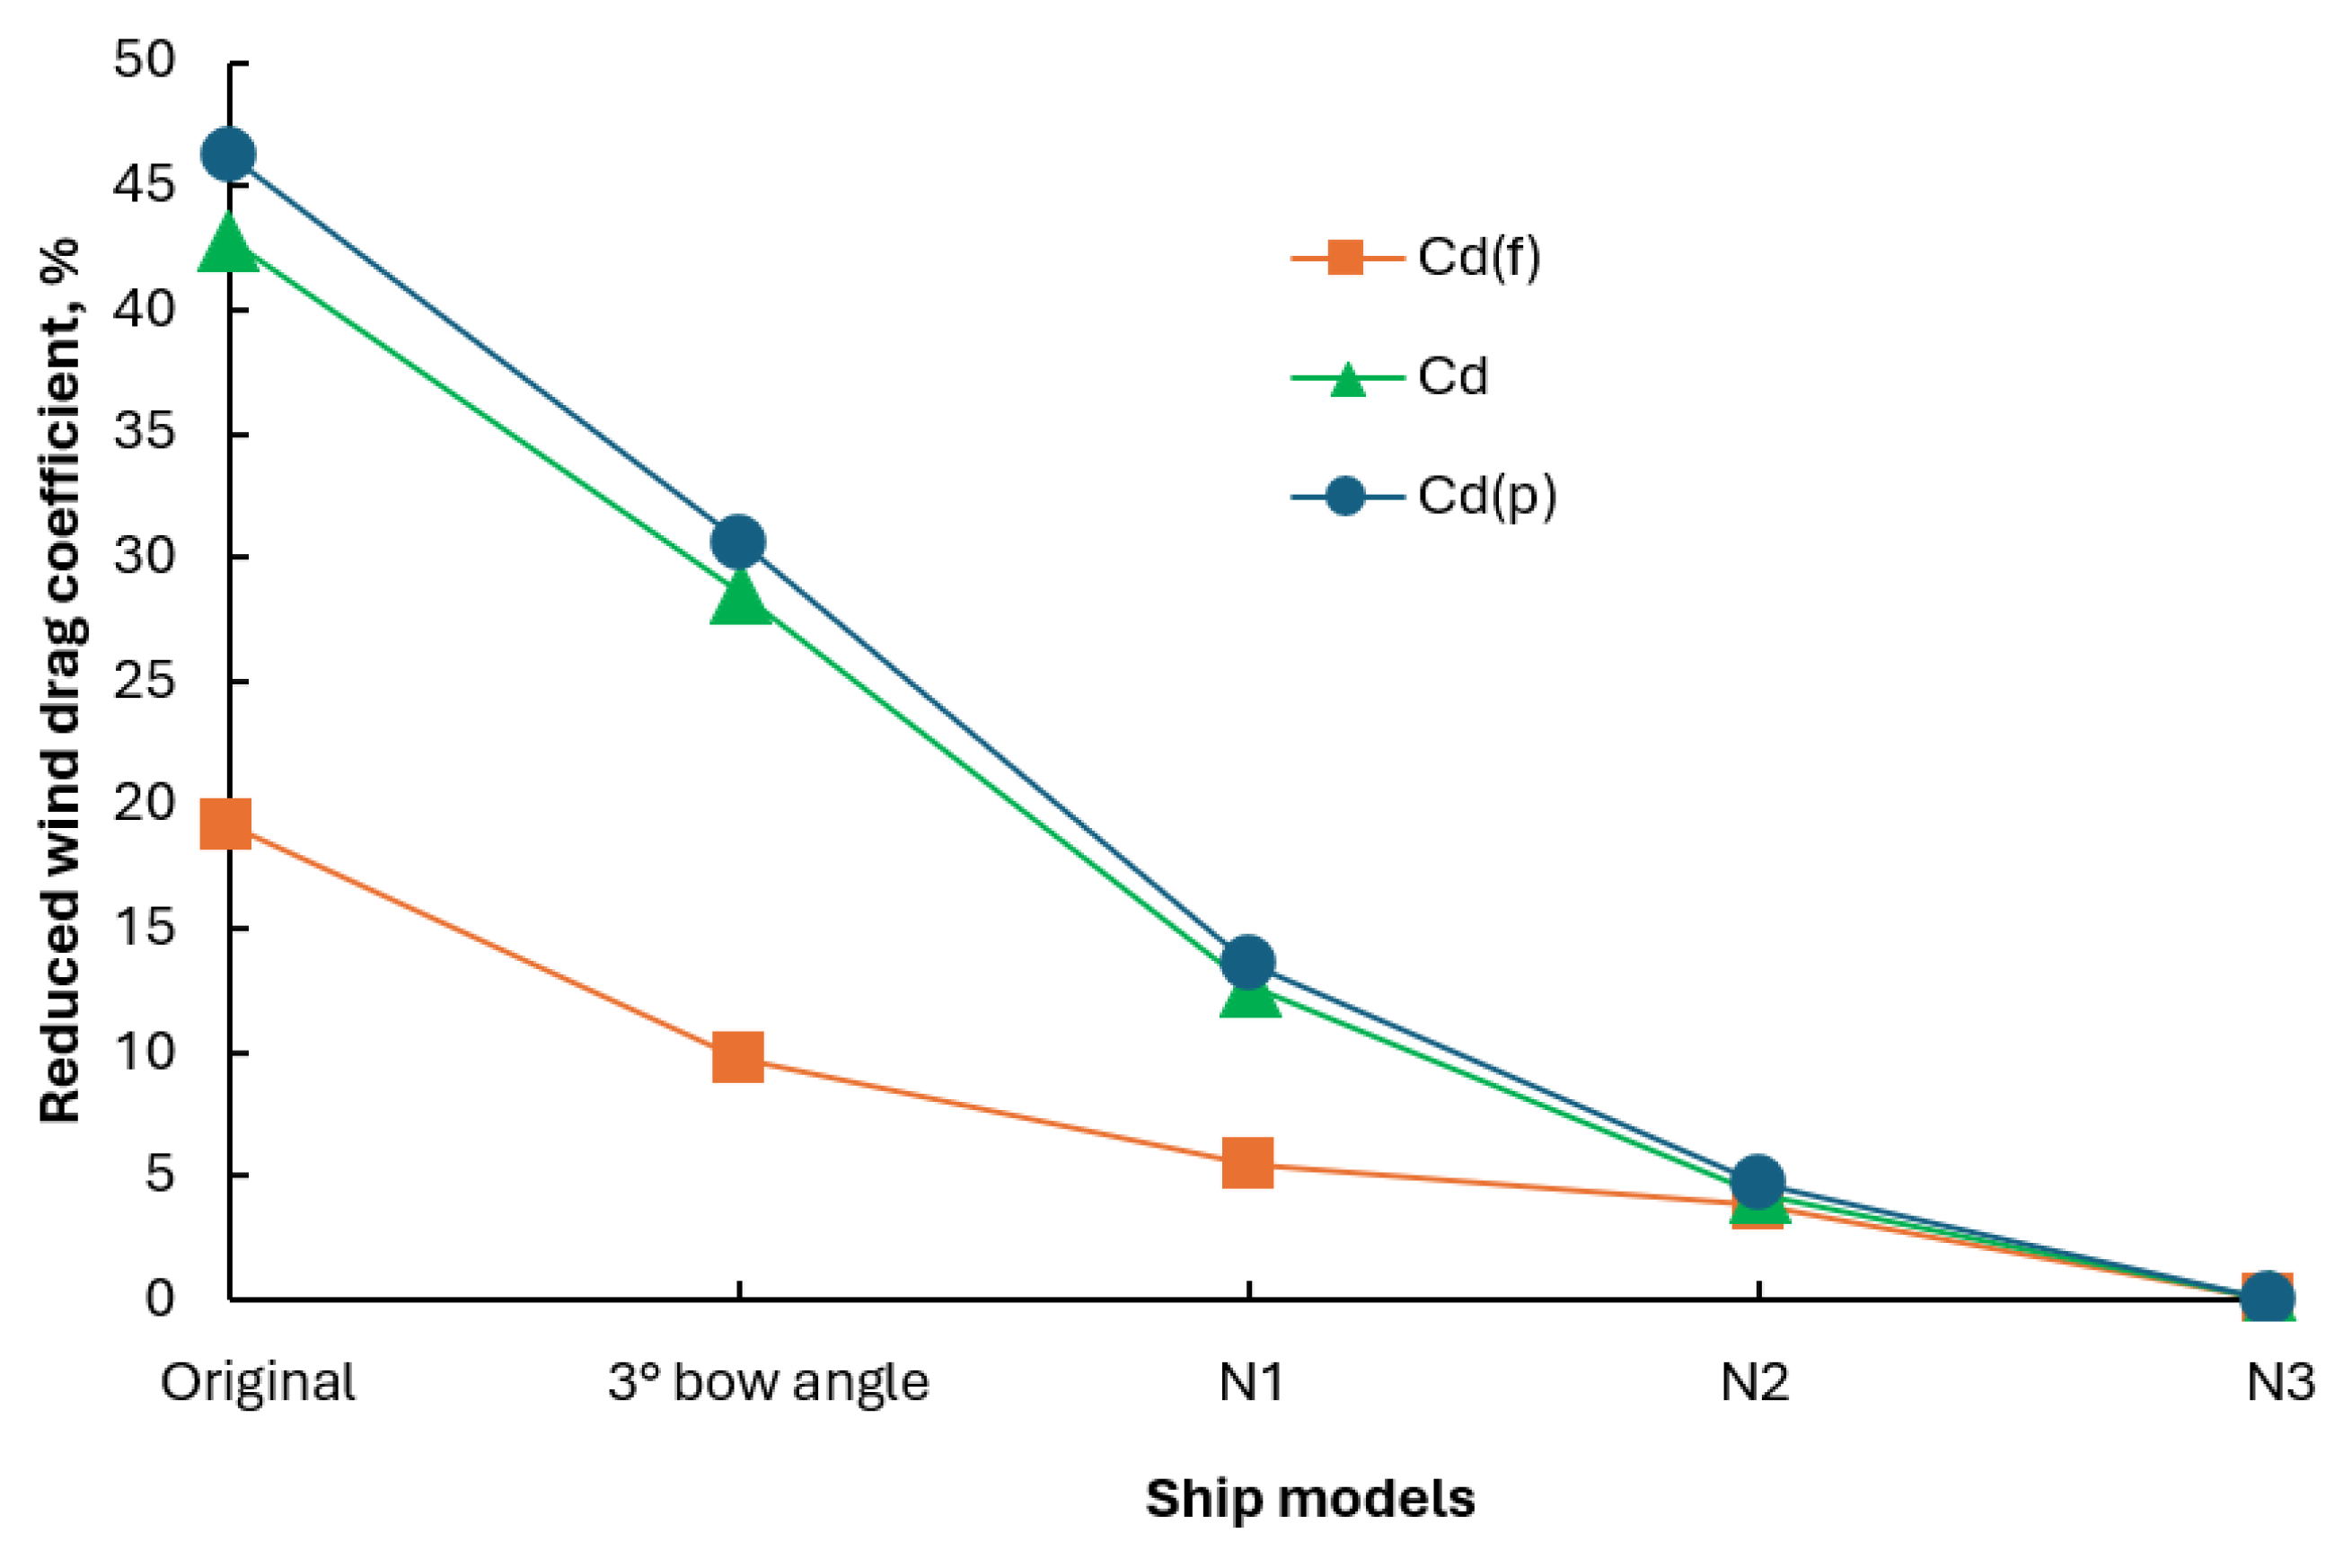

Table 1.
Principal dimensions of the ship.
| Parameters | Value | Unit |
| Length, L | 43.25 | m |
| Breadth, B | 5.70 | m |
| Depth, H | 2.25 | m |
| Draft, d | 1.90 | m |
| Frontal projected area, Sx | 21.64 | m2 |
| Lateral projected area, Sy | 110.79 | m2 |
| Displacement, D | 436.27 | ton |
| Block coefficient, Cb | 0.9162 | - |
| Waterline coefficient, CW | 0.8621 | - |
| Midship coefficient, CM | 0.9683 | - |
Table 2.
Computational conditions.
| Conditions | Parameters | Unit |
| Velocity inlet, V | 2.57 – 9.26 | m/s |
| Pressure outlet, p | 1.025 | at |
| Reynold, Rn | 6 × 10⁶ - 2.2 × 10⁷ | - |
| Air density, ρ | 1.225 | kg/m3 |
| Air kinematic viscosity, ν | 1.7894 × 10⁻⁵ | kg/m∙s |
Table 3.
Wind drag acting on the ship in different mesh numbers, at Rn=6.26 × 10⁶.
|
Mesh number (×106) |
y+ | Cd | ΔCd, % |
| 1.1535 | 128.262 | 0.9891 | 2.6319 |
| 1.6246 | 81.235 | 0.9675 | 0.4599 |
| 2.2356 | 43.768 | 0.9645 | 0.1461 |
| 3.1655 | 30.756 | 0.9637 | 0.0669 |
| 3.8633 | 17.658 | 0.9635 | 0.0466 |
| 5.7366 | 9.835 | 0.9632 | 0.0160 |
| 7.6826 | 4.786 | 0.9631 | 0.0000 |
Table 4.
Wind drag acting on the ship corresponds to the Reynolds number.
| Rn × 106 | Rd(p), N | Rd(f), N | Rd, N | Cd(p) | Cd(f) | Cd |
| 6.20 | 79.1056 | 5.3631 | 84.4686 | 0.9018 | 0.0611 | 0.9632 |
| 8.67 | 152.0577 | 9.6966 | 161.7544 | 0.8844 | 0.0564 | 0.9411 |
| 11.20 | 249.2042 | 14.6588 | 263.8630 | 0.8769 | 0.0516 | 0.9287 |
| 13.60 | 374.7486 | 20.2532 | 395.0018 | 0.8827 | 0.0477 | 0.9306 |
| 18.60 | 612.9621 | 33.3372 | 646.2994 | 0.7764 | 0.0422 | 0.8189 |
| 22.30 | 807.5041 | 45.7045 | 853.2086 | 0.7103 | 0.0402 | 0.7507 |
Table 5.
Wind drag acting on the ship in the 3-degree bow angle condition.
| Rn × 106 | Rd(p), N | Rd(f), N | Rd, N | Cd(p) | Cd(f) | Cd |
| 6.20 | 79.7980 | 5.3979 | 85.1959 | 0.9099 | 0.0616 | 0.9715 |
| 8.67 | 151.6999 | 9.7662 | 161.4661 | 0.8826 | 0.0568 | 0.9394 |
| 11.20 | 239.5849 | 14.8093 | 254.3942 | 0.8432 | 0.0521 | 0.8953 |
| 13.60 | 353.3394 | 20.6182 | 373.9576 | 0.8325 | 0.0486 | 0.8810 |
| 18.60 | 583.7182 | 34.6321 | 618.3502 | 0.7396 | 0.0439 | 0.7835 |
| 22.30 | 837.9862 | 46.4016 | 884.3879 | 0.7373 | 0.0408 | 0.7781 |
Table 6.
Comparison of wind drag acting on the ship in the different operating conditions.
| Rn × 106 | Wind drag, % | Wind drag coefficient, % | ||||
| Rd(p) | Rd(f) | Rd | Cd(p) | Cd(f) | Cd | |
| 6.20 | 0.88% | 0.65% | 0.86% | 0.88% | 0.65% | 0.86% |
| 8.67 | -0.24% | 0.72% | -0.18% | -0.24% | 0.72% | -0.18% |
| 11.20 | -3.86% | 1.03% | -3.59% | -3.86% | 1.03% | -3.59% |
| 13.60 | -5.71% | 1.80% | -5.33% | -5.71% | 1.80% | -5.33% |
| 18.60 | -4.77% | 3.88% | -4.32% | -4.77% | 3.88% | -4.32% |
| 22.30 | 3.77% | 1.53% | 3.65% | 3.77% | 1.53% | 3.65% |
Table 7.
Wind drag coefficients acting on the ships with different accommodation shapes.
| Model | Wind drag, N | Wind drag coefficient | ||||
| Rd(p) | Rd(f) | Rd | Cd(p) | Cd(f) | Cd | |
| Original ship | 612.962 | 33.337 | 646.299 | 0.7758 | 0.0422 | 0.818 |
| 30 bow angle | 583.718 | 34.632 | 618.35 | 0.7388 | 0.0438 | 0.7826 |
| N1 | 529.281 | 35.141 | 564.422 | 0.6699 | 0.0445 | 0.7143 |
| N2 | 425.13 | 36.549 | 461.679 | 0.5381 | 0.0463 | 0.5843 |
| N3 | 329.755 | 39.779 | 369.534 | 0.4173 | 0.0503 | 0.4677 |
Table 8.
Comparison of the wind drag coefficients acting on the ships.
| Model | Wind drag, % | Wind drag coefficient, % | ||||
| Rd(p) | Rd(f) | Rd | Cd(p) | Cd(f) | Cd | |
| Original ship | 46.20 | 19.32 | 42.82 | 46.21 | 19.19 | 42.82 |
| 30 bow angle | 30.64 | 9.63 | 28.57 | 30.64 | 9.72 | 28.57 |
| N1 | 13.65 | 5.41 | 12.67 | 13.65 | 5.45 | 12.68 |
| N2 | 4.77 | 3.88 | 4.32 | 4.77 | 3.79 | 4.33 |
| N3 | 0.00 | 0.00 | 0.00 | 0.00 | 0.00 | 0.00 |
Disclaimer/Publisher’s Note: The statements, opinions and data contained in all publications are solely those of the individual author(s) and contributor(s) and not of MDPI and/or the editor(s). MDPI and/or the editor(s) disclaim responsibility for any injury to people or property resulting from any ideas, methods, instructions or products referred to in the content. |
© 2025 by the authors. Licensee MDPI, Basel, Switzerland. This article is an open access article distributed under the terms and conditions of the Creative Commons Attribution (CC BY) license (http://creativecommons.org/licenses/by/4.0/).
Copyright: This open access article is published under a Creative Commons CC BY 4.0 license, which permit the free download, distribution, and reuse, provided that the author and preprint are cited in any reuse.


