
Submitted:
21 January 2026
Posted:
22 January 2026
You are already at the latest version
Abstract
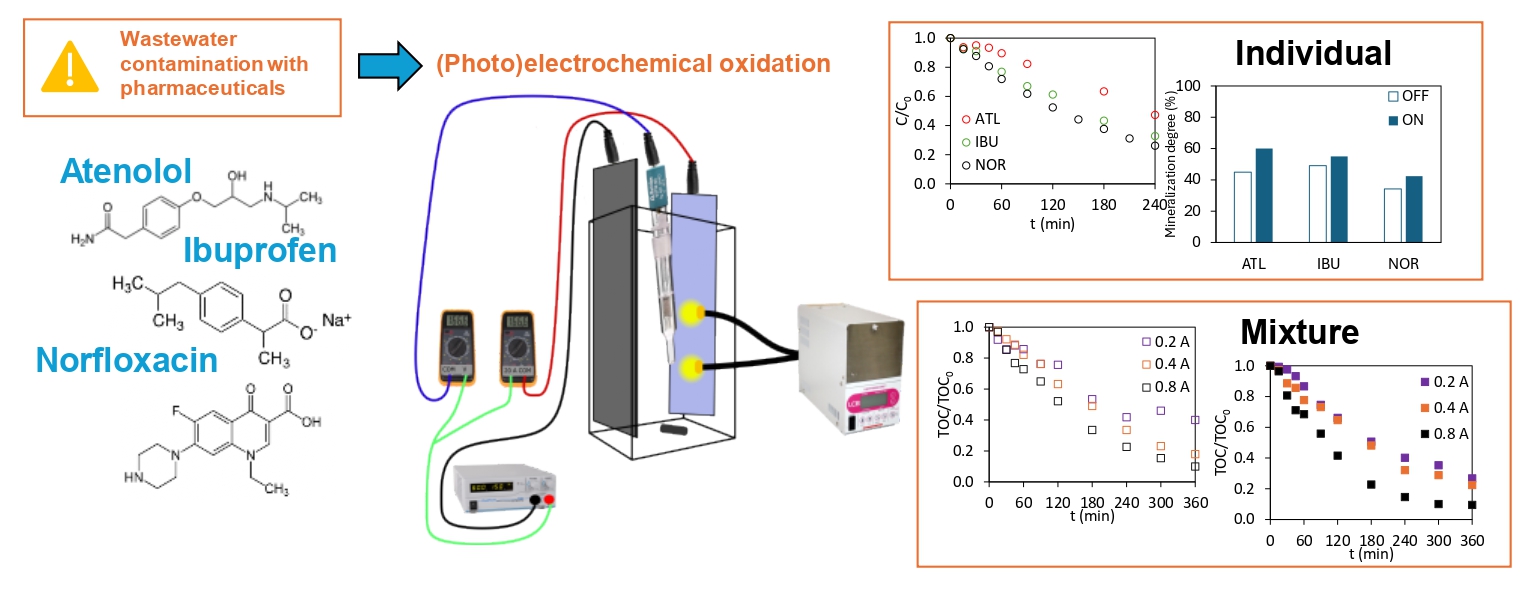
A ceramic anode made of Sb-doped SnO2 and coated with a photoactive BiPO4 layer was tested for the (photo)electrochemical oxidation of three commonly used pharmaceuticals: atenolol, ibuprofen, and norfloxacin. Light-pulsed chronoamperometry showed that the photoanode responded immediately to illumination. The application of light and current enhanced degradation for all compounds when treated separately. Ibuprofen and nor-floxacin exhibited higher degradation than mineralization, which demonstrates their per-sistent nature. Electric current was essential to achieve efficient degradation and mineral-ization, demonstrating the effectiveness of the electrochemical approach. For multicom-ponent mixtures, applying light resulted in higher mineralization compared to dark con-ditions at low operation currents (0.2 A). At higher currents (0.4–0.8 A), the contribution of light was partially masked by the enhanced electrochemical production of hydroxyl radi-cals. Analysis of individual compounds within the mixture revealed significant im-provements in degradation under light exposure. Overall, these results demonstrate the potential of the Sb-doped SnO2 ceramic photoanode as a cost-effective and promising al-ternative to commercial materials for treating pharmaceutical contaminants.
Keywords:
advanced oxidation
; antimony-doped
; atenolol
; bismuth phosphate
; ceramic
; ibuprofen
; norfloxacin
; photoanode
; photoelectrochemical oxidation
; semiconductor
; tin dioxide
1. Introduction
Pharmaceutical active compounds, including antibiotics, analgesics, β-blockers, and hormones, have emerged as a significant type of micropollutants due to their persistent and potentially harmful effects on aquatic ecosystems [1]. These substances enter water bodies through pharmaceutical, urban, and hospital effluents. Moreover, studies show that up to 90% of some antibiotics are excreted without being metabolized [2,3], further contributing to their persistence in aquatic environments. Once released, pharmaceuticals become progressively diluted as they enter wastewater networks. By the time they arrive at wastewater treatment plants, their concentrations are often too low for conventional treatment technologies to effectively remove them.
Despite advances in wastewater treatment, the elimination of these compounds remains challenging due to their low concentrations, chemical recalcitrance, and the absence of specialized degrading microorganisms [4]. As a result, pharmaceuticals can often persist in the treated effluents or accumulate in sewage sludge, posing long-term environmental risks [5]. Although technologies such as adsorption and reverse osmosis are commonly studied for removing pharmaceuticals from aqueous media, they often entail secondary pollution and incomplete removal. In response to this problem, the Directive (EU) 2024/3019 establishes for the first time in the European Union, a target removal efficiency of some pollutants, including pharmaceuticals, through advanced (quaternary) wastewater treatment processes [6].
To address these limitations, advanced oxidation processes (AOPs) have gained attention as a promising alternative. These processes rely on the generation of highly reactive species, such as hydroxyl radicals (•OH), which degrade a wide range of organic pollutants and can achieve their complete mineralization [7]. Among AOPs, photoelectrochemical oxidation has emerged as a particularly effective technique for pollutant degradation, leveraging the synergistic action of electrochemical oxidation and the light-induced activation of a photocatalyst supported on a conductive surface [8]. This dual mechanism enhances the generation of reactive oxygen species, leading to more efficient breakdown of persistent contaminants. As a result, photoelectrochemical oxidation has been applied for remediation of pharmaceutical-containing wastewater [9,10,11,12]. Conductive surfaces, such as fluorine-doped tin dioxide, are often used as supports to immobilize the photocatalyst [13,14]. Recently, research is shifting towards more sustainable and cost-effective alternatives, such as antimony-doped tin dioxide ceramic supports. These materials combine a unique structure that provides great electrical conductivity. Furthermore, these conductive supports can be made with a large active surface area, high porosity, chemical stability, and have low fabrication costs [15,16,17]. Mora-Gómez et al. [18] compared the performance of a commercial boron-doped diamond anode (BDD) with that of the ceramic anode. The study reported up to 92% mineralization of norfloxacin for the BDD anode and 63% when using the ceramic anode. In another study, the influence of reactor configuration on atenolol removal was also assessed for both anodes. Higher mineralization degrees were observed in a divided-cell configuration for both materials, achieving up to 43.9% atenolol mineralization with the ceramic anode [19].
Alongside the conductive support, the choice of the photocatalyst plays a crucial role in determining the overall performance of the photoanode. In this context, Medina-Casas et al. [20] conducted a study comparing two photocatalysts, CdFe2O4 and ZnFe2O4, deposited on a Sb-doped SnO2 ceramic support for norfloxacin mineralization. The study showed enhanced norfloxacin degradation in the presence of light and for higher current intensities, achieving a 90% degradation rate at an operation intensity of 0.8 A with the CdFe2O4 photocatalyst.
Bismuth-based materials, such as BiPO4, used in this study, stand out for their low cost, non-toxicity, and high oxidizing ability under ultraviolet and visible light [21]. In our previous work, the influence of light exposure, operation current and illuminated area on norfloxacin abatement using a BiPO4 photocatalyst deposited over a Sb-doped SnO2 conductive support was explored [22]. Results showed enhanced mineralization of norfloxacin in the photoelectrochemical process, with the illuminated area playing a key role. Similarly, in a research conducted by Domingo-Torner et. al. the same ceramic support coated with another bismuth-based photocatalyst (BiFeO3) was used for norfloxacin mineralization [23]. Using this material, 56% norfloxacin mineralization was achieved. Notably, the photoelectrochemical process exhibited approximately 15% lower energy consumption than its electrochemical counterpart.
In the present study, an Sb-doped SnO2 anode coated with the photoactive BiPO4 layer is employed in the electrochemical and photoelectrochemical oxidation of three commonly consumed pharmaceuticals: atenolol, ibuprofen, and norfloxacin. The pharmaceuticals were treated both individually and in a mixture. This study enables comparison with previous studies using the same pharmaceutical mixture but different anode materials, such as BDD [24], while expanding on previous findings that demonstrated the potential of this material in pharmaceutical removal. The performance of the photoanode will be assessed through parameters like the pharmaceutical degradation, mineralization efficiency, specific energy consumption, and mineralization current efficiency.
2. Materials and Methods
2.1. Chemicals and Reagents
Three widely consumed pharmaceuticals were selected for the present study: atenolol (ATL, beta-blocker), ibuprofen (IBU, non-steroidal anti-inflammatory drug), and norfloxacin (NOR, broad-spectrum antimicrobial). All pharmaceuticals were of analytical grade and purchased from Sigma-Aldrich. The chemical properties of the pharmaceuticals can be found in Table S1.
Analytical-grade sodium sulfate (Na2SO4) (99% purity), obtained from Panreac, was used as the supporting electrolyte. For ion chromatography measurements, solutions of sodium hydrogen carbonate and anhydrous sodium carbonate, purchased from Sigma-Aldrich with a purity higher than 99%, were used as the anionic eluent. A mixture of 17 mmol·L⁻¹ nitric acid and dipicolinic acid was employed as the cationic eluent.
Analytical grade acetonitrile from Merck and OptimaTM LC/MS grade formic acid from Fischer were used in the High-Performance Liquid Chromatography coupled with mass spectrometry (HPLC-MS) analysis. All solutions were prepared using Type 1 Mili-Q ultrapure water with a resistivity of 18.2 MΩ·cm at 25 ºC and a Total Organic Carbon (TOC) value of ≤ 5 ppb.
2.2. Photoanode Material and Treated Solutions
The photoanode was an Sb-doped SnO2 ceramic support coated with a photoactive layer of BiPO4 with an active area of 11.55 cm2. The anode synthesis and its characterization were described in a previous work [22]. Photolytic, electrochemical, and photoelectrochemical treatments were applied to individual pharmaceutical solutions to evaluate the photoanode performance and compare degradation and mineralization efficiencies of each compound under different conditions. The model solution of the first group of experiments consisted of 100 mg·L-1 of ATL, IBU, or NOR, each prepared with 2 g·L-1 of Na2SO4 as the supporting electrolyte. Subsequently, the selected pollutants were mixed, to evaluate the performance of the material when treating multiple compounds simultaneously, mirroring conditions commonly encountered in real effluents. In the second group of experiments, a synthetic mixture containing 20 mg·L-1 of each pharmaceutical was used, using 2.8 g·L-1 of the supporting electrolyte. These conditions were established to enable a more direct comparison with results from previous studies conducted by the research group [24].
2.3. Photoelectrochemical Characterization
The preliminary photoelectrochemical characterization of the electrode was conducted by means of using light-pulsed chronoamperometry to assess the photoactivity of the material. A conventional three-electrode configuration was used for the experiments. The working electrode was the photoanode under study (active area: 0.3 cm2), a Pt foil (Crison) (area: 1 cm2) served as the counter electrode, and a 3 M KCl Ag/AgCl electrode (Metrohm) was used as the reference. The electrodes were placed in a 200 mL quartz reactor containing 14.2 g·L-1 Na2SO4 as the electrolyte. The light source was the Lightningcure LC8 L9566-03A device from Hamamatsu equipped with a 200 W Xenon lamp, and an IR filter with transmittance wavelengths between 350 and 600 nm and a single light beam. Measurements were performed with a PalmSens4 potentiostat controlled by PSTrace 5.9. Before the measurements, the photoanode was pretreated at 1 V vs. Ag/AgCl for 4 h. Three bias potential values (measured versus open-circuit potential) were tested: 0.1, 0.5, and 1 V. During chronoamperometric experiments, the photoanode was first polarized for 1 h in the dark at the corresponding overpotential until reaching current stabilization. Light pulses at two percentages of the total light power (100% and 50%) were then applied, alternating 150 s of illumination with 150 s in the dark. The measured intensity values were normalized by subtracting the baseline intensity recorded in the absence of light.
2.3. Photoelectrochemical Oxidation
Photoelectrochemical oxidation experiments were conducted in galvanostatic mode at 0.2, 0.4 and 0.8 A (17.32, 34.63, 69.25 mA·cm-2) in the absence and presence of light for both the individual pharmaceuticals and the synthetic mixture. The experimental setup is depicted in Figure S1. The reactor, the light source (with a double light beam to increase illuminated area) and the reference electrode were the same as the ones used in the photoelectrochemical characterization experiments (section 2.3.). The current was supplied using a PeakTech P1585 power supply. A stainless-steel sheet with a total area of 20 cm2 was employed as cathode. Prior to the photoelectrochemical oxidation experiments, photolysis studies were conducted in the absence of the anode and using the previously specified concentrations for the individual pharmaceuticals to assess whether the pollutants could be degraded solely by the action of light.
In the treatment of individual pharmaceuticals, the experiments lasted 4 hours, with samples collected at intervals of 15 minutes during the first hour, 30 minutes during the second hour, and every hour thereafter until the end of the experiment. For the treatment of the synthetic mixture, experiments were conducted over a 6-hour period, during which samples were collected at the same time intervals.
2.4. Analytical Techniques
The concentration profiles of ATL, IBU, and NOR, when treated separately, were monitored using UV/vis spectrophotometry (Unicam UV4-200). The absorbance was measured at the characteristic wavelengths of each compound: 223 nm for both atenolol and ibuprofen, and 277 nm for norfloxacin. Pollutant concentrations were then determined using calibration curves correlating absorbance with concentration.
The degradation of the pollutants in the synthetic mixture was monitored using HPLC-MS analysis, with an Agilent 1290 Infinity system equipped with a C-18 column (Agilent ZORBAX Eclipse Plus, 50 mm x 2.1 mm, 1.8 µm particle size). Mobile phases were A, 0.1% v/v formic acid in water, and B, acetonitrile. The flow rate was 0.5 mL·min-1. The sample injection volume was 20 µl. The chromatographic gradient is shown in Table S2. Samples were previously filtered using polyethersulfone (PES) membranes with a pore size of 0.22 µm to prevent column fouling. The mass spectrometer operated in positive ionization mode, for ATL and NOR, and in negative ionization mode for IBU quantification with the following parameters: capillary voltage, 4000V; nebulizer pressure, 40psi; drying gas flow, 9 L·min-1; gas temperature, 325 ºC; skimmer voltage, 65V; octopole rf, 250V; and fragmentor voltage, 190V. The mass spectra were recorded between 100 and 1700 m/z. The m/z values of the analytes were 267.17 for ATL, 205.13 for IBU, and 320.14 for NOR, and their approximate retention times were 3.55 min, 8.9 min, and 4.7 min, respectively. The analysis and quantification of each compound were performed using extracted ion chromatograms (EIC), which provide information regarding specific m/z values [25]. Calibration curves were constructed and used for quantification by plotting EIC peak area versus analyte concentration for concentrations ranging from 0.1 to 1 mg·L-1.
Mineralization was evaluated by measuring the non-purgeable organic carbon (NPOC), corresponding to the TOC present in the solution. These values were obtained using a Shimadzu TNM-L ROHS analyzer. During NPOC measurements, the sample undergoes catalytic combustion in a furnace at 680ºC, where all carbon present in the solution is converted to CO2. The NPOC value is then determined using a calibration curve. This analysis complements the determination of individual pollutant concentrations, as it provides insight into whether the organic molecules are being mineralized into CO2 and H2O.
Ionic by-products were identified and quantified using ion chromatography with a Metrohm 883 Basic IC ion chromatograph. The analyzer is equipped with a Metrosep C6-250/4.0 cation exchange resin column and a Metrosep A Sup 150/4.0 anion exchange resin column. For the anionic column, 100 mM H2SO4 was used as a suppressor. The elution time was 30 minutes, with flow rates of 0.9 mL·min⁻¹ and 0.7 mL·min⁻¹, for the cationic and anionic eluent, respectively. Ion concentrations were determined using calibration curves, which correlate the area under the peak obtained in the chromatogram with the concentration of each ion.
2.4. Indicators of the Reactor Performance
Several parameters were selected to assess the process performance. The degree of degradation evaluates the transformation of the pollutant into other species and can be determined using Equation (1):
Where is the initial concentration of the pollutant (C = ATL, IBU, NOR) and is the concentration of the pollutant at a certain time.
The degree of mineralization indicates the extent to which the organic pollutants in the solution are decomposed into CO2, H2O, and inorganic ions. It was calculated using Equation (2):
Where is the initial TOC concentration and corresponds to the TOC concentration at a certain time .
The unreleased ion percentage refers to the percentage of a certain element originally present in the molecule that remains unconverted or undetected in the form of ionic species in the bulk solution. It was calculated using Equation (3)
Where is the total concentration of a specific ion measured at the end of the experiment and is the theoretical maximum concentration of the selected element that can be formed from the complete mineralization of the original molecule.
The mineralization specific energy consumption was also calculated. This parameter quantifies the energy consumption relative to the mineralization process (4):
Where is equal to the experiment duration, is the cell voltage (V), is the operating intensity (A),is the volume of the reactor (L), and are the initial and the final TOC concentration values, respectively, in mg·L-1.
Mineralization current efficiency (MCE) indicates the percentage of the supplied charge invested in the mineralization process [23]. The MCE value was calculated using Equation (5):
Where is the number of electrons exchanged in the electrochemical oxidation assuming complete mineralization of the pollutants, 66 (see reaction (6) for ATL, (7) for IBU, and (8) for NOR). is the Faraday constant (96487 C·mol-1), 7.2·105 is a conversion factor for dimensional homogenization (60 s·min-1 x 12000 mg C mol C-1), and is the number of carbon atoms present per mole of the contaminants. When treating the mixture of pharmaceuticals, value was 14.1.
The specific energy consumption and MCE values were compared with the ones obtained by the research group when using a commercial BDD anode (NeoCoat, thickness of the coating was 6 µm, and a total boron concentration, 2500 ppm) [24].
3. Results and Discussion
3.1. Photoelectrochemical Characterization
The photoactivity of the material was evaluated by light-pulsed chronoamperometry. As illustrated in Figure 1, the material exhibits an immediate photocurrent response upon irradiation. The photocurrent transient exhibits a two-stage increase: a rapid rise immediately upon illumination, followed by slower growth during continued light exposure, characteristic of inductive materials [26]. Results show that photocurrent depends on both the applied overpotential (Figure 1a) and the irradiation intensity (Figure 1b): higher values of either parameter result in higher photocurrent values.
Regarding the effect of applied potential (Figure 1a), the higher photocurrent values can be attributed to the fact that increasing the bias facilitates electron transfer from the valence band to the conduction band, while simultaneously reducing the recombination of photogenerated holes with electrons, which increases the efficiency of the photocatalytic process. When the light is turned off, the system requires some time to relax and reach stability. Relaxation slows down at lower applied potential and becomes faster as it increases, showing that the transients depend strongly on it. Similar trends observed in semiconductor devices like solar cells confirm that the relaxation process is not limited by resistance-capacitance time constants [27].
The effect of applied light intensity is evaluated in Figure 1b and reflects that applying 100% of light intensity results in higher photocurrent values, with similar inductive behavior as observed in Figure 1a. Note that the initial rise in photocurrent upon illumination becomes more pronounced at higher light intensities. The experiments show that photocurrent value increases with the incident light intensity, since a higher photon flux generates a greater concentration of charge carriers [28]. Similarly, as shown in Figure 1a, the system relaxes more rapidly under higher light intensities. Taking that into account from now on, the degradation of the pharmaceuticals will be performed applying 100% light intensity.
3.2. Photoelectrochemical Oxidation of the Isolated Pollutants
3.2.1. Degradation
The behaviour of the ceramic photoanode was studied by treating both electrochemically and photoelectrochemically the selected pharmaceuticals separately. The evolution of the relative concentration in the absence (OFF) and in the presence of light (ON) is represented in Figure 2a to c for ATL, IBU, and NOR, respectively. The relative concentration of the contaminants declines over time both in the electrochemical and photoelectrochemical experiments for all pharmaceuticals because of the electrochemical generation of •OH and other weaker oxidants, e.g., S2O8=, that may originate from the oxidation of the supporting electrolyte, Na2SO4 [29].
The final value of relative concentration achieved is lower when light is applied, due to supplementary photoelectrolytic •OH production, which accelerates the degradation process. The effect of illumination observed is more pronounced for ATL at the end of the experiments. This observation aligns with reported studies demonstrating that BiPO4 photocatalysts show superior degradation efficiency for cationic species [30], corresponding to improved acid-base interactions at the semiconductor surface. Under the experimental conditions (pH ≈ 8), which is below the pKa value of ATL (9.6), ATL predominantly remains in its protonated (cationic) form. This characteristic likely explains its enhanced photocatalytic degradation efficiency compared to neutral species or anionic compounds like NOR.
The experimental findings related to the potential degradation of contaminants under UV-visible light irradiation without applying current were also analyzed. The evaluation is based on the hypothesis that UV-visible light may contribute to the breakdown of organic molecules itself, without the application of current to the system. In our study, no notable photodegradation of the target pollutants was observed as indicated by the evolution of their relative concentrations shown Figure S2. These findings are in line with other studies available in literature. For instance, Carrillo et al. [16] reported no photodegradation of ATL under visible light irradiation. Furthermore, TOC measurements confirmed the absence of significant mineralization for any of the species under study. The minimal variations in both concentration and TOC values throughout the photolysis experiments suggest that, although slight decreases in pollutant concentrations may occur, they do not involve notable transformation into smaller molecules. These variations in TOC further support the conclusion that photolysis under UV-visible light alone does not result in meaningful mineralization of the pollutants.
Figure 2d depicts the evolution of C/C0 in the absence of light for ATL, IBU, and NOR when treated separately. It is observed that ATL achieves the highest C/C0 value, hence the lowest degradation, followed by IBU and NOR. The increased difficulty of ATL to be degraded may be explained by the fact that ATL contains a specific functional group (NH2COCH2-) (Table S2) in its structure, which lowers its reaction rate constant with •OH [31]. IBU exhibits intermediate degradation capacity because IBU is slightly more reactive with •OH than ATL, likely explained by the presence of an aromatic ring in IBU structure (Table S2) [32,33]. Finally, NOR presents the highest degradation likely due to defluorination, a mechanism that was disclosed as the primary transformation pathway for NOR in other AOPs, such as ozonation [34] and photoelectrochemical oxidation [23]. The loss of the fluorine atom alters the molecular structure of NOR (Table S2), preventing its detection by UV absorbance and thus indicating transformation of its primary structure [22].
Ion chromatography was employed to monitor the transformation products formed during the degradation process. In the case of ATL, the molecule undergoes oxidation according to the reaction shown in (6). The final concentrations of inorganic ions generated during ATL degradation under both electrochemical and photoelectrochemical conditions are presented in Figure S3a. The presence of nitrite, nitrate, and formate ions was confirmed which is consistent with findings previously reported in the literature [35,36]. It is important to note that nitrite and nitrate ions were detected instead of ammonium (NH4+) because of the rapid oxidation of NH4+ to more stable nitrogen species under the applied oxidative conditions, such as nitrite and nitrate, due to its low oxidation state (-III) [37]. Notably, nitrite was only detected under illuminated conditions, with a concentration of 0.46 mmol·L-1. In contrast, both nitrate and formate were detected under both dark and illuminated conditions, with similar concentrations in each case: 0.045 mmol·L-1 (dark) vs. 0.039 mmol·L-1 (light) for nitrate, and 0.06 mmol·L-1 (dark) vs. 0.09 mmol·L-1 (light) for formate. The maximum concentration of nitrogen that can be released into the bulk solution due to ATL transformation assuming complete mineralization, following reaction (6), is 0.75 mmol·L-1. Based on this theoretical value, the percentage of unreleased nitrogen was calculated for ATL using Equation (3). Under light conditions, only 33% of nitrogen content remains unreleased, whereas in the absence of light, this percentage increases significantly to 94%, underscoring the crucial role of light in promoting nitrogen release during ATL degradation.
For NOR oxidation (according to reaction (8)), in addition to nitrite, nitrate, and formate, fluoride ions were also detected, and their final concentration is shown in Fig.S3b. Fluoride concentrations reached 0.193 mmol·L⁻¹ during electrochemical degradation and 0.28 mmol·L⁻¹ in the photoelectrochemical experiments. As previously calculated for nitrogen-containing ions in the ATL molecule, the maximum concentration of fluoride that can be released from the decomposition of NOR was calculated assuming complete mineralization, resulting in a value of 0.313 mmol·L-1. Based on this value and using Equation (3), the unreleased fluorine percentage was also calculated, resulting in a value of 38% in the absence of light and 11% under illuminated conditions. The decreased amount of fluorine that remains attached to NOR molecule under illumination suggests photolytic and photoelectrolytic cleavage of C–F bonds in the NOR structure.
3.2.2. Mineralization
The evolution of the relative TOC concentration was also evaluated for ATL, IBU, and NOR (Figure 3a to c). This parameter decreases over time for all pharmaceuticals, according to their conversion into simpler molecules due to the attack of the oxidants generated near the electrode surface. In the case of IBU (Figure 3b), when no light is applied, the low decrease in TOC/TOC0 indicates limited mineralization during the first 120 minutes of the experiment. After that, the TOC/TOC0 evolution is equivalent to that observed under illuminated conditions. Overall, the results are consistent with other works in the literature for organic pollutants, where the increased radical production resulted in lower relative TOC values [38,39] However, none of the compounds underwent complete mineralization. An improvement in terms of TOC/TOC0 was observed under illuminated conditions for all pharmaceuticals, being more pronounced for ATL and IBU. Beyond the molecular degradation observed in Figure 2, the photoelectrochemical process also promotes the breakdown of these compounds into smaller organic compounds. NOR shows the lowest difference between the final TOC/TOC0 value both in the absence and in the presence of light, since defluorination, though crucial in the transformation of the primary structure of NOR, does not imply mineralization of the molecule. As can be seen in the NOR transformation mechanisms proposed by Zhu et. al. [40], the potential intermediate that is formed due to fluorine loss of the NOR molecule yet has the same number of carbon atoms in its structure as the original molecule,16. Figure 3d shows the evolution of TOC/TOC0 for all pharmaceuticals in the absence of light when treated separately. All pharmaceuticals exhibit almost identical evolutions of the parameter during the experiments and achieve similar final TOC/TOC0 values.
Figure 4 represents the final degradation and mineralization percentages of ATL, IBU, and NOR under both dark and illuminated conditions for a better comparison. In the absence of light, ATL exhibited a degradation efficiency of 41.7%, whereas IBU and NOR achieved higher efficiencies, 67.8% and 73.8%, respectively. Illumination enhanced degradation for all compounds, with efficiencies increasing up to 55.6% for ATL, 75.2% for IBU, and 79.8% for NOR. ATL exhibited the most pronounced light-induced degradation enhancement among the three compounds, as observed in Figure 4a. The synergistic effect of light and electricity is particularly interesting in enhancing the degradation of less reactive compounds such as ATL.
In terms of mineralization, as shown in Figure 4b, the three compounds show mineralization percentages ranging between 34.2 and 60.0%, with NOR presenting a slightly lower value than ATL and IBU. Final mineralization percentages without and with light application were 44.9% vs. 60.0% for ATL, 49.1% vs. 55.0% for IBU, and 34.2% vs. 42.4% for NOR. For all pharmaceuticals, the degree of mineralization increases with the application of light, indicating enhanced mineralization under photo-assisted conditions.
It is important to note that, for all compounds, mineralization degrees are consistently lower than degradation degrees, which emphasizes the complexity of the degradation pathway. This discrepancy can be attributed to the multi-step nature of the mineralization process. While degradation refers to the transformation or breakdown of the parent compound into intermediate products, mineralization quantifies the complete conversion of these intermediates into CO2 [41]. As a result, a compound may undergo extensive degradation without achieving full mineralization, since the oxidation of organic compounds is reported to lead to the formation of short-chain carboxylic acids (such as formate, see Figure S3) prior to their complete mineralization [42]. For instance, in some studies, ATL achieved up to 99% degradation confirmed by HPLC-MS, but only 80% mineralization when treated with a carbon dot/TiO2 composite photocatalyst [43]. Similarly, IBU has been shown to reach degradation levels of 91.5% using ozonation, while its mineralization remained significantly lower, around 63.9% [44], highlighting the persistence of intermediate organic species in the system.
3.3. Photoelectrochemical Oxidation of the Synthetic Mixture
3.3.1. Degradation
The target pharmaceuticals in the synthetic mixture were effectively detected using the previously described HPLC method, as illustrated in Figure 5. Specifically, in Figure 5a, two intense peaks were detected at retention times of 3.5 and 4.7 minutes, corresponding to ATL and NOR, respectively. As can be seen in Figure 5b, the other compound of interest, IBU, eluted at approximately 8.9 minutes.
The degradation of each pharmaceutical was monitored by obtaining EIC chromatograms at selected sampling times. Figure S4 shows the temporal evolution of the peaks in the EICs corresponding to ATL, IBU, and NOR. The peaks decrease over time under both dark and illuminated conditions, with a faster decline observed under illumination, consistent with the results obtained when treating the pollutants individually (Figure 2). These findings confirm the effectiveness of the anode for treating a mixture of pharmaceuticals, as the •OH generated during the process, along with other oxidants, exhibit non-selective reactivity toward all the compounds present in the mixture.
These observations are further substantiated by the results depicted in Figure 6, which illustrate the evolution of the relative concentrations of ATL, IBU, and NOR over time under dark (a) and illuminated (b) conditions. In the absence of light, ATL, IBU and NOR follow a similar trend, with a gradual decrease in concentration, reaching final degradation percentages of 79.4%, 86.3%, and 88.8%, respectively. This observation leads us to assume that their behavior in terms of reactivity toward •OH remains unchanged, even though the pharmaceuticals are treated as a mixture. As can be observed in Figure 6b, ATL and IBU undergo complete degradation (>99.0%), while NOR reaches a 90.0% degradation. The faster decomposition of ATL in the presence of light suggests an enhanced affinity of the pharmaceutical with the BiPO4 photoactive layer, as previously observed when treating ATL alone (section 3.2.1). Overall, the results demonstrate the improved performance of the photoelectrochemical system under illumination, particularly for compounds with lower reactivity in dark conditions.
Ion chromatography was used to quantify inorganic ions formed during the degradation of the pharmaceutical mixture. This technique provides insight into transformation pathways, although some ions, such as nitrate, may originate from multiple compounds (e.g., ATL and NOR). In contrast, ions like fluoride are specific to certain pharmaceuticals (NOR) and serve as markers of their degradation. The concentration of ionic by-products increased over time during the initial stages of the experiment for certain ions (e.g., fluoride and formate) and continued to rise throughout the entire treatment period in the case of nitrate. This trend reflects the progressive transformation of the parent compounds. For fluoride (Figure 7a), a maximum concentration of approximately 0.025 mmol·L-1 was reached in the early stages, followed by stabilization around this value. Interestingly, in the case of formate (Figure 7b), a different decrease in concentration was noted under illuminated conditions after 180 minutes of treatment. Beyond this point, the elimination rate of formate ions exceeds their generation rate, because of the oxidative action of photogenerated •OH, which promotes further mineralization of formate into carbon dioxide. This trend was also observed for other short-chain organic ions, such as acetate, detected during NOR elimination by electrofiltration [45]. Nitrate (Figure 7c) was detected under both dark and illuminated conditions, reaching measured maximum concentrations between 0.20-0.25 mmol·L-1. The saturation values obtained are in coherence with stoichiometric maximum expected from the further oxidation of ammonium ions (calculated at 0.24 mmol·L-1), formed during the decomposition of ATL (reaction (6)), and NOR (reaction (8)) to nitrate.
3.3.2. Mineralization
The effect of operating current was evaluated in the treatment of the mixture by obtaining the evolution of the TOC/TOC0 parameter at 0.2, 0.4, and 0.8 A under dark (Figure 8a) and illuminated (Figure 8b) conditions. The TOC/TOC0 parameter decreases over time for all conditions tested because of the increased number of oxidants generated when the operating intensity is higher. Final mineralization degrees in the absence of light reached values up to 60.0, 82.0, and 90.1% for operation intensity values of 0.2, 0.4, and 0.8 A, respectively. When light was applied, the contribution of photogenerated •OH in the reduction of TOC/TOC0 parameter was more significant at 0.2 A. Proof of that is the final mineralization degrees achieved in the photoelectrochemical oxidation experiments: 73.2, 77.6, and 90.4% for operation intensity values of 0.2, 0.4, and 0.8 A, respectively. Although the photoelectrochemical characterization revealed an increase in photocurrent with higher bias potentials (Figure 1a), this enhancement was not reflected in the mineralization of the pollutants. It is likely that the contribution of photochemically generated •OH radicals to mineralization at 0.4 and 0.8 A was masked by the predominant electrochemical production of •OH at higher operating intensities.
3.3.2. Energy Consumption
The specific energy consumption (Equation (4)) was determined for the treatment of the mixture containing the three pharmaceuticals in the absence and in the presence of light (Figure 9). The specific energy consumption value increases with operation intensity, both under dark and illuminated conditions due to the increased cell voltage. This increased power supply to the system also translates into increased •OH generation, and with that, an increased mineralization. The results show that the increased power supply is not outweighed by increased mineralization when the operation intensity is higher. As per the effect of light, at 0.2 A, the specific energy consumption value is lower in the presence of light, which is due to the contribution to mineralization of the photogenerated radicals. As explained in section 4.2.2, when the operation current is increased in the presence of light, no significant effect in terms of mineralization is observed, which results in slightly higher energy consumption values.
The results indicate that the photoelectrochemical treatment is more energy-efficient for the mixture at 0.2 A, due to the increased mineralization observed during the process (Figure 8). Additionally, it is crucial to find a correct balance between the power supplied to the system and the attained mineralization, to ultimately achieve a cost-effective photoelectrochemical process, where the use of light, preferably from sustainable sources such as solar energy, offsets the associated power consumption.
3.3.3. Comparison with a commercial BDD anode
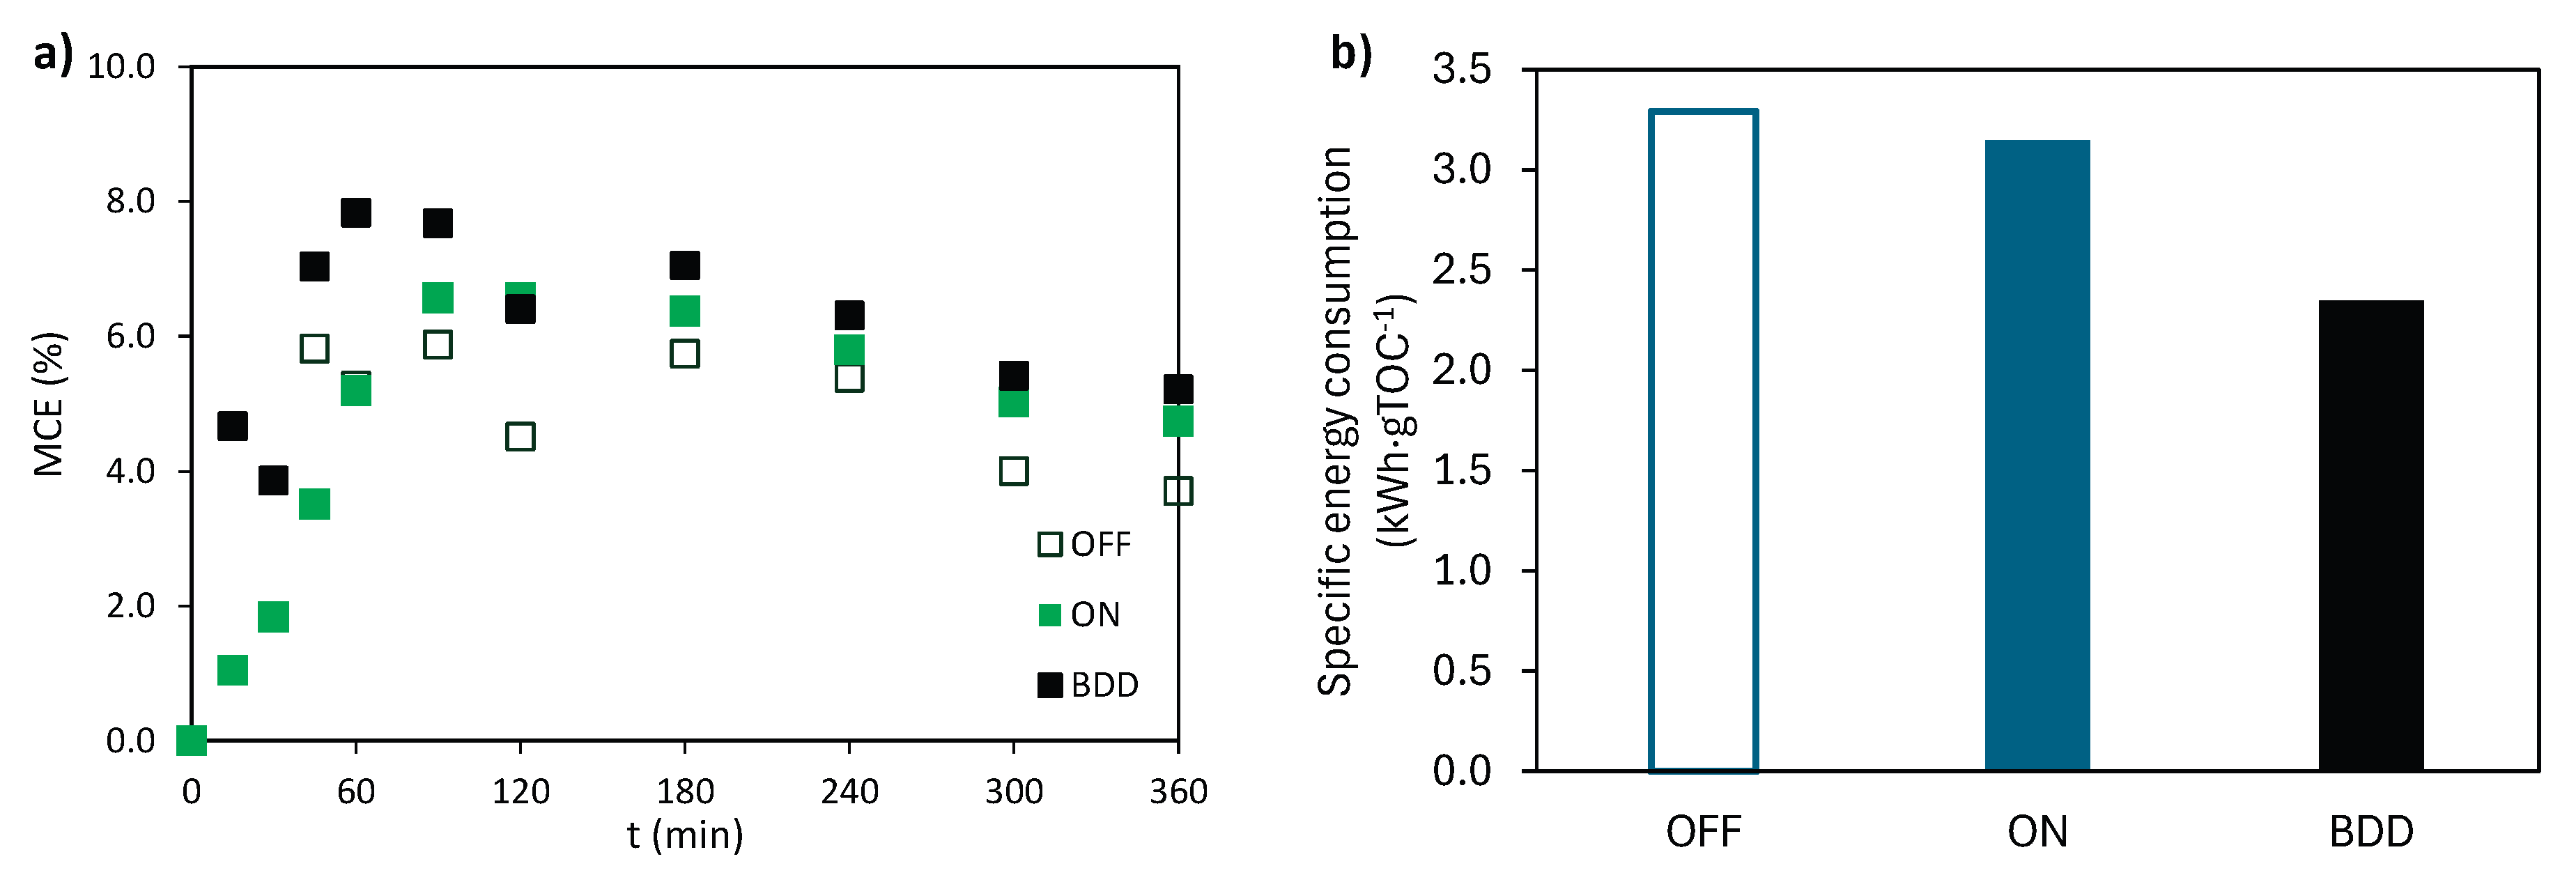
In this section, a comparison of the MCE parameter evolution and energy consumption is conducted between the Sb-doped SnO2 ceramic electrode coated with BiPO4 and a commercial BDD based on a previous study performed by the research group [24]. The evolution of the MCE parameter for the ceramic anode coated with BiPO4 (in dark and illuminated conditions) and the commercial BDD anode is depicted in ¡Error! No se encuentra el origen de la referencia Figure 10a. The MCE values tend to converge toward similar final values, with a sharp increase during the first 30 minutes of the experiment, followed by a decrease and subsequent stabilization. The final MCE values attained were similar as those reported in the literature for pharmaceutical treatment when using the BDD or other metal-based anodes [46,47]. Higher MCE values were achieved with the BDD anode compared to the ceramic anode, both under dark and illuminated conditions. However, the difference of the MCE parameter is smaller between the BDD anode and the ceramic anode when light is applied, a finding that shows that the material under study exhibits similar efficiency as the BDD anode. The findings support the viability of the ceramic anode as a cost-effective alternative to BDD for the electrochemical treatment of pharmaceutical contaminants.
The specific energy consumption value was obtained for the selected materials, and their values are represented in Figure 10b. The BDD anode exhibits lower energy consumption, which can be attributed to its superior ability to generate weakly adsorbed •OH [48]. Since the energy consumption value is directly dependent on the cell voltage, Figure S5 displays the cell voltage values achieved for 0.2, 0.4, and 0.8 A, for the ceramic material and the BDD anode. The average cell voltage for both materials increases with applied intensity. However, for the photoanode under study, this increment is more pronounced, indicating that it operates under more demanding conditions compared to the BDD anode. Higher cell potentials are the result of higher anode potentials, which directly impact the energy requirements of electrochemical oxidation processes [49]. The enhanced oxidative capacity of the BDD anode leads to more efficient mineralization of pollutants and lower specific energy consumption values, as previously reported by other authors [50].
4. Conclusions
A ceramic material made of Sb-doped SnO2 and coated with a photoactive layer of BiPO4 was used in the electrochemical and photoelectrochemical depletion of ATL, IBU, and NOR, both individually and in a synthetic mixture. The performance of the material was evaluated for both types of treatment conditions, with the main findings summarized below:
- The photoelectrochemical characterization of the photoanode revealed an immediate photocurrent response upon illumination, which depended on both the applied bias potential and the light intensity, a behavior typical of semiconductor materials. Based on these results, the light intensity was selected and kept constant for the subsequent experiments.
- Degradation of individual pharmaceuticals showed significant improvement under illumination. Likewise, the mineralization of the solution was also enhanced with light exposure, though always lower than degradation for all pharmaceuticals under study, a fact that emphasizes the complexity of their degradation pathway. Photolysis tests confirmed that ATL, IBU and NOR are stable under light irradiation.
- In the pharmaceutical mixture, HPLC-MS analysis revealed that light exposure also improved removal efficiency. The amount of electrogenerated •OH increased with operation intensity, and with that, greater mineralization of the solution was observed. It was concluded that the effect of the photochemical generation of •OH on mineralization may be masked by its improved electrochemical production when operation intensity is increased.
- Overall, the BDD anode exhibits lower energy consumption. The ceramic material, when acting as photoanode, exhibits a significant reduction in energy consumption, reaching values comparable to those of the commercial BDD anode.
In summary, the combined effect of current and light resulted in increased degradation and mineralization for both individual compounds and the mixture, confirming a synergistic interaction between electrochemical and activation with light. The photoanode under study showed effective degradation and mineralization of both individual pharmaceuticals and their mixture.
Supplementary Materials
The following supporting information can be downloaded at the website of this paper posted on Preprints.org, Figure S1: Schematic representation of the experimental setup that consisted of the following electrodes: (1) Sb doped–SnO2 anode coated with BiPO4 acting as a as a working electrode, (2) a stainless-steel sheet acting as a counter electrode, and (3) an Ag/AgCl (3M KCl) reference electrode. The light source (4) was equipped with a double light beam to increase the illuminated area of the anode. The experiments were performed in galvanostatic mode, and the current was applied using a power supply (5). The current and the electrode potential were measured using an amperometer (6) and a voltameter (7), respectively. The experiments were performed in a prismatic quartz cell with 200 mL capacity (8). A magnetic stirrer set to 1000 rpm (9) was used to minimize mass transfer limitations; Table S1: Main properties of the selected contaminants; Table S2: HPLC gradient conditions for the detection of ATL, IBU and NOR; Figure S2: Evolution of the relative concentration in the photolysis experiments for ATL, IBU and NOR. (C0 = 100 mg·L-1 and CNa2SO4 = 2 g·L-1); Figure S3: Concentration of ions formed during (a) ATL and (b) NOR degradation in electrochemical (OFF) and photoelectrochemical (ON) experiments. I = 0.2 A, C0 = 100 mg·L-1 and CNa2SO4 = 2 g·L-1; Figure S4: EIC chromatograms for time values of 0, 120, 240 and 360 min for ATL in the absence (a) and in the presence (b) of light. Figures (c) and (d) correspond to the same representations for IBU, and (e) and (f) for NOR. I=0.2 A, CATL = CIBU = CNOR = 20 mg·L-1 and CNa2SO4 = 2.8 g·L-1; Figure S5: Average cell voltage for the ceramic anode in the absence (OFF), in the presence (ON) of light, and for the BDD anode at operation intensity values of 0.2, 0.4 and 0.8 A. CATL = CIBU = CNOR = 20 mg·L-1 and CNa2SO4 = 2.8 g·L-1.
Author Contributions
Conceptualization, M. García-Gabaldón and M.C. Martí-Calatayud; methodology, M. García-Gabaldón. and M.C. Martí-Calatayud; validation, A. Balseviciute and M.C. Martí-Calatayud; formal analysis, M. García-Gabaldón and M.C. Martí-Calatayud; investigation, A. Balseviciute and S. Mestre, M. García-Gabaldón and M.C. Martí-Calatayud.; resources, S. Mestre and V. Pérez-Herranz.; data curation, A. Balseviciute; writing—original draft preparation, A. Balseviciute; writing—review and editing, M. García-Gabaldón, V. Pérez-Herranz and M.C. Martí-Calatayud; visualization, A. Balseviciute.; supervision, M. García-Gabaldón, V. Pérez-Herranz and M.C. Martí-Calatayud; project administration, M. García-Gabaldón and V. Pérez-Herranz; funding acquisition, M. García-Gabaldón and V. Pérez-Herranz. All authors have read and agreed to the published version of the manuscript.
Funding
The authors are greatly thankful to the Agencia Estatal de Investigación for the financial support through the grant (PID2023-147511OB-C21), funded by MICIU/AEI/10.13039/501100011033 and by ERDF/EU.
Data Availability Statement
The data presented in this study is available on request from the corresponding author.
Conflicts of Interest
The authors declare no conflicts of interest. The funders had no role in the design of the study; in the collection, analyses, or interpretation of data; in the writing of the manuscript; or in the decision to publish the results.
Abbreviations
The following abbreviations are used in this manuscript:
| AOPs | Advanced Oxidation Processes |
| ATL | Atenolol |
| BDD | Boron-doped diamond |
| C | Concentration |
| EIC | Extracted Ion Chromatograms |
| ETOC | Specific energy consumption |
| HPLC-MS | High-Performance Liquid Chromatography coupled with mass spectrometry |
| IBU | Ibuprofen |
| MCE | Mineralization current efficiency |
| NOR | Norfloxacin |
| TOC | Total Organic Carbon |
References
- Nguyen, M.K.; Lin, C.; Bui, X.T.; Rakib, M.R.J.; Nguyen, H.L.; Truong, Q.M.; Hoang, H.G.; Tran, H.T.; Malafaia, G.; Idris, A.M. Occurrence and fate of pharmaceutical pollutants in wastewater: Insights on ecotoxicity, health risk, and state–of–the-art removal. Chemosphere 2024, 354. [Google Scholar] [CrossRef]
- Rohan Khizer, M.; Saddique, Z.; Imran, M.; Javaid, A.; Latif, S.; Mantzavinos, D.; Momotko, M.; Boczkaj, G. Polymer and graphitic carbon nitride based nanohybrids for the photocatalytic degradation of pharmaceuticals in wastewater treatment – A review. Sep. Purif. Technol. 2024, 350. [Google Scholar] [CrossRef]
- Javid, N.; Honarmandrad, Z.; Malakootian, M. Ciprofloxacin removal from aqueous solutions by ozonation with calcium peroxide. Desalination Water Treat. 2020, 174, 178–185. [Google Scholar] [CrossRef]
- Bijlsma, L.; Pitarch, E.; Fonseca, E.; Ibáñez, M.; Botero, A.M.; Claros, J.; Pastor, L.; Hernández, F. Investigation of pharmaceuticals in a conventional wastewater treatment plant: Removal efficiency, seasonal variation and impact of a nearby hospital. J. Environ. Chem. Eng. 2021, 9. [Google Scholar] [CrossRef]
- Gracia-Lor, E.; Sancho, J. V.; Serrano, R.; Hernández, F. Occurrence and removal of pharmaceuticals in wastewater treatment plants at the Spanish Mediterranean area of Valencia. Chemosphere 2012, 87, 453–462. [Google Scholar] [CrossRef] [PubMed]
- Official Journal of the European Union. DIRECTIVE (EU) 2024/3019 OF THE EUROPEAN PARLIAMENT AND OF THE COUNCIL OF 27 NOVEMBER 2024 CONCERNING URBAN WASTEWATER TREATMENT. 2024. Available online: http://data.europa.eu/eli/C/2023/250/oj.
- Babu, D.S.; Srivastava, V.; Nidheesh, P. V.; Kumar, M.S. Detoxification of water and wastewater by advanced oxidation processes. Sci. Total Environ. 2019, 696. [Google Scholar] [CrossRef]
- Reis, R.Y.N.; Goulart, L.A.; Mascaro, L.H.; Alves, S.A. A critical view of the contributions of photoelectrochemical technology to pharmaceutical degradation. J. Environ. Chem. Eng. 2022, 10. [Google Scholar] [CrossRef]
- Su, Y. Fan; Wang, G.B.; Kuo, D.T.F.; Chang, M. ling; Shih, Y. hsin. Photoelectrocatalytic degradation of the antibiotic sulfamethoxazole using TiO2/Ti photoanode. Appl. Catal. B 2016, 186, 184–192. [Google Scholar] [CrossRef]
- Cristino, V.; Longobucco, G.; Marchetti, N.; Caramori, S.; Bignozzi, C.A.; Martucci, A.; Molinari, A.; Boaretto, R.; Stevanin, C.; Argazzi, R.; Dal Colle, M.; Bertoncello, R.; Pasti, L. Photoelectrochemical degradation of pharmaceuticals at β25 modified WO3 interfaces. Catal. Today 2020, 340, 302–310. [Google Scholar] [CrossRef]
- Sivaranjani, T.; Rajakarthihan, S.; Karthigeyan, A.; Bharath, G. Sustainable photoelectrocatalytic oxidation of antibiotics using Ag–CoFe2O4@TiO2 heteronanostructures for eco-friendly wastewater remediation. Chemosphere 2024, 362. [Google Scholar] [CrossRef]
- Feitosa, M.H.A.; Santos, A.M.; Wong, A.; Moraes, C.A.F.; Grosseli, G.M.; Nascimento, O.R.; Fadini, P.S.; Moraes, F.C. Photoelectrocatalytic removal of antibiotic ciprofloxacin using a photoanode based on Z-scheme heterojunction. Chem. Eng. J. 2024, 493. [Google Scholar] [CrossRef]
- Masekela, D.; Hintsho-Mbita, N.C.; Ntsendwana, B.; Mabuba, N. Thin Films (FTO/BaTiO3/AgNPs) for Enhanced Piezo-Photocatalytic Degradation of Methylene Blue and Ciprofloxacin in Wastewater. ACS Omega 2022, 7, 24329–24343. [Google Scholar] [CrossRef]
- Orimolade, B.O.; Arotiba, O.A. Towards visible light driven photoelectrocatalysis for water treatment: Application of a FTO/BiVO4/Ag2S heterojunction anode for the removal of emerging pharmaceutical pollutants. Sci. Rep. 2020, 10. [Google Scholar] [CrossRef] [PubMed]
- Carrillo-Abad, J.; Mora-Gómez, J.; García-Gabaldón, M.; Mestre, S.; Pérez-Herranz, V. Comparison between an electrochemical reactor with and without membrane for the nor oxidation using novel ceramic electrodes. J. Environ. Manage. 2020, 268. [Google Scholar] [CrossRef]
- Carrillo-Abad, J.; Mora-Gómez, J.; García-Gabaldón, M.; Montañés, M.T.; Mestre, S.; Pérez-Herranz, V. Enhanced Atenolol oxidation by ferrites photoanodes grown on ceramic SnO2-Sb2O3 anodes. J. Alloys Compd. 2022, 908. [Google Scholar] [CrossRef]
- Saadeddin; Hilal, H.S.; Pecquenard, B.; Marcus, J.; Mansouri, A.; Labrugere, C.; Subramanian, M.A.; Campet, G. Simultaneous doping of Zn and Sb in SnO2 ceramics: Enhancement of electrical conductivity. Solid State Sci. 2006, 8, 7–13. [Google Scholar] [CrossRef]
- Mora-Gomez, J.; Ortega, E.; Mestre, S.; Pérez-Herranz, V.; García-Gabaldón, M. Electrochemical degradation of norfloxacin using BDD and new Sb-doped SnO2 ceramic anodes in an electrochemical reactor in the presence and absence of a cation-exchange membrane. Sep. Purif. Technol. 2019, 208, 68–75. [Google Scholar] [CrossRef]
- Mora-Gómez, J.; García-Gabaldón, M.; Carrillo-Abad, J.; Montañés, M.T.; Mestre, S.; Pérez-Herranz, V. Influence of the reactor configuration and the supporting electrolyte concentration on the electrochemical oxidation of Atenolol using BDD and SnO2 ceramic electrodes. Sep. Purif. Technol. 2020, 241. [Google Scholar] [CrossRef]
- Medina-Casas, M.P.; Pérez-Herranz, V.; Giner-Sanz, J.J.; Mestre, S.; García-Gabaldón, M. Statistical comparison of the photoelectrochemical degradation of an antibiotic pollutant using two Sb-doped SnO2 ceramic anodes coated with photoactive CdFe2O4 and ZnFe2O4 layers. Sep. Purif. Technol. 2025, 360. [Google Scholar] [CrossRef]
- Lichtfouse, E.; Schwarzbauer, J.; Robert, D. Environmental chemistry: green chemistry and pollutants in ecosystems; Springer, 2005. [Google Scholar]
- Balseviciute; Martí-Calatayud, M.C.; Pérez-Herranz, V.; Mestre, S.; García-Gabaldón, M. Novel Sb-doped SnO2 ceramic anode coated with a photoactive BiPO4 layer for the photoelectrochemical degradation of an emerging pollutant. Chemosphere 2023, 335. [Google Scholar] [CrossRef] [PubMed]
- Domingo-Torner; García-Gabaldón, M.; Martí-Calatayud, M.C.; Mestre, S.; Pérez-Herranz, V. Norfloxacin mineralization under light exposure using Sb–SnO2 ceramic anodes coated with BiFeO3 photocatalyst. Chemosphere 2023, 313. [Google Scholar] [CrossRef]
- Balseviciute; Patiño-Cantero, I.; Carrillo-Abad, J.; Giner-Sanz, J.J.; García-Gabaldón, M.; Pérez-Herranz, V.; Martí-Calatayud, M.C. Degradation of multicomponent pharmaceutical mixtures by electrochemical oxidation: Insights about the process evolution at varying applied currents and concentrations of organics and supporting electrolyte. Sep. Purif. Technol. 2025, 362. [Google Scholar] [CrossRef]
- Cain, C.N.; Schöneich, S.; Synovec, R.E. Development of an enhanced total ion current chromatogram algorithm to improve untargeted peak detection. Anal. Chem. 2020, 92, 11365–11373. [Google Scholar] [CrossRef] [PubMed]
- Bisquert, JJ.; Gonzales, C.; Guerrero, A. Transient On/Off Photocurrent Response of Halide Perovskite Photodetectors. J. Phys. Chem. C. 2023, 127, 21338–21350. [Google Scholar] [CrossRef]
- McNeill, C.R.; Hwang, I.; Greenham, N.C. Photocurrent transients in all-polymer solar cells: Trapping and detrapping effects. J. Appl. Phys. 2009, 106. [Google Scholar] [CrossRef]
- Amano, F.; Koga, S. Influence of light intensity on the steady-state kinetics in tungsten trioxide particulate photoanode studied by intensity-modulated photocurrent spectroscopy. J. Electroanal. Chem. 2020, 860. [Google Scholar] [CrossRef]
- da Silva, S.W.; Navarro, E.M.O.; Rodrigues, M.A.S.; Bernardes, A.M.; Pérez-Herranz, V. The role of the anode material and water matrix in the electrochemical oxidation of norfloxacin. Chemosphere 2018, 210, 615–623. [Google Scholar] [CrossRef]
- Bouddouch; Akhsassi, B.; Amaterz, E.; Bakiz, B.; Taoufyq, A.; Villain, S.; Guinneton, F.; El Aamrani, A.; Gavarri, J.R.; Benlhachemi, A. Photodegradation under UV Light Irradiation of Various Types and Systems of Organic Pollutants in the Presence of a Performant BiPO4 Photocatalyst. Catalysts 2022, 12. [Google Scholar] [CrossRef]
- Kovácsa, K.; Tóth, T.; Wojnárovits, L. Evaluation of advanced oxidation processes for β-blockers degradation: a review. Water Sci. Technol. 2022, 85, 685–705. [Google Scholar] [CrossRef] [PubMed]
- Yang, Z.; Su, R.; Luo, S.; Spinney, R.; Cai, M.; Xiao, R.; Wei, Z. Comparison of the reactivity of ibuprofen with sulfate and hydroxyl radicals: An experimental and theoretical study. Sci. Total Environ. 2017, 591, 751–760. [Google Scholar] [CrossRef]
- Albarran, G.; Mendoza, E.; Schuler, R.H. Concerted effects of substituents in the reaction of •OH radicals with aromatics: The hydroxybenzaldehydes. Radiat. Phys. Chem. 2016, 124, 46–51. [Google Scholar] [CrossRef]
- Ling, W.; Ben, W.; Xu, K.; Zhang, Y.; Yang, M.; Qiang, Z. Ozonation of norfloxacin and levofloxacin in water: Specific reaction rate constants and defluorination reaction. Chemosphere 2018, 195, 252–259. [Google Scholar] [CrossRef] [PubMed]
- da Silva, S.W.; Navarro, E.M.O.; Rodrigues, M.A.S.; Bernardes, A.M.; Pérez-Herranz, V. Using p-Si/BDD anode for the electrochemical oxidation of norfloxacin. J. Electroanal. Chem. 2019, 832, 112–120. [Google Scholar] [CrossRef]
- Isarain-Chávez, E.; Rodríguez, R.M.; Cabot, P.L.; Centellas, F.; Arias, C.; Garrido, J.A.; Brillas, E. Degradation of pharmaceutical beta-blockers by electrochemical advanced oxidation processes using a flow plant with a solar compound parabolic collector. Water Res. 2011, 45, 4119–4130. [Google Scholar] [CrossRef]
- Chandran, K.; Smets, B.F. Single-Step Nitrification Models Erroneously Describe Batch Ammonia Oxidation Profiles when Nitrite Oxidation Becomes Rate Limiting. Biotechnol. Bioeng. 2000, 4, 396–406. [Google Scholar] [CrossRef]
- Mora-Gómez, J.; García-Gabaldón, M.; Mestre, S.; Pérez-Herranz, V.; García-García, D.M.; Carrillo-Abad, J. Synthesis of SnO-Sb2O5 ceramic anodes coated with cadmium and calcium ferrites for the depletion of emerging contaminants. J. Water Process Eng. 2024, 67, 106136. [Google Scholar] [CrossRef]
- Sopaj, F.; Oturan, N.; Pinson, J.; Podvorica, F.; Oturan, M.A. Effect of the anode materials on the efficiency of the electro-Fenton process for the mineralization of the antibiotic sulfamethazine. Appl. Catal. B 2016, 199, 331–341. [Google Scholar] [CrossRef]
- Zhu, F.; Lv, Y.; Li, J.; Ding, J.; Xia, X.; Wei, L.; Jiang, J.; Zhang, G.; Zhao, Q. Enhanced visible light photocatalytic performance with metal-doped Bi2WO6 for typical fluoroquinolones degradation: Efficiencies, pathways and mechanisms. Chemosphere 2020, 252, 126577. [Google Scholar] [CrossRef] [PubMed]
- Gadhi, T.A.; Mahar, R.B.; Bonelli, B. Chapter 12 - Actual mineralization versus partial degradation of wastewater contaminants, in: Nanomaterials for the Detection and Removal of Wastewater Pollutants; Elsevier, 2020; pp. 331–350. [Google Scholar] [CrossRef]
- Lin, H.; Oturan, N.; Wu, J.; Oturan, M.A.; Zhang, H. The application of electro-Fenton process for the treatment of artificial sweeteners. In Handbook of Environmental Chemistry; Springer Verlag, 2018; pp. 379–398. [Google Scholar] [CrossRef]
- Ponkshe, P. Thakur, Solar light–driven photocatalytic degradation and mineralization of beta blockers propranolol and atenolol by carbon dot/TiO2 composite. Environ. Sci. Pollut. Res. 2022, 29, 15614–15630. [Google Scholar] [CrossRef]
- Olak-Kucharczyk, M.; Foszpańczyk, M.; Żyłła, R.; Ledakowicz, S. Photodegradation and ozonation of ibuprofen derivatives in the water environment: Kinetics approach and assessment of mineralization and biodegradability. Chemosphere 2022, 291, 132742. [Google Scholar] [CrossRef]
- Martí-Calatayud, M.C.; Dionís, E.; Mestre, S.; Pérez-Herranz, V. Antimony-doped tin dioxide ceramics used as standalone membrane electrodes in electrofiltration reactors enhance the oxidation of organic micropollutants. J. Clean Prod. 2022, 363. [Google Scholar] [CrossRef]
- Periyasamy, S.; Farissi, S.; Rayaroth, M.P.; Kannan, M.; Nambi, I.M.; Liu, D. Electrochemical oxidation of Florfenicol in aqueous solution with mixed metal oxide electrode: Operational factors, reaction by-products and toxicity evaluation. Chemosphere 2024, 362. [Google Scholar] [CrossRef] [PubMed]
- Ma, J.; Trellu, C.; Skolotneva, E.; Oturan, N.; Oturan, M.A.; Mareev, S. Investigating the reactivity of TiOx and BDD anodes for electro-oxidation of organic pollutants by experimental and modeling approaches. Electrochim. Acta 2023, 439. [Google Scholar] [CrossRef]
- Afonso; Sousa, C.Y.; Farinon, D.M.; Lopes, A.; Fernandes, A. Electrochemical Oxidation of Pollutants in Textile Wastewaters Using BDD and Ti-Based Anode Materials. Textiles 2024, 4, 521–529. [Google Scholar] [CrossRef]
- K. Scott, Process intensification: An electrochemical perspective. Renew. ad Sustain. Energy Rev. 2018, 81, 1406–1426. [CrossRef]
- Trench, A.B.; Oturan, N.; Demir, A.; Moura, J.P.C.; Trellu, C.; Santos, M.C.; Oturan, M.A. Degradation of methylparaben by anodic oxidation, electro-Fenton, and photoelectro-Fenton using carbon felt-BDD cell. Sep. Purif. Technol. 2025, 371. [Google Scholar] [CrossRef]
Figure 1.
Light-pulsed chronoamperometry performed at (a) bias potential values of 0.1, 0.5 and 1 V (light intensity=100%) and (b) light intensities of 50% and 100% (bias potential value=0.1 V)
Figure 1.
Light-pulsed chronoamperometry performed at (a) bias potential values of 0.1, 0.5 and 1 V (light intensity=100%) and (b) light intensities of 50% and 100% (bias potential value=0.1 V)
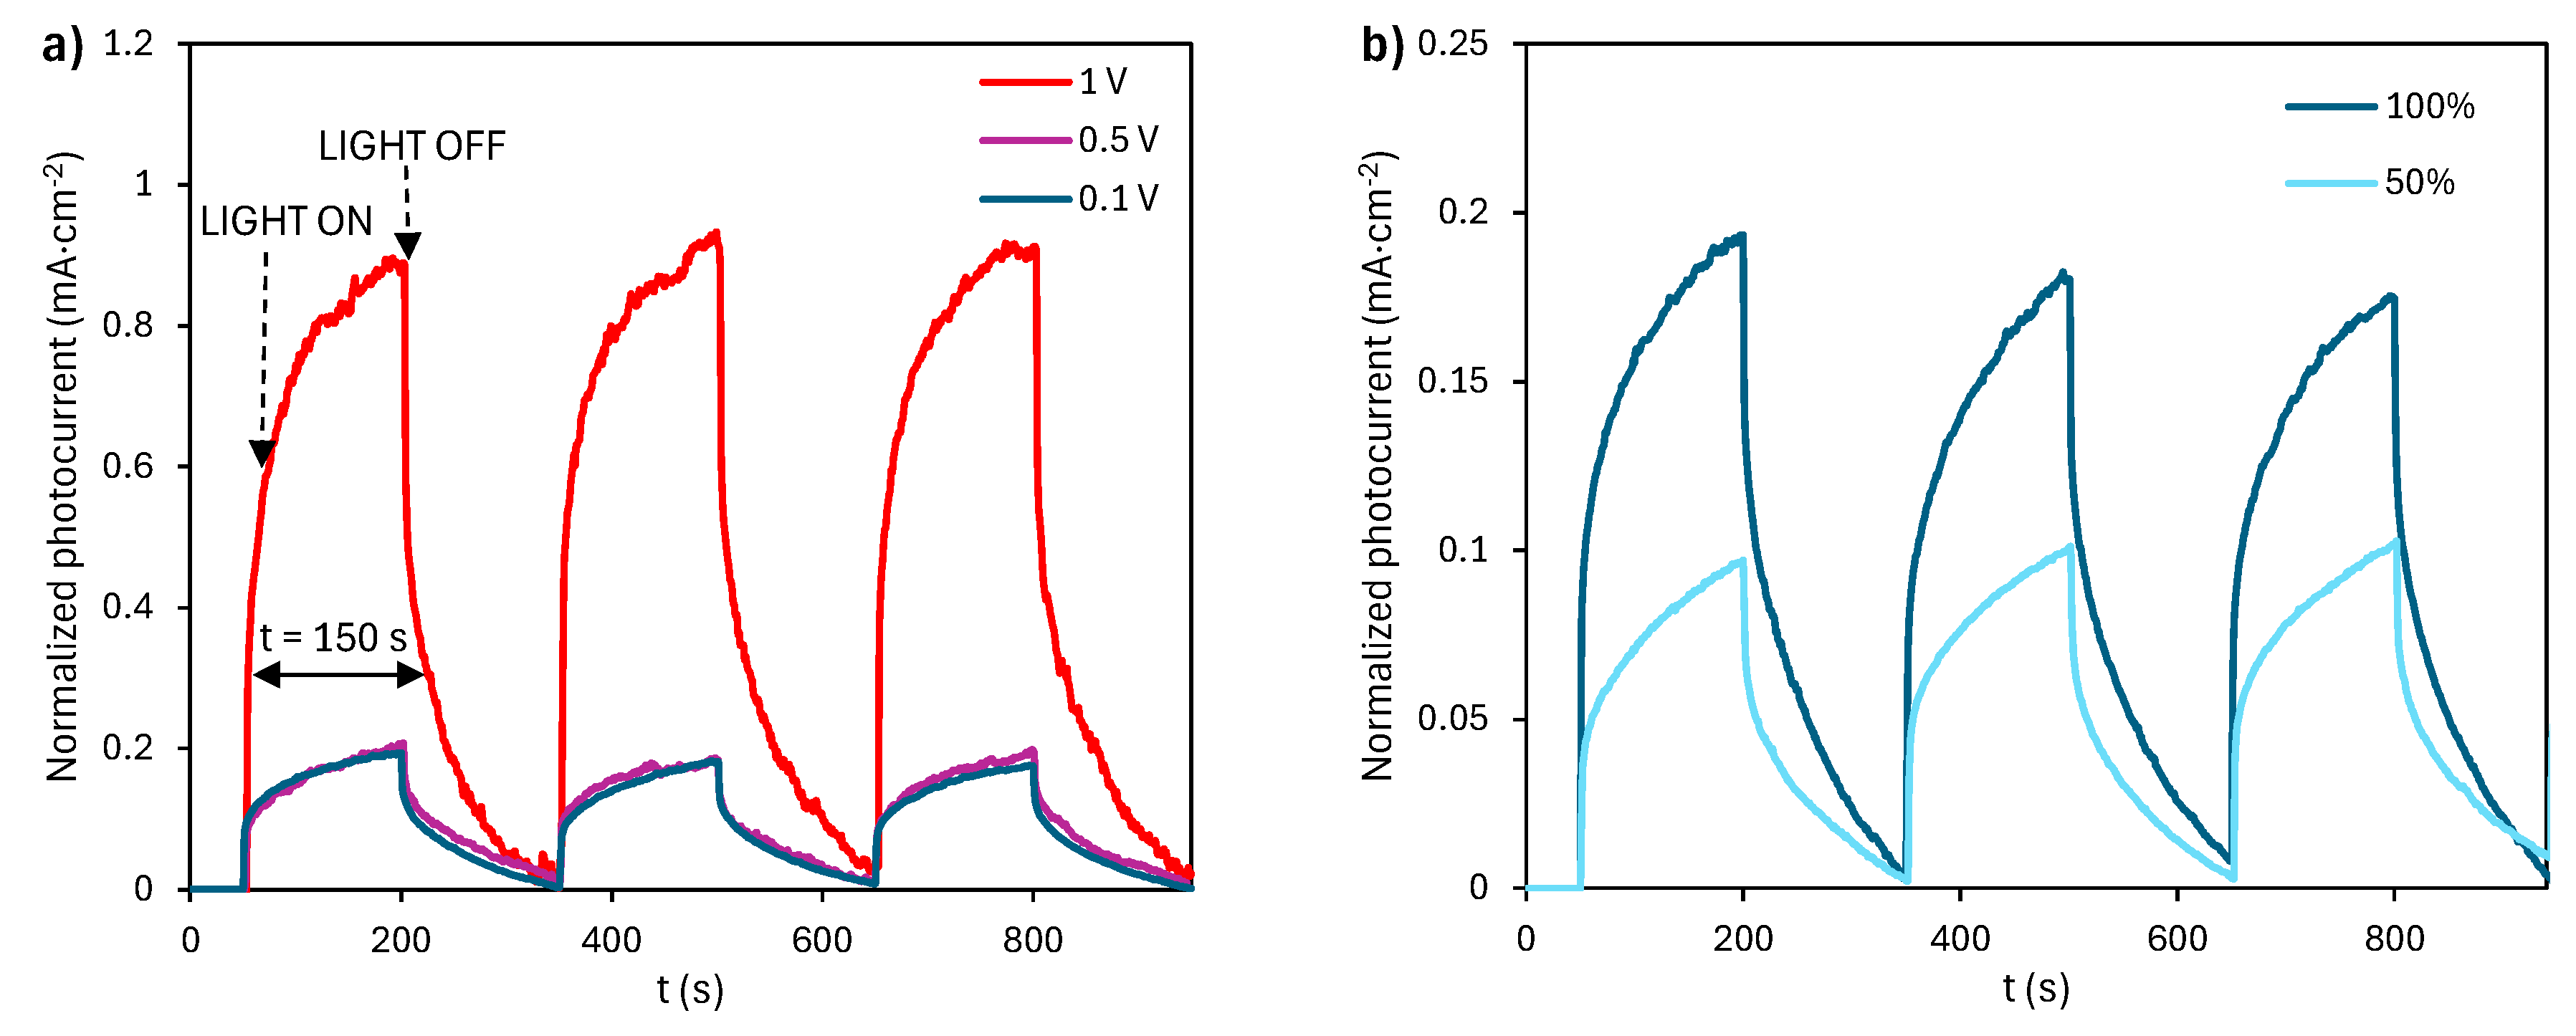
Figure 2.
Evolution of the relative concentration in the electro (OFF) and photoelectrochemical (ON) oxidation of (a) ATL, (b) IBU, and (c) NOR. (d) Evolution of the relative concentration in the electrochemical oxidation of ATL, IBU, and NOR. I = 0.2 A, C0 = 100 mg·L-1 and CNa2SO4 = 2 g·L-1.
Figure 2.
Evolution of the relative concentration in the electro (OFF) and photoelectrochemical (ON) oxidation of (a) ATL, (b) IBU, and (c) NOR. (d) Evolution of the relative concentration in the electrochemical oxidation of ATL, IBU, and NOR. I = 0.2 A, C0 = 100 mg·L-1 and CNa2SO4 = 2 g·L-1.
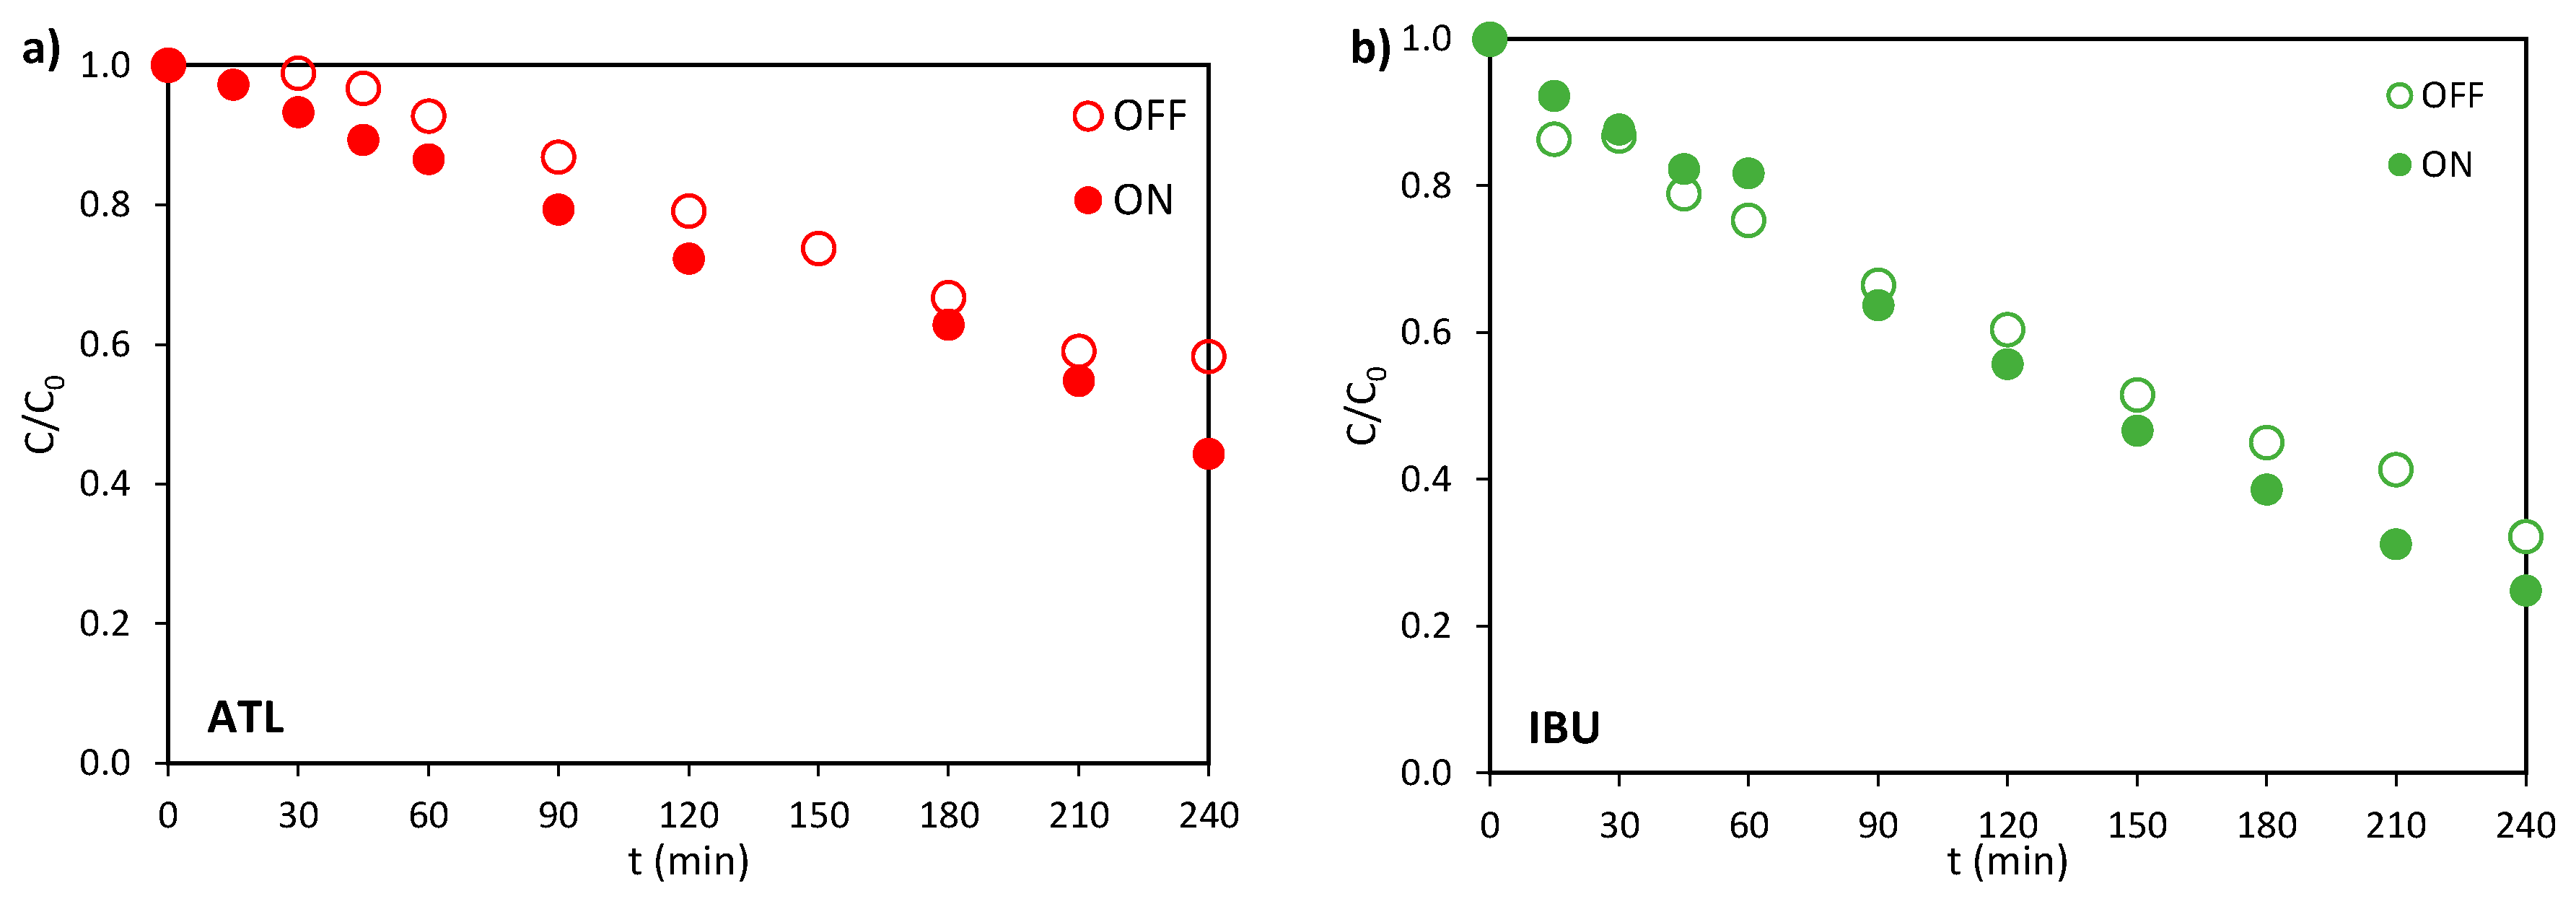
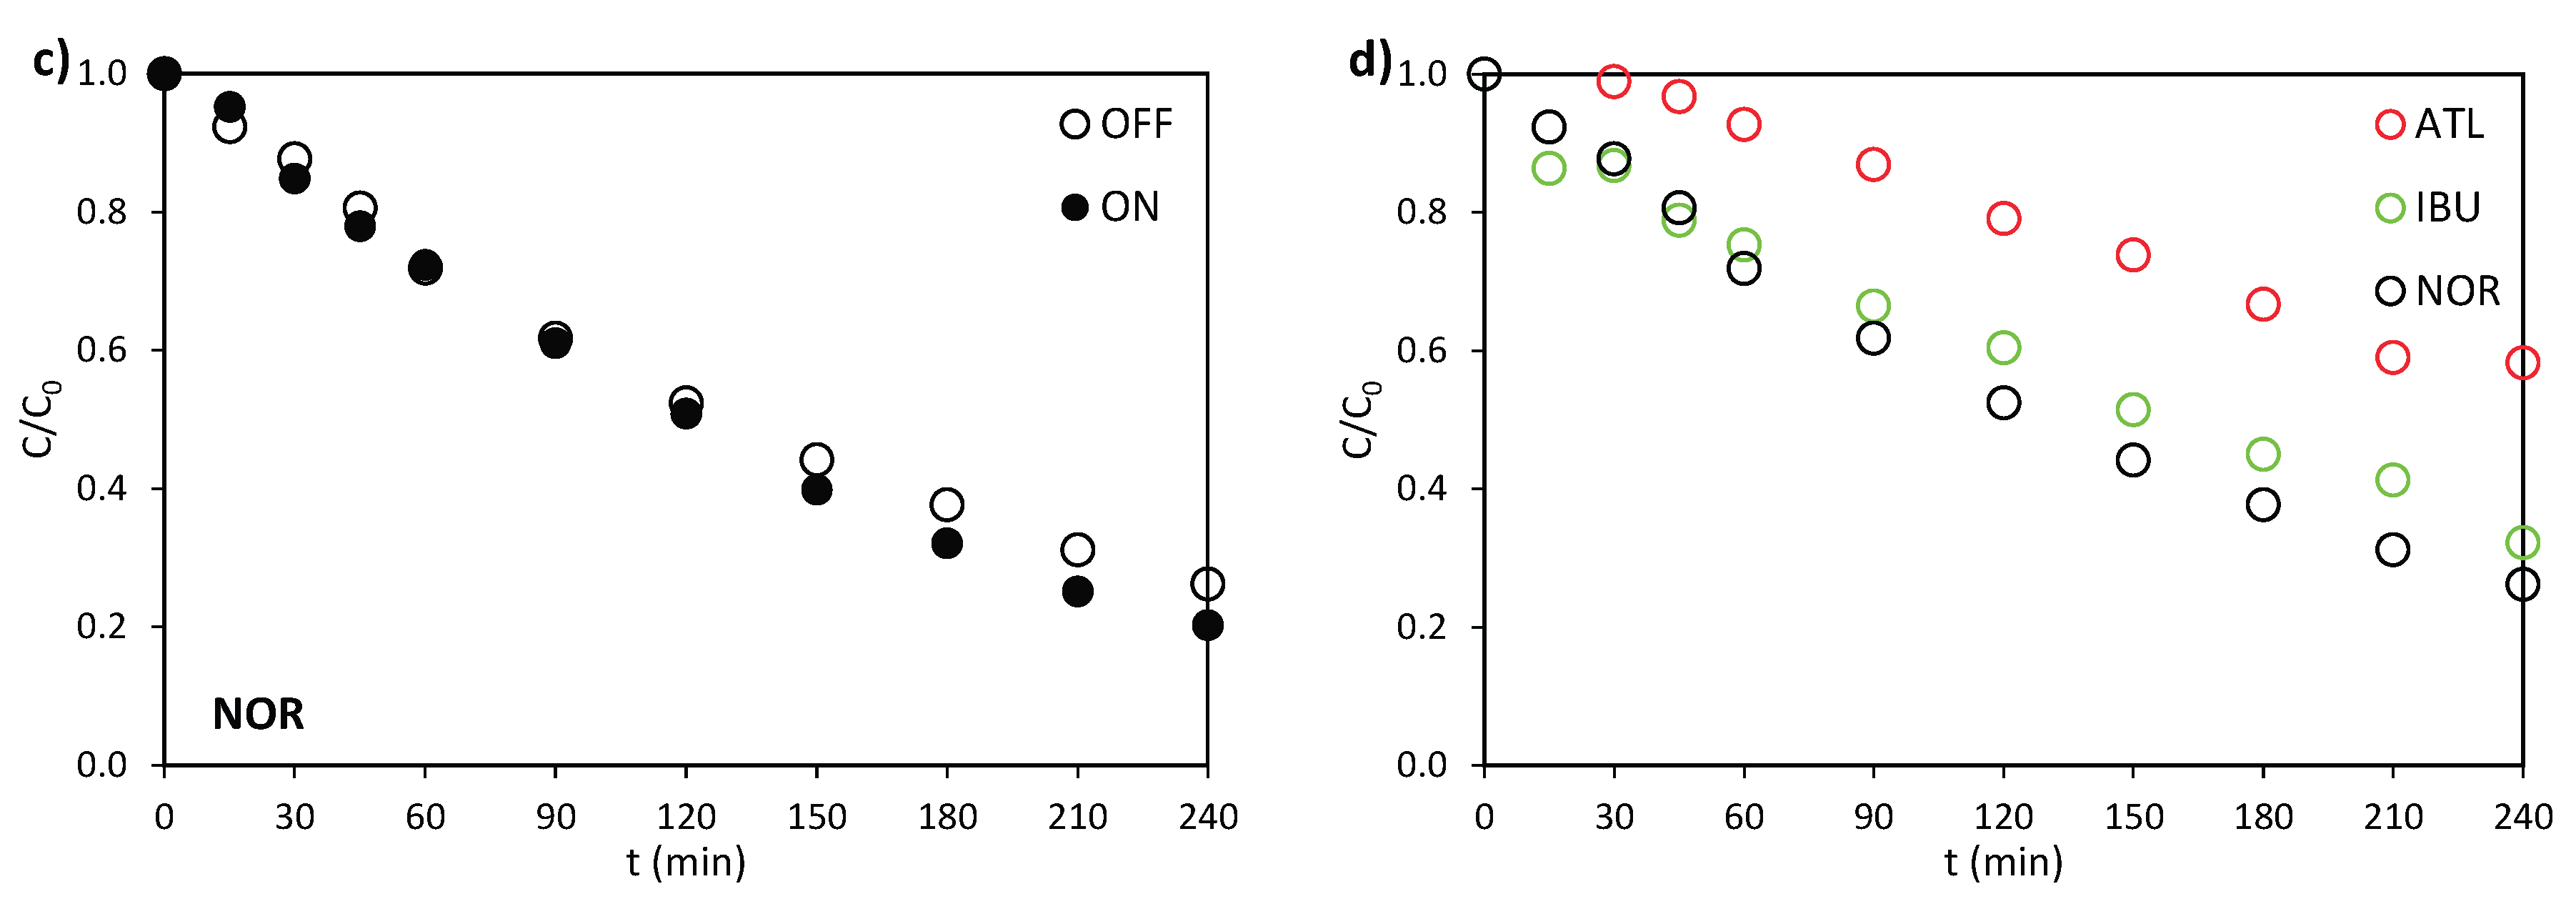
Figure 3.
Evolution of the relative TOC concentration in the electro (OFF) and photoelectrochemical (ON) oxidation of (a) ATL, (b) IBU, and (c) NOR. (d) Evolution of the relative TOC concentration in the electrochemical oxidation of ATL, IBU, and NOR. I = 0.2 A, C0 = 100 mg·L-1 and CNa2SO4 = 2 g·L-1.
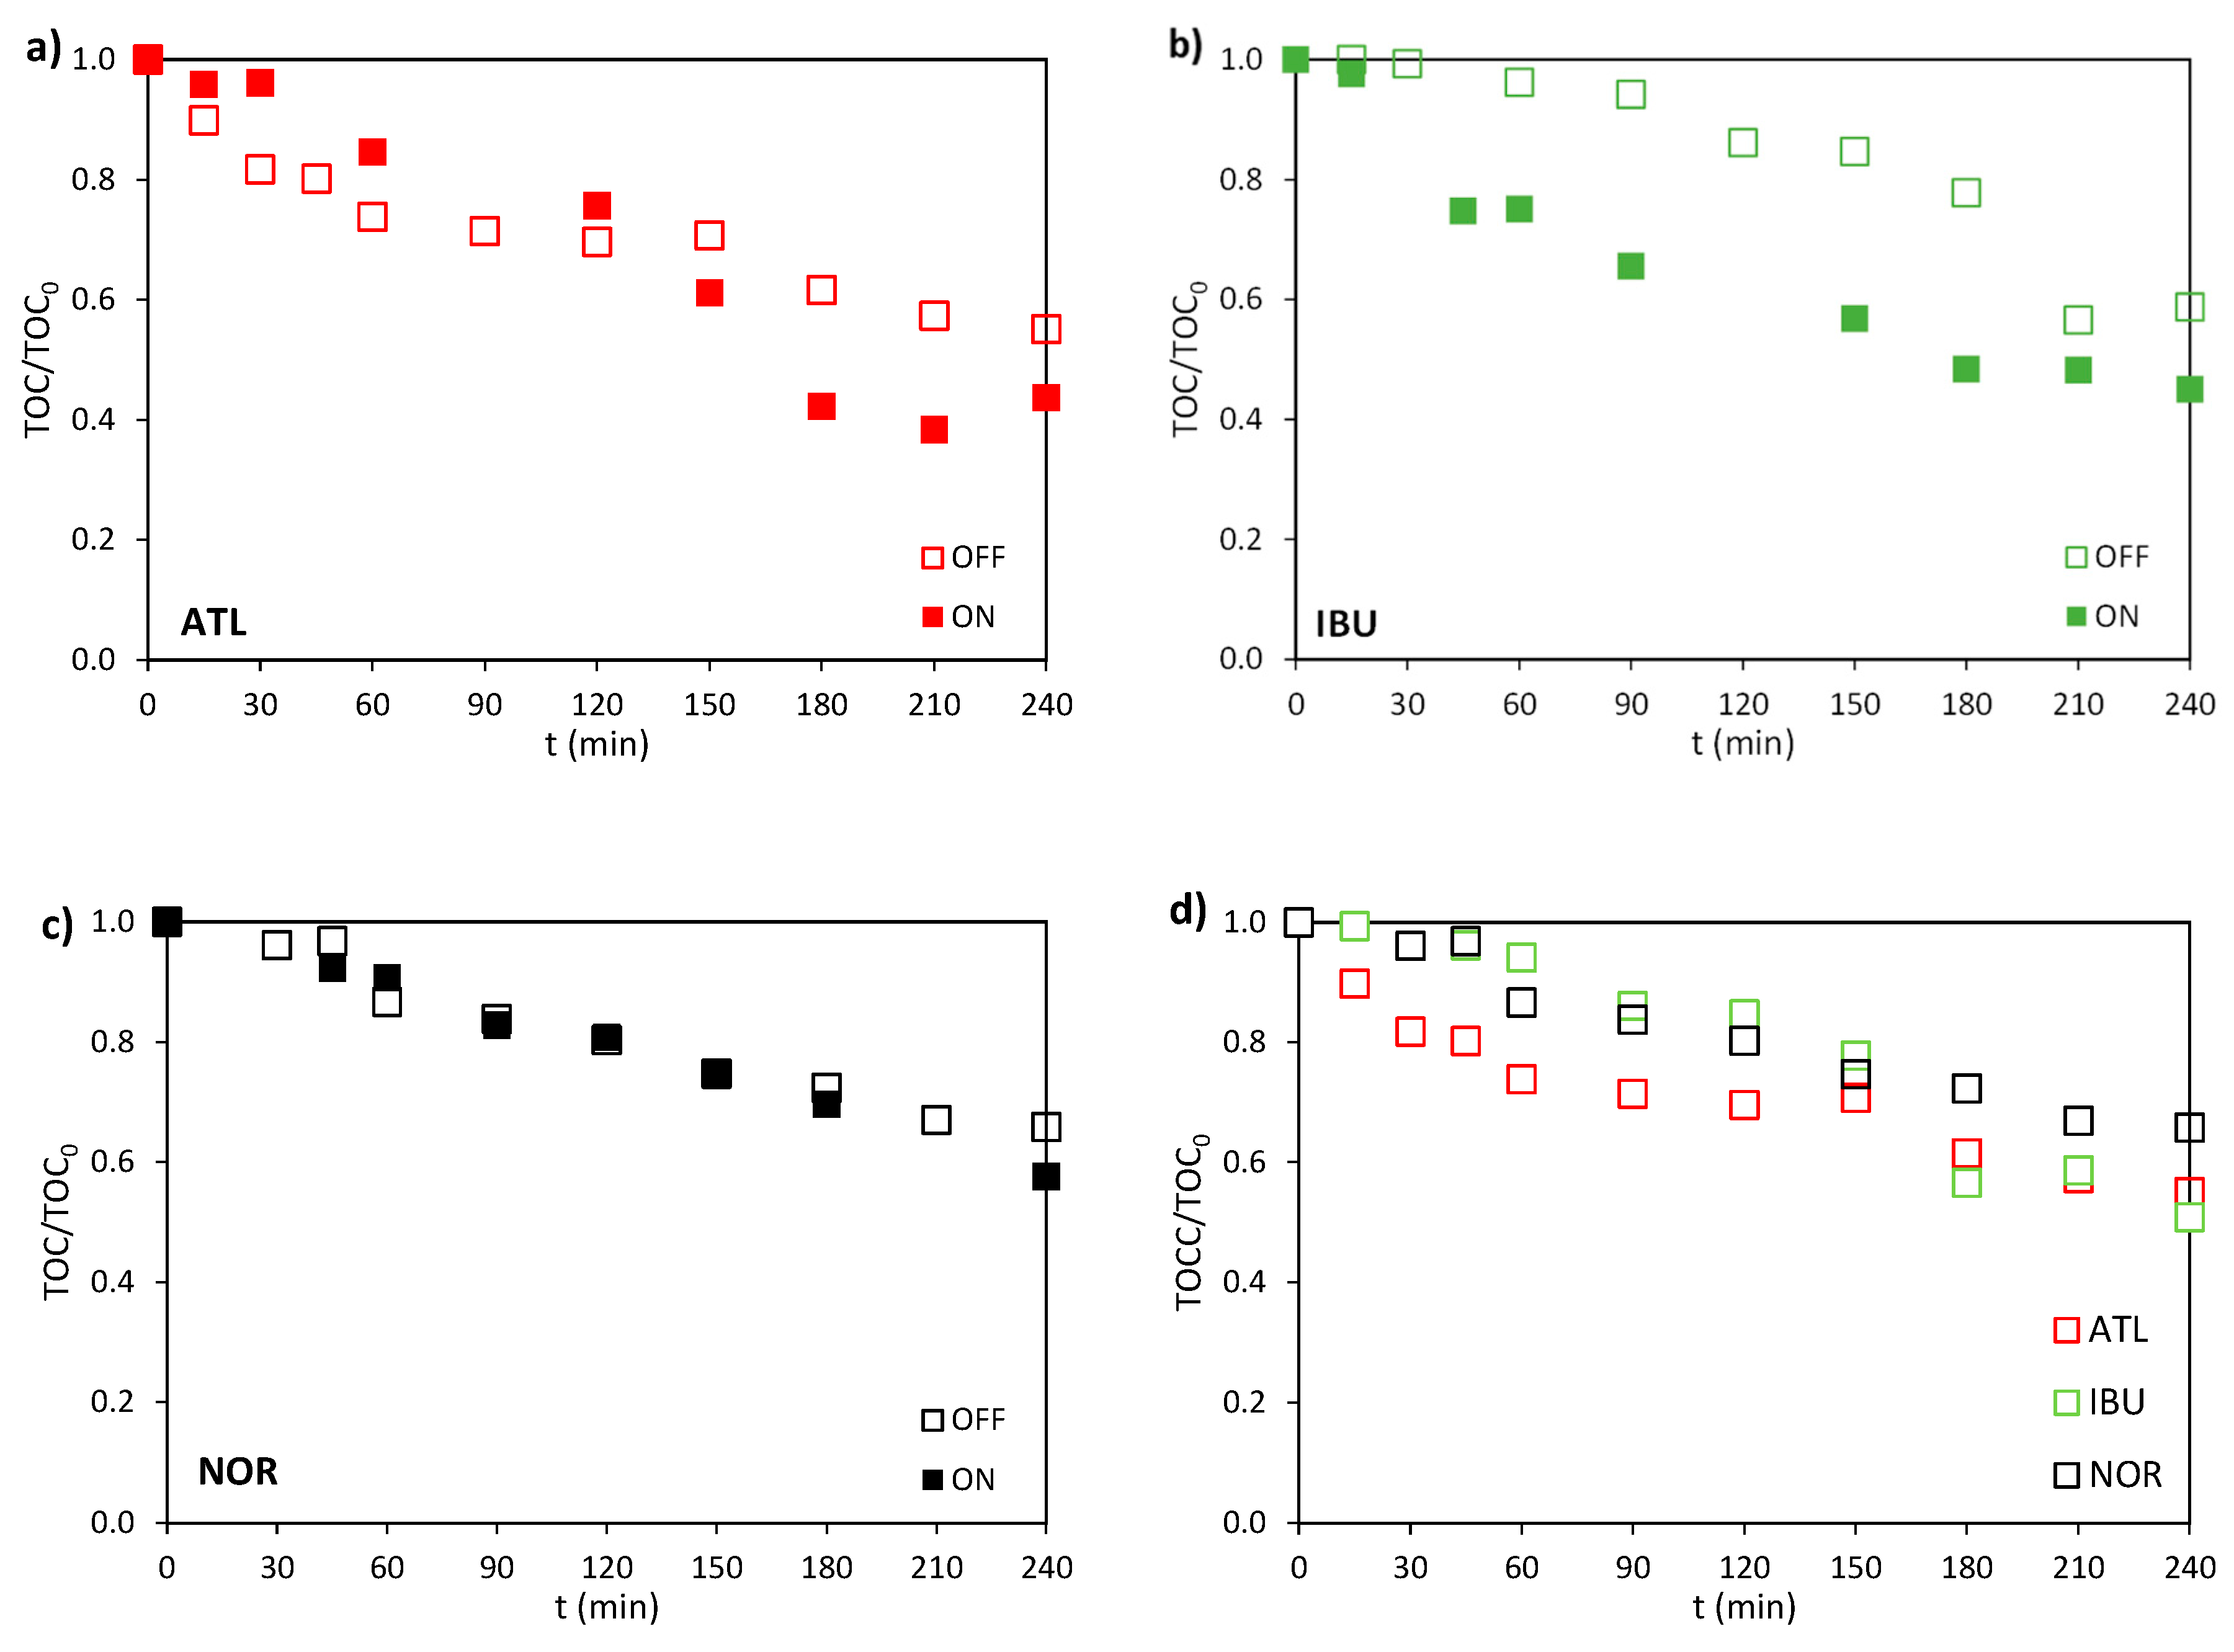
Figure 4.
Final (a) degradation and (b) mineralization degrees achieved in the electro (OFF) and photoelectrochemical (ON) experiments for ATL, IBU, and NOR. I = 0.2 A, C0 = 100 mg·L-1 and CNa2SO4 = 2 g·L-1.
Figure 4.
Final (a) degradation and (b) mineralization degrees achieved in the electro (OFF) and photoelectrochemical (ON) experiments for ATL, IBU, and NOR. I = 0.2 A, C0 = 100 mg·L-1 and CNa2SO4 = 2 g·L-1.
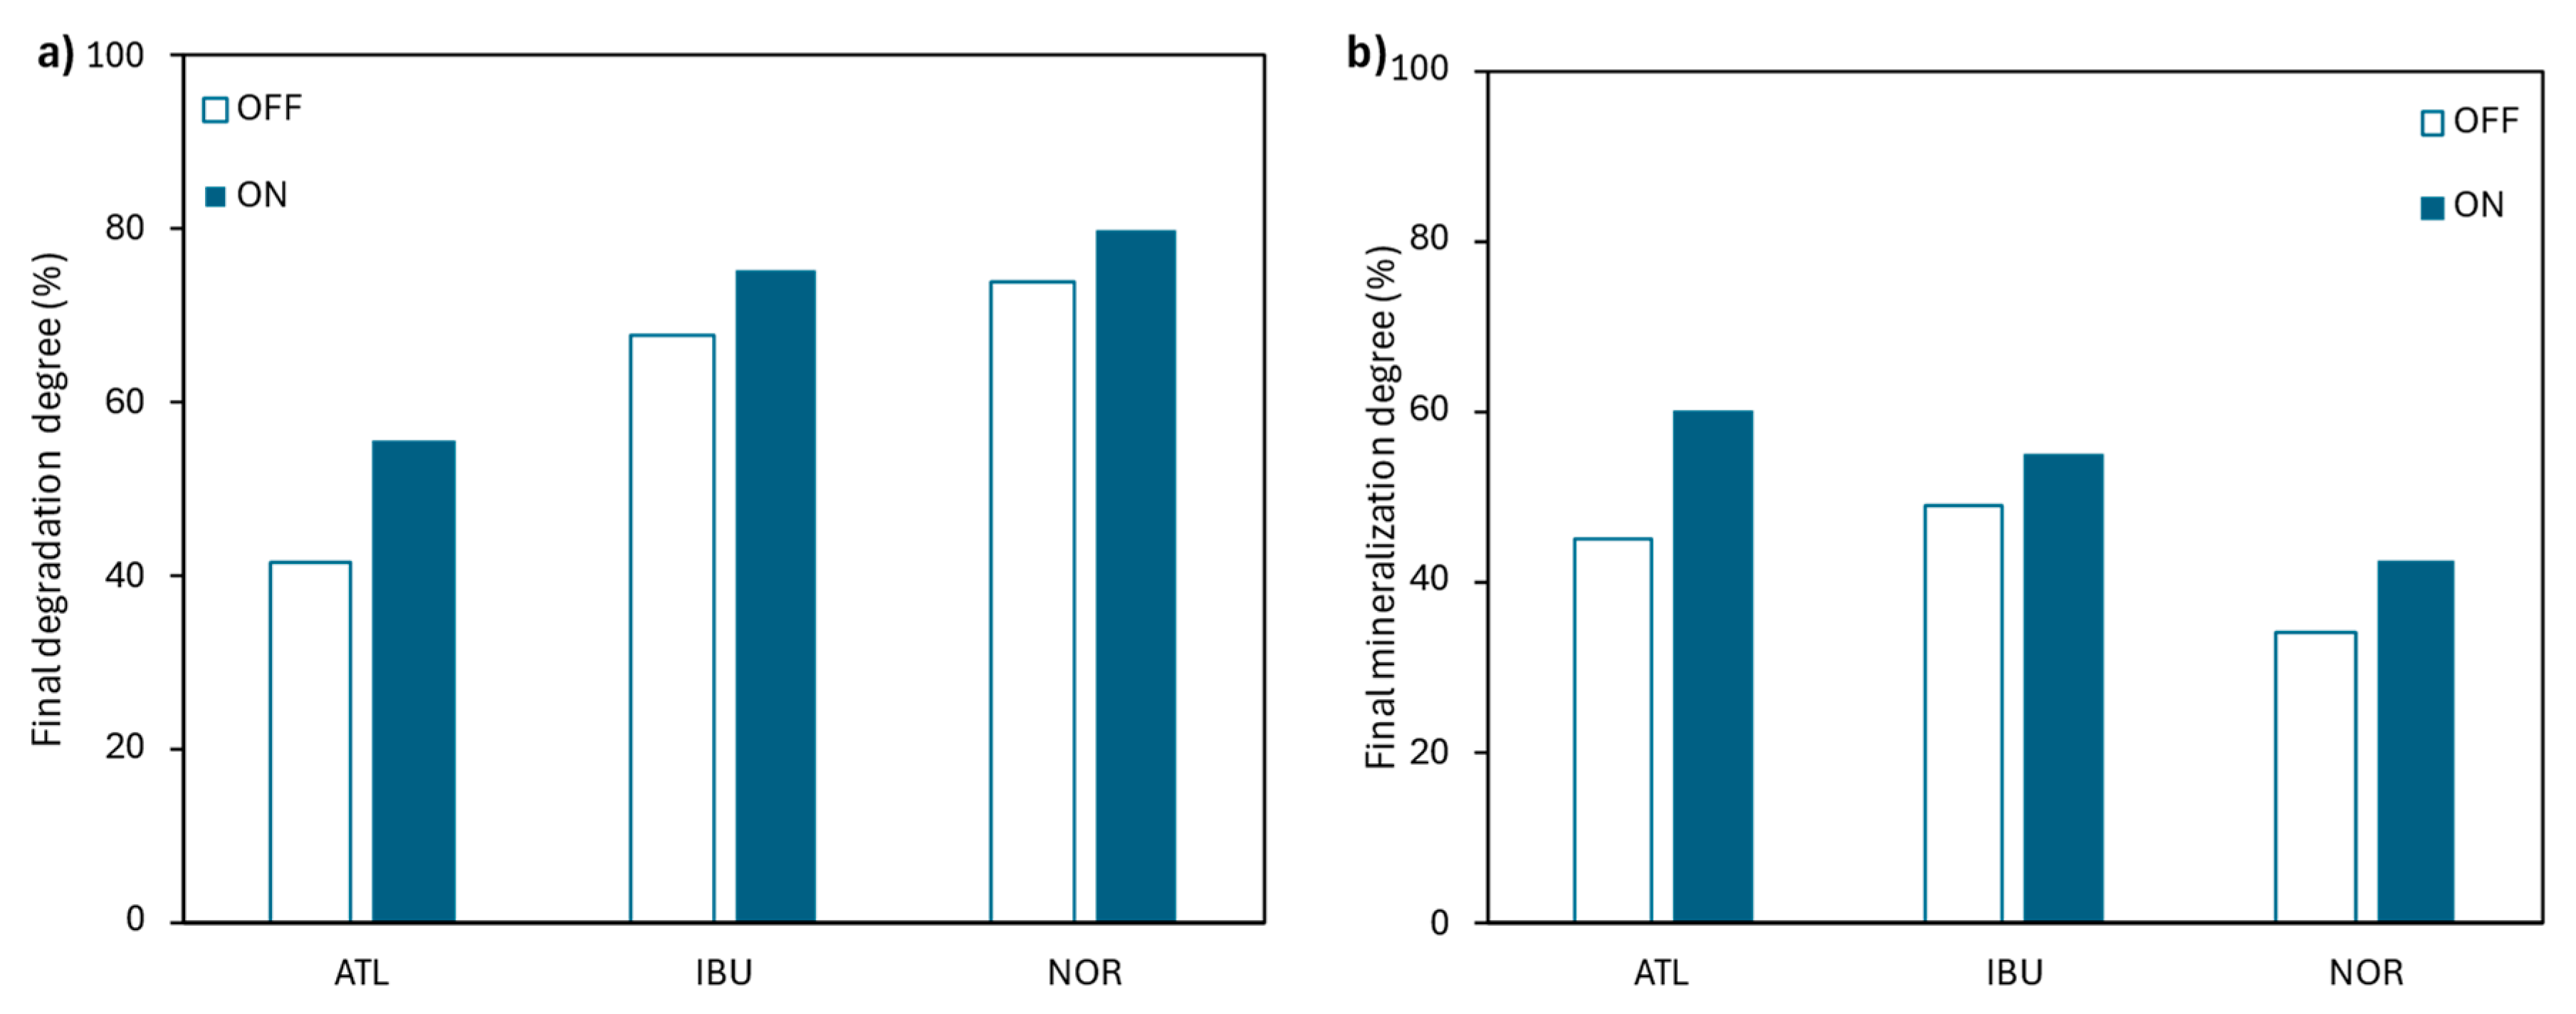
Figure 5.
EIC chromatograms for the pharmaceuticals (a) in positive (for ATL and NOR), and in (b) negative ionization mode (for IBU) of the initial solution containing CATL = CIBU = CNOR = 20 mg·L-1 and CNa2SO4 = 2.8 g·L-1. Molecular structures of the pharmaceuticals are included as an inset.
Figure 5.
EIC chromatograms for the pharmaceuticals (a) in positive (for ATL and NOR), and in (b) negative ionization mode (for IBU) of the initial solution containing CATL = CIBU = CNOR = 20 mg·L-1 and CNa2SO4 = 2.8 g·L-1. Molecular structures of the pharmaceuticals are included as an inset.
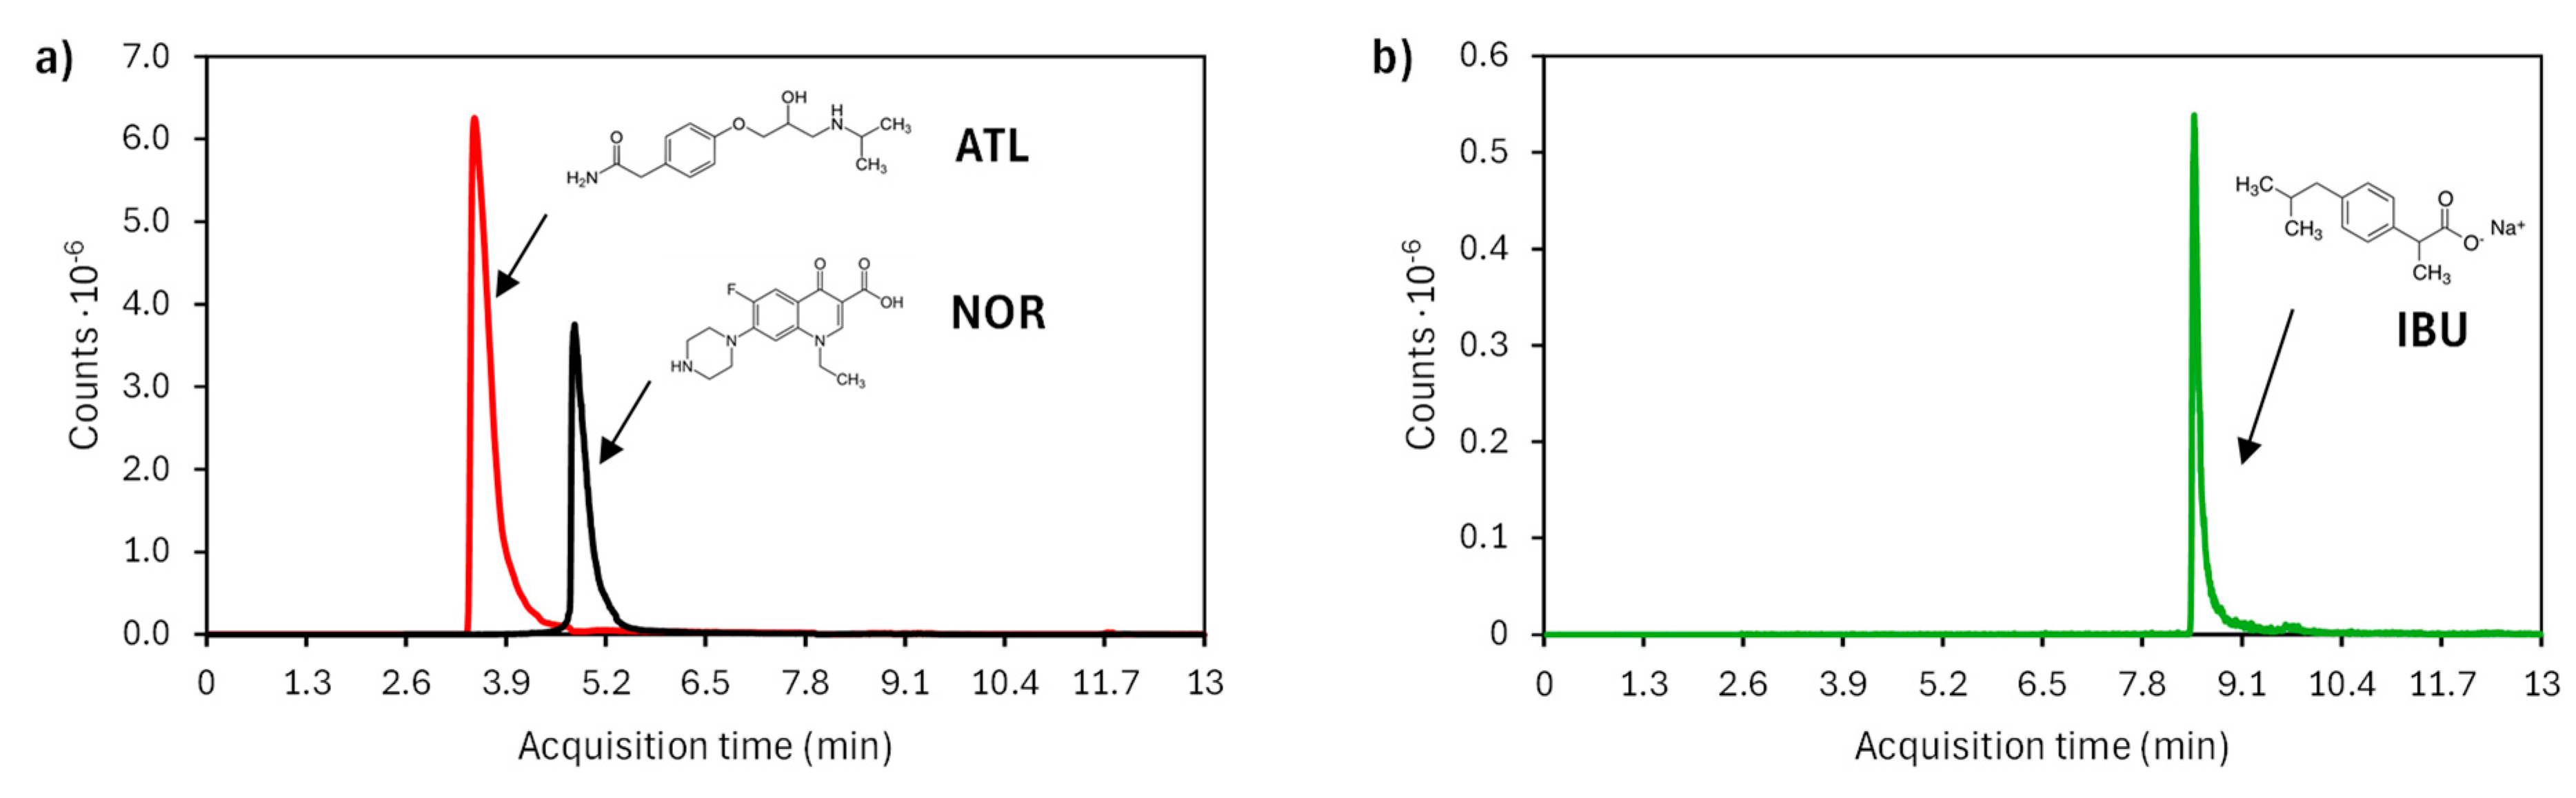
Figure 6.
Temporal evolution of relative concentration of ATL, IBU and NOR in the (a) electrochemical and (b) photoelectrochemical oxidation experiments when treating the synthetic mixture. I = 0.2 A, C0 = 100 mg·L-1, CATL = CIBU = CNOR = 20 mg·L-1 and CNa2SO4 = 2.8 g·L-1.
Figure 6.
Temporal evolution of relative concentration of ATL, IBU and NOR in the (a) electrochemical and (b) photoelectrochemical oxidation experiments when treating the synthetic mixture. I = 0.2 A, C0 = 100 mg·L-1, CATL = CIBU = CNOR = 20 mg·L-1 and CNa2SO4 = 2.8 g·L-1.
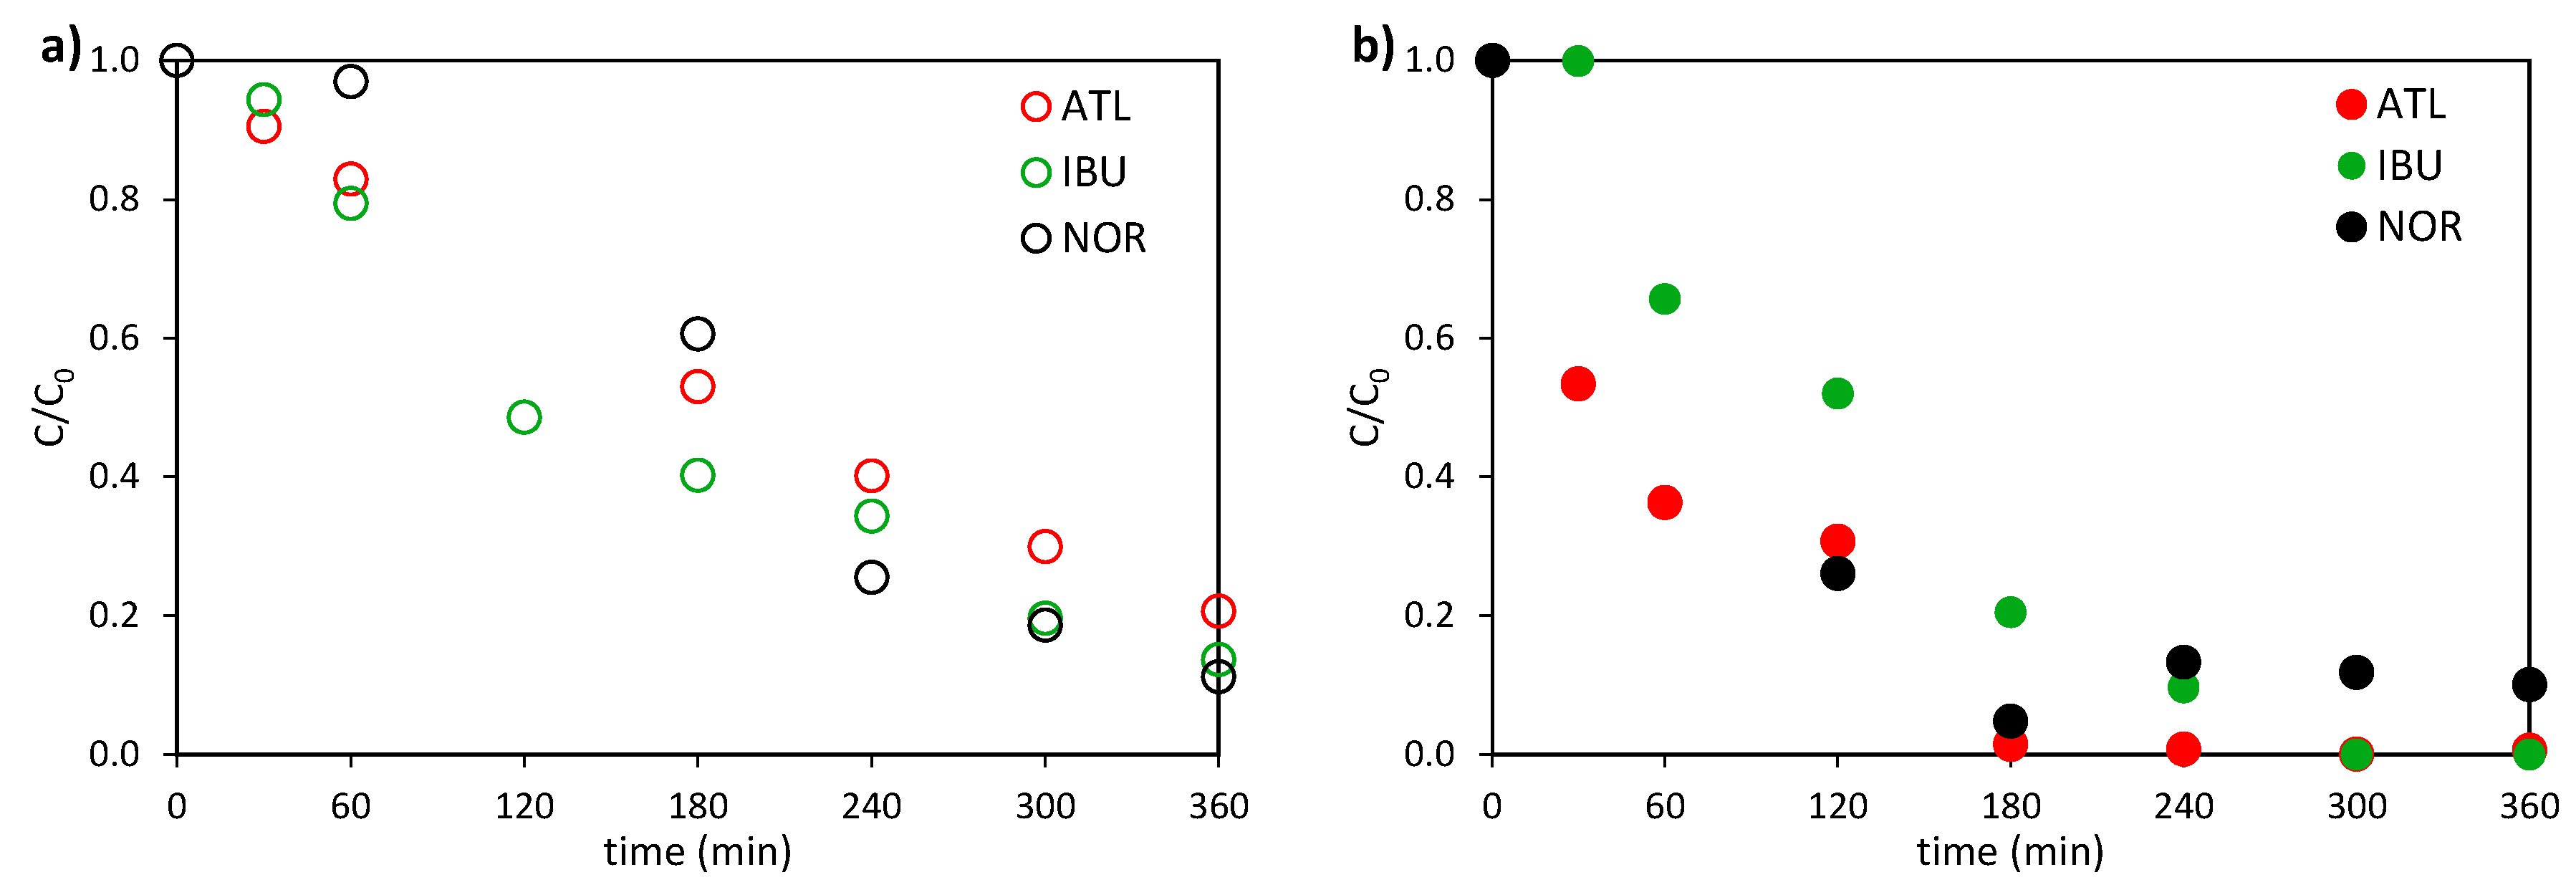
Figure 7.
Ion concentration evolution with time in the synthetic mixture treatment in the absence (OFF) and in the presence of light (ON): (a) fluoride, (b) formate, and (c) nitrate. I = 0.2 A, CATL = CIBU = CNOR = 20 mg·L-1 and CNa2SO4 = 2 g·L-1.
Figure 7.
Ion concentration evolution with time in the synthetic mixture treatment in the absence (OFF) and in the presence of light (ON): (a) fluoride, (b) formate, and (c) nitrate. I = 0.2 A, CATL = CIBU = CNOR = 20 mg·L-1 and CNa2SO4 = 2 g·L-1.
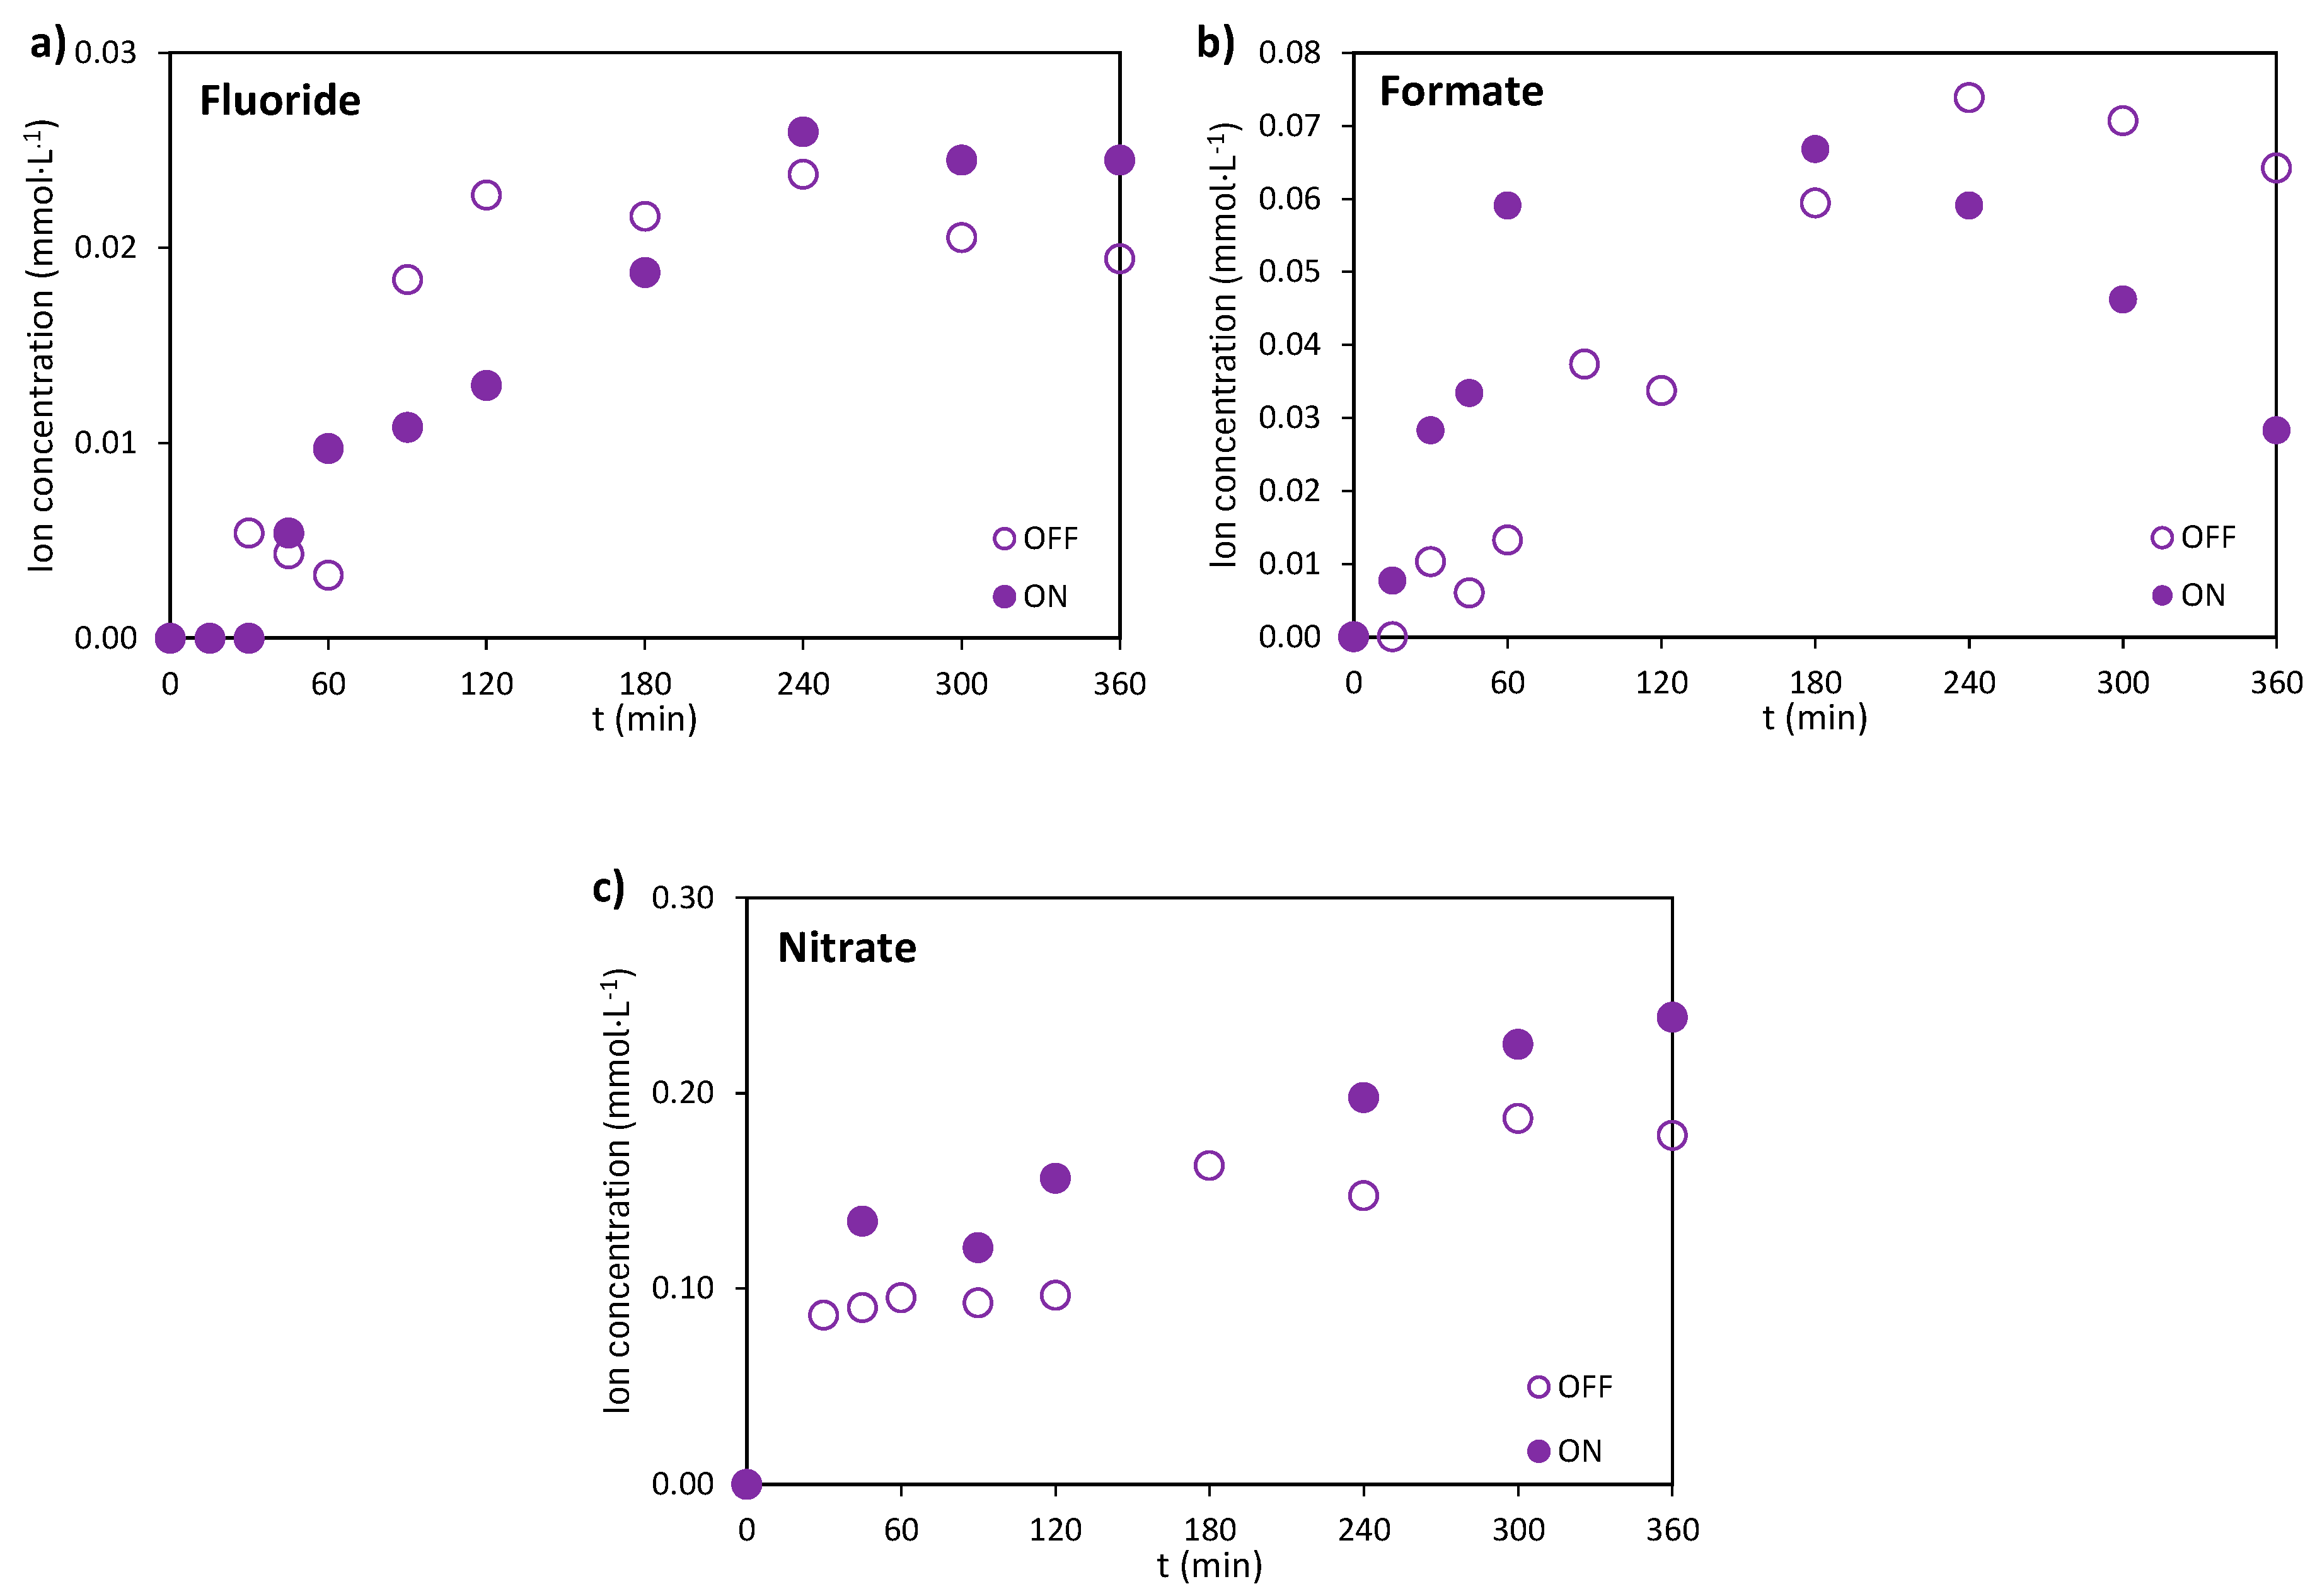
Figure 8.
Evolution of the relative mineralization at 0.2, 0.4, and 0.8 A in the (a) electro and (b) photoelectrochemical oxidation of the mixture. CATL = CIBU = CNOR = 20 mg·L-1 and CNa2SO4 = 2 g·L-1.
Figure 8.
Evolution of the relative mineralization at 0.2, 0.4, and 0.8 A in the (a) electro and (b) photoelectrochemical oxidation of the mixture. CATL = CIBU = CNOR = 20 mg·L-1 and CNa2SO4 = 2 g·L-1.
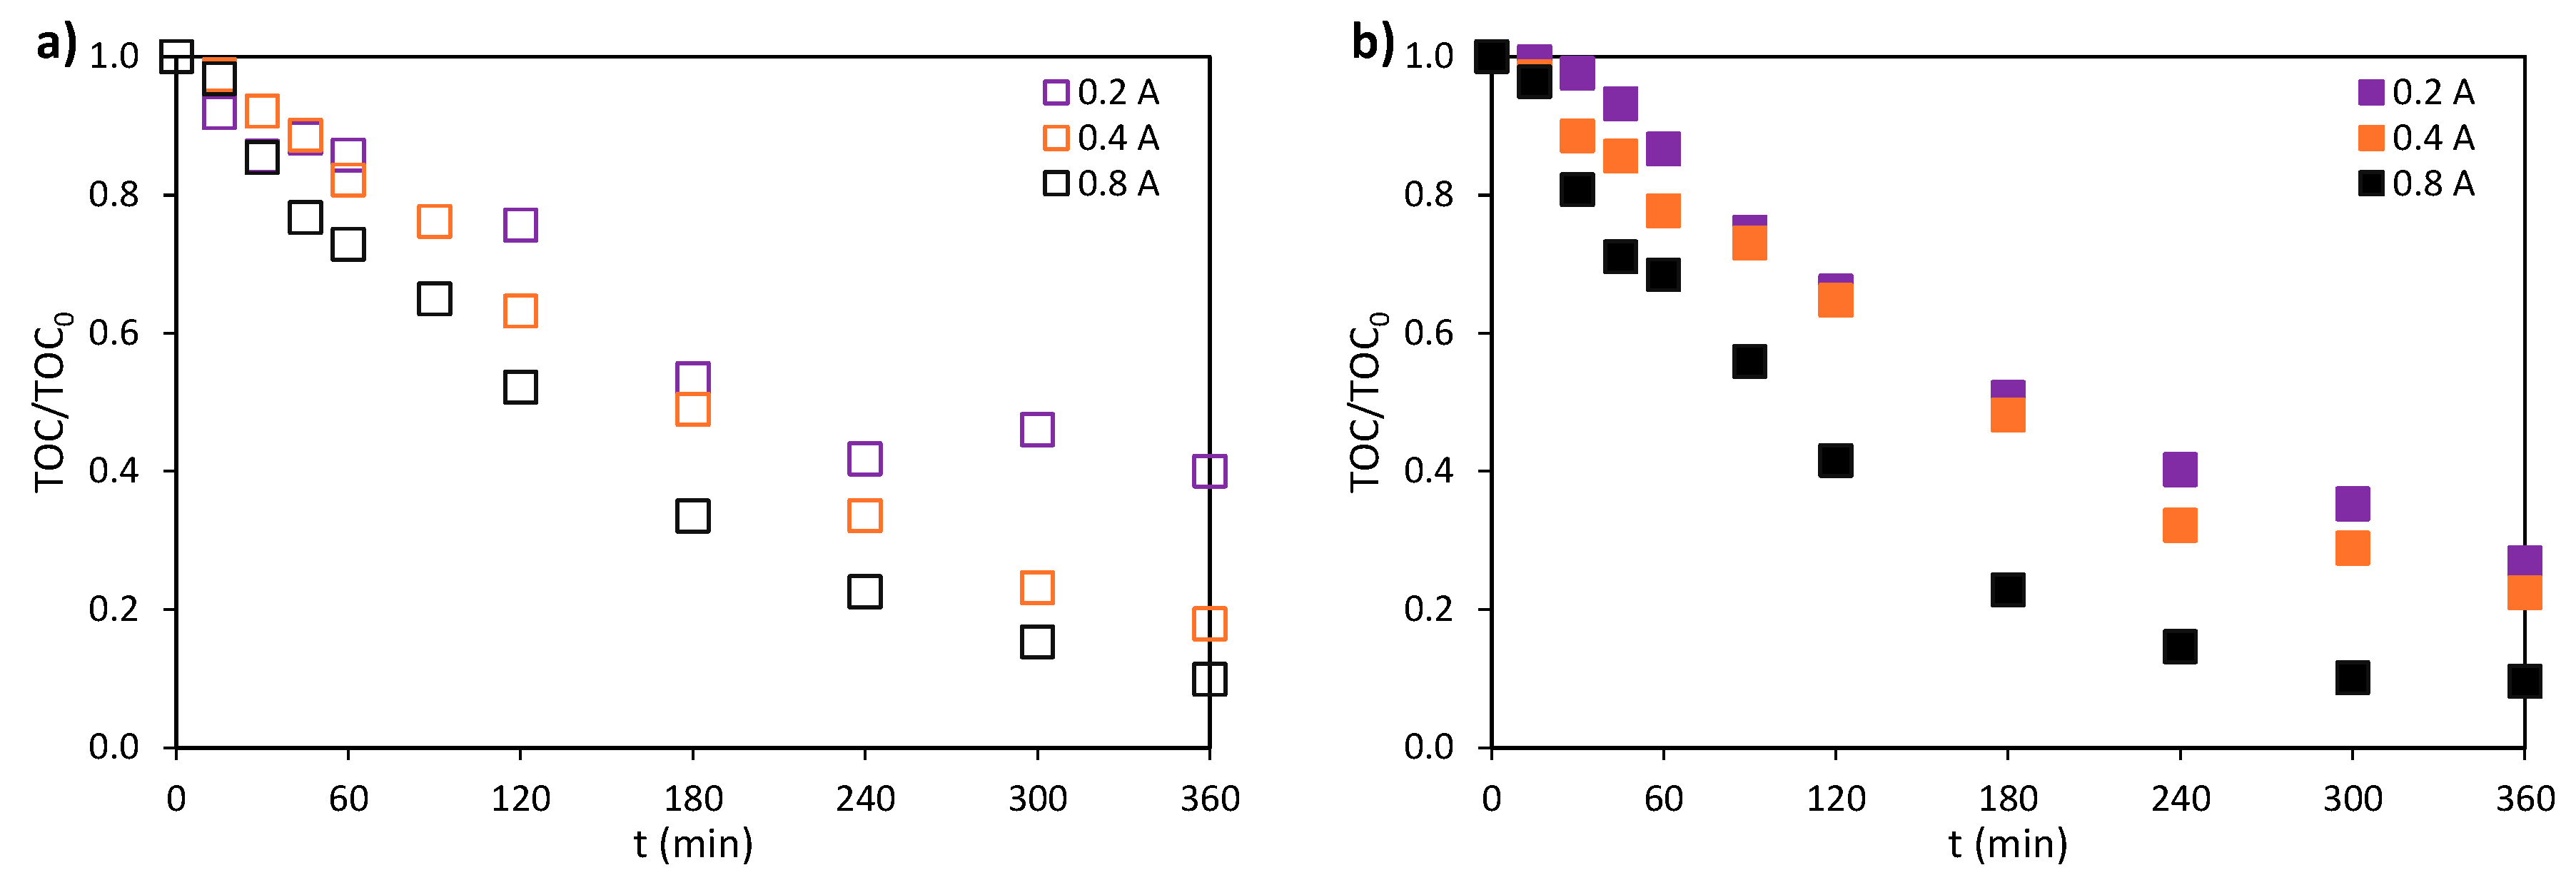
Figure 9.
Final specific energy consumption at 0.2, 0.4, and 0.8 A in the electro (OFF) and photoelectrochemical (ON) oxidation of the mixture. CATL = CIBU = CNOR = 20 mg·L-1 and CNa2SO4 = 2 g·L-1.
Figure 9.
Final specific energy consumption at 0.2, 0.4, and 0.8 A in the electro (OFF) and photoelectrochemical (ON) oxidation of the mixture. CATL = CIBU = CNOR = 20 mg·L-1 and CNa2SO4 = 2 g·L-1.
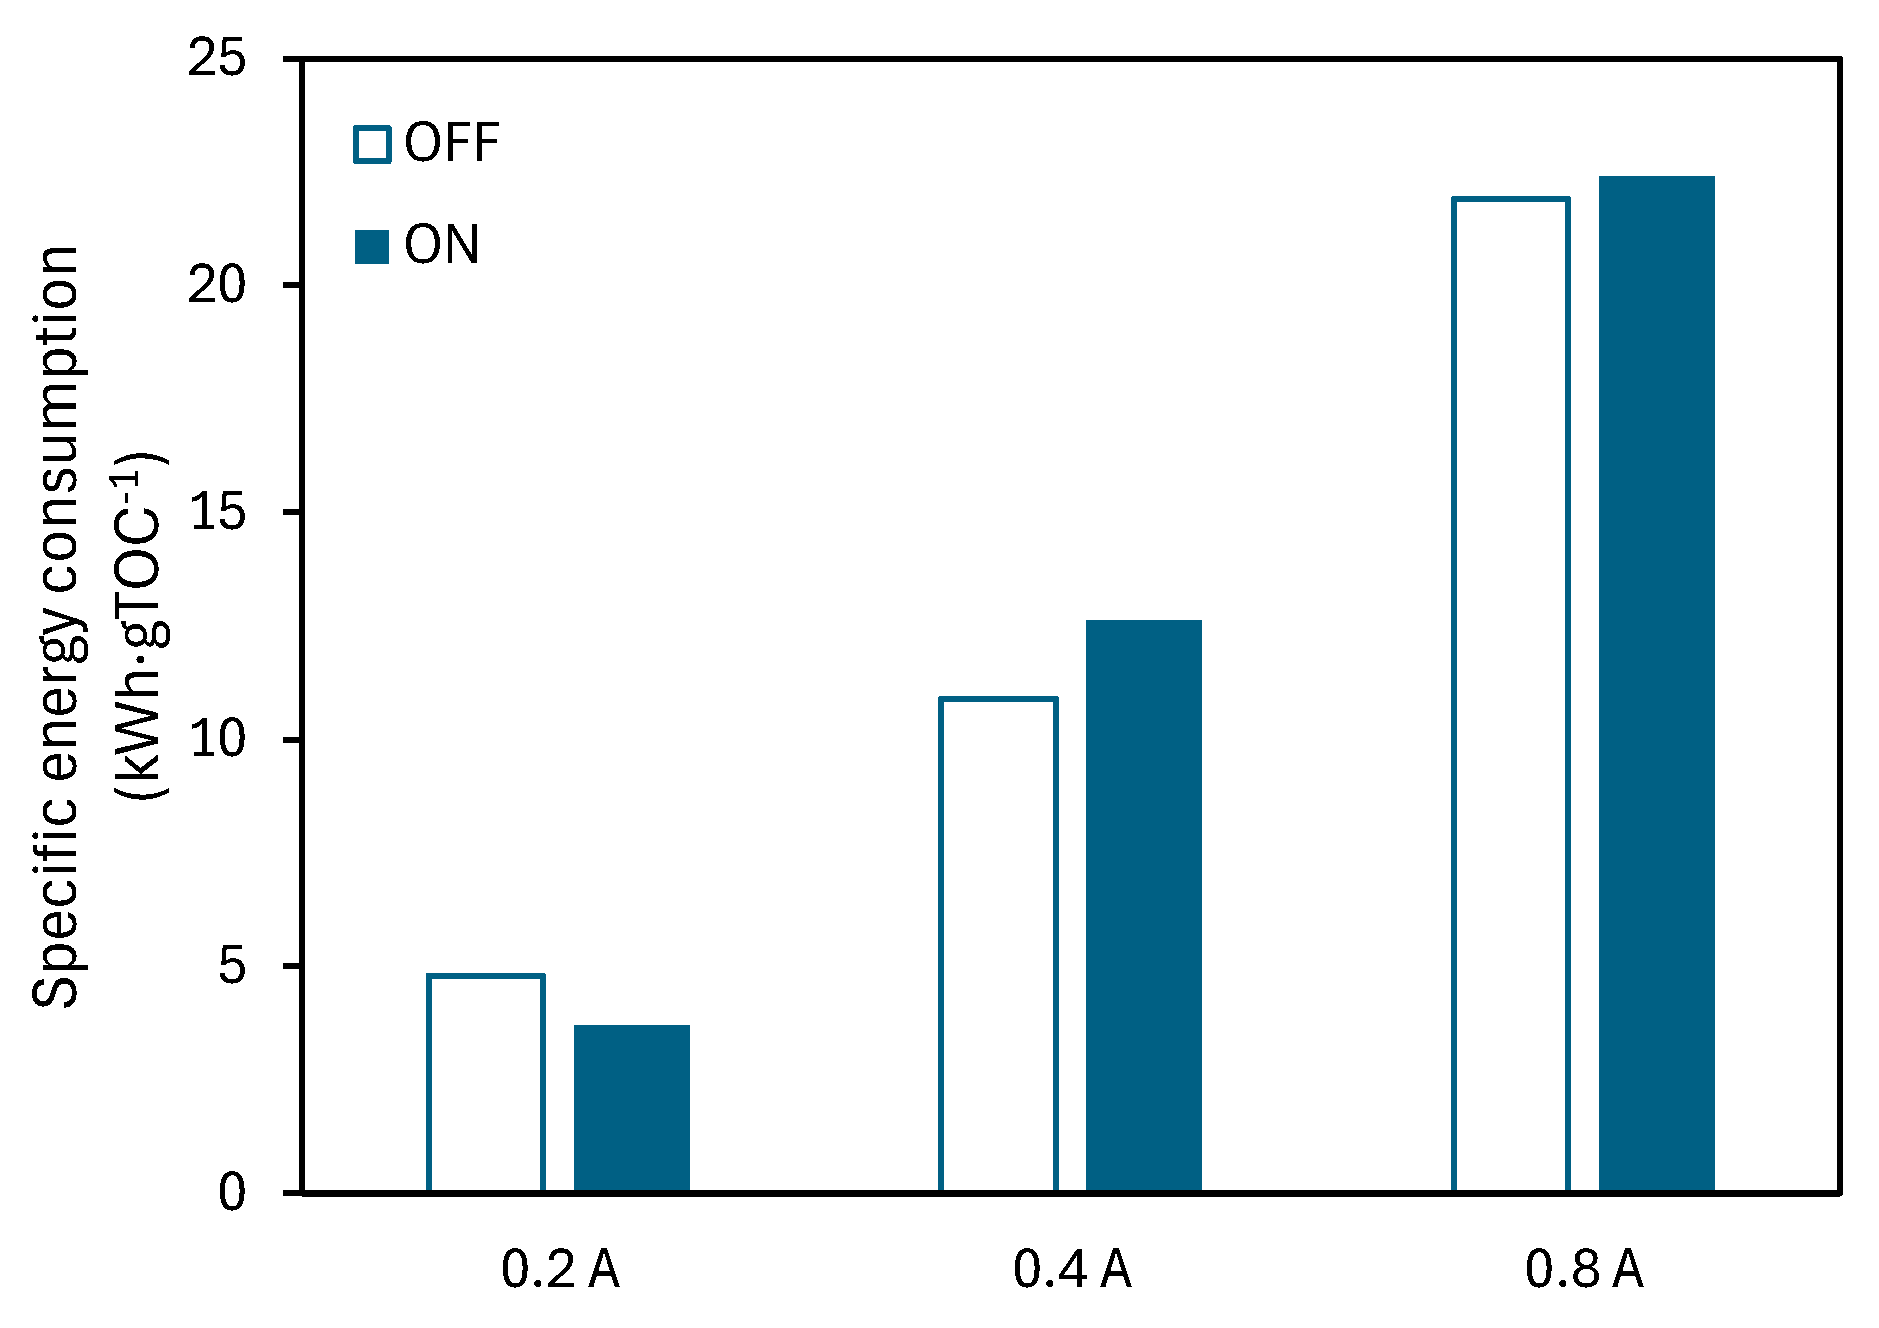
Figure 10.
(a) Evolution of MCE with time and (c) Specific energy consumption for the ceramic anode in electro (OFF) and photoelectrochemical (ON) oxidation experiments and the electrochemical oxidation with BDD anode. I = 0.2 A, CATL = CIBU = CNOR = 20 mg·L-1 and CNa2SO4 = 2 g·L-1.
Figure 10.
(a) Evolution of MCE with time and (c) Specific energy consumption for the ceramic anode in electro (OFF) and photoelectrochemical (ON) oxidation experiments and the electrochemical oxidation with BDD anode. I = 0.2 A, CATL = CIBU = CNOR = 20 mg·L-1 and CNa2SO4 = 2 g·L-1.
Disclaimer/Publisher’s Note: The statements, opinions and data contained in all publications are solely those of the individual author(s) and contributor(s) and not of MDPI and/or the editor(s). MDPI and/or the editor(s) disclaim responsibility for any injury to people or property resulting from any ideas, methods, instructions or products referred to in the content. |
© 2026 by the authors. Licensee MDPI, Basel, Switzerland. This article is an open access article distributed under the terms and conditions of the Creative Commons Attribution (CC BY) license (http://creativecommons.org/licenses/by/4.0/).
Copyright: This open access article is published under a Creative Commons CC BY 4.0 license, which permit the free download, distribution, and reuse, provided that the author and preprint are cited in any reuse.


