
Submitted:
18 January 2026
Posted:
19 January 2026
You are already at the latest version
Abstract
This study analyzes long‑term structural and demographic change in Japan by examining prefectural productivity trends from 1975 to 2021 and municipal‑level dynamics in Mie Prefecture. Four benchmark years—1975, 1989, 2006, and 2021—capture major turning points in Japan’s postwar economic trajectory. Spot values and interval‑based changes across the periods 1975–1989, 1989–2006, and 2006–2021 reveal three phases of regional economic development. Metropolitan prefectures led productivity growth until the early 2000s, but their dominance weakened after 2006, when productivity gains became concentrated in non‑metropolitan regions despite substantial population decline. Municipal‑level evidence from Mie Prefecture reinforces this pattern. Between 2011 and 2021, all 29 municipalities recorded increases in income per working‑age person, and municipalities with the steepest demographic contraction often showed the strongest income growth. These findings challenge the prevailing narrative of regional decline and indicate that depopulation may coexist with, or even facilitate, local economic restructuring. Overall, Japan’s regional transformation should be understood not simply as decline but as a process of reorganization driven by demographic change and the emergence of resilient local enterprises.
Keywords:
depopulation
; productivity dynamics
; regional innovation
; regional resilience
; Schumpeterian adaptation
; structural transformation
1. Introduction
1.1. Demographic Decline and the Transformation of Regional Economies in Japan
Japan’s rapid economic growth from the 1960s onward triggered large-scale migration from rural communities to major metropolitan areas, undermining the viability of many localities. Despite policy interventions such as the 1970 Act on Emergency Measures for Depopulated Areas, depopulation has intensified, and more than half of all municipalities were designated as depopulated in 2022 [1,2,3]. Projections indicate accelerating population decline and severe labor shortages across essential sectors, raising concerns about the sustainability of local public services [4]. Although these demographic trends are well documented, academic discourse has long framed depopulation primarily as a process of regional decline. This “decline model” emphasizes economic contraction and service withdrawal, leaving limited room to consider more diverse regional trajectories. Yet emerging evidence suggests that the relationship between demographic change and regional economic performance may be undergoing a fundamental shift.
1.2. Emerging Patterns of Local Adaptation
Recent cases across Japan indicate that demographic contraction can catalyze new forms of cooperation and restructuring. In peripheral regions, remaining businesses and residents have reorganized production systems and forged new collaborative relationships. Examples from Mie Prefecture illustrate these dynamics: aquaculture producers in southern Mie formed cooperative arrangements after the 2011 Great East Japan Earthquake, establishing a regional brand through standardized production and joint shipping. In Matsusaka City, tomato farmers partnered with an oil-processing company to utilize waste heat, improving profitability and creating employment for socially disadvantaged groups [5]. These cases highlight micro-level mechanisms through which demographic decline can trigger Schumpeterian adaptation and enhance local resilience.
At the macro level, national statistics also point to structural change. While metropolitan regions dominated economic growth through the late twentieth century, their economic primacy has weakened since 2006, accompanied by more pronounced income growth in rural areas [6]. These patterns challenge long-standing assumptions about the inevitability of regional decline under demographic contraction.
1.3. Research Gap and Contribution
Despite growing recognition of these heterogeneous trajectories, existing research remains limited in three respects:
- it continues to conceptualize depopulation primarily as decline;
- it lacks long-term, nationally comparable analyses of regional productivity dynamics;
- and it insufficiently theorizes mechanisms of local adaptation and restructuring.
This study addresses these gaps by integrating long-term national statistics with region-specific case analysis. Using demographic, economic, and administrative datasets from 1975 to 2021, it examines the structural characteristics, temporal trajectories, and spatial heterogeneity of population decline in Japan. It further analyzes how demographic contraction interacts with local economic structures and community organization, offering insights into the emergence of resilient business practices and new forms of cooperation. Through this approach, the study contributes to contemporary debates on regional revitalization and sustainable community development.
2. Materials and Methods
2.1. Analytical Periods
This study analyzes long-term structural and demographic change in Japan using four benchmark years—1975, 1989, 2006, and 2021—that represent major turning points in the country’s postwar economic trajectory. These years correspond to (1) the transition to stable growth following the end of the high-growth era (1975), (2) the peak of the bubble economy (1989), (3) the conclusion of prolonged post-bubble adjustment and the onset of economic normalization (2006), and (4) the most recent stage of demographic decline and regional restructuring (2021). By examining changes across the intervals 1975–1989, 1989–2006, and 2006–2021, the analysis captures the distinct characteristics of each phase, including shifts in industrial structure, regional productivity, and population dynamics.
2.2. Data Sources
The quantitative analysis draws on publicly available datasets from two primary sources. Prefecture-level indicators of population, income, and economic activity were obtained from the Cabinet Office’s Prefectural Accounts [7], which provide consistent time-series data for all 47 prefectures. Municipal-level demographic and economic data for Mie Prefecture were taken from the Municipal Accounts published by the Mie Prefectural Government [8]. These datasets are widely used in regional economic research and offer sufficient temporal and spatial resolution to analyze long-term structural changes. All data correspond to the Japanese fiscal year (April to the following March).
2.3. Variables and Indicators
The analysis employs a set of demographic, income, and productivity indicators defined as follows:
- Population variables: total population, working-age population (15–64), population change rate.
- Income variables: per-capita income, per-worker income (working-age population).
- Productivity variables: gross prefectural product (GPP) per capita and per worker.
All variables were used as defined in the original datasets. Prefecture-level indicators were compiled for the benchmark years (1975, 1989, 2006, and 2021), and municipal-level indicators were compiled for all 29 municipalities in Mie Prefecture. Unless otherwise noted, values represent nominal figures. These indicators allow for consistent comparison across regions and over time, enabling the identification of structural shifts in productivity and income distribution.
2.4. Statistical Procedures
The statistical analysis proceeded in three steps. First, descriptive statistics were calculated to summarize the distribution of key indicators, including the mean, median, standard deviation (SD), range, and interquartile range (IQR). These measures were used to assess central tendencies and regional disparities across prefectures and municipalities.
Second, changes in nominal GDP per worker were computed for each of the three analytical intervals—1975–1989, 1989–2006, and 2006–2021. Percentage changes relative to the initial year of each interval were used to ensure comparability across regions with different economic scales. These changes were visualized to identify shifts in growth patterns and to compare the trajectories of metropolitan and non-metropolitan prefectures.
Third, outliers were evaluated using Tukey’s interquartile range (IQR) method [9]. Outliers were not excluded unless explicitly noted; instead, their influence on distributional patterns was examined to ensure that observed trends were not driven by extreme values. Measures of dispersion, including the coefficient of variation, were used to assess changes in regional inequality over time.
2.5. Case Analysis of Mie Prefecture
To complement the prefecture-level analysis, a detailed municipal-level examination was conducted using Mie Prefecture as a case study. Mie comprises 29 municipalities with substantial variation in demographic and economic conditions, making it well suited for analyzing how population decline interacts with local economic structures.
Municipal-level indicators—residents’ income, working-age population, and income per working-age person—were compiled for the period 2011–2021. These indicators were selected to capture both demographic contraction and changes in local economic performance. Municipalities were compared based on the magnitude of change in income per working-age person, allowing for the identification of divergent trajectories within the prefecture.
The case analysis integrates quantitative indicators with publicly available administrative documents and secondary sources describing local industrial structures and community-level developments. Cases were selected based on their relevance to demographic change, representativeness within the region, and availability of reliable documentation. This mixed-methods approach enables the study to link macro-level statistical trends with micro-level mechanisms of local adaptation, restructuring, and productivity enhancement.
3. Results
3.1. Prefectural GDP per Worker in Key Benchmark Years and Subsequent Period Changes
Table 1 provides descriptive statistics for nominal prefectural GDP per worker in the four benchmark years—1975, 1989, 2006, and 2021—which represent key turning points in Japan’s postwar economic trajectory. These spot values offer a fixed reference for understanding regional productivity levels at each stage and serve as anchor points for interpreting subsequent changes.
Building on these benchmarks, Figure 1 compares the magnitude of change in GDP per worker across the three intervals 1975–1989, 1989–2006, and 2006–2021. This combined approach—spot values at major turning points and interval-based changes between them—allows the analysis to capture both the absolute levels of regional productivity and the distinct growth patterns that characterize each economic phase.
Phase A: 1975–1989 — Broad-Based and Rapid Growth
During this period, all prefectures experienced substantial increases in GDP per worker. The mean increase was 140.1%, and the median 138.5%, indicating broad uniform growth. Values ranged from 99.9% (Wakayama) to 190.4% (Yamanashi). Tokyo grew by 132.9%, ranking ninth nationwide. The narrow interquartile range (IQR) and modest standard deviation reflect limited regional disparity during this phase.
Phase B: 1989–2006 — Slowing Growth and Gradual Divergence
Growth continued in all prefectures but at a much slower pace. Both the mean and median were 28.2%, with an SD of 9.1%. The range extended from 9.8% (Saitama) to 45.6% (Wakayama). Tokyo’s increase of 24.4% placed it 31st among prefectures. Although disparities widened slightly, the overall pattern remained one of positive but decelerating growth.
Phase C: 2006–2021 — Divergent Trajectories and Metropolitan Stagnation
The third period marks a clear structural shift. Seven prefectures—Nara, Tottori, Chiba, Osaka, Okayama, Okinawa, and Kanagawa—recorded declines in GDP per worker, while the remaining prefectures experienced increases. The mean increase was 6.8%, the median 7.1%, and the SD 7.3%, indicating greater variation than in earlier periods. Values ranged from a 10.3% decrease (Kanagawa) to a 24.3% increase (Tokushima). Tokyo’s growth was nearly flat (0.3%), signaling stagnation despite continued population inflow.
Taken together, the spot values in Table 1 and the interval-based changes in Figure 1 reveal a pronounced shift in Japan’s regional economic dynamics: since 2006, regional prefectures have increased productivity despite shrinking labor forces, whereas metropolitan areas have absorbed additional workers without corresponding productivity gains.
3.2. Divergent Developments Between Tokyo and Regional Prefectures Since 2006
To examine the structural shift observed in the 2006–2021 interval in greater detail, Figure 2 presents year-to-year trends in nominal GDP, employment, and GDP per worker for Tokushima Prefecture, the national average, and Tokyo. These cases illustrate the contrasting mechanisms underlying regional productivity changes.
Tokushima recorded the largest overall increase in GDP per worker since 1975, rising from 2,188.4 thousand yen in 1975 to 9,458.5 thousand yen in 2021—an approximately 4.3-fold increase. Growth accelerated particularly after 2006. Between 2006 and 2021, employment declined by 8.8%, while nominal GDP increased by 13.4%, resulting in a substantial rise in productivity. Similar patterns were observed in other top-performing prefectures such as Iwate, Ibaraki, Kumamoto, Gunma, Kagoshima, Wakayama, Nagano, Yamaguchi, and Akita—all located outside the three major metropolitan areas.
In contrast, Tokyo experienced an 8.1% increase in employment between 2006 and 2021, but nominal GDP increased by only 8.4%, resulting in stagnation in GDP per worker. Osaka and Aichi exhibited similar patterns. Kanagawa recorded a 12.9% increase in employment but only a 1.3% increase in nominal GDP, leading to a 10.3% decline in GDP per worker.
These results reinforce the pattern identified in Figure 1: since 2006, regional prefectures have increased productivity through structural adjustment amid declining labor forces, whereas metropolitan areas have absorbed additional workers without corresponding productivity gains.
3.3. Municipal-Level Dynamics in Mie Prefecture
To complement the prefecture-level analysis, Figure 3 presents changes from 2011 to 2021 in municipal residents’ income, working-age population, and income per working-age person for all 29 municipalities in Mie Prefecture. This municipal-level perspective provides insight into how demographic contraction interacts with local economic structures.
The working-age population declined in all municipalities except Asahi and Kawagoe, both adjacent to the Nagoya metropolitan area. The steepest decline occurred in Minamiise (−44.0%). The five municipalities with the largest decreases—Toba, Kihoku, Owase, Taiki, and Minamiise—were all located in the southern region.
In contrast, income per working-age person increased in every municipality. The largest increase was observed in Kiho (49.6%), and the smallest in Asahi (11.5%). Among municipalities with the steepest population declines, income per working-age person rose by 24.4% in Toba, 32.6% in Kihoku, 33.4% in Owase, 33.9% in Taiki, and 44.9% in Minamiise. Except for Toba, all exceeded the prefectural average.
Municipal residents’ income showed more variation: 11 municipalities recorded declines, while 18 recorded increases. The prefectural average was a 5.1% increase.
Overall, the municipal-level results mirror the prefecture-level patterns observed in Figure 1 and Figure 2: municipalities experiencing the most severe population decline tended to exhibit higher income growth per working-age person, suggesting that demographic contraction may be associated with local restructuring and productivity enhancement.
Overall, while the working-age population declined in nearly all municipalities between 2011 and 2021, income per working-age person increased in every municipality. Moreover, municipalities experiencing the most severe population decline tended to exhibit higher income growth per working-age person.
4. Discussion
The findings of this study challenge conventional narratives of regional decline in Japan. The Japan Policy Council’s 2024 reanalysis identifies approximately 40% of municipalities as “at risk of disappearance,” defined by a projected decline of more than half in the population of women aged 20–39 between 2020 and 2050 [10]. While this designation highlights the severity of demographic contraction, the results presented here suggest that “disappearance” should be interpreted primarily as the erosion of administrative capacity rather than the disappearance of communities themselves. Local societies may continue to function—even transform—even as institutional structures weaken.
Evidence from Mie Prefecture illustrates this dynamic. Between 2011 and 2021, all 29 municipalities recorded increases in income per working-age person, despite widespread population decline. Minamiise Town, which experienced a more than 40% reduction in its working-age population, achieved a 44.9% increase in income per working-age group, far exceeding the 24.6% increase observed in Yokkaichi City, the prefecture’s largest municipality. These patterns indicate that municipalities experiencing the most severe depopulation can nonetheless exhibit strong economic performance, suggesting that demographic contraction may coexist with, or even facilitate, local economic restructuring.
The long-term prefectural trends reinforce this interpretation. The spot values in Table 1 and the interval-based changes in Figure 1 reveal three distinct historical phases. From 1975 to 1989, Japan experienced broad-based productivity growth, led by Tokyo during the stable growth and bubble periods. Between 1989 and 2006, however, Tokyo’s dominance weakened as the country underwent prolonged post-bubble adjustment. By the time economic conditions began to normalize, Tokyo’s centripetal pull had largely dissipated. Since 2006, productivity growth has been particularly pronounced in non-metropolitan regions, while metropolitan prefectures—despite continued population inflow—have shown stagnation or decline in GDP per worker. The contrasting trajectories of Tokushima and Tokyo in Figure 2 exemplify this shift.
The year 2006 also marked the emergence of institutional fatigue, as evidenced by the building safety fraud scandal and the pension record problem. These failures signaled the limits of postwar institutional arrangements and suggest that new forms of governance and economic organization were beginning to emerge from the regions. The simultaneous timing of institutional fatigue and the reversal of regional productivity trends points to a broader structural transformation in Japan’s political economy.
Taken together, these findings call for a reinterpretation of depopulation. Rather than a unidirectional decline, depopulation can be understood as a social process accompanying the reorganization of local communities in the postwar era. It has facilitated the emergence of “regional societies centered on resilient local enterprises,” which adapt through Schumpeterian creative destruction and new combinations [11]. Observations from Mie Prefecture demonstrate that such processes can generate new value, stimulate local industries, and enhance residents’ earning capacity. Depopulation, therefore, may function as a catalyst for regional economic renewal rather than a simple indicator of decline.
At the same time, a paradox remains. Even resilient firms may face existential risks as population decline undermines municipal functions and essential infrastructure—water systems, transportation networks, education, healthcare, and retail environments. Once these foundations deteriorate, both businesses and residents may struggle to remain, raising the possibility of genuine community disappearance. As local industries undergo selection and consolidation, new regional societies are emerging, but their sustainability will depend on constructing social infrastructure designed for low-density conditions.
The ongoing transformation of regional society also presents opportunities. By recombining people, firms, traditions, and new technologies, local enterprises can rebuild social foundations and extend their activities beyond regional and even national boundaries. Such processes may form the basis for future growth.
Finally, this study has limitations. Because the analysis relies on publicly available government datasets, it captures structural tendencies but cannot fully represent local realities. Although fieldwork has been conducted, it has been limited to Mie Prefecture. A comprehensive understanding of Japan’s regional transformations will require sustained field research across diverse areas with differing historical and socioeconomic contexts.
Author Contributions
The author solely conducted all aspects of this research.
Funding
This research received no external funding.
Institutional Review Board Statement
Not applicable.
Informed Consent Statement
Not applicable.
Data Availability Statement
As described in the text, this study conducted basic statistical analysis using publicly available data published by the Cabinet Office of Japan and Mie Prefecture.
Acknowledgments
I am deeply grateful to Ms. Chikako Araki and Ms. Yukako Demiya for their dedicated administrative assistance, which was essential to the completion of this study. During the preparation of this manuscript, the author used Microsoft Copilot as an AI-based language and analytical support tool. It assisted with English translation, editorial refinement, and minor statistical checks. All final decisions regarding the analyses, interpretations, and written content were made solely by the author.
Conflicts of Interest
The author declares no conflicts of interest.
Abbreviations
The following abbreviations are used in this manuscript:
| IQR | Interquartile Range |
| GDP | Gross Domestic Product |
References
- National Institute of Population and Social Security Research. Population dynamics statistics: Status of designated depopulated municipalities as of April 1, 2022.
- Statistics Bureau of Japan. Population of Japan: Final report of the 2005 Population Census.
- National Institute of Population and Social Security Research. Population projections for Japan: 2021–2070 (2023 revision).
- Furuya, S.; Recruit Works Institute. the shock of an 11 million worker shortage. President Publishing, 2023.
- Nishimura, N. The 100 presidents doctoral project. Getsutosha, 2021.
- Nishimura, N. Regional innovation and genuine regional revitalization driven by people’s awakening. Shinkin Bank, 2024.
- Cabinet Office, Government of Japan. Prefectural economic accounts 1975–2021.
- Mie Prefectural Government. Municipal economic accounts of Mie Prefecture, FY2021.
- Tukey, J. W. Exploratory data analysis. Addison-Wesley, 1977.
- Japan Policy Council. Report on the future of Japan: Population decline and regional challenges. 2014.
- Schumpeter, J. A. The theory of economic development. Harvard University Press, 1934.
Figure 1.
Change in Prefectural Nominal GDP per Worker in (A) 1975–1989, (B) 1989–2006, and (C) 2006–2021.
Figure 1.
Change in Prefectural Nominal GDP per Worker in (A) 1975–1989, (B) 1989–2006, and (C) 2006–2021.
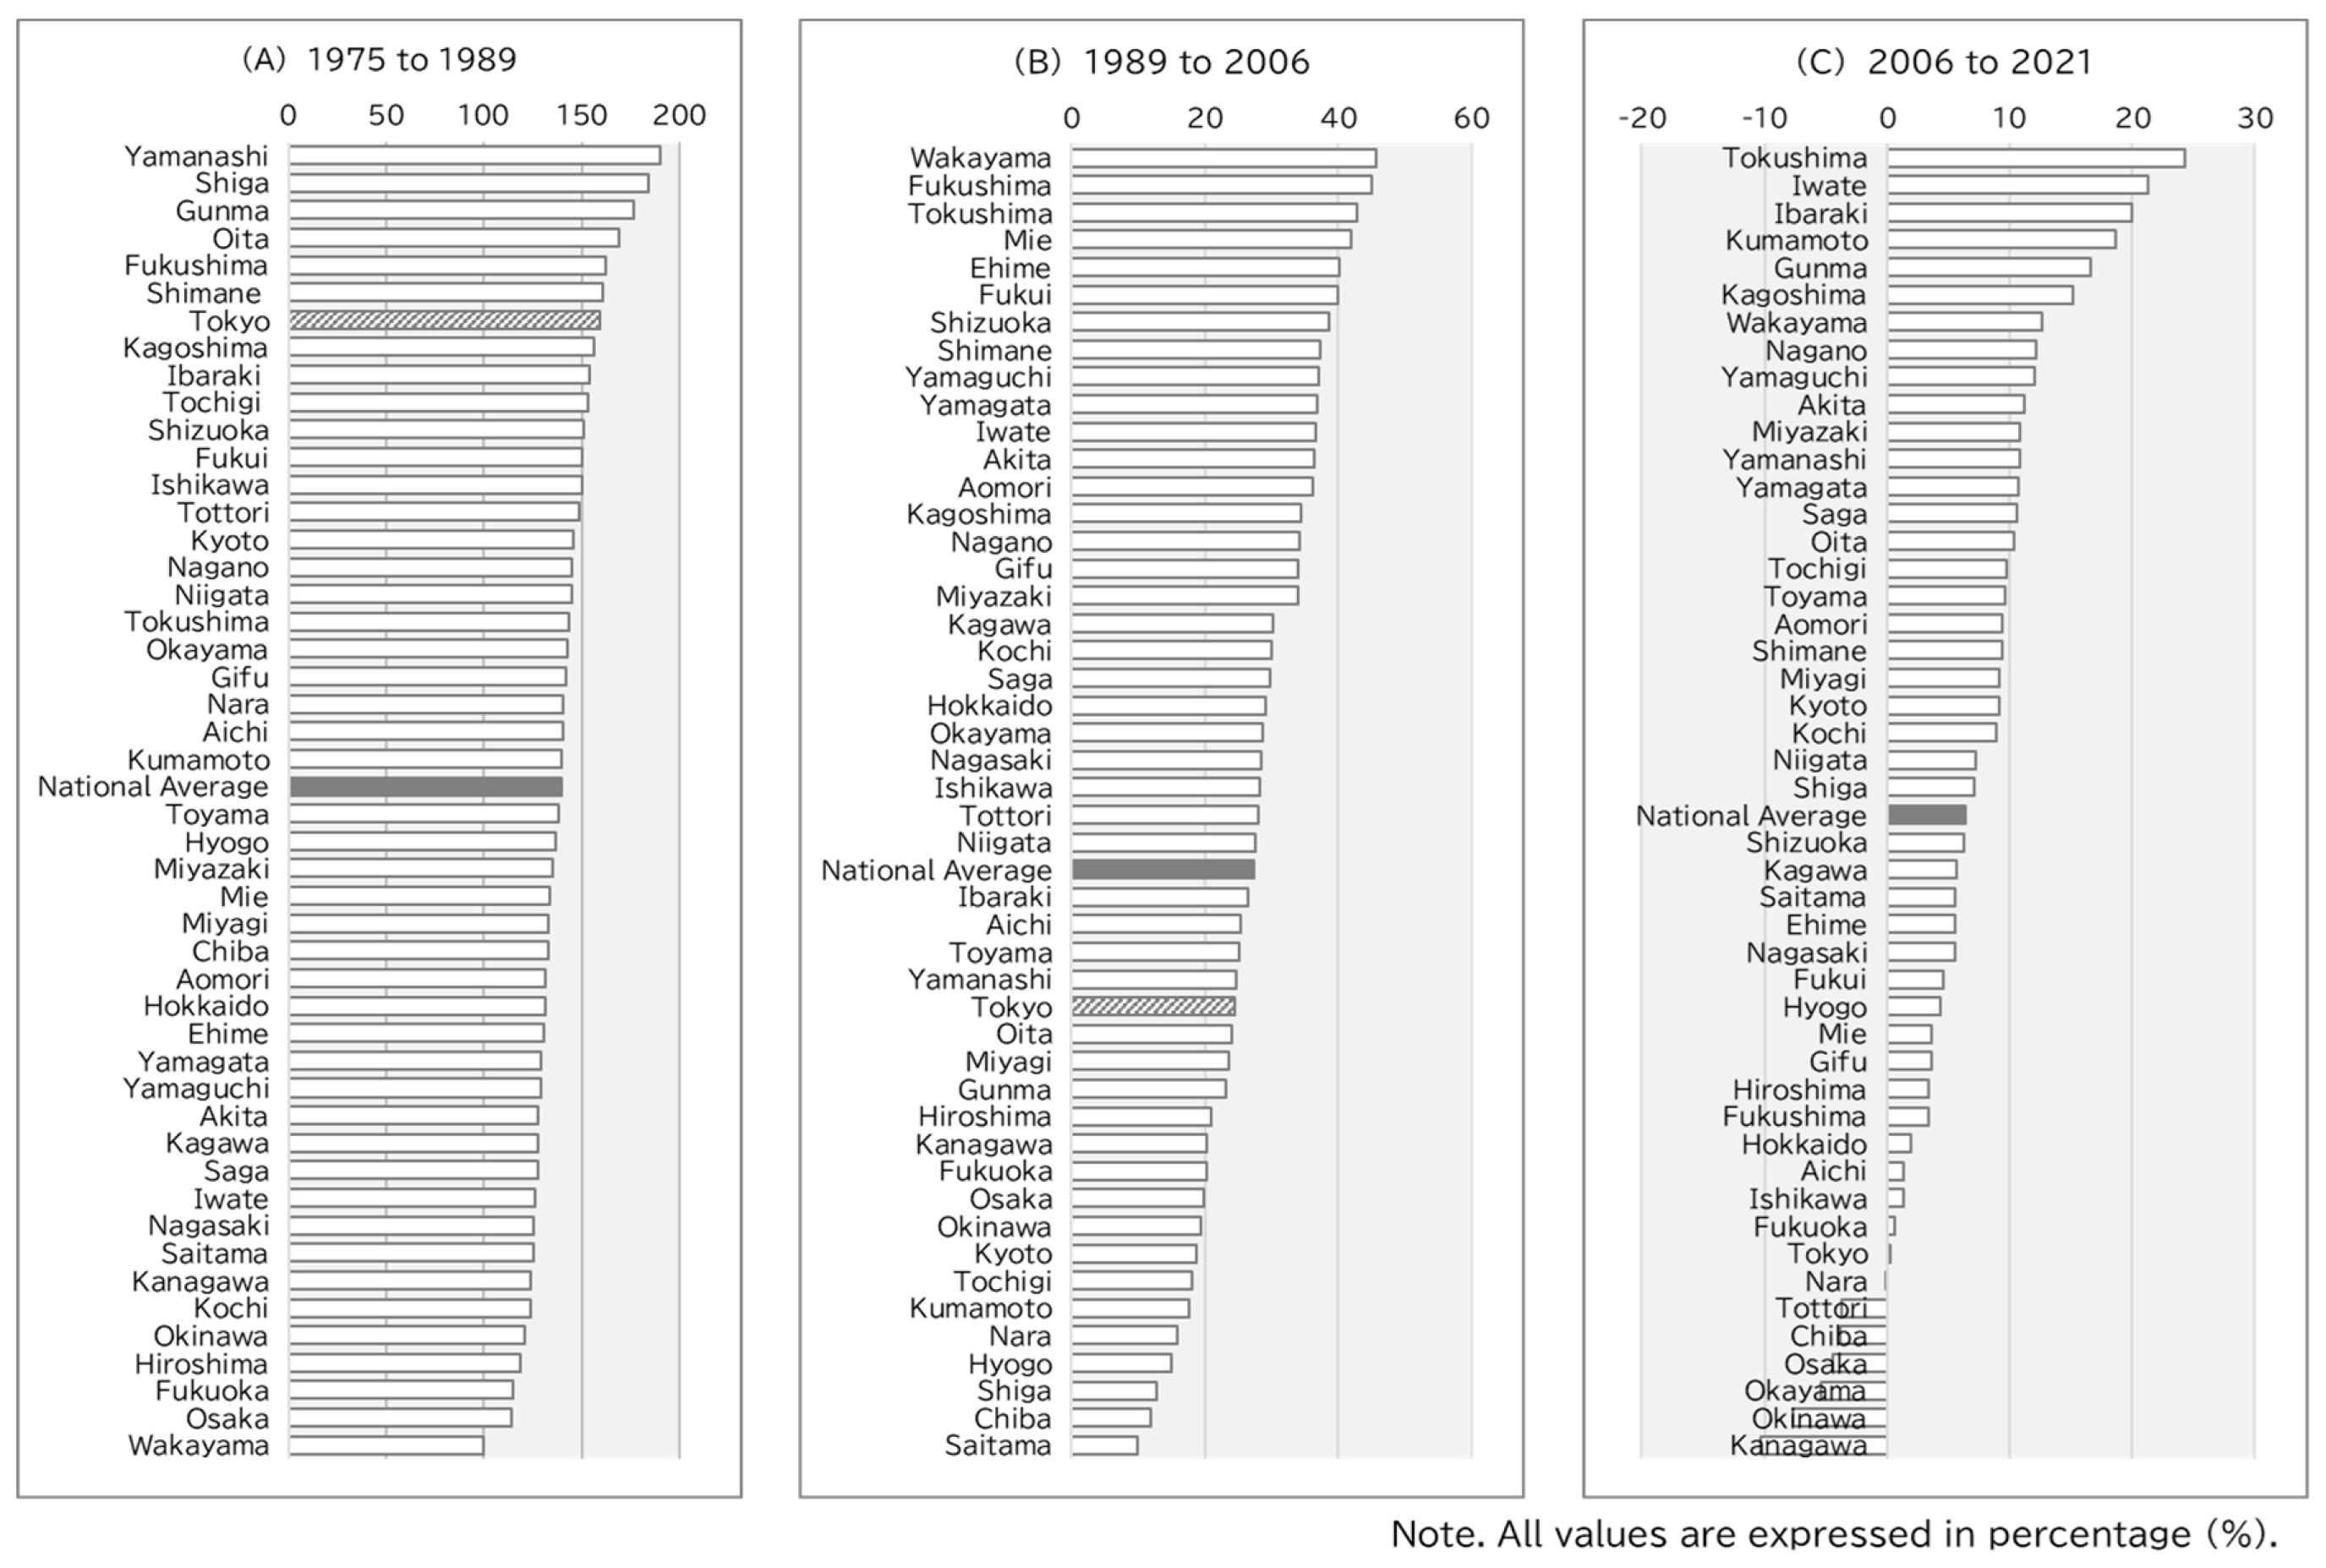
Figure 2.
Divergent Trends in Nominal GDP, Employment, and GDP per Worker for Tokushima, Tokyo, and the National Average, 2006–2021.
Figure 2.
Divergent Trends in Nominal GDP, Employment, and GDP per Worker for Tokushima, Tokyo, and the National Average, 2006–2021.
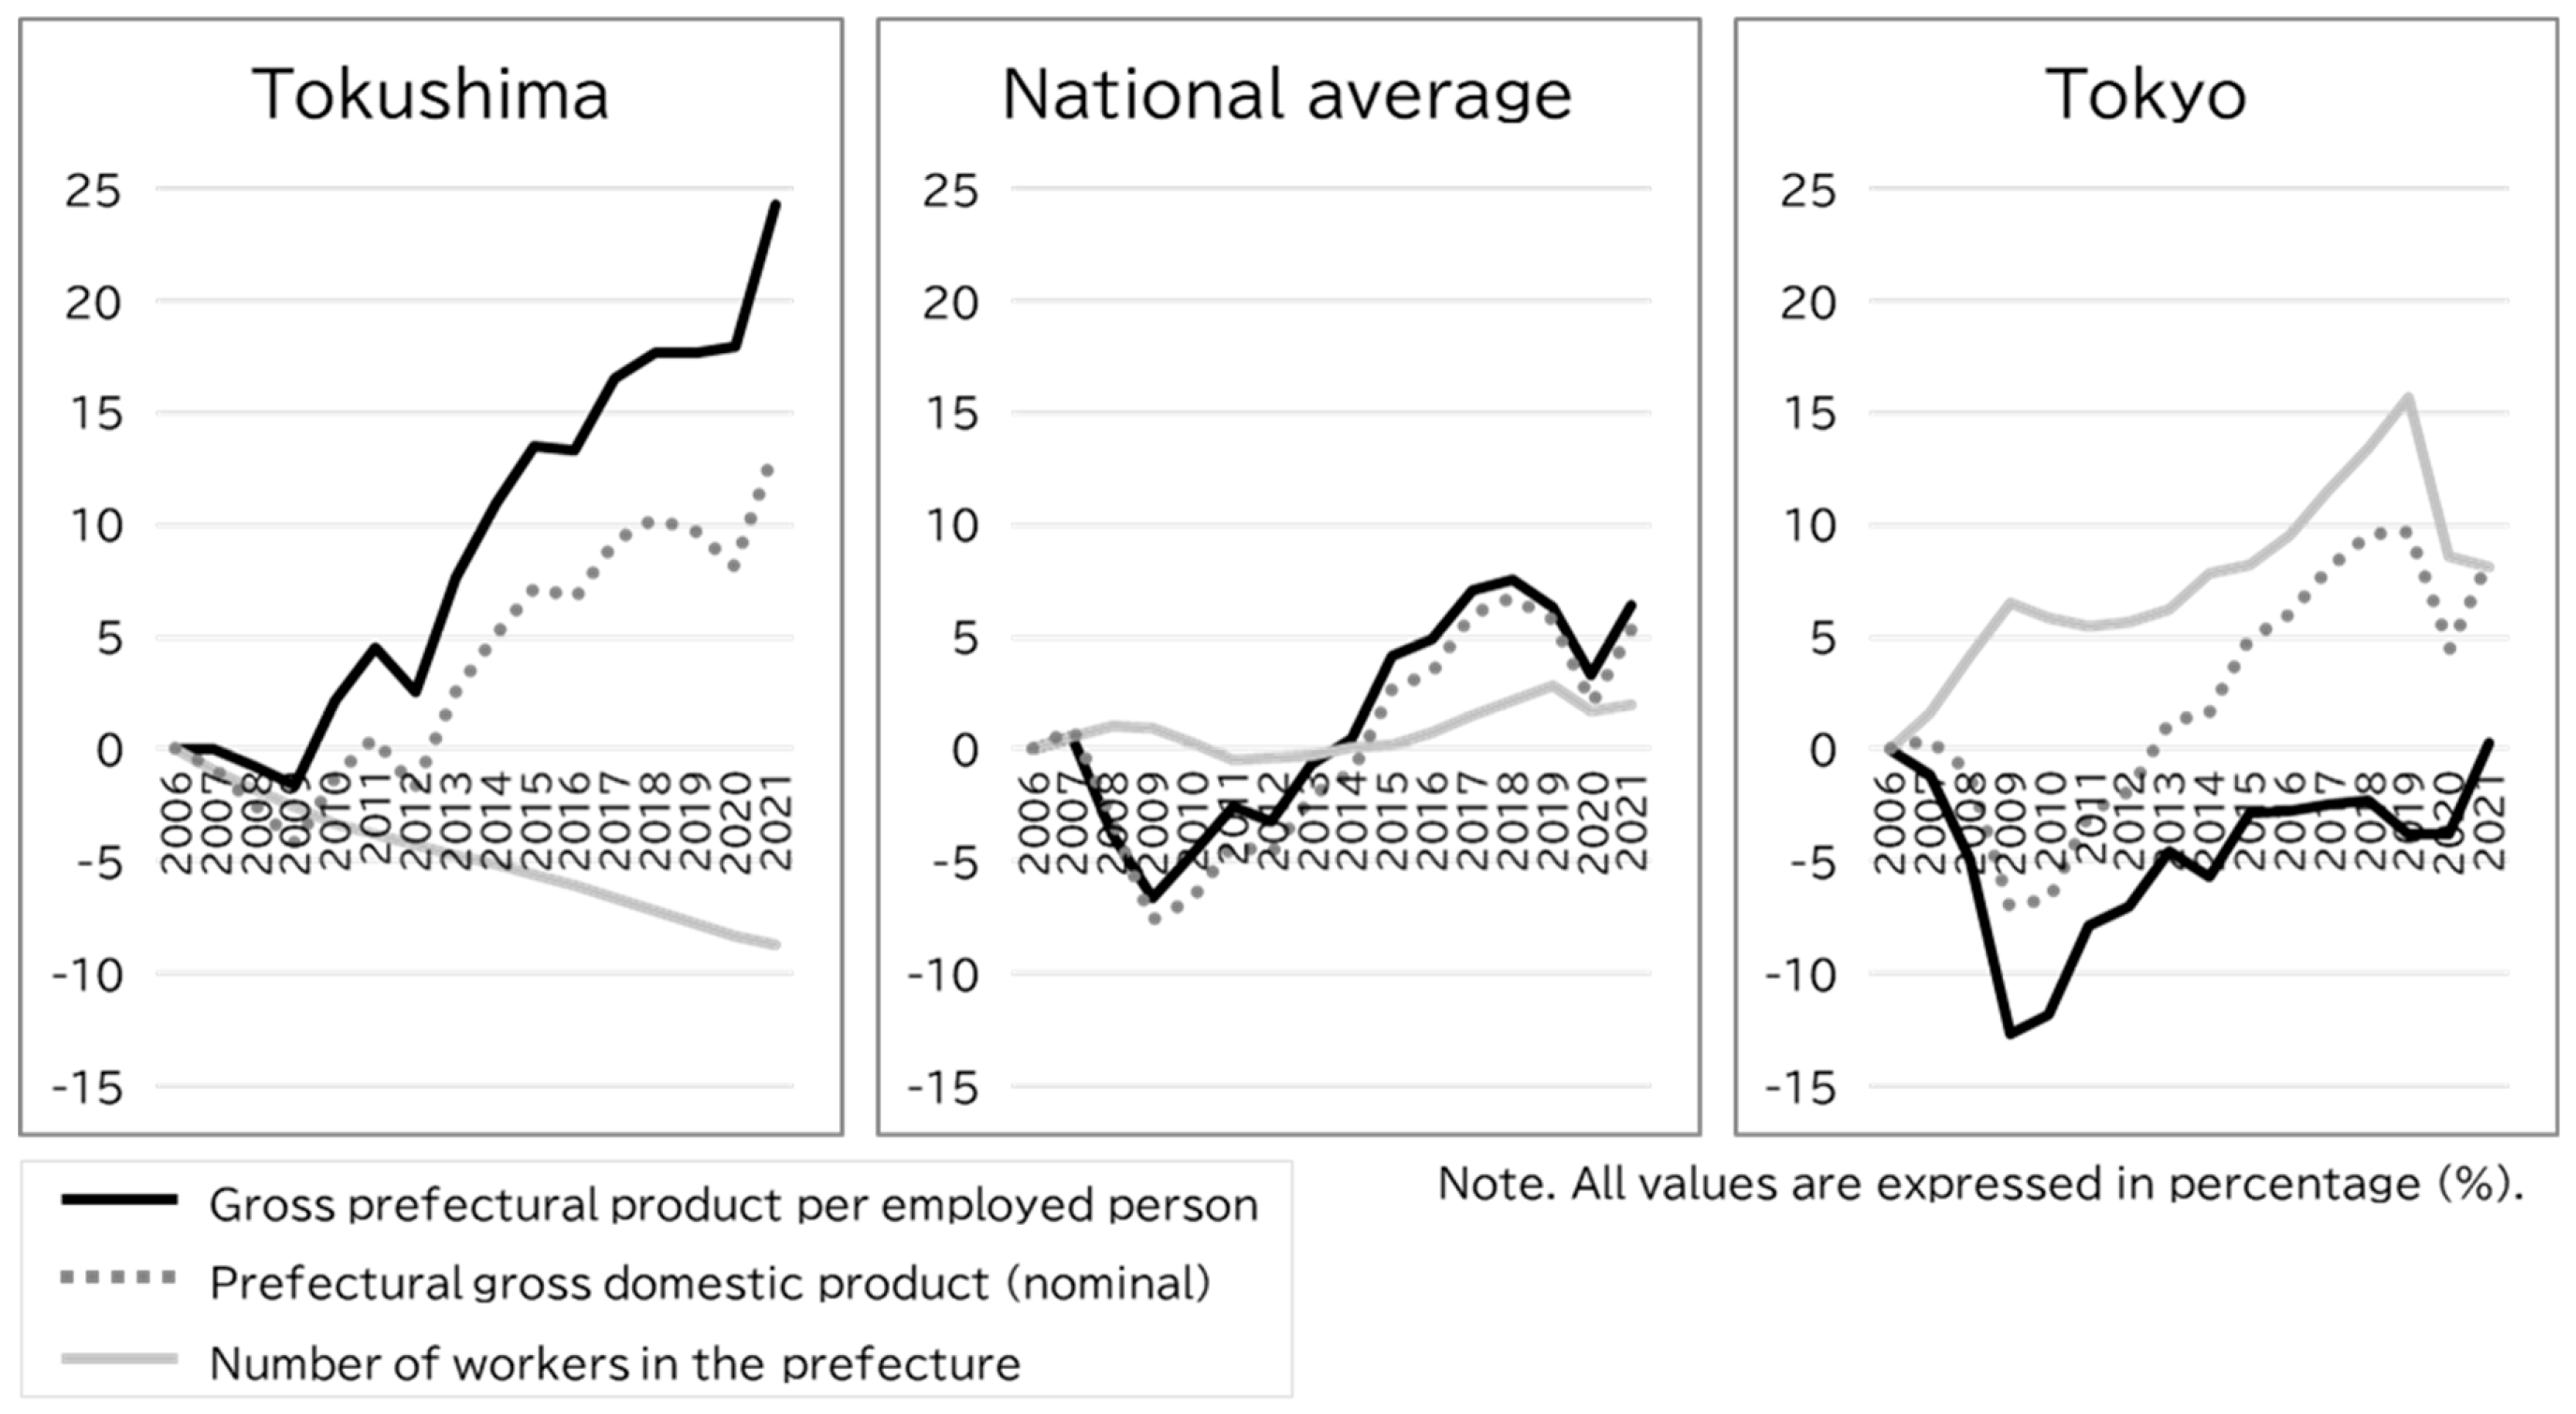
Figure 3.
Changes in Residents’ Income, Working-Age Population, and Income per Working-Age Person Across 29 Municipalities in Mie Prefecture, 2011–2021.
Figure 3.
Changes in Residents’ Income, Working-Age Population, and Income per Working-Age Person Across 29 Municipalities in Mie Prefecture, 2011–2021.
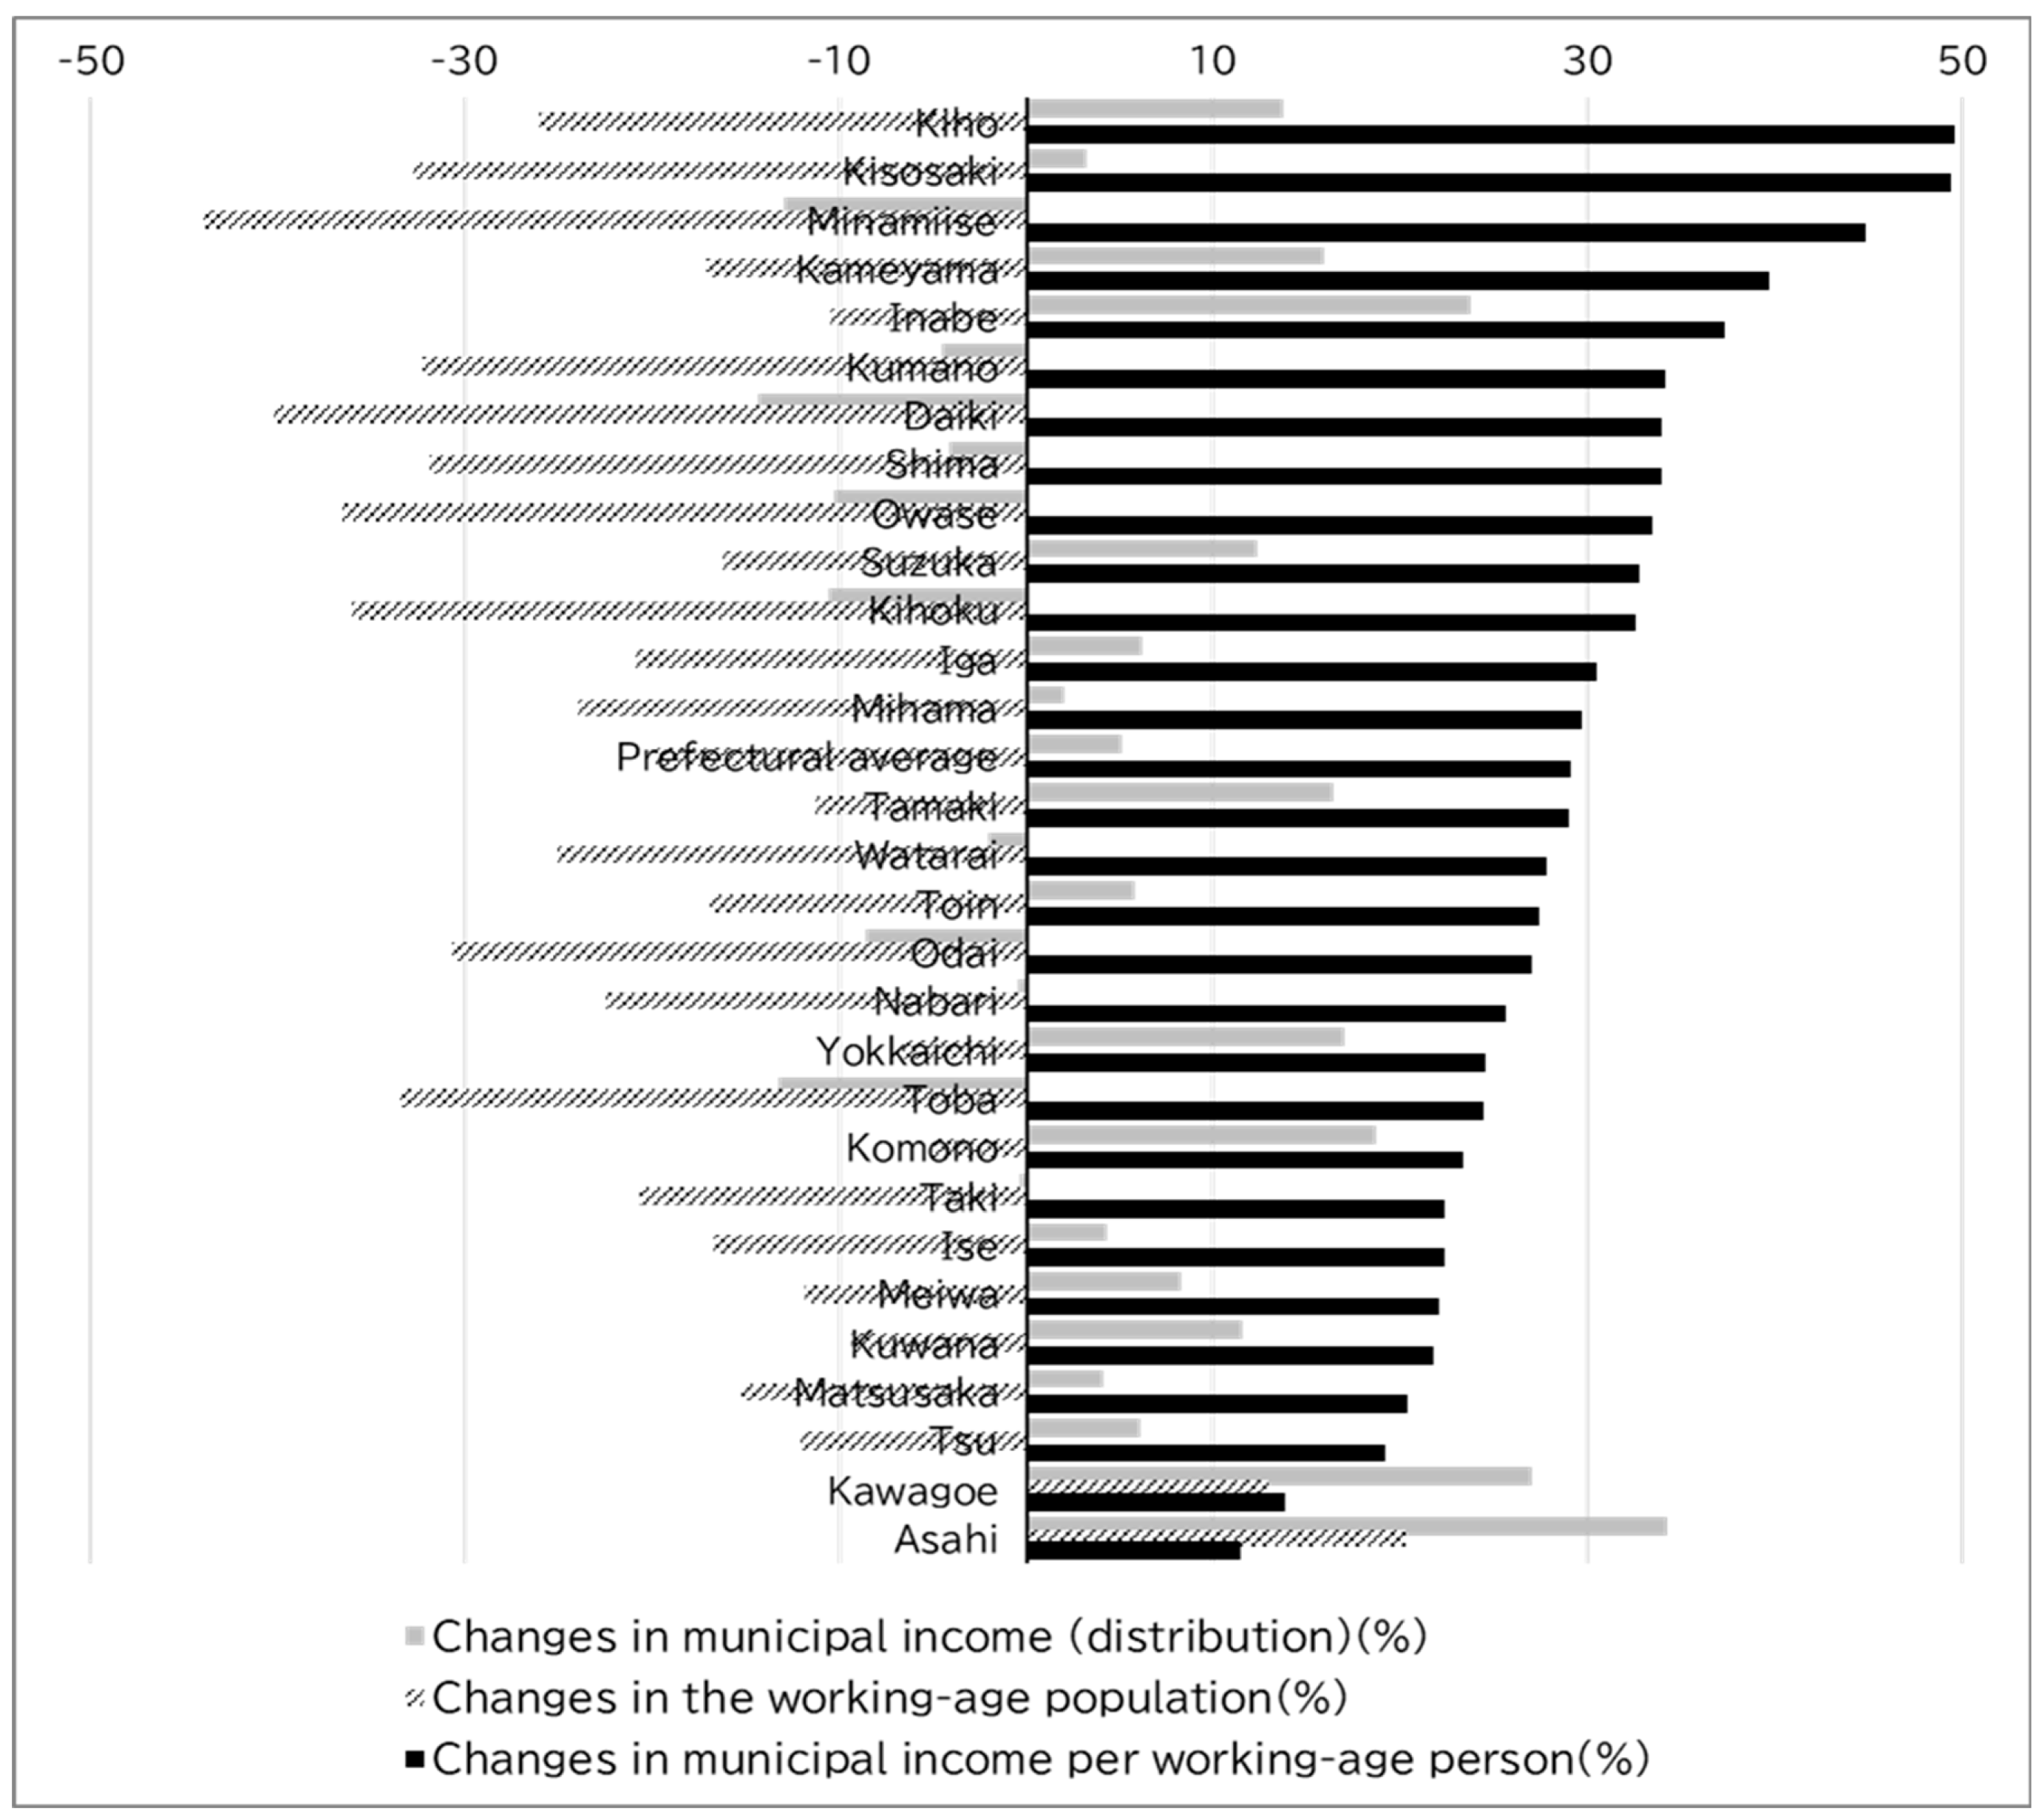

Table 1.
Descriptive Statistics for Prefectural Nominal GDP per Worker in 1975, 1989, 2006, and 2021.
Table 1.
Descriptive Statistics for Prefectural Nominal GDP per Worker in 1975, 1989, 2006, and 2021.
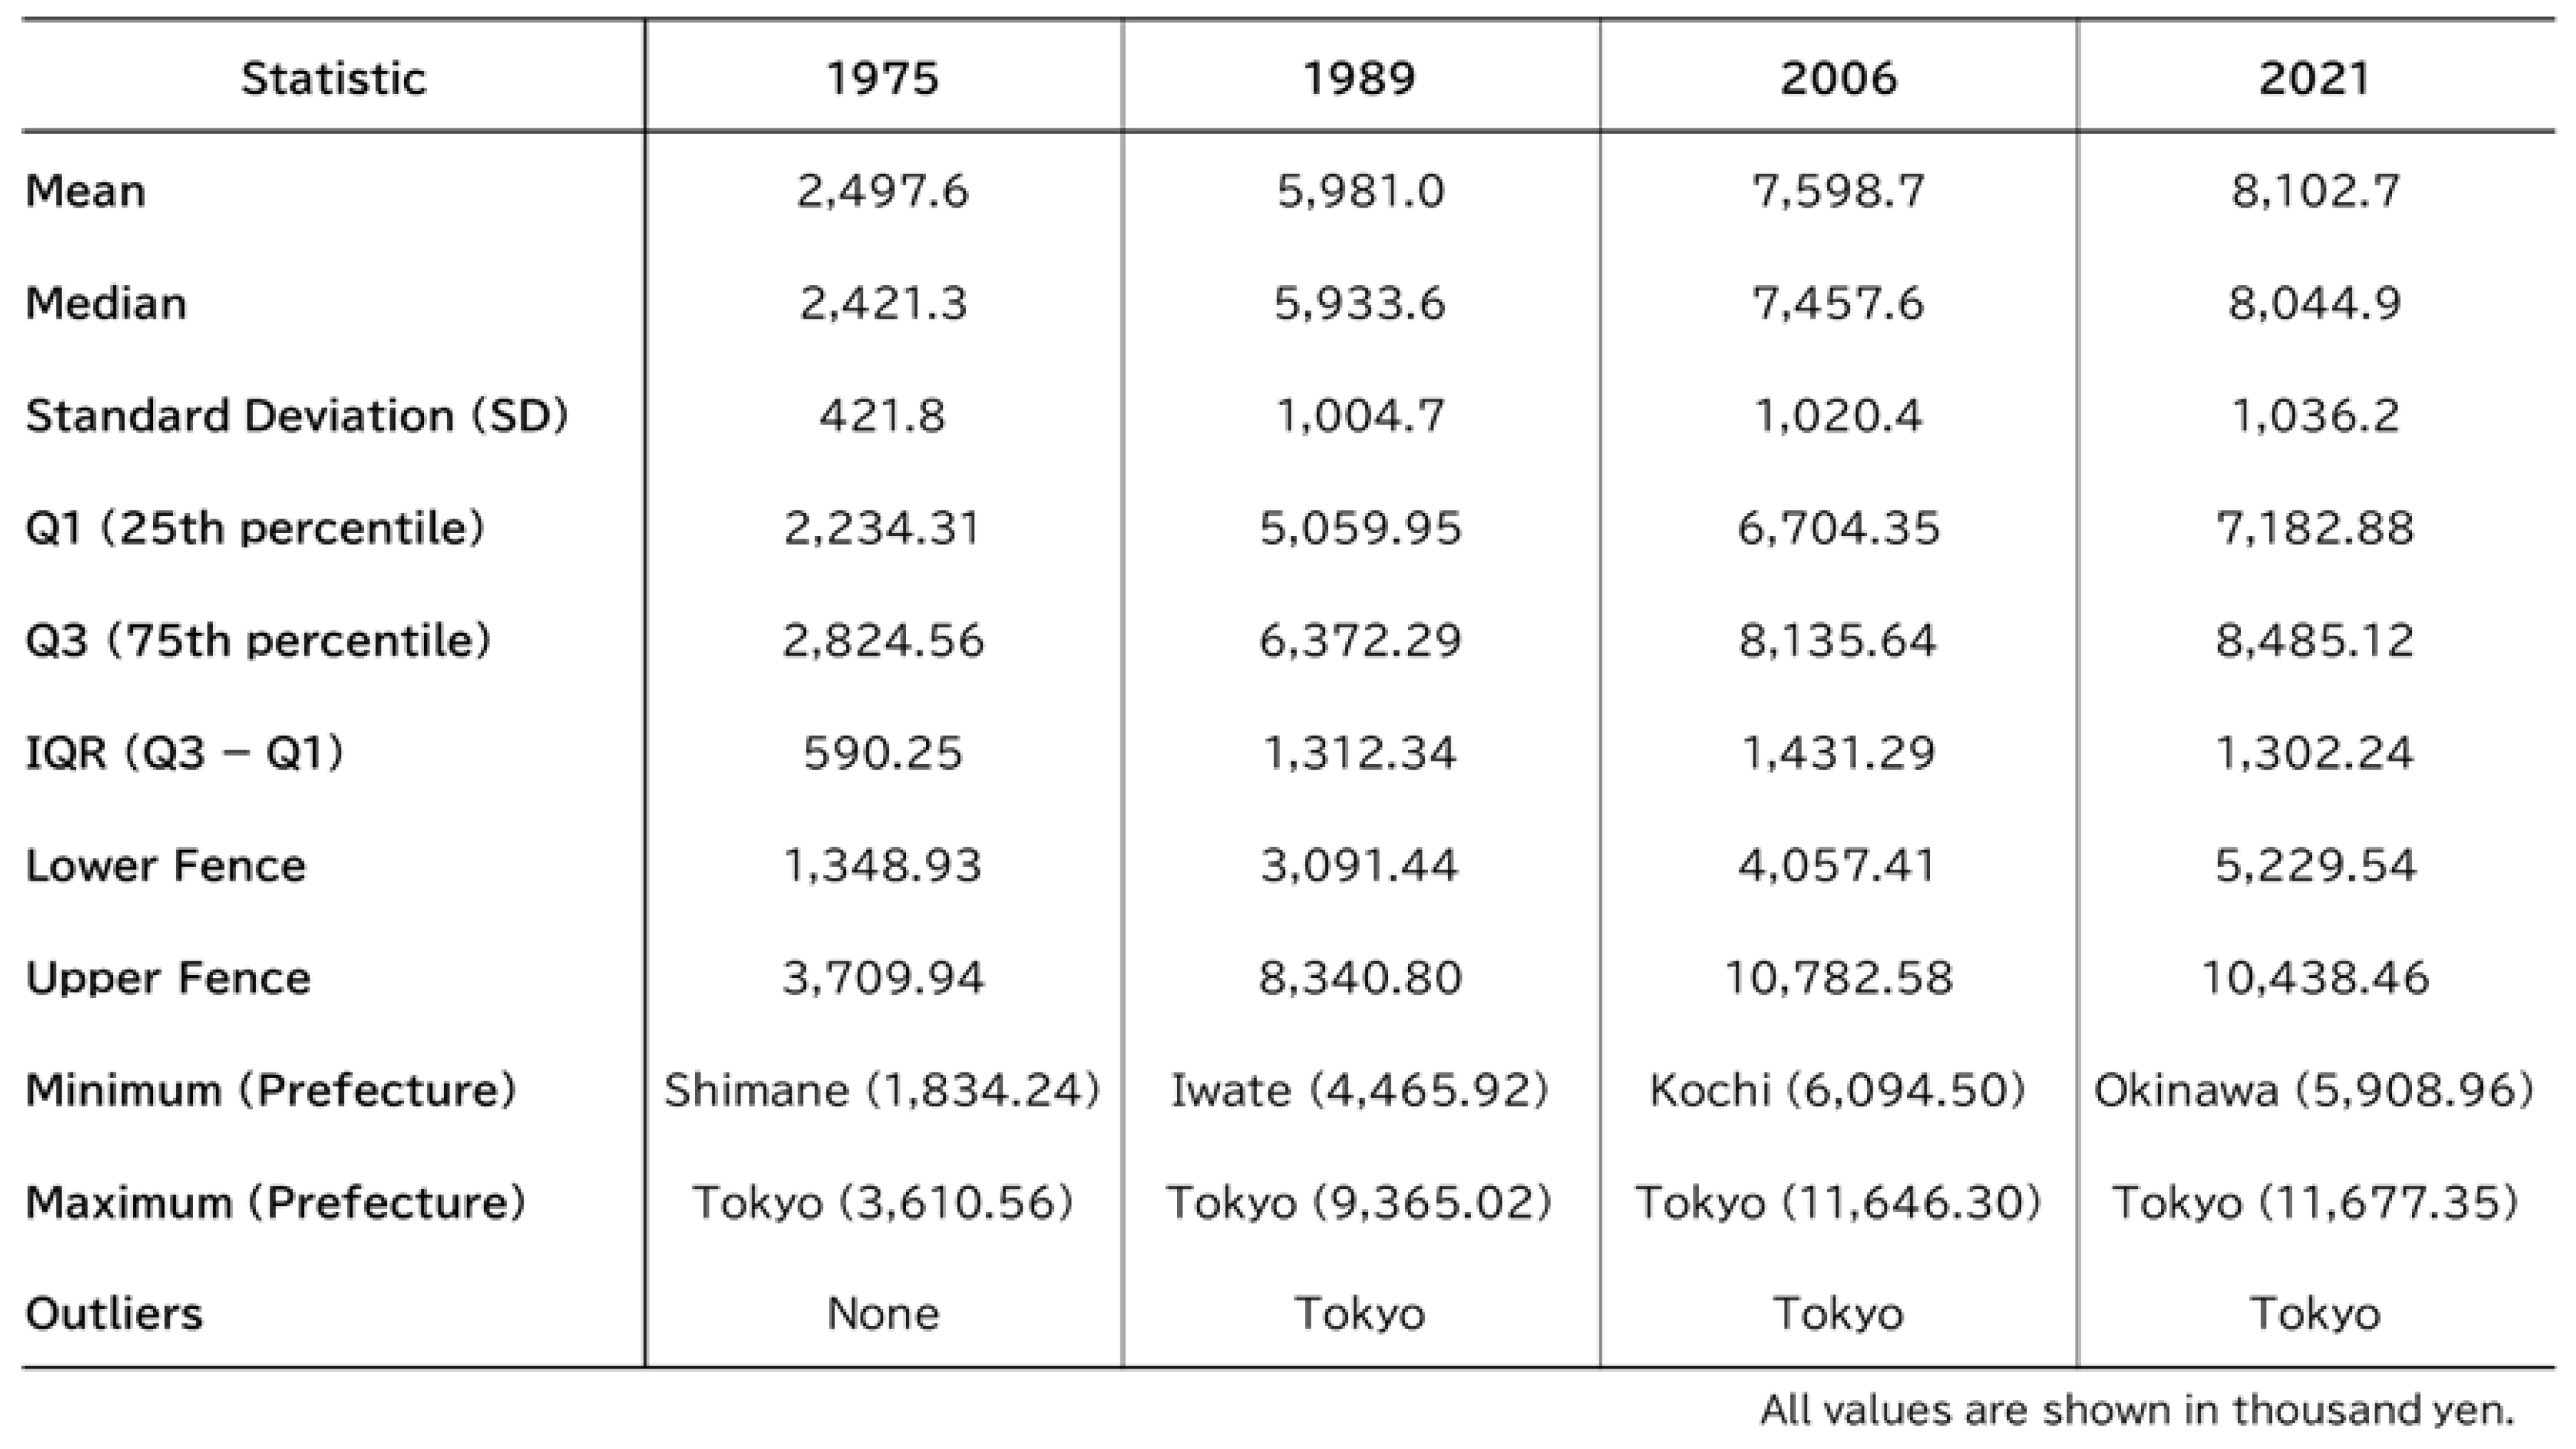
Notes: The table reports the mean, median, standard deviation (SD), range, and interquartile range (IQR) of nominal GDP per worker across 47 prefectures. IQR is used to assess outliers and distributional spread.
Disclaimer/Publisher’s Note: The statements, opinions and data contained in all publications are solely those of the individual author(s) and contributor(s) and not of MDPI and/or the editor(s). MDPI and/or the editor(s) disclaim responsibility for any injury to people or property resulting from any ideas, methods, instructions or products referred to in the content. |
© 2026 by the authors. Licensee MDPI, Basel, Switzerland. This article is an open access article distributed under the terms and conditions of the Creative Commons Attribution (CC BY) license (http://creativecommons.org/licenses/by/4.0/).
Copyright: This open access article is published under a Creative Commons CC BY 4.0 license, which permit the free download, distribution, and reuse, provided that the author and preprint are cited in any reuse.


