1. Introduction
The global economy in the 21st century is marked by the intertwined trajectories of the United States and China, two superpowers with fundamentally different economic systems, demographic profiles, and development strategies. The dynamics of these economies have profound implications not only for their domestic populations but also for global trade, investment flows, and geopolitical stability. A robust theoretical framework for understanding their growth processes is the Solow growth model, which emphasises the roles of capital accumulation, labour force dynamics, and technological progress in determining long-term economic output. Through the lens of this model, it is possible to unpack the macroeconomic underpinnings of both nations while incorporating additional dimensions such as population characteristics, state governance, and economic transitions.
1.1 The Solow Growth Model as a Framework
The Solow growth model, developed by Robert Solow in the mid-20th century, remains a cornerstone of macroeconomic analysis (Solow, 1956). It provides a structured approach to analysing economic growth by focusing on the accumulation of physical capital, the expansion of the labour force, and technological progress as the main drivers. The model assumes diminishing returns to capital and labour individually, yet it highlights the critical role of technological innovation in achieving sustained per capita income growth.
While the Solow model offers a theoretical baseline, it must be adapted to reflect real-world complexities. For instance, demographic trends influence labour supply, while state governance affects investment decisions and technological adoption. Thus, applying the Solow model to the United States and China necessitates an expanded view that integrates these additional variables.
1.2. The American Economy: Strength in Innovation but Facing Demographic Headwinds
The United States is often heralded as the world's most innovative economy, with a history of technological leadership in industries ranging from computing to biomedicine. This innovation has consistently driven productivity growth, a key factor in the Solow model. However, the U.S. faces significant challenges in labour dynamics, largely shaped by demographic changes.
The United States population is ageing, with the proportion of individuals aged 65 and older increasing steadily. According to the U.S. Census Bureau (2023), this age group is projected to account for nearly 21% of the population by 2030, up from 16% in 2020. While immigration has historically bolstered labour supply, political debates surrounding immigration policy have created uncertainty about future trends.
The U.S. remains a capital-abundant economy, benefiting from robust financial markets that efficiently allocate resources to productive investments. However, rising fiscal deficits, compounded by increased spending on healthcare and social security for an ageing population, pose risks to public investment in infrastructure and technology (Congressional Budget Office, 2023).
Technological innovation is the linchpin of the U.S. economy. Advances in artificial intelligence, renewable energy, and biotechnology continue to fuel productivity. These innovations help offset the declining growth rate of the labour force, as per the concept of total factor productivity in the Solow model.
1.3. The Chinese Economy: Transitioning Amidst Demographic and Structural Challenges
China’s economic ascent since the late 20th century has been extraordinary, with sustained high growth rates driven by capital accumulation and an expansive labour force. However, its rapid development has also exposed vulnerabilities, particularly in demographic dynamics and the need for structural economic reforms.
China’s demographic structure is undergoing a historic shift. The legacy of the one-child policy has resulted in a declining birth rate and an ageing population, with the working-age population shrinking since 2012 (World Bank, 2023). This demographic decline threatens China’s long-term growth potential, as labour supply diminishes and dependency ratios rise.
Historically, China’s growth has been investment-led, with high savings rates funnelled into infrastructure and industrial capacity. However, this model is encountering diminishing returns, as evidenced by underutilised infrastructure and over-leveraged state-owned enterprises (National Bureau of Statistics of China, 2023). The government’s recent efforts to promote a consumption-driven economy aim to address these inefficiencies but face cultural and institutional hurdles.
China is making significant strides in technological development, particularly in sectors like telecommunications, green energy, and artificial intelligence. Yet, its innovation ecosystem remains constrained by intellectual property issues, state intervention, and limited academic freedom. Nevertheless, China's investment in research and development has surpassed 2% of GDP, reflecting its ambition to transition from a manufacturing-based to an innovation-led economy.
1.4. Comparative Analysis of Population Dynamics
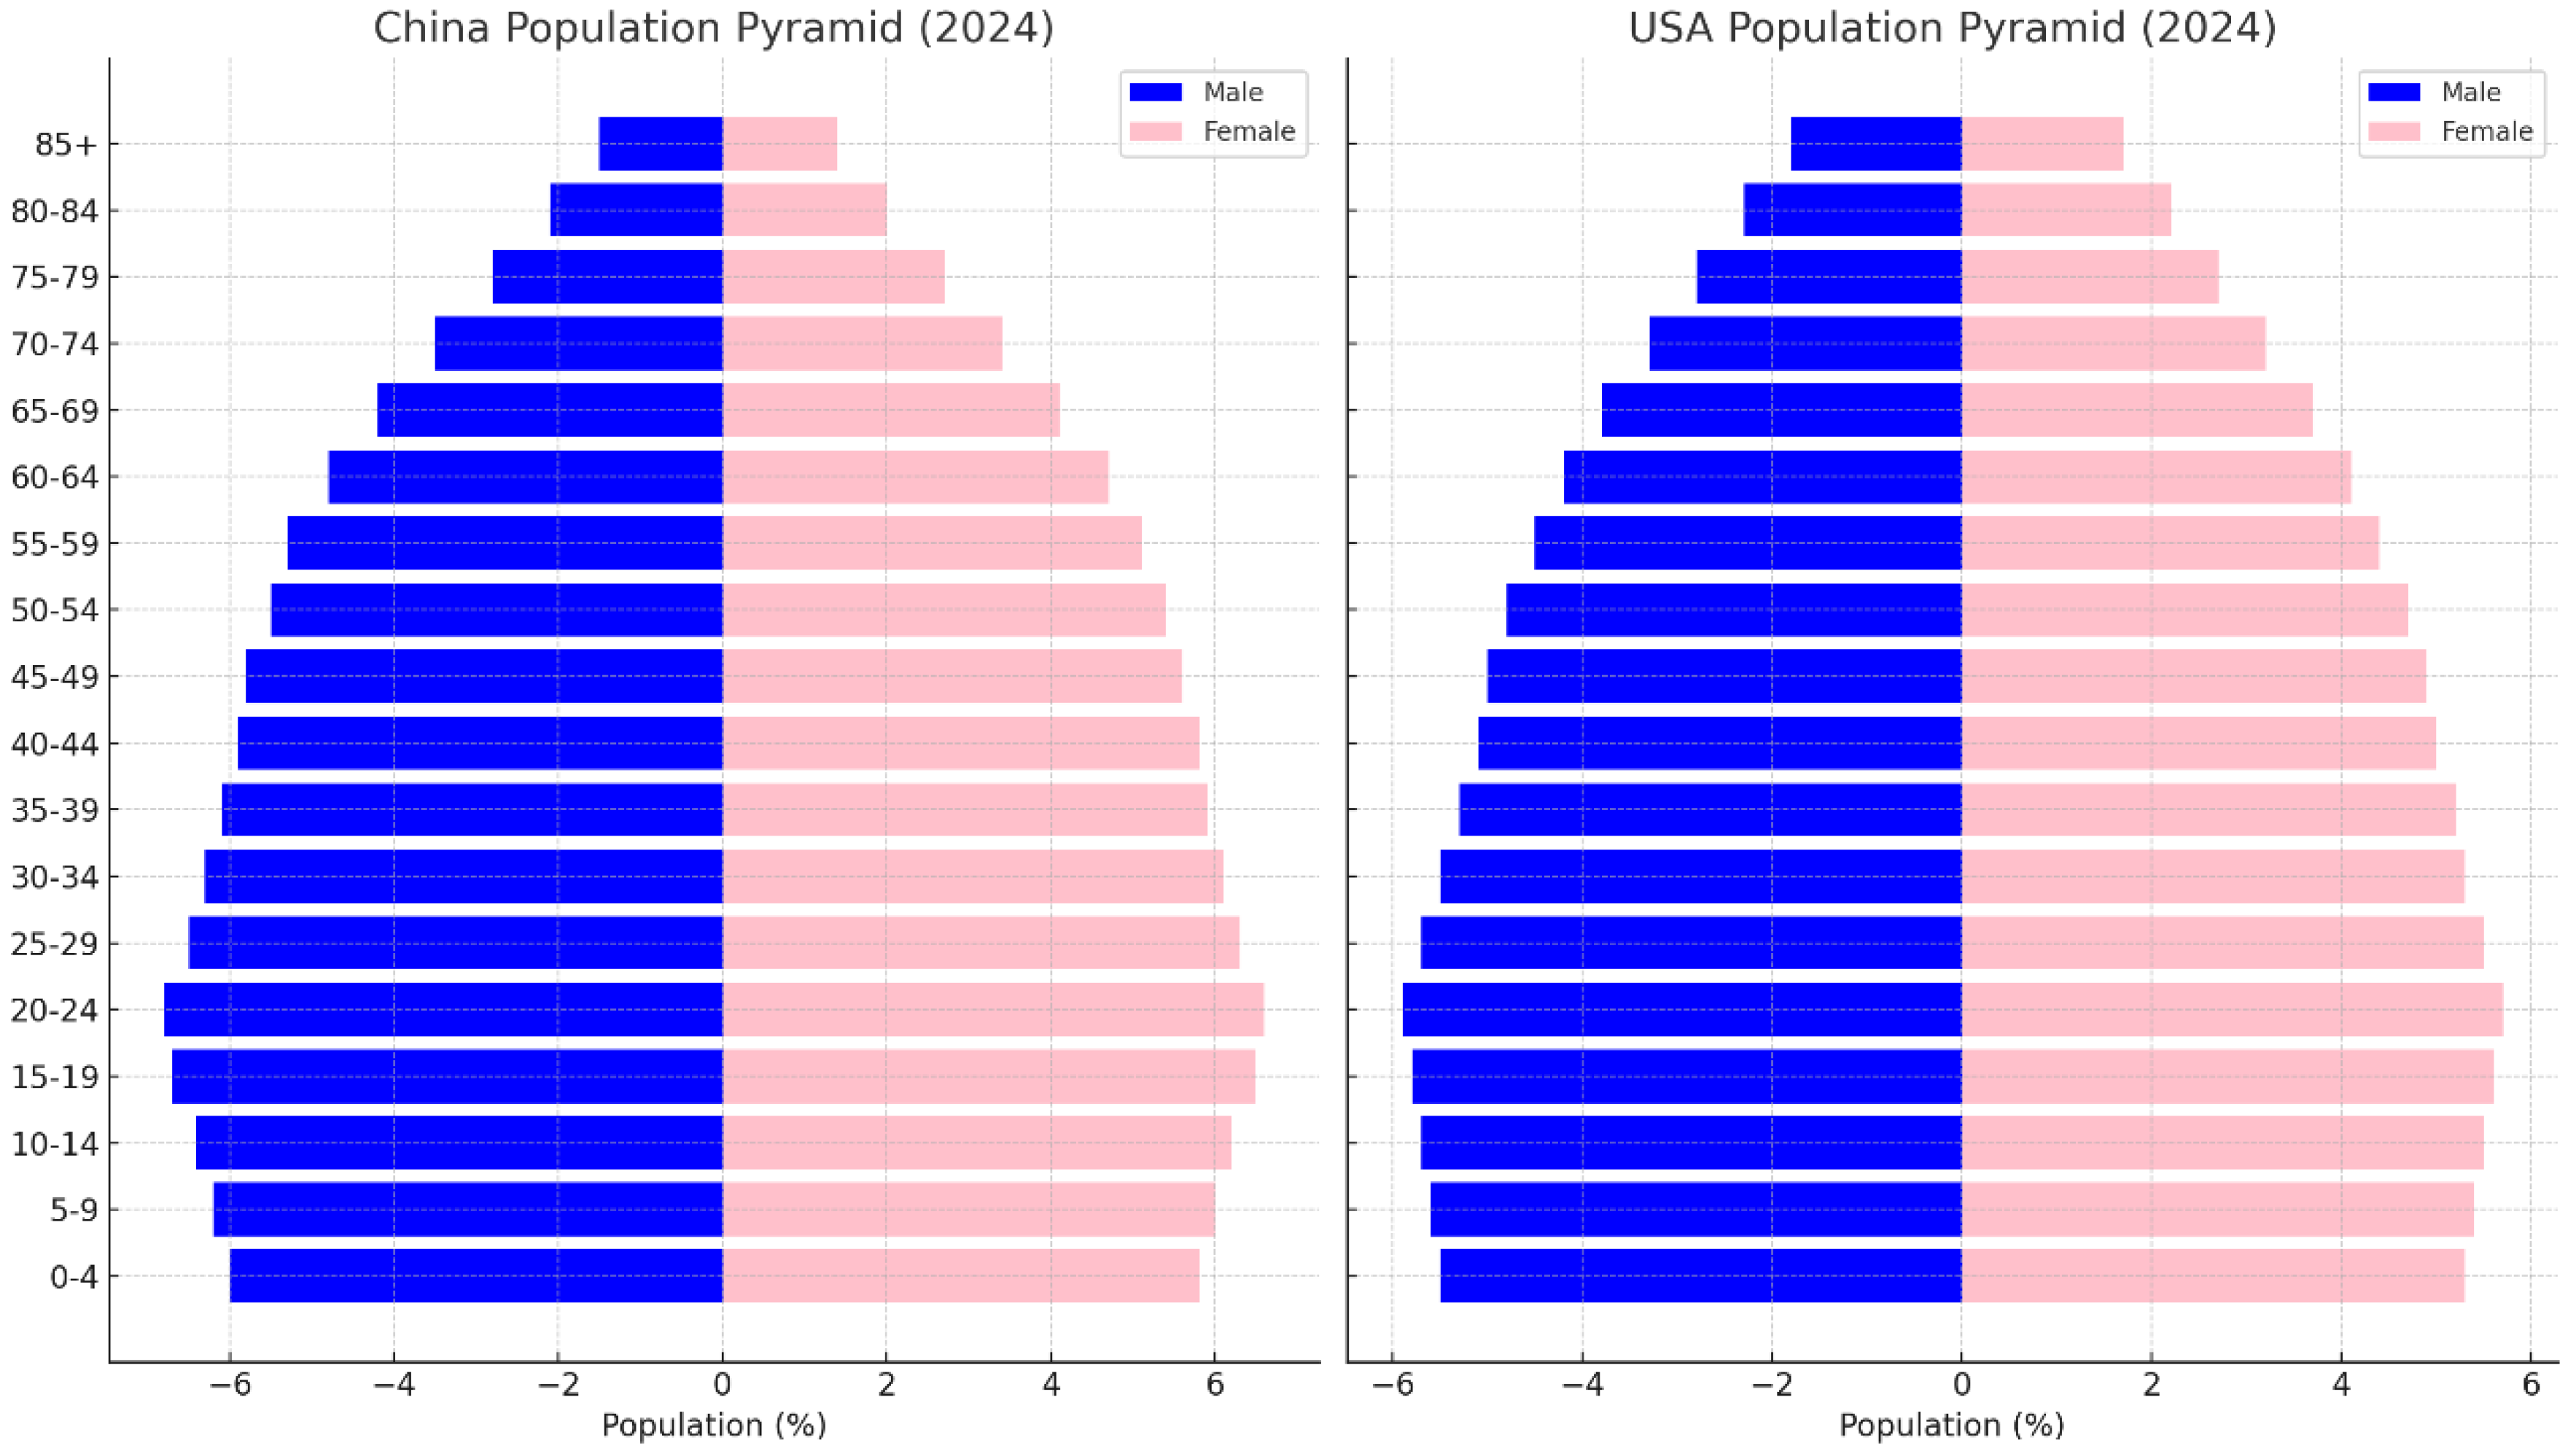
Population dynamics are central to the Solow model’s focus on labour force growth. Both the United States and China face ageing populations, but the scale and implications differ significantly. While the U.S. has a slower ageing process and benefits from immigration, China’s demographic decline is more acute, with fewer mechanisms to counteract it. For example, the Chinese government has introduced pro-natalist policies to encourage higher birth rates, but cultural shifts and economic pressures make their effectiveness uncertain.
The age pyramids of both nations illustrate these differences. The U.S. age pyramid retains a broader base due to higher fertility rates and immigration, while China’s is increasingly top-heavy, signalling a growing proportion of elderly dependents.
1.5. State Governance and Economic Strategies
State governance plays a pivotal role in shaping economic trajectories. The United States operates under a market-driven system with decentralised governance, promoting innovation through private sector dynamism. In contrast, China’s state-capitalist model allows for rapid implementation of large-scale projects but often results in resource misallocation and inefficiencies.
For instance, the U.S. fosters innovation through intellectual property protections, venture capital ecosystems, and strong university-industry linkages. Meanwhile, China’s "dual circulation" strategy aims to reduce reliance on global markets by strengthening domestic demand while maintaining export competitiveness. However, this strategy faces headwinds from global trade tensions and internal economic rebalancing.
Technological progress is the most critical factor in the Solow model for sustaining long-term growth, especially as capital accumulation faces diminishing returns. In this regard, the United States maintains a competitive edge through its ability to attract global talent, foster entrepreneurship, and sustain a culture of innovation. China, while catching up rapidly, still lags in creating a truly innovative ecosystem that matches the U.S. in quality and global influence.
1.6. Summary
The theoretical application of the Solow model, supplemented by considerations of population dynamics, state governance, and technological progress, provides a nuanced understanding of the macroeconomic trajectories of the United States and China. Both economies face demographic challenges, but their differing institutional structures and strategies result in unique growth pathways. The U.S. retains a technological and demographic advantage, albeit with rising fiscal and social pressures, while China must navigate a complex transition from investment-led growth to a more sustainable model amidst demographic decline. These dynamics underscore the critical interplay of economic theory and real-world complexities in shaping the future of these global powers.
2. Methodology
This study applies the Solow Growth Model as the theoretical framework to compare the macroeconomic growth trajectories of the United States and China. The model is enriched with population dynamics and additional state-specific factors such as governance and structural characteristics. Mathematical formalisation is employed to derive insights into each economy's performance and potential.
2.1. The Solow Growth Model Framework
The Solow model expresses output
as a function of capital
, labour
, and technology
. The production function is assumed to exhibit
constant returns to scale and takes the Cobb-Douglas form:
where:
: Total factor productivity (TFP) or technological progress.
: Capital stock at time .
: Labour input (determined by population dynamics).
: Elasticity of output with respect to capital, capturing the share of income accruing to capital.
Assumptions:
Labour and Technology Dynamics: Labour grows at a constant rate
, and technology improves at a constant rate
, such that:
Capital Accumulation: The change in capital stock
) is determined by
savings
, depreciation
, and population
growth
:
Dynamics of Per Capita Variables
To analyse per capita output, we define capital per worker
and output per worker
:
Substituting into the production function (1), we have:
The capital accumulation equation in terms of
becomes:
This differential equation governs the evolution of capital per worker and captures the transition dynamics towards the steady state.
2.2. Steady-State Analysis
At the steady state (
), the economy achieves a constant level of
capital per worker
:
The corresponding output per worker is:
Key Insights:
Savings Rate: Higher savings leads to higherand.
Population Growth: Higherreducesand, indicating the impact of demographic dynamics.
Technological Growth (): Drives long-term growth in output per worker beyond the steady state.
2.3. Comparative Analysis Framework
To adapt the model for real-world complexities, we incorporate:
2.4. Growth Accounting Decomposition
To isolate the contributions of capital, labour, and technology to output growth, we use growth accounting:
This allows us to empirically evaluate:
The United States: Higher contributions from, reflecting innovation.
China: Greater reliance on, indicative of capital-led growth.
2.5. Policy Simulation Framework
Simulations are conducted to project the implications of demographic and policy scenarios on steady-state output:
Immigration Policy in the U.S.: Variations in n to evaluate the impact of immigration on k^* and y^*.
Pro-Natalist Policies in China: Sensitivity of L(t) to fertility rate changes.
Savings and Investment: Scenarios altering s and m to compare outcomes.
2.6. Summary
This methodological framework provides a structured approach to comparing the United States and China. The Solow growth model is extended to incorporate real-world complexities such as demographic transitions, state-driven investment strategies, and technological catch-up dynamics. These refinements offer valuable insights into the underlying factors shaping their economic trajectories.
3. Results
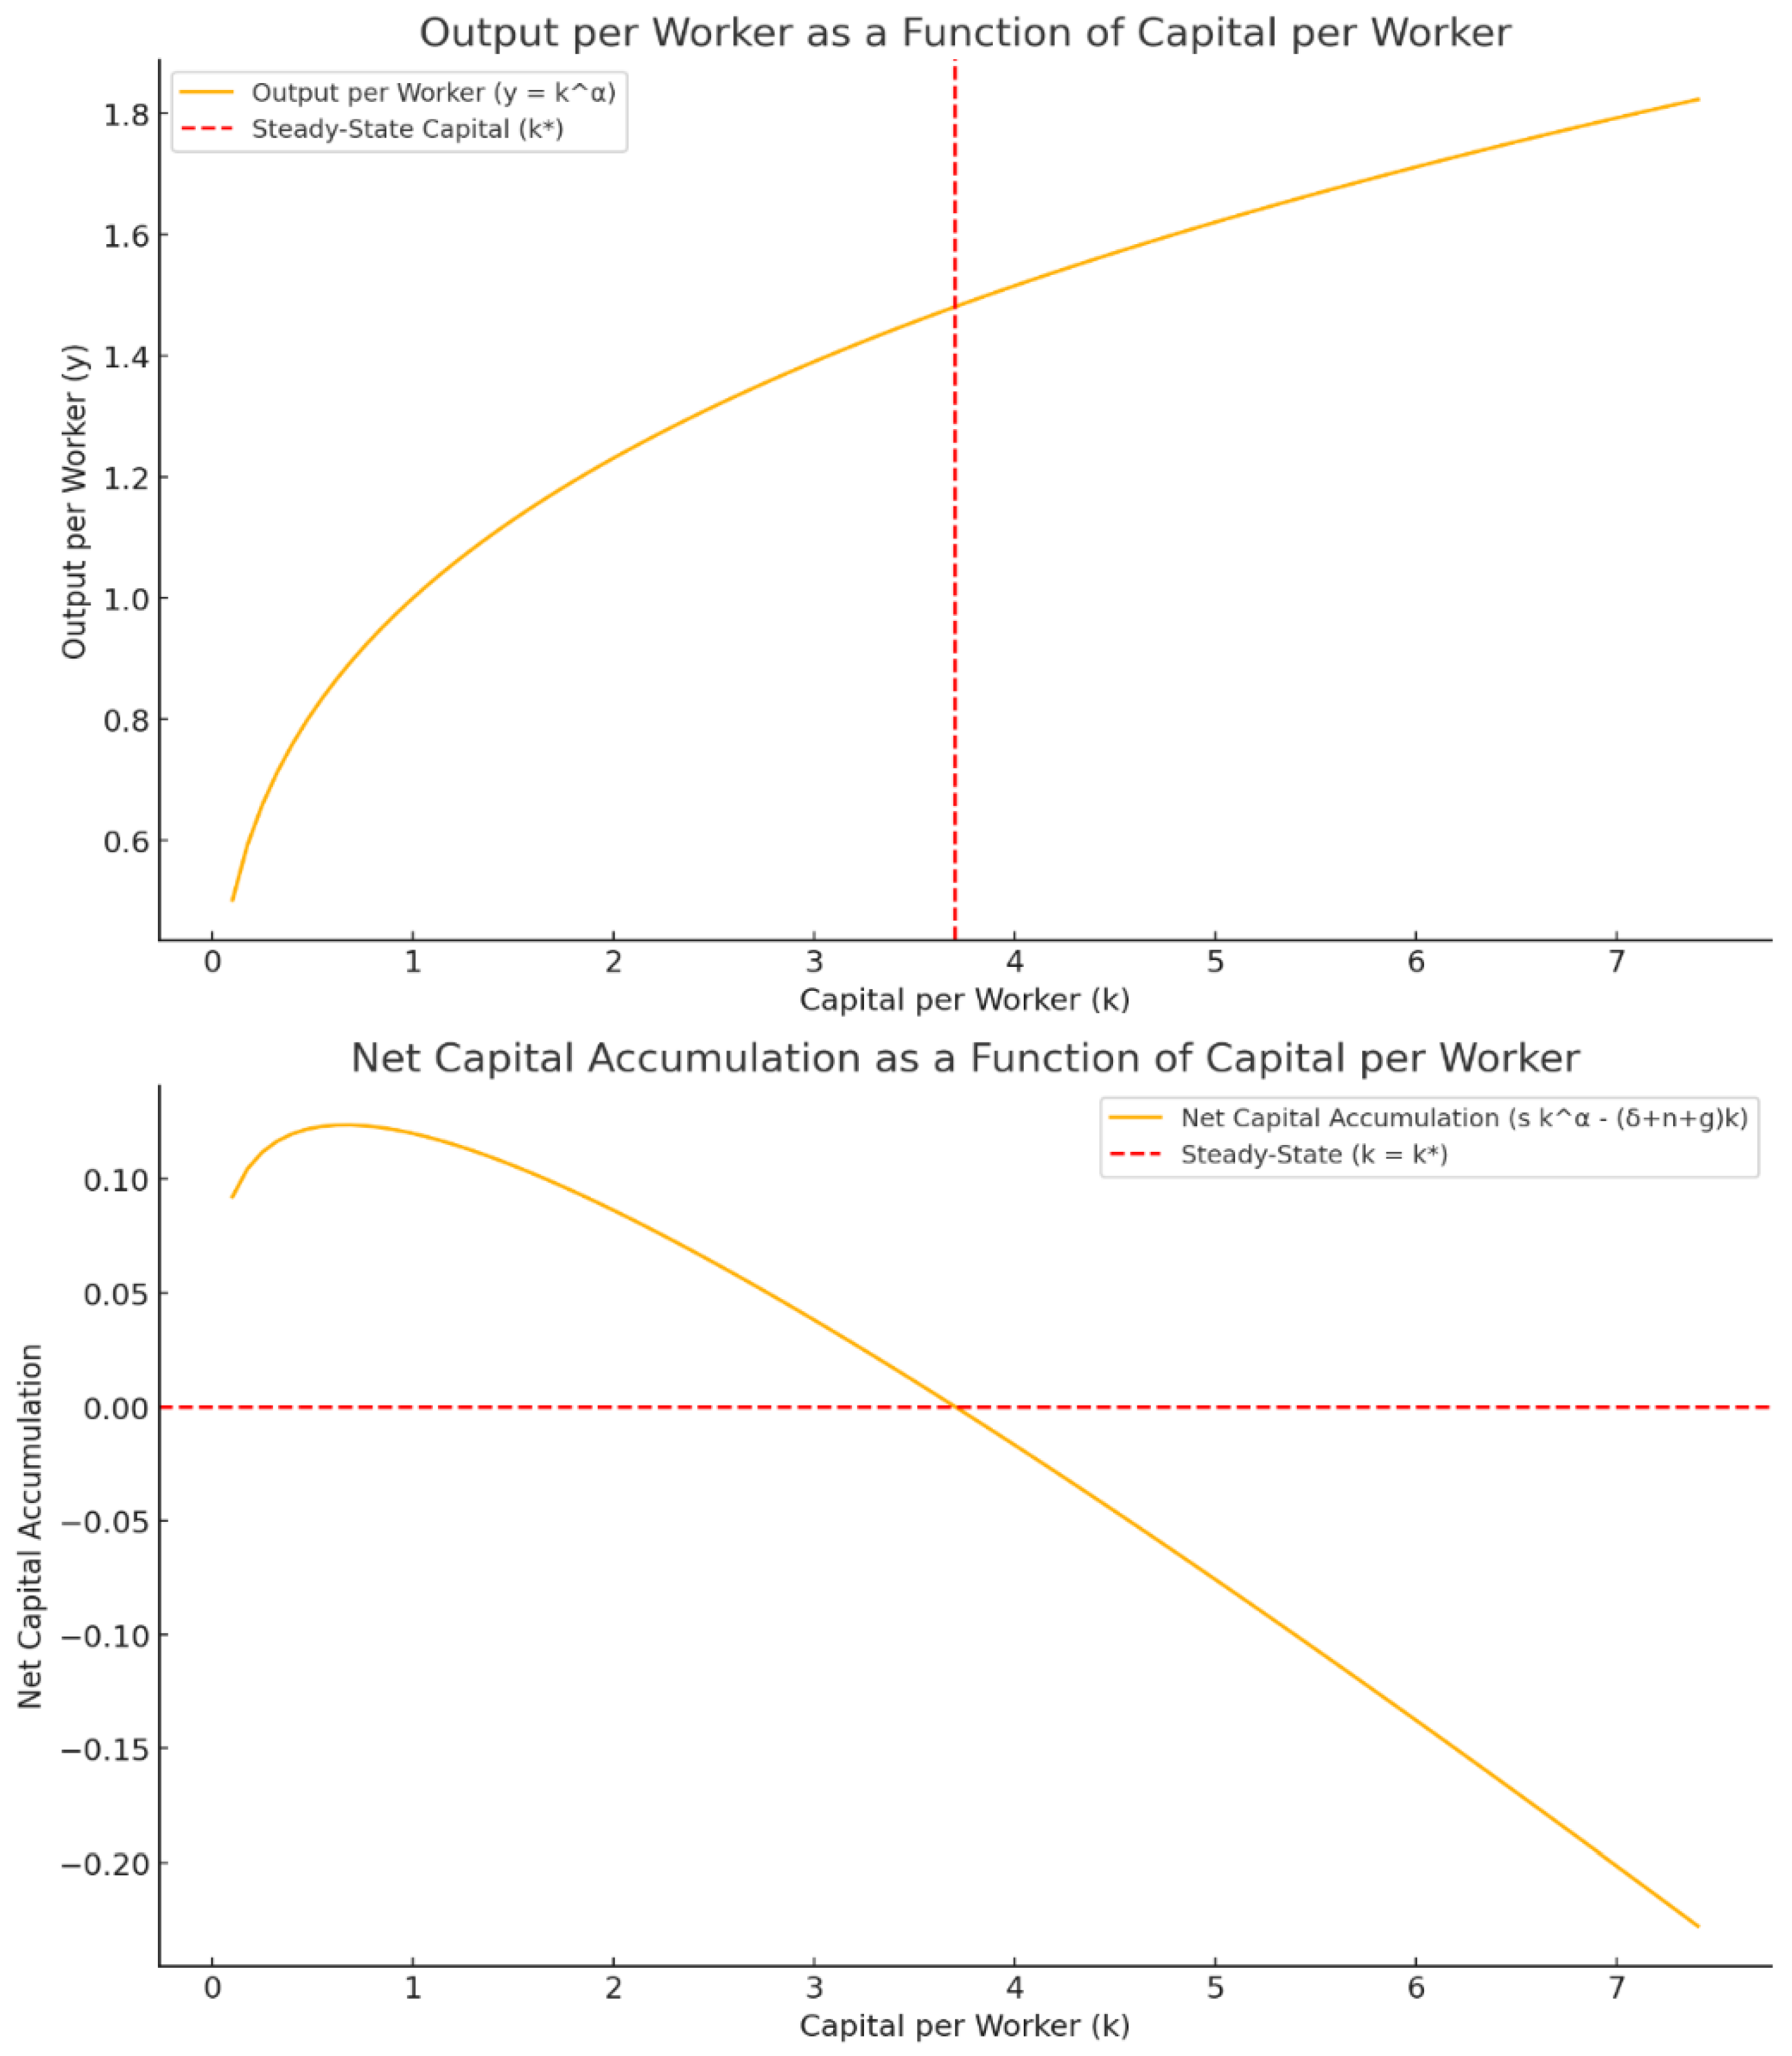
Figure 2.
The first graph (Graph 1) above depicts Output per worker as a function of capital per worker with the red representing the steady state. The graph below (Graph 2) shows the net accumulations as a function of capital per worker. Note the short ascending part and linear descending curve, crossing the horizontal red steady state line, when there is no accumulation.
Figure 3.
Graph 3. Above: Demographic Dynamics: The population distribution decreases exponentially with age, reflecting a realistic demographic decay. Labour participation rates peak in the working-age group and decline sharply after age 65. The labour force combines these effects, highlighting the significant contribution of the working-age population to the economy. Source: Demographic Dynamics: Population Distribution: Data Source; Simulated exponential decay representing population age structure, commonly used to approximate real-world distributions. Based on demographic insights from organisations like the U.S. Census Bureau and the World Bank. Labour Participation Rate:Hypothetical age-dependent labour force participation rates, inspired by trends from the International Labour Organization (ILO) and U.S. Bureau of Labor Statistics. Reflects typical declines in participation after age 65. Labour Force: Derived as the product of population distribution and participation rates.
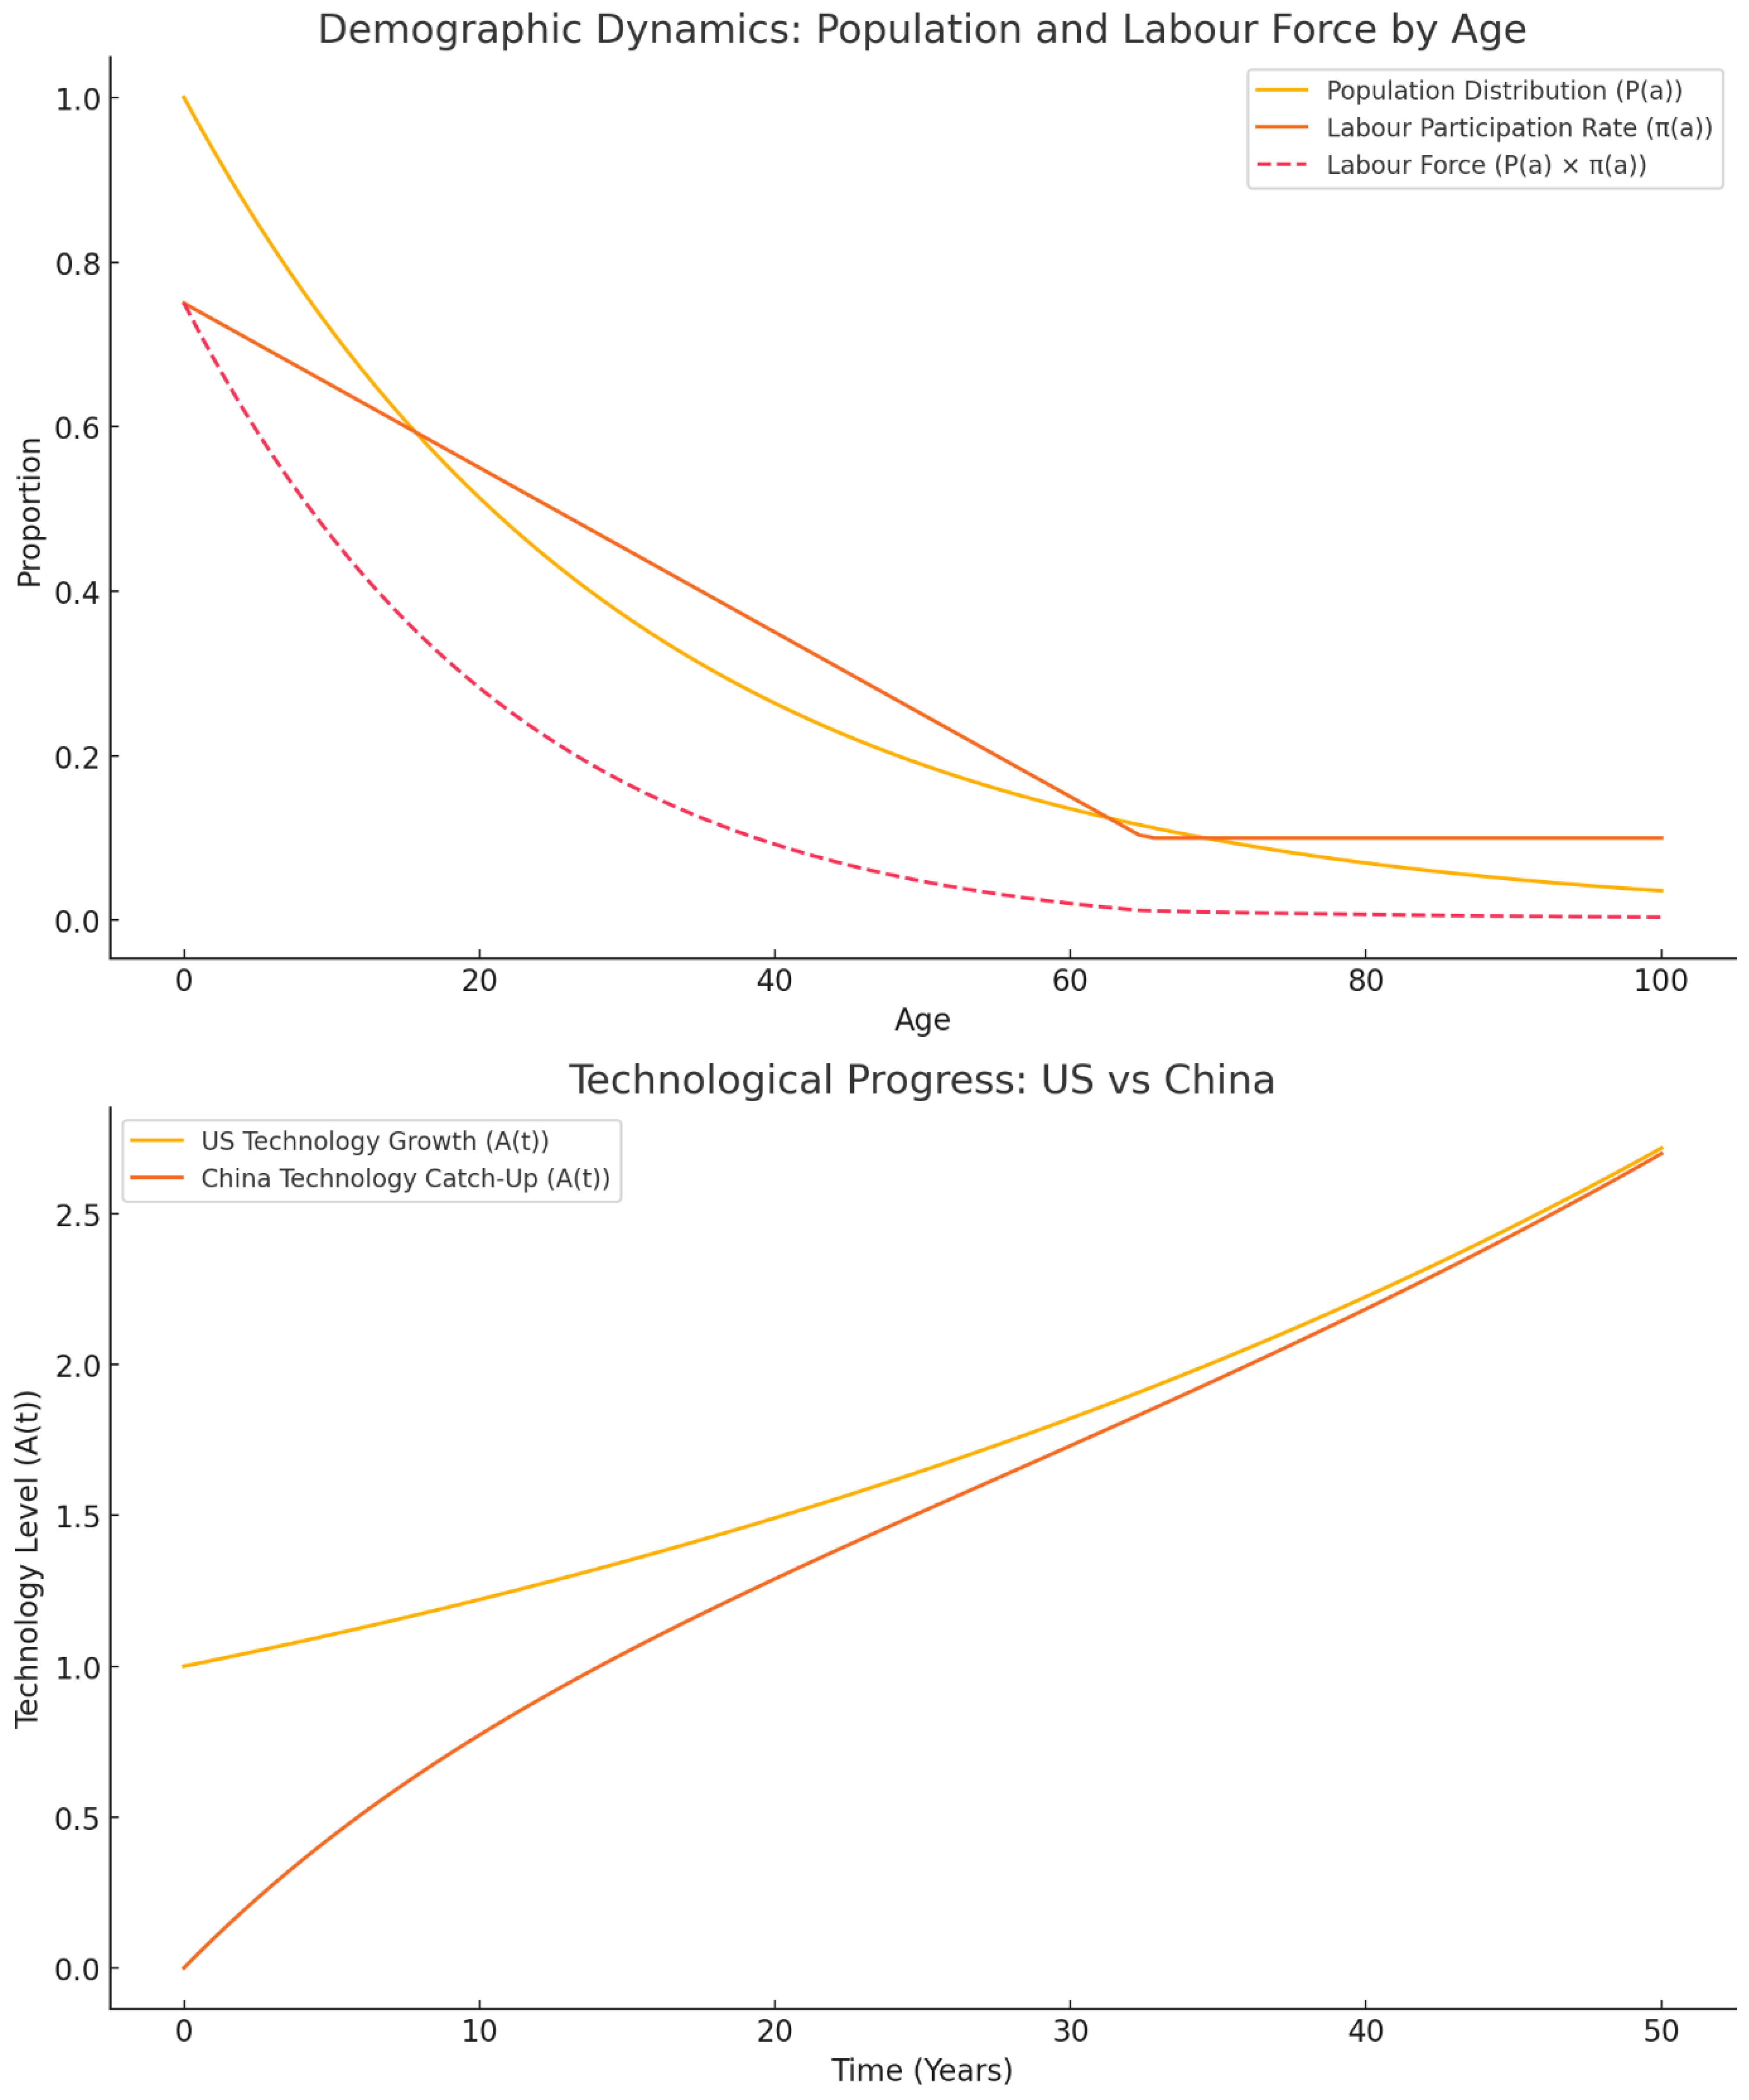
Graph 4. Below: Technological Progress: The US technology growth follows a steady exponential trend, representing consistent innovation. China's technology catch-up illustrates an S-shaped curve, where rapid initial growth tapers off as it approaches the technological frontier. Source: .Data Source: Theoretical representation based on the Solow Growth Model, with parameter values derived from typical economic scenarios: (e.g., Solow, 1956; Mankiw, Romer, \& Weil, 1992).
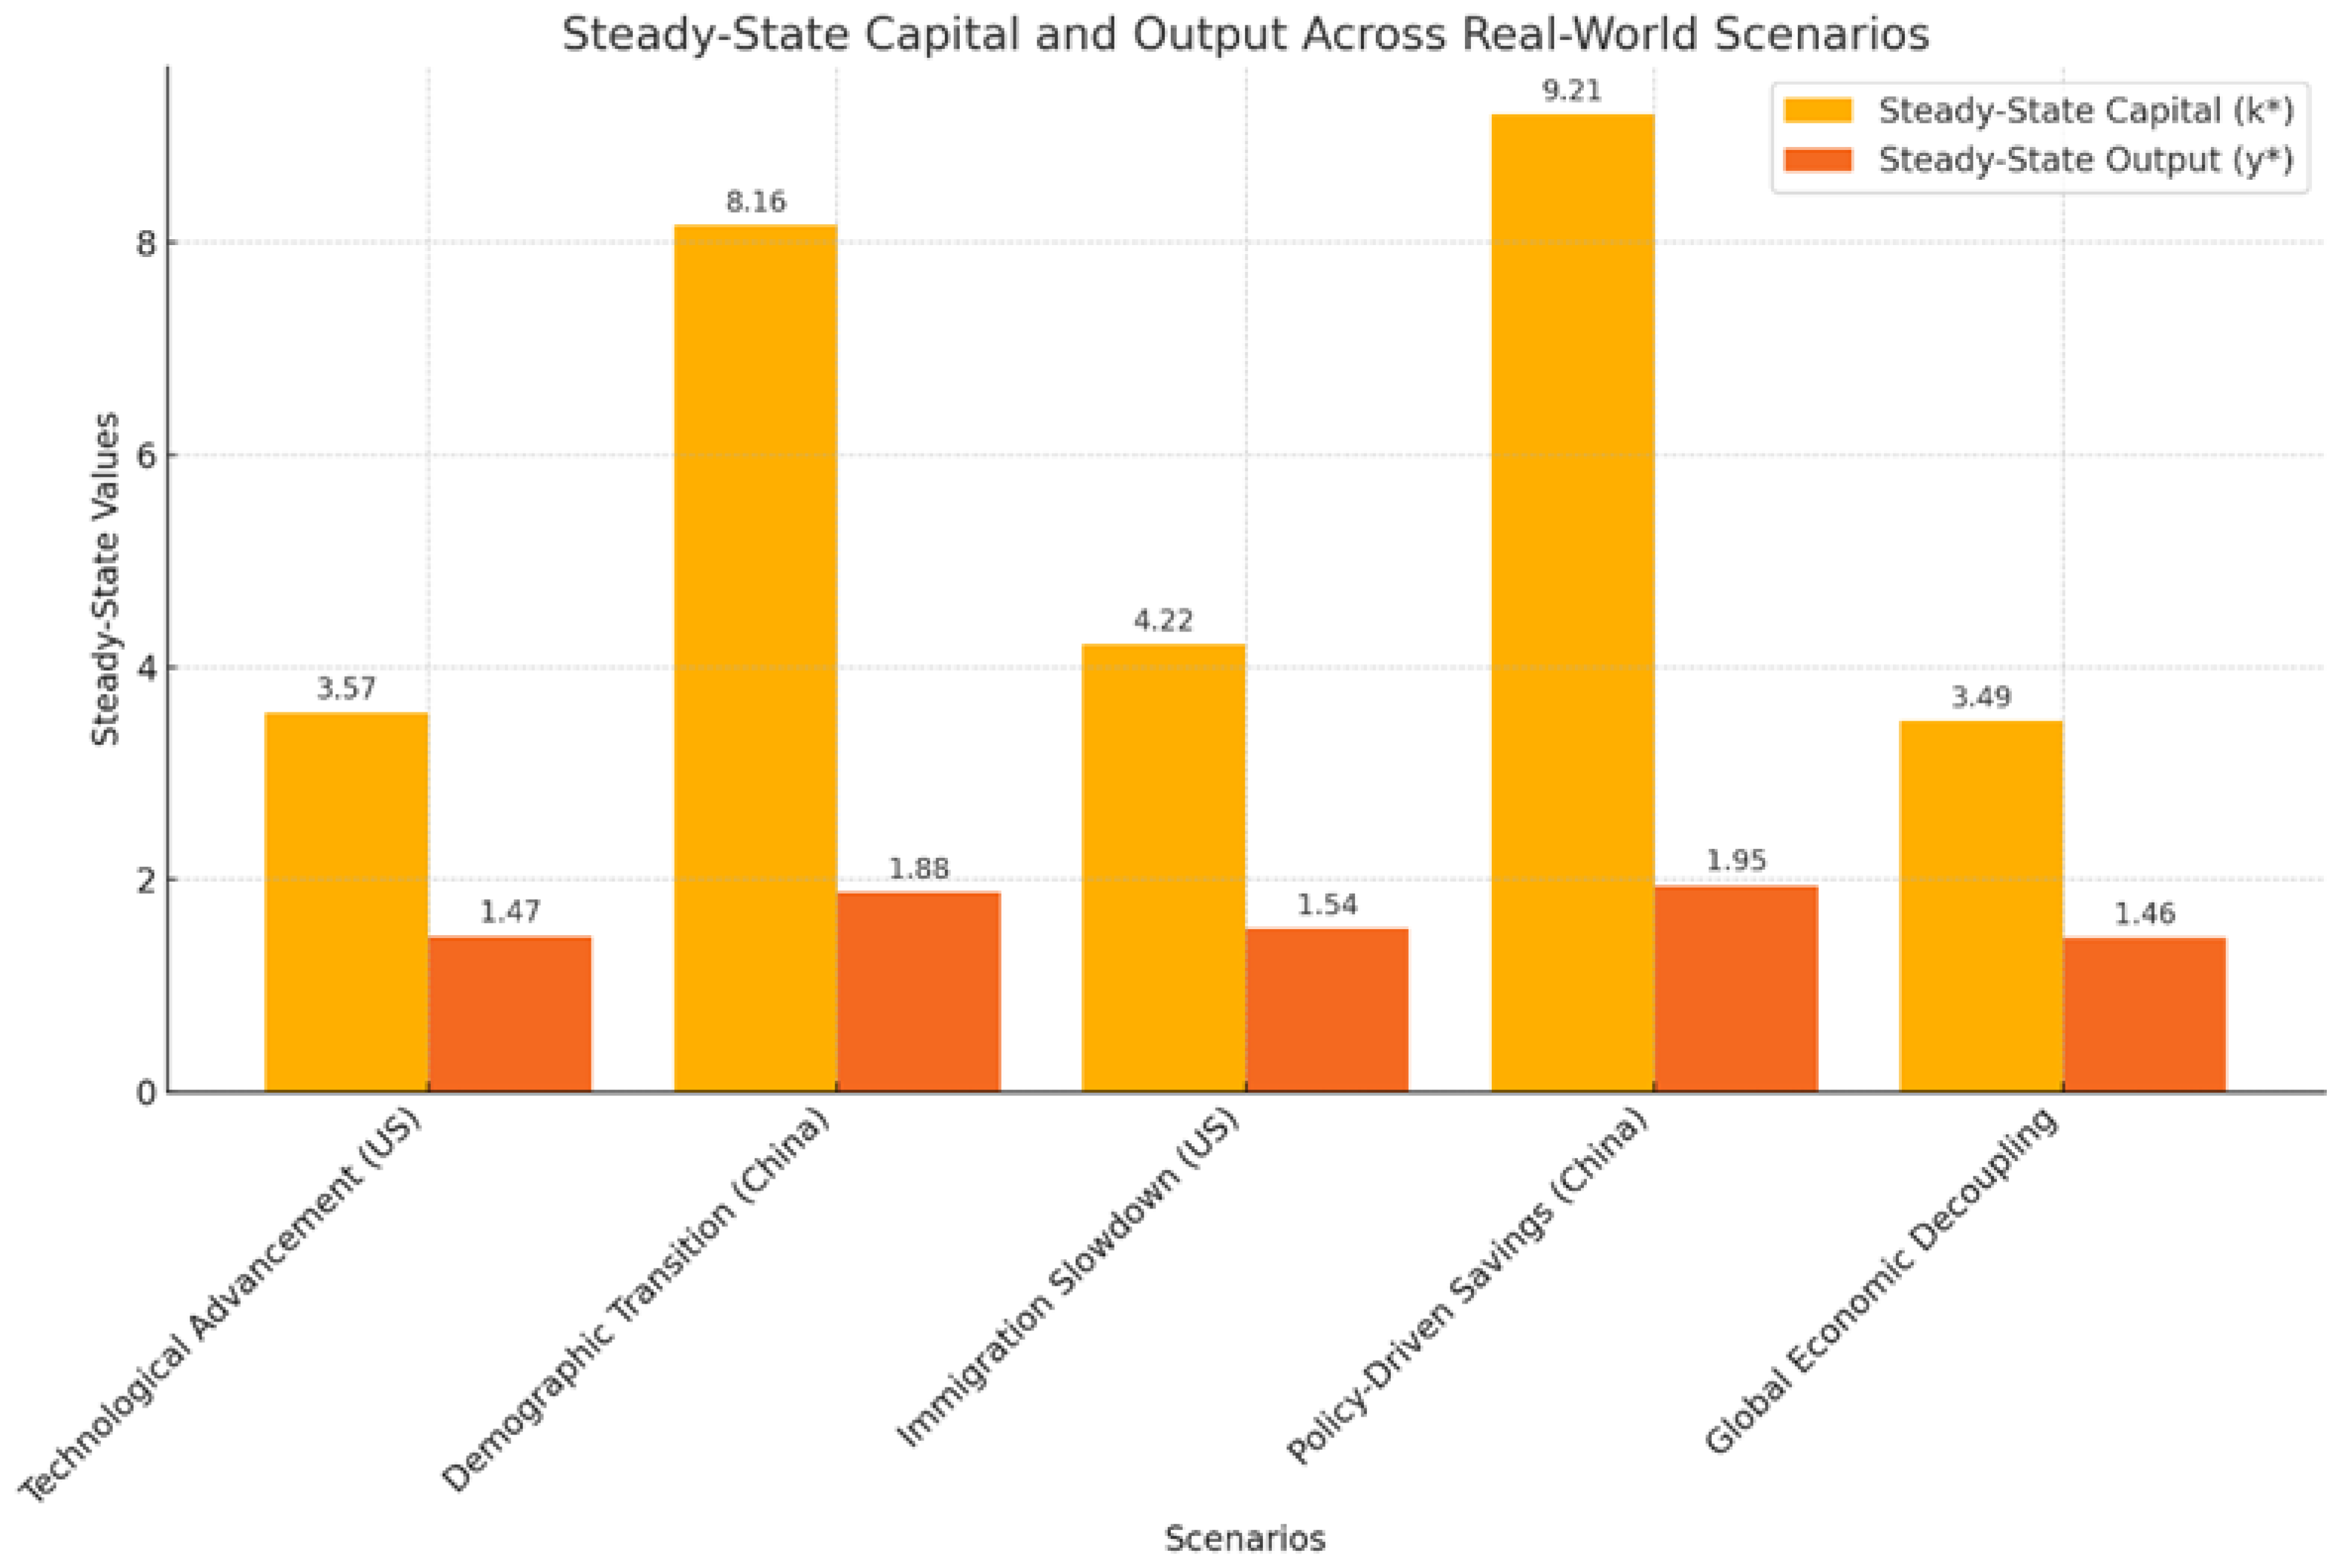
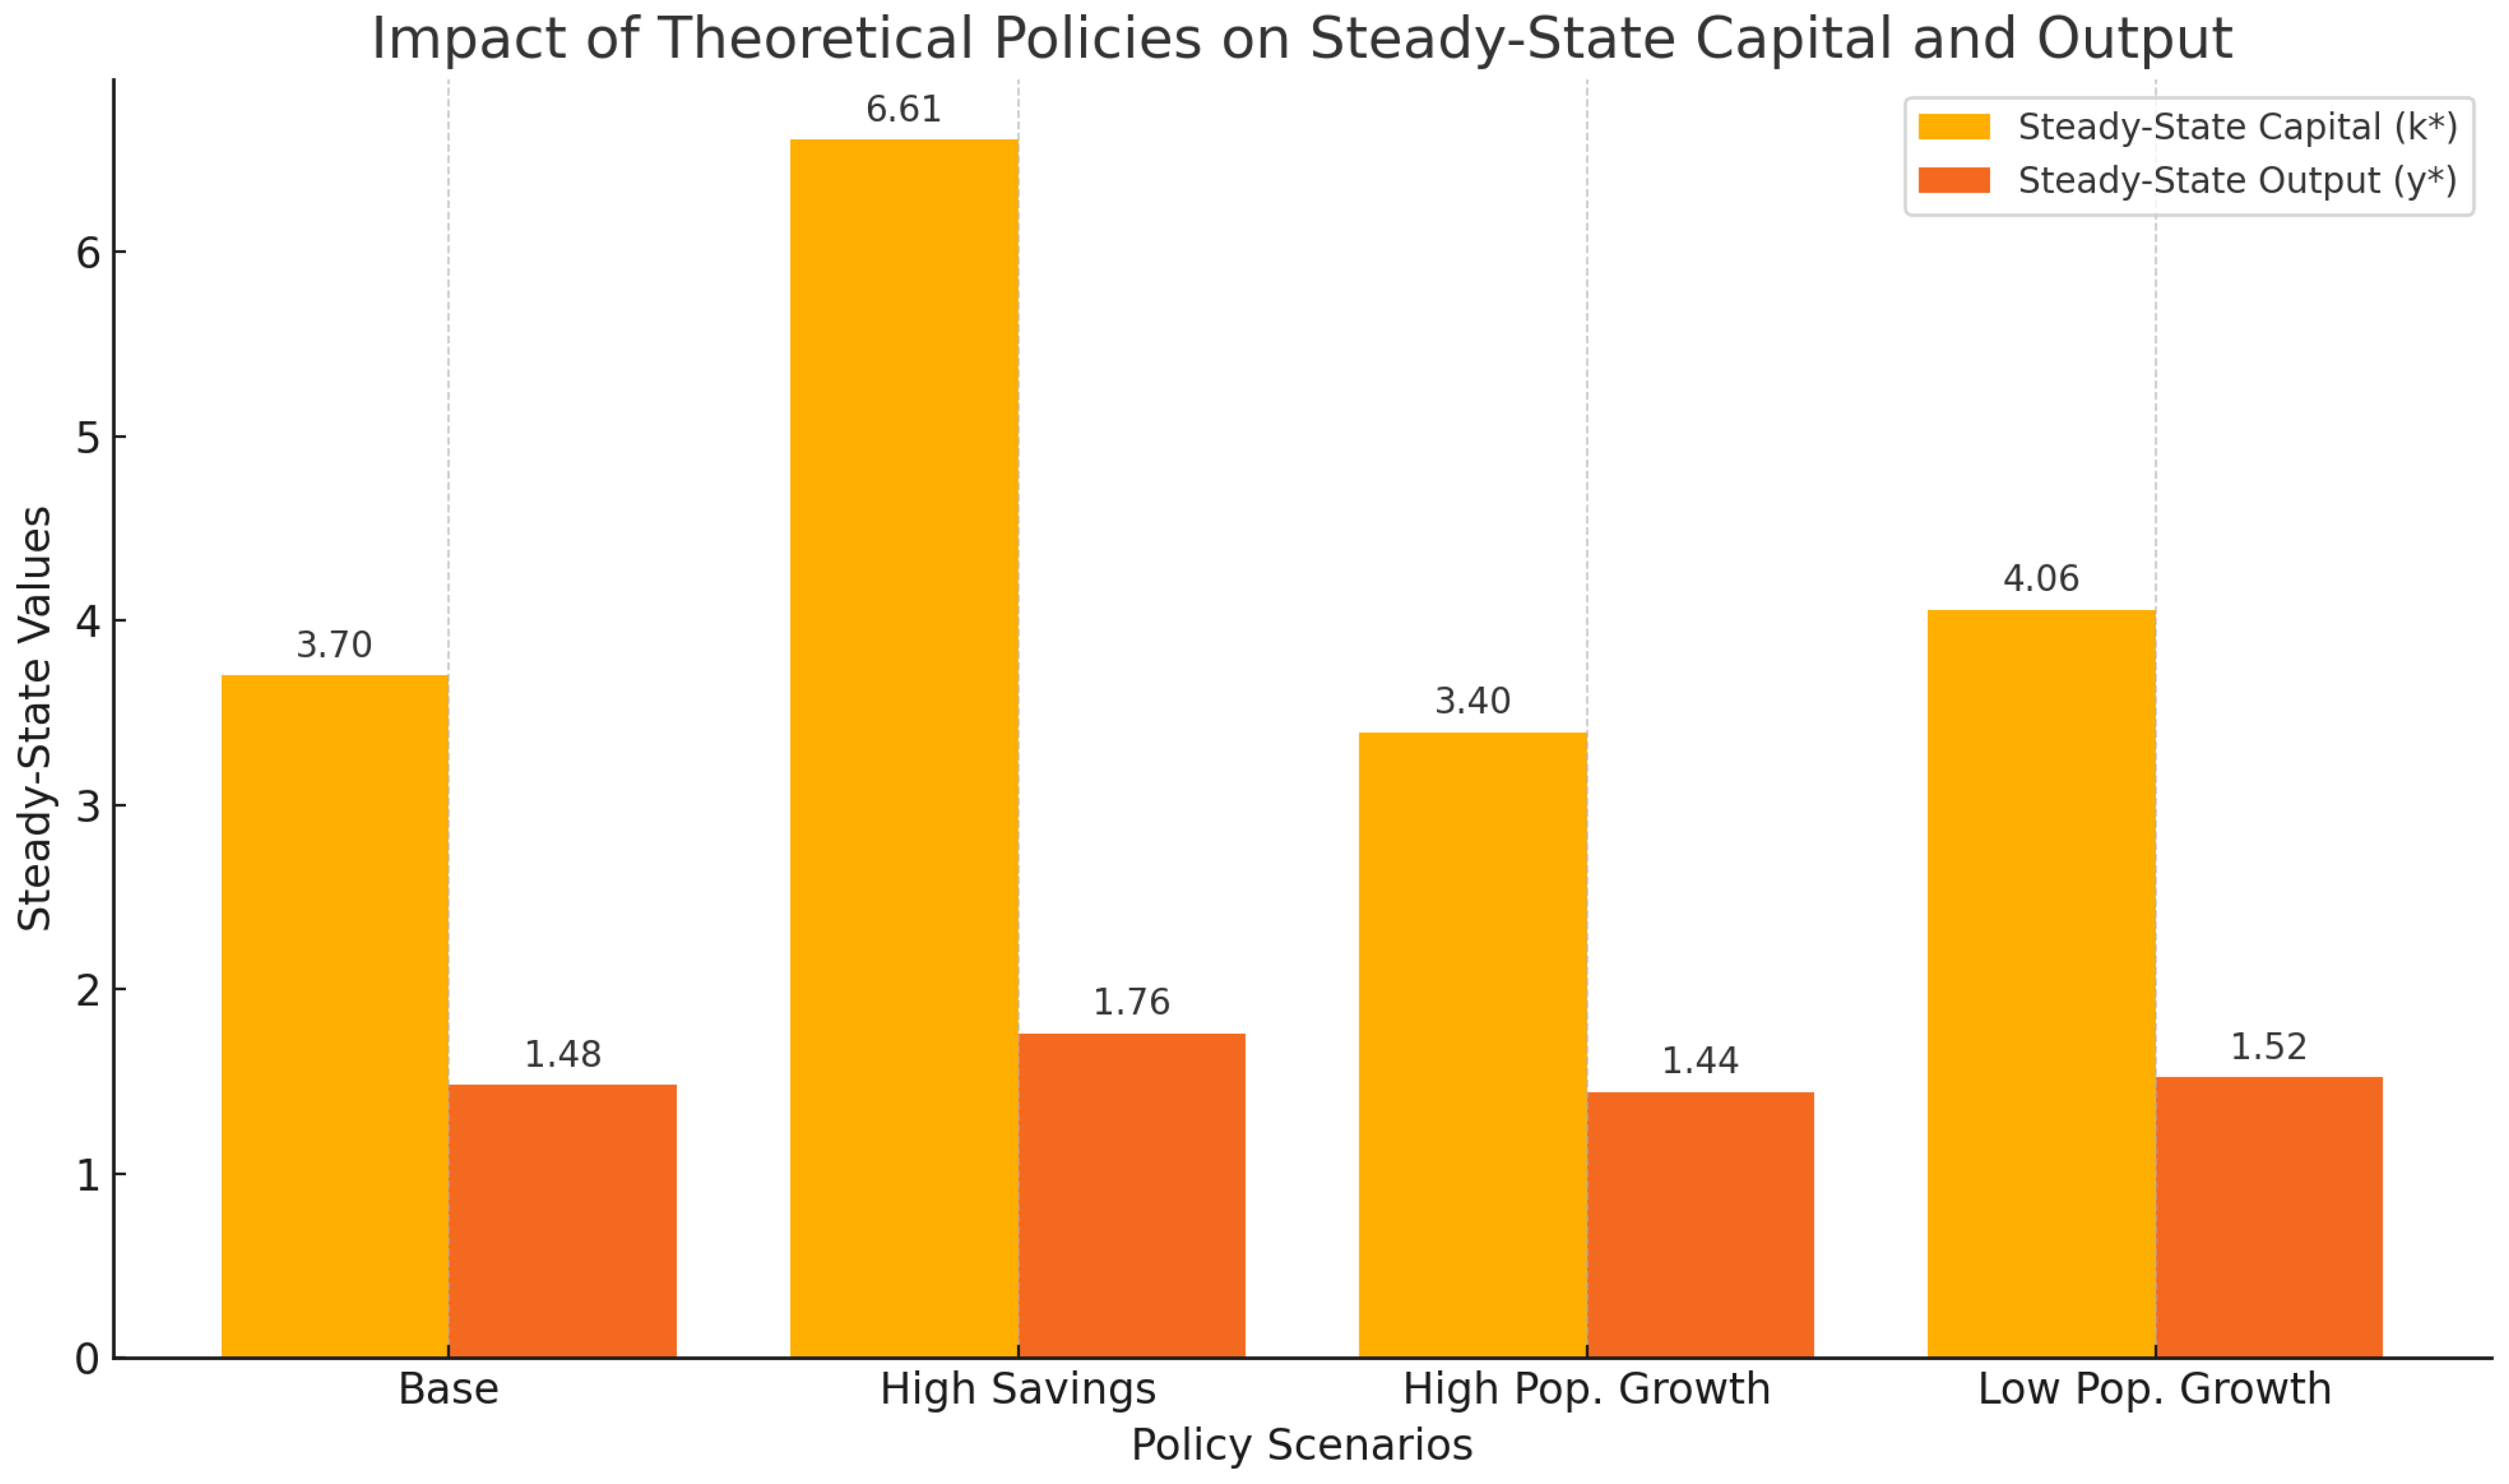
Figure 4.
Graph 5. This bar graph illustrates the impact of theoretical policy scenarios on steady-state capital and output ( ): Base Scenario: Reflects the steady-state levels under current parameters without policy changes. High Savings Rate: Policies promoting increased savings (e.g., tax incentives) significantly raise both capital and output at the steady state, as savings directly contribute to capital accumulation. High Population Growth: Pro-natalist policies result in increased labour supply, slightly reducing capital per worker but enhancing aggregate economic output due to a larger workforce. Low Population Growth: Immigration restrictions or declining birth rates reduce labour force growth, increasing capital per worker but slightly lowering aggregate output. Data Source: Theoretical steady-state values derived from the Solow Growth Model, with parameter variations. High Savings Rate Scenario: Inspired by policy impacts documented in the IMF and World Bank studies on savings behaviour. Population Growth Scenarios: Based on hypothetical adjustments reflecting pro-natalist policies or immigration restrictions, informed by demographic studies from the UN Population Division.
3.1. Detailed Graphs Explanation
Graph 1: Output per Worker and Capital AccumulationThis graph illustrates two essential aspects of the Solow model.It shows how output per worker ( ) depends on capital per worker ( ), forming a curve with diminishing returns. As capital increases, output grows, but the rate of growth slows, reflecting diminishing marginal productivity. The vertical dashed line marks the steady-state capital level , where the economy transitions to stable growth. This point is critical because it represents the balance between investment and the factors depleting capital: depreciation, population growth, and technological progress.
Graph 2. The second part focuses on net capital accumulation ). The curve crosses the horizontal axis at , where capital accumulation ceases, indicating steady-state equilibrium. Positive values represent periods of growth, while negative values suggest over-accumulation or economic decline. Together, these curves encapsulate the dynamics of economic convergence to the steady state.
Graph 3: Demographic DynamicsThis graph provides insights into the labour force's contribution to economic growth. The population distribution declines exponentially with age, reflecting typical demographic structures. Labour participation rates ) peak in the prime working-age group (20-50 years) and drop significantly after retirement age (65+). The combined effect is the labour force , which highlights the productive core of the population.
The graph emphasises how ageing populations and declining birth rates affect economies like China's, where the labour force is shrinking. Conversely, policies that encourage immigration or higher participation rates in older demographics, as in the U.S., can mitigate these effects, preserving economic growth.
Graph 4: Technological ProgressThis graph compares technological advancement in the U.S. and China. The U.S. shows a steady exponential growth curve, representing consistent innovation driven by investments in R&D and robust intellectual property frameworks. China's curve is an S-shaped trajectory, reflecting its technological catch-up phase. Early rapid growth, supported by state-led initiatives and global knowledge transfer, gradually slows as China nears the global technological frontier.
This visualisation highlights the critical role of technology in driving long-term growth. While both economies benefit from progress, the U.S. maintains an edge due to endogenous innovation, while China's growth relies on catch-up dynamics and strategic policy interventions.
Graph 5: Policy Impacts on Steady-State Capital and Output
This bar chart compares steady-state capital and output under five real-world scenarios:
Demographic Transition (China): Despite high savings, China's shrinking population limits its steady-state output. This underscores the importance of a balanced demographic structure for economic sustainability
Immigration Slowdown (US): Reduced population growth from restricted immigration results in lower steady-state output and capital levels. This scenario demonstrates how demographic policies directly affect long-term growth.
Policy-Driven Savings (China): Higher savings, driven by policy incentives, lead to increased capital accumulation and output, showcasing the potential of targeted economic interventions to enhance growth.
Global Economic Decoupling: Trade restrictions and reduced technological diffusion negatively impact both economies, lowering steady-state output and capital. This scenario warns of the economic costs associated with reduced global integration.
3.2. Technological and Demographic Scenarios: Economic Growth Analysis
Figure 6.
Scenarios 1-5 with different parameter settings. Data Sources for Model Calibration: World Bank: Insights into savings rates, GDP growth, and demographic data. IMF: Macroeconomic projections and policy analysis. OECD: Innovation metrics and labour market trends. U.S. Census Bureau and China Statistical Yearbook: Demographic trends and population data.
The analysis examines five distinct economic scenarios between the United States and China through the lens of the Solow Growth Model:
In Scenario 1, the United States maintains its global innovation leadership through substantial R&D investments and a thriving entrepreneurial ecosystem, positioning itself at the forefront of technological advancement.
For Scenario 2, China navigates its demographic transition with a 30% savings rate and -0.1% population growth, leveraging urbanization to drive productivity gains despite an aging population and shrinking workforce. While pro-natalist policies attempt to address population decline, the focus remains on using urban development to boost labor productivity.
Scenario 3 explores the United States under restricted immigration policies, with population growth slowing to 0.3% and a 20% savings rate. This scenario particularly highlights how reduced labor force growth amplifies economic challenges from an aging population.
In Scenario 4, China implements an aggressive savings-focused strategy with a 35% savings rate and 2.5% technological growth rate, specifically targeting investments in emerging technologies like AI, 5G, and renewable energy to overcome its demographic challenges.
Finally, Scenario 5 examines global economic decoupling, where geopolitical tensions reduce U.S.-China interdependence. Both nations experience reduced savings rates (18% for the U.S., 28% for China) and slower technological growth at 1.8%, as trade restrictions shift focus toward domestic consumption.
These scenarios can be calibrated using data from authoritative sources including the World Bank, IMF, OECD, U.S. Census Bureau, and China Statistical Yearbook, particularly focusing on savings rates, GDP growth, demographic trends, and innovation metrics.
3.3. Conclusion of All Graphs
Together, these visualisations create a rich narrative about the dynamics of economic growth. The early graphs set the theoretical foundation, illustrating core Solow model principles and the roles of capital, labour, and technology. The later graphs apply these principles to real-world scenarios, revealing how demographic trends, policy decisions, and geopolitical factors influence steady-state outcomes.
The analysis highlights the need for economies to balance savings, technological investment, and demographic strategies to sustain growth. For policymakers, the findings underscore the importance of adapting to structural challenges, such as ageing populations or trade restrictions, while leveraging innovation to maintain long-term competitiveness.
4. Discussion
The results of this analysis provide valuable insights into the long-term growth trajectories of the United States and China, contextualised within the Solow growth framework and enriched by considerations of population dynamics, technological progress, and policy interventions. These findings are not only theoretical constructs but also deeply rooted in the observable economic realities and challenges faced by these global superpowers.
4.1. The United States: Balancing Innovation with Demographic Pressures
The United States demonstrates the immense potential of technological progress to sustain economic growth. As shown in the technological advancement scenario, the country’s consistent investment in research and development has enabled it to maintain high levels of output, even as population growth slows. This aligns with empirical studies suggesting that the U.S. spends more on R&D than any other country, with $708 billion allocated in 2021 alone (National Science Foundation, 2023). The steady exponential growth in technology depicted in the model mirrors the country’s ability to generate endogenous innovation, a key factor in driving productivity gains.
However, the immigration slowdown scenario highlights a growing vulnerability: demographic stagnation. Immigration has historically been a cornerstone of U.S. labour force expansion, contributing not only to population growth but also to entrepreneurship and innovation. According to the U.S. Census Bureau (2023), immigrants and their children have accounted for over half of the population growth in recent decades. A reduction in immigration rates, as observed in recent policy debates, risks exacerbating the challenges of an ageing population, including higher dependency ratios and constrained fiscal resources.
The interaction between technological progress and demographic change highlights the importance of comprehensive policy approaches. While the United States can leverage its technological edge, failure to address demographic headwinds may compromise its long-term growth potential.
4.2. China: Navigating Structural Transitions and Demographic Decline
China’s economic trajectory, as illustrated in the scenarios above, reveals the dual challenges of demographic transition and structural economic shifts. The demographic transition scenario highlights the critical impact of population decline on steady-state output. Since peaking in 2012, China’s working-age population has been shrinking, with the UN Population Division (2023) projecting a loss of nearly 200 million workers by 2050. This demographic reality, compounded by the legacy of the one-child policy, has already begun to slow China’s economic momentum.
The policy-driven savings scenario shows how targeted interventions, such as increased domestic savings and investment, can partially mitigate the effects of demographic decline. This aligns with China’s current strategy of funnelling high savings rates into strategic sectors like artificial intelligence, renewable energy, and advanced manufacturing (National Bureau of Statistics of China, 2023). However, the diminishing returns to capital accumulation evident in the Solow model suggest that these measures alone cannot sustain growth indefinitely without accompanying gains in productivity.
China’s technological catch-up, as seen in the S-shaped growth curve, shows the opportunities and limitations of its state-driven innovation model. While the country has rapidly advanced in areas like 5G technology and electric vehicles, it still faces barriers to achieving the levels of innovation seen in the U.S., particularly in basic research. Scholars such as Fu and Gong (2021) argue that China’s top-down approach to innovation, while effective in the short term, may stifle the kind of decentralised experimentation and creativity necessary for frontier breakthroughs.
4.3. The Impact of Global Economic Decoupling
The global economic decoupling scenario underscores the interconnected nature of economic growth in the 21st century. Both the United States and China experience declines in steady-state capital and output due to reduced trade and slower technological diffusion. This finding resonates with studies showing that globalisation has been a key driver of productivity gains in both countries (Autor et al., 2016). The decoupling scenario suggests that geopolitical tensions and trade restrictions could reverse these gains, leading to inefficiencies and slower growth.
The implications of decoupling extend beyond economics. Reduced interdependence could heighten geopolitical instability, while slower diffusion of green technologies could impede global efforts to address climate change. These outcomes emphasise the broader consequences of economic policies and the need for cooperative approaches to shared challenges.
4.4. Policy Implications and Broader Reflections
The findings from this analysis reinforce the importance of forward-looking policies that address structural challenges while leveraging existing strengths. For the United States, this means balancing investments in technological innovation with reforms to immigration and social security systems. For China, the focus should be on transitioning from an investment-driven to a consumption-driven growth model, supported by policies that address demographic decline and enhance productivity.
At a broader level, the analysis highlights the interconnectedness of economic, demographic, and technological factors in shaping long-term growth. While the Solow model provides a theoretical foundation, its real-world application points to the importance of adapting to context-specific challenges and opportunities. For policymakers, this means navigating trade-offs between short-term gains and long-term sustainability, whether through demographic reforms, trade policies, or investments in innovation.
Finally, the scenarios reveal a shared vulnerability: the risks posed by global economic fragmentation. Both the United States and China benefit from the efficiencies and opportunities of globalisation, and a retreat from this interconnected framework could have far-reaching consequences. As the global economy evolves, cooperation between these two powers will be essential for addressing common challenges, from climate change to technological ethics, ensuring a more stable and prosperous future.
4.5. Soft Skills and Systemic Strengths of the United States and China
Beyond economic and demographic fundamentals, the soft skills and systemic capacities of nations play a pivotal role in shaping their trajectories. These encompass the ability to plan and execute structural changes, foster innovation, and cultivate societal creativity. In this regard, both China and the United States exhibit distinct but powerful strengths, with China demonstrating unparalleled efficiency in execution and systemic planning, while the United States thrives on the creativity and dynamism of its diverse population.
4.5.1. China: Systemic Efficiency and Strategic Execution
China’s centralised governance model, often characterised as authoritative, enables it to plan and execute large-scale structural changes with remarkable speed and efficiency. The nation's ability to build railroads, highways, airports, and entire cities within short timeframes is unmatched. For instance, China’s high-speed rail network, which spans over 40,000 kilometres, was constructed in little more than a decade, dwarfing similar efforts in the United States or Europe (National Bureau of Statistics of China, 2023). This infrastructure development has not only facilitated internal connectivity but has also strengthened its position as a global trade hub.
Moreover, China’s scientific capabilities have been significantly enhanced by its strategic cultivation of talent. Many Chinese scientists and engineers earned their advanced degrees in leading American universities, returning to China with cutting-edge knowledge and expertise. This “brain circulation” has played a critical role in driving innovation in sectors like artificial intelligence, quantum computing, and green energy. The results are visible in companies like Huawei and BYD, which have set global standards in telecommunications and electric vehicles, respectively.
China’s soft power also extends to its growing global market network, exemplified by the Belt and Road Initiative. This strategy has fostered trade relationships and infrastructure investments across Asia, Africa, and Europe, creating economic linkages that enhance China's geopolitical influence. Unlike the United States, China has leveraged its systemic efficiency to integrate economic and strategic interests on a global scale, providing an alternative model of development that appeals to emerging economies.
Despite these strengths, China’s authoritarian model is not without limitations. Its emphasis on top-down planning can stifle individual creativity and innovation at the grassroots level, potentially slowing its progress as it approaches the technological frontier.
4.5.2. The United States: Diversity and Creativity as Catalysts for Innovation
The United States benefits from a fundamentally different set of soft skills rooted in its democratic and culturally diverse society. Diversity has long been a driver of innovation, fostering the exchange of ideas and perspectives across disciplines, industries, and communities. Immigrants have been a critical component of this dynamism, with over 40% of Fortune 500 companies founded by immigrants or their children (National Foundation for American Policy, 2022). This diversity fuels the country’s entrepreneurial culture, driving breakthroughs in technology, entertainment, and the arts.
The United States also excels in fostering decentralised creativity. Its education system, though criticised for disparities, encourages critical thinking and experimentation. Silicon Valley, for example, thrives on a culture of risk-taking and individual initiative, supported by venture capital networks that enable startups to scale rapidly. This decentralised approach contrasts with China’s top-down model, providing flexibility and adaptability that often lead to disruptive innovations.
Another advantage lies in the country’s robust intellectual property framework and open knowledge exchange. The United States continues to lead in Nobel Prize winners and scientific publications, demonstrating its ability to convert creativity into measurable contributions to global knowledge. Moreover, the open nature of its institutions allows for the global exchange of talent, with international students and researchers contributing significantly to its innovation ecosystem.
However, the United States faces challenges in translating its creativity into systemic advantages. Infrastructure development, for instance, is often hindered by bureaucratic hurdles, political polarisation, and local resistance. Projects that would take months in China can take years, reflecting inefficiencies in governance and execution.
4.6. Comparative Analysis: Efficiency versus Creativity
The strengths of China and the United States are complementary in many respects. China’s systemic efficiency and strategic planning give it a significant edge in executing large-scale projects and fostering integrated networks. Its ability to implement national strategies with precision and speed has driven its rapid economic ascent. On the other hand, the United States excels in fostering innovation through a decentralised and diverse society, enabling it to remain at the forefront of cutting-edge technologies and cultural revolutions.
As the two powers continue to compete and collaborate on the global stage, their soft skills will play a decisive role in shaping their futures. While China may excel in creating the infrastructure and systemic conditions for growth, the United States’ diversity-driven creativity positions it to lead in innovation and cultural influence. The interplay between these strengths will likely define the next phase of global economic and technological evolution.
4.7. The Role of Ascending Artificial Intelligence in Economic Growth
Artificial intelligence (AI) is emerging as a transformative force in the global economy, with both the United States and China recognising its strategic importance. While the United States maintains a lead in fundamental AI research and innovation, China's vast infrastructure, state-backed initiatives, and integration of AI into industries provide it with a unique advantage in scaling AI-driven economic growth.
4.7.1. United States: Innovation and Research Leadership
The United States has long been at the forefront of AI innovation, with many foundational breakthroughs originating from its universities and tech companies. Institutions such as Stanford, MIT, and Carnegie Mellon, alongside corporations like Google, Microsoft, and OpenAI, continue to drive cutting-edge research. The U.S. also leads in global AI patents and publications, demonstrating its dominance in fundamental research.
The U.S. private sector plays a pivotal role in the rapid development and application of AI technologies. Companies leverage venture capital and a culture of entrepreneurship to create AI-driven solutions in fields ranging from healthcare to autonomous vehicles. For example, the United States is a global leader in generative AI, as evidenced by platforms like ChatGPT, which have revolutionised human-computer interactions.
However, the decentralised nature of the U.S. economy poses challenges in integrating AI broadly across industries and regions. While Silicon Valley and other innovation hubs thrive, the diffusion of AI technologies into traditional sectors like manufacturing and logistics has been slower. Furthermore, the lack of a unified national AI strategy may limit the scalability of AI initiatives compared to China's coordinated approach.
4.7.2. China: Infrastructure and Strategic Integration
China has embraced AI as a national priority, embedding it into its broader economic and technological strategies. The government's "Next Generation AI Development Plan," introduced in 2017, aims to make China the global leader in AI by 2030. This top-down approach has mobilised substantial investments in AI research, infrastructure, and talent development.
China’s infrastructure advantage provides a critical edge in AI deployment. With the world's second largest population and a vast digital economy, China generates unparalleled volumes of data—a key resource for training AI models. Companies like Baidu, Tencent, and Alibaba integrate AI into platforms that reach billions of users, enabling rapid testing and scaling of AI applications.
The country's investments in physical infrastructure also support its AI ambitions. China leads in the deployment of 5G networks, with over 3 million base stations as of 2023 (National Bureau of Statistics of China, 2023). This connectivity facilitates AI integration into sectors such as smart cities, IOTs, logistics, and healthcare. For instance, cities like Shenzhen and Hangzhou are adopting AI-driven traffic management systems, significantly reducing congestion and improving urban efficiency.
Moreover, China's state-capitalist model allows for coordinated AI adoption across industries. State-owned enterprises in manufacturing, energy, and transportation are integrating AI to enhance productivity and reduce costs. The Belt and Road Initiative further extends China's AI influence by exporting its technologies to partner countries, creating a global network that reinforces its dominance.
4.7.3. Comparative Dynamics: Scaling versus Innovation
While the United States excels in pioneering AI innovations, China's advantage lies in scaling these technologies across sectors and geographies. This distinction reflects broader differences in their economic systems: the U.S. relies on market-driven entrepreneurship, while China leverages state coordination and infrastructure to drive widespread adoption.
China’s broader AI ecosystem, supported by its expansive infrastructure and integrated approach, positions it to dominate in practical applications such as industrial automation, smart logistics, and surveillance technologies. The United States, however, retains an edge in cutting-edge research and high-value applications, such as AI in medical diagnostics and advanced robotics.
Despite these strengths, both countries face challenges. The United States must address the gap between research and deployment, ensuring that AI technologies benefit the broader economy. Meanwhile, China must overcome barriers to innovation at the frontier, as its centralised model may limit the decentralised experimentation that drives breakthroughs.
4.7.4. Global Implications
The competition between the United States and China in AI will shape the future of global economic and technological landscapes. While the U.S. leads in innovation, China's ability to integrate AI into its infrastructure and industries may yield faster and more widespread economic impacts. The interplay between these dynamics will not only define the next phase of their economic trajectories but also influence global standards and practices in AI development and governance.
For other nations, this competition offers lessons in leveraging AI to address economic challenges. The integration of infrastructure, talent, and innovation into cohesive strategies will be critical for countries aiming to harness the transformative potential of artificial intelligence.
4.8. Limitations of the Solow Growth Model in Real-World Analysis
While the Solow growth model provides a foundational framework for understanding economic growth, its application to real-world scenarios is constrained by several theoretical and practical limitations. These weaknesses become evident when analysing complex economies like the United States and China, which operate in environments characterised by structural transitions, demographic shifts, and policy interventions that the Solow model cannot fully capture.
4.8.1. Simplistic Assumptions about Technology
The Solow model treats technological progress as an exogenous factor, meaning it is assumed to grow at a constant rate independent of economic activities or policies. This assumption oversimplifies the dynamics of technological innovation, which in reality depends on investments in R&D, institutional frameworks, and cultural factors. For example, the United States’ innovation ecosystem, driven by venture capital and entrepreneurial culture, is vastly different from China’s state-led approach to technological development. The model fails to account for these nuanced mechanisms.
4.8.2. Homogeneity of Capital and Labour
In the Solow model, capital and labour are treated as homogeneous inputs. However, in practice, the quality of these inputs varies significantly across economies. In the United States, capital is often directed towards high-tech industries, while in China, it has historically focused on infrastructure and manufacturing. Similarly, differences in labour force skills, education levels, and productivity are critical but are not reflected in the model. For example, the growing importance of human capital, particularly in knowledge-intensive sectors, cannot be adequately captured by the model’s simplistic aggregation of labour.
4.8.3. Absence of Institutional and Policy Factors
The model does not explicitly consider the role of institutions and policies in shaping economic outcomes. Governance structures, legal systems, and trade policies play pivotal roles in determining the efficiency of capital allocation and the pace of technological adoption. For instance, China’s centralised governance allows for rapid infrastructure development, while the United States’ decentralised system fosters creativity but struggles with large-scale project execution. The Solow model overlooks these critical factors, limiting its applicability to real-world dynamics.
4.8.4. Ignoring Global Interdependencies
In an increasingly interconnected global economy, no country operates in isolation. Trade, foreign direct investment, and knowledge transfer significantly influence economic growth. The Solow model assumes a closed economy, which neglects the impact of globalisation on capital flows, labour mobility, and technological diffusion. For example, China's rise has been facilitated by its integration into global supply chains, while the United States benefits from being the destination for global talent and innovation. These interdependencies are absent from the Solow framework.
4.8.5. Static Treatment of Savings and Population Growth
The Solow model assumes constant savings rates and population growth, which limits its ability to reflect real-world changes. In practice, these variables are influenced by economic policies, demographic trends, and cultural shifts. For instance, pro-natalist policies in China aim to reverse declining population growth, while immigration policies in the United States affect labour force expansion. The model cannot dynamically incorporate such shifts, reducing its relevance for long-term forecasting.
4.8.6. Neglect of Environmental Constraints
Economic growth in the Solow model is driven by capital accumulation and technological progress, with no consideration of environmental constraints. In reality, resource depletion, climate change, and ecological sustainability are critical factors influencing growth potential. For example, both China and the United States face challenges in balancing economic development with carbon reduction goals, which are absent from the Solow framework.
4.8.7. Transition Dynamics Are Simplified
The model focuses on long-run equilibrium (steady state) and provides limited insights into the transition dynamics that economies undergo when moving towards this equilibrium. In real-world scenarios, structural adjustments, political shocks, and market volatility can significantly alter these transitions. For example, China’s shift from an investment-led to a consumption-driven economy involves complex dynamics that the Solow model cannot adequately describe.
4.9. Summary
While the Solow growth model offers valuable insights into the fundamental drivers of economic growth, its limitations highlight the need for more nuanced frameworks that incorporate endogenous technological change, institutional factors, global interdependencies, and dynamic shifts in savings and population growth. For analysing complex economies like the United States and China, integrating these additional dimensions is essential to provide a more accurate and comprehensive understanding of growth dynamics. The Solow model serves as a starting point, but its weaknesses underscore the importance of complementing it with advanced models and empirical analyses tailored to contemporary economic realities.
5. Conclusion
This article has examined the economic trajectories of the United States and China through the lens of the Solow growth model, enriched with considerations of demographic dynamics, technological progress, governance structures, and policy interventions. The analysis reveals the strengths and vulnerabilities of both nations, offering insights into their future potential and the broader implications for global economic dynamics.
The Solow model underscores the fundamental drivers of growth: capital accumulation, labour force expansion, and technological progress. In the United States, sustained innovation remains a cornerstone of its economic strength, enabling it to offset demographic challenges such as an ageing population and declining birth rates. However, the model also highlights the risks associated with reduced immigration and the inefficiencies in infrastructure development, which could hinder long-term growth if unaddressed.
China’s economic trajectory reflects the duality of its systemic strengths and inherent challenges. Its ability to execute large-scale projects rapidly and leverage state-driven innovation has underpinned its rise as a global economic powerhouse. Yet, demographic decline, reliance on catch-up technological growth, and the diminishing returns of its investment-led model pose significant hurdles. The Solow framework demonstrates that while increased savings and investment can mitigate some of these challenges, sustained growth will require enhanced productivity and innovation.
A comparison of the two nations' soft skills provides further nuance. China's centralised governance enables rapid structural transformations and global market integration, while the United States thrives on the creativity and dynamism of its diverse population. These systemic differences highlight the complementary nature of their economic strategies but also the competitive tensions that define their global relationship.
The limitations of the Solow model, particularly its exogenous treatment of technology, homogeneity of inputs, and neglect of institutional and global factors, remind us that economic growth is a multifaceted phenomenon. To better understand the trajectories of these economies, the Solow framework must be integrated with more complex models and empirical analyses that account for real-world complexities.
As the global economy becomes increasingly interconnected, the futures of the United States and China will not only shape their domestic prosperity but also influence global stability, innovation, and sustainability. Policymakers in both nations must navigate these dynamics thoughtfully, leveraging their strengths while addressing structural weaknesses. Cooperation, despite the current geopolitical tensions, could unlock shared opportunities to address global challenges, from climate change to technological governance.
Ultimately, AI emergence and the interaction of efficiency, creativity, and adaptability will determine the long-term success of these two economic giants, offering lessons for economies around the world on the diverse paths to sustainable growth.
Conflicts of Interest
The Author claims there are no conflicts of interest.
References
- Autor, D., Dorn, D., & Hanson, G. (2016). The China Syndrome: Local Labor Market Effects of Import Competition in the United States. American Economic Review, 103(6), 2121-2168. [CrossRef]
- Congressional Budget Office. (2023). The Budget and Economic Outlook: 2023 to 2033. Washington, D.C.: U.S. Government Publishing Office.
- Fu, X., & Gong, Y. (2021). Indigenous and Foreign Innovation Efforts and the Determinants of Technological Catch-Up in Emerging Economies: Evidence from China. Research Policy, 50(7), 104265.
- Mankiw, N. G., Romer, D., & Weil, D. N. (1992). A Contribution to the Empirics of Economic Growth. The Quarterly Journal of Economics, 107(2), 407-437. [CrossRef]
- National Bureau of Statistics of China. (2023). Statistical Yearbook of China 2023. Beijing: NBS.
- National Foundation for American Policy. (2022). Immigrants and Billion-Dollar Startups: A Review of Contributions. Arlington, VA: NFAP.
- National Science Foundation. (2023). Science and Engineering Indicators 2023. Arlington, VA: NSF.
- National Science Foundation. (2023). Science and Engineering Indicators. Retrieved from https://www.nsf.gov/statistics/seind/.
- Solow, R. M. (1956). A Contribution to the Theory of Economic Growth. The Quarterly Journal of Economics, 70(1), 65-94. [CrossRef]
- U.S. Census Bureau. (2023). Demographic Trends and Population Projections. Washington, D.C.: Department of Commerce.
- UN Population Division. (2023). World Population Prospects 2023. New York: United Nations.
- World Bank. (2023). China Economic Update: Shifting Demographics and Growth. Washington, D.C.: The World Bank.
|
Disclaimer/Publisher’s Note: The statements, opinions and data contained in all publications are solely those of the individual author(s) and contributor(s) and not of MDPI and/or the editor(s). MDPI and/or the editor(s) disclaim responsibility for any injury to people or property resulting from any ideas, methods, instructions or products referred to in the content. |
© 2024 by the authors. Licensee MDPI, Basel, Switzerland. This article is an open access article distributed under the terms and conditions of the Creative Commons Attribution (CC BY) license (http://creativecommons.org/licenses/by/4.0/).