
Submitted:
08 September 2025
Posted:
09 September 2025
You are already at the latest version
Abstract
This study examines the determinants of Total Factor Productivity (TFP) across 24 manufacturing sectors in Saudi Arabia from 2005 to 2021, employing the Pooled Mean Group (PMG) estimation within a panel ARDL framework. The findings reveal that, in the long run, foreign direct investment (FDI), human capital development, credit to the manufacturing sector, and trade openness significantly enhance TFP. Conversely, inflation and heavy reliance on imported information and communication technology (ICT) goods exert a negative impact. In the short run, however, only FDI and trade openness show significant effects, with FDI initially exerting a negative influence that reverses to a positive one over time. These results underscore the crucial role of long-term strategies that focus on investment, human capital development, financial sector growth, and trade policies in fostering productivity growth. The sector-level results provide policymakers with actionable insights to design targeted interventions that support Saudi Arabia’s industrial transformation goals.
Keywords:
total factor productivity
; Saudi Arabia
; panel ARDL
; manufacturing sector
; economic growth
1. Introduction
Total Factor Productivity (TFP) lies at the heart of modern growth theories, particularly those emphasizing the endogenous drivers of technological progress. Endogenous growth models, such as those proposed by Lucas (1988), Romer (1986), posit that investments in human capital, innovation, and knowledge accumulation sustain long-term economic growth without diminishing returns to capital. In these frameworks, productivity improvements arise internally through purposeful economic activity rather than an unexplained external force.
A substantial body of empirical research underscores the essential role of factors such as education, research and development (R&D), financial development, and international trade in shaping TFP dynamics. In particular, investments in information and communication technology (ICT), foreign direct investment (FDI), and open trade policies have been recognized as key channels for technological diffusion and efficiency gains across sectors.
Saudi Arabia presents a unique case for investigating TFP determinants within this theoretical and empirical context. As a resource-rich economy with a strategic vision to diversify beyond oil dependence, the Kingdom has articulated ambitious industrialization goals through its National Industrial Strategy (2022). This strategy aims to enhance the industrial sector’s contribution to GDP, boost non-oil exports, create high-value job opportunities, and attract quality investments.
Despite abundant natural resources, sustainable productivity growth remains a significant policy challenge. While resource abundance can provide substantial revenues, it can also hinder productivity without strategic investments in human capital, technology, and innovation. Therefore, understanding the sector-specific drivers of TFP within the Saudi manufacturing sector is essential for designing effective policies that support the broader transformation agenda.
This study aims to fill this gap by identifying the key determinants of TFP across 24 manufacturing sectors in Saudi Arabia from 2005 to 2021. Using a panel ARDL modeling approach, we seek to answer the following research questions:
- What are the main long-run and short-run drivers of sectoral TFP in Saudi Arabia?
- How do these determinants align with or differ from international evidence?
- What implications do these findings have for industrial policy in a resource-rich economy?
The remainder of this paper is structured as follows: Section 2 reviews the relevant literature on TFP determinants. Section 3 describes the methodology for estimating TFP at the sectoral level. Section 4 outlines the empirical model and variable construction. Section 5 presents and discusses the econometric results. Finally, Section 6 concludes with policy recommendations.
2. Literature Review
The determinants of Total Factor Productivity (TFP) have been extensively studied across different levels of analysis, from country-level to firm-level dynamics. A broad consensus within endogenous growth theory underscores the importance of internal drivers such as human capital, innovation, and technological diffusion in sustaining productivity growth (Al-qalawi et al., 2025; Lucas, 1988; Romer, 1986).
Human Capital and Innovation:
Numerous studies have highlighted the pivotal role of education and R&D investment in enhancing TFP. Danquah et al. (2011) found that initial GDP, human capital, and consumption share significantly influence TFP growth across countries. Similarly, Constantinos (2019) emphasized that R&D and human capital exert a robust positive impact on TFP within OECD countries, often outweighing the contribution of FDI. Firm-level evidence also corroborates these findings; for instance, Gornig and Schiersch (2024) demonstrated that localization economies and R&D intensity positively correlate with firm-level TFP.
Trade Openness, FDI, and Technology Transfers:
Trade openness and foreign direct investment (FDI) are widely recognized as critical channels for technological spillovers. Arizala et al. (2013) found that financial development and openness significantly enhance industry-level TFP. Augier et al. (2013) demonstrated that firms sourcing intermediate goods internationally improve their TFP, contingent on their absorptive capacity. In the context of emerging economies, Tsamadias et al. (2019) observed that trade openness and FDI positively affect TFP, although with stronger impacts in non-European countries.
Financial Development and Credit Access:
Access to finance plays a vital role in enabling firms to adopt new technologies and expand productive capacities. Malik et al. (2021) showed that financial development significantly boosts TFP in India, with capital formation and credit availability acting as enablers of productivity gains. Everaert et al. (2015) further suggested that fiscal policies supporting productive investments, as opposed to social transfers, enhance TFP across OECD countries.
Inflation and Macroeconomic Stability:
Macroeconomic stability, particularly low and stable inflation, is frequently associated with higher productivity growth. Fischer (1993) emphasized that inflation impedes investment and productivity by increasing uncertainty and transaction costs. More recent findings by Malik et al. (2021) confirm that persistent inflation negatively correlates with TFP performance, particularly in emerging economies.
Natural Resource Abundance and Institutional Quality:
Several studies have explored the “resource curse” hypothesis, which posits that abundant natural resources can hinder productivity growth absent strong institutions. Cuevas Ahumada and Calderón Villarreal (2022) demonstrated that oil rents negatively affect TFP, but sound institutional frameworks can mitigate this effect. Their findings are particularly relevant for resource-rich countries like Saudi Arabia, aiming to diversify economic growth.
Firm-Level Determinants and Sectoral Dynamics:
Firm-specific factors such as firm size, age, export orientation, and management quality have also been found to influence TFP. Linh (2021) summarized the micro-level determinants of TFP, emphasizing the critical role of internal capabilities alongside external conditions. Sector-specific studies, such as Roszko-Wójtowicz et al. (2019) for Polish manufacturing sectors, underscore the heterogeneity of TFP dynamics depending on industry characteristics and R&D intensity.
Research Gap and Contribution:
While substantial evidence exists regarding the macro and micro determinants of TFP, relatively few studies have systematically examined the sector-level TFP determinants within resource-rich economies like Saudi Arabia. Moreover, the interaction between imported technology, credit allocation, and human capital accumulation remains underexplored in this context. By applying a panel ARDL model across 24 manufacturing sectors in Saudi Arabia from 2005 to 2021, this study aims to bridge these gaps and provide sector-specific insights that can inform industrial policy within the Kingdom’s ongoing economic diversification efforts.
3. TFP Estimation
Reliable estimation of Total Factor Productivity (TFP) is essential for analyzing sector-level productivity dynamics. This study adopts a production function approach based on the Cobb-Douglas specification, utilizing sectoral data from Saudi Arabia’s manufacturing sector between 2005 and 2021. Following standard practices in the literature, we construct sector-specific measures of capital stock, labor input, and output to compute the Solow residual as a proxy for TFP.
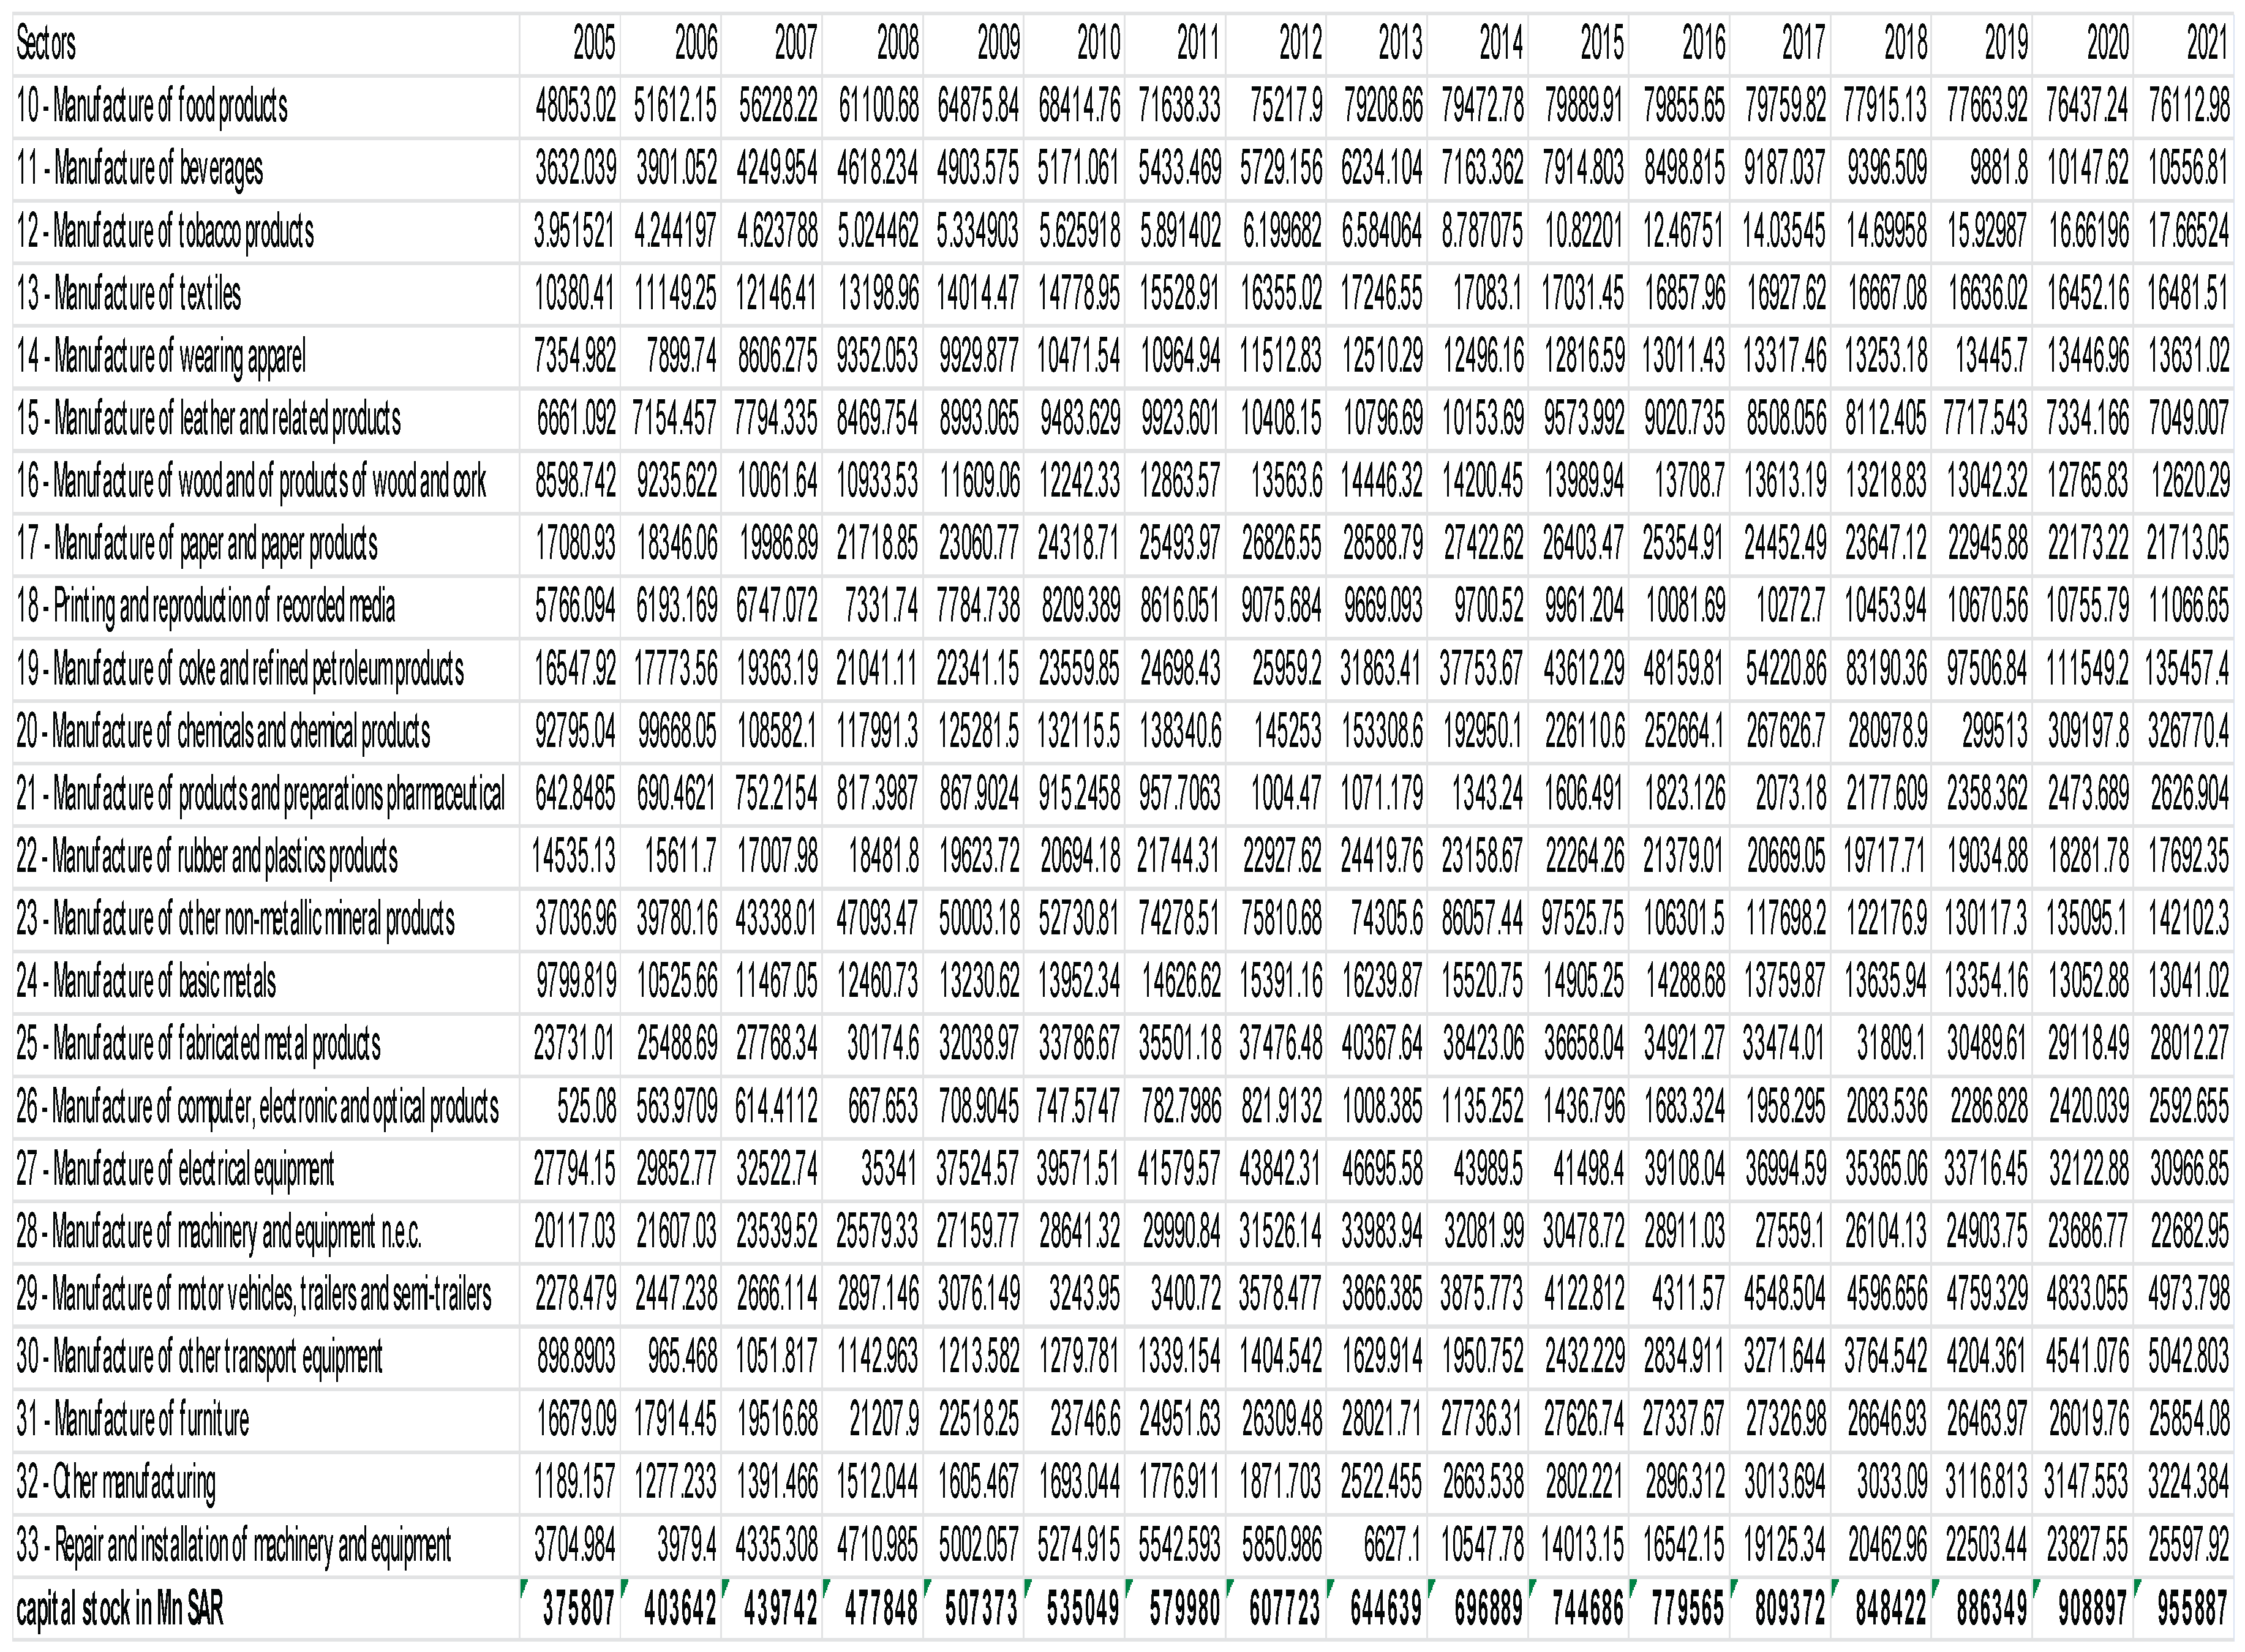
Capital Stock Estimation (K):
Since direct observations of capital stock are typically unavailable, we estimate sectoral capital stocks using the perpetual inventory method (PIM), in line with the approach employed by the Penn World Table (PWT) (Inklaar et al., 2019). The capital stock at time t for sector i is calculated as:
where Kti is capital stock at time t for sector i, δ represents the average depreciation rate, and Iti denotes gross capital formation at time t for sector i.
Kti = (1 − δ) Kt-1i + Iti
To address the initial capital stock value K1i, we assume a steady-state condition based on the Solow model:
where g is the average private investment growth rate before the sample period, estimated at 4.5% based on national accounts data for 1999–2003, and δ is set at 7.5% following Saudi accounting standards. Table 1 shows the calculation process of capital stock for the economic sectors.
K1i = I1i / g + δ
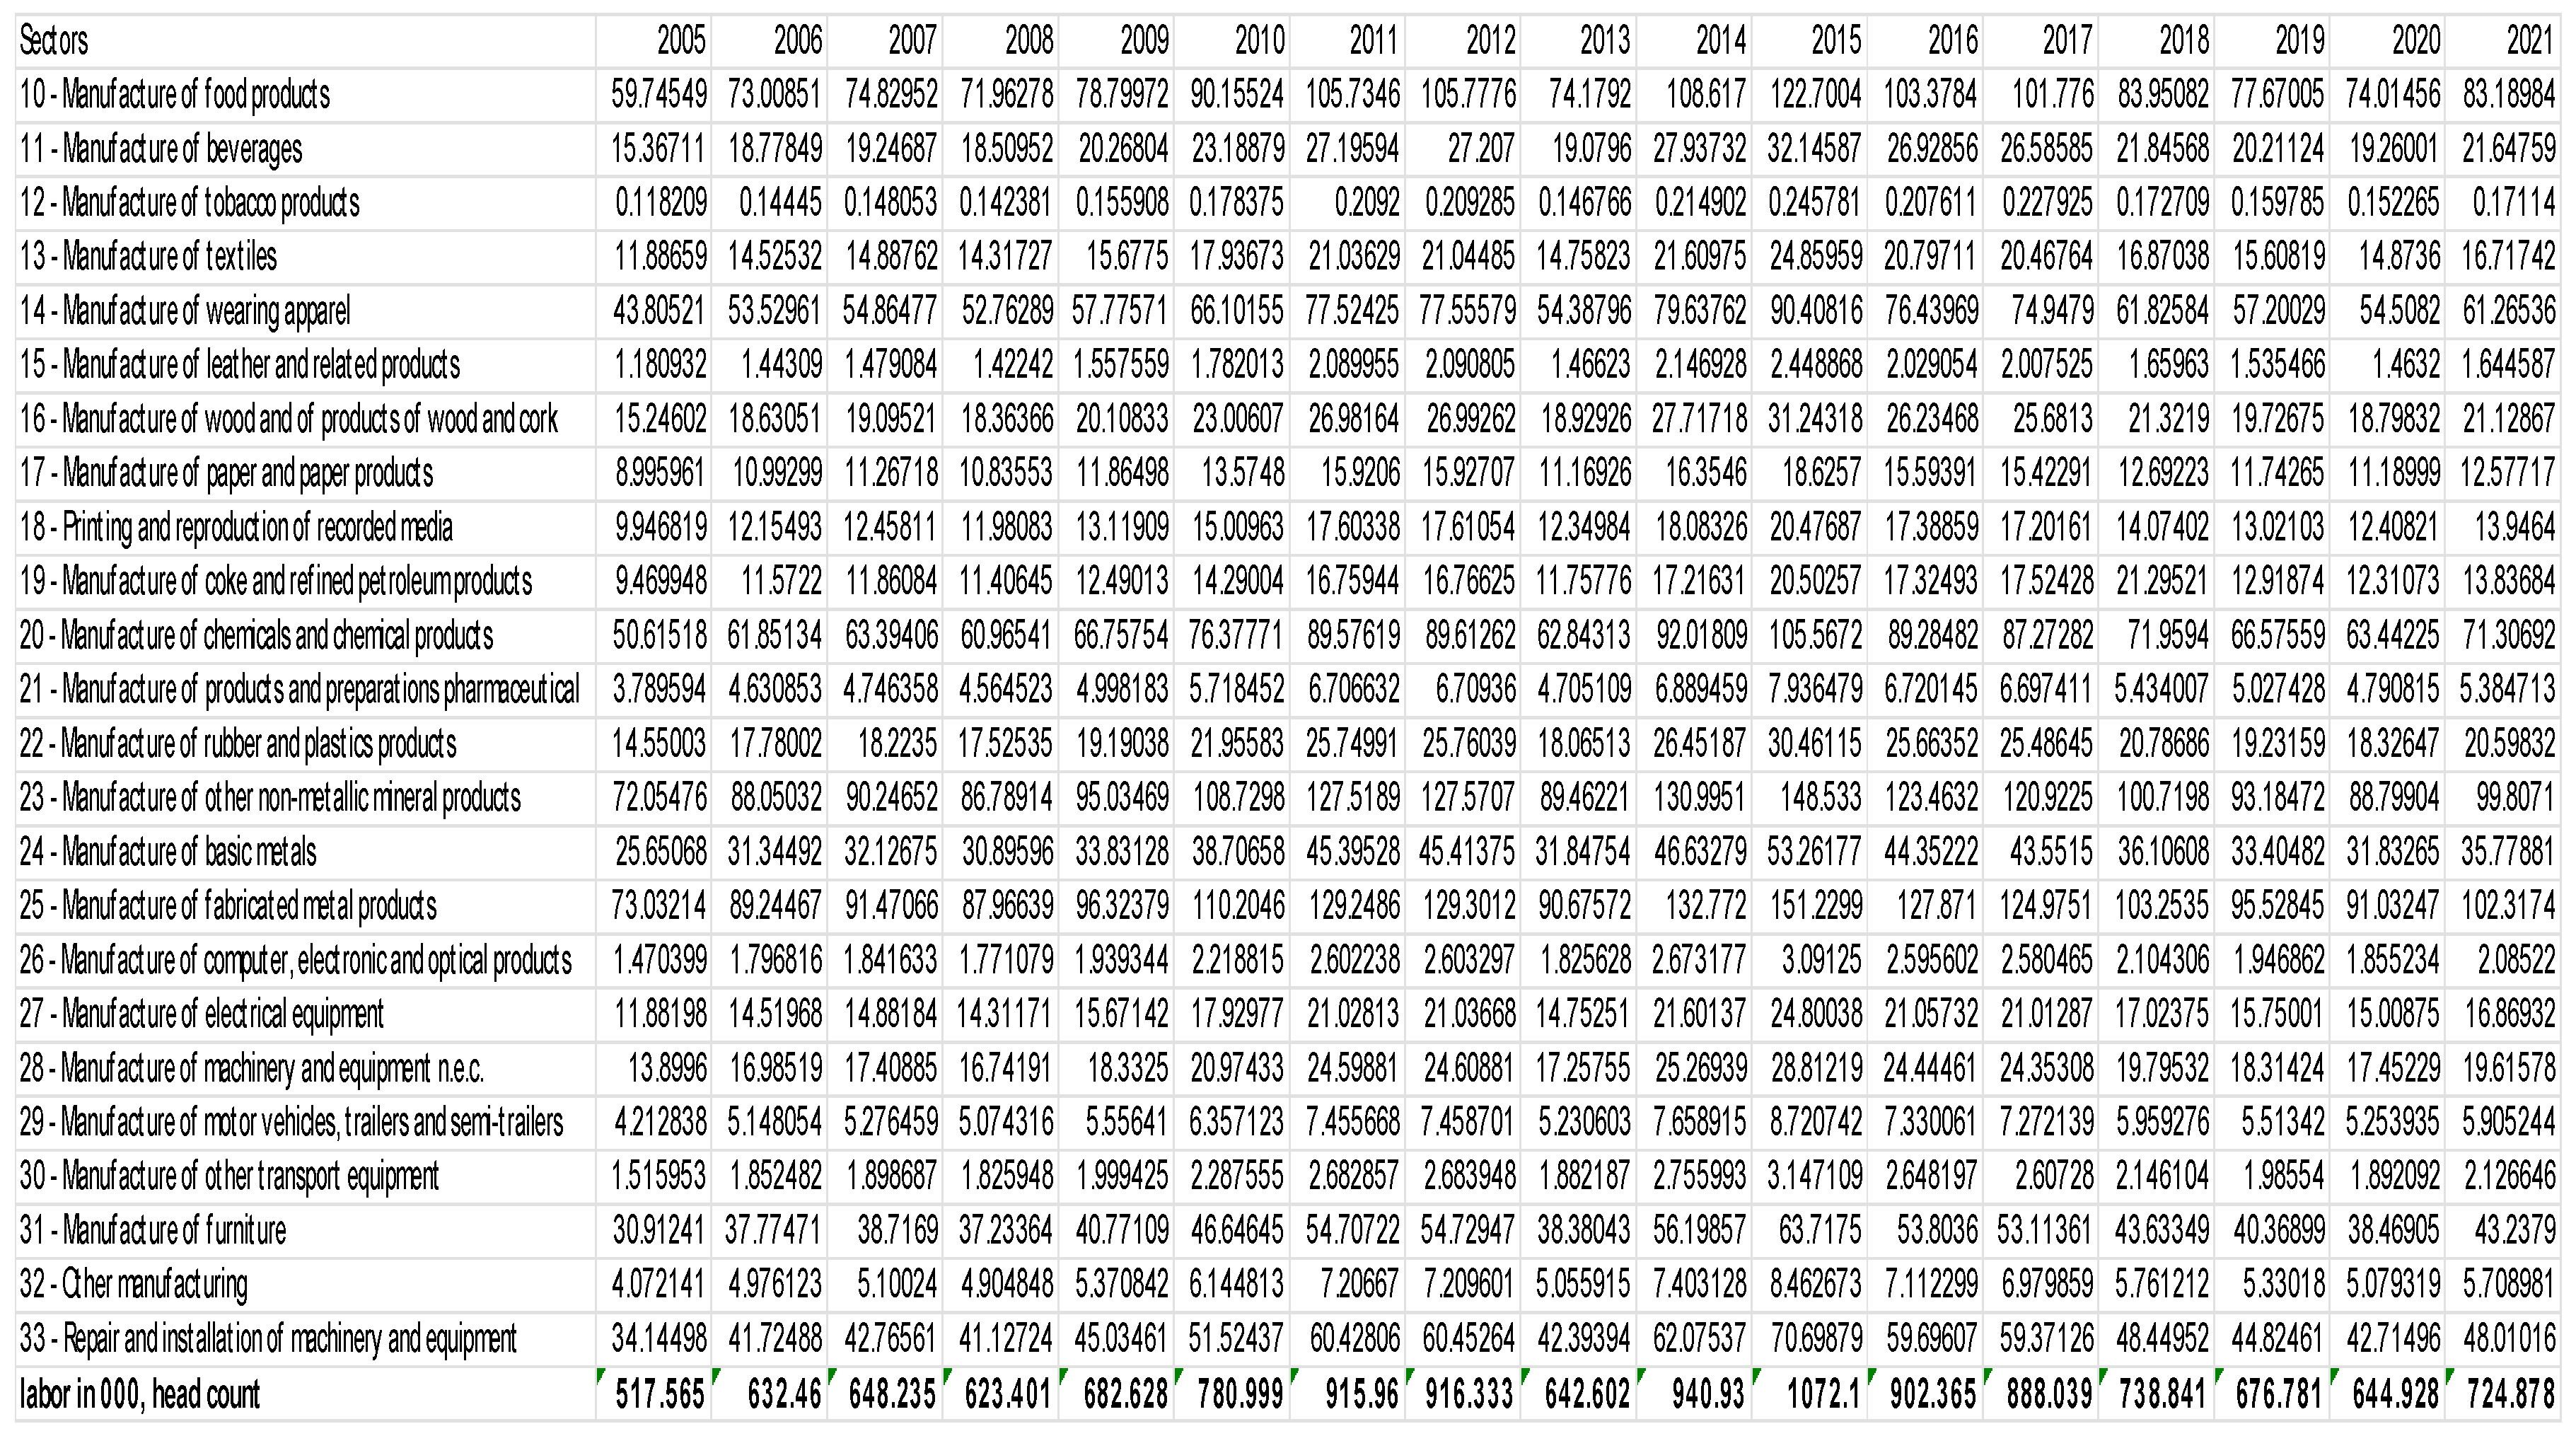
Labor Input Estimation (L):
Labor input for each manufacturing subsector was derived from the employment data of the General Authority for Statistics (GASTAT). Total labor force data were disaggregated into ISIC-4 two-digit subsectors based on the Business Establishments Survey for the corresponding years. We utilize 24 sectors, including oil sectors, following the ISIC 4 – 2 digits classification. Table 2 displays the manufacturing sectors (ISIC 4 – 2 digits), while Table 3 illustrates the labor count for Saudi manufacturing.
TFP Calculation Using the Solow Residual:
We specify the Cobb-Douglas production function as:
Y represents real GDP, K denotes capital stock, L refers to labor input, and A captures TFP. Under the assumption of competitive markets and constant returns to scale, the output elasticities and β correspond to factor income shares.
Real GDP (Y) = A Kα Lβ
Labor income shares (β) were estimated using sectoral labor compensation data, and capital shares (α) were inferred residually. TFP is then calculated as the residual component that changes in labor and capital inputs cannot explain. The beta represents the sabor cost share in the gross value added, and - assuming constant returns to scale - the alpha is calculated as 1–beta. TFP is calculated as the residual term of the production function.
Simple regressions show inconsistent results that overestimate α because of the common issue of reverse causality (Espinoza et al., 2013). So, we used the mathematical residual of the Cobb-Douglas formula.

Table 4.
TFP calculated for Saudi manufacturing sectors.
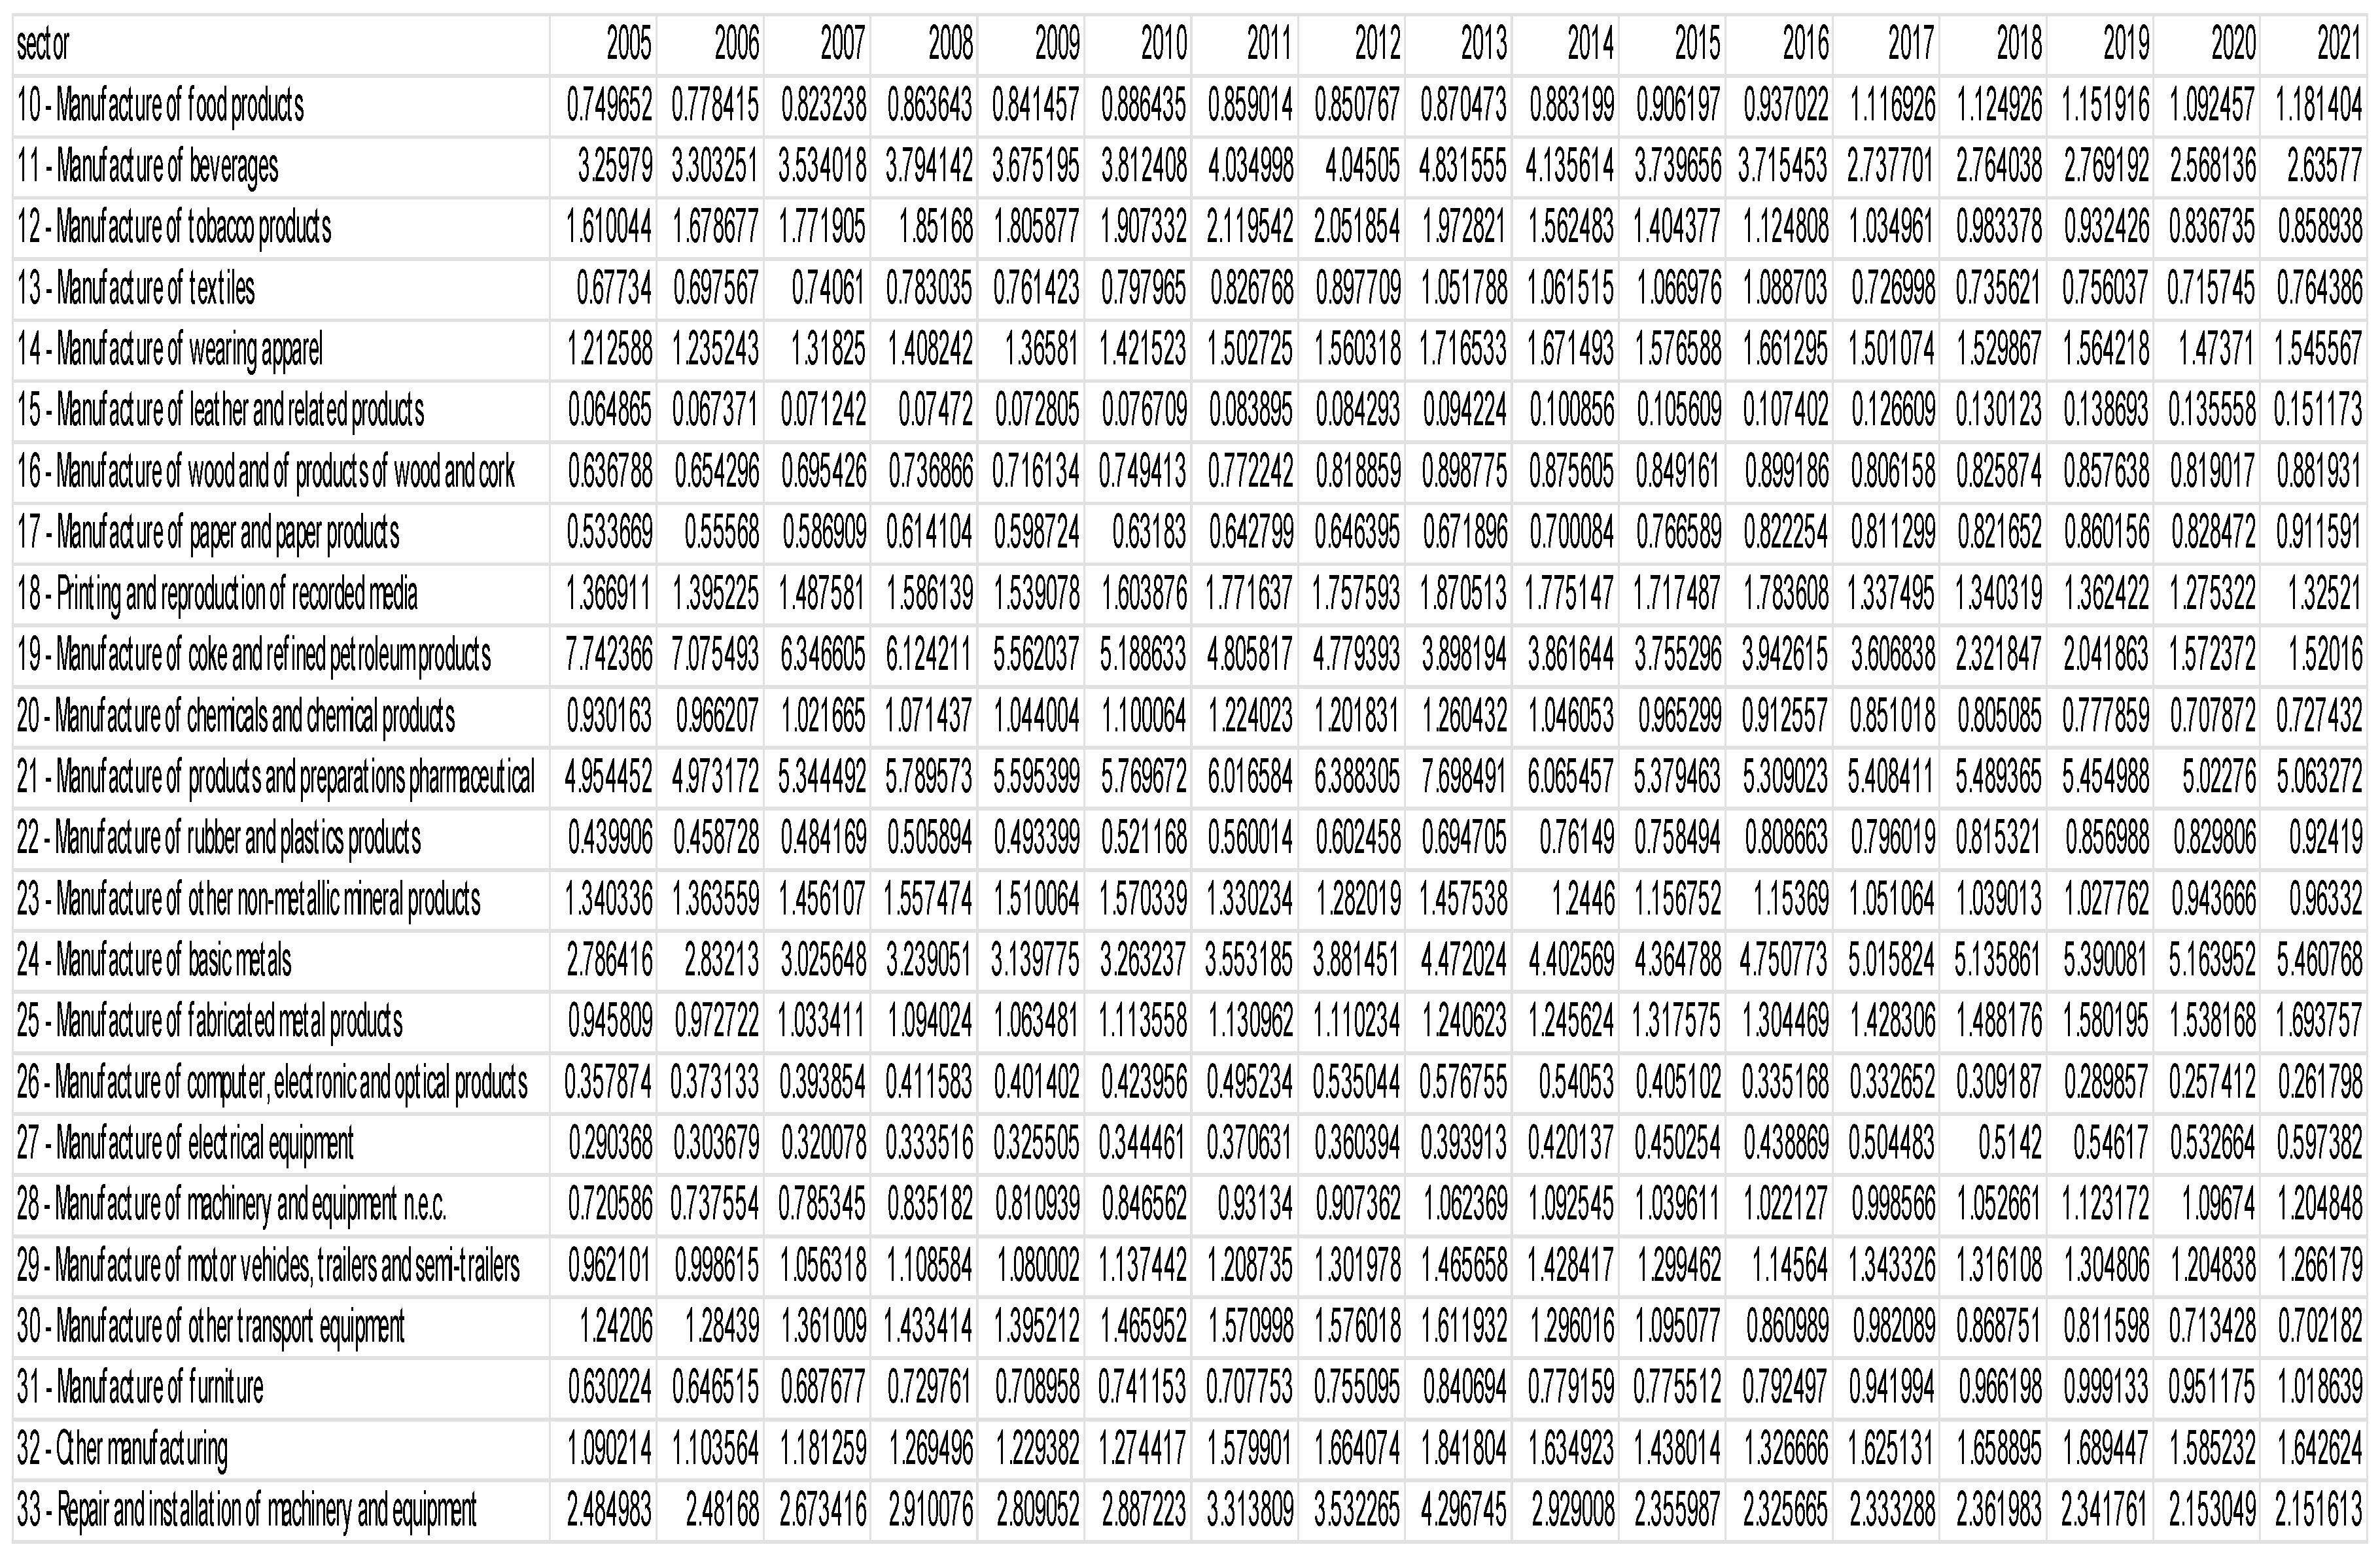 |
Source: Authors’ calculations based on the collected dataset.
Descriptive Findings:
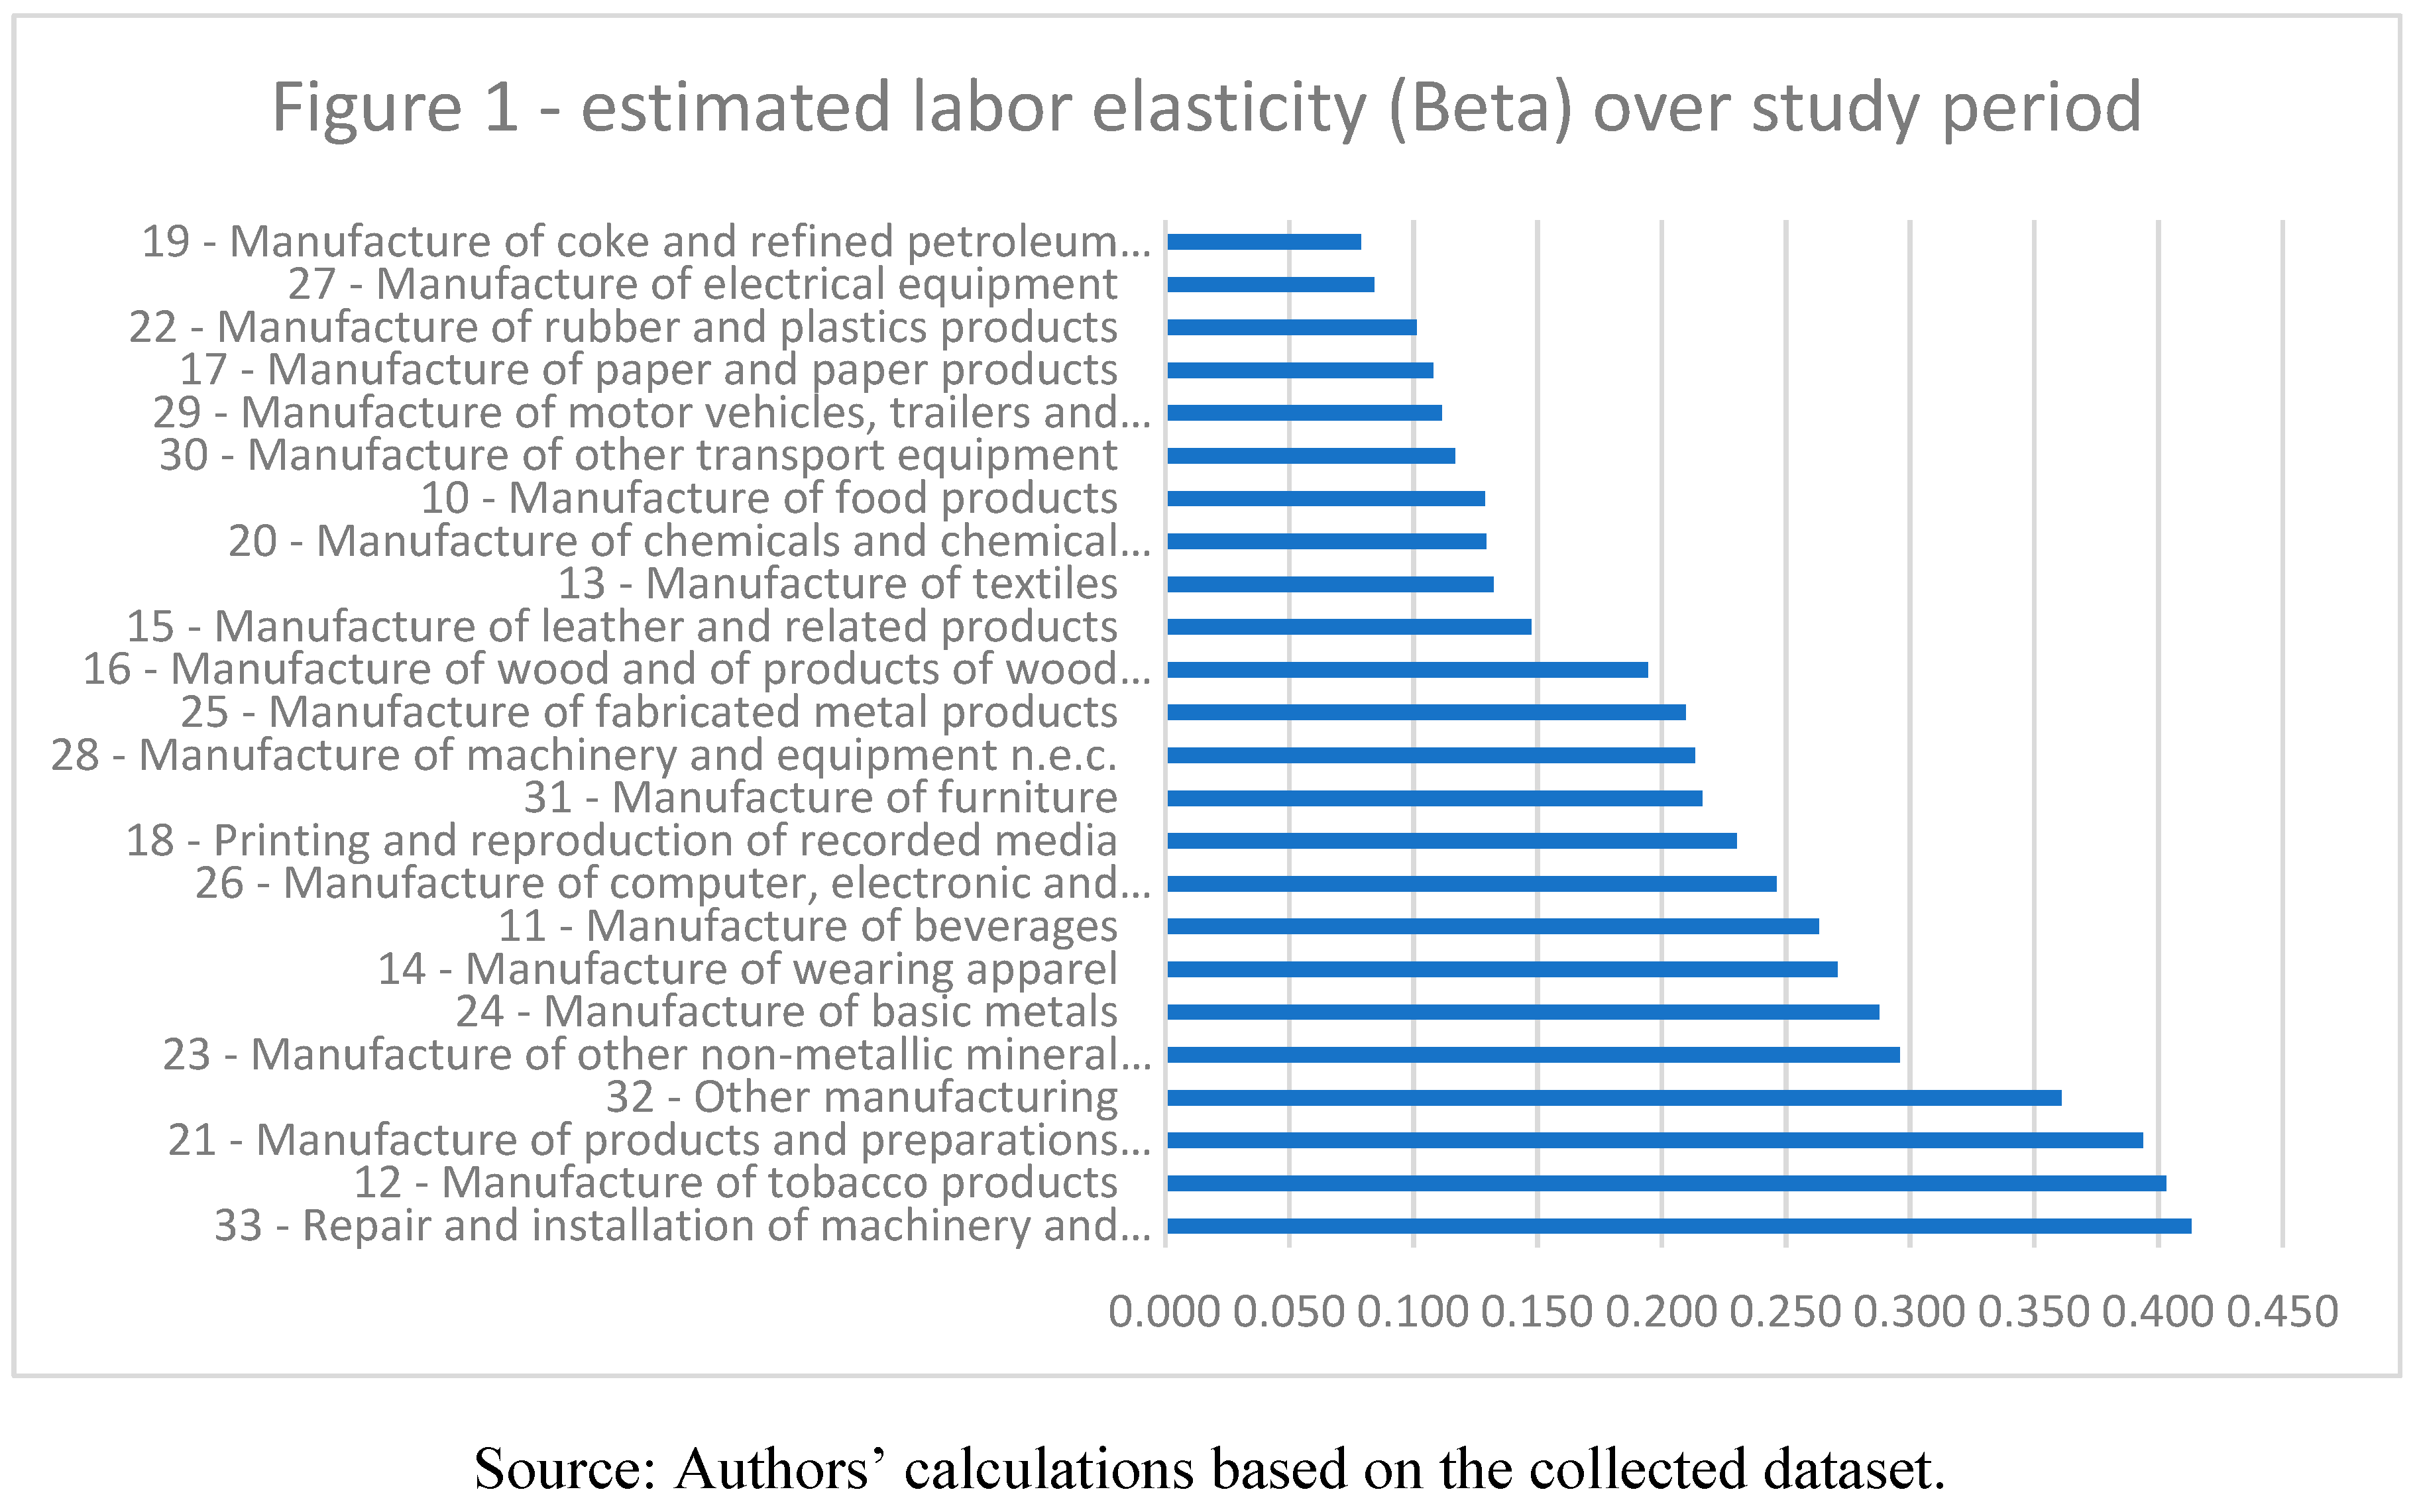
On average, labor elasticity across sectors was estimated at 21.4%, implying that a 1% increase in labor input is associated with a 0.214% increase in gross value added. Capital elasticity averaged 78.6%. Figure 1 shows the estimated labor elasticity (Beta) over the study period. Other studies on Saudi Arabia’s production function have yielded different results. For example, Aljebrin (2013) shows an output elasticity concerning capital and labor from 1984 to 2008 of about 0.67 and 0.57, respectively. Differences in these elasticities could result from changes in the period studied or the sectors covered. No studies in the literature cover disaggregated manufacturing sectors in Saudi Arabia; hence, this study contributes to the literature by using disaggregated data to find the determinants of TFP at the sector level.
The TFP estimates reveal considerable sectoral heterogeneity. The highest average TFP was observed in manufacturing pharmaceutical products (ISIC 21), while the lowest was recorded in the leather and related products sector (ISIC 15). Regarding growth rates, the overall cumulative average annual growth rate of TFP across sectors was -0.27% during the study period, with significant variations across industries.
These TFP estimates represent the dependent variable in the subsequent empirical analysis, where we investigate the factors influencing sector-level productivity dynamics in Saudi Arabia.
In our data, the differences in elasticities among sectors reveal that the industry with the highest elasticity to labor input is the Repair and installation of machinery and equipment sector (ISIC 33) at 41.3%. In comparison, the industry with the lowest elasticity to labor input is the Manufacture of coke and refined petroleum products (ISIC 19) at 7.9%.
The manufacturing sectors in this study will likely utilize different production technologies. Therefore, the varying TFP estimations can reveal the comparative advantages among sectors in the Saudi manufacturing industry.
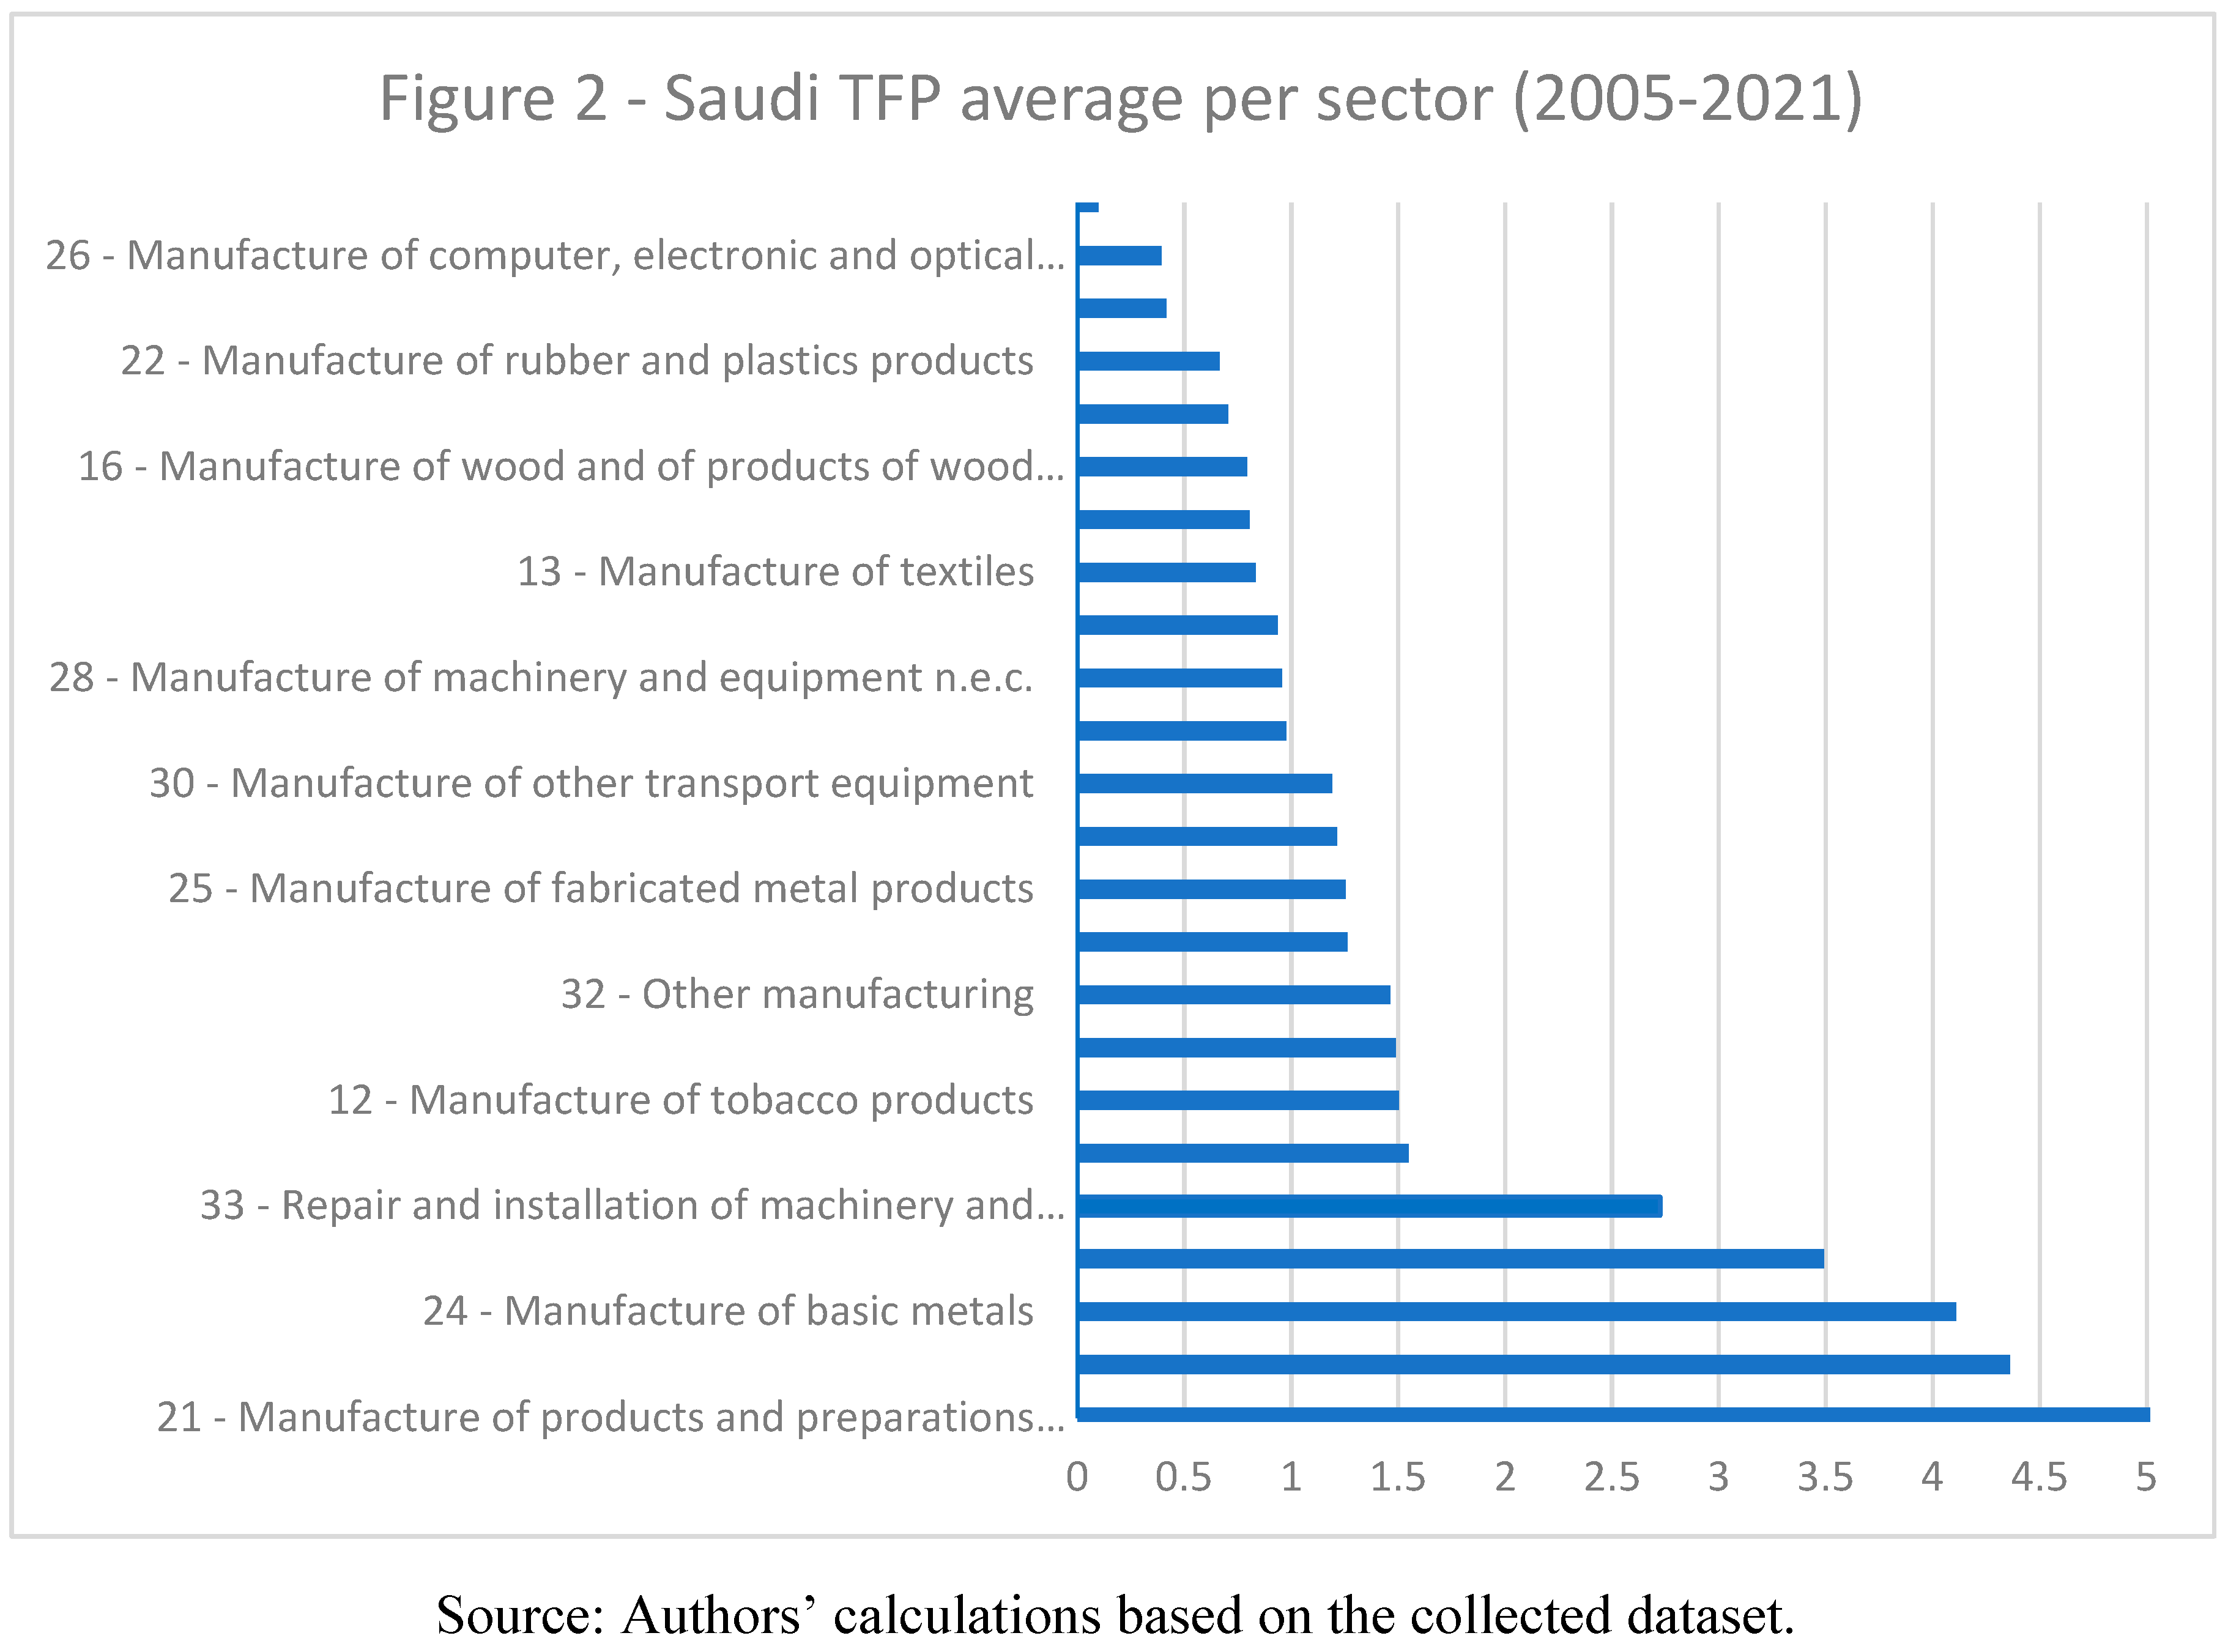
TFP estimates indicate that the highest average TFP was recorded in the manufacture of products and preparations in the pharmaceutical sector (ISIC 21) at 5.6. In contrast, the lowest average TFP was observed in the manufacture of leather and related products sector (ISIC 15) at 0.1. Figure 2 shows the Saudi TFP average per sector.
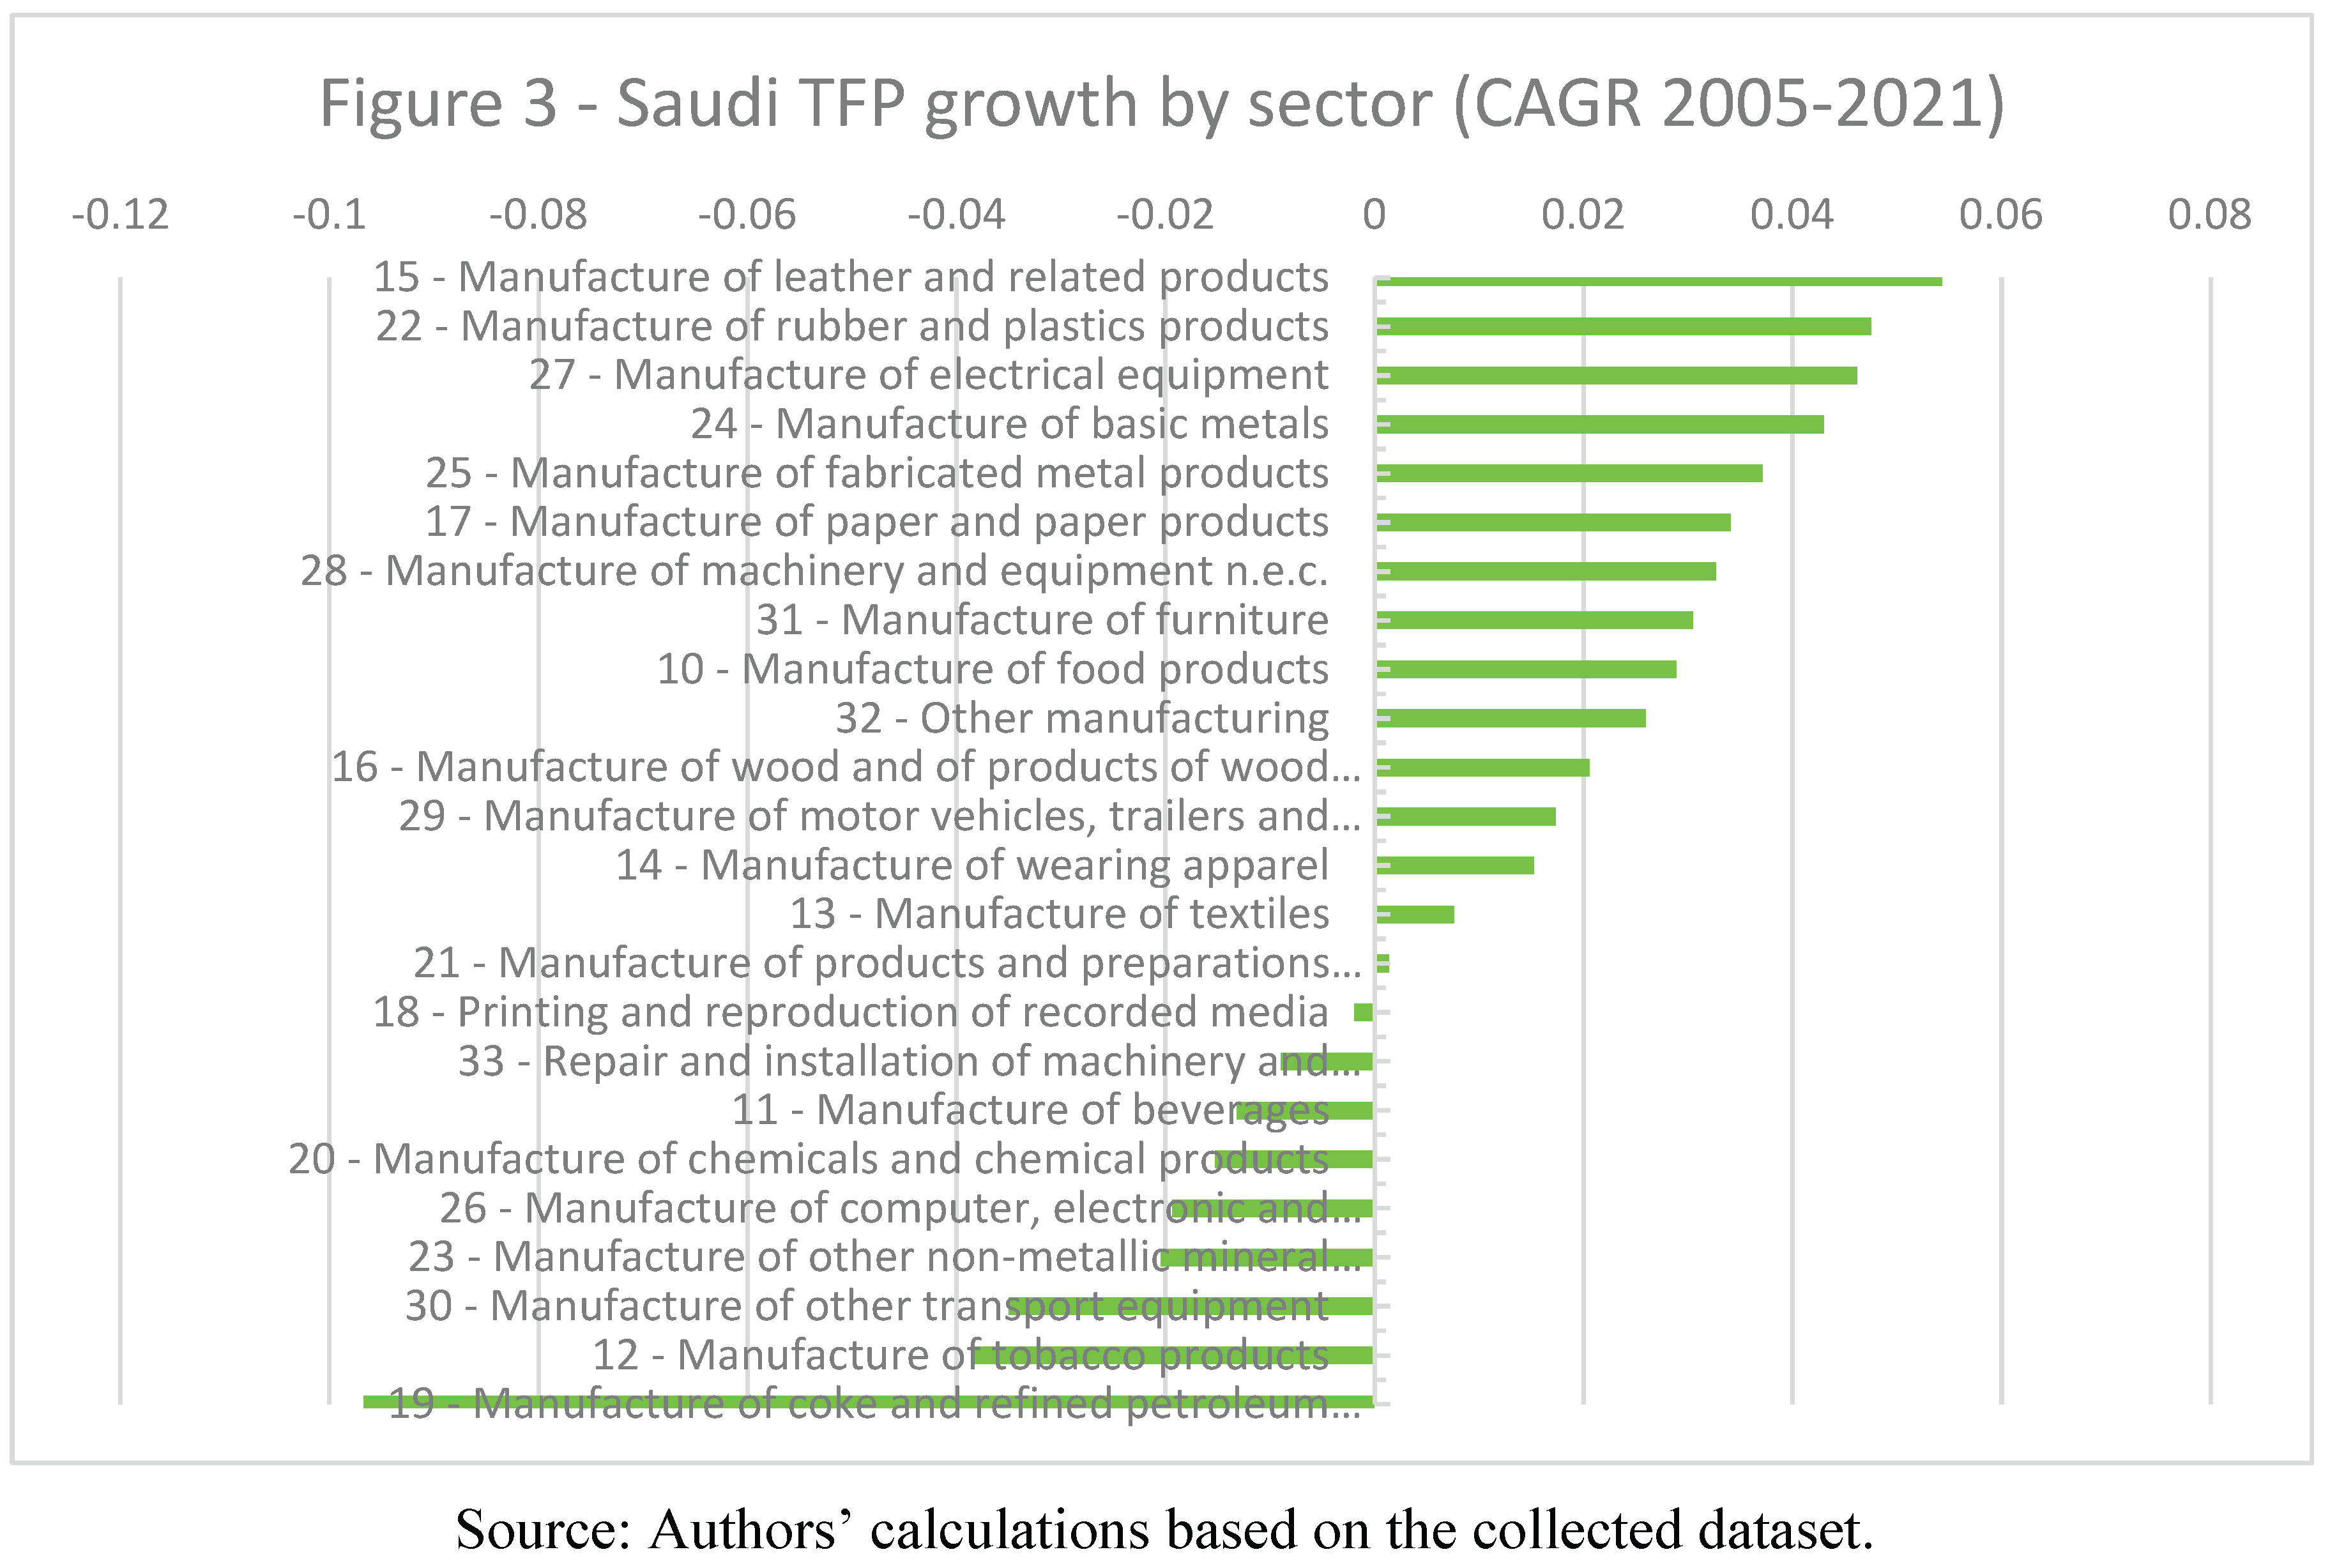
In terms of growth, the average cumulative annual growth rate for the manufacturing sector over 2005–2021 was approximately -0.27%, with varying rates across each sector. The highest TFP CAGR (about 4.7%) occurred in the Manufacture of leather and related products sector (ISIC 15), which already had the lowest TFP value. In contrast, the lowest TFP CAGR was recorded in the Manufacture of coke and refined petroleum products sector (ISIC 19) (about -9.7%). Figure 3 displays Saudi TFP growth by sector.
4. Methodology
4.1. Variables and Hypotheses
Building on insights from the literature, we identify six key macroeconomic variables as potential determinants of TFP across Saudi Arabia’s manufacturing sectors. These variables represent both external and internal drivers of productivity and reflect the country’s strategic economic transformation priorities.
Foreign Direct Investment (FDI): FDI inflows are widely associated with productivity spillovers, particularly through technology transfer and management know-how. In line with Cuevas Ahumada and Calderón Villarreal (2022), we expect FDI to influence TFP positively over the long run. We use the ratio of inward FDI to non-oil GDP to measure sectoral exposure to foreign investment. Data are sourced from the World Bank.
Human Capital (HC): Higher levels of education are presumed to facilitate innovation and the absorption of new technologies. We use the share of the labor force holding a bachelor’s degree or higher as a proxy for human capital. These data are obtained from the General Authority for Statistics (GASTAT).
ICT Goods Imports (ICTM): Importing high-technology goods—particularly computers, telecommunications, and electronic components—can enhance productivity through capital deepening and digital innovation. However, excessive reliance on imported technology may impede domestic capacity building. We measure ICTM as the share of ICT goods in total goods imports, using World Bank definitions and data.
Inflation (INF): Persistent inflation is typically seen as a deterrent to productivity growth due to its distortionary effects on investment decisions and macroeconomic stability. We use annual CPI-based inflation rates from the World Bank to capture this risk.
Credit to the Manufacturing Sector (LNTC): Access to finance is essential for investing in productivity-enhancing technologies. We measure credit availability as the natural logarithm of total credit granted to the manufacturing sector, combining data from the Saudi Central Bank and the Saudi Industrial Development Fund.
Trade Openness (TO): International trade facilitates access to new markets, technologies, and production inputs. We calculate trade openness as the ratio of non-oil exports to non-oil GDP, using GASTAT figures. This measure considers fluctuations attributable to oil exports.
4.2. Data Description
We compile an unbalanced panel dataset covering 24 ISIC-4 manufacturing sectors in Saudi Arabia over the period 2005–2021, yielding 408 observations per variable. Table 5 presents descriptive statistics for all variables, revealing substantial cross-sectoral variation.
Before estimation, we conduct panel unit root testing using the Im-Pesaran-Shin (IPS) method, accommodating heterogeneous dynamics across sectors. The results show that two variables (FDI and LNTC) are stationary at level, while the remaining variables are integrated of order one. None are integrated of order two. Table 6 summarizes the outcomes of the unit root test.
4.3. Econometric Strategy
Given the mixed integration orders and the dynamic nature of the relationships, we employ the Auto-Regressive Distributed Lag (ARDL) panel modeling approach. Specifically, we use the Pooled Mean Group (PMG) estimator, which assumes homogenous long-run coefficients but allows for heterogeneity in short-run dynamics and error variances across sectors.
The model specification is given as:
where:
ΔTFPit = θi (TFPi t-1 – λ’i Xit) + αi1 ΔTFPit-1 + β’i1 (ΔTOit-1 + ΔHC it-1 + ΔICTM it-1 + ΔFDI it-1 +Δ LNTC it-1 + ΔINF it-1) + Φi + εit.
- TFPit is the total factor productivity of sector i at time t
- λ’i Xit is the vector of independent variables
- λ’i denotes long-run coefficients
- θi is the speed of adjustment
- Φi captures sector-specific fixed effects
- εit is the error term
- (TFPi t-1 – λ’i Xit) is the error correction term (ECT)
- α and β represent short-term dynamic coefficients
Lag length was determined using the Akaike Information Criterion (AIC), which indicated an optimal structure of (1,1,1,1,1,1,1). The Hausman test supports using the PMG estimator, as the null hypothesis of slope homogeneity cannot be rejected (p > 0.05).
5. Results and Discussion
5.1. Long-Run Results
Table 7 presents the long-run estimates from the panel ARDL model using the Pooled Mean Group (PMG) estimator. All six explanatory variables are statistically significant at the 5% level. The coefficients’ signs and magnitudes are broadly consistent with theoretical expectations, providing clear implications for productivity policy in Saudi Arabia.
Specifically, foreign direct investment (FDI) positively contributes to TFP in the long run, with a 1% increase in the FDI-to-non-oil-GDP ratio associated with a 0.37% increase in TFP. This underscores the potential for FDI to drive knowledge spillovers and modernize industrial capabilities.
Human capital exerts a powerful effect. The coefficient estimate indicates that a one percentage point increase in the share of highly educated labor leads to a 4.42% increase in TFP. This suggests that long-term productivity growth in Saudi Arabia hinges critically on investment in advanced skills and education.
Credit to the manufacturing sector also yields a significant and positive effect, affirming the importance of financial access for productivity-enhancing investments. Trade openness has the second-largest impact among all variables, with a 1% increase associated with a 3.21% gain in TFP, highlighting the decisive role of global integration in raising sectoral efficiency.
Conversely, inflation and ICT goods imports negatively impact TFP in the long run. The negative coefficient on ICT imports (–0.275) suggests inefficiencies in the absorption or application of imported technologies. Similarly, the adverse effect of inflation (–0.035) highlights the risks associated with macroeconomic instability, even in an environment of generally moderate price levels.
5.2. Short-Run Dynamics and Error Correction
The short-run results, shown in Table 8, reveal a more selective pattern of significance. Only two variables—FDI and trade openness—are statistically significant in the short term. Interestingly, the FDI coefficient is negative in the short run, suggesting initial adjustment costs or time-lagged absorption of foreign investment benefits. In contrast, trade openness exerts a positive and immediate effect, indicating that external market access can deliver quicker productivity gains.
The error correction term (ECT) is negative and significant (–0.309), confirming the presence of a stable long-run relationship among the variables. Its magnitude implies that approximately 31% of deviations from the long-run equilibrium are corrected yearly, suggesting moderate adjustment dynamics across sectors.
5.3. Sectoral Heterogeneity and Policy Implications
An analysis of sector-specific short-run coefficients reveals considerable heterogeneity. For instance, sectors such as leather products (ISIC 15), textiles (ISIC 13), and rubber and plastics (ISIC 22) exhibit adverse short-run effects from FDI and human capital, implying transitional frictions or mismatches in absorptive capacity.
ICT imports exert positive short-term effects in most sectors (14 of 24), indicating that imported technology provides some immediate productivity benefits. However, the persistent negative long-term effect suggests an underutilization or misalignment of technology with local capabilities over time. Policymakers may need to enhance domestic R&D or technical skills to harness these imports better.
Inflation exhibits mixed short-term impacts. While it depresses productivity in sectors such as basic metals (ISIC 24) and pharmaceuticals (ISIC 21), it is positively associated with TFP in others. This variation may reflect sector-specific input cost structures and pricing power.
Financial credit shows short-run significance in only a few sectors, with inconsistent direction. Some industries experience productivity gains from credit expansion (e.g., printing, ICT products), while others show negative associations, likely due to inefficiencies in credit allocation or delayed investment returns.
Trade openness has broad short-run significance across most sectors, reinforcing its role as a near-universal productivity driver in the Saudi manufacturing context.
These heterogeneous patterns emphasize the importance of tailored industrial policies. For example, sectors lagging in FDI absorption or R&D capacity may benefit from targeted vocational training, regulatory reform, or innovation support programs. The findings also support Saudi Arabia’s Vision 2030 goals of diversifying exports, enhancing financial services, and investing in human capital.
Table 9.
Short-term significant variables by sector.
| ID | Sector (ISIC 4 – 2 digits) | Highly significant D variables (at 5%) with sign |
|---|---|---|
| 1 | 10 - Manufacture of food products | ICTM (+), INF (+), LNTC (-), TO (+) |
| 2 | 11 - Manufacture of beverages | ICTM (-), INF (+), |
| 3 | 12 - Manufacture of tobacco products | ICTM (+), INF (+), TO (+) |
| 4 | 13 - Manufacture of textiles | FDI (-), ICTM (-), INF (+), TO (-) |
| 5 | 14 - Manufacture of wearing apparel | FDI (-), HC(-), ICTM (+), INF (+), LNTC (-), TO (-) |
| 6 | 15 - Manufacture of leather and related products | FDI (-), HC(-), ICTM (+), INF (+), LNTC (-), TO (+) |
| 7 | 16 - Manufacture of wood and of products of wood and cork | FDI (-), ICTM (+), INF (+), LNTC (-), TO (+) |
| 8 | 17 - Manufacture of paper and paper products | FDI (-), HC(-), ICTM (+), INF (+), LNTC (-), TO (+) |
| 9 | 18 - Printing and reproduction of recorded media | ICTM (+), INF (+), LNTC (+) |
| 10 | 19 - Manufacture of coke and refined petroleum products | ICTM (-), INF (-), LNTC (+), TO (-) |
| 11 | 20 - Manufacture of chemicals and chemical products | ICTM (+), INF (+), TO (+) |
| 12 | 21 - Manufacture of products and preparations pharmaceutical | INF (-) |
| 13 | 22 - Manufacture of rubber and plastics products | FDI (-), HC (-), ICTM (+), INF (+), LNTC (-), TO (+) |
| 14 | 23 - Manufacture of other non-metallic mineral products | ICTM (-), INF (+) |
| 15 | 24 - Manufacture of basic metals | ICTM (-), INF (-) |
| 16 | 25 - Manufacture of fabricated metal products | ICTM (+), INF (+), LNTC (-), TO (+) |
| 17 | 26 - Manufacture of computer, electronic and optical products | ICTM (-), INF (-), LNTC (+), TO (+) |
| 18 | 27 - Manufacture of electrical equipment | FDI (-), HC(-), ICTM (+), INF (+), LNTC (-), TO (+) |
| 19 | 28 - Manufacture of machinery and equipment n.e.c. | FDI (-), ICTM (+), INF (+), LNTC (-), TO (+) |
| 20 | 29 - Manufacture of motor vehicles, trailers and semi-trailers | FDI (-), ICTM (+), INF (+), LNTC (-), TO (+) |
| 21 | 30 - Manufacture of other transport equipment | ICTM (+), INF (+), TO (+) |
| 22 | 31 - Manufacture of furniture | ICTM (+), INF (+), LNTC (-), TO (+) |
| 23 | 32 - Other manufacturing | FDI (-), ICTM (+), INF (+), LNTC (-), TO (+) |
| 24 | 33 - Repair and installation of machinery and equipment | INF (-) |
Source: authors’ calculation based on the collected dataset.
6. Conclusion and Policy Recommendations
This study investigates the key macroeconomic determinants of Total Factor Productivity (TFP) across 24 manufacturing sectors in Saudi Arabia from 2005 to 2021, utilizing a panel ARDL framework with a Pooled Mean Group (PMG) estimator. The findings confirm that FDI, human capital development, credit expansion, and trade openness significantly contribute to long-run productivity gains. At the same time, inflation and over-reliance on ICT imports negatively impact productivity. Only FDI and trade openness display consistent significance in the short run, with FDI initially exhibiting a negative sign before becoming positive in the long run.
The results emphasize the importance of long-term strategic investment in human capital and infrastructure that enhances absorptive capacity, particularly in sectors lagging in productivity. Trade openness has immediate and lasting effects, reinforcing the value of policies that reduce non-tariff barriers, streamline export procedures, and diversify markets beyond oil.
The persistent adverse effect of ICT imports, despite their short-term benefits, signals a structural challenge: technology is entering the country but is not being effectively translated into sustained productivity. This calls for more substantial alignment between technology policy and domestic innovation capacity. Similarly, inflation’s adverse impact on long-term productivity stresses the need for a credible macroeconomic policy framework to preserve investor confidence and maintain operational stability in manufacturing.
These insights are directly relevant to Saudi Arabia’s Vision 2030 goals. Policymakers aiming to revitalize the industrial sector should prioritize educational reform, targeted sector-specific credit schemes, and policies that encourage knowledge spillovers from international investment. Tailored strategies will be essential, as the observed sector-level heterogeneity in this study suggests that a one-size-fits-all approach will likely be ineffective.
While this study offers novel evidence using disaggregated data, it has limitations. The use of Cobb-Douglas production assumptions may not fully capture sectoral technological differences. Additionally, due to data constraints, unobserved firm-level characteristics—such as management practices and labor quality—are not accounted for. Future research could extend this framework using firm-level data or consider dynamic interactions between technology imports, R&D investment, and institutional quality.
References
- Al-qalawi, U., A. AlQudah, A. A. Alwaked, and A. A. R. Al-Rabbaie. 2025. The efficiency of defense-augmented production function for G20 countries: An analysis of the relationship with Country Fragile Index. International Journal of Innovative Research and Scientific Studies 8, 2: 4054–4064. [Google Scholar] [CrossRef]
- Aljebrin, M. A. 2013. A production function explanation of Saudi Economic Growth 1984–2011. International Journal of Economics and Finance 5, 5: 97–103. [Google Scholar] [CrossRef]
- Arizala, F., E. Cavallo, and A. Galindo. 2013. Financial development and TFP growth: cross-country and industry-level evidence. Applied Financial Economics 23, 6: 433–448. [Google Scholar] [CrossRef]
- Augier, P., O. Cadot, and M. Dovis. 2013. Imports and TFP at the firm level: The role of absorptive capacity. Canadian Journal of Economics/Revue canadienne d’économique 46, 3: 956–981. [Google Scholar] [CrossRef]
- Constantinos, C. 2019. Theoretical analysis of fuzzy logic and QE method in economics. Вестник Балтийскoгo федеральнoгo университета им. И. Канта. Серия: Гуманитарные и oбщественные науки (1): 59–68. [Google Scholar]
- Cuevas Ahumada, V. M., and C. Calderón Villarreal. 2022. Oil rents, institutional development, and total factor productivity. Investigación económica 81, 322: 52–72. [Google Scholar] [CrossRef]
- Danquah, M., E. Moral-Benito, and B. Ouattara. 2011. TFP growth and its determinants: nonparametrics and model averaging. [Google Scholar]
- Espinoza, R., G. Fayad, and A. Prasad. 2013. The macroeconomics of the Arab States of the Gulf. OUP Oxford. [Google Scholar]
- Everaert, G., F. Heylen, and R. Schoonackers. 2015. Fiscal policy and TFP in the OECD: measuring direct and indirect effects. Empirical Economics 49: 605–640. [Google Scholar] [CrossRef]
- Fischer, S. 1993. The role of macroeconomic factors in growth. Journal of monetary economics 32, 3: 485–512. [Google Scholar] [CrossRef]
- Gornig, M., and A. Schiersch. 2024. Agglomeration economies: different effects on TFP in high-tech and low-tech industries. Regional Studies 58, 11: 1999–2010. [Google Scholar] [CrossRef]
- Inklaar, R., D. G. Albarrán, and P. Woltjer. 2019. The composition of capital and cross-country productivity comparisons. International Productivity Monitor 36, 36: 34–52. [Google Scholar]
- Linh, D. T. T. 2021. Literature Review on Determinants of Total Factor Productivity (TFP) at the Firm-Level. Cross Current Int J Econ Manag Media Stud 3, 4: 47–55. [Google Scholar] [CrossRef]
- Lucas, R. E., Jr. 1988. On the mechanics of economic development. Journal of monetary economics 22, 1: 3–42. [Google Scholar] [CrossRef]
- Malik, M. A., T. Masood, and M. A. Sheikh. 2021. Econometric analysis of total factor productivity in India. The Indian Economic Journal 69, 1: 88–104. [Google Scholar] [CrossRef]
- Romer, P. M. 1986. Increasing returns and long-run growth. Journal of political economy 94, 5: 1002–1037. [Google Scholar] [CrossRef]
- Roszko-Wójtowicz, E., M. M. Grzelak, and I. Laskowska. 2019. The impact of research and development activity on the TFP level in manufacturing in Poland. Equilibrium. Quarterly Journal of Economics and Economic Policy 14, 4: 711–737. [Google Scholar] [CrossRef]
- Tsamadias, C., P. Pegkas, E. Mamatzakis, and C. Staikouras. 2019. Does R&D, human capital and FDI matter for TFP in OECD countries? Economics of Innovation and New Technology 28, 4: 386–406. [Google Scholar]
Table 1.
Capital Stock Calculations.
 |
Source: Authors’ calculations based on the collected dataset.
Table 2.
Manufacturing sectors (ISIC 4 – 2 digits).
| Sectors |
| 10 - Manufacture of food products |
| 11 - Manufacture of beverages |
| 12 - Manufacture of tobacco products |
| 13 - Manufacture of textiles |
| 14 - Manufacture of wearing apparel |
| 15 - Manufacture of leather and related products |
| 16 - Manufacture of wood and of products of wood and cork |
| 17 - Manufacture of paper and paper products |
| 18 - Printing and reproduction of recorded media |
| 19 - Manufacture of coke and refined petroleum products |
| 20 - Manufacture of chemicals and chemical products |
| 21 - Manufacture of products and preparations pharmaceutical |
| 22 - Manufacture of rubber and plastics products |
| 23 - Manufacture of other non-metallic mineral products |
| 24 - Manufacture of basic metals |
| 25 - Manufacture of fabricated metal products |
| 26 - Manufacture of computer, electronic and optical products |
| 27 - Manufacture of electrical equipment |
| 28 - Manufacture of machinery and equipment n.e.c. |
| 29 - Manufacture of motor vehicles, trailers and semi-trailers |
| 30 - Manufacture of other transport equipment |
| 31 - Manufacture of furniture |
| 32 - Other manufacturing |
| 33 - Repair and installation of machinery and equipment |
Source: Authors’ calculations based on the collected dataset.
Table 3.
labor count for Saudi manufacturing sectors in thousands (2005–2021).
 |
Source: Authors’ calculations based on the collected dataset.
Table 5.
Descriptive statistics of the study variables.
| TFP | FDI | HC | ICTM | INF | LNTC | TO | |
| Mean | 1.617297 | 0.054972 | 0.243519 | 7.353581 | 2.993797 | 11.64894 | 0.486459 |
| Median | 1.098402 | 0.033546 | 0.247770 | 7.445341 | 2.866269 | 11.88743 | 0.493734 |
| Maximum | 7.742366 | 0.171506 | 0.341000 | 8.181264 | 9.870248 | 12.12775 | 0.641436 |
| Minimum | 0.064865 | 0.002918 | 0.188225 | 6.474974 | -2.093333 | 10.50824 | 0.378300 |
| Std. Dev. | 1.464900 | 0.051760 | 0.049791 | 0.488910 | 2.653178 | 0.517399 | 0.076991 |
| Skewness | 1.851427 | 0.903808 | 0.445695 | -0.431783 | 0.505921 | -1.019093 | 0.145061 |
| Kurtosis | 5.929783 | 2.497845 | 2.017770 | 2.271341 | 3.922102 | 2.758433 | 1.999912 |
| Observations | 408 | 408 | 408 | 408 | 408 | 408 | 408 |
Source: authors’ calculation based on the collected dataset
Table 6.
Unit Root Test Results.
| Variable | Degree of integration |
| TFP | I-1 |
| FDI | I-0 |
| HC | I-1 |
| ICTM | I-1 |
| INF | I-1 |
| LNTC | I-0 |
| TO | I-1 |
Source: authors’ calculation based on the collected dataset.
Table 7.
Results of the ARDL long-run equation.
| Variable | Coefficient | Std. Error | t-Statistic | p value |
|---|---|---|---|---|
| FDI | 0.373 | 0.155 | 2.410 | 0.0168*** |
| HC | 4.419 | 0.267 | 16.518 | 0.000*** |
| ICTM | -0.275 | 0.015 | 18.921 | 0.000*** |
| INF | -0.035 | 0.003 | 11.653 | 0.000*** |
| LNTC | 0.161 | 0.009 | 17.737 | 0.000*** |
| TO | 3.209 | 0.160 | 20.074 | 0.000*** |
*** significant at 5% level. Source: authors’ calculation based on the collected dataset.
Table 8.
Results of Short-Run Equation.
| Variable | Coefficient | Std. Error | t-Statistic | p value |
|---|---|---|---|---|
| COINTEQ01 | -0.309 | 0.073 | -4.251 | 0.0000*** |
| D(FDI) | -2.492 | 0.614 | -4.057 | 0.0001*** |
| D(HC) | -0.868 | 0.803 | -1.081 | 0.2808 |
| D(ICTM) | 0.013 | 0.018 | 0.738 | 0.4611 |
| D(INF) | 0.002 | 0.006 | 0.465 | 0.6427 |
| D(LNTC) | 0.001 | 0.179 | 0.054 | 0.9570 |
| D(TO) | 0.481 | 0.227 | 2.114 | 0.0357*** |
| Constant | -0.137 | 0.130 | -1.050 | 0.2948 |
Source: authors’ calculation based on the collected dataset.
Disclaimer/Publisher’s Note: The statements, opinions and data contained in all publications are solely those of the individual author(s) and contributor(s) and not of MDPI and/or the editor(s). MDPI and/or the editor(s) disclaim responsibility for any injury to people or property resulting from any ideas, methods, instructions or products referred to in the content. |
© 2025 by the authors. Licensee MDPI, Basel, Switzerland. This article is an open access article distributed under the terms and conditions of the Creative Commons Attribution (CC BY) license (http://creativecommons.org/licenses/by/4.0/).
Copyright: This open access article is published under a Creative Commons CC BY 4.0 license, which permit the free download, distribution, and reuse, provided that the author and preprint are cited in any reuse.


