Submitted:
16 January 2026
Posted:
16 January 2026
You are already at the latest version
Abstract
In high-density urban environments, residential design often faces a conflict between maximizing landscape access and maintaining energy-oriented compactness. This study proposes a target-based visibility analysis framework to optimize high-rise forms under strict performance constraints. Utilizing a Quad-mesh reconstruction strategy and Inverse Targeted Ray-Casting, the method accurately quantifies visibility via the cumulative Landscape Visible Surface (LVS) on the target building and Viewpoint-Specific Surface Visibility Rate (Rv) for precise verification against specific landscape targets. The frame-work is applied to evaluate three morphological prototypes: Compact Tower, Dispersed Tower, and Slab–Tower Hybrid. Quantitative simulations identify the Slab–Tower Hybrid as the optimal solution, demonstrating superior "Visual Morphological Efficiency." While maintaining a moderate Shape Coefficient (SC=0.326) to satisfy energy standards, the Hy-brid achieves a cumulative Park-View LVS approximately 1.8 times that of the Compact Tower. Furthermore, environmental simulations indicate the Hybrid fosters stable wind environments (0.4–0.7 m/s) and equitable sunlight distribution. The research concludes that through differentiated massing, high-rise architecture can achieve a synergistic bal-ance between visual openness and physical compactness, transforming view analysis from a passive check into an active design driver.
Keywords:
high-rise residential form
; landscape view access
; visibility analysis
; quad-mesh
; performance constraints
1. Introduction
Rapid urbanization has driven the proliferation of high-rise residential buildings in high-density cities, effectively addressing housing shortages but simultaneously severing the connection between inhabitants and the natural environment [1,2]. In the context of the “concrete jungle,” access to natural landscapes (e.g., rivers, mountains, and parks) is no longer merely an aesthetic preference but a critical determinant of urban livability and public health [3,4]. Studies based on attention restoration theory have confirmed that visual exposure to natural elements significantly reduces stress [5,6,7], improves mental well-being [8,9], and enhances the economic value of real estate [10]. Consequently, maximizing Landscape View Access—particularly to multi-source landscapes like rivers, mountains, and parks—has shifted from an aesthetic luxury to a fundamental requirement for healthy urban living.
Recognizing this imperative, architects and scholars have made significant efforts to bridge the gap between the built environment and nature. These contributions primarily focus on visual perception preferences, architectural design philosophy, and the optimization of specific building components. Extensive research has defined what constitutes a “good view.” For instance, Kristl et al. [2] examined how demographic factors influence window view preferences, while Lin et al. [11] confirmed that a higher proportion of natural elements significantly enhances subjective preference. On a macro level, architects have sought a harmonious “self-consistency” between construction logic and nature, exemplified by Antonin Raymond’s work [12] and traditional Chinese architectural order [13]. On a micro level, research has focused on the geometric variables of openings; Ko et al. [14] proposed the “View Access Index” to optimize occupant satisfaction. Similarly, regarding semi-open spaces, Molaei et al. [15] highlighted that balconies facing natural landscapes significantly increase usage frequency. However, a critical gap remains: existing literature extensively covers subjective perception and local component optimization, yet few studies directly address the adaptability of overall residential building morphology to the natural landscape environment [16]. Current studies often isolate “view” from “building form,” making it difficult to provide explicit guidance on how different morphological prototypes fundamentally determine landscape accessibility.
Furthermore, integrating precise visibility analysis into morphological design remains technically challenging. Current research on visibility analysis largely stems from geography and urban planning [17,18,19]. The foundational concepts of “Isovist” [20] and “Viewshed” [21] are widely used to measure visibility on 2D planes. Building upon these foundations, research has evolved significantly towards complex 3D simulations. Fisher-Gewirtzman and Natapov [22] expanded the definition of visibility analysis, comparing Voxel-based approaches with 3D line-of-sight approaches to analyze complex urban topographies. Subsequent studies have further enhanced these models by incorporating human perception and environmental targets. Fisher-Gewirtzman [23] integrated subjective “weighted views” into quantitative line-of-sight models to better predict spatial perception. Similarly, Kim and Yi [24] proposed “QuVue,” a method that treats the sky hemisphere as a target to accurately calculate the visible sky ratio in high-density environments.
However, most existing methods adopt an “observer-based” perspective, simulating what a person sees from a specific point outward. While effective for evaluating a single viewpoint, this approach is computationally inefficient for optimizing an entire building’s form. To address this limitation, the concept of “Inverse Visual Analysis” (or Reverse Viewshed) has been adopted [25]. Grounded in the principle of visual reciprocity—which posits that if a target object is visible from the landscape, the landscape is conversely visible from the object—this method evaluates visibility by projecting rays from surrounding landscape elements towards the target building. This approach allows for a holistic mapping of visual potential onto the architectural surface. Nevertheless, a critical technical gap persists. While divergent ray-casting methods are highly effective for evaluating spatial openness or landmark visibility within a certain range, they suffer from the “divergence error” when applied to inverse analysis over long distances [26,27,28]. These methods operate on a principle where rays are dense near the viewpoint but spread out as distance increases (the “near-dense, far-sparse” phenomenon). When evaluating visibility from a landscape viewpoint towards a distant building, this leads to sparse sampling on the target surface, causing small architectural features to be missed. Therefore, there is an urgent need for a high-precision method to accurately quantify visibility on complex building forms without being compromised by distance.
Optimizing for views does not happen in a vacuum; it is strictly constrained by physical and climatic factors. In the architectural domain, the trade-off between “Form” and “Performance” is a well-documented dilemma. To maximize view access, building forms tend to become dispersed or articulated [29,30,31]. However, in regions with challenging climatic conditions, such as China’s hot summer and cold winter zone, energy efficiency regulations mandate a low Shape Coefficient (SC)—a ratio of surface area to volume—favoring compact forms to minimize heat transfer [32,33]. Additionally, high-rise typology must strictly adhere to sunlight standards and wind comfort requirements [34,35]. Prior studies have mostly focused on single-objective optimization, rarely establishing a unified framework that couples precise visibility analysis with multi-dimensional performance constraints [36].
To bridge these gaps, this study proposes a comprehensive morphological optimization framework. The primary objective is to establish a quantitative design pathway that couples architectural form with environmental quality. Specifically, this research aims to:
- Propose a Quad-mesh based inverse visibility analysis method using 1-meter grids to ensure high-precision visibility quantification;
- Integrate strict Performance Constraints, including the Household Sunlight Perimeter Ratio (HSPR) and SC; and
- Identify the optimal morphological strategy through a comparative case study of three prototypes (Compact, Dispersed, and Slab-Tower Hybrid) in Changsha.
This study provides a scientific, evidence-based tool for architects to navigate the complex trade-offs in high-rise residential design.
2. Materials and Methods
To address these technical challenges—particularly the lack of precise visibility quantification for complex building skins—a methodological framework is established. This approach integrates a parametric workflow within the Rhinoceros 3D platform, employing custom algorithms to synchronize morphological design with environmental performance verification.
2.1. Research Framework
This study establishes a quantitative design optimization framework aimed at maximizing the acquisition of external natural landscape resources through architectural form, while strictly adhering to environmental performance standards as boundary constraints. The workflow is structured into three logical phases (Figure 1):
Phase 1: Environmental Context Modeling (Invariant Input).
The first phase involves establishing the digital representation of the site’s fixed environmental context. All surrounding landscape elements (rivers, mountains, parks) are modeled in the Rhinoceros platform to accurately reflect spatial occlusion relationships. Crucially, specific visual boundary curves are defined along the edges of these landscapes to serve as the emission sources for the inverse visual analysis.
Phase 2: Morphological Variable Analysis (Variable Input & Response).
The proposed architectural form serves as the independent variable. By inputting a specific morphological prototype, the framework performs two evaluations: it utilizes an innovative method to identify the ‘Visible Mesh’ that establishes a visual connection with the landscape, while simultaneously calculating key physical indicators—such as Shape Coefficient (Energy), Sunlight hours, and Wind Environment—to optimize performance.
Phase 3: Decision-Making and Optimization (Evaluation Loop).
This is the critical decision-making stage. The logic follows a “Check-and-Refine” process: validation is achieved only if the design maximizes landscape view access while simultaneously satisfying all performance constraints (Energy, Sun, and Wind).
The optimization process is defined as an evolutionary trajectory guided by design intelligence, rather than algorithmic randomization. It initiates with a foundational prototype. Guided by the architect’s design experience and the quantitative feedback from the analysis, the form is iteratively modified—evolving through intermediate morphological variations to a final optimized solution—until a satisfactory balance between landscape maximization and performance compliance is achieved.
2.2. Target-Based Visibility Analysis
The core of the morphological optimization lies in the precise quantification of view access. Target-based visibility analysis method is specifically designed to identify and extract the Landscape Visible Surface (LVS) on the proposed building. By treating the building envelope as the target of visual calculation, this method aims to pinpoint the exact mesh faces that possess a direct line of sight to the surrounding natural landscape resources, thereby quantifying the “visual potential” of the architectural form.
2.2.1. Principle of Inverse Visibility and Visual Boundary Definition
The method is based on the principle of Visual Reciprocity, derived from the methodology proposed by Guo et al. [25]. A critical prerequisite for this analysis is the scientific definition of the “Visual Boundary Curves”—specific linear sources from which visual rays are cast towards the building.
Guo et al. demonstrated that for a neighborhood block, the maximum potential visual scope is defined by the union of visual fields from an ‘Optimal Viewpoint Combination’—specifically, viewpoints located at the site boundary closest to the landscape and at the maximum permissible building height. However, this model assumes a vertically continuous visual corridor; it may become invalid in the presence of intervening overhead obstructions (e.g., viaducts) that segment the view, thereby rendering the simplified landscape boundary curve insufficient.
Assuming unobstructed conditions, the viewshed boundary generated by this optimal combination represents the theoretical maximum visibility range for the entire site. Geometrically, if a viewer can see the nearest edge of a landscape (such as a riverbank), they would naturally have visual access to the landscape’s broader expanse. Consequently, the visual field from any point within the residential cluster constitutes a subset of this maximum scope.
Therefore, this study adopts the boundary lines of this maximum viewshed as the Visual Boundary Curves. For instance, for a river, these curves correspond to the line along the opposite riverbank; for a mountain, they correspond to the ridge line. These curves serve as the valid emission sources for the inverse ray-casting process. If rays emitted from points on these boundary curves can reach the faces of the target building mesh without obstruction, those faces are recognized as having access to the landscape view and are thus categorized as part of the LVS.
2.2.2. Computational Workflow for Visibility Analysis
In the Rhinoceros 3D platform, geometric objects exist in various structural formats, primarily: NURBS Surfaces, Boundary Representations (Brep), Meshes, and SubD objects [37].
Brep: This format defines geometry using precise mathematical boundaries (NURBS surfaces) combined with topological data (vertices, edges, and faces). It is the standard for high-precision modeling of solids and surfaces.
Mesh: This format approximates geometry using a discrete collection of polyhedral faces (typically triangles or quadrilaterals) defined by vertices. Unlike Breps, meshes allow for discrete data processing, making them ideal for computational analysis.
In this study, the Obstruction Environment—including terrain, water bodies, Street trees, Roadside shrubs, and existing buildings—is constructed using Brep models to maintain geometric precision (Figure 2). Conversely, the Target Object (the proposed residential building) is prepared in two formats at the same location: a reference Brep and a computational Quad-Mesh. The Quad-mesh is generated using the “Quad Remesh” algorithm to discretize the continuous building skin into uniform computational units [38]. To illustrate this setup, a standard cube with dimensions of 40 m (L)×30 m (W)×50 m (H) is used as a target prototype. When the quad-mesh edge length is set to 10 meters, the surface of this cube is discretized into 94 mesh faces (F 1−94), as shown in Figure 2.
Visibility calculations are implemented using the Grasshopper visual programming platform (Figure 3). The input parameters for the algorithm include the Target Quad-Mesh, the Obstruction Breps, and the Viewpoint.
The core calculation logic employs a ‘Targeted Ray-Casting’ method (Figure 4). The algorithm constructs lines of sight connecting the Viewpoint (Pview) to the centroid (Ci) of each mesh face on the target object. For the 94-face cube example, this generates 94 initial target rays, which are then categorized into three types based on intersection analysis:
- Type A (Environmentally Occluded): Rays that intersect with any object in the obstruction environment (terrain, surrounding buildings, etc.). These are marked as blocked.
- Type B (Self-Occluded): Rays that do not hit the environment but intersect the target object itself at a point closer than the target centroid (i.e., intersection distance < original ray length). This occurs when a face is on the back side of the building relative to the viewer.
- Type C (Effective Lines of Sight): The remaining rays that encounter no obstructions. These rays maintain their original length and successfully reach the target faces.
Based on this classification, the mesh faces corresponding to Type C rays are identified as visible. The algorithm then reconstructs these valid faces into a new geometric entity called the “Visible Mesh.” In the cube example, the result identifies 27 effective rays, corresponding to a Visible Mesh area of 2700 m2 (Figure 4).
The precision of the Quad-Remesh conversion directly influences the calculation results. As the target edge length decreases, geometric fidelity increases, but computational load rises. Table 1 compares the results for the cube prototype with edge lengths ranging from 10 m to 0.5 m.
Using the 0.5 m grid result as the benchmark ground truth, the analysis shows that a 1.0 m grid size achieves a relative accuracy of 99.92%. Since this setting significantly reduces the face count (and thus calculation time) while maintaining near-perfect accuracy, 1.0 meter is selected as the standard precision for this study.
This workflow demonstrates high adaptability to complex architectural forms, such as residential towers with curved balconies. Figure 5 applies this method to a proposed design with 23,207 total quad faces (1m grid). The calculation successfully filters out occluded areas, resulting in a Visible Mesh of 3,992 faces. As shown in the figure, the generated visible surface perfectly matches the visual perspective, validating the algorithm’s reliability for complex morphological combinations.
2.3. Environmental Performance Simulation and Constraints
Architectural form optimization requires a holistic approach where visual aesthetics and physical environmental performance are inextricably linked. Following the visibility analysis, this study extends the simulation workflow to assess sunlight, ventilation, and energy efficiency. To ensure methodological consistency, these environmental simulations are conducted within the same high-precision 3D obstruction environment (comprising terrain, surrounding buildings, and vegetation) as defined in Section 2.2. Furthermore, the simulation grid for the target building maintains the 1.0-meter precision standard, ensuring that data points for visibility, sunlight, and wind pressure are topologically aligned on the building skin.
The environmental analysis is powered by Glodon CONCETTO, an AI-driven architectural design platform [39]. Specifically, its AI Simulation Analysis module leverages advanced computational algorithms to perform automated, multi-dimensional performance assessments. This tool allows for rapid iteration and precise quantification of how the building form interacts with natural forces in a complex occlusion environment.
2.3.1. Sunlight Environment: Mandatory Constraints and Health Metrics
Sunlight is a critical factor for residential health. The assessment is divided into two parts: a mandatory regulatory constraint and a quantitative performance metric.
Mandatory Constraint (Chinese National Standard): According to the “Standard for Urban Residential Area Planning” (GB 50180-2018) in China, at least one habitable room (such as a bedroom or living room) in every household unit must receive a minimum of 2 hours of effective sunlight on the Great Cold Day (January 20th). Any design that fails to meet this threshold is immediately discarded.
Performance Metric (HSPR): In addition to the minimum standard, this study introduces the HSPR to quantify the overall quality of sunlight exposure. Unlike traditional point-based analysis, HSPR measures the extent of the building envelope that functions as a “solar collector” for the unit. It is defined as the percentage of the household’s total perimeter that meets the 2-hour sunlight requirement:
wgere Lsun≥2 h is the length of the exterior wall meeting the sunlight standard, and Ltotal is the total wall perimeter of the household unit. A higher HSPR indicates a unit with superior natural light penetration and better potential for promoting health.
2.3.2. Wind Environment: Natural Ventilation Potential
The building’s aerodynamic form significantly influences both the outdoor pedestrian comfort and the indoor hygrothermal environment.
Outdoor Environment: The building massing is analyzed to ensure it does not create excessive wind turbulence or stagnation zones at the pedestrian level, facilitating outdoor recreational activities.
Indoor Natural Ventilation: In the “Hot Summer and Cold Winter” climate zone, effective natural ventilation is essential for cooling and maintaining air quality. The optimization goal is to maximize the Wind Pressure Difference between the windward (South) and leeward (North) faces of the building. A significant pressure gradient facilitates the “cross-ventilation” effect, which helps remove indoor heat and moisture. The CONCETTO AI simulation calculates the wind speed distribution around the building at a height of 1.5 meters. While this simulation directly outputs wind speed data, the wind pressure difference can be indirectly inferred through Bernoulli’s principle, thereby approximating the building’s natural ventilation potential.
2.3.3. Energy Efficiency: SC
The SC is a fundamental indicator of thermal efficiency. It represents the ratio of the building’s external surface area in contact with the atmosphere (Ftarget) to its enclosed volume (Vtarget).
A lower SC implies a more compact form with less heat loss. According to the General Specifications for Building Energy Conservation and Renewable Energy Utilization (Chinese National Standard GB 55015-2021), the SC for high-rise residential build-ings in this climate zone is subject to a strict limit:
This value serves as a rigid constraint in the optimization process. While lower values are preferred for energy saving, any design exceeding 0.40 is considered non-compliant with national energy codes and is eliminated.
2.4. Case Study: A Residential Project in a Complex Landscape Context
To verify the effectiveness of the proposed coupling mechanism, this study applies the optimization workflow to a real-world residential project, detailing the specific site constraints, the construction of the large-scale simulation environment, and the logic behind the generation of three morphological prototypes for comparative analysis.
2.4.1. Site Context and Landscape Resources
The empirical case study is a residential development project located in Changsha, China. Changsha is a prominent example of a “Landscape City,” characterized by the harmonious integration of mountains, rivers, and the urban fabric. The project site is strategically positioned at the convergence of three primary natural landscape resources, as illustrated in Figure 6.
To precisely quantify the visual potential, these environmental assets are categorized into three distinct landscape typologies that serve as the primary targets for analysis:
- River (Water): The site overlooks the expansive Xiang River to the east, including a prominent river island.
- Mountain: A continuous mountain range (the southern extension of the Yuelu Mountain system) provides a scenic backdrop to the south.
- Park: A large-scale urban ecological park is located immediately to the west.
The plot is shaped by a set of rigid urban constraints that substantially limit design freedom. On the western side, an underground road tunnel and a subway line impose strict structural protection requirements, leaving only a narrow, north–south-oriented strip as the final developable area. Meanwhile, the eastern section is already occupied by three high-rise residential towers (130–150 m) and several four-story auxiliary buildings. Additionally, a residential project to the northwest is currently under construction. Due to updated zoning regulations and a prolonged development timeline, the proposed building faces a strict height limit of 80 m. These combined constraints—the narrow buildable footprint, significant visual occlusion from existing eastern towers, and the strict height cap—create a highly restricted ‘gap.’ Within this confined spatial envelope, optimizing the architectural form becomes critical to maximizing visual access to the surrounding landscape, as traditional design strategies are rendered ineffective by such dense boundary conditions.
2.4.2. Simulation Environment Setup
To accurately quantify the visual interaction between the building and its surroundings, a comprehensive 3D Site Model covering an area of 4500 m × 4500 m was constructed within the Rhinoceros platform (Figure 7). The proposed building is situated at the geometric center of this environment. The model incorporates high-fidelity Brep geometries representing the complex terrain, all existing surrounding buildings, and critical road infrastructure.
Based on this digital environment, and applying the “Visual Boundary Definition” principles established in Section 2.2.1, three distinct Landscape Boundary Curves were extracted to drive the simulation. As shown in Figure 7, these curves do not merely trace geometric edges but serve as the source trajectories for the inverse visibility calculation:
- River Surface Curve: Rather than using a simple geometric centerline, this curve is extracted to represent the maximum river-view extent relevant to the site, thereby ensuring the accuracy of the visibility calculation.
- Mountain Ridgeline Curve: Defined along the crest of the southern mountain range. As the highest visible contour, this curve dictates the vertical silhouette of the landscape background. Any line of sight reaching the ridgeline implies visual access to the mountain mass below.
- Park Boundary Curve: Defined along the interface between the urban fabric and the ecological park, representing the near-field visual boundary of the western green space.
A critical divergence from previous methodologies lies in the analysis range. While Guo et al. [25] limited their visual structure analysis to a 800-meter radius, the scale of the Xiang River and Yuelu Mountain landscape necessitates an extended range of 2250 meters. At such a magnitude, traditional “diverging ray-casting” methods become ineffective, as the angular spread would cause the spatial gap between rays to exceed the dimensions of the target building elements. This limitation fundamentally justifies the adoption of the “Targeted Ray-Casting” method (Section 2.2.2). By anchoring the calculation to the discretized mesh faces of the target object, this approach effectively decouples simulation precision from visual distance, maintaining consistent accuracy across the entire 2250-meter range without the resolution degradation inherent in traditional methods.
2.4.3. Design Evolution and Morphological Prototypes
The architectural form was not generated by a black-box algorithm but through a rigorous design process led by architects to balance site-specific constraints with environmental performance. From the numerous variations explored during the design phase, three distinct morphological prototypes were selected as representative samples for this study. As illustrated in Figure 8, these prototypes reflect the logical evolution of the design strategy in response to the complex site conditions.
The specific design logic and morphological characteristics of each prototype are detailed as follows:
- Initial Scheme: The Compact Tower. This prototype represents the initial passive response to the rigid site limitations. Constrained by the underground tunnel control line to the west and the existing high-rise towers to the east, the buildable area is reduced to a narrow, north-south oriented strip. To maximize land-use efficiency within these setbacks, the architects adopted a centralized core layout with a compact, minimal footprint. While this form strictly adheres to the zoning boundaries, its dense massing results in a “thick” floor plate, which potentially limits the width of view corridors and the depth of natural light penetration.
- Iteration Scheme: The Dispersed Tower. In an effort to break the limitations of the compact form, the design team explored various dispersed layouts, with the Dispersed Tower presented here as a representative outcome of this exploration phase. The core strategy here was to “fragment” the building mass. By expanding the perimeter and articulating the volume into smaller, interconnected blocks, this scheme aims to increase the number of “corner units” and widen the visual interface with the external landscape. This morphological shift reflects an active attempt to maximize landscape accessibility and natural ventilation potential through geometric manipulation.
- Optimized Scheme: The Slab-Tower Hybrid. The final optimized scheme seeks a synthesis between the compactness of the initial Compact Tower and the openness of the iterative Dispersed Tower. It combines the slender, efficient profile of a slab building with the multi-directional orientation of a tower. The massing is strategically articulated to maintain the benefits of wide view corridors while controlling the overall complexity of the building envelope. This prototype represents a balanced architectural solution intended to harmonize visual performance with functional rationality under the strict 80-meter height limit.
3. Results
3.1. Geometric Efficiency Analysis
Geometric efficiency in this study refers to the balanced relationship between a building’s landscape accessibility and its energy-related form performance. Ideally, the architectural form should maximize landscape visibility while maintaining low envelope-driven energy demand. Accordingly, the analysis proceeds in three steps: first, examining the inherent geometric attribute of the form (Shape Coefficient); second, quantifying landscape visibility from both global LVS and target-based perspectives; and finally, synthesizing these metrics to determine “Visual Morphological Efficiency,” which characterizes the balance between landscape acquisition and energy conservation.
3.1.1. Inherent Geometric Attribute: SC
The SC is an inherent geometric attribute of architectural form and is commonly adopted as a proxy for envelope-related energy performance, where a lower SC generally indicates a more compact mass with reduced heat-transfer area. In the present context, however, its implication for landscape visibility is not straightforward because visibility is governed not only by envelope extent but also by self-occlusion and external blockage within a dense urban setting. All three schemes satisfy the regulatory threshold (SC ≤ 0.40) for the “Hot Summer and Cold Winter” climate zone, yet they differ in compactness: the Compact Tower achieves the lowest SC (0.302), the Dispersed Tower exhibits the highest SC (0.348) due to its fragmented massing, and the Slab–Tower Hybrid remains intermediate (0.326), indicating a balanced degree of compactness and articulation.
3.1.2. Landscape Visibility Assessment: Cumulative LVS and Viewpoint-Specific Rates
To precisely quantify the natural landscape acquisition of the proposed project (the Target), we defined specific landscape boundary curves and established a series of “Estimated Effective Viewpoints” along each curve:
- River Landscape: 20 estimated effective viewpoints (No. 0–19).
- Mountain Landscape: 14 estimated effective viewpoints (No. 0–13).
- Park Landscape: 20 estimated effective viewpoints (No. 0–19).
Based on these defined viewpoints, we employed two complementary methods to quantify visibility:
- Cumulative LVS areas:
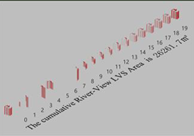
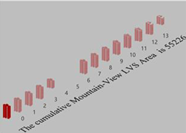
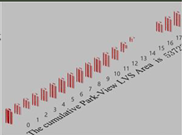
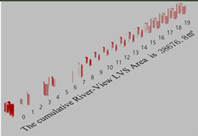
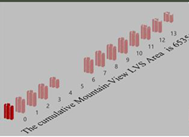
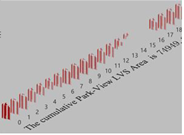
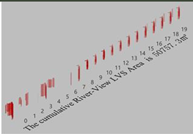
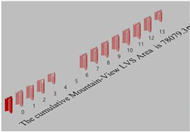
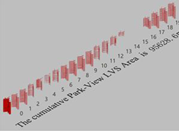
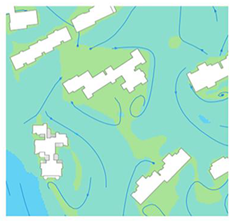
Landscape accessibility is evaluated through the cumulative LVS areas associated with each landscape category (Figure 9, Table 2). The green rays in Figure 9 illustrate the inverse targeted ray-casting from the landscape boundary curves to the building envelope, determining the specific surface areas visible from each resource. The results show a consistent hierarchy, with the Slab–Tower Hybrid performing best across view types. Taking Park-View as an illustrative example, the Hybrid reaches a cumulative Park-View LVS of 95,628.6 m², which is approximately 1.8 times that of the Compact Tower (53,723.9 m²) and 1.3 times that of the Dispersed Tower (74,949.2 m²). River-View and Mountain-View exhibit the same overall pattern, indicating that the Hybrid form provides the most effective visual access under the given occlusion conditions.
- 2.
- Viewpoint-Specific Surface Visibility Rate (Rv)
To reveal the distribution of visibility across the landscape boundaries, we calculated the Surface Visibility Rate for each specific estimated effective viewpoint. This is defined as the percentage of the Target’s visible mesh area (seen from a specific viewpoint) relative to the Target’s total envelope surface area:
where i corresponds to the specific viewpoint number on the landscape curve. Figure 10 integrates these rates into line charts, clearly illustrating the performance differences.
- River View (Figure 10-a): The Slab-Tower Hybrid (Grey line) shows a distinct advantage. Notably, at Viewpoint 3, the Hybrid achieves a visibility rate exceeding 40%, whereas the other prototypes remain below 20%. It maintains a consistent lead from Viewpoint 7 to 19.
- Mountain View (Figure 10-b): The Hybrid maintains a high-efficiency “plateau,” with visibility rates consistently exceeding 50% for Viewpoints 0–2 and 6–10, significantly outperforming the Compact Tower (~40%) and Dispersed Tower (<38%).
- Park View (Figure 10-c): Similarly, the Hybrid peaks near 50% visibility and maintains a substantial margin over the others across the majority of sampling points (No. 0–10 and 16–19).
3.1.3. Synthesis: Balancing Energy Conservation and Landscape Acquisition
A key finding emerged when LVS was interpreted alongside the total building surface area. The Dispersed Tower attained higher visibility largely by expanding the building envelope (15,992.5 m²), implying increased construction exposure and potentially greater envelope-related energy losses. In contrast, the Slab–Tower Hybrid achieved the highest cumulative visibility outcomes with a more moderate envelope area (13,385.3 m²) and a lower SC than the Dispersed Tower (0.326 vs. 0.348). This indicated a higher “visual morphological efficiency”: rather than relying on a brute-force increase in surface area, the Hybrid configuration leverages strategic geometric alignment and mass articulation to reduce self-occlusion and better engage available view corridors. Overall, the comparison suggests that, within the same regulatory SC constraint, architectural form-making can substantially influence landscape visibility, and the Slab–Tower Hybrid achieves superior visual returns per unit envelope area by coupling visual performance with geometric compactness.
3.2. Sunlight Environment and Health Metrics
Following the visibility analysis, the study evaluated sunlight performance to ensure that the optimization of landscape views does not compromise solar accessibility, a critical determinant of resident health. The simulation, conducted using Concetto AI, mapped precise solar hours onto every square meter of the building envelope under identical constraints (Figure 11).
As a baseline, the simulation confirms that all three architectural forms satisfy the mandatory code requirement of providing at least 2 hours of sunlight to at least one habitable room per household on the Great Cold Day. However, meeting the minimum code does not equate to uniform living quality. To quantify the disparities in health performance beyond basic compliance, we utilize the HSPR (see Table 3). The HSPR measures the percentage of a household’s external perimeter that receives effective sunlight; a higher value indicates superior solar accessibility, contributing to a healthier and more comfortable indoor environment.
The HSPR results reveal distinct performance characteristics driven by the geometric logic of each prototype:
- Compact Tower: The sunlight distribution exhibits significant unevenness. While some units achieve reasonable values, Unit 4 performs poorly at only 17.50%, and the majority of units are below 30%. This indicates severe self-shading issues inherent to the centralized core layout.
- Dispersed Tower: This form demonstrates the most superior and balanced performance. Three out of five units exceed an HSPR of 46%, with Unit 3 reaching a peak of 51.57%. Even the lowest-performing unit maintains a ratio of 33.02%. The dispersed layout effectively increases the solar exposure perimeter for individual households, eliminating “sunlight dead zones.”
- Slab-Tower Hybrid: The results show a polarized performance. Unit 1 achieves the highest HSPR (58.47%) among all tested units (benefiting from the slab-end position). However, north-facing units (e.g., Units 2 and 4) show lower metrics (approx. 25-26%), relying heavily on south-facing exposure.
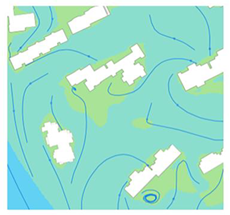
3.3. Wind Environment and Natural Ventilation
The assessment of the wind environment addresses two distinct scales: the outdoor pedestrian comfort and the potential for indoor natural ventilation.
At the site level, the computational fluid dynamics simulation reveals negligible differences among the three architectural forms (Table 4). In winter, wind speeds within the residential cluster remain below 2 m/s, preventing uncomfortable drafts, while summer conditions offer a light breeze across the site. Consequently, all three proposals satisfy the standard comfort requirements for pedestrian circulation and outdoor recreational activities.
However, a critical divergence appears when evaluating the building envelope’s potential for indoor ventilation. In the “Hot Summer and Cold Winter” climate zone, the design priority shifts seasonally: while winter strategy focuses on airtightness for heat preservation, maximizing natural ventilation in summer is paramount for passive cooling and thermal comfort. The simulation results regarding the building envelope (Figure 12) highlight significant performance disparities driven by the morphological traits of each iteration:
- Compact Tower: This form exhibits the poorest ventilation potential. Its bulky, centralized mass creates extensive “Wind Shadow” zones on the leeward side, resulting in stagnant airflows (< 0.2 m/s) around the envelope. This lack of air movement is detrimental to heat dissipation, significantly increasing the reliance on mechanical cooling during summer.
- Dispersed Tower: Despite its fragmented volume, this form suffers from uneven airflow distribution. While corner units experience higher wind velocities, the complex recesses and setbacks induce vortex formation, leading to severe airflow stagnation in the re-entrant corners. This results in poor ventilation equity, where some households enjoy good airflow while neighbors face stagnation.
- Slab-Tower Hybrid: The hybrid form demonstrates optimal ventilation performance. Its articulated linear geometry effectively acts as a wind guide, channeling the prevailing winds to maintain a consistent speed range of 0.4–0.7 m/s (Soft Breeze) across most facades. This stable wind pressure distribution is crucial for facilitating effective cross-ventilation for the majority of residential units.
3.4. Comprehensive Decision
To determine the final architectural prototype, a multi-criteria trade-off analysis was conducted by synthesizing results from the landscape, sunlight, wind, and energy simulations. Table 5 summarizes the comparative performance of the three schemes.
As indicated in Table 5, the Slab–Tower Hybrid is selected as the most suitable solution under the site-specific constraints. The decision follows a clear hierarchy. First, with landscape performance as the primary objective, the Hybrid achieves the highest visual efficiency by aligning its massing with the river and mountain view axes, rather than relying on a simple increase in envelope area as in the Dispersed Tower. Second, regarding the critical health requirement of ventilation, it provides the most stable cross-ventilation potential—an important contributor to summer thermal comfort in Changsha—while avoiding the localized air stagnation observed in the Compact Tower. Third, in terms of constraint management for energy and sunlight, although the Compact Tower is thermally the most efficient, it underperforms in both habitable sunlight access and landscape visibility. The Hybrid scheme offers a more balanced profile: it maintains a moderate SC (0.326), substantially lower than the Dispersed option, while still securing acceptable sunlight conditions for most units.
Consequently, the Slab–Tower Hybrid is selected as the optimal prototype for this site context, as it statistically satisfies the performance constraints while maximizing the primary objective of landscape view access.
4. Discussion
4.1. Decoupling View from Envelope: The Necessity of Precise Computation
This study responds to the fundamental challenge of quantifying landscape accessibility in high-density urban environments. A prevalent assumption in conventional design practice is linear: that maximizing the building envelope naturally leads to maximized views. However, the comparative results between the Dispersed Tower and the Slab-Tower Hybrid refuted this linearity. Although the Dispersed Tower possessed the largest surface area, its effective landscape visibility was compromised by self-shading and mutual occlusion. Conversely, the Slab-Tower Hybrid achieved superior visibility with a smaller, more energy-efficient envelope.
This discrepancy highlights that in complex urban settings, where occlusion environments are stochastic and multi-layered, empirical experience is insufficient. The “view potential” of a site cannot be determined by the sheer quantity of the facade but relies on the precise geometric relationship between the observer and the target. Only through the construction of an accurate inverse-calculation model—predicting occlusion possibilities and tracing visual rays—can architects obtain reliable data on landscape acquisition. This validates the study’s core premise: that accurate quantification is the prerequisite for decoupling landscape maximization from energy inefficiency.
4.2. Site-Specificity and the Scale of Landscape Acquisition
The coupling of architectural form with natural landscape is not merely an aesthetic intuition but a quantifiable data description rooted in site-specificity [40]. The essence of this research is to predict the landscape accessibility for future residents realistically. In this specific case study, the target resources are large-scale natural entities: the Xiang River, the Mountain, and the Urban Park. The modeling strategy deliberately omitted vegetation interference for two reasons: first, the permeability of foliage allows for partial visibility [41]; second, trees primarily affect the lower floors, whereas the focus here is on the macro-relationship between the high-rise massing and the distant horizon [42].
However, this method is scale-dependent. If the research object were a small-scale landscape feature—for instance, if the abstract viewpoint used in the algorithm validation (Section 2, Figure 5) were hypothetically assumed to be a garden sculpture—vegetation occlusion would become a critical variable [43]. In such micro-scale scenarios, the model would need to account for the specific canopy dimensions to accurately measure the visible wall area. Thus, the proposed workflow is adaptable: it provides a rigid framework for quantification, but the definition of “obstacles” must be adjusted according to the scale of the landscape target (Macro vs. Micro).
4.3. Evidence-Based Design Strategies: From Morphological Topology to Programmatic Intervention
The core value of the proposed computational workflow lies in its ability to translate simulation data into tangible architectural strategies. Architectural design in this climate zone inevitably faces a “Vectorial Conflict”: the Solar Axis (optimal South orientation for thermal and health performance) opposes the Landscape Axis (East for the River, West for the Park). To address this, the Slab-Tower Hybrid employs a strategy of Topological Differentiation. The massing is twisted to capture the eastern river view and western park view. However, this morphological optimization introduces a secondary challenge: the orientation of the slab components deviates from the strict South, creating a bias towards the Southeast and Southwest. This deviation exposes the facade to excessive solar radiation during summer.
The simulation results necessitated a compensatory architectural intervention to resolve this thermal drawback. As illustrated in Figure 13, the design introduces Sky Communal Terraces to mitigate the solar gain while enhancing living quality. The specific generation mechanism and multidimensional benefits of this strategy are articulated as follows:
- Programmatic Interlocking (The 9-Meter Logic):
The distinct 9-meter clear height of these terraces is derived from the structural rhythm of the unit mix. The design systematically integrates Duplex Units (spanning floors H and H+1) with Simplex Units (on floor H+2). By staggering the terrace locations—for instance, positioning the Duplex terrace on the West and the Simplex terrace on the East—a vertical void spanning three structural floors is created above each platform. This rhythmic arrangement articulates the facade and generates voluminous, airy communal pockets within the high-rise density.
- 2.
- Climatic Response (Solar Altitude & Shading):
These terraces function as effective horizontal shading devices. In the “Hot Summer and Cold Winter” zone (Changsha, approx. 28°N), the Solar Altitude Angle is extremely high during the summer solstice, peaking near 85° around noon. The deep overhangs of the terraces are strategically designed to block direct solar radiation during the critical high-intensity window of 11:00–13:00. By intercepting the steep solar rays before they reach the interior, the terraces significantly reduce the cooling load despite the building’s orientation deviation.
- 3.
- Dual Functionality (Social & Viewing):
Beyond their climatic function, these terraces serve as superior observation decks. Compared to indoor windows, these semi-outdoor platforms offer wider, frameless panoramic views of the river and mountains, creating a high-quality social space for residents to engage with the natural environment.
By integrating morphological twists with climatic shading structures, the study demonstrates a holistic Evidence-Based Design process. It proves that architectural form optimization is not about finding a “perfect” shape, but about balancing conflicting vectors (View vs. Sun) through specific spatial interventions [44].
4.4. Methodological Applicability and Directions for Further Optimization
This study presents a specific optimal solution—the Slab-Tower Hybrid—tailored to the unique landscape constraints of the Changsha site. It is crucial to acknowledge that while the computational workflow possesses universal applicability, the resulting architectural form is not a generalized formula. Every architectural project is essentially a unique innovation responding to distinct loci [45,46]. The value of this research lies not in prescribing a fixed shape, but in providing a rigorous, evidence-based tool that empowers architects to make informed decisions within complex, site-specific constraints.
While the current workflow successfully resolved the macro-morphological trade-offs, the methodology holds significant potential for deeper integration with architectural tectonics and performance analysis.
First, regarding decision-making in complex scenarios, the current optimization benefited from a site that allowed for the simultaneous maximization of all three landscape types. However, in more intricate urban environments, landscape resources often present conflicting availability. Future research should introduce a weighted evaluation system based on resident preferences or real estate valuation, enabling the algorithm to handle scenarios where trade-offs between different view targets are unavoidable.
More importantly, a critical direction for future research lies in the precise correlation between the “Visible Mesh” and the internal residential layout. Since the computational model has already achieved a high-precision resolution (1m2) for the global envelope, and given that the overall building facade is essentially a composite of the exterior walls of multiple individual residential units, it is computationally feasible to map the global visibility data directly onto specific household envelopes. This data mapping would transform the design process from “Massing Optimization” to “Functional Allocation and Fenestration Strategy.” By identifying the specific facade zones with the highest cumulative visibility for each unit, architects can scientifically align primary habitable rooms (e.g., master bedrooms and living rooms) with these high-value surfaces, while relegating service spaces to low-visibility zones.
Furthermore, this correlation directly dictates the design of the facade openings. Zones with high landscape accessibility warrant maximized glazing to capture the view, whereas zones with negligible visibility should adopt reduced window sizes or solid walls to conserve energy. This inevitably leads to a dialectical conflict between Landscape Acquisition and Thermal Insulation, as larger windows increase solar gain and heat loss. Therefore, a valuable trajectory for future work is to transition from global morphological optimization to local façade articulation. Building upon the optimized form established in this study, future research will investigate the quantitative equilibrium between window-to-wall ratios, visual quality, and energy consumption, thereby achieving a multi-scalar integration of architectural form and detailed fenestration.
5. Conclusions
This study investigated the complex trade-offs between landscape visibility, energy efficiency, and environmental comfort in high-density urban residential design. By comparing three distinct morphological prototypes under identical regulatory constraints, the research identified the Slab–Tower Hybrid as the optimal topological solution for the multi-source landscape context of Changsha.
Quantitative evidence from the simulations confirmed that the Hybrid form successfully resolves the inherent conflict between “View Maximization” and “Energy Conservation.” Unlike the Dispersed Tower, which relies on brute-force envelope expansion to increase visibility (resulting in a higher SC of 0.348), the Hybrid achieves the highest landscape acquisition—exemplified by a cumulative Park-View LVS approximately 1.8 times that of the Compact Tower—while maintaining a moderate SC (0.326). This performance demonstrated a superior “Visual Morphological Efficiency,” effectively delivering “more view with less envelope.” Simultaneously, in terms of environmental health, the Hybrid prototype overcomes the limitations of the other forms by ensuring stable cross-ventilation (0.4–0.7 m/s) and eliminating the “sunlight dead zones” inherent to the centralized core layout, thereby providing a balanced and healthy living environment.
Beyond the specific case study, this research contributes a methodological framework for “Target-Based Visibility Analysis.” Distinct from traditional methods that quantify visibility as a generic percentage of open space, the Inverse Targeted Ray-Casting method developed here shifts the focus to specific landscape resources. By integrating the Rv, the framework allows architects to verify whether the building’s geometric twists accurately align with the vector direction of valuable landscape nodes. This transforms view analysis from a passive post-design check into an active, precision-oriented design driver, ensuring that morphological articulation directly responds to site-specific assets.
Looking forward, while this research established the optimal logic at the morphological massing scale, the comprehensive realization of landscape performance requires a multi-scalar approach. Future research will shift focus from the macro-scale building form to the micro-scale adaptability of unit floor plans and facade articulation. Specifically, subsequent studies will investigate how internal functional layouts, window-to-wall ratios, and balcony configurations can be optimized to further capture the landscape targets defined in this study. The ultimate goal is to integrate these multi-scalar findings into a systematic design framework for high-rise residential architecture that seamlessly bridges the gap between urban morphology, energy constraints, and the human experience of nature.
Author Contributions
Conceptualization, Y.G. and B.G.; methodology, Y.G.; software, Y.G., D.L. and Yu.Z.; validation, Y.G., B.G. and Ye.Z.; formal analysis, Y.G.; investigation, J.Y., and Ye.Z.; resources, Y.G. and B.G.; data curation, Y.G.; writing—original draft preparation, Y.G.; writing—review and editing, Y.G. and B.G.; visualization, Y.G. Ye.Z. and J.Y.; supervision, Y.G.; project administration, Y.G.; funding acquisition, Y.G. All authors have read and agreed to the published version of the manuscript.
Funding
This work was supported by the Key Disciplines of State Forestry Administration of China (No. 21 of Forest Ren Fa, 2016); Hunan Province “Double First-class” Cultivation discipline of China (No. 469 of Xiang Jiao Tong, 2018).
Data Availability Statement
The data that support the findings of this study are available from the authors upon reasonable request.
Acknowledgments
The authors wish to thank Baian Miao, Lecturer at the School of Landscape Architecture, Central South University of Forestry and Technology, for his valuable insights regarding the architectural form design. Special thanks are extended to the undergraduate students from Central South University of Forestry and Technology—Huayue Fan (2021 Cohort), and Yue Zhang, Yihan Xiong, Xia Xu, and Jiashen Li (2022 Cohort)—as well as Xiaoyang Peng, a graduate student at the School of Architecture, Hunan University, for their extensive assistance with drafting and visualization throughout the design process.
Conflicts of Interest
The authors declare no conflicts of interest.
References
- Qi, L.; Hu, Y.; Bu, R.; Xiong, Z.; Li, B.; Zhang, C.; Liu, H.; Li, C. Spatial-temporal patterns and influencing factors of the building green view index: a new approach for quantifying 3d urban greenery visibility. Sustain Cities Soc 2024, 111, 105518. [Google Scholar] [CrossRef]
- Kristl, Ž.; Fošner, A.; Zbašnik-Senegačnik, M. Tolerance to urban window views with various design features. Buildings 2025, 15, 914. [Google Scholar] [CrossRef]
- Patino, J.E.; Martinez, L.; Valencia, I.; Duque, J.C. Happiness, life satisfaction, and the greenness of urban surroundings. Landsc Urban Plan 2023, 237, 104811. [Google Scholar] [CrossRef]
- Li, M.; Xue, F.; Yeh, A.G.O. Bi-objective analytics of 3d visual-physical nature exposures in high-rise high-density cities for landscape and urban planning. Landsc Urban Plan 2023, 233, 104714. [Google Scholar] [CrossRef]
- Kaplan, R. The nature of the view from home. Environ Behav 2001, 33, 507–542. [Google Scholar] [CrossRef]
- Ulrich, R.S.; Simons, R.F.; Losito, B.D.; Fiorito, E.; Miles, M.A.; Zelson, M. Stress recovery during exposure to natural and urban environments. J Environ Psychol 1991, 11, 201–230. [Google Scholar] [CrossRef]
- Kaplan, R.; Kaplan, S.; Ryan, R. With people in mind:design and management of everyday nature; Island Press: Washington DC, 1998; p. 239. ISBN 9781559635943. [Google Scholar]
- He, S.; Zhang, W.; Guan, Y. The impact of building windows on occupant well-being: a review integrating visual and non-visual pathways with multi-objective optimization. Buildings 2025, 15, 2577. [Google Scholar] [CrossRef]
- Jutzi, C.A.; Möller, J.; Hansen, J.; Klackl, J.; Jonas, E. Psychological needs in the built environment. J Environ Psychol 2025, 101. [Google Scholar] [CrossRef]
- Damigos, D.; Anyfantis, F. The value of view through the eyes of real estate experts: a fuzzy delphi approach. Landsc Urban Plan 2011, 101, 171–178. [Google Scholar] [CrossRef]
- Lin, T.Y.; Le, A.V.; Chan, Y.C. Evaluation of window view preference using quantitative and qualitative factors of window view content. Build Environ 2022, 213, 108886. [Google Scholar] [CrossRef]
- Cabeza-Lainez, J.; Almodovar-Melendo, J.M.; Rodríguez-Cunill, I. The search for sustainable architecture in asia in the oeuvre of antonin raymond: a new attunement with nature. Sustainability 2022, 14, 10273. [Google Scholar] [CrossRef]
- Almodovar-Melendo, J.M.; Cabeza-Lainez, J.M.R.A. Environmental features of chinese architectural heritage: the standardization of form in the pursuit of equilibrium with nature. Sustainability 2018, 10, 2443. [Google Scholar] [CrossRef]
- Ko, W.H.; Schiavon, S.; Santos, L.; Kent, M.G.; Kim, H.; Keshavarzi, M. View access index: the effects of geometric variables of window views on occupants’ satisfaction. Build Environ 2023, 234, 110132. [Google Scholar] [CrossRef]
- Molaei, P.; Hashempour, P.; Tang, L.M. Semi-open spaces of apartments considering COVID-19 pandemic: general expectations of balcony design in the post-pandemic world. Archit Eng Des Manag 2021, 18, 705–722. [Google Scholar] [CrossRef]
- Marcus, L.; Pont, M.B.; Barthel, S. Towards a socio-ecological spatial morphology: integrating elements of urban morphology and landscape ecology. Urb Morphol 2022, 23. [Google Scholar] [CrossRef]
- Batty, M. Exploring isovist fields: space and shape in architectural and urban morphology. Environment and Planning B: Planning and Design 2001, 28, 123–150. [Google Scholar] [CrossRef]
- Suleiman, W.; Joliveau, T.; Favier, E. A new algorithm for 3d isovists. In Advances in Spatial Data Handling; Timpf, S., P, L., Eds.; Springer Berlin Heidelberg: Berlin, Heidelberg, 2012; pp. 157–173. ISSN ISBN 1867-2434. [Google Scholar]
- Chmielewski, S.; Tompalski, P. Estimating outdoor advertising media visibility with voxel-based approach. Appl Geogr 2017, 87, 1–13. [Google Scholar] [CrossRef]
- Benedikt, M.L. To take hold of space: isovists and isovist fields. Environment and Planning B: Planning and Design 1979, 6, 47–65. [Google Scholar] [CrossRef]
- Wilson, J.; Lindsey, G.; Liu, G. Viewshed characteristics of urban pedestrian trails, indianapolis, indiana, USA. J Maps 2008, 4, 108–118. [Google Scholar] [CrossRef]
- Fisher-Gewirtzman, D.; Natapov, A. Different approaches of visibility analyses applied on hilly urban environment. Surv Rev 2014, 46, 366–382. [Google Scholar] [CrossRef]
- Fisher-Gewirtzman, D. Integrating ‘weighted views’ to quantitative 3d visibility analysis as a predictive tool for perception of space. Environ Plan B Urban Anal City Sci 2018, 45, 345–366. [Google Scholar] [CrossRef]
- Kim, H.; Yi, Y.K. QuVue implementation for decisions related to high-rise residential building layouts. Build Environ 2019, 148, 116–127. [Google Scholar] [CrossRef]
- Guo, Y.; Lai, D.; Hu, X. Measuring river-view visibilities of individual dwellings for planning of compact urban riverside neighborhood blocks. Sustainability 2023, 15, 7059. [Google Scholar] [CrossRef]
- Guo, Y.; Hu, X.; Tang, J. Structural landmark salience computation in compact urban districts with 3d node-landmark grid analysis model: a case study on two sample districts in changsha, china. Buildings 2023, 13, 1024. [Google Scholar] [CrossRef]
- Fisher-Gewirtzman, D. The association between perceived density in minimum apartments and spatial openness index three-dimensional visual analysis. Environ Plan B Urban Anal City Sci 2017, 44, 764–795. [Google Scholar] [CrossRef]
- Yosifof, R.; Fisher-Gewirtzman, D. Hybrid quantitative mesoscale analyses for simulating pedestrians’ visual perceptions: comparison of three new york city streets. Environ Plan B Urban Anal City Sci 2024, 51, 140–156. [Google Scholar] [CrossRef]
- Rashid, M.; Ara, D.R. Designed outdoor spaces and greenery in a brownfield inner city area: a case study from sydney. Landsc Res 2015, 40, 795–816. [Google Scholar] [CrossRef]
- Carmona, M.; Tiesdell, S.; Heath, T.; Oc, T. Public places - urban spaces: the dimensions of urban design, 2 ed.; Architectural Press of Elsevier: Burlington, USA, 2010; ISBN 13: 978-1-85617-827-3. [Google Scholar]
- Oxman, R. Theory and design in the first digital age. Des Stud 2006, 27, 229–265. [Google Scholar] [CrossRef]
- Geng, L.; Gao, J.; Xue, M.; Yang, Y. LCA views of low-carbon strategy in historic shopping district decoration—case study in harbin. Buildings 2025, 15, 2944. [Google Scholar] [CrossRef]
- MOHURD; Ministry of Housing and Urban-Rural Development of the People’s Republic of China. GB 55015-2021; General Code for Energy Efficiency and Renewable Energy Application in Buildings. China Architecture & Building Press: Beijing, China, 2021.
- Caswell, H.; Alidoust, S.; Corcoran, J. Planning for livable compact vertical cities: a quantitative systematic review of the impact of urban geometry on thermal and visual comfort in high-rise precincts. Sustain Cities Soc 2025, 119, 106007. [Google Scholar] [CrossRef]
- Al-Kodmany, K.M. Sustainable tall buildings: cases from the global south. International Journal of Architectural Research: ArchNet-IJAR 2016, 10, 52–66. [Google Scholar] [CrossRef]
- Fisher-Gewirtzman, D.; Polak, N. A learning automated 3d architecture synthesis model: demonstrating a computer governed design of minimal apartment units based on human perceptual and physical needs. Archit Sci Rev 2019, 62, 301–312. [Google Scholar] [CrossRef]
- Wang, Q.; Gao, B.; Li, T.; Wu, H.; Kan, J.; Hu, B. A triangular mesh generator over free-form surfaces for architectural design. Autom Constr 2018, 93, 280–292. [Google Scholar] [CrossRef]
- Shi, Z.; Dai, H. Generative design methodology using non-uniformmesh subdivision based on internal force. In Proceeding of the Proceedings of the IASS 2024 Symposium: Redefining the Art of Structural Design, Zurich, Switzerland, 2024. [Google Scholar]
- Glodon. CONCETTO AI simulation analysis; Beijing, 2024. [Google Scholar]
- Urech, P.R.W.; Dissegna, M.A.; Girot, C.; Grêt-Regamey, A. Point cloud modeling as a bridge between landscape design and planning. Landsc Urban Plan 2020, 203, 103903. [Google Scholar] [CrossRef]
- Lopes, A.S.; Macedo, D.V.; Brito, A.Y.S.; Furtado, V. Assessment of urban cultural-heritage protection zones using a co-visibility-analysis tool. Computers, Environment and Urban Systems 2019, 76, 139–149. [Google Scholar] [CrossRef]
- Wang, F.; Munakata, J. Assessing effects of facade characteristics and visual elements on perceived oppressiveness in high-rise window views via virtual reality. Build Environ 2024, 266, 112043. [Google Scholar] [CrossRef]
- Bartie, P.; Reitsma, F.; Kingham, S.; Mills, S. Incorporating vegetation into visual exposure modelling in urban environments. Int J Geogr Inf Sci 2011, 25, 851–868. [Google Scholar] [CrossRef]
- De Luca, F.; Natanian, J.; Wortmann, T. Ten questions concerning environmental architectural design exploration. Build Environ 2024, 261, 111697. [Google Scholar] [CrossRef]
- Lawson, B. How designers think:the design process demystified; Architectural Press, 2005. [Google Scholar]
- Peng, Z.; Zhang, Y.; Lu, W.; Li, X. Data-driven generative contextual design model for building morphology in dense metropolitan areas. Autom Constr 2024, 168, 105820. [Google Scholar] [CrossRef]
Figure 1.
Flowchart of the morphological optimization framework.
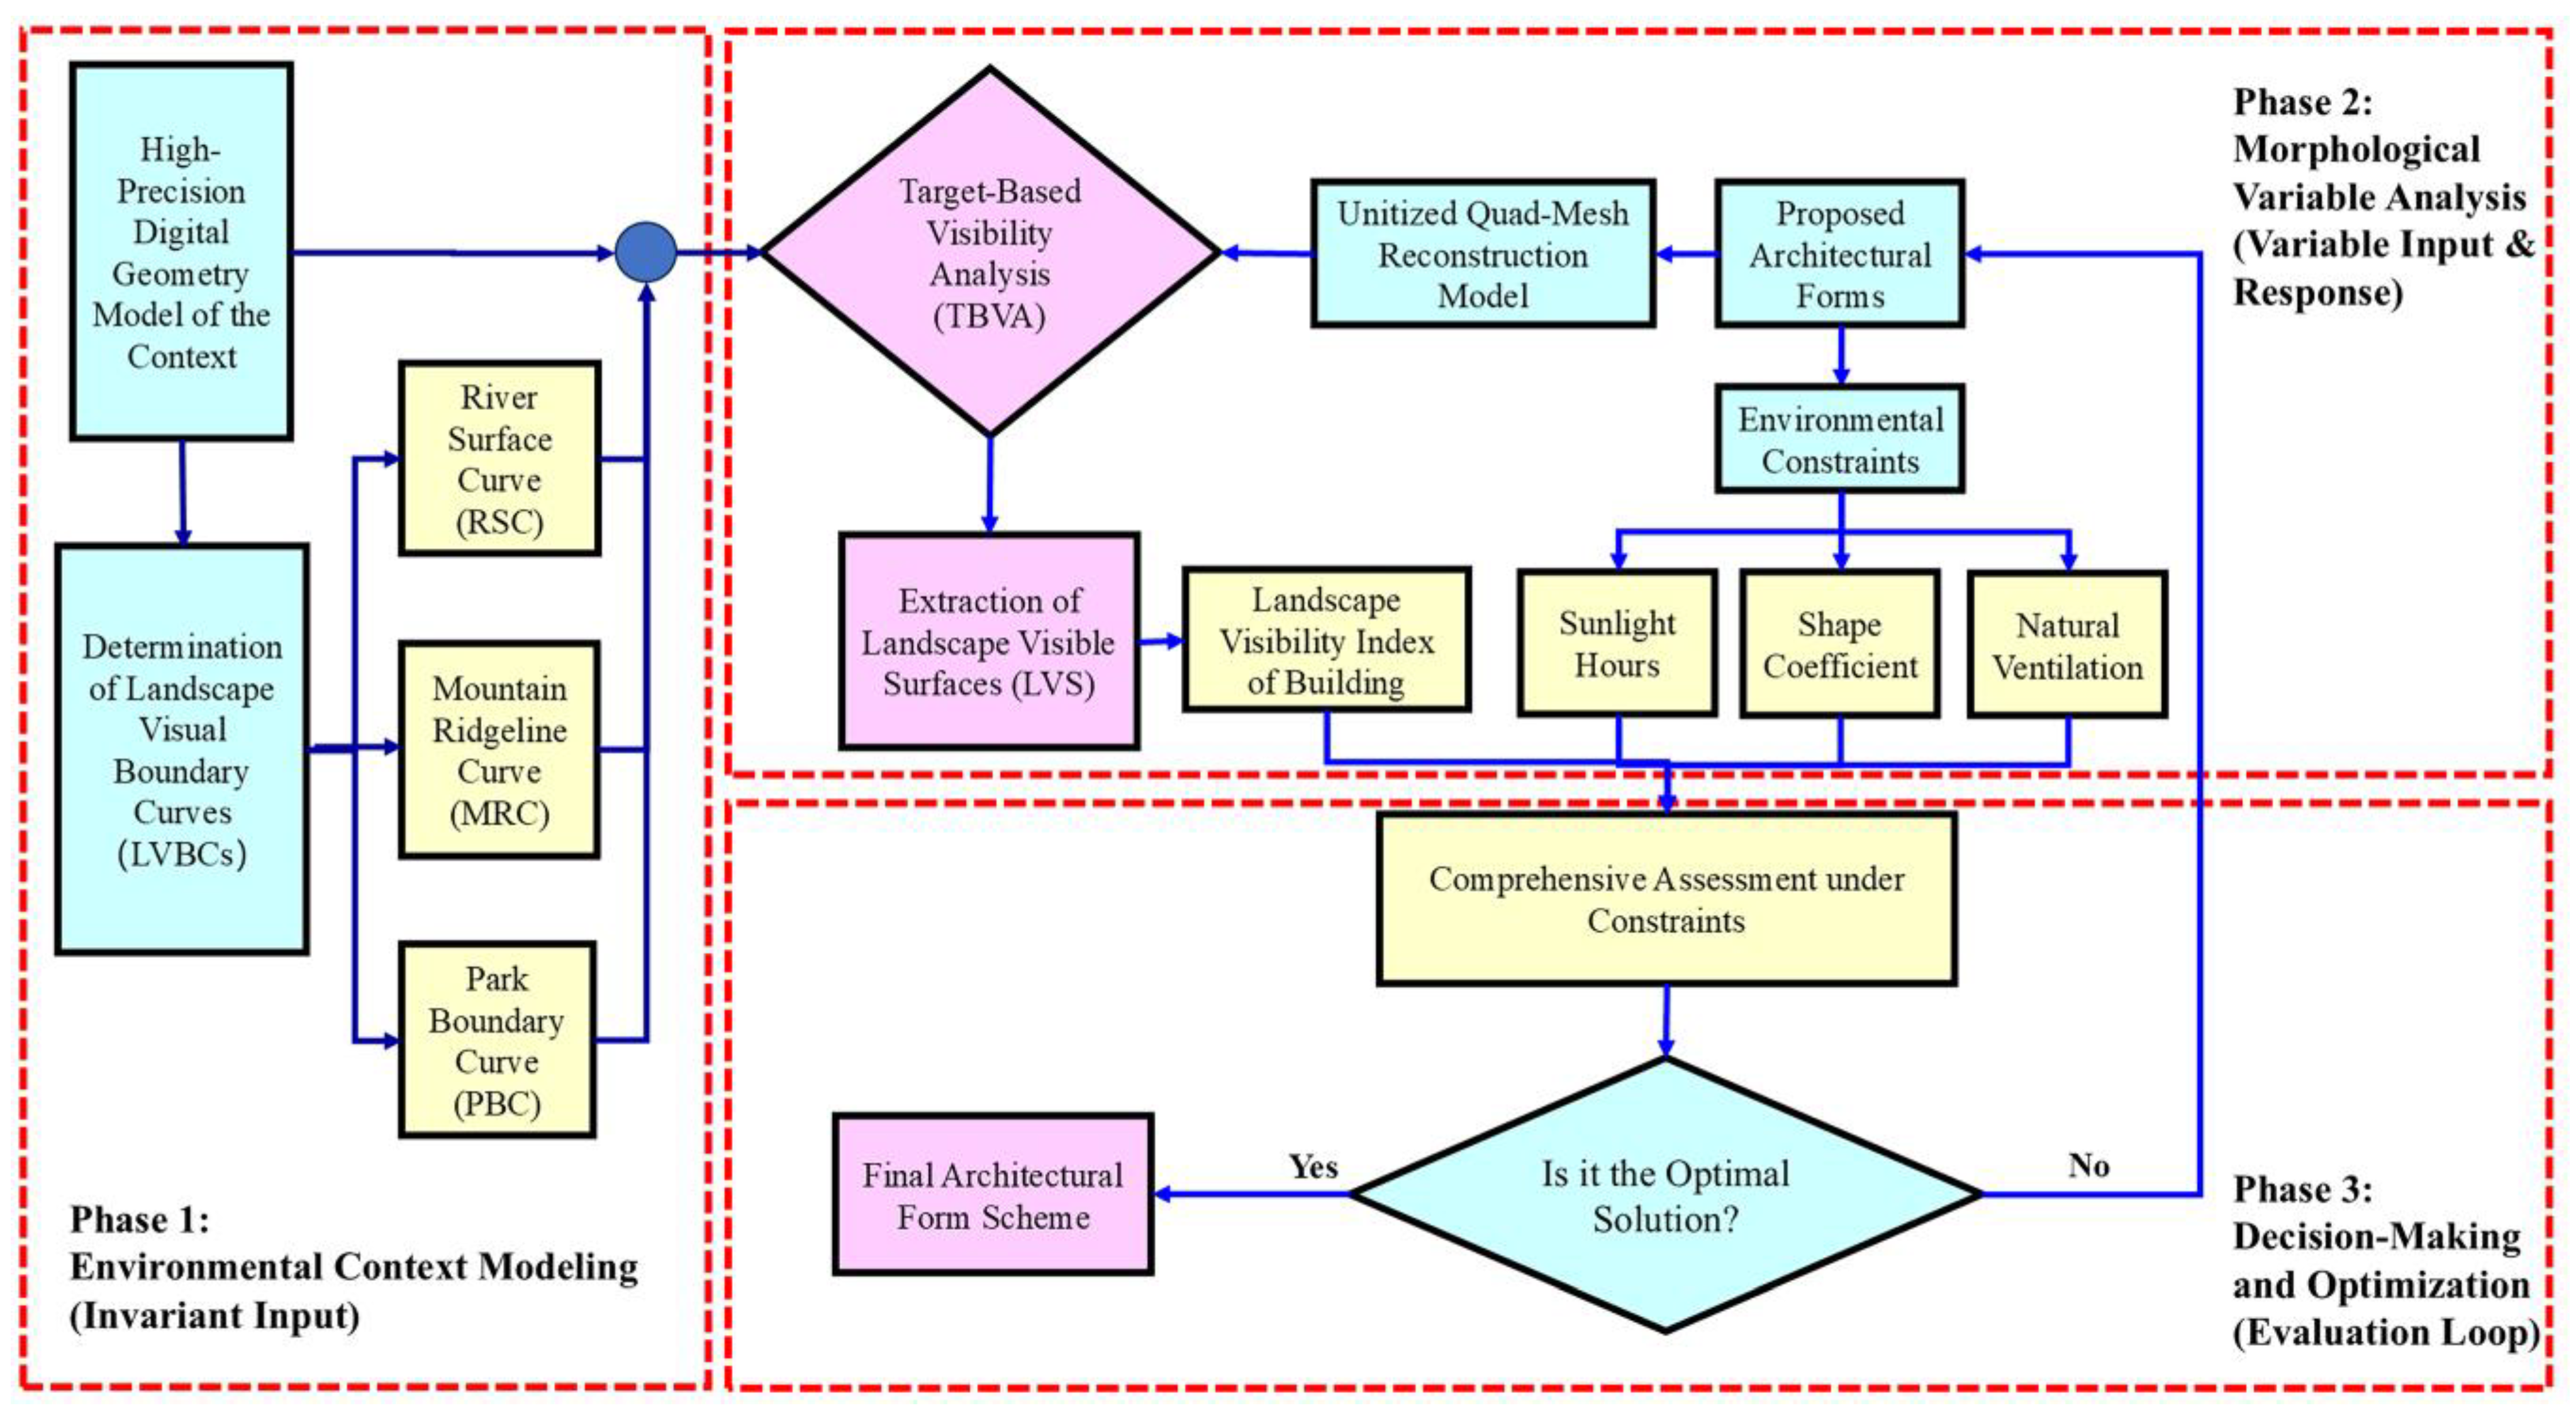
Figure 2.
Modeling of obstructions and Quad-mesh conversion of the target object.
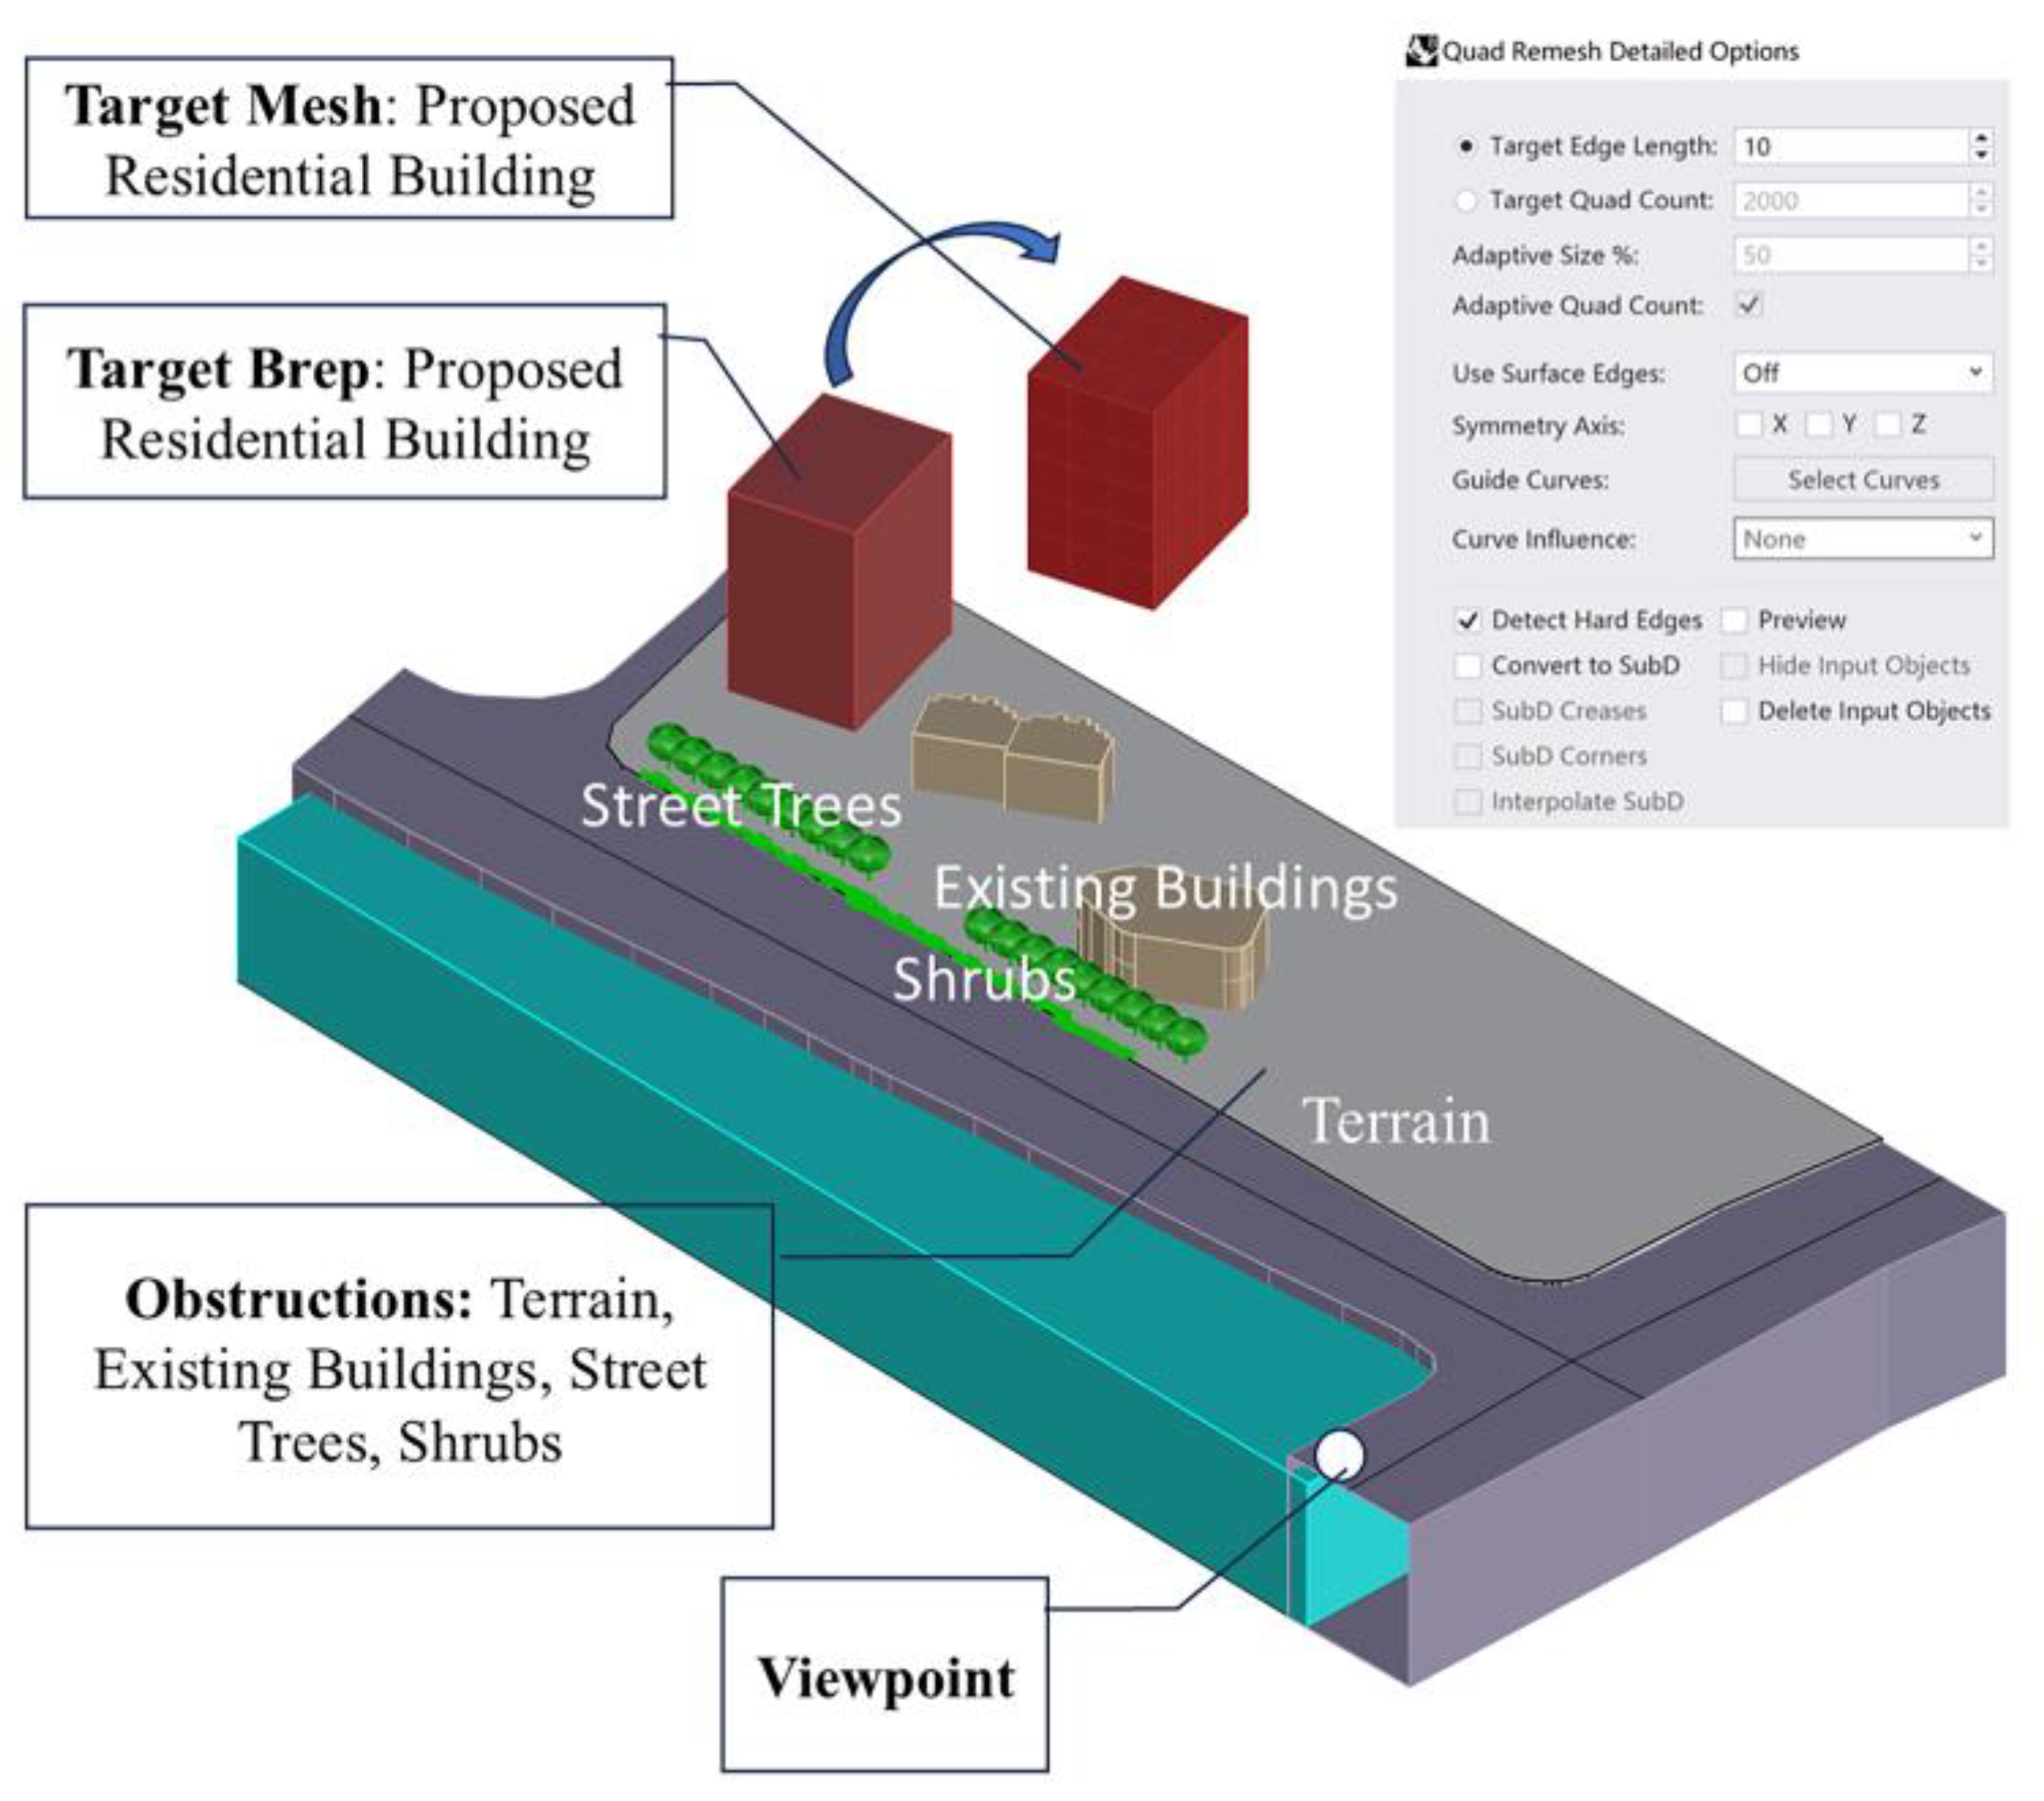
Figure 3.
The computational workflow in Grasshopper.
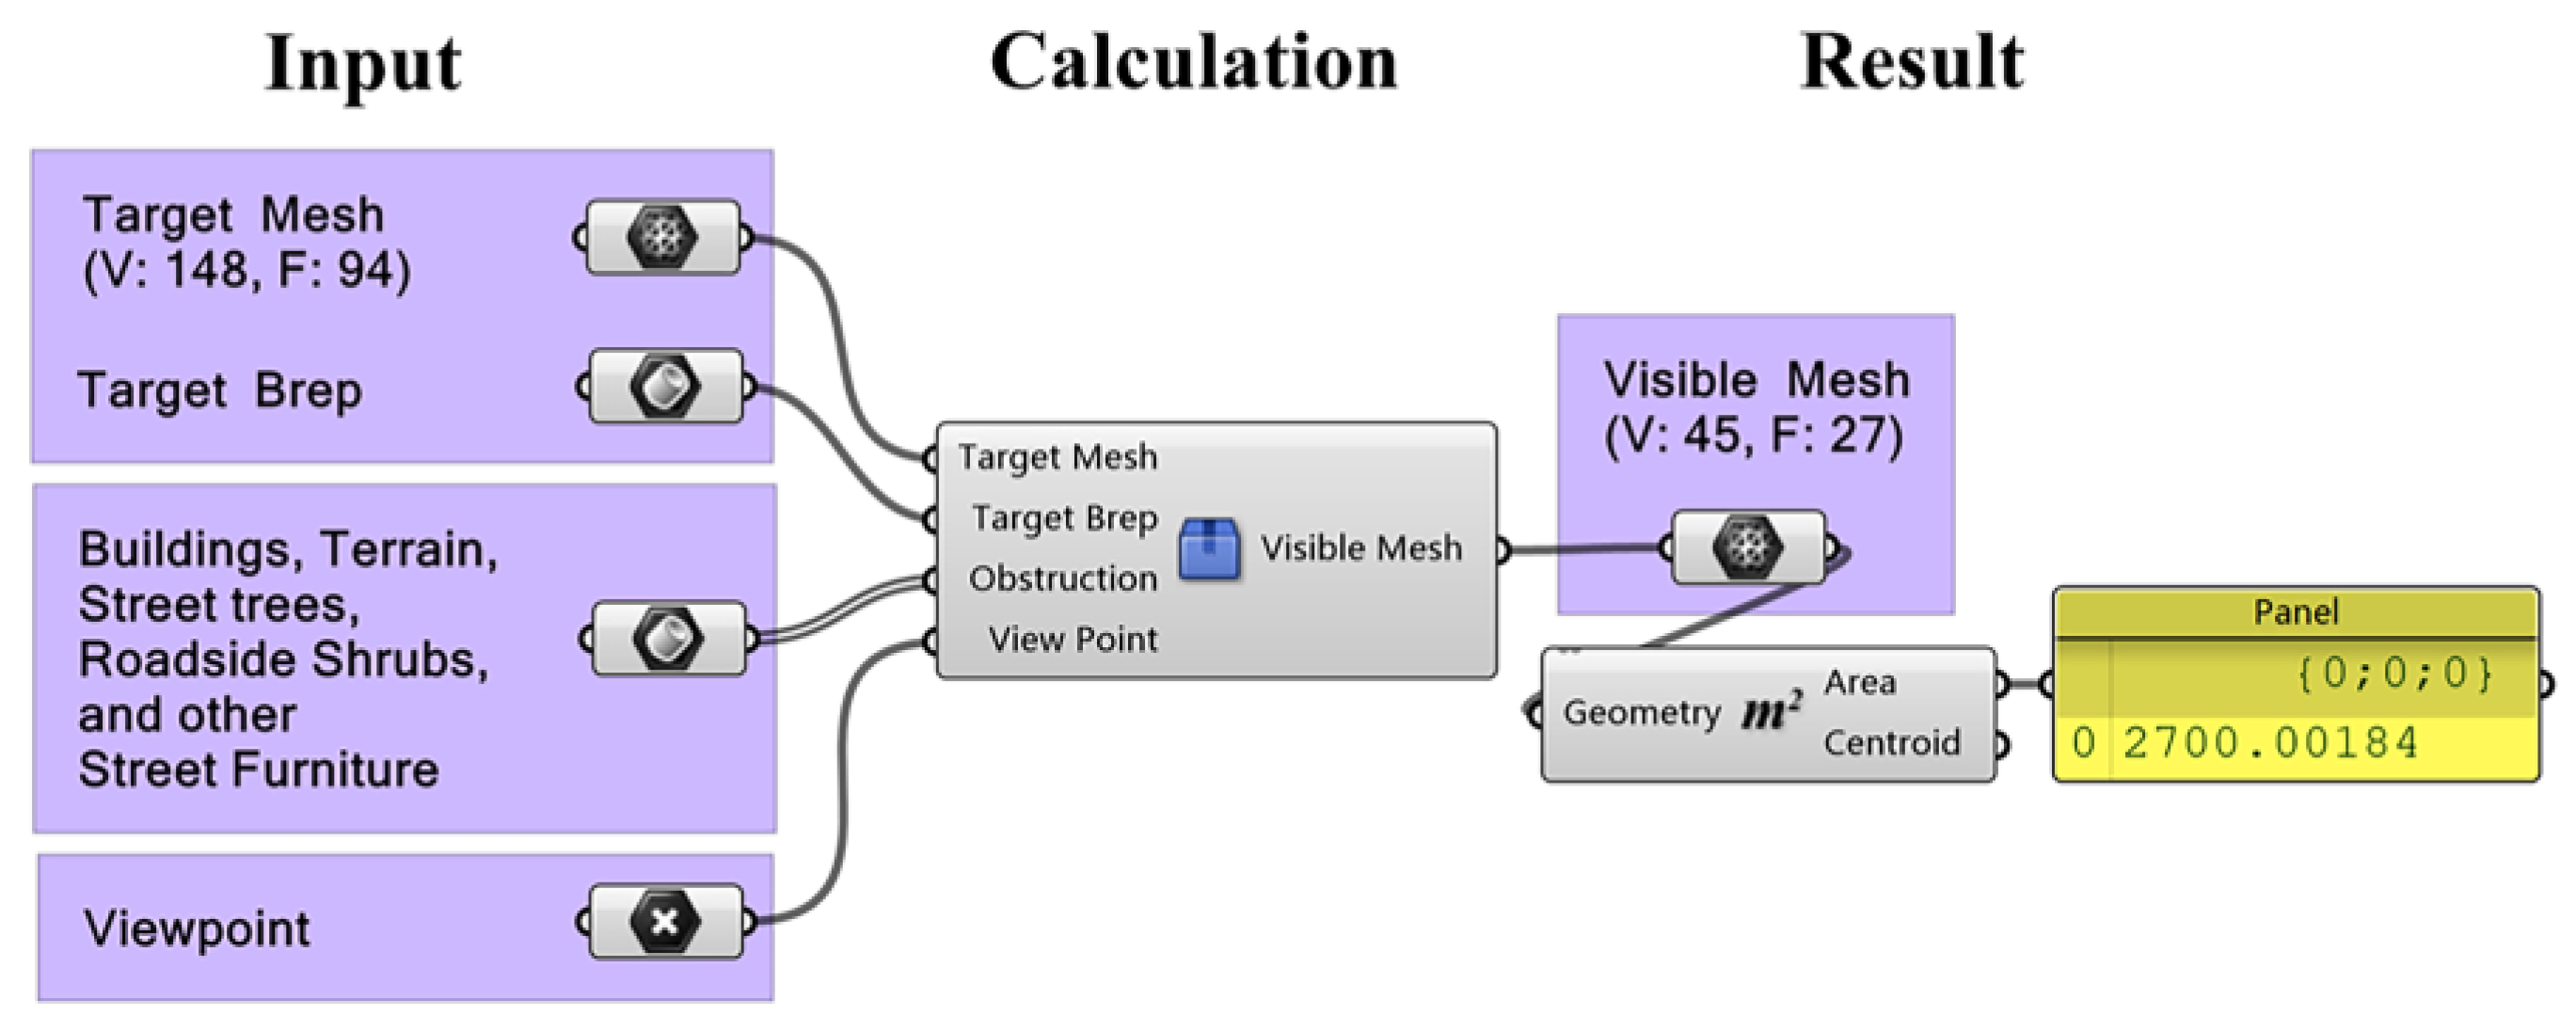
Figure 4.
Diagram of the “Targeted Ray-Casting” method.
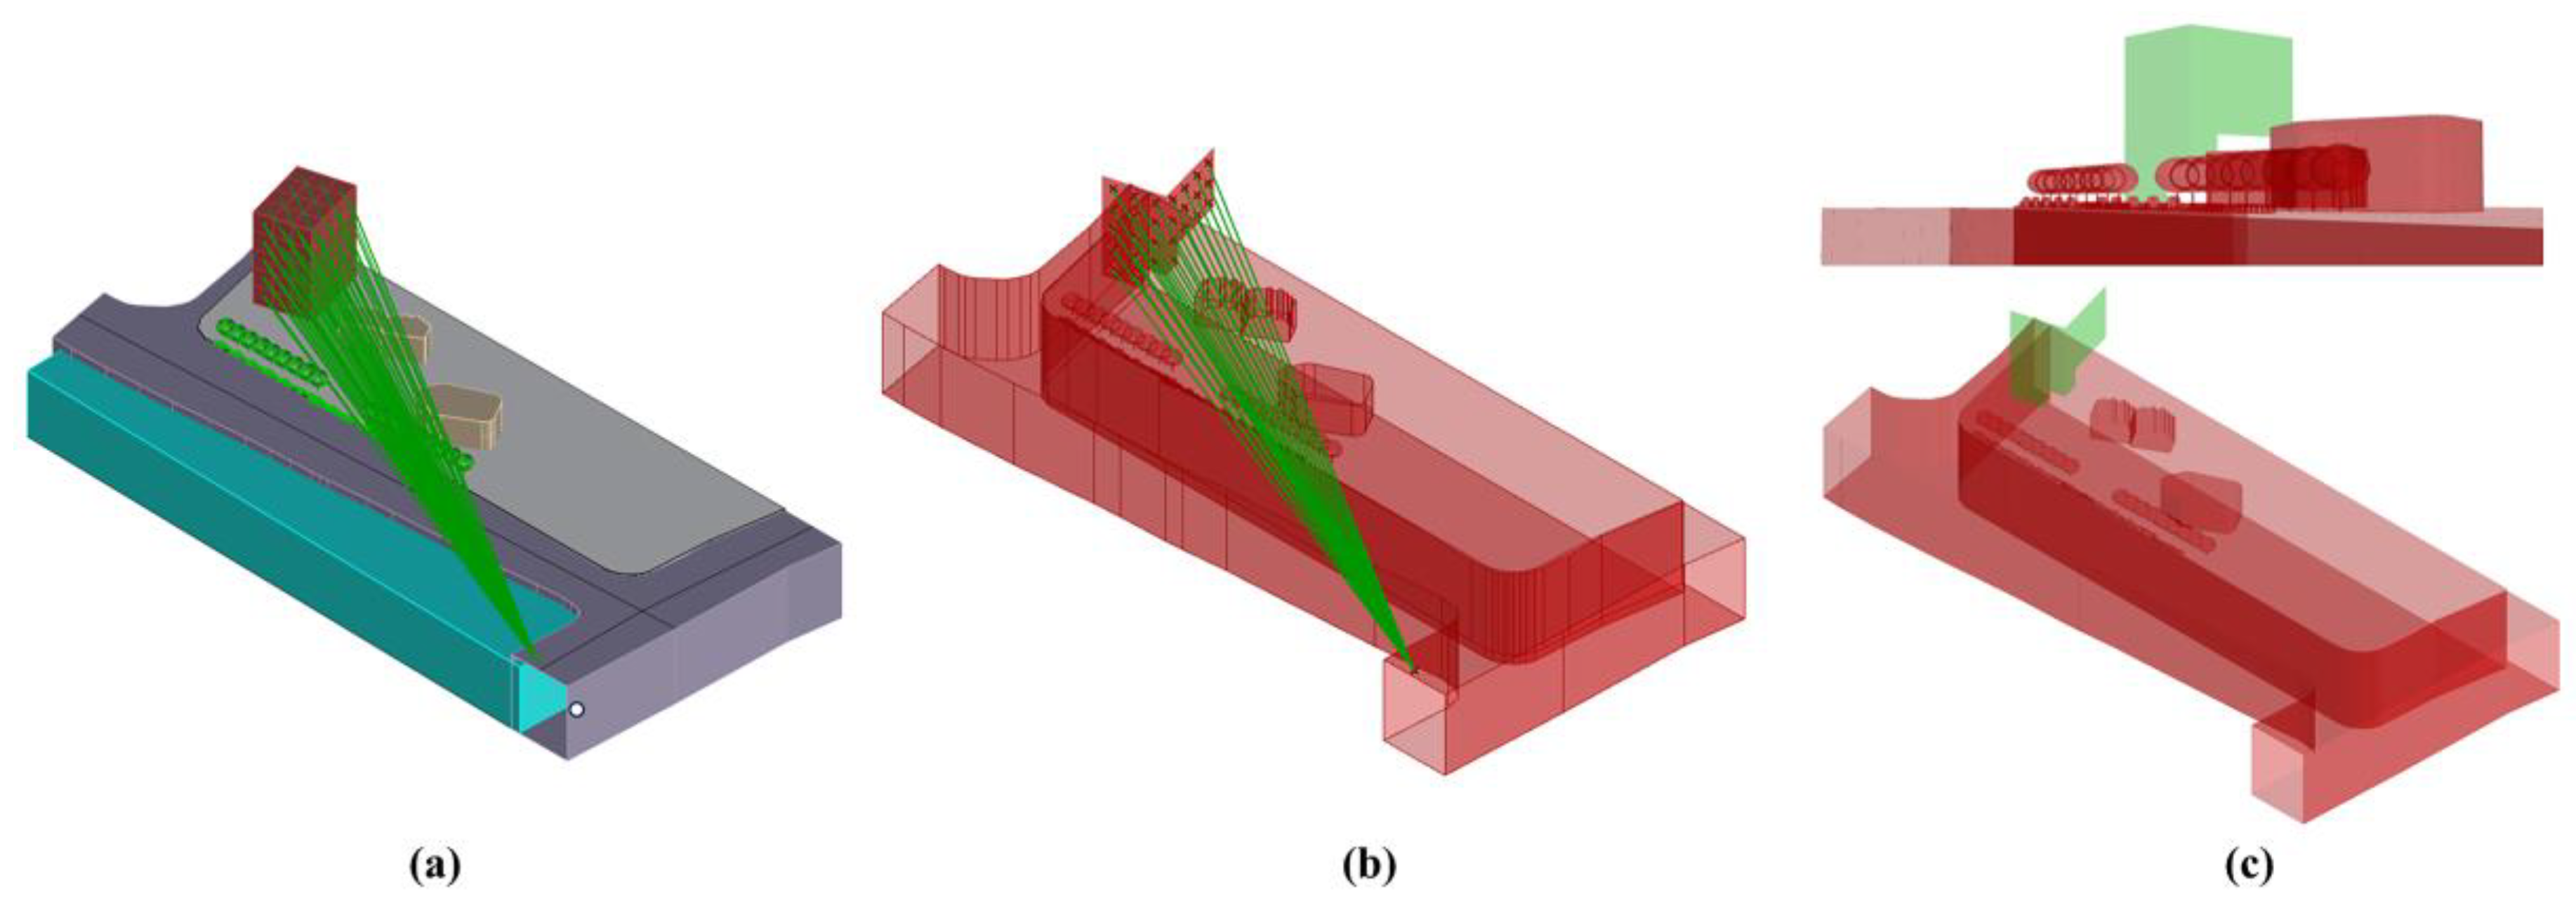
Figure 5.
Algorithm validation on a complex architectural form.
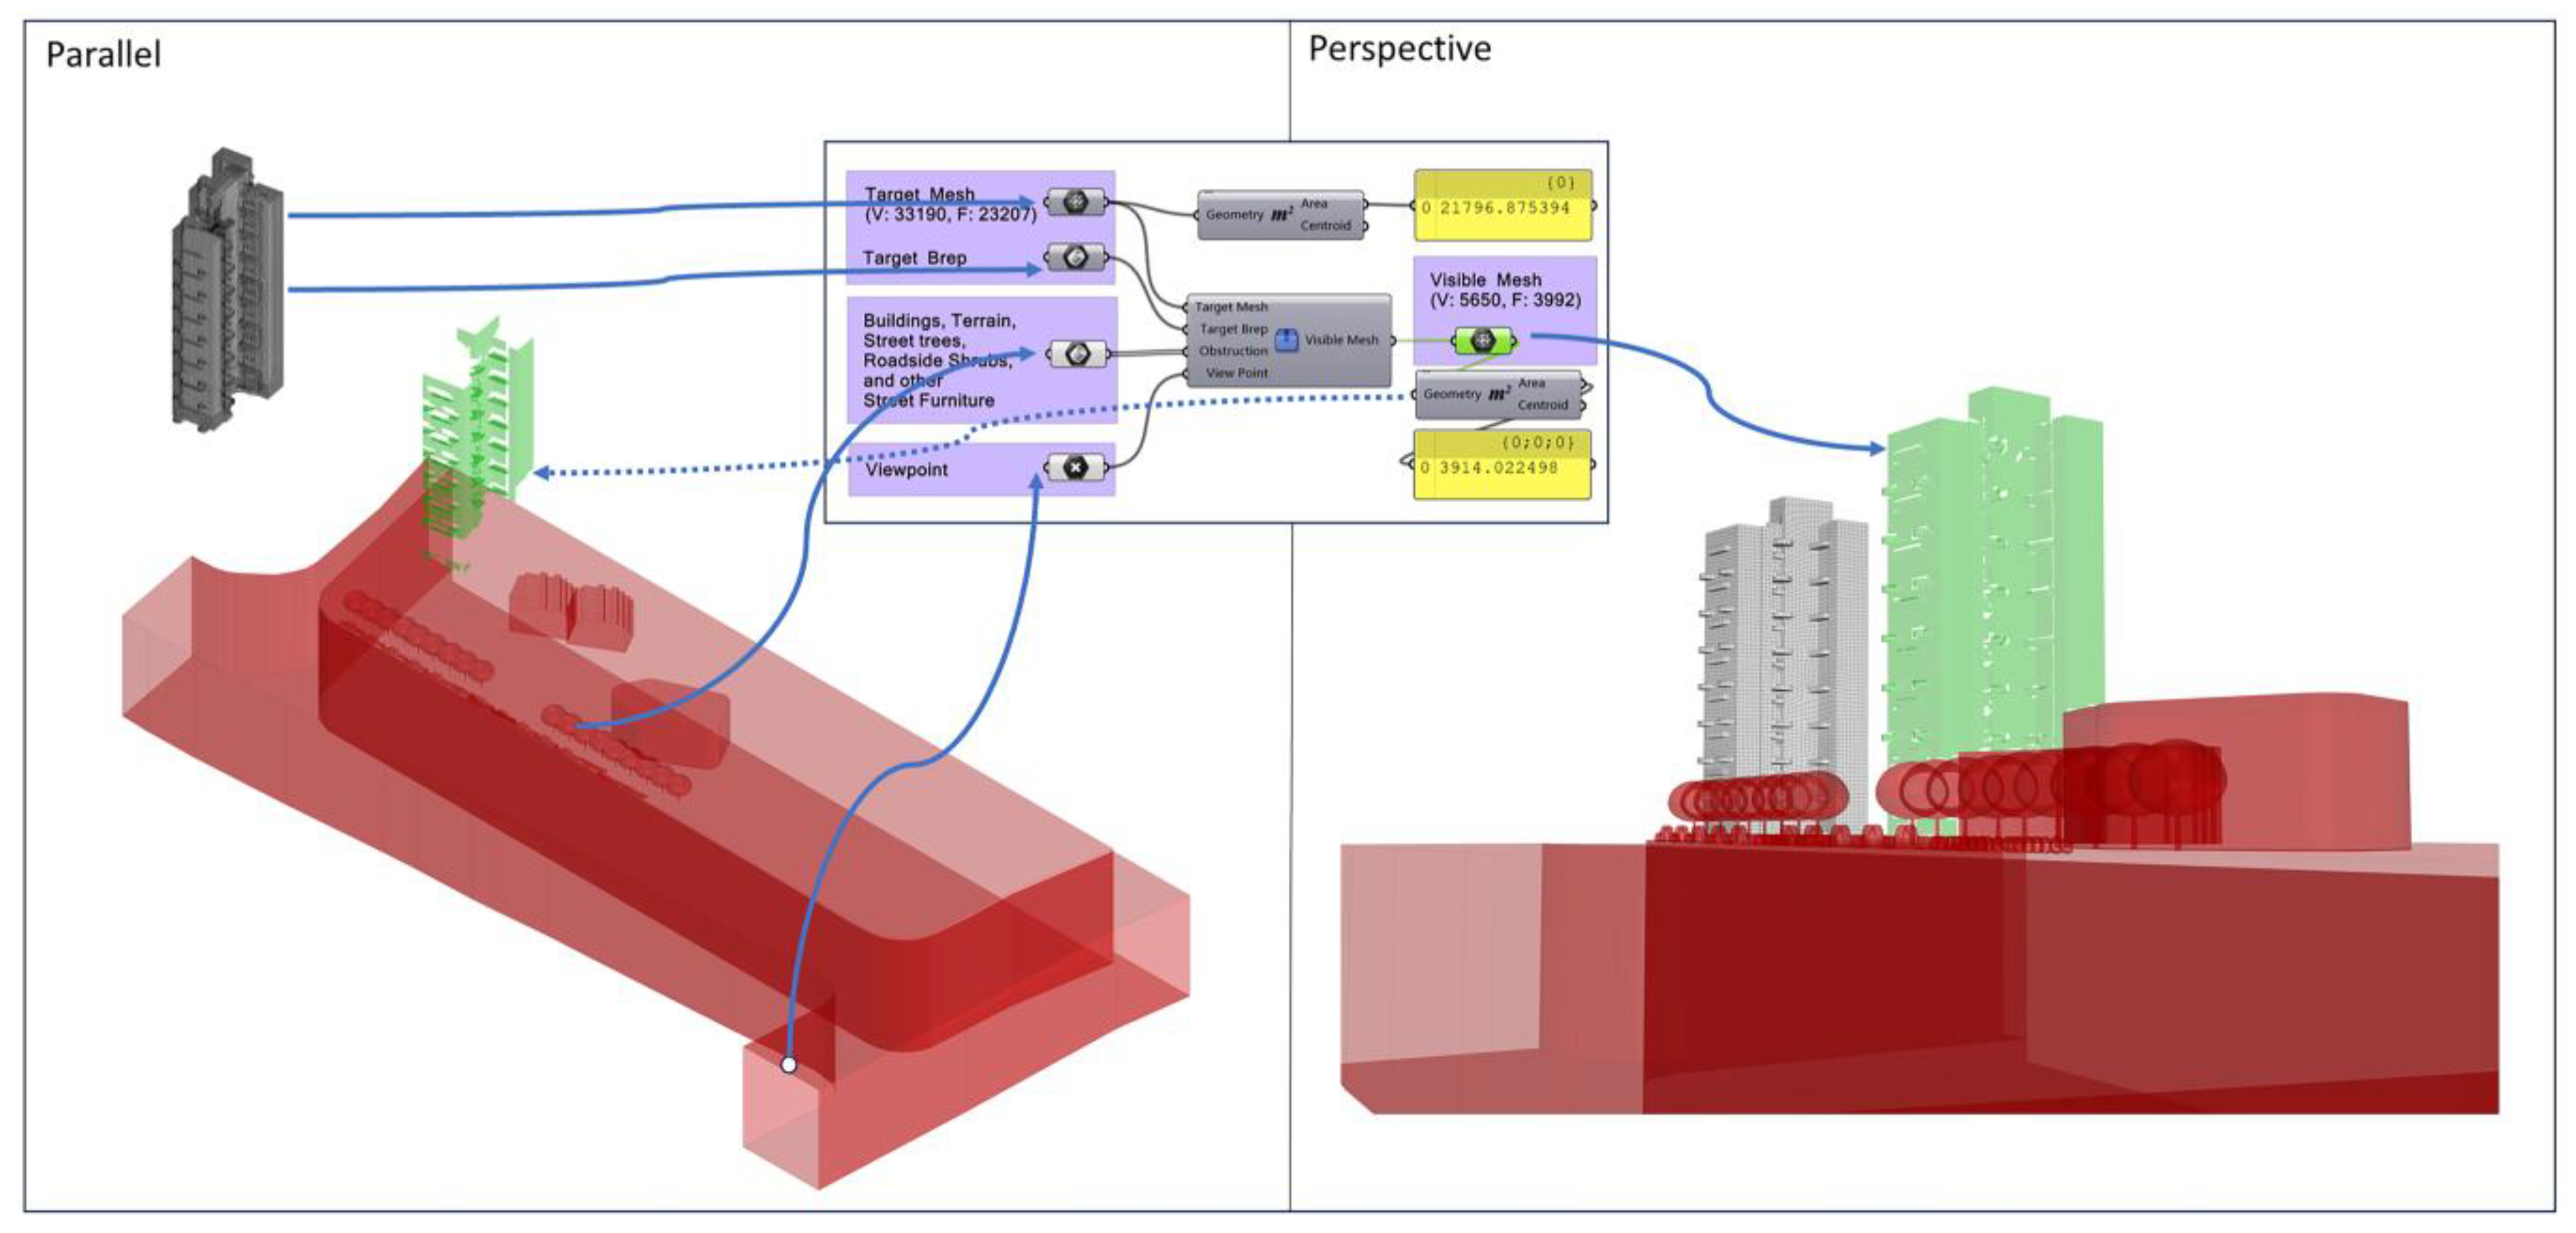
Figure 6.
Site conditions and constraints.
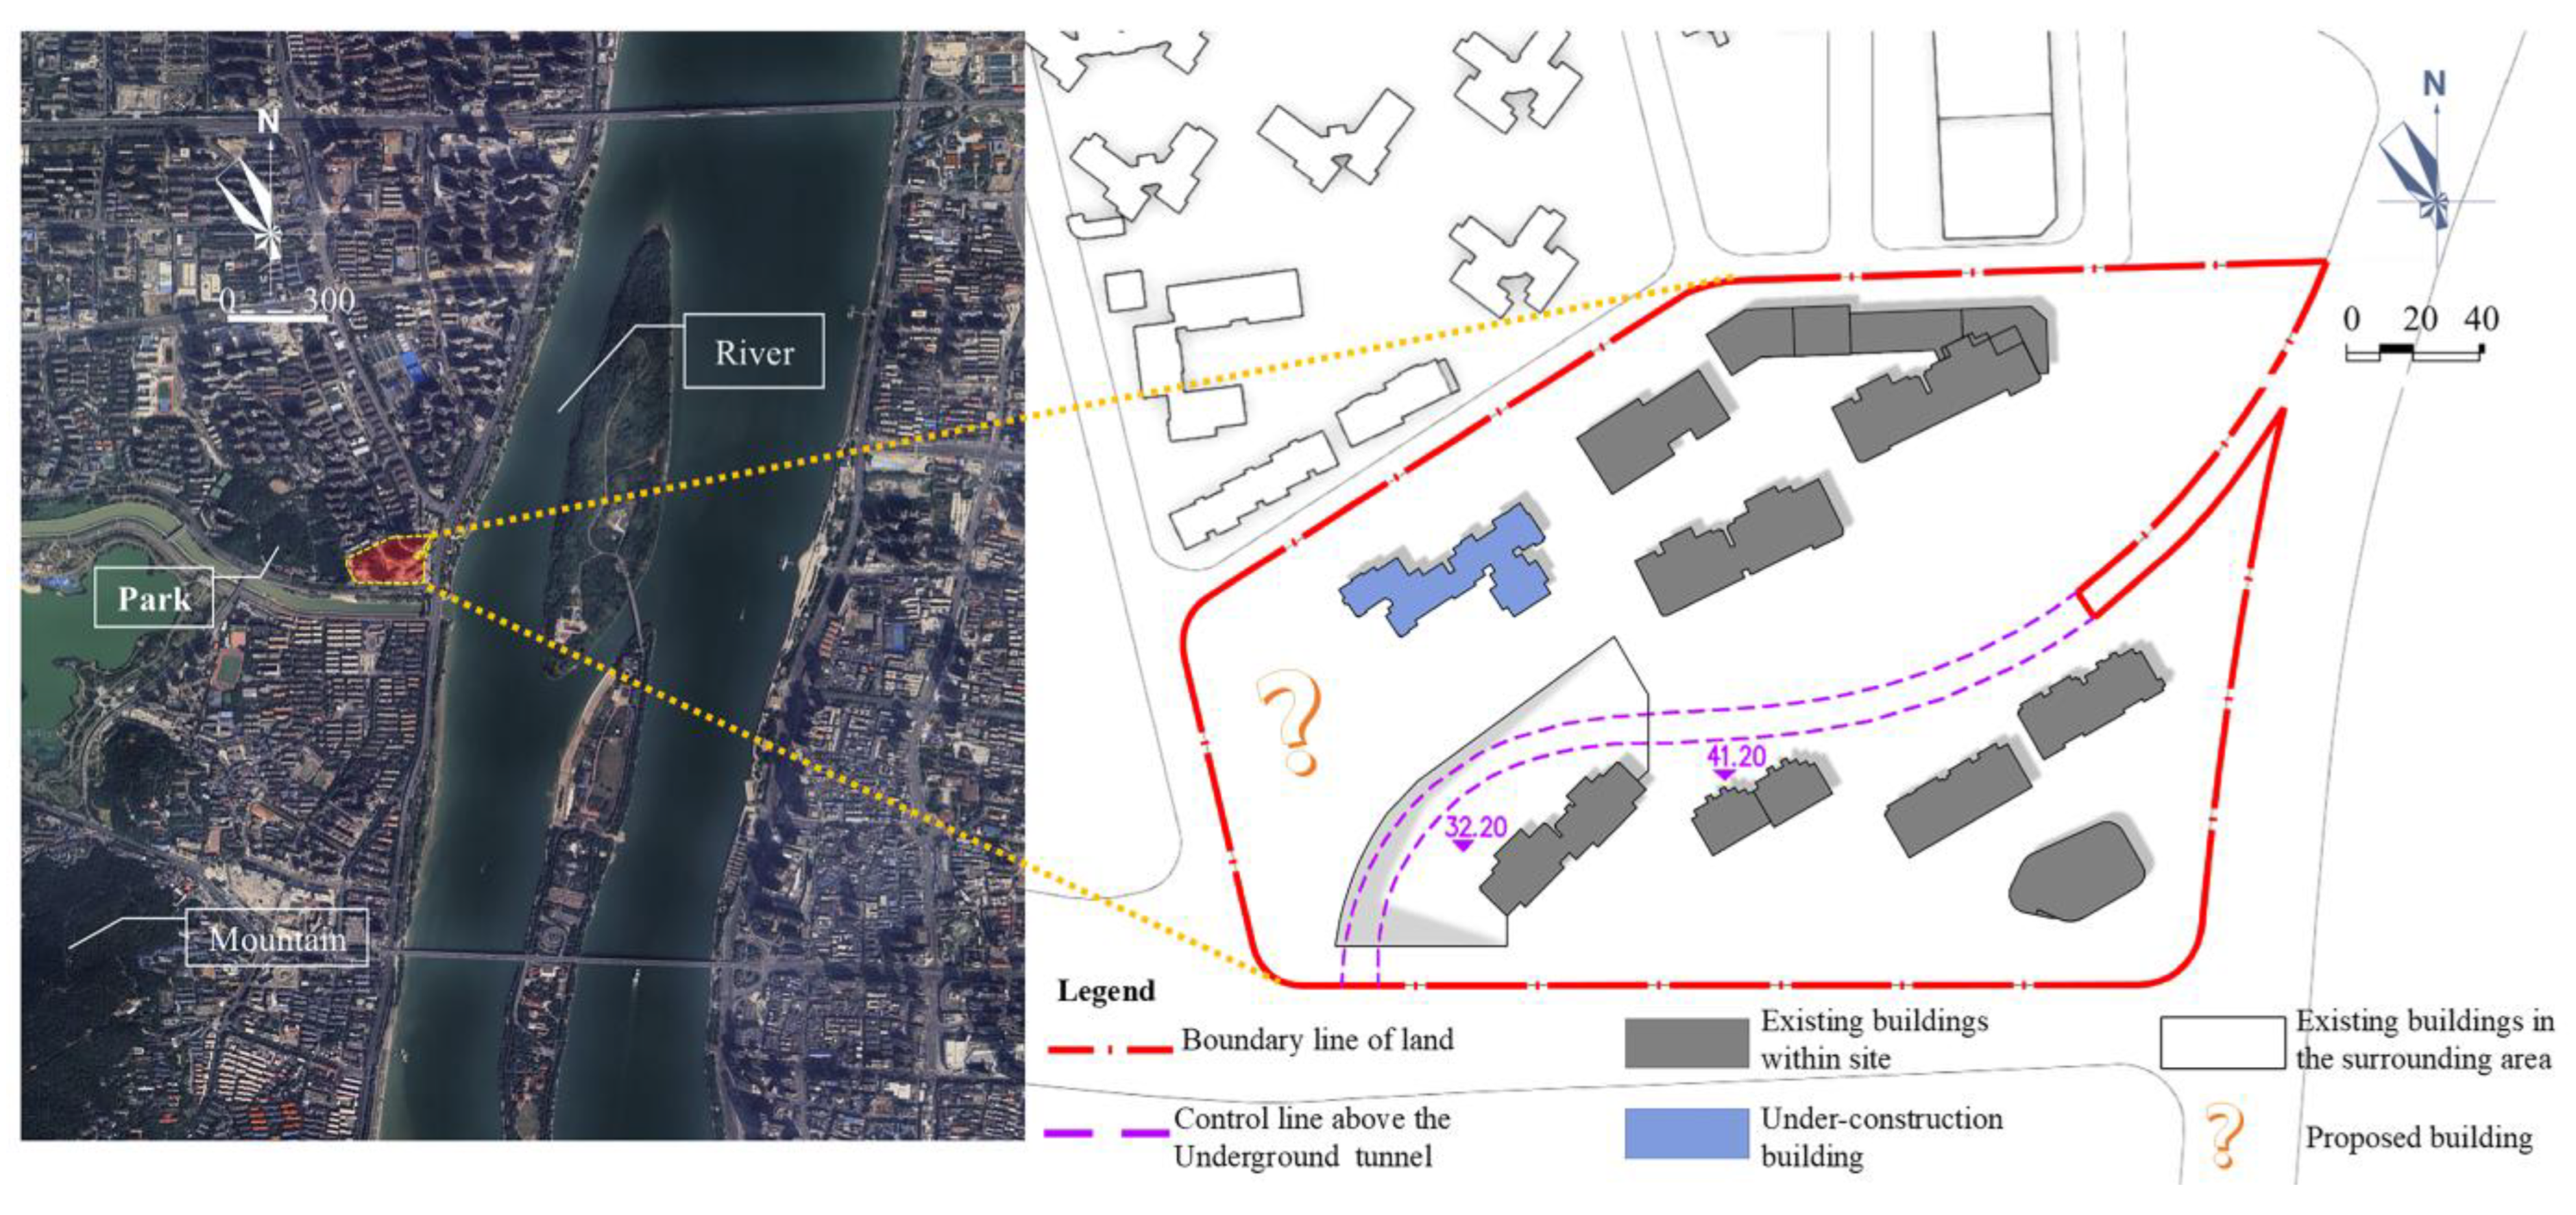
Figure 7.
The 4500 m × 4500 m simulation environment.
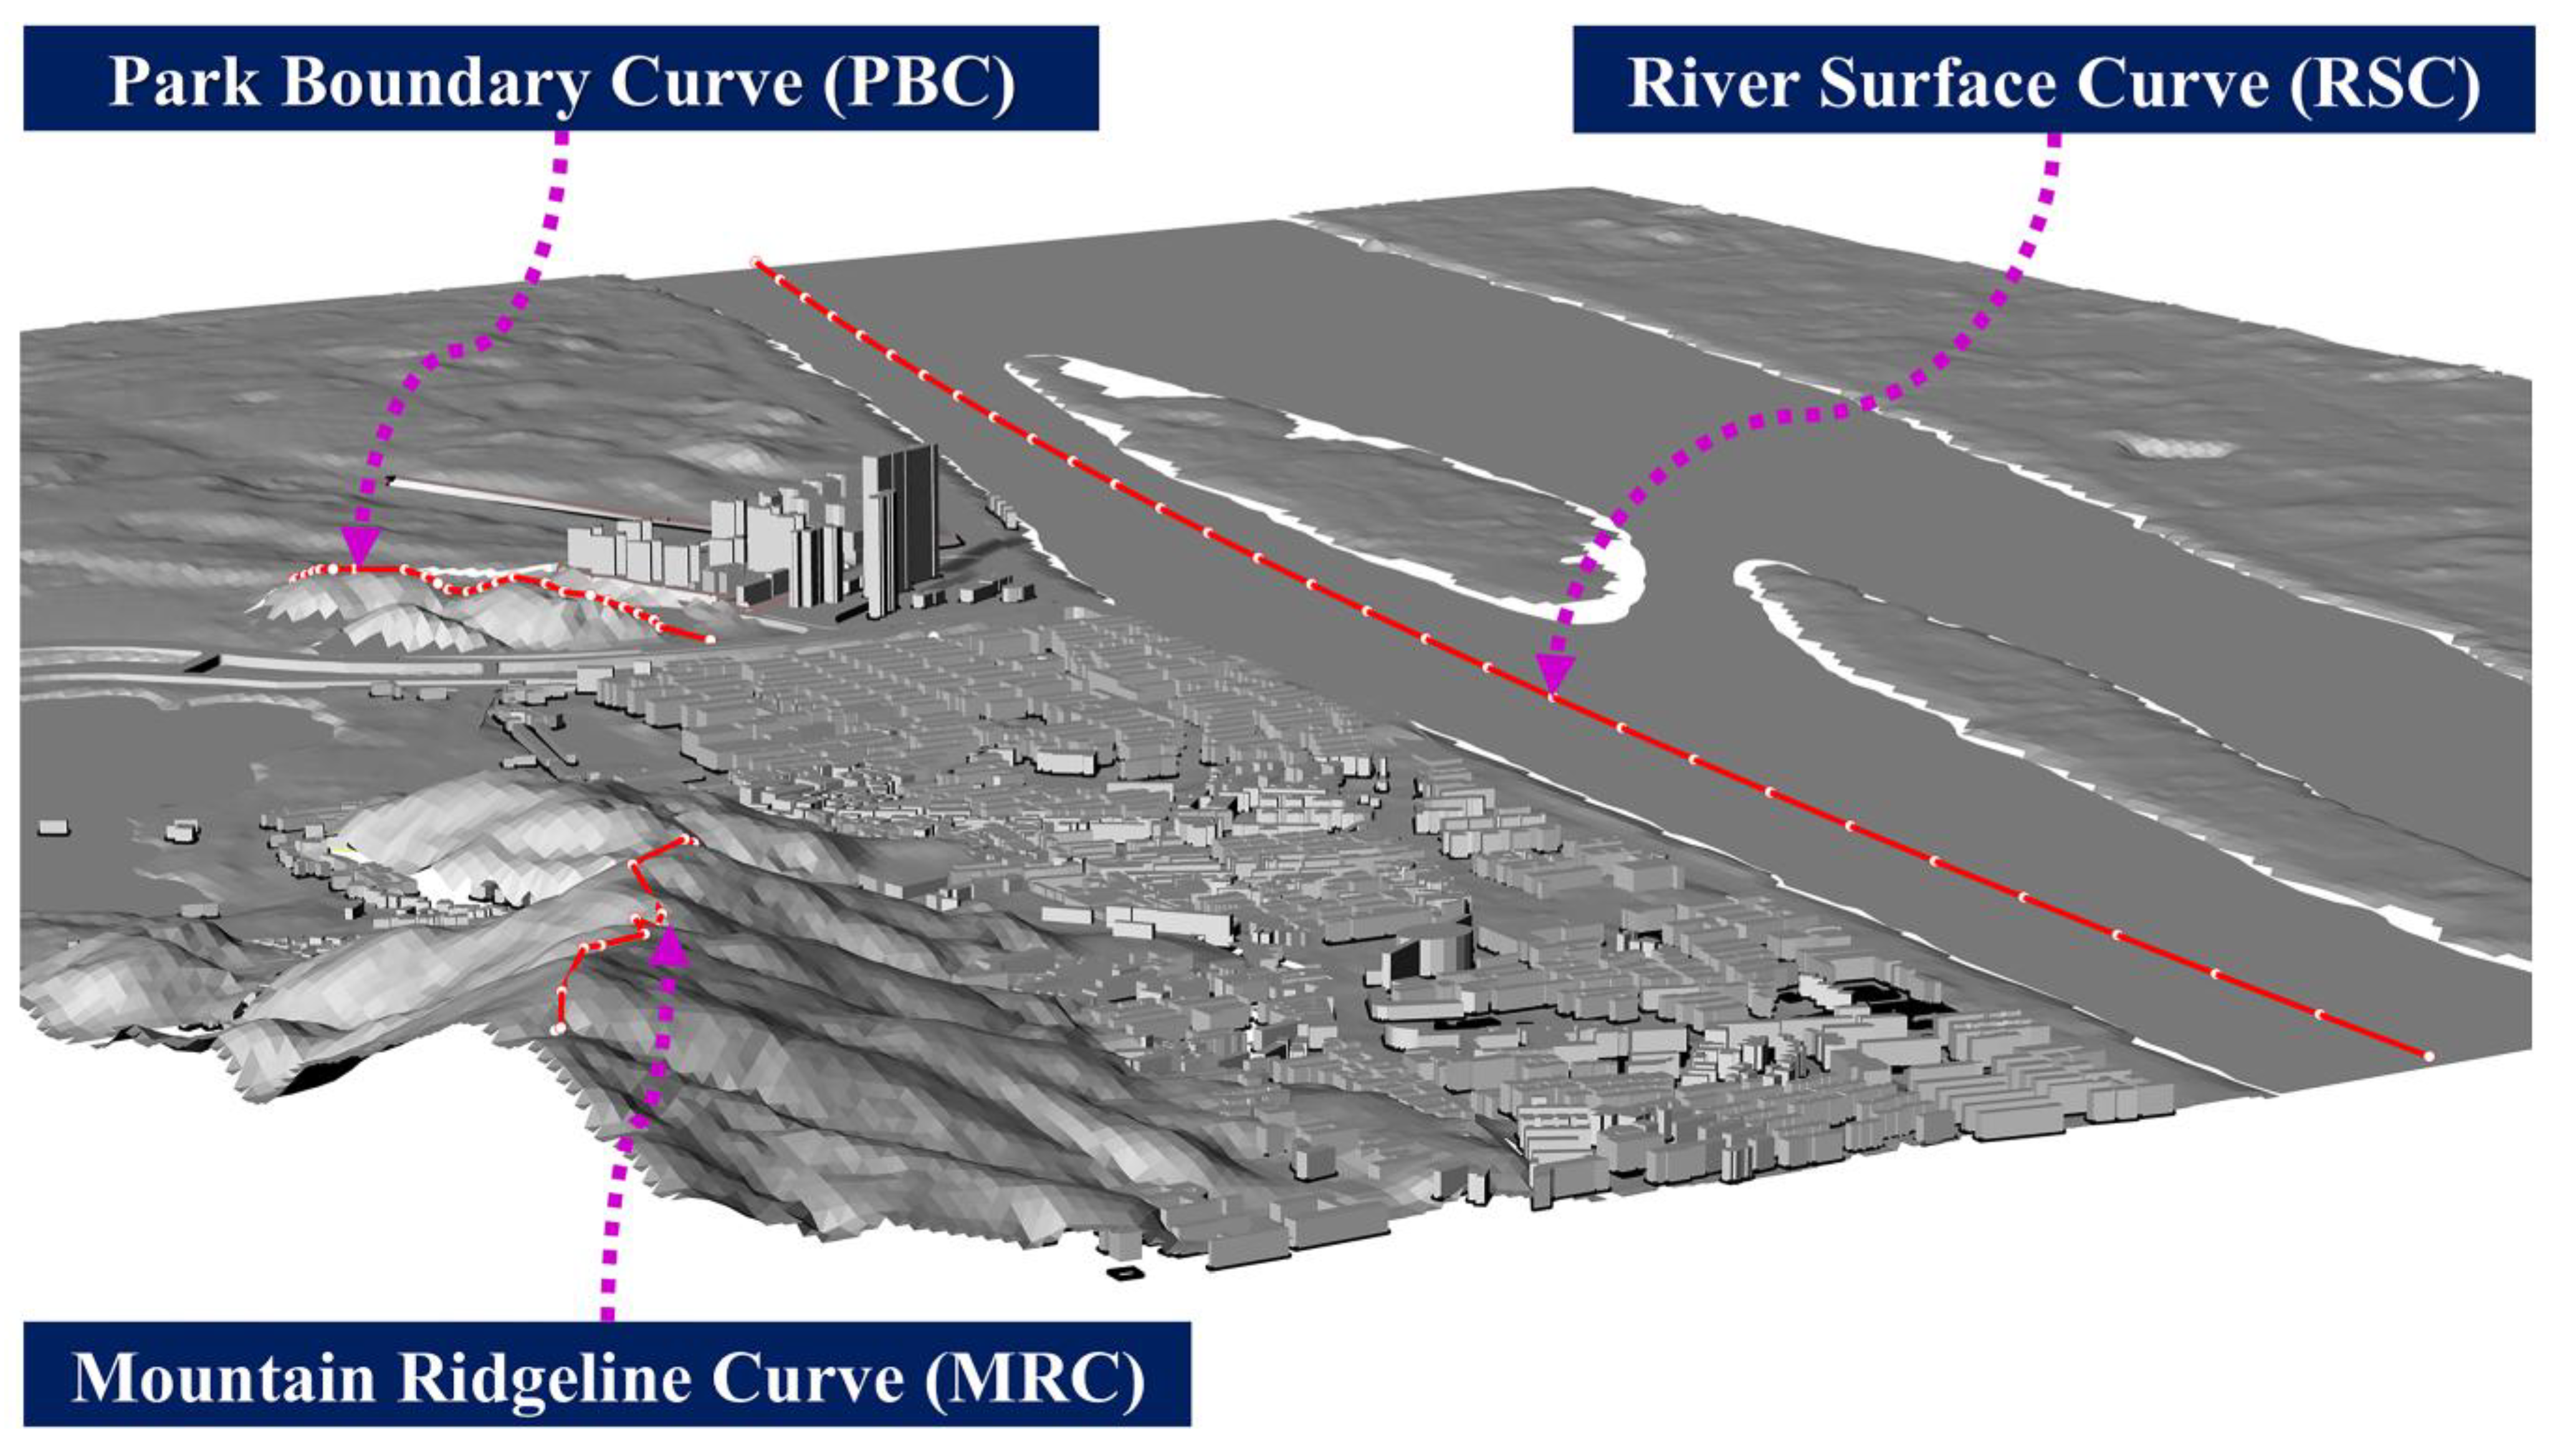
Figure 8.
The iterative design evolution.
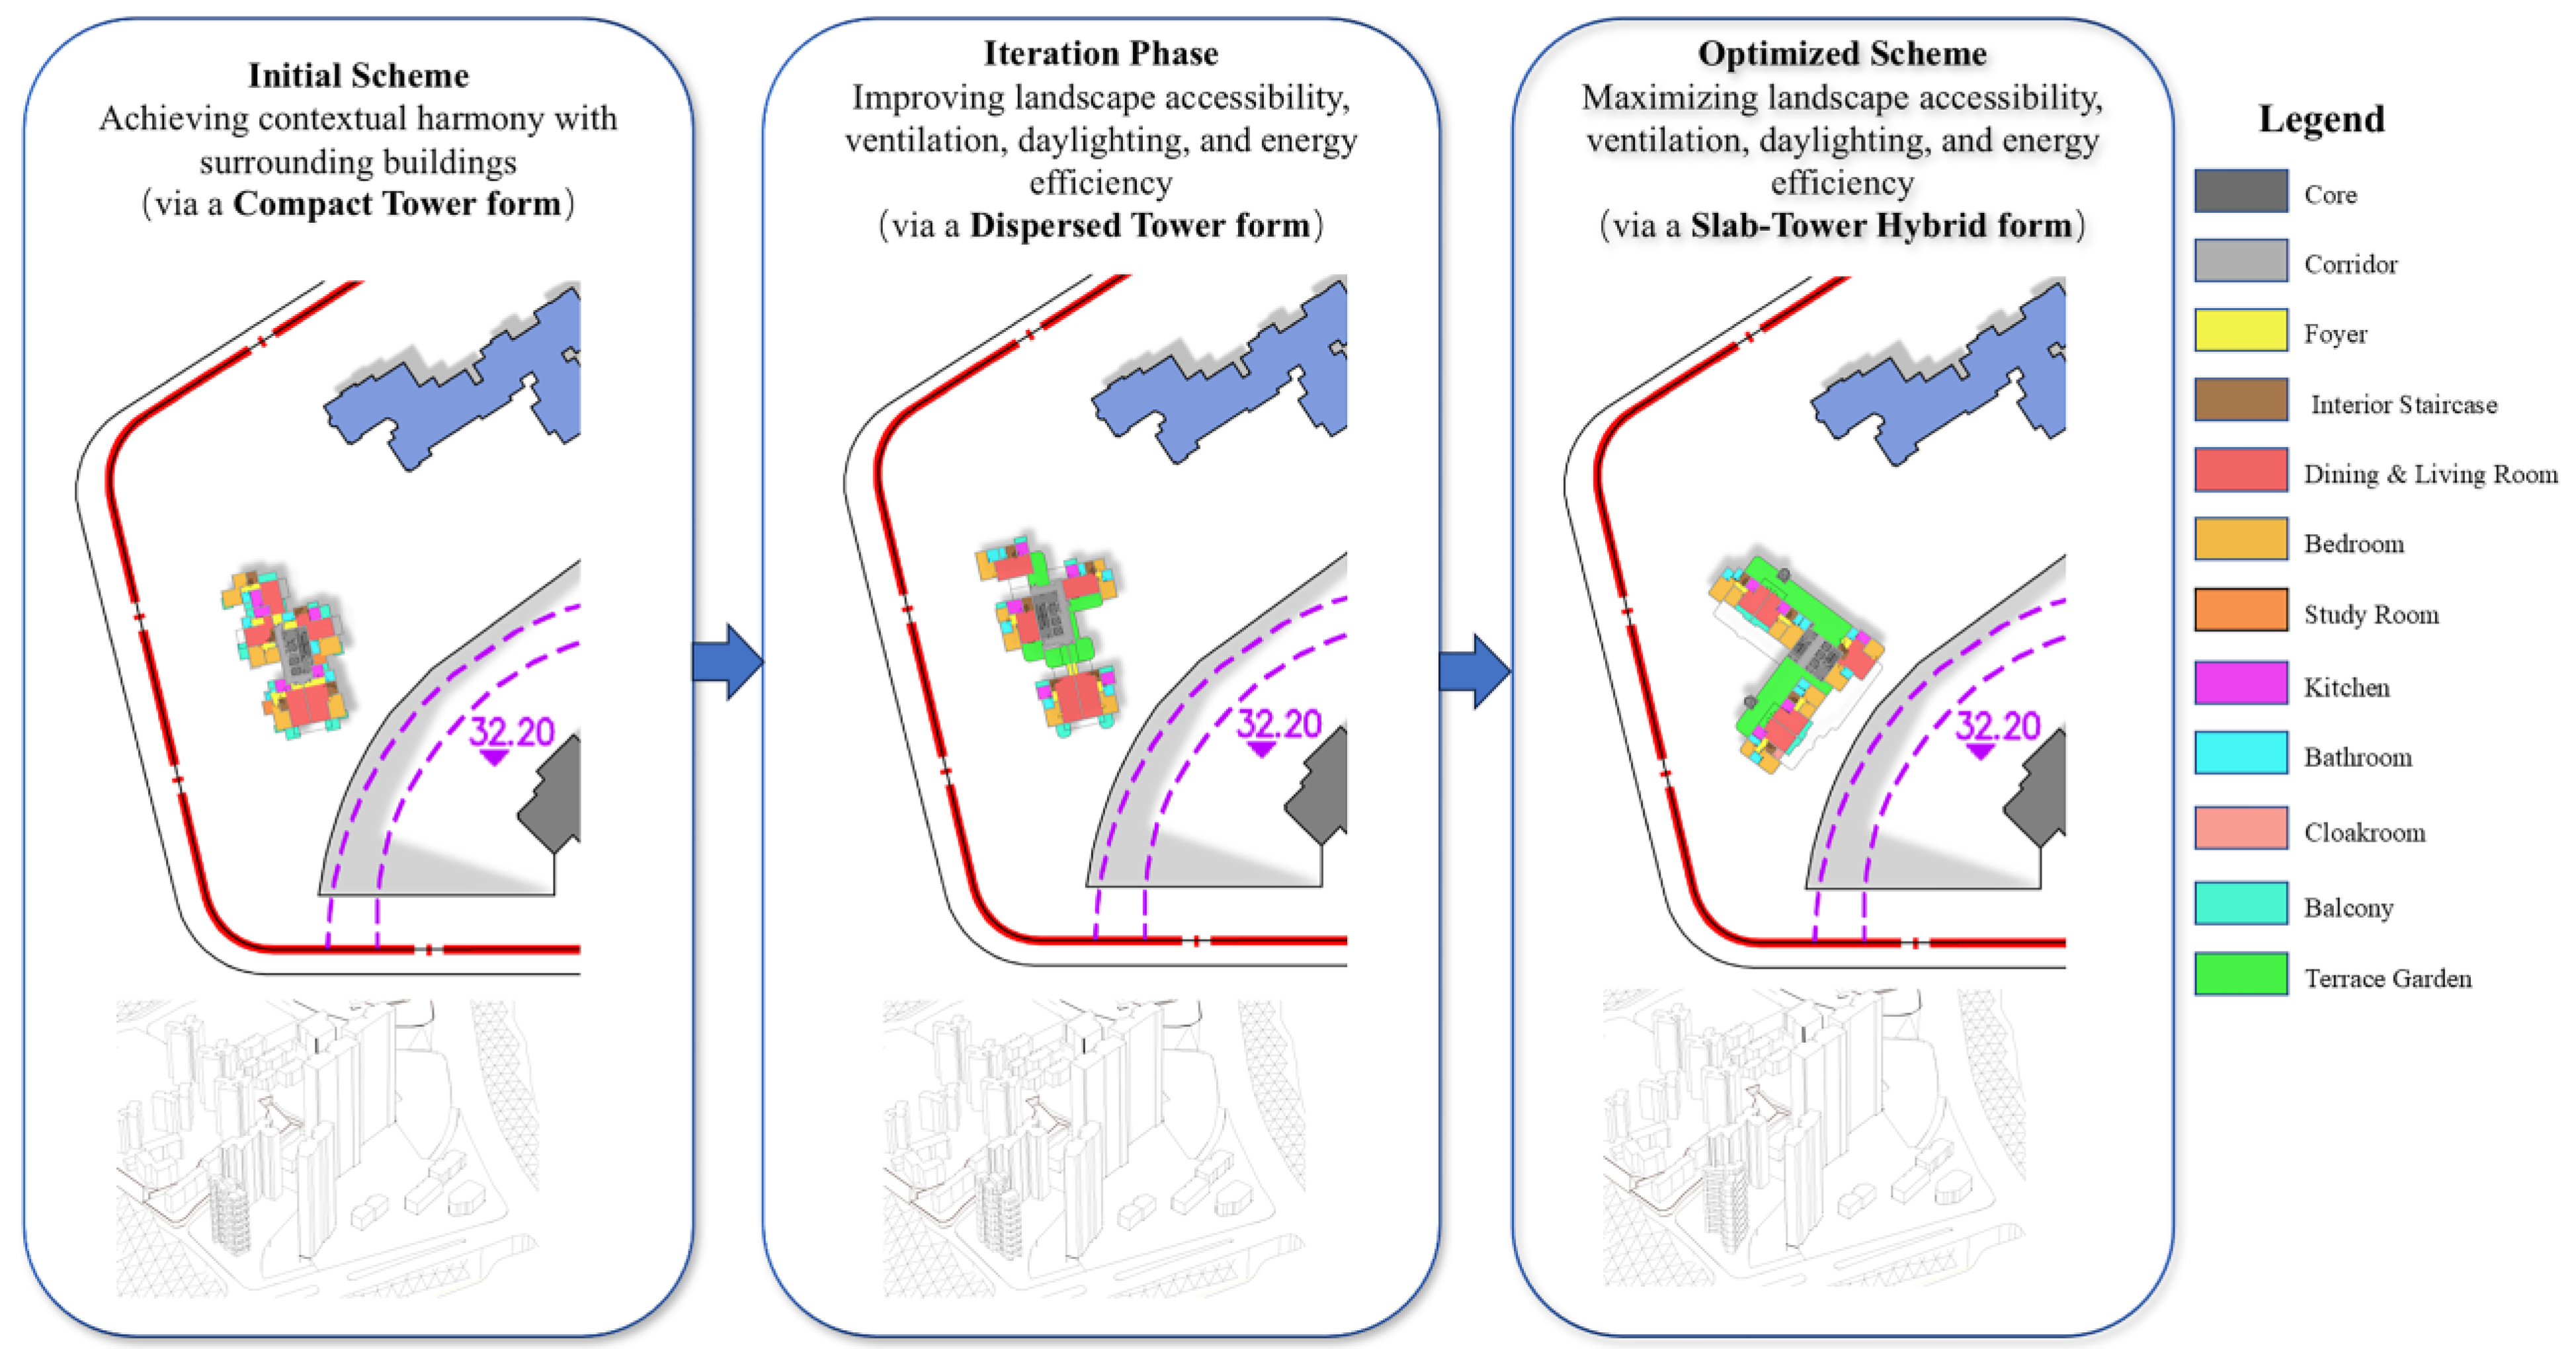
Figure 9.
Computational process of the LVS acquisition. (a) River-View acquisition; (b) Mountain-View acquisition; (c) Park-View acquisition.
Figure 9.
Computational process of the LVS acquisition. (a) River-View acquisition; (b) Mountain-View acquisition; (c) Park-View acquisition.
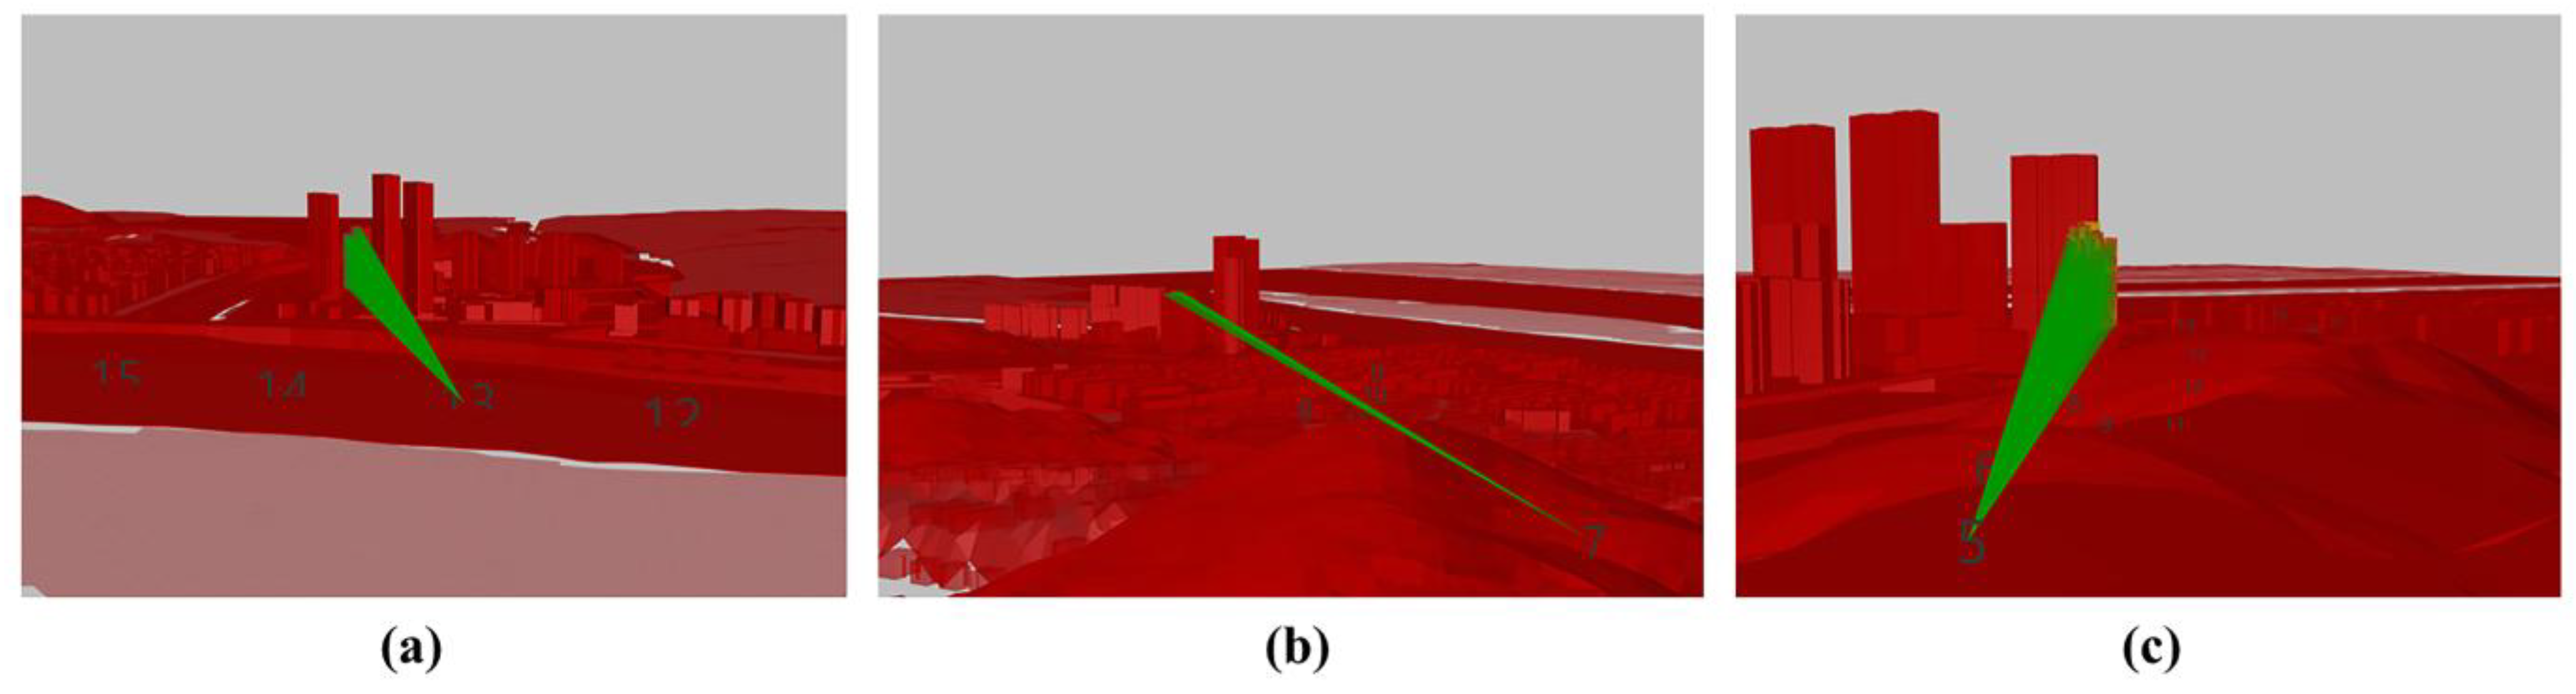
Figure 10.
Comparative analysis of Rv across estimated effective viewpoints. (a) River View; (b) Mountain View (c) Park View.
Figure 10.
Comparative analysis of Rv across estimated effective viewpoints. (a) River View; (b) Mountain View (c) Park View.
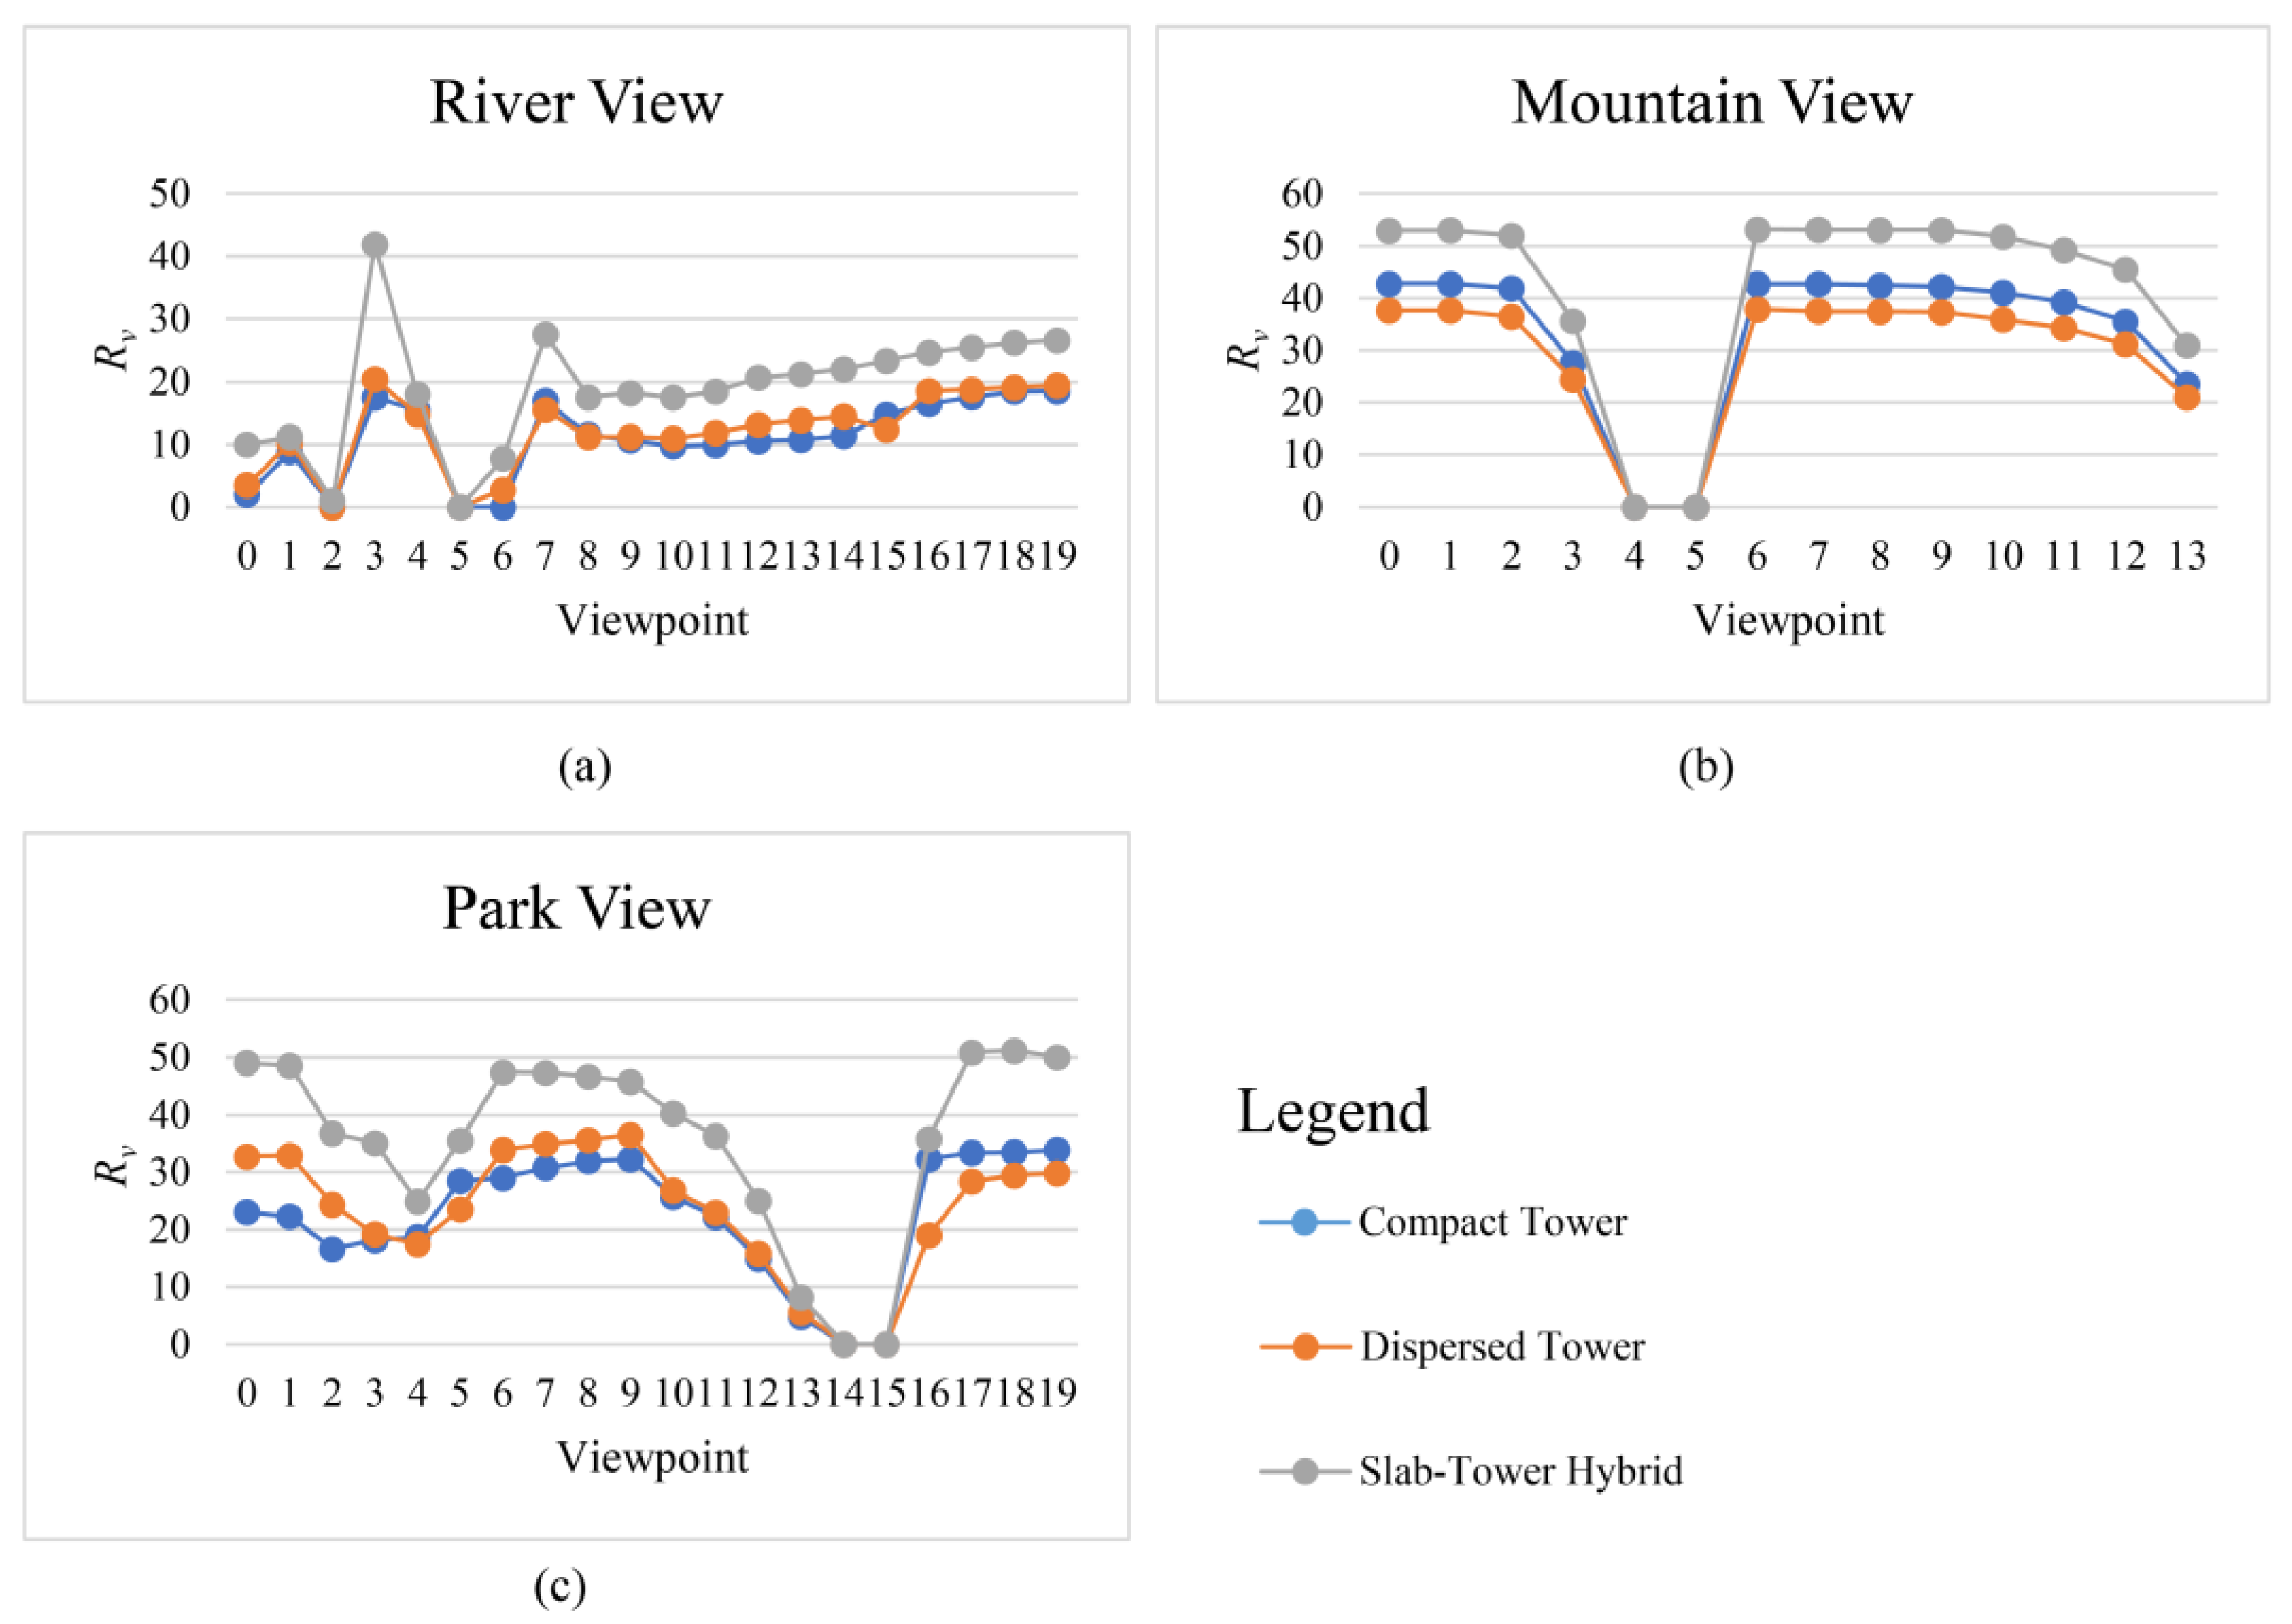
Figure 11.
3D spatial distribution of cumulative sunlight duration. (a) Overview of the simulation domain; (b-c) Solar exposure of the Slab-Tower Hybrid from Southwest and Southeast perspectives; (d-e) Solar exposure of the Dispersed Tower from Southwest and Southeast perspectives; (f-g) Solar exposure of the Compact Tower from Southwest and Southeast perspectives.
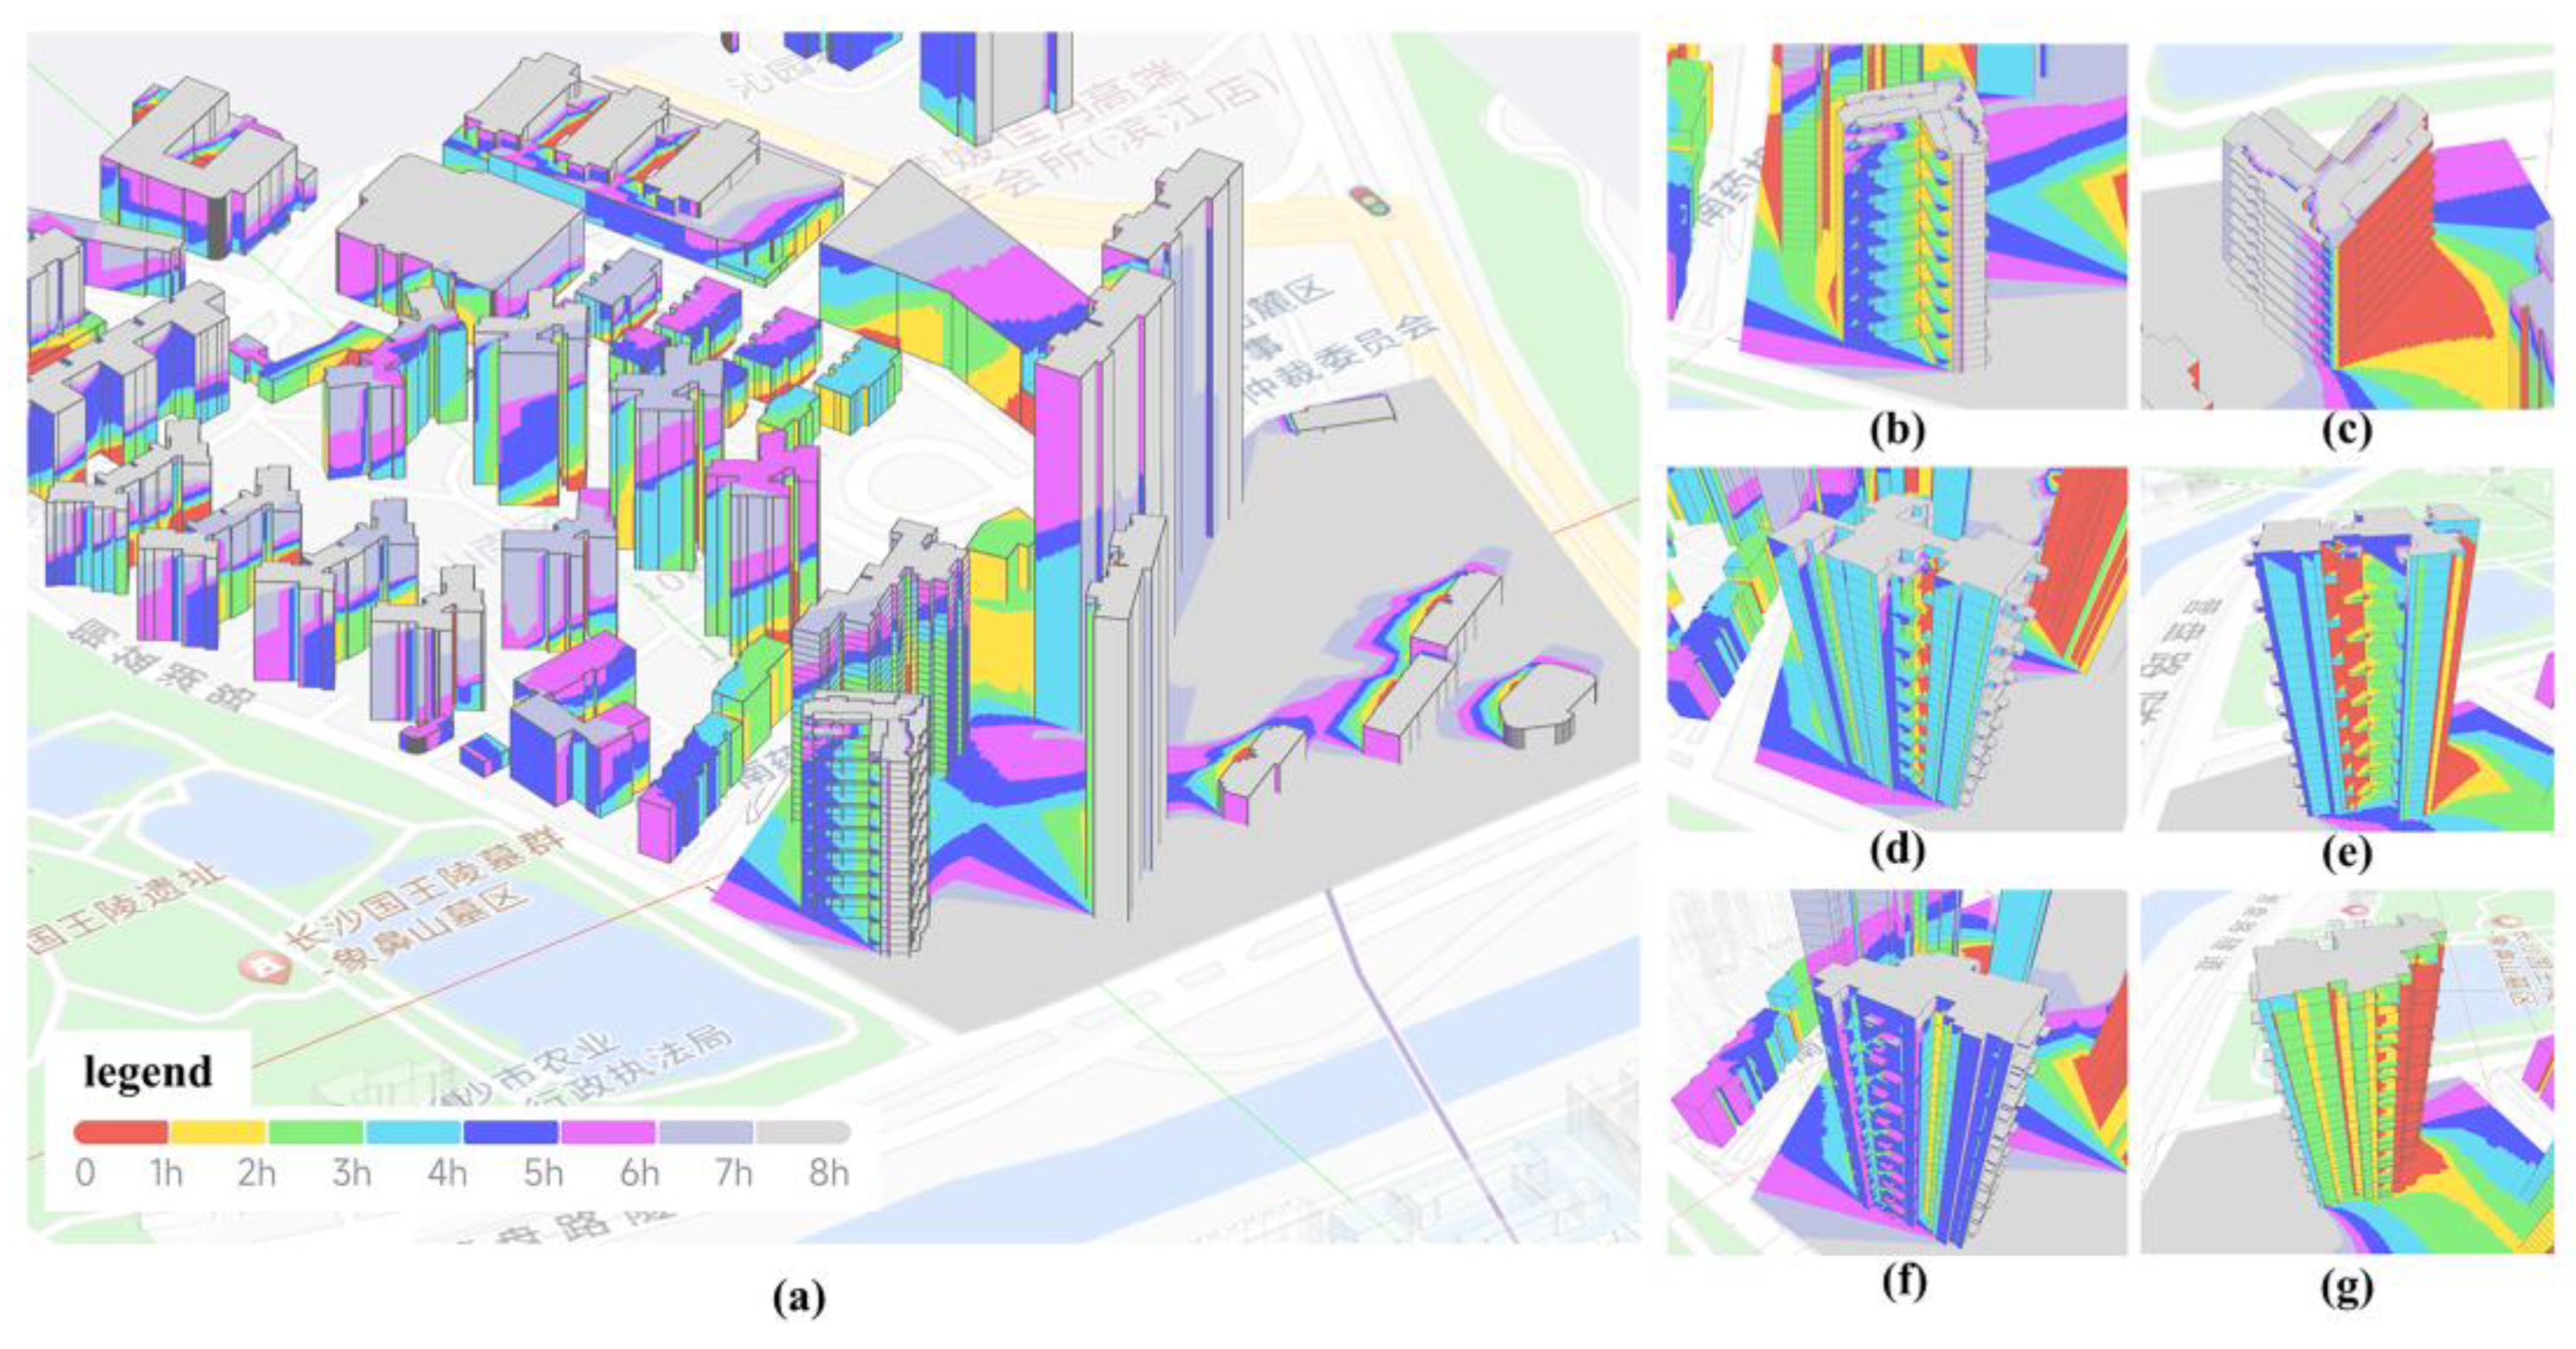
Figure 12.
Distribution of wind velocity around the building envelope in summer. (a) Compact Tower; (b) Dispersed Tower; (c) Slab-Tower Hybrid.
Figure 12.
Distribution of wind velocity around the building envelope in summer. (a) Compact Tower; (b) Dispersed Tower; (c) Slab-Tower Hybrid.
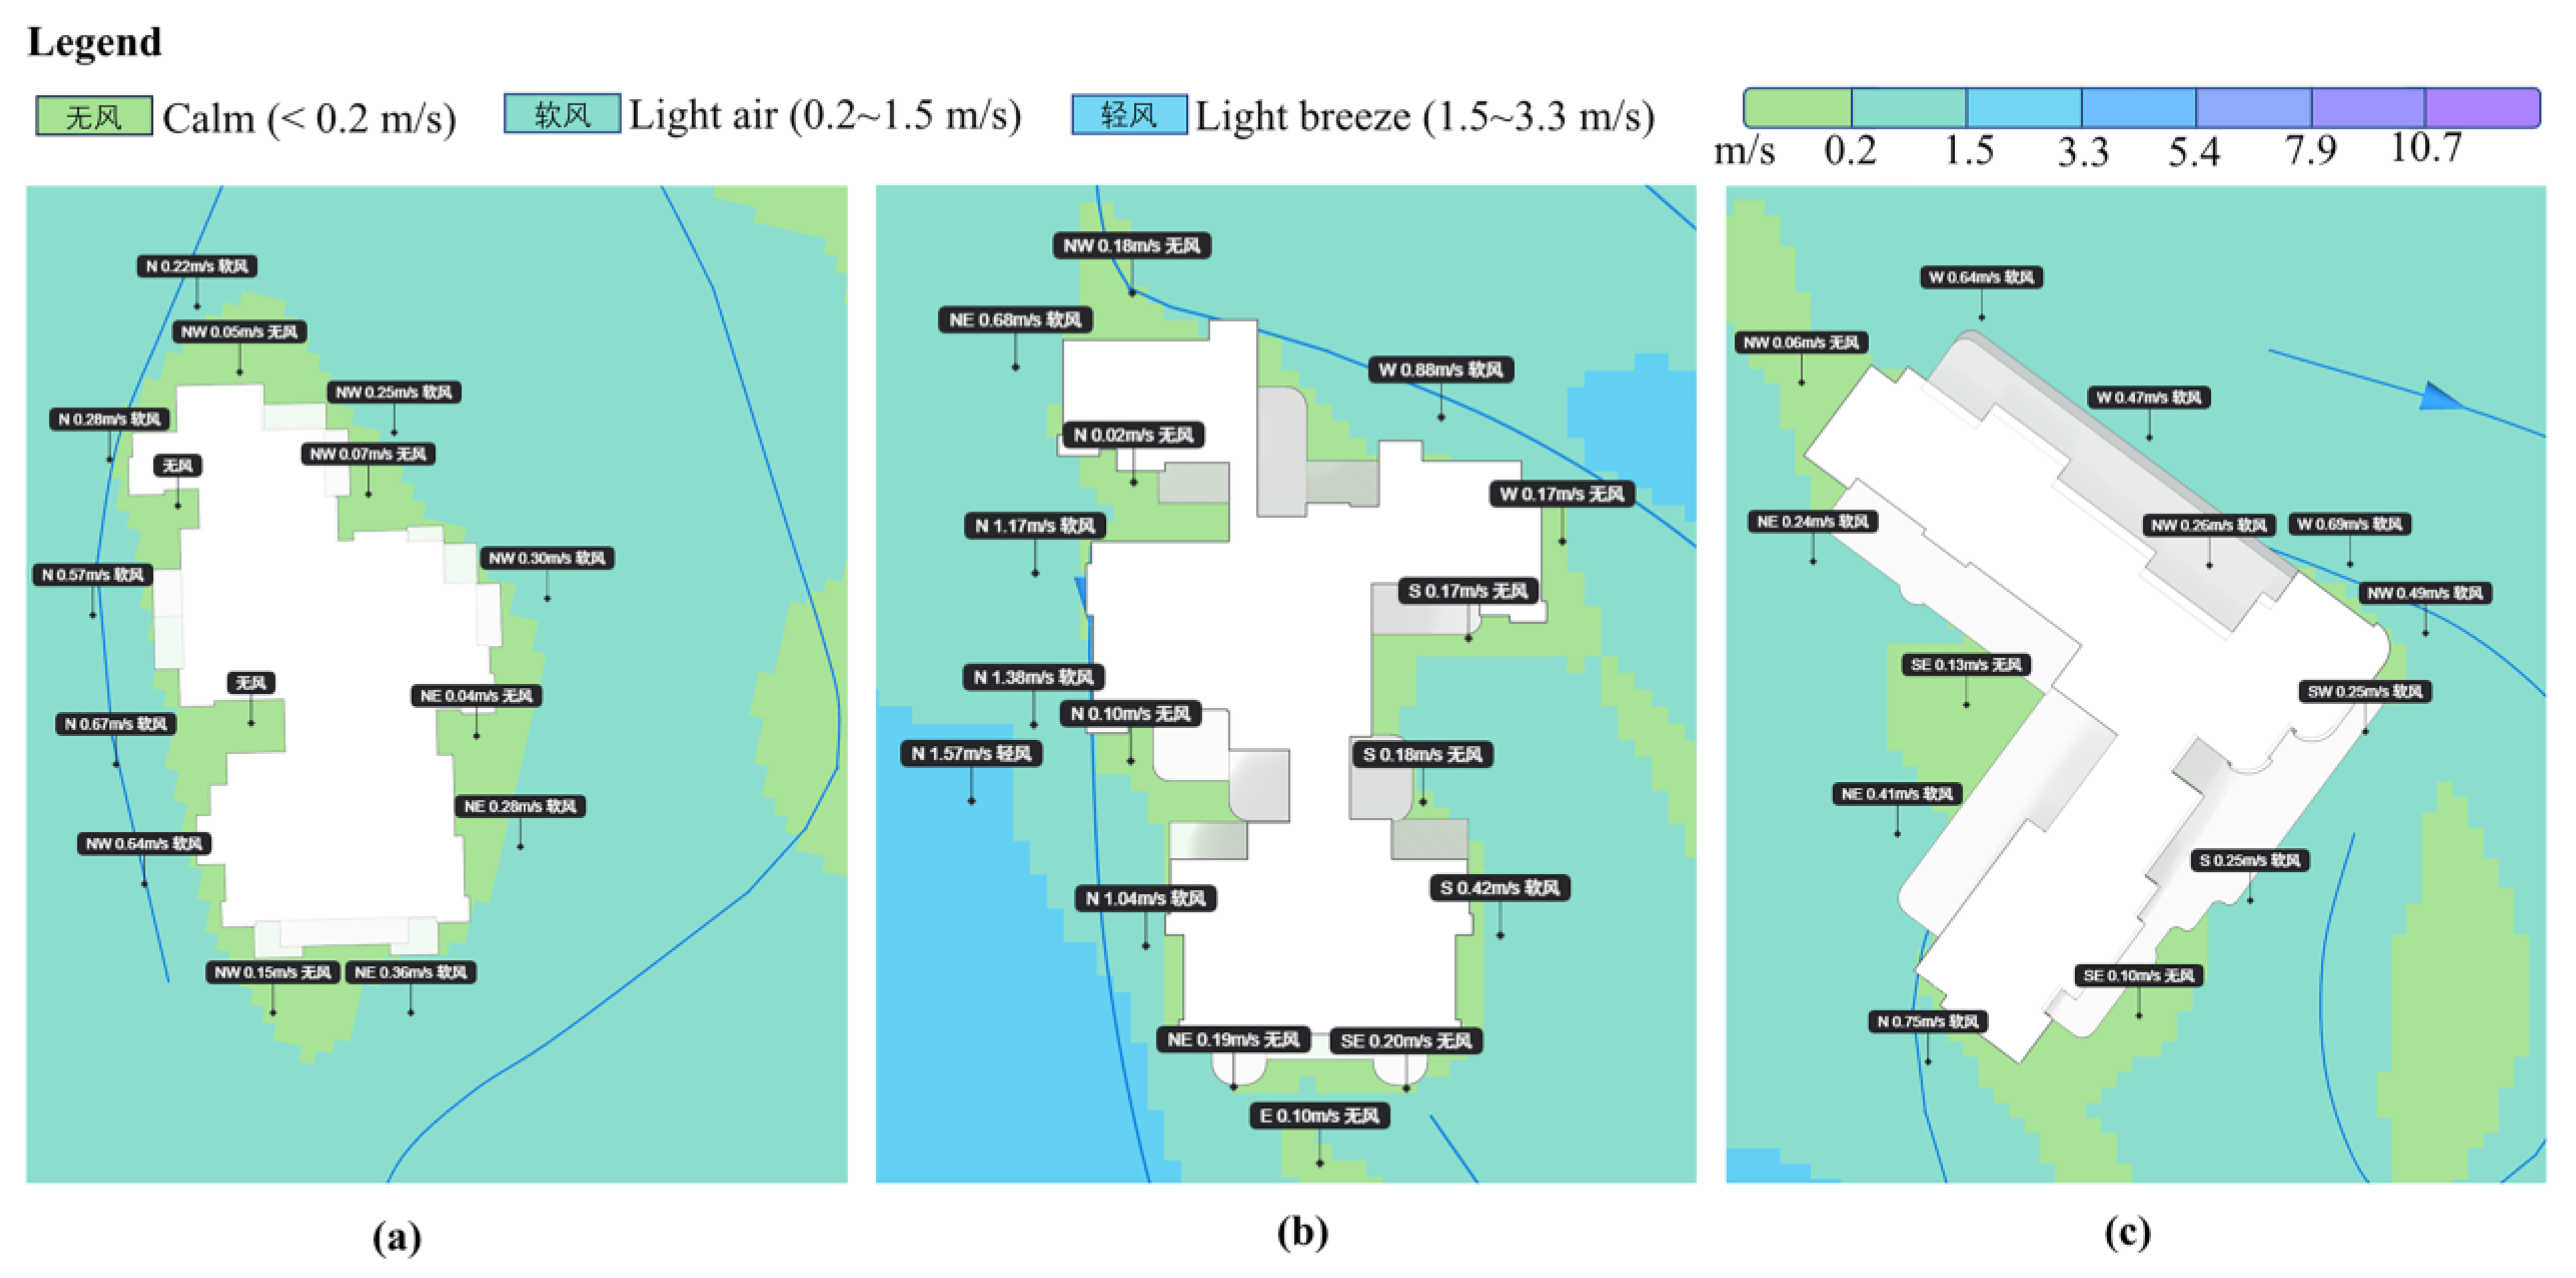
Figure 13.
Typological integration of the Slab-Tower Hybrid.
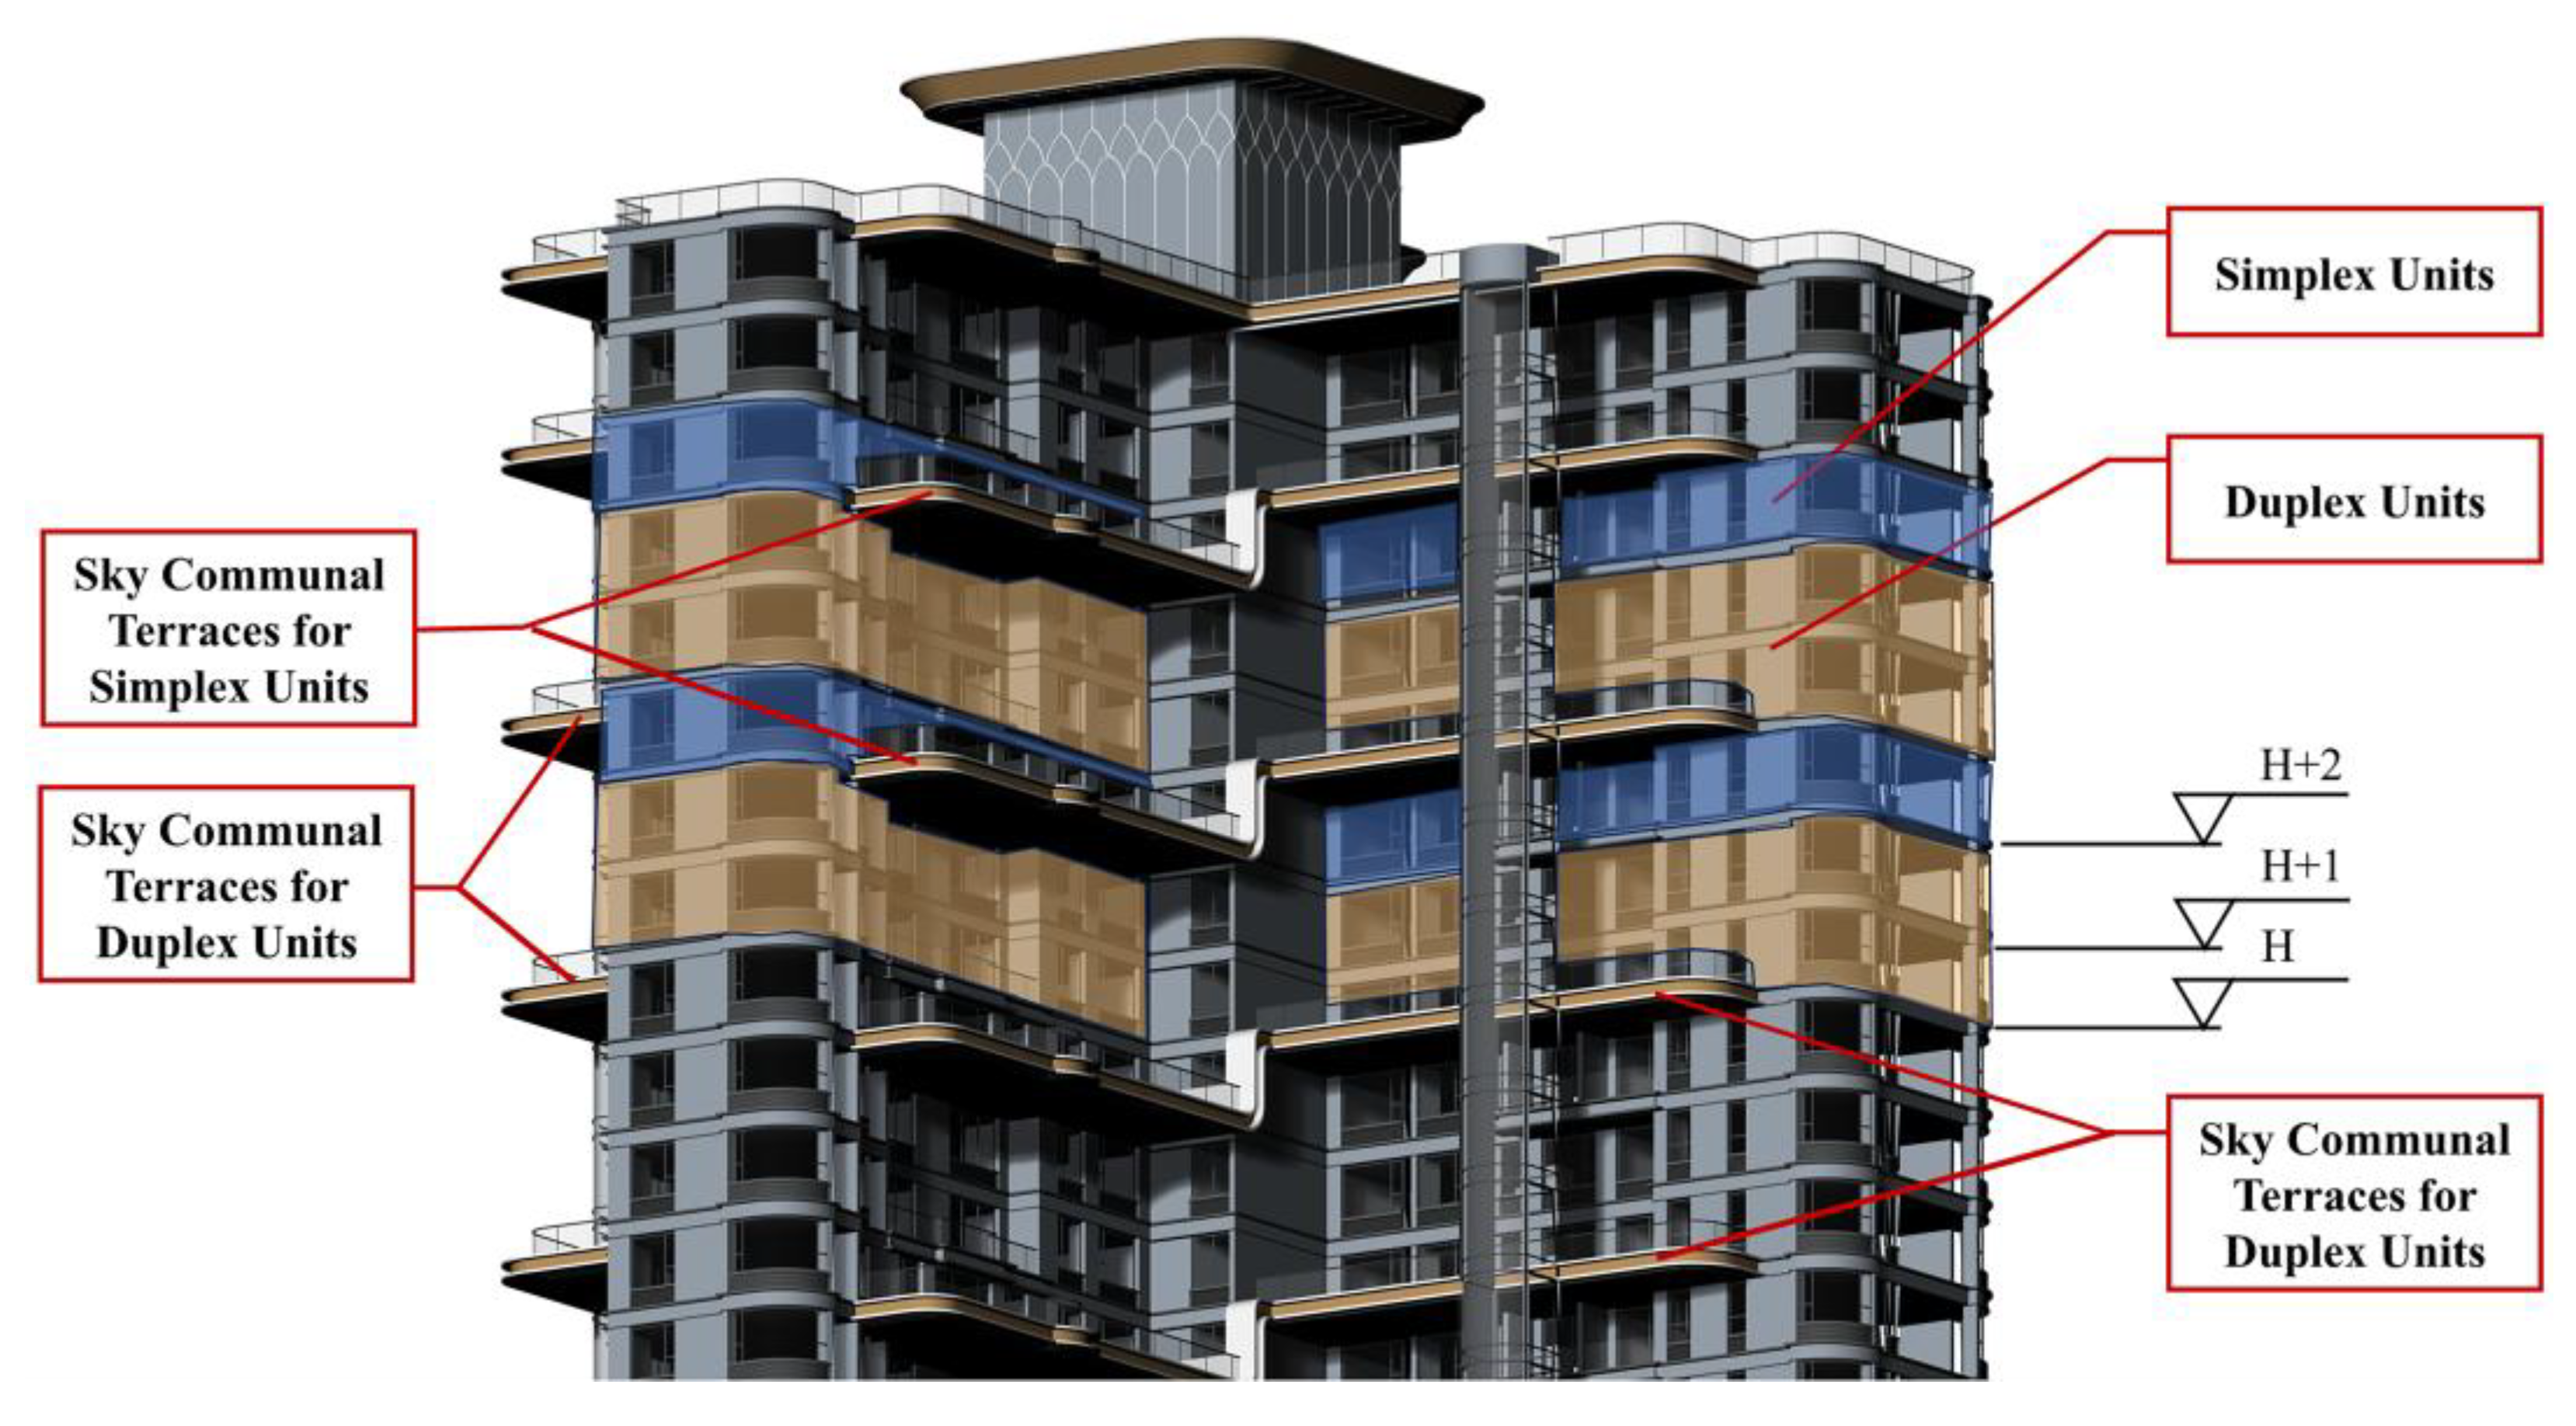

Table 1.
Sensitivity analysis of visible surface area calculation across different Quad-mesh resolutions.
Table 1.
Sensitivity analysis of visible surface area calculation across different Quad-mesh resolutions.
| Target edge length of Quad-mesh | Vertices of Quad-mesh | Faces of Quad-mesh | Vertices of visible mesh | Faces of visible mesh | Area of visible mesh | Relative accuracy (%) |
| 10 m | 148 | 94 | 45 | 27 | 2700 | 95.59% |
| 5 m | 478 | 376 | 145 | 104 | 2600 | 99.46% |
| 2.5 m | 1702 | 1504 | 498 | 418 | 2612 | 98.98% |
| 1 m(Selected) | 9886 | 9400 | 2781 | 2584 | 2584 | 99.92% |
| 0.5 m (Benchmark) | 38566 | 37600 | 10739 | 10346 | 2586 | 100.00% |
Table 2.
Quantitative comparison of cumulative LVS areas.
| Building surface area | River-View | Mountain-View | Park-View | |
| Compact Tower | 11896.2 m2 |
 26261.7 m2 26261.7 m2
|
 55226.5 m2 55226.5 m2
|
 53723.9 m2 53723.9 m2
|
| Dispersed Tower | 15992.5 m2 |
 38676.8 m2 38676.8 m2
|
 65350.6 m2 65350.6 m2
|
 74949.2 m2 74949.2 m2
|
| Slab-Tower Hybrid | 13385.3 m2 |
 50757.3 m2 50757.3 m2
|
 78079.3 m2 78079.3 m2
|
 95628.6 m2 95628.6 m2
|
Table 3.
Comparative analysis of HSPR.
| Compact tower residence | Dispersed tower residence | Slab–tower hybrid residence | |||||||
| South side (minutes) | West or east side (minutes) | HSPR | South side (minutes) | West or east side (minutes) | HSPR | Toward south side (minutes) | Toward north side (minutes) | HSPR | |
| Unit 1 | 480 | 285 | 40.23% | 480 | 234 | 46.22% | 385 | 94 | 58.47% |
| Unit 2 | 480 | 159 | 26.19% | 480 | 219 | 47.54% | 315 | 30 | 26.68% |
| Unit 3 | 300 | 270 | 42.89% | 289 | 234 | 51.57% | 304 | 0 | 33.68% |
| Unit 4 | 170 | 144 | 17.50% | 255 | 189 | 33.02% | 200 | 0 | 25.21% |
| Unit 5 | 304 | 230 | 28.03% | 255 | 225 | 38.36% | 274 | 0 | 45.43% |
Note: The calculation results presented in this table correspond to the first-floor residential units.
Table 4.
Comparative simulation of the outdoor wind environment.
| Winter | Summer | |
| Compact Tower | 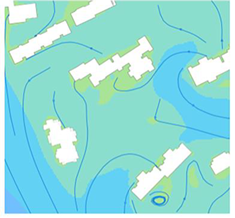 |
 |
| Dispersed Tower | 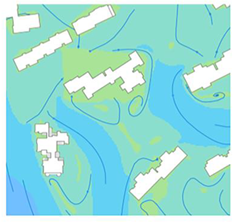 |
 |
| Slab-Tower Hybrid | 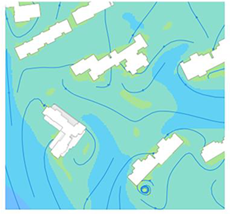 |
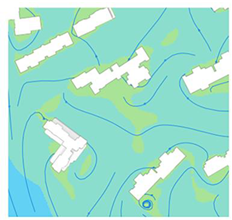 |
Table 5.
Multi-criteria performance comparison matrix of the three morphological prototypes.
| Performance Metric | Compact Tower | Dispersed Tower | Slab-Tower Hybrid |
| Landscape Visibility | Low Severe self-occlusion |
Medium Gained via surface expansion |
High Highest morphological efficiency |
| Sunlight Equity (HSPR) | Poor Uneven; max unit < 30% |
High Balanced; most units > 46% |
Moderate Polarized; relies on south units |
| Ventilation Quality | Poor Stagnant air (< 0.2 m/s) |
Medium Uneven; vortex issues |
Optimal Stable cross-ventilation (0.4-0.7 m/s) |
| Energy Efficiency (SC) | High SC = 0.302 (Best) |
Low SC = 0.348 (Worst) |
Balanced SC = 0.326 (Moderate) |
| Overall Verdict | Rejected Fails living quality standards | Sub-optimal High energy cost for views | Selected (Optimal) Best balance of View, Health & Energy |
Disclaimer/Publisher’s Note: The statements, opinions and data contained in all publications are solely those of the individual author(s) and contributor(s) and not of MDPI and/or the editor(s). MDPI and/or the editor(s) disclaim responsibility for any injury to people or property resulting from any ideas, methods, instructions or products referred to in the content. |
© 2026 by the authors. Licensee MDPI, Basel, Switzerland. This article is an open access article distributed under the terms and conditions of the Creative Commons Attribution (CC BY) license (http://creativecommons.org/licenses/by/4.0/).
Copyright: This open access article is published under a Creative Commons CC BY 4.0 license, which permit the free download, distribution, and reuse, provided that the author and preprint are cited in any reuse.


