
Submitted:
15 January 2026
Posted:
16 January 2026
You are already at the latest version
Abstract
Lavender has been cultivated in Bulgaria for over a century. The high essential oil content and quality of Bulgarian lavender varieties have established the country as a leading global producer. Studies into the crop's genetic diversity is essential for selecting varieties best suited to specific environmental conditions, maximising resilience and yield. Therefore, identifying appropriate genetic markers to monitor lavender diversity is a key prerequisite for developing effective crop selection strategies, particularly in response to the challenges posed by global climate change. In this study, we evaluate the versatility of markers for assessing genetic diversity of lavender genotypes. A total of 96, 97 and 96 bands were recorded using the 13 SCoT, 13 ISSR and 14 CEAP primers, respectively. All amplification programs used were successful in the studied genotypes. Additionally, were applied four informative primers of each marker systems for assessment of the within-field genetic variability in two lavender plantations from Bulgaria. This is the first report on the combined use and comparison of CEAP, SCoT and ISSR primers in lavender genotypes in Bulgaria.
Keywords:
Lavandula angustifolia
; lavender
; genetic diversity
; ISSR
; CEAP
; SCoT
; essential oil crop
1. Introduction
The cultivation and processing of
medicinal and aromatic plants is a major part of agriculture in Bulgaria [1]. In recent years, the interest
in these crops has increased due to their wide application in perfumery,
cosmetics, pharmacology and the food industry. The most important and
commercially grown species of the genus Lavender are L. angustifolia
Mill., L. latifolia Medik., L. stoechas L., and L. intermedia
Emeric ex Loisel [2].
Among them notable is L.
angustifolia Mill., for its economic importance in
Bulgaria. It is grown in different regions of Bulgaria,
but a shift can be observed from its cultivation in the traditional regions of
Southeastern Bulgaria to an increasing cultivation in the Northeastern part of
the country [3]. The
species studies were mainly focused on morphology, cultivation techniques and
essential oil [3,4,5,6].
In recent years, an increasing number of studies have been accumulated on the
genotypes of L. angustifolia with dominant and
codominant markers [7,8,9]. The morphological markers applied (e.g., plant height, bush
diameter, and inflorescence traits)> are influenced by
environmental conditions and do not distinguish varieties/hybrids, while the
market value and bioactivity of lavender essential oil largely depend on the
used varieties [4,5,10]. This necessitates the use of DNA markers that could provide
varietal identification, the ability to evaluate the lavender gene pool and its
proper use and conservation. Currently, for L. angustifolia Mill. there
are a reported set of Expressed Sequence Tag – Simple Sequence Repeat (EST-SSR) markers, and more recently a wider set of Simple Sequence
Repeat (SSR) markers, through which the first genetic linkage map for the
species was constructed [11,12]. On a global scale L. angustifolia Mill. has high genetic
diversity at the morphological, molecular and biochemical levels [13]. Genetic diversity in
specimens of L. angustifolia as well as genetic stability during
long-term in vitro propagation was also assessed by Sequence-Related
Amplified Polymorphism (SRAP), Single
Nucleotide Polymorphism (SNP), and Random Amplified Polymorphic DNA (RAPD) and Inter-Simple Sequence Repeat (ISSR) [11,14,15,16].
To distinguish varieties of cultivated lavender species, among which L.
angustifolia, DNA barcode markers such as matK, rbcL, trnH-psbA and ITS were also applied.
However, the matK region was not successfully
amplified, and s rbcL and trnH-psbA cannot distinguish
hybrids. ITS managed to distinguish three species with a few
exceptions, and only the combined application of rbcL,
trnH-psbA and ITS successfully differentiates cultivated L. latifolia from L. angustifolia
and L. x intermedia [17]. In the recent years, it has been revealed the mitochondrial genome
of L. angustifolia, and the chloroplast genome of the species [18,19,20]. The
rapid evolution of molecular genetics and sequencing technologies has expanded
the set of available DNA markers. Current research increasingly favors the
simultaneous application of diverse marker systems, as this integrated approach
provides a more comprehensive and robust characterization of populations
genetic structure and genetic diversity. By capturing different regions of the
genome, such combinations offer higher resolution and reliability than
single-marker analysis. Consequently, the use of multi-locus dominant markers
has become a currently strategy for assessing the genetic status of various
economically important crops[21,22,23,24,25,26]. Although Bulgaria is one of the leading producers of lavender, its
genetic material has so far only been evaluated with SRAP and SSR markers [12,14].
ISSR is a simple and fast method,
using microsatelite repetitive sequences such as primers, with their proven
high polymorphism and effectiveness in plant genomes, they are still relevant
and widely used [27,28,29]. Start Codon Target Polymorphism (SCoT) is a gene-based marker,
which uses short, conserved region flanking the ATG start codon in plant genes [30]. They can be used effectively
in Marker-Assisted Selection (MAS), they are highly
polymorphic and in a variety of plant species have advantage over ISSR and RAPD
[31,32,33,34]. Meanwhile
CEAP is a new technique, based on eight cis-elements AAAG, ACGTG, CCGA, ACT
CAT, GGTCA, TATCC, TGAC и GATAA, which are related to the growth and
development of plants, the signal transduction, and the stress response [35]. The authors tested them on
different plant species, and proved their effectiveness, polymorphism and better
results compared to ISSR, CBDP, and iPBS markers [35,36,37,38].
The aim of the study was to test
the effectiveness of three more CEAP, ISSR and SCoT marker systems on L.
angustifolia accessions from Bulgaria and to provide new
opportunities for evaluating the genetic resources of the species.
2. Materials and Methods
2.1. Plant Material
A total of 40 lavender accessions
were collected in July 2023 from two private plantations in Northeastern
Bulgaria - twenty of region Shumen (plantation 1, Figure 1A, 43° 17'
48.156" N, 27° 05' 01.572" E )
and twenty of region Shabla (plantation 2, Figure 1B, 43° 33'
04.226" N, 28° 32' 24.232" E). Samples from each site (Figure 1) were obtained from
randomly selected plants. Plants with visually distinct morphological
characteristics were included to ensure a representative sample of the field's
genetic diversity.
DNA was isolated from frozen leaf,
using Quick-DNATM Plant/Seed Miniprep Kit (Zymo Research) and
Disruptor Genie®. The concentration and quality of DNA were evaluated using a
NanoVue Plus spectrophotometer and 1% agarose gel electrophoresis (MS Choice ST
and Transilluminator Bio-Imaging System). DNA working solution (50 ng/μL) was
prepared and stored at -20°C for later use. All DNA samples exhibited high purity,
with A260/A280 ratios ranging from 1.8 to 2.0.
2.2. PCR Amplification
Thirteen Start Codon Targeted
(SCoT) primers, thirteen Inter-Simple Sequence Repeat (ISSR) primers, and
fourteen cis-element amplified polymorphism (CEAP) primers were tested for amplification
in three lavender genotypes. The
amplification of each tested primer was performed several time to ensure
technical consistency and reliability of the data. All PCR products were
performed in a total volume of 20 µl, containing 50 ng genomic DNA (1µl), 10 µl
Red Taq DNA Polymerase 2×Master Mix, 10 pmol Primer (1µl, Invitrogen, Germany),
and 8 µl nuclease-free ddH2O. Amplification was performed on a Doppio Gradient
2 × 48 well thermal cycler (VWR®, Germany), following a different program for each
type of primers. Gels were stained with GelRed® (Biotium, USA) and comprised
7.5 µl of product mixed with 1.5 µl loading buffer and NZYDNA Ladder VI (50 –
1500 bp) or DNA Ladder 100pb (100-1500bp). PCR amplified products were detected
through horizontal electrophoresis (1.8% - 2% agarose gel) and visualized by
gel imager (Bio-Imaging System, Israel). All clear and reproducible bands were used for final scoring, while all ambiguous bands were re-amplified or excluded.
SCoT-PCR
SCoT-PCR amplification program
included pre-denaturation at 94°C for 5 min, followed by 35 cycles:
denaturation at 94°C for 45 sec, annealing at 54°C - 61°C for 45 sec, extension
at 72°C for 1 min and 30 sec, and final extension at 72°C for 10 min.
ISSR-PCR
ISSR-PCR amplification program
included pre-denaturation at 94°C for 4 min, followed by 35 cycles:
denaturation at 94°C for 45 sec, annealing at 50°C for 45 sec, extension at
72°C for 45 sec, and final extension at 78°C for 8 min.
CEAP-PCR
CEAP-PCR amplification program
included pre-denaturation at 95°C for 2 min, followed by 5 cycles: denaturation
at 95°C for 40 sec, annealing at 35-39°C for 1 min, extension at 72°C for 3
min, followed by more 35 cycles: denaturation at 95°C for 40 sec, annealing at
50°C for 50 sec, extension at 72°C for 2 min, and final extension at 72°C for 8
min.
2.3. Genetic Diversity
The primers from each marker
system that were mostly polymorphic and included clear bands were used to
estimate genetic diversity at twenty accessions from the plantation 1 and 2 (
Table 1
).
2.4. Data Analysis
The presence or absence of the
amplified band was recorded in a binary data matrix as ’1’ or ’0’, and -1 for
missing data. Polymorphic information content (PIC) [39], effective multiplex ratio
(EMR) [40], marker
index (MI) [41] and
resolving power (RP) [42] were calculated. GenAlEx V 6.51 [43] was utilized for principal coordinate analysis (PCoA), and PAST V.
4.17 for determined genetic similarity index and constructed denrograms. The first two principal coordinate axes of
Genalex were used for visualization in GraphPad Prism 10.6.1. Within and among
genetic field variability was assessed by Analysis of Molecular Variance
(AMOVA) , different (Na) and effective (Ne) number
alleles, Shannon’s Information Index (I), Nei’s gene diversity (H) in GenAlEx (V 6.51).
3. Results
PCR-amplification at primers
tested
In three lavender genotypes a
total of 289 bands were registered as follows: 96 for CEAP markers, 96 for SCoT
markers and 97 for ISSR markers (Table 2, Figure 2). The number of amplified bands for CEAP markers varied from five
to eleven, with primers ACGTG26 (11), AAAG14 (11) and AAAG2 (10) scoring the
most bands (Figure 2). With SCoT markers, one of the primers (SCoT 5) showed no
amplification, the SCoT 21 primer had only one band, but for the others the
amplification was good and ranged from 1 to 15 bands. The most bands in SCoT
markers are marked with primers SCoT 14 (15 bands), SCoT 2 (12 bands), SCoT 11
(12 bands) and SCoT 15 (12 bands). In ISSR the scored bands were from four to
eleven, with four of the primers
amplifying 9 bands each (CAA6, CA6K GACA4, GA8YG), and three 8-band each
(AC8YT, CA6R, CA8G), with the most bands at CA6RM. The
SCoT markers, compared to the other systems, yielded the clearest and most
distinct amplification profiles in the three lavender samples.
Genetic diversity in lavender genotypes
Based on preliminary screening results, we selected the four informative primers to assess the genetic variability of accessions. A total of 61 bands were identified, 13 of which were monomorphic, and 48 polymorphic (Figure 3, Table 2).

Table 2.
Selected primers used for assessing the genetic diversity in Lavandula angustifolia Mill. germplasm.Total bands (TB) Polymorphic bands (PB), Monomorphic bands (MB), Effective multiplex ratio (EMR), Polymorphic information content (PIC), Resolving power (RP), Marker index (MI),.
Table 2.
Selected primers used for assessing the genetic diversity in Lavandula angustifolia Mill. germplasm.Total bands (TB) Polymorphic bands (PB), Monomorphic bands (MB), Effective multiplex ratio (EMR), Polymorphic information content (PIC), Resolving power (RP), Marker index (MI),.
| Primers | Band size, bp | TB | PB | MB | %PB | EMR | PIC | Rp | MI |
| ACTCAT1 | 300-1500 | 13 | 7 | 6 | 53.84 | 15.9 | 0.25 | 16.1 | 4.4 |
| CA6R | 200-1500 | 17 | 16 | 1 | 94.11 | 16.8 | 0.50 | 17.0 | 7.5 |
| SCoT 14 | 120-1500 | 17 | 11 | 6 | 55.00 | 21.8 | 0.25 | 19.3 | 5.5 |
| SCoT 24 | 400-1500 | 14 | 14 | 0 | 100 | 19.8 | 0.69 | 18.9 | 13.6 |
| Total | 61 | 48 | 13 | ||||||
| Mean | 75.7 | 18.6 | 0.42 | 15.3 | 7.8 |
The highest polymorphic information content (PIC) was obtained for primer SCoT 24, demonstrating the greatest effectiveness across all evaluated parameters. SCoT 14 and ACTCAT1 showed similar performance with respect to the number of monomorphic bands (MB = 6) and PIC (0.25). The mean values across all primers for the forty lavender accessions were 75.7% for %PB, 18.6 for EMR, 0.42 for PIC, 15.3 for Rp, and 7.8 for MI.
Within-field genetic diversity
Genetic diversity was observed in both lavender plantations (Table 3), as well as its variation across primers from different marker systems. For the 20 lavender plants from the Shumen region (Plantation 1), genetic diversity indices—represented by the effective number of alleles (Ne), Shannon’s information index (I), and Nei’s gene diversity (H)—ranged from 1.21 to 1.60, 0.16 to 0.50, and 0.11 to 0.34, respectively, with the highest values recorded for ISSR markers, particularly primer CA6R. Mean values across all loci for all genotypes were Ne = 1.41, I = 0.34, and H = 0.23. In the Shabla region (Plantation 2), the highest values were observed for SCoT markers, especially SCoT24, with ranges across all primers as follows: Ne = 1.26–1.52, I = 0.23–0.41, and H = 0.15–0.28. Overall, a similar level of genetic diversity was observed among the 20 genotypes from Plantation 2 across all loci and marker systems (Ne = 1.38, I = 0.32, H = 0.22). The seven specific locus for both plantations were registered.
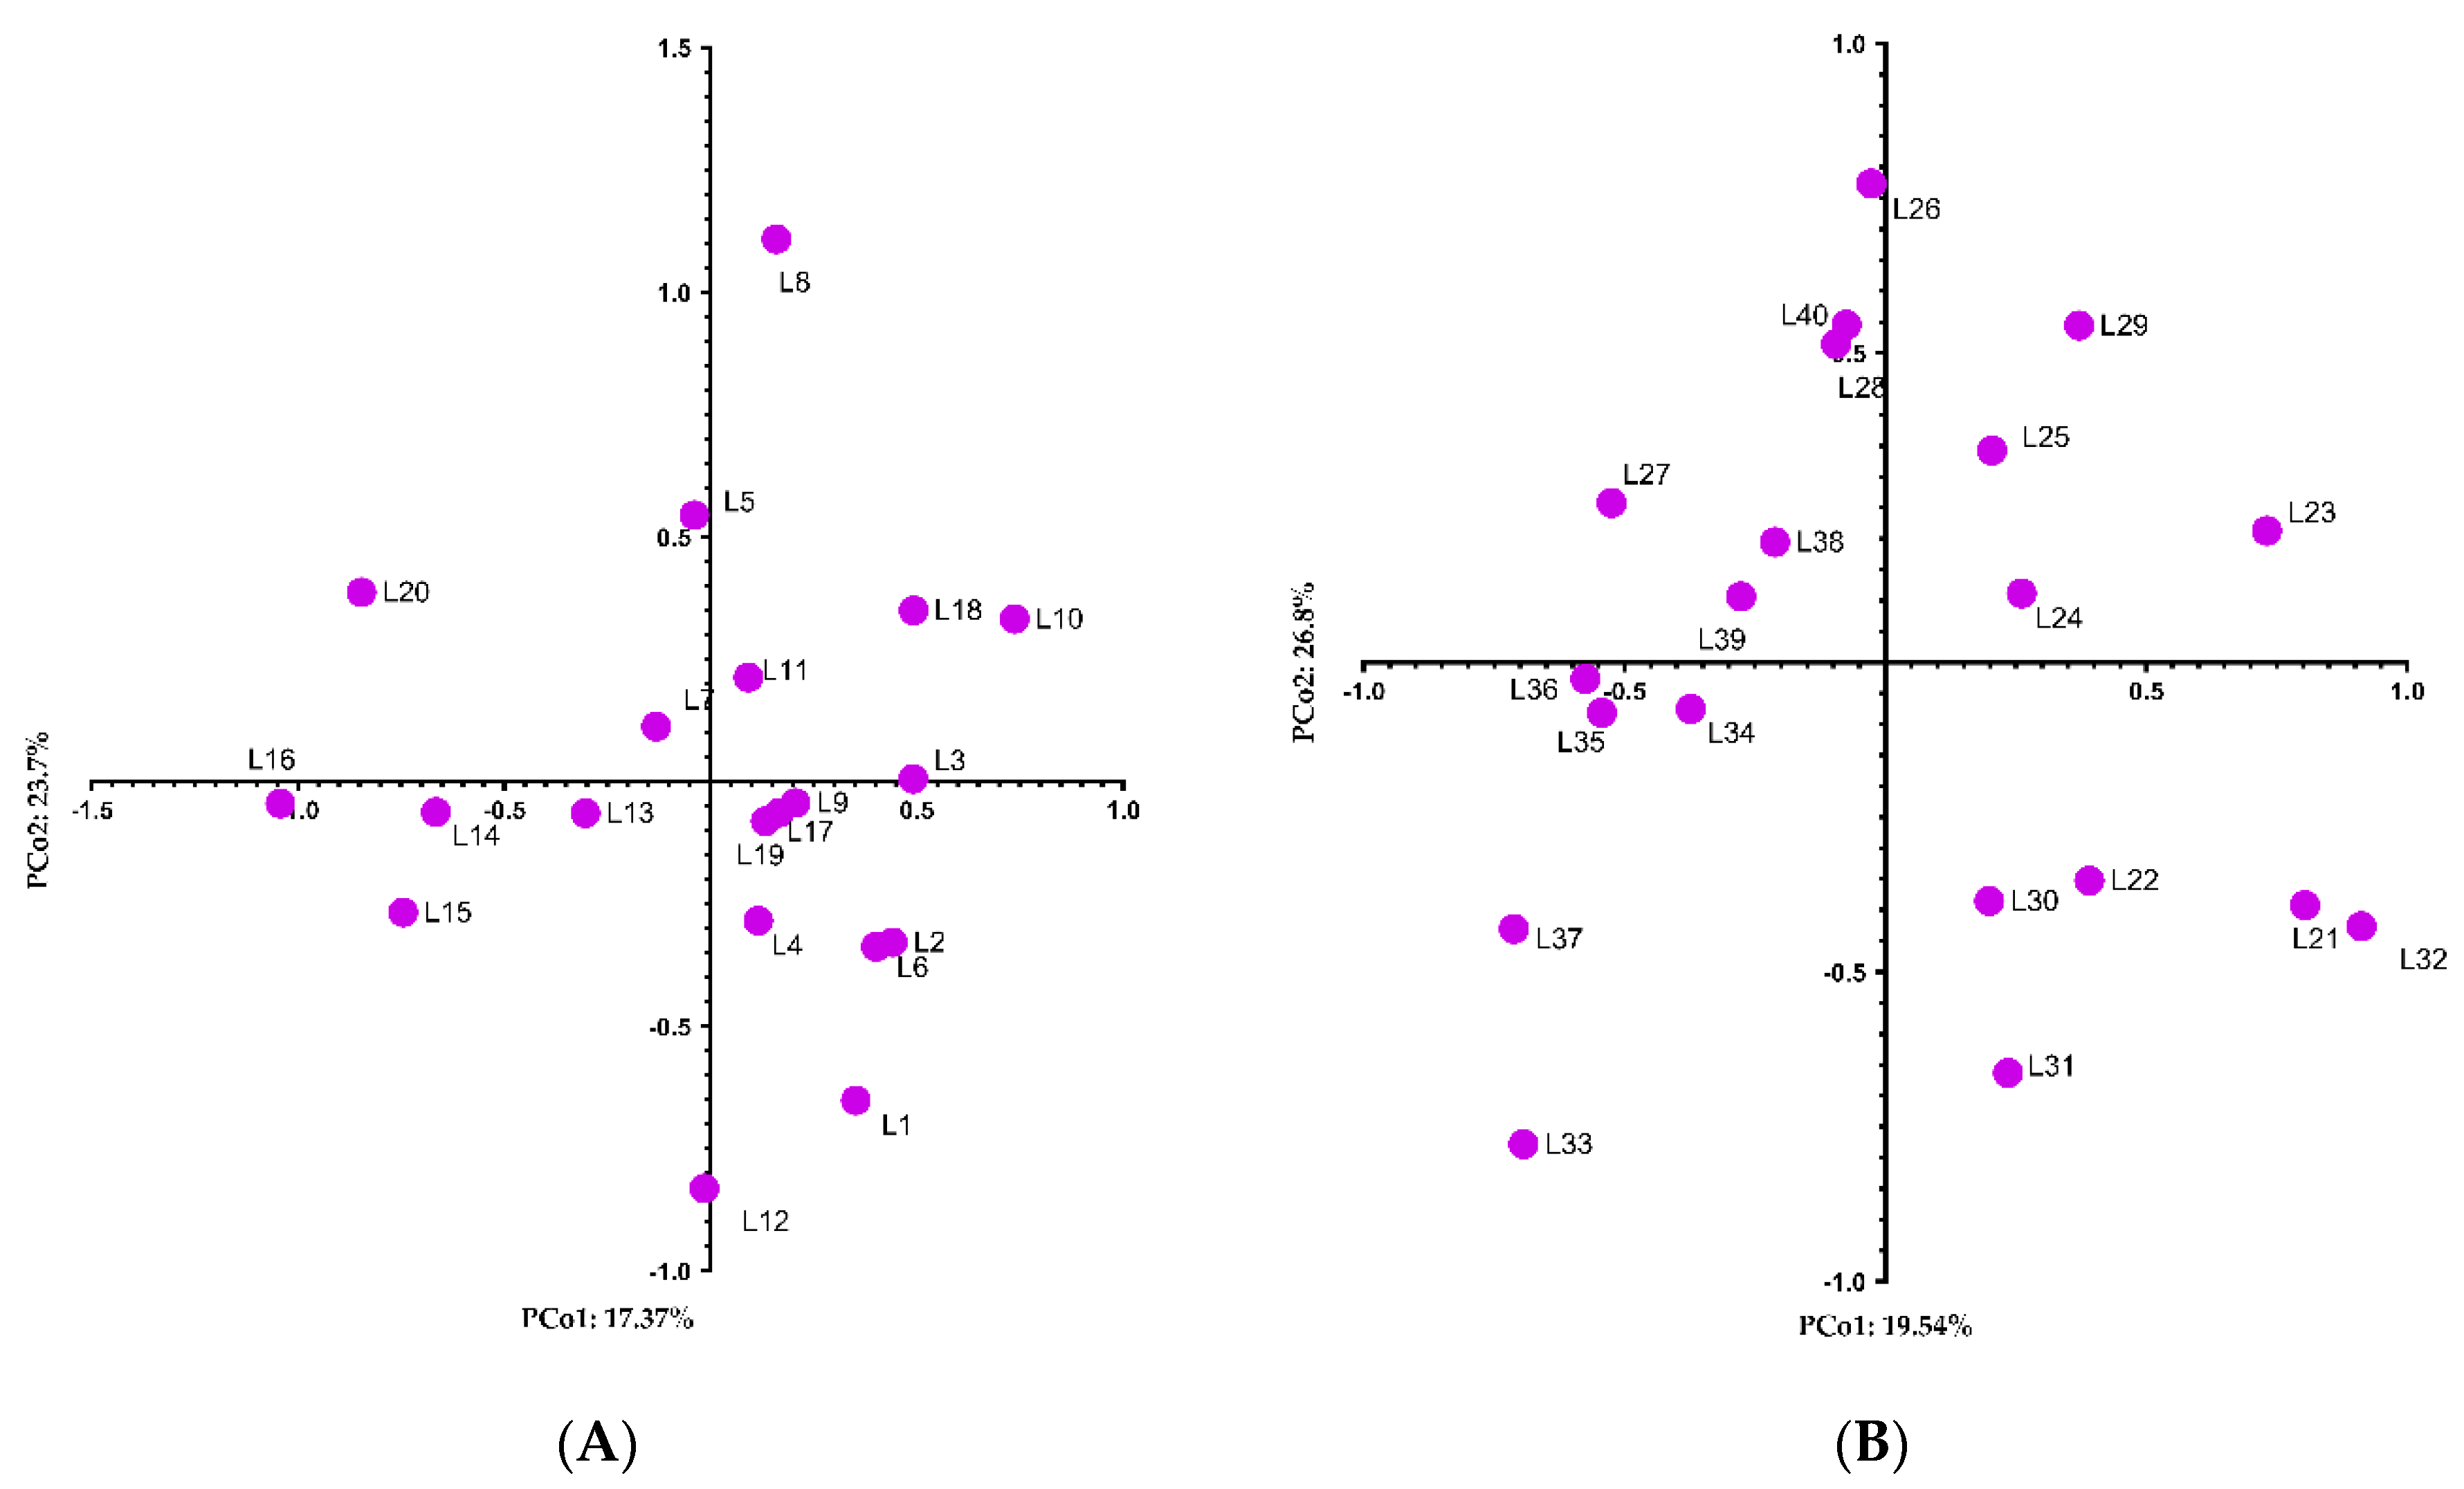
The genetic relationships visualized on the first two axes of the PCoA plots confirm the presence of within-field genetic diversity; these axes account for 17.37% and 23.68% (totaling 41.05%) of the variation in Plantation 1 (Figure 3A), and 19.54% and 26.38% (totaling 45.92%) in Plantation 2 (Figure 3B).. In both plantations, only a few plants exhibited a high level of genetic similarity – L9, L19 and L17; L6 and L2; L28 and L40; L35 and L36. The coefficient of Jaccard genetic similarity among accessions in fields varied from 0.65 to 0.92 in Plantation 1 and a wider range in Plantation 2 (0.58 to 0.93).
Figure 4.
PCoA plot of within-field patterns within 20 Lavandula angustifolia Mill accessions revealed by CEAP, ISSR and SCoT markers in two plantations: (a) Plantation 1 (L1-L20); (b) Plantation 2 (L21-40).
Figure 4.
PCoA plot of within-field patterns within 20 Lavandula angustifolia Mill accessions revealed by CEAP, ISSR and SCoT markers in two plantations: (a) Plantation 1 (L1-L20); (b) Plantation 2 (L21-40).
Among fields genetic diversity
The Nei genetic distance between the two plantations was 0.186, indicating a considerable similarity between them. Genetic diversity indices across all loci for the forty genotypes were comparable to the within-field diversity indices of each plantation, with values of Ne = 1.40, I = 0.33, and H = 0.23 (Table 4).
This is further supported by the AMOVA analysis, which showed a coefficient of genetic differentiation ФPT (PhiPT) among fields of 0.419, indicating that 42% of the total genetic variation was attributable to differences between fields and 58% to variation within fields (p = 0.001) (Table 5).
In the hierarchical clustering analysis, based on locus-specific genetic distances and Ward’s linkage method, the genotypes from the two plantations are clearly separated, confirming genetic diversity within the L. angustifolia germplasm (Figure 5). Genotypes from the Shumen region (Plantation 1; L1–L20) are resolved into three clusters, whereas those from the Shabla region (Plantation 2; L21–L40) form two clusters. The clustering patterns across primers indicate that all marker systems detect both monomorphic and polymorphic regions, complementing one another in resolving genetic relationships. The shade plot in Figure 5 illustrates the polymorphisms detected by each primer across the forty lavender genotypes. All primers contain at least one highly polymorphic locus, and their combined application enhances the accuracy of genetic diversity assessment and supports marker-assisted selection.
4. Discussion
This is the first report on the use of a combination of dominant marker systems such as CEAP, ISSR and SCoT markers in germplasm in lavender. A total of forty primers - 13 SCoT, 13 ISSR, and 14 CEAP were tested.Most of them amplified clear loci that can be informative. The highest number of ambiguous loci was observed with the CEAP markers, which may be entirely attributable to the amplification conditions. Under the specified experimental conditions, SCoT markers stand out with the clearest profile of many loci and high efficiency for distinguishing lavender genotypes, Figure 2 and Figure 3 and Table 1 and Table 2. A similar profile can be related to chemotypes, as in the case of Myrtus communis L. [45].The authors identify an aconcordance in the Cluster Analysis between the composition of essential oils and the genetic profiles derived from SCoT markers. The results clearly demonstrate a strong correlation between genetic diversity, essential oil profiles, and environmental factors. Given the insufficient information available on the genetic characteristics of local lavender varieties, these findings will be helpful for future studies and crop improvement..
In a study of Dactylis glomerata using a combination of three marker techniques – AFLP, ISSR and RAPD, the authors concluded that the identified 288 loci provided the necessary broad genome coverage. This coverage is of particular importance when analysing variability in closely related genotypes. Such comprehensive data are essential for improving varieties and establishing germplasm collections [46]. The four primers tested by us demonstrate grouping both in the polymorphic fragments in lavender, and the monomorphic ones, in different proportion. This shows the necessity of studying more loci, more primers and comparing different genome segments, which can be easily done by combining techniques for dominant markers [45,46,47,48,49].
The reported genetic diversity in local lavender accessions in the present study, confirms the results of other authors who discovered such genetic diversity in Bulgarian cultivars through analysis with the use of SRAP markers [14]. The authors used a total of 51 primer pairs, with the average percentage of polymorphic fragments for the studied genotypes being 74.3%, and the Polymorphic Information Content (PIC) ranging from 0.22 to 0.39, demonstrating a high potential for effective use in lavender plants. In the present study, the tested four markers from two plantations with 20 genotypes each, revealed an average percentage of polymorphic loci among genotypes of 63.93% for plantation 1 and 59.02% for plantation 2, (Table 3), and a variation of PIC ranged from 0.25 to 0.69, indicating also a high potential for assessment of the lavender germplasm. Also, these four markers can be successfully applied when assessing and comparing the genetic structure of plant material on production fields (Table 3, Figure 4 and Figure 5). Zagorcheva et al. [14] reported genetic similarity based on Jacard coefficients 0.30, which corresponds to the similarity coefficient obtained by us, Jacard similarity 0.27 for plantation 1, and 0.35 for plantation 2, with a value of 0.42 for the forty genotypes.
In the scientific literature, the Effective Multiplex Ratio (EMR) and Resolving Power (RP) indices are used as key indicators of marker efficiency within a group of individuals. In this study, the values obtained for EMR (19.8 and21.8) and RP (18.9 and 19.3) demonstrate the superiority of SCoT markers over the ISSR and CEAP systems. Given the higher resolution achieved across multiple loci, we recommend the extensive use of SCoT markers for the genetic evaluation of lavender plant material.. The tested ISSR markers can also be effectively combined with SCoT markers, as they demonstrated clear and highly polymorphic profiles in our study (Table 2 and Table 3, and 4).. In the study of Salvia - another valuable species for cosmetics, perfumery and medicine, the authors made similar recommendations, based on the data from ISSR and SCoT markers. They recommend SCoT as more effective, based on higher RP values, and more accurate subclustering of individuals according to their species and sections. But they emphasize that the correlation between ISSR and SCoT matrices derived by Mantel test (r = 0.83) shows a similar pattern of polymorphism distribution and a great correspondence between the results obtained by the two techniques [50].
Genetic diversity and phylogenetic relationships between 28 varieties of lavender (L. angustifolia Mill.), from the Ilij region, (Xinjiang) has been studied through ISSR markers [51]. According to the authors their results show a low level of genetic diversity (Ne = 1.448, H = 0.262, I = 0.384), which would make it difficult to create new varieties in this region. But they prove the ability of the ISSR technique in the lavender genotype, with an estimated Polymorphism rate of 75.00%, for 8 ISSR markers, identifying 60 polymorphic loci. The present study revealed similar indices for genetic diversity with only 16 ISSR polymorphic loci identified in 40 lavender genotypes from two production fields (Ne = 1.50, H = 0.29, and I = 0.43), and a total of 48 polymorphic loci from different marker systems (Ne = 1.40, H = 0.23, and I = 0.33). Interesting is also the result of Dan-li et al. for the genetic similarity coefficient between the 28 varieties, which is 0.30 and coincides with the one reported by Zagorcheva et al. in the study of 10 Bulgarian and 5 foreign varieties of lavender [14,51].
While the current data are limited regarding the overall genetic diversity of the examined lavender samples, they demonstrate the effectiveness of the applied techniques and provide clear directions for future research aimed at a broader assessment of genetic resources. Although the four markers from three different systems offered an initial estimate of the genetic structure and relationships among the 40 lavender plants in the two production fields, a more comprehensive evaluation would require additional markers and a larger number of loci.. Despite the limitation of the small number of loci reported here, the analyses performed (PCoA, AMOVA, and Hierarchical clustering) clearly reflect a lack of genotypic uniformity within these fields. The genetic material between the fields is well-differentiated, as indicated by a ФPT (PhiPT) of 0.419; as well as the within-field variability is also considerably high (58%). The absence of distinct clustering in the PCoA plot suggests a mixture of cultivars within these fields—an observation visually supported by the morphological variations shown in Figure 1. The wide range of Jaccard similarity values (0.58-0.93) and the calculated Nei genetic distance (0.186) highlight a lack of genetic stability within these lavender accessions. From a practical standpoint, this genetic fragmentation, further evidenced by the PCoA and AMOVA results, suggests that cultivar purity has not been maintained, which may lead to inconsistent essential oil quality and varying yields across the production fields.The expansion of the total lavender areas during the last decade in Bulgaria is related to increasing cultivation outside the traditional areas in the country. Often the local soil characteristics and/or climate conditions in the new regions of lavender cultivation are not optimal for the currently available and cultivated varieties, which results in large variations of flower and essential oil yields, as well as lower lavender oil quality in some unfavourable years [4]. However, the development and application of molecular markers for the characterization of genetic resources and biodiversity in Bulgarian lavender have been restricted to only a few reported studies [4,12].
In this study were tested a total of 40 primers from three marker systems in germplasms of Lavandula angustifolia Mill., which can be applied to assess planting materials, assessment of genetic diversity and relationships, and marker-assisted selections. Despite the new information, this study has limitations in terms of both marker coverage and sample size.. Future research should focus on larger-scale sampling across different agroclimatic zones and the development of a molecular database for cultivar identification, which is essential for ensuring the authenticity and quality of lavender essential oil.
Funding
The APC was funded by Bulgarian Ministry of Education and Science in the frames of the Bulgarian National Recovery and Resilience Plan, Component “Innovative Bulgaria,” the Project No BG-RRP-2.004-0006-C02 “Development of research and innovation at Trakia University in service of health and sustainable well-being”. The study was supported by the Bulgarian Ministry of Education and Science the National Science Fund grant number: КП 06 М61/7 15.12.22, Project: "Genetic Profile of Lavender Plantations from Different Regions of Bulgaria. Determining the Authenticity and Uniformity of the Initial Planting Material and Its Influence on the Quality of the Obtained Essential Oil.
Data Availability Statement
The original contributions presented in this study are included in the article. Further inquiries can be directed at the corresponding author.
Acknowledgments
The author extends profound appreciation to M.Sc. Julieta Kocherneko for her meticulous and high-quality translation of the manuscript. Gratitude is also expressed to M.Sc. Vanesa Vasileva and Ph.D. Zornitsa Zherkova for their valuable assistance in the collection and transportation of the plant material. The author further acknowledges the lavender growers for their cooperation and for granting access to their fields for sampling.
Conflicts of Interest
The author declare no conflicts of interest.
References
- Atanasova, M.; Nedkov, N. Essential Oil and Medicinal Crops. Modern Cultivation Technologies. Competitiveness. Funding.; (In Bulgarian). Cameo: Sofia, Bulgaria, 2004. [Google Scholar]
- Ražná, K.; Čerteková, S.; Štefúnová, V.; Habán, M.; Korczyk-Szabó, J.; Ernstová, M. Lavandula spp. diversity assessment by molecular markers as a tool for growers. Agrobiodiversity for Improving Nutrition, Health and Life Quality 2023, 7(1). [Google Scholar] [CrossRef]
- Georgieva, R.; Kirchev, H.; Delibaltova, V.; Chavdarov, P. Investigation of Some Agricultural Performances of Lavender Varieties. Yuzuncu Yıl University Journal of Agricultural Sciences 2021, 31, 170–178. [Google Scholar] [CrossRef]
- Kozuharova, E.; Simeonov, V.; Batovska, D.; Stoycheva, C.; Valchev, H.; Benbassat, N. Chemical composition and comparative analysis of lavender essential oil samples from Bulgaria in relation to the pharmacological effects. Pharmacia 2023, 70, 395–403. [Google Scholar] [CrossRef]
- Stanev, S.; Angelova, D. Peculiarities in the flowering of the Bulgarian varieties of lavender (Lavandula angustifolia Mill.). Applied microbiology and biotechnology 2023, 99, 3375–3385. [Google Scholar]
- Adaszyńska-Skwirzyńska, M.; Zych, S.; Bucław, M.; Majewska, D.; Dzięcioł, M.; Szczerbińska, D. Evaluation of the antibacterial activity of gentamicin in combination with essential oils isolated from different cultivars and morphological parts of Lavender (Lavandula angustifolia Mill.) against selected bacterial strains. Molecules 2023, 28, 5781. [Google Scholar] [CrossRef]
- Prasad, A.; Shukla, S.P.; Mathur, A.; Chanotiya, C.S.; Mathur, A.K. Genetic fidelity of long-term micropropagated Lavandula officinalis Chaix.: an important aromatic medicinal plant. Plant Cell, Tissue and Organ Culture (PCTOC) 2015, 120, 803–811. [Google Scholar] [CrossRef]
- Ibrahim, H.; Salama, A.M.; Abou El-Leel, O.F. Analysis of genetic diversity of Lavandula species using taxonomic, essential oil and molecular genetic markers. Sciences 2017, 7, 141–154. [Google Scholar]
- Babanina, S.S.; Yegorova, N.A.; Stavtseva, I.V.; Abdurashitov, S.F. Genetic stability of lavender (Lavandula angustifolia Mill.) plants obtained during long-term clonal micropropagation. Russian Agricultural Sciences 2023, 49, 132–139. [Google Scholar] [CrossRef]
- Stoyanova, A.; Balinova-Tcvetkova, A. Lavender: Obtaining Essential Oil Products in Bulgaria.; (In Bulgarian). UFT Academic Publishing House: Plovdiv, Bulgaria, 2019. [Google Scholar]
- Adal, A.M.; Demissie, Z.A.; Mahmoud, S.S. Identification, validation and cross-species transferability of novel Lavandula EST-SSRs. Planta 2015, 241, 987–1004. [Google Scholar] [CrossRef] [PubMed]
- Georgieva, P.; Rusanov, K.; Rusanova, M.; Kitanova, M.; Atanassov, I. Development of SSR markers and construction of a genetic linkage map in lavender (Lavandula angustifolia Mill.). Preprints 2025, 2025011933. [Google Scholar] [CrossRef]
- Sharan, H.; Pandey, P.; Singh, S. Genetic Resources and Breeding Strategies for Lavender (Lavandula angustifolia Mill.). In Ethnopharmacology and OMICS Advances in Medicinal Plants; Springer Nature Singapore: Singapore, 2024; Volume 2, pp. 33–54. [Google Scholar]
- Zagorcheva, T.; Stanev, S.; Rusanov, K.; Atanassov, I. SRAP markers for genetic diversity assessment of lavender (Lavandula angustifolia Mill.) varieties and breeding lines. Biotechnology & Biotechnological Equipment 2020, 34, 303–308. [Google Scholar] [CrossRef]
- Ražná, K.; Čerteková, S.; Štefúnová, V.; Habán, M.; Korczyk-Szabó, J.; Ernstová, M. Lavandula spp. diversity assessment by molecular markers as a tool for growers. Agrobiodiversity for Improving Nutrition, Health and Life Quality 2023, 7(1). [Google Scholar] [CrossRef]
- Fopa Fomeju, B.; Brunel, D.; Bérard, A.; Rivoal, J.B.; Gallois, P.; Le Paslier, M.C.; Bouverat-Bernier, J.P. Quick and efficient approach to develop genomic resources in orphan species: Application in Lavandula angustifolia. Plos one 2020, 15, e0243853. [Google Scholar] [CrossRef]
- Hind, K.R.; Adal, A.M.; Upson, T.M.; Mahmoud, S.S. An assessment of plant DNA barcodes for the identification of cultivated Lavandula (Lamiaceae) taxa. Biocatalysis and agricultural biotechnology 2018, 16, 459–466. [Google Scholar] [CrossRef]
- Wang, J.; Liu, X.; Zhang, M.; Liu, R. The mitochondrial genome of Lavandula angustifolia Mill. (Lamiaceae) sheds light on its genome structure and gene transfer between organelles. BMC genomics 2024, 25, 929. [Google Scholar] [CrossRef]
- Ma, Lan. The complete chloroplast genome sequence of the fragrant plant Lavandula angustifolia (Lamiaceae). Mitochondrial DNA Part B 2018, 3:1, 135–136. [Google Scholar] [CrossRef]
- Alp Furan, M.; Yildiz, F.; Kaya, O. Exploring the Complete Chloroplast Genomes of Key Lamiaceae Species Uncovers the Secrets of Evolutionary Dynamics and Phylogenetic Relationships. Journal of Plant Growth Regulation 2025, 1–14. [Google Scholar] [CrossRef]
- Al-Khayri, J.M.; Mahdy, E.M.; Taha, H.S.; Eldomiaty, A.S.; Abd-Elfattah, M.A.; Abdel Latef, A.A.H.; Hassanin, A.A. Genetic and morphological diversity assessment of five kalanchoe genotypes by SCoT, ISSR and RAPD-PCR markers. Plants 2022, 11, 1722. [Google Scholar] [CrossRef]
- Amom, T.; Tikendra, L.; Apana, N.; Goutam, M.; Sonia, P.; Koijam, A.S.; Nongdam, P. Efficiency of RAPD, ISSR, iPBS, SCoT and phytochemical markers in the genetic relationship study of five native and economical important bamboos of North-East India. Phytochemistry 2020, 174, 112330. [Google Scholar] [CrossRef] [PubMed]
- Chen, M.Y.; He, X.H.; Zhang, Y.L.; Lu, T.T.; Yang, J.H.; Huang, X.; Luo, C. Genetic diversity and relationship analyses of mango (Mangifera indica L.) germplasm resources with ISSR, SRAP, CBDP and CEAP markers. Scientia Horticulturae 2022, 301, 111146. [Google Scholar] [CrossRef]
- Marimuthu Somasundaram, S.; Durairajan, S.G.; Arumugam Palanivelu, S.; Rajendran, S.; Palani, D.; Arumugam, C.; Subbaraya, U. Evaluation of genetic diversity and phylogenetic relationship among the major banana varieties of north-eastern India using ISSR, IRAP, and SCoT markers. Plant Molecular Biology Reporter 2024, 42, 281–296. [Google Scholar] [CrossRef]
- Badakhshan, H.; Kamangar, M.S.; Mozafari, A.A. Characterization of strawberry (Fragaria × ananassa Duch.) cultivars using SCoT, ISSR and IRAP markers. Crop Breeding Journal 2018, 8, 61–72. [Google Scholar]
- Tahir, N.; Lateef, D.; Rasul, K.; Rahim, D.; Mustafa, K.; Sleman, S.; Aziz, R. Assessment of genetic variation and population structure in Iraqi barley accessions using ISSR, CDDP, and SCoT markers. Czech Journal of Genetics and Plant Breeding 2023, 59, 148–159. [Google Scholar] [CrossRef]
- Pradeep Reddy, M.; Sarla, N.; Siddiq, E.A. Inter simple sequence repeat (ISSR) polymorphism and its application in plant breeding. Euphytica 2002, 128, 9–17. [Google Scholar] [CrossRef]
- da Silva, G.R.; de Sousa, V.A.; Guedes, F.L.; Diniz, F.M. Genetic diversity and association analysis of ISSR markers with forage production traits in pigeonpea. Genetic Resources and Crop Evolution 2025, 72, 5853–5871. [Google Scholar] [CrossRef]
- Chittaragi, D.; Ananthan, M.; Venkatesan, K.; Mahalingam, L.; Jeyakumar, P.; Boopathi, N.M. Molecular characterization of curry leaf genotypes using ISSR markers. Scientific Reports 2025, 15, 37763. [Google Scholar] [CrossRef]
- Collard, B.C.; Mackill, D.J. Start codon targeted (SCoT) polymorphism: a simple, novel DNA marker technique for generating gene-targeted markers in plants. Plant Molecular Biology Reporter 2009, 27, 86–93. [Google Scholar] [CrossRef]
- Mulpuri, S.; Muddanuru, T.; Francis, G. Start codon targeted (SCoT) polymorphism in toxic and non-toxic accessions of Jatropha curcas L. and development of a codominant SCAR marker. Plant science 2013, 207, 117–127. [Google Scholar] [CrossRef]
- Rahimi, M.; Nazari, L.; Kordrostami, M.; Safari, P. SCoT marker diversity among Iranian Plantago ecotypes and their possible association with agronomic traits. Scientia Horticulturae 2018, 233, 302–309. [Google Scholar] [CrossRef]
- Xu, Y.X.; Shen, S.Y.; Chen, W.; Chen, L. Analysis of genetic diversity and development of a SCAR marker for green tea (Camellia sinensis) cultivars in Zhejiang Province: the most famous green tea-producing area in China. Biochemical Genetics 2019, 57, 555–570. [Google Scholar] [CrossRef]
- Pan, H.; Deng, L.; Zhu, K.; Shi, D.; Wang, F.; Cui, G. Evaluation of genetic diversity and population structure of Annamocarya sinensis using SCoT markers. Plos One 2024, 19, e0309283. [Google Scholar] [CrossRef]
- Chen, M.; He, X.; Huang, X.; Lu, T.; Zhang, Y.; Zhu, J.; Luo, C. Cis-element amplified polymorphism (CEAP), a novel promoter-and gene-targeted molecular marker of plants. Physiology and Molecular Biology of Plants 2022, 28, 1407–1419. [Google Scholar] [CrossRef]
- Chen, M.Y.; He, X.H.; Zhang, Y.L.; Lu, T.T.; Yang, J.H.; Huang, X.; Luo, C. Genetic diversity and relationship analyses of mango (Mangifera indica L.) germplasm resources with ISSR, SRAP, CBDP and CEAP markers. Scientia Horticulturae 2022, 301, 111146. [Google Scholar] [CrossRef]
- Wang, Z.; Wu, X.; Pi, Z.; Wu, Z.; Li, S. Genetic diversity analysis of red beet germplasm resources using CEAP molecular markers. Sugar Tech 2024, 26, 1477–1486. [Google Scholar] [CrossRef]
- Song, Y.; Li, S.; Pi, Z.; Wu, Z. Genetic Diversity Analysis of Sugar Beet Polyembryonic Germplasm Resources Based on CBDP and CEAP Molecular Markers. Sugar Tech 2025, 1–8. [Google Scholar] [CrossRef]
- Roldan-Ruiz, I.; Dendauw, J.; Vanbockstaele, E.; Depicker, A.; De Loose, M. AFLP markers reveal high polymorphic rates in ryegrasses (Lolium spp.). Molecular Breeding 2000, 6, 125–134. [Google Scholar] [CrossRef]
- Nagaraju, J.; Damodar, R.K.; Nagaraja, G.M.; Sethuraman, B.N. Comparison of multilocus RFLPs and PCR-based marker systems for genetic analysis of the silkworm, Bombyx mori. Heredity 2001, 86, 588–597. [Google Scholar] [CrossRef]
- Varshney, R.K.; Chabane, K.; Hendre, P.S.; Aggarwal, R.K.; Graner, A. Comparative assessment of EST-SSR, EST-SNP and AFLP markers for evaluation of genetic diversity and conservation of genetic resources using wild, cultivated and elite barleys. Plant Science 2007, 173, 638–649. [Google Scholar] [CrossRef]
- Prevost, A.; Wilkinson, M.J. A new system of comparing PCR primers applied to ISSR fingerprinting of potato cultivars. Theoretical and Applied Genetics 1999, 98, 107–112. [Google Scholar] [CrossRef]
- Peakall, R.; Smouse, P.E. GENALEX 6: Genetic analysis in Excel. Population genetic software for teaching and research. Molecular Ecology Resources 2006, 6, 288–295. [Google Scholar] [CrossRef]
- Hammer, Ø.; Harper, D. A. Past: paleontological statistics software package for educaton and data anlysis. Palaeontologia electronica 2001, 4(1), 1. [Google Scholar]
- FARD, S.M.; Peyvandi, M.; Abbaspour, H.; Majd, A.; MARANDI, S.J. Genetic diversity and essential oil composition of Myrtus communis L. from Lorestan Province, Iran: Implications for conservation and utilization. Notulae Botanicae Horti Agrobotanici Cluj-Napoca 2025, 53, 14559–14559. [Google Scholar] [CrossRef]
- Costa, R.; Pereira, G.; Garrido, I.; Tavares-de-Sousa, M.M.; Espinosa, F. Comparison of RAPD, ISSR, and AFLP molecular markers to reveal and classify orchardgrass (Dactylis glomerata L.) germplasm variations. Plos One 2016, 11, e0152972. [Google Scholar] [CrossRef]
- Elgohary, M.E.; Salama, E.A.; El-wakil, H.M.; Abdelsalam, N.R.; Atia, M.A. Integrating SCoT, CBDP, and ISSR molecular markers for genetic diversity assessment and taxonomic authentication of some Asteraceae species in Egypt. Genetic Resources and Crop Evolution 2025, 1–21. [Google Scholar] [CrossRef]
- Bidyananda, N.; Jamir, I.; Nowakowska, K.; Varte, V.; Vendrame, W.A.; Devi, R.S.; Nongdam, P. Plant genetic diversity studies: insights from DNA marker analyses. International Journal of Plant Biology 2024, 15, 607–640. [Google Scholar] [CrossRef]
- Hromadová, Z.; Gálová, Z.; Mikolášová, L.; Balážová, Ž.; Vivodík, M.; Chňapek, M. Efficiency of RAPD and SCoT markers in the genetic diversity assessment of the common bean. Plants 2023, 12, 2763. [Google Scholar] [CrossRef] [PubMed]
- Etminan, A.; Pour-Aboughadareh, A.; Noori, A.; Ahmadi-Rad, A.; Shooshtari, L.; Mahdavian, Z.; Yousefiazar-Khanian, M. Genetic relationships and diversity among wild Salvia accessions revealed by ISSR and SCoT markers. Biotechnology & Biotechnological Equipment 2018, 32, 610–617. [Google Scholar] [CrossRef]
- Guo, D.; Li, M.; Wang, Z.; Jiang, X.; Huang, X.; Lu, Z.; Wang, P. Genetic Diversity of Distinctive-spicy Lavender Cultivars in Xinjiang Yili Revealed by ISSR Analysis. Xinjiang Agricultural Sciences 2016, 53, 716–720. [Google Scholar]
Figure 1.
Location of the study sites: A - Plantation 1, B - Plantation 2.
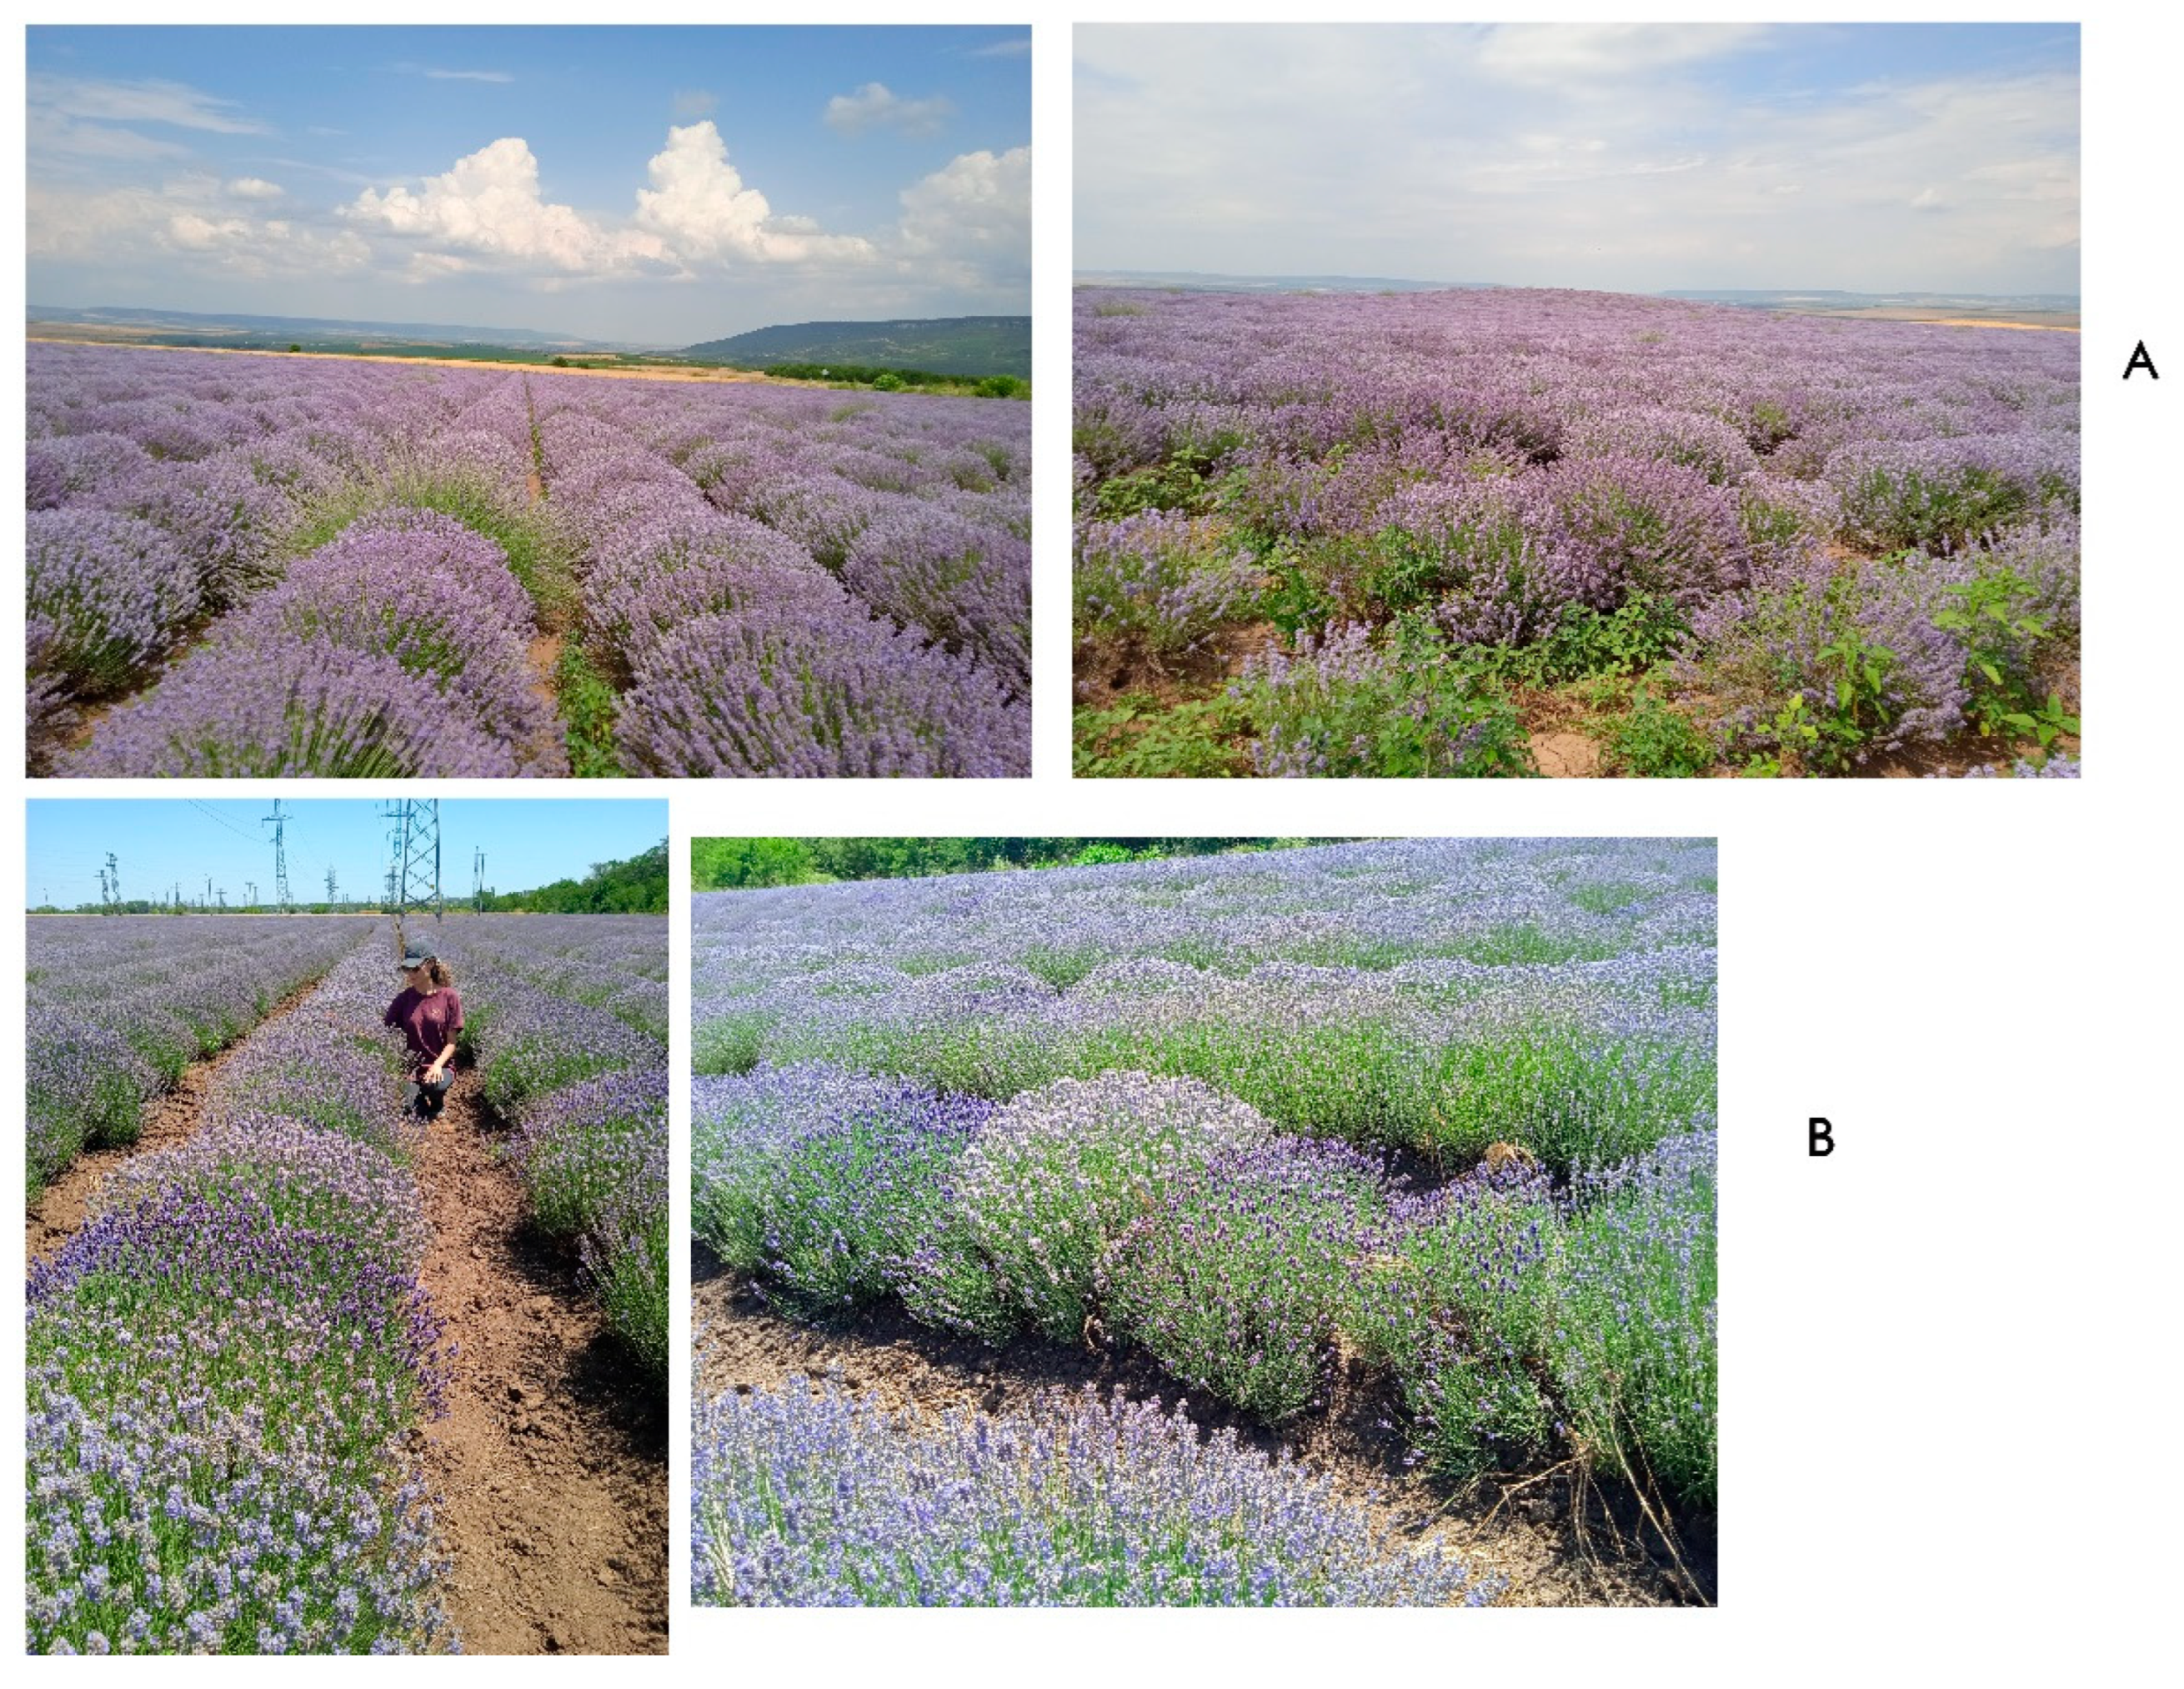
Figure 2.
Electrophoresis gels of three lavender accessions (1, 2, 3) tested with CEAP, ISSR and SCoT primers.
Figure 2.
Electrophoresis gels of three lavender accessions (1, 2, 3) tested with CEAP, ISSR and SCoT primers.
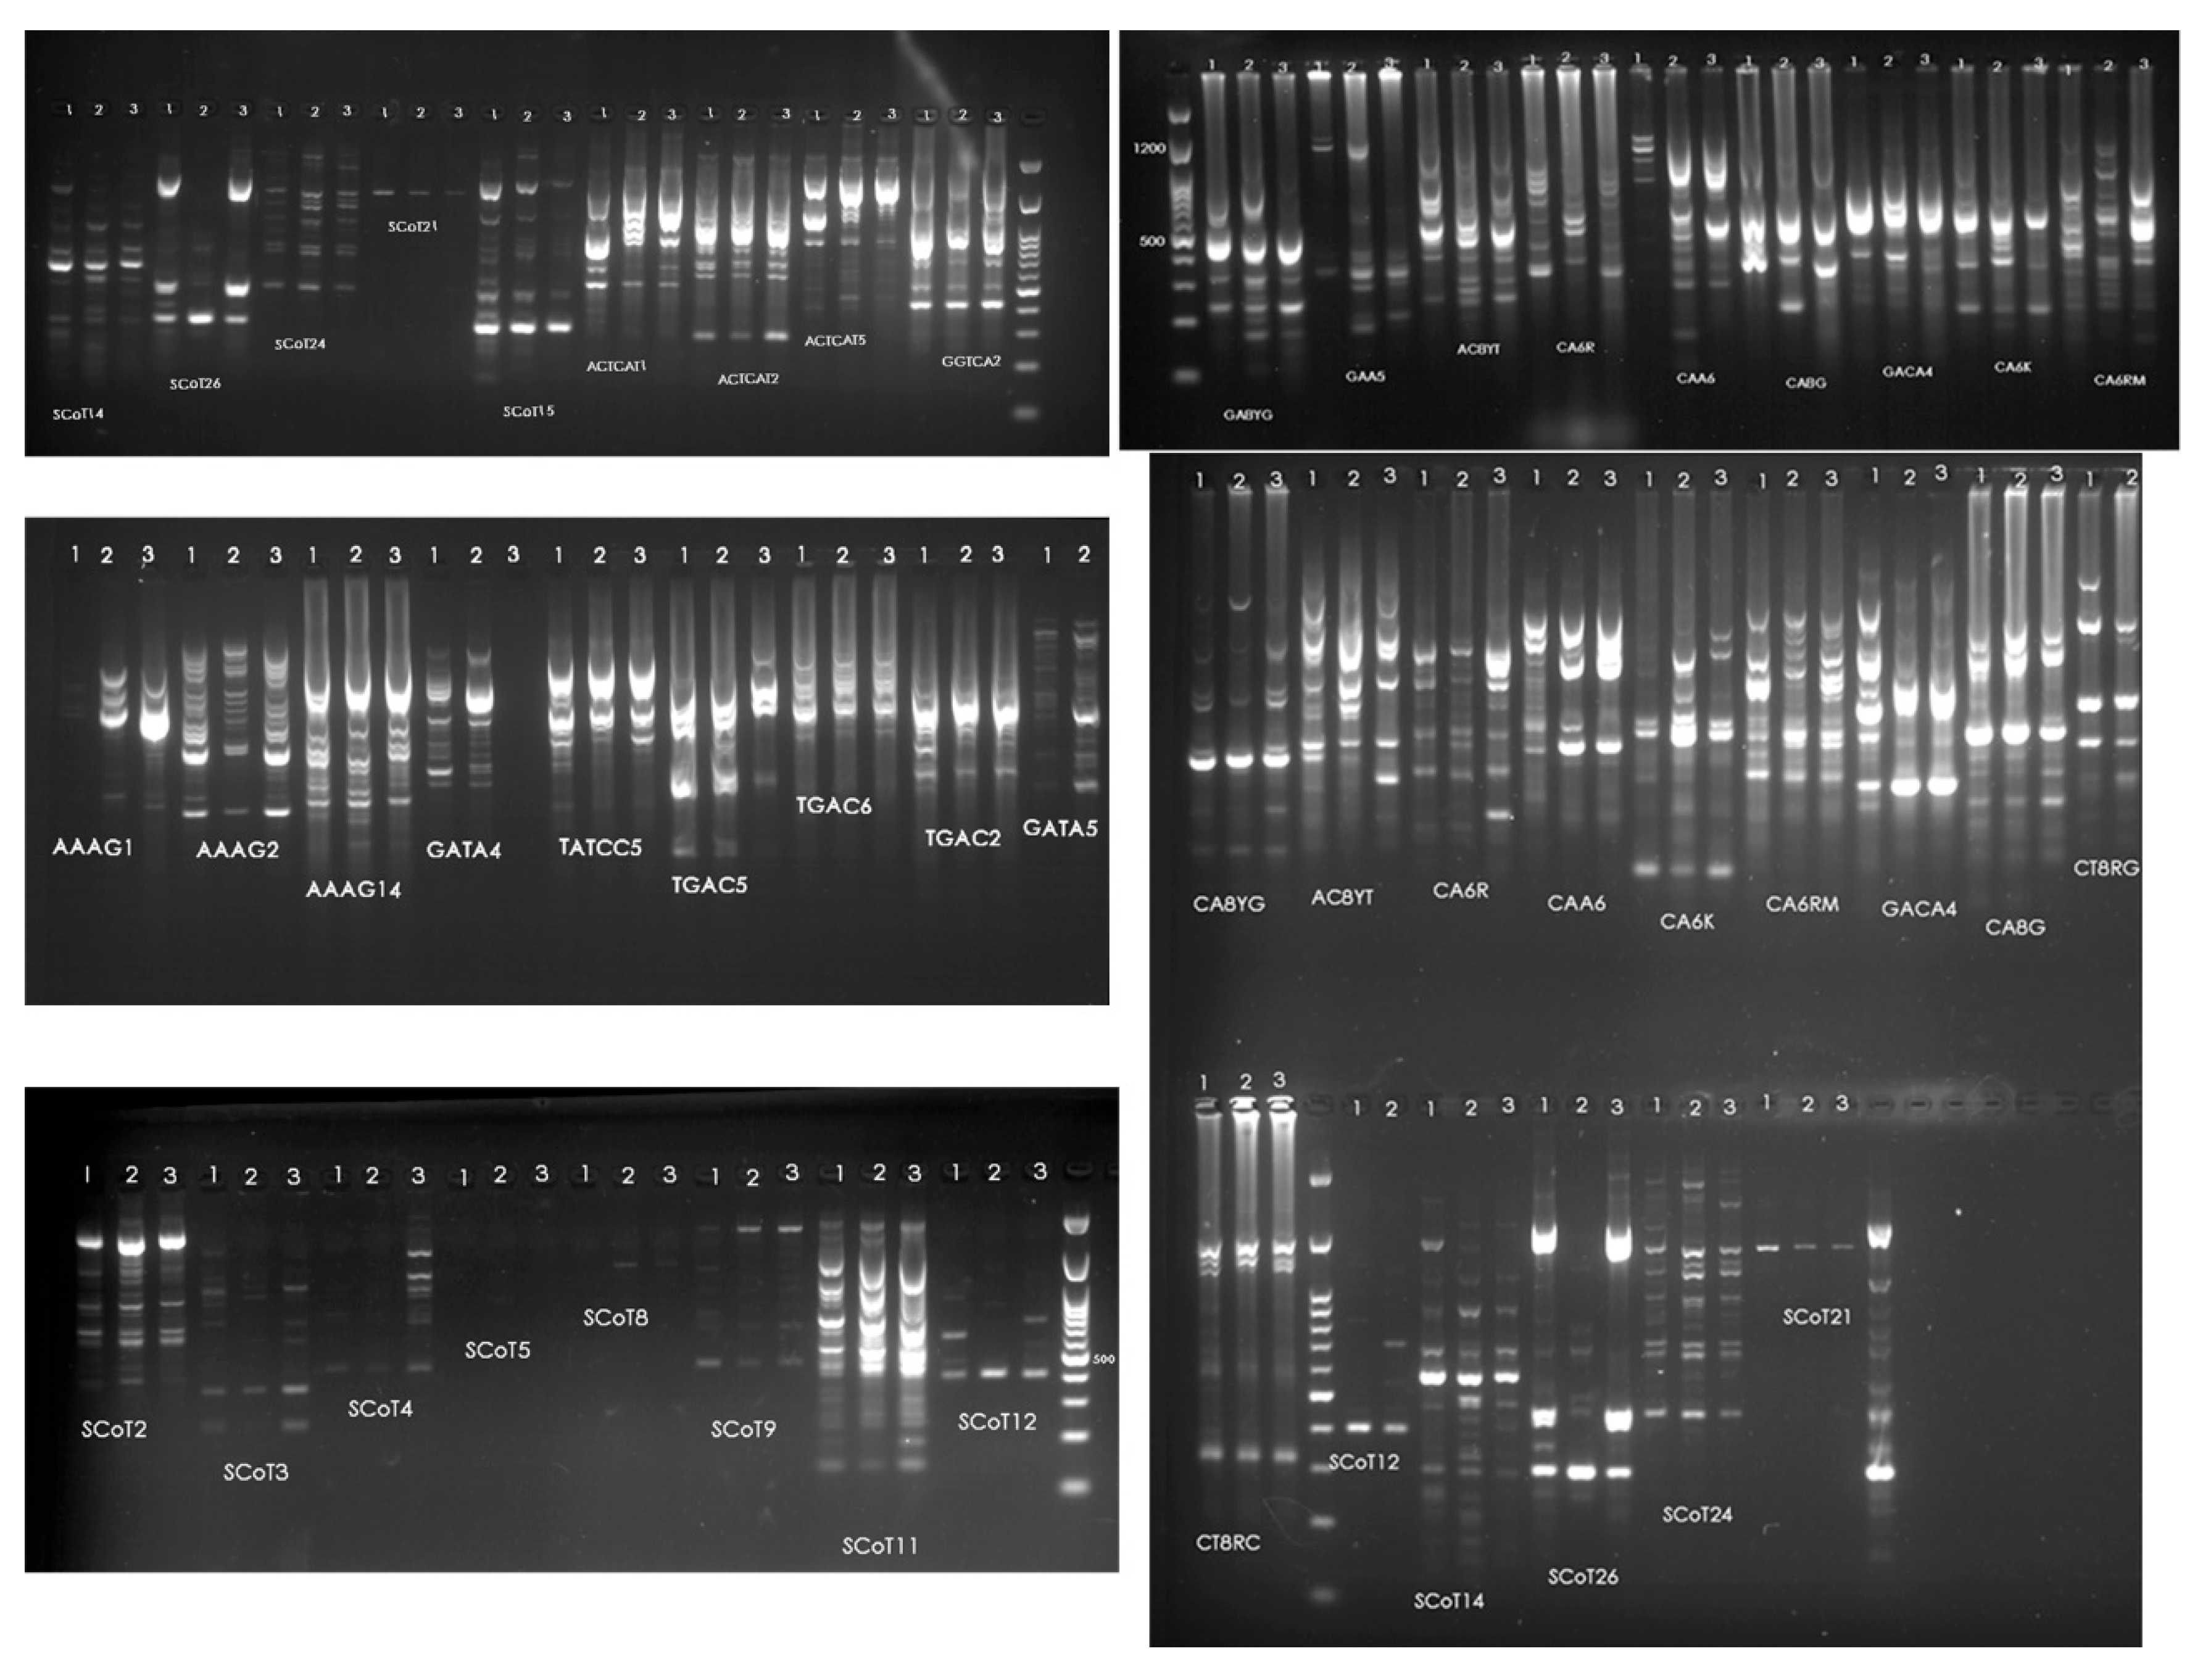
Figure 3.
Electrophoresis gels of the 40 accessions from both lavender plantations A, Shumen region, L1-L20 and B, Shabla region, L21-L40, tested with selected primers, ladder (50 – 1500 bp).
Figure 3.
Electrophoresis gels of the 40 accessions from both lavender plantations A, Shumen region, L1-L20 and B, Shabla region, L21-L40, tested with selected primers, ladder (50 – 1500 bp).
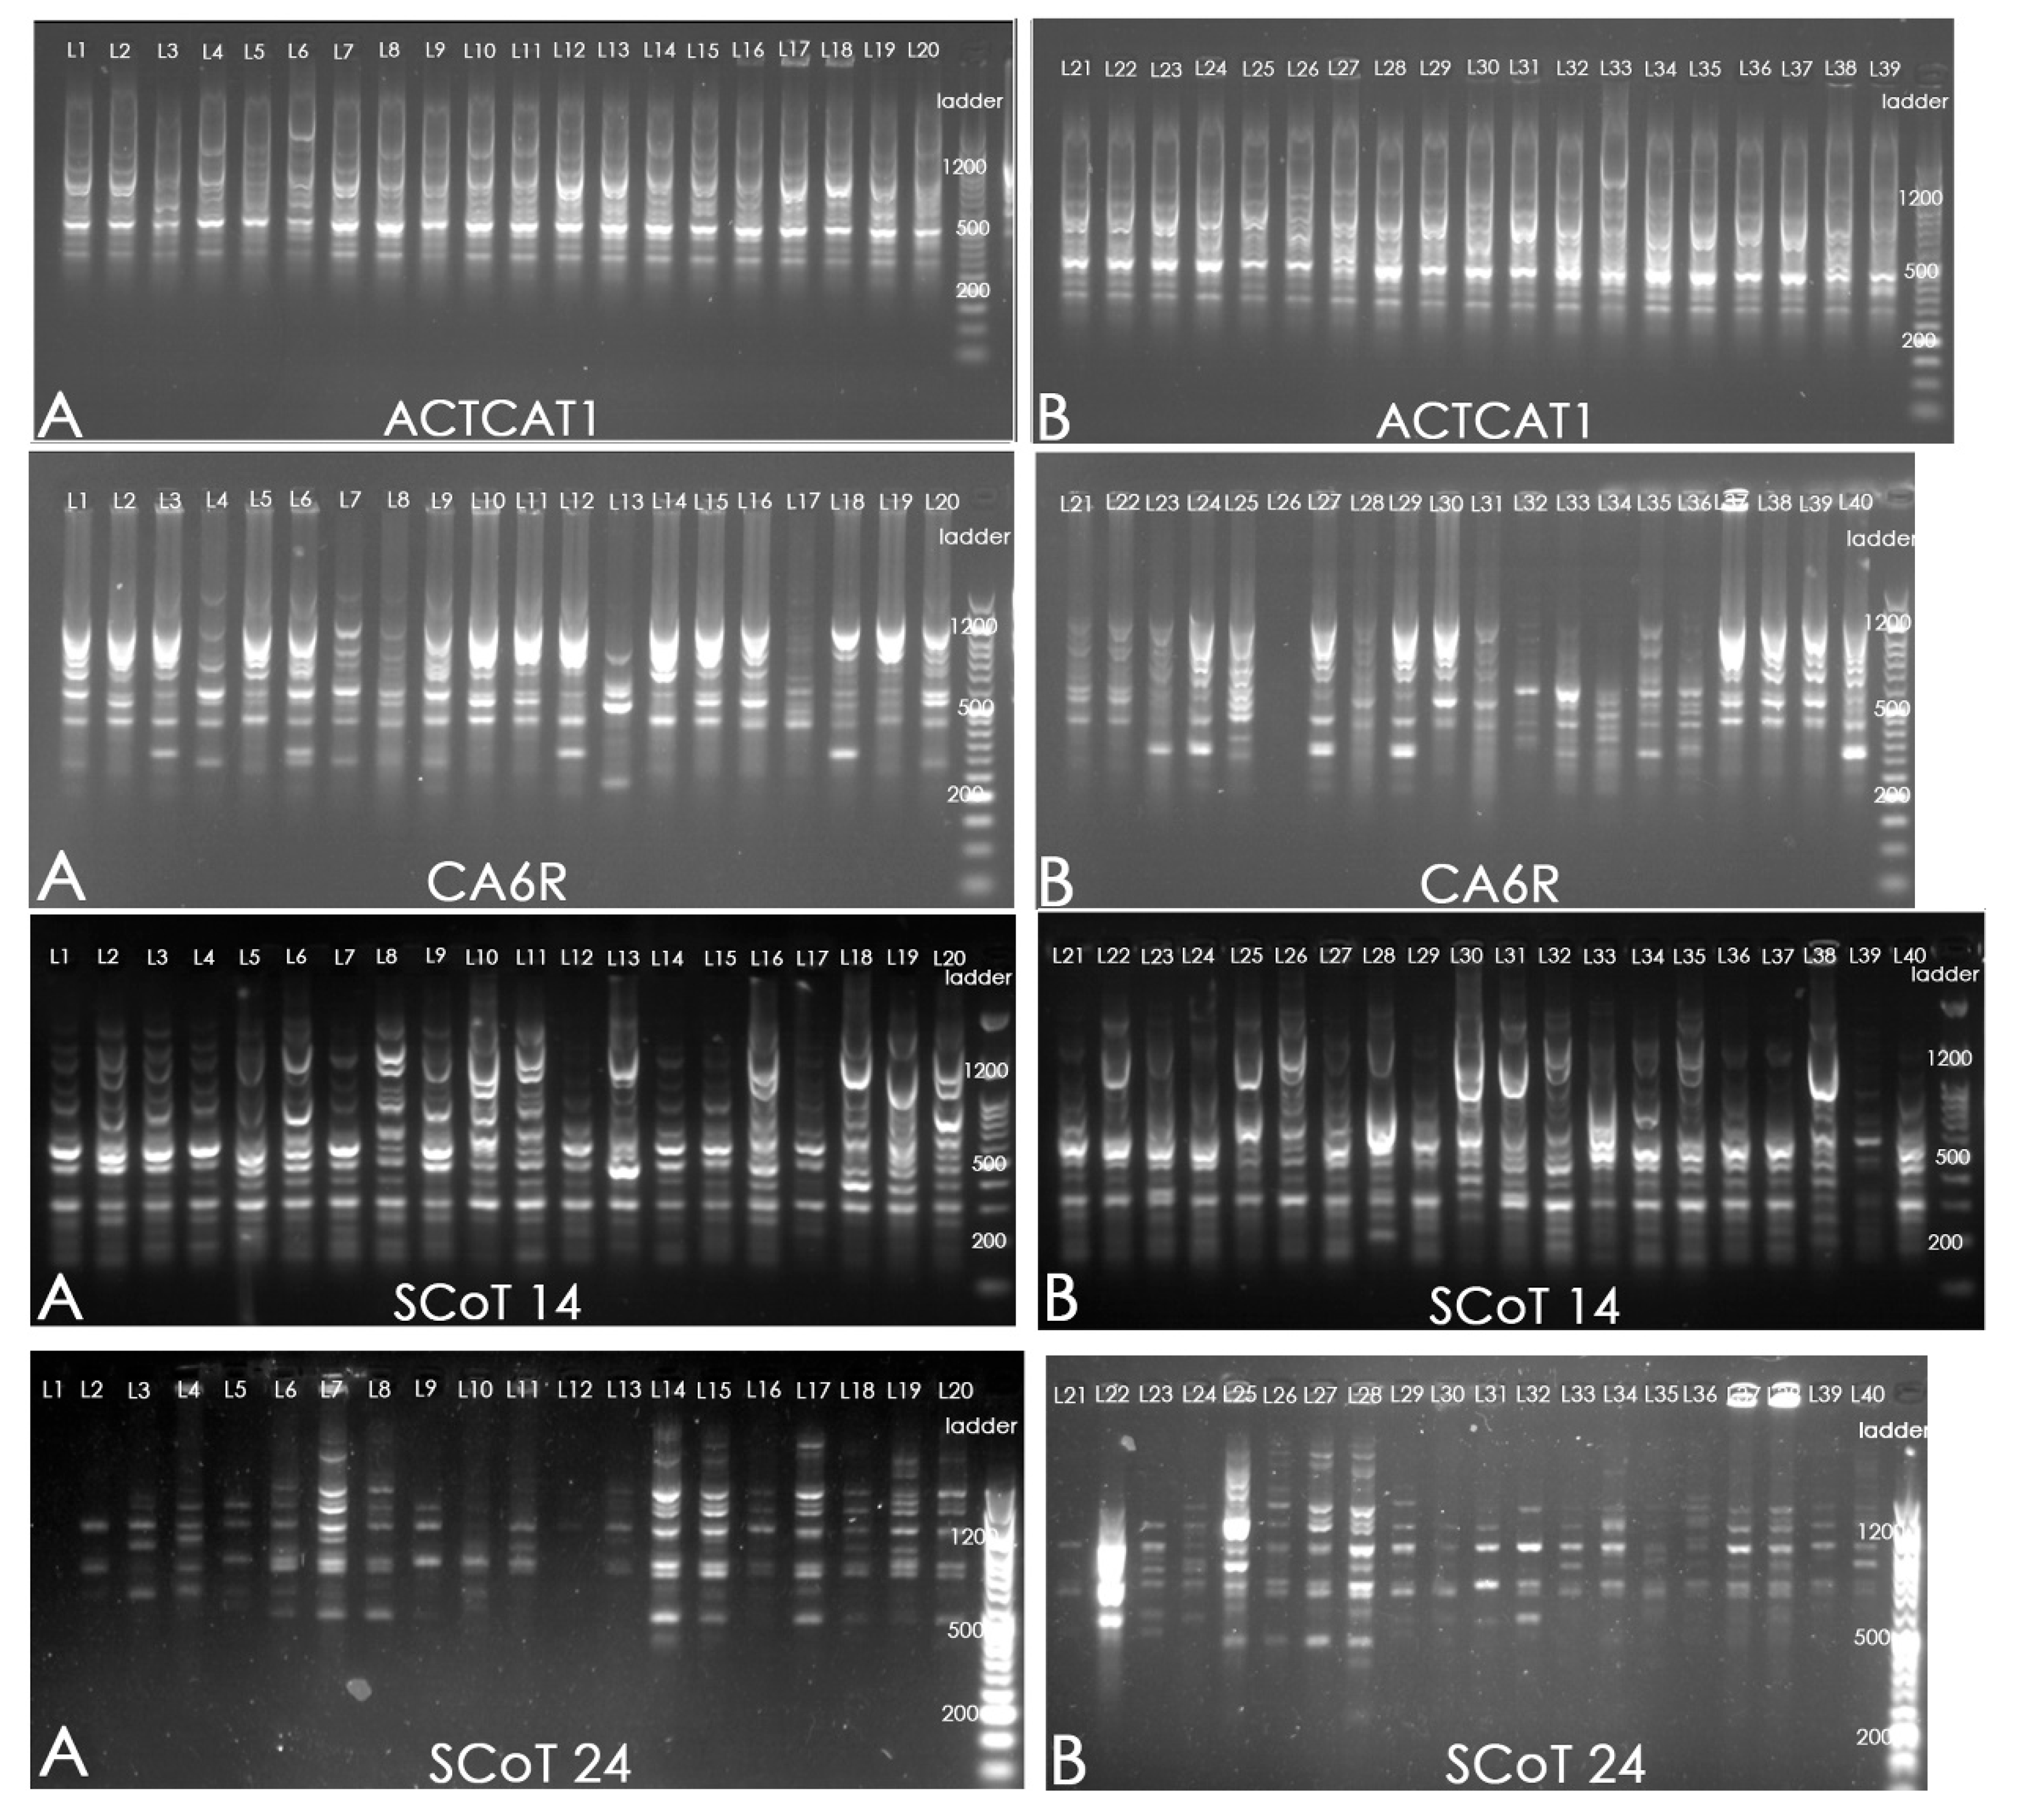
Figure 5.
Shade plot of hierarchical cluster of molecular data obtained by CEAP, ISSR and SCoT markers for forty lavender accessions from two plantations in Bulgaria.
Figure 5.
Shade plot of hierarchical cluster of molecular data obtained by CEAP, ISSR and SCoT markers for forty lavender accessions from two plantations in Bulgaria.
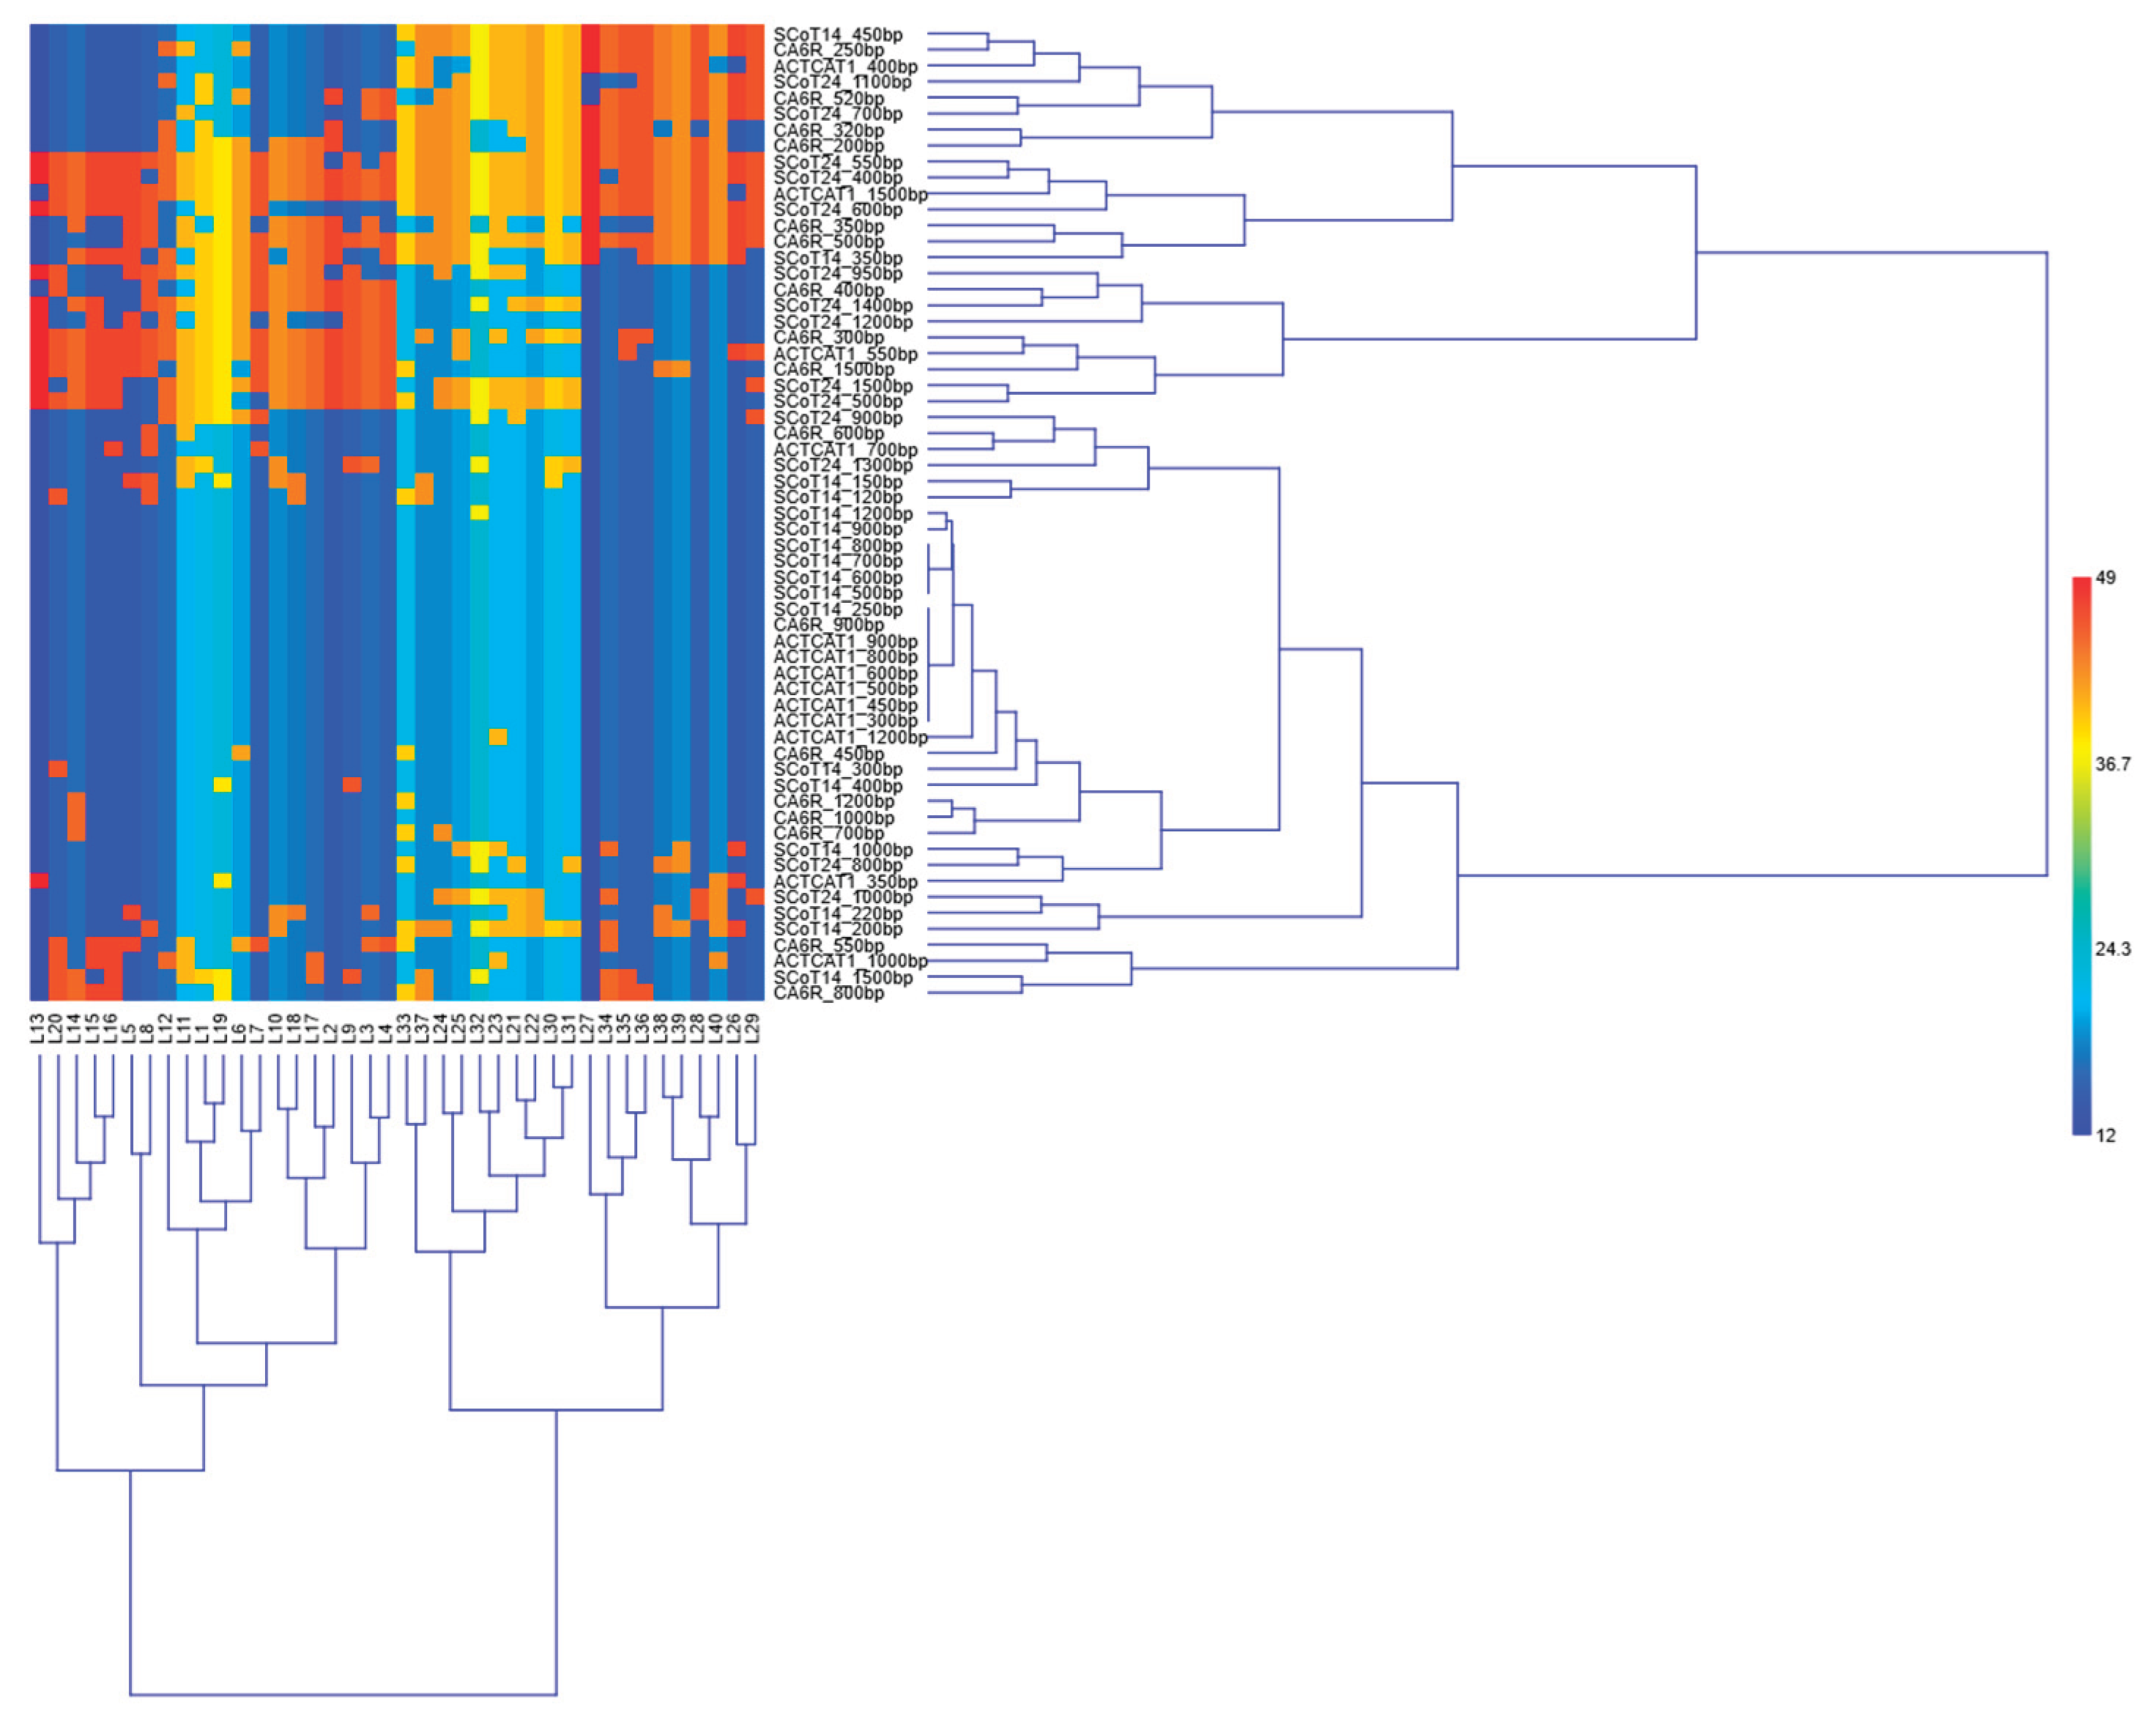
Table 1.
The selected primers used for assessment genetic diversity in lavender plants.
| Primer | Sequence (5' to 3') |
| ACTCAT1 | GCAGCTGCGTACTCATAA |
| CA6R | CACACACACACAR |
| SCoT 14 | ACGACATGGCGACCACCG |
| SCoT 24 | CACCATGGCTACCACCAT |
Table 2.
CEAP, SCoT and ISSR primers and their number of amplified loci (NB) in Lavandula angustifolia Mill. germplasm.
Table 2.
CEAP, SCoT and ISSR primers and their number of amplified loci (NB) in Lavandula angustifolia Mill. germplasm.
| Primers | Sequence | NB |
| ACTCAT1 | GCAGCTGCGTACTCATAA | 5b |
| ACTCAT2 | GCAGCTGCGTACTCATAT | 5b |
| AAAG1 | GCAGCTGCGTGTAAAGAA | 5c |
| AAAG2 | GCAGCTGCGTGTAAAGAT | 10c |
| AAAG14 | GCAGCTGCGTGTAAAGCT | 11c |
| GATAA4 | GCAGCTGCGTGGATAATA | 9c |
| GATAA5 | GCAGCTGCGTGGATAATT | 5c |
| ACGTG26 | GCAGTCAGACACGTGCAG | 11a |
| TATCC5 | GCAGCTGAGACTATCCTA | 5c |
| TGAC2 | GCAGCTGAGAGTTGACAT | 5c |
| TGAC5 | GCAGCTGAGAGTTGACTA | 6c |
| GGTCA2 | GCAGTCAGATCGGTCAAT | 6c |
| ACTCAT5 | 8b | |
| TGAC6 | 5c | |
| Total | 96 | |
| SCoT 2 | CAACAATGGCTACCACCC | 12e |
| SCoT 3 | CAACAATGGCTACCACCG | 7e |
| SCoT 4 | CAACAATGGCTACCACCT | 8e |
| SCoT 5 | CAACAATGGCTACCACGA | 0e |
| SCoT 8 | CAACAATGGCTACCACGT | 2e |
| SCoT 9 | CAACAATGGCTACCAGCA | 5e |
| SCoT 11 | AAGCAATGGCTACCACCA | 12e |
| SCoT 12 | ACGACATGGCGACCAACG | 4f |
| SCoT 14 | ACGACATGGCGACCACCG | 15f |
| SCoT 15 | ACGACATGGCGACCGCGA | 12f |
| SCoT 21 | ACGACATGGCGACCGCCA | 1e |
| SCoT 24 | CACCATGGCTACCACCAT | 10e |
| SCoT 26 | ACAATGGCTACCACCATC | 8f |
| Total | 96 | |
| AC8YT | ACACACACACACACACYT | 8d |
| CA6R | CACACACACACAR | 8d |
| CAA6 | CAACAACAACAACAACAA | 9d |
| CA6K | CACACACACACAK | 9d |
| CA6RM | CACACACACACARM | 11d |
| GACA4 | GACAGACAGACAGACA | 9d |
| GA8YG | GAGAGAGAGAGAGAGAYG | 9d |
| CT8RG | CTCTCTCTCTCTCTCTRG | 5d |
| CA8G | CACACACACACACACAG | 8d |
| CT8RC | CTCTCTCTCTCTCTCTRC | 7d |
| GATA4 | GATAGATAGATAGATA | 4d |
| GAA5 | GAAGAAGAAGAAGAA | 5d |
| CA8YG | CACACACACACACACAYG | 7d |
| Total | 97 |
* Annealing temperatures: a - 35℃, b - 37℃, c - 39℃, d - 50℃, e - 54℃, f - 61℃.
Table 3.
Genetic diversity in studied Lavandula angustifolia Mill plantations revealed by CEAP, ISSR and SCoT markers, , different (Na) and effective (Ne) number alleles, Shannon’s Information Index (I), Nei’s gene diversity(H), Total number of bands (TB), Number of specific bands (Sb), Percent of polymorphic bands (PB).
| Primers | Band Freq. | N | Na | Ne | I | H |
| ACTCAT1 | 0.81 | 20 | 1.23 | 1.21 | 0.16 | 0.11 |
| CA6R | 0.67 | 20 | 1.80 | 1.60 | 0.50 | 0.34 |
| SCoT14 | 0.89 | 20 | 1.47 | 1.37 | 0.29 | 0.20 |
| SCoT24 | 0.51 | 20 | 1.86 | 1.43 | 0.39 | 0.26 |
| Mean | 1.61(0.07) | 1.41(0.05) | 0.34(0.04) | 0.23(0.03) | ||
| TB | PB% | |||||
| 59 | 63.93 | |||||
| ACTCAT1 | 0.83 | 20 | 1.46 | 1.26 | 0.23 | 0.15 |
| CA6R | 0.65 | 20 | 1.65 | 1.41 | 0.36 | 0.24 |
| SCoT14 | 0.80 | 20 | 1.41 | 1.34 | 0.28 | 0.19 |
| SCoT24 | 0.49 | 20 | 1.50 | 1.52 | 0.41 | 0.28 |
| Mean | 1.51(0.08) | 1.38(0.05) | 0.32(0.04) | 0.22(0.03) | ||
| TB | PB% | |||||
| 56 | 59.02 | |||||
1 In the brackets are shown SE.
Table 4.
Genetic diversity in all studied Lavandula angustifolia Mill accessions revealed by CEAP, ISSR and SCoT markers, , different (Na) and effective (Ne) number alleles, Shannon’s Information Index (I), Nei’s gene diversity (H).
Table 4.
Genetic diversity in all studied Lavandula angustifolia Mill accessions revealed by CEAP, ISSR and SCoT markers, , different (Na) and effective (Ne) number alleles, Shannon’s Information Index (I), Nei’s gene diversity (H).
| Primers | Band Freq. | N | Na | Ne | I | H |
| ACTCAT1 | 0.82 | 40 | 1.35 | 1.23 | 0.19 | 0.13 |
| CA6R | 0.66 | 40 | 1.74 | 1.50 | 0.43 | 0.29 |
| SCoT14 | 0.84 | 40 | 1.44 | 1.35 | 0.29 | 0.20 |
| SCoT24 | 0.50 | 40 | 1.68 | 1.48 | 0.40 | 0.27 |
| Total | 1.56(0.06) | 1.40(0.04) | 0.33(0.03) | 0.23(0.22) |
1 In the brackets are shown Standard devaluation (SE).
Table 5.
AMOVA analysis for studying lavender plantations.
| Source | df | SS | MS | Est. var | %Variation |
| Among fields | 1 | 88.875 | 88.875 | 4.156 | 42% |
| Within Fields | 38 | 218.550 | 5.751 | 5.751 | 58% |
| Total | 39 | 307.425 | 9.908 | 100% |
Disclaimer/Publisher’s Note: The statements, opinions and data contained in all publications are solely those of the individual author(s) and contributor(s) and not of MDPI and/or the editor(s). MDPI and/or the editor(s) disclaim responsibility for any injury to people or property resulting from any ideas, methods, instructions or products referred to in the content. |
© 2026 by the authors. Licensee MDPI, Basel, Switzerland. This article is an open access article distributed under the terms and conditions of the Creative Commons Attribution (CC BY) license (http://creativecommons.org/licenses/by/4.0/).
Copyright: This open access article is published under a Creative Commons CC BY 4.0 license, which permit the free download, distribution, and reuse, provided that the author and preprint are cited in any reuse.


