Preprint
Article

This version is not peer-reviewed.

Comprehensive Analysis of Formin Genes Reveals Their Roles in Tissue Development and Cold Stress Responses in Brassica rapa

A peer-reviewed article of this preprint also exists.

Submitted:

15 January 2026

Posted:

16 January 2026

You are already at the latest version

Abstract

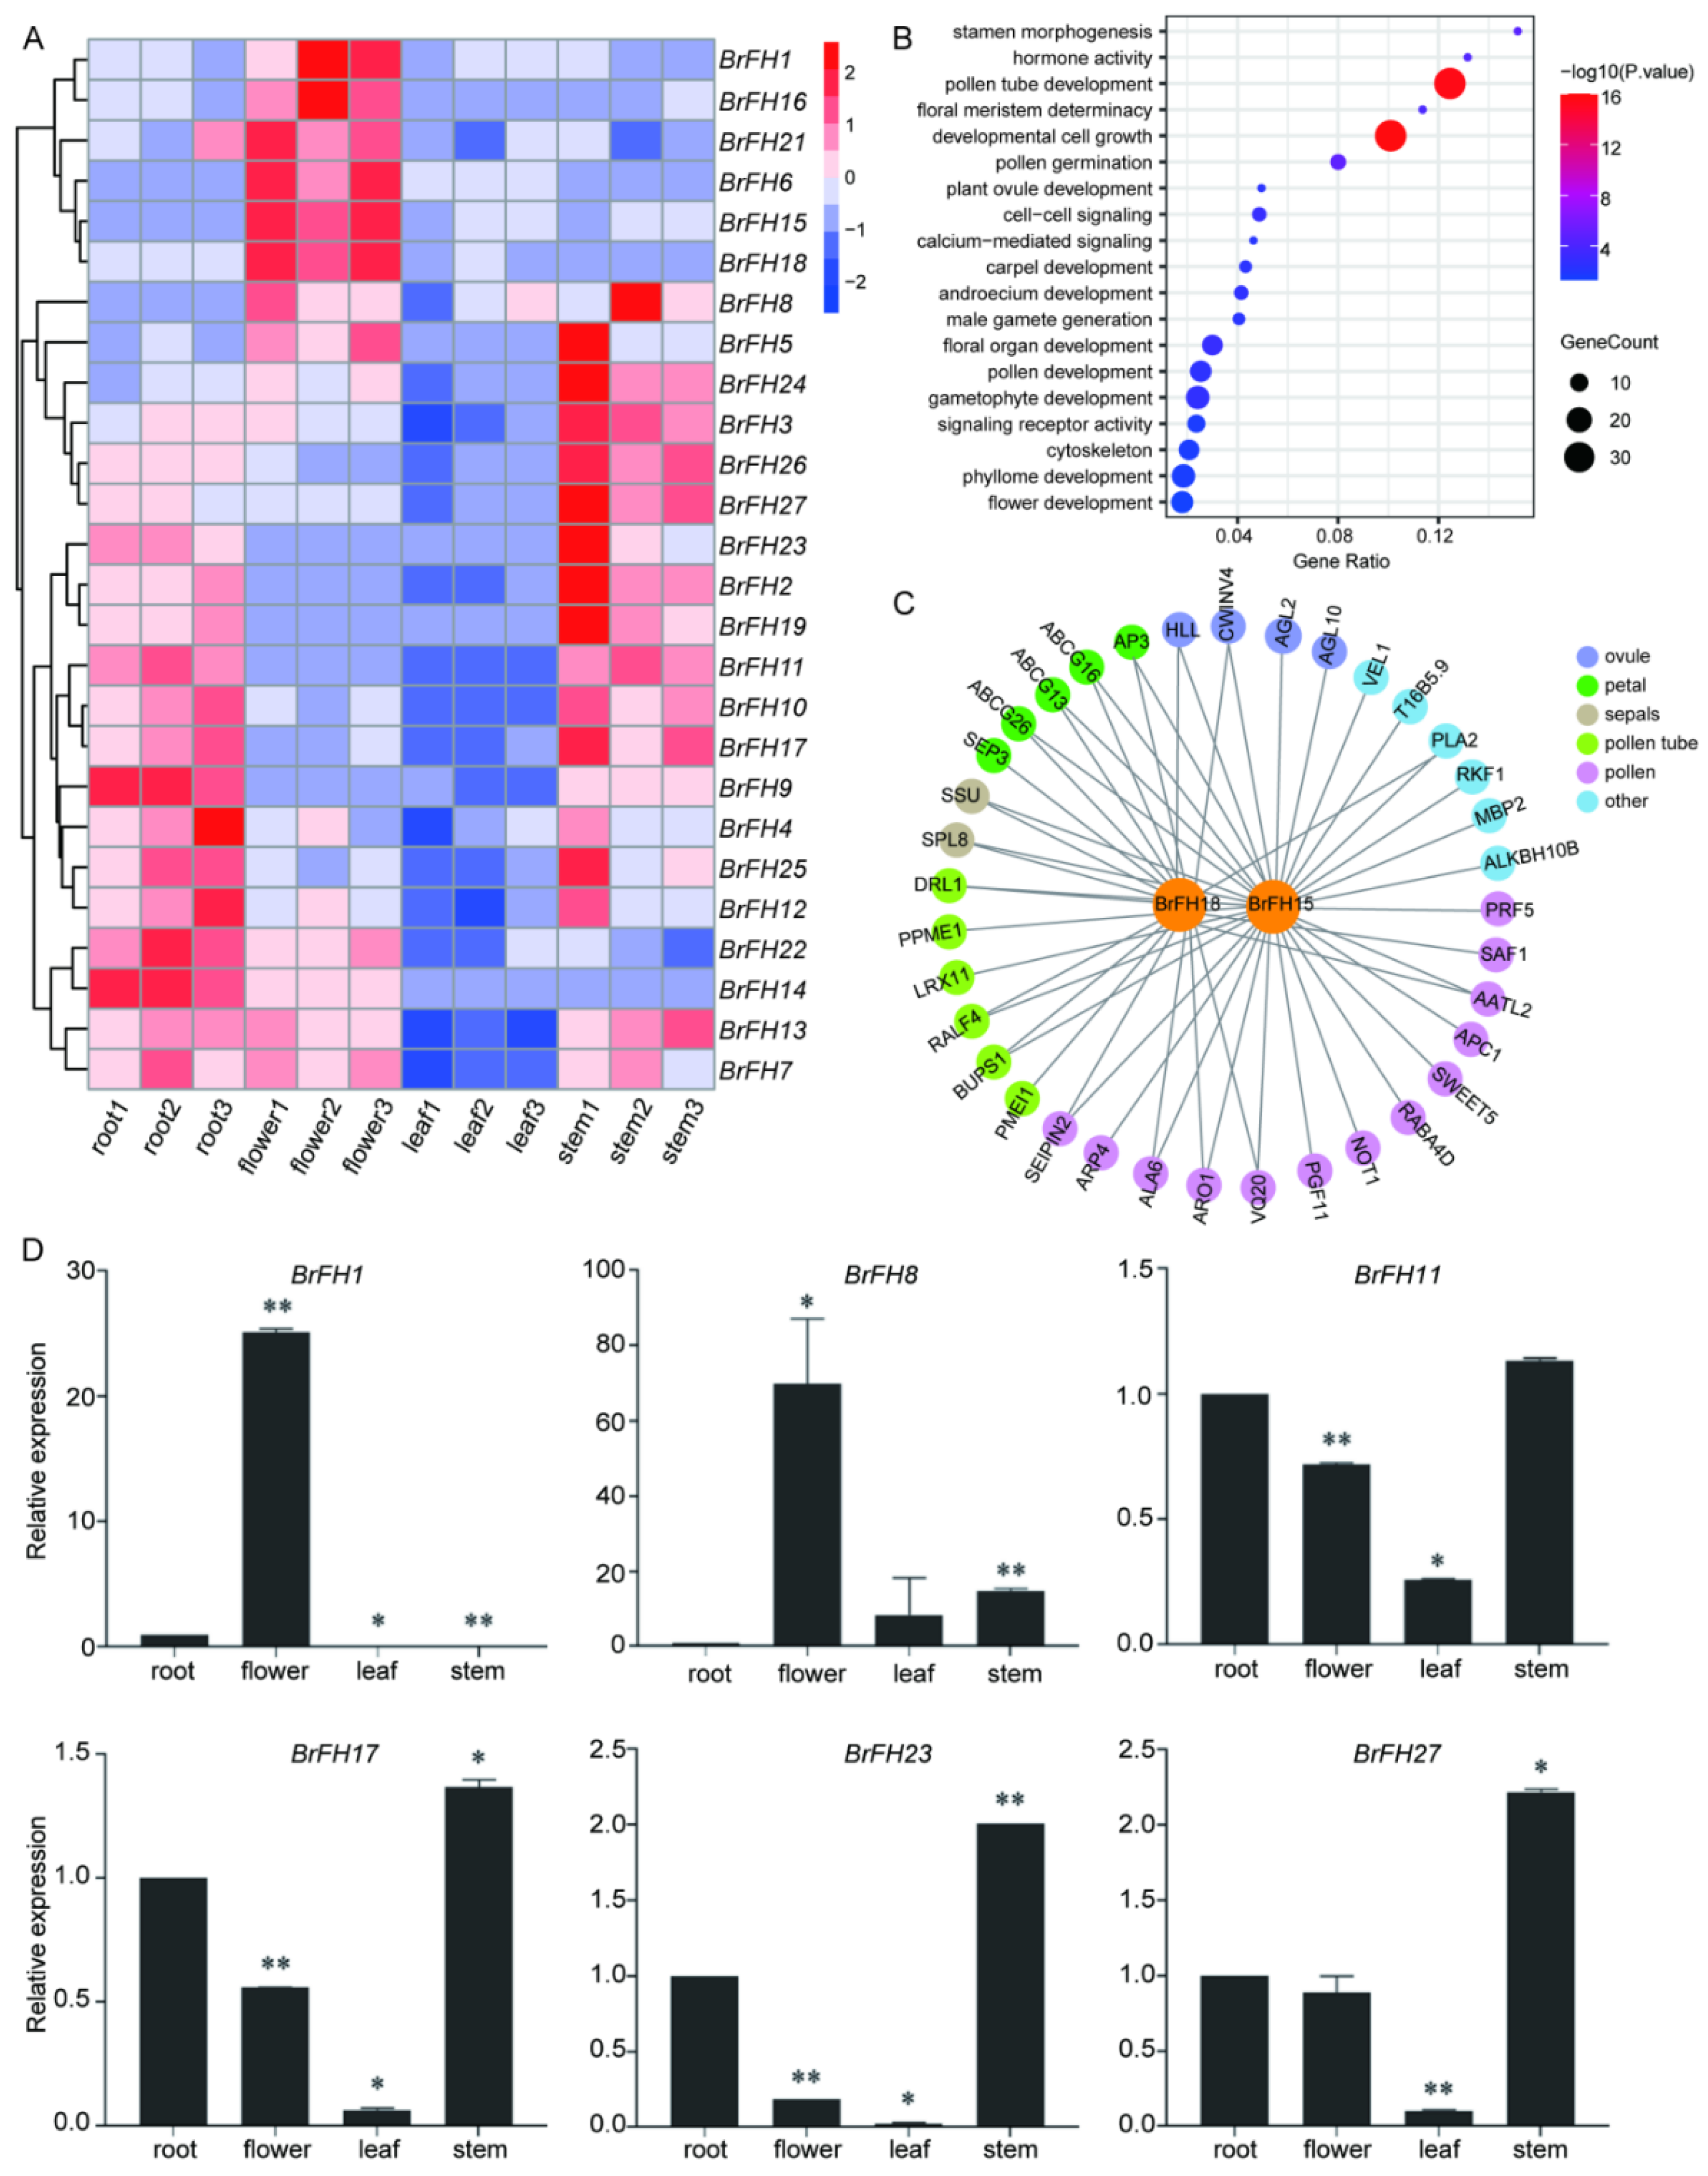
Background: Formin proteins are crucial regulators of actin filament assembly and elongation in eukaryotic cells, playing important roles in plant development and abiotic stress responses. However, the functional characterization of formins in Brassica rapa remains uncover. Methods: A total of 27 formin family members (BrFHs) were identified through genome-wide alignment with Arabidopsis thaliana. Results: Phylogenetic analysis classified BrFH gene family into two distinct clades, designated Group I and Group II, which exhibit divergent protein architectures. Promoter analysis revealed that BrFHs contain multiple cis-regulatory elements related to growth and development, stress responses, and phytohormone signaling. These findings suggest that BrFHs may have diversified functions. Tissue-specific expression analysis revealed that BrFHs exhibit distinct expression patterns across various tissues. Notably, BrFH15 and BrFH18 are highly expressed in flowers, displaying expression profiles similar to those of floral development genes such as AP3, AGL10 and so on. Additionally, many BrFHs show dynamic expression patterns in response to cold stresses. In particular, BrFH2, BrFH19 and BrFH27 were up-regulated, and their co-expression within the gene network suggests potential roles in regulating cold stress. Conclusions: These results clarify the functional roles of BrFHs and shed light on the molecular mechanisms underlying their regulation of tissue development and responses to abiotic stress in Brassica rapa.

Keywords: 
;  ;  ;  

1. Introduction

The cytoskeleton in eukaryotes plays a various role in cell division and differentiation, growth and development, signal perception, and cellular immunity, which is mainly composed of two highly conserved compounds, microfilaments and microtubules. The coordinated reconstruction and dynamic behavior of these structures are regulated by various actin binding proteins (ABPs) [[1[4]. In plant species, ABPs mainly include six kinds, among which formin proteins have been well characterized as actin binding proteins, defined as nucleation factors that initiate microfilament polymerization and then participated in the structural organization of actin cytoskeleton. Plant morphology is relatively conserved in the kingdom plantae, representatively defined by the conserved FH2 domain [[5[9]. In addition, a polygenetic analysis based on multiple sequence alignment showed that the formin homologs are not only present in plant genomes, but also in fungi and metazoans, indicating the universality of the formin homology protein family in eukaryotes [10]. Additionally, researchers have extensively reported that the organization and dynamics of the cytoskeleton can be altered in response to external stress stimuli to regulate plant growth and development, mainly depending on the action of formin homology proteins [11,12].
Over the past decades, formin homology proteins have extensively attracted much research attention in numerous physiological and cellular processes, especially for cell morphology, signal transduction, and stress adaptation [13,14]. Several plant species have identified formin homology gene family. For example, 21-formin encoding proteins have been found in Arabidopsis (Arabidopsis thaliana) [15], 17 proteins in rice (Oryza sativa) [16] and 46 proteins in cotton (Gossypium hirsutum) [17]. The model plant Arabidopsis genome have been described, which have been grouped into two distinct subfamilies based on the sequence similarity and domain composition, Class I and Class II [11,18]. AtFHs have been universally reported to be involved in numerous physiological processes and responses to external stimuli, such as drought stress, salt stress, and other abiotic stresses [19,20]. For example, the Arabidopsis plants expressing formin AtFH1 had the function of regulating actin filament bundles, and mainly participated in pollen tube broadening and growth depolarization [15,21]. In addition, cold stress can induce the expression of FH gene, which can promote the recombination of cytoskeleton to cope with the risk of membrane lipid coagulation, thereby ultimately affecting on the polar growth of pollen tubes, which underscored their vital role in controlling the normal growth and development of pollen tubes by regulating actin polymerization [22]. Similarly, high temperature stress condition not only had a significant impact on the thermal stability of microfilament proteins, but also altered the polar transport of pollen tubes, and even led to pollen abortion [23]. The actin-depolymerizing factors (ADFs) have been functionally characterized as a class of conserved microfilament-binding proteins to regulate the rapid turnover of the microfilament cytoskeleton, rearrange construction and finally contribute to proper pollen tubes growth or root hairs growth. The formin AtFH4 regulated the lateral intercellular boundaries of the plant root bark and cortex, which plays a role in linking the membrane with the cytoskeletal network [24], but under the external stress, the expression of AtFH4 showed an suppression, and ultimately affected the formation of microtubules and actin-associated proteins [11]. Moreover, AtFH6, a member of Arabidopsis formin, was reported to impact the nucleation of the barbed end of actin filaments and promoted root hair cell, while the mutant of AtFH6 showed an abnormal development during the mineral salt deficiency [19]. The conserved domain of AtFH8 regulates the nucleation of the barbed end of actin filaments and promotes root hair cell and polarized cell growth [25]. Class II members accompanied by a N-terminus phosphatase and tensin-related (PTEN)-like domain, which intricately connected the cell with external environments [26]. Notably, Arabidopsis FH12, classified as a Class II formin, was reported to positively regulate the normal dynamics of actin filaments in root hairs under salt stress, as evidenced that mutants lacking FH12 pronounced inhibition of root elongation [27]. In addition, AtFH14 and AtFH16 have also been reported that can promote taproot growth and increase the number of lateral roots [28,29]. In other plant species, the MtFH genes were significantly upregulated under drought and salt stress, which may reduce water loss or ion toxicity by enhancing the stability of the cytoskeleton in Medicago truncatula [30]. The GhFH genes played significant roles in development of cotton (Gossypium hirsutum L.) under heat and salt stresses [31]. Gene expression identified that FH genes with a dynamic pattern in response to salt and drought stresses in soybean (Glycine max L.), which revealed the potential roles in regulating plant stress adaptation [32]. Meanwhile, there is a synergistic effect between FH gene and stress signaling pathway, for example, the closure of stomata was regulated by signaling molecules under drought stress, including abscisic acid (ABA), reactive oxygen species (ROS), and phospholipids. Among them, actin filaments in the guard cells underwent recombination and played a role in stomatal movement [33]. Consequently, the dynamic adjustment of the cytoskeleton is crucial for plants to adapt to environmental changes under abiotic stresses.
Brassica rapa (B. rapa) is one of the most extensively cultivated vegetables, and represents one of the major vegetables in China. To cope with these unfavorable growth conditions caused by stresses (e.g., cold stress), Chinese cabbage has evolved complex regulatory mechanisms, particularly during vegetative growth stages, enabling its survival and maximizing its achievable yield and quality [34,35]. Concurrently, it has been observed that the expression of many genes that respond to cold stress changed attribute to physiological and metabolic alterations. However, so far, there has been relatively little research on the functions of the formin gene family and its members in other plant species. Therefore, further systematic identification and classification of the formin gene family members in B. rapa are necessary to be conducted. In the present study, we performed a genome-wide identification of the BrFH gene family, revealing a potential regulatory role of BrFH in response to cold conditions to orchestrate plant growth and development. The finding from our study on the BrFH gene family not only deepens our understanding of its the physicochemical properties and structure, but also leverages their stress resistance function to provide new targets for crop stress resistance breeding.

2. Materials and Methods

2.1. Identification of FH Genes in the B. rapa Genome and Subcellular Localization Analysis

To identify BrFH genes in the B. rapa genome, the full-length protein sequences of FH genes from A. thaliana were retrieved from the TAIR database (https://www.arabidopsis.org/). These sequences were used as queries in BLAST searches against the Plant Information Database to identify homologous sequences in B. rapa. Protein domain structures were analyzed using the Pfam database (http://pfam.xfam.org/) and the SMART 9.0 tool (http://smart.embl-heidelberg.de/) to construct a genome-wide protein domain model for B. rapa [36,37].
The physicochemical properties of the identified BrFH proteins were predicted using the Expasy ProtParam tool (http://web.expasy.org/). Subcellular localization of the proteins was predicted using WoLF PSORT (http://wolfpsort.org/) [38].

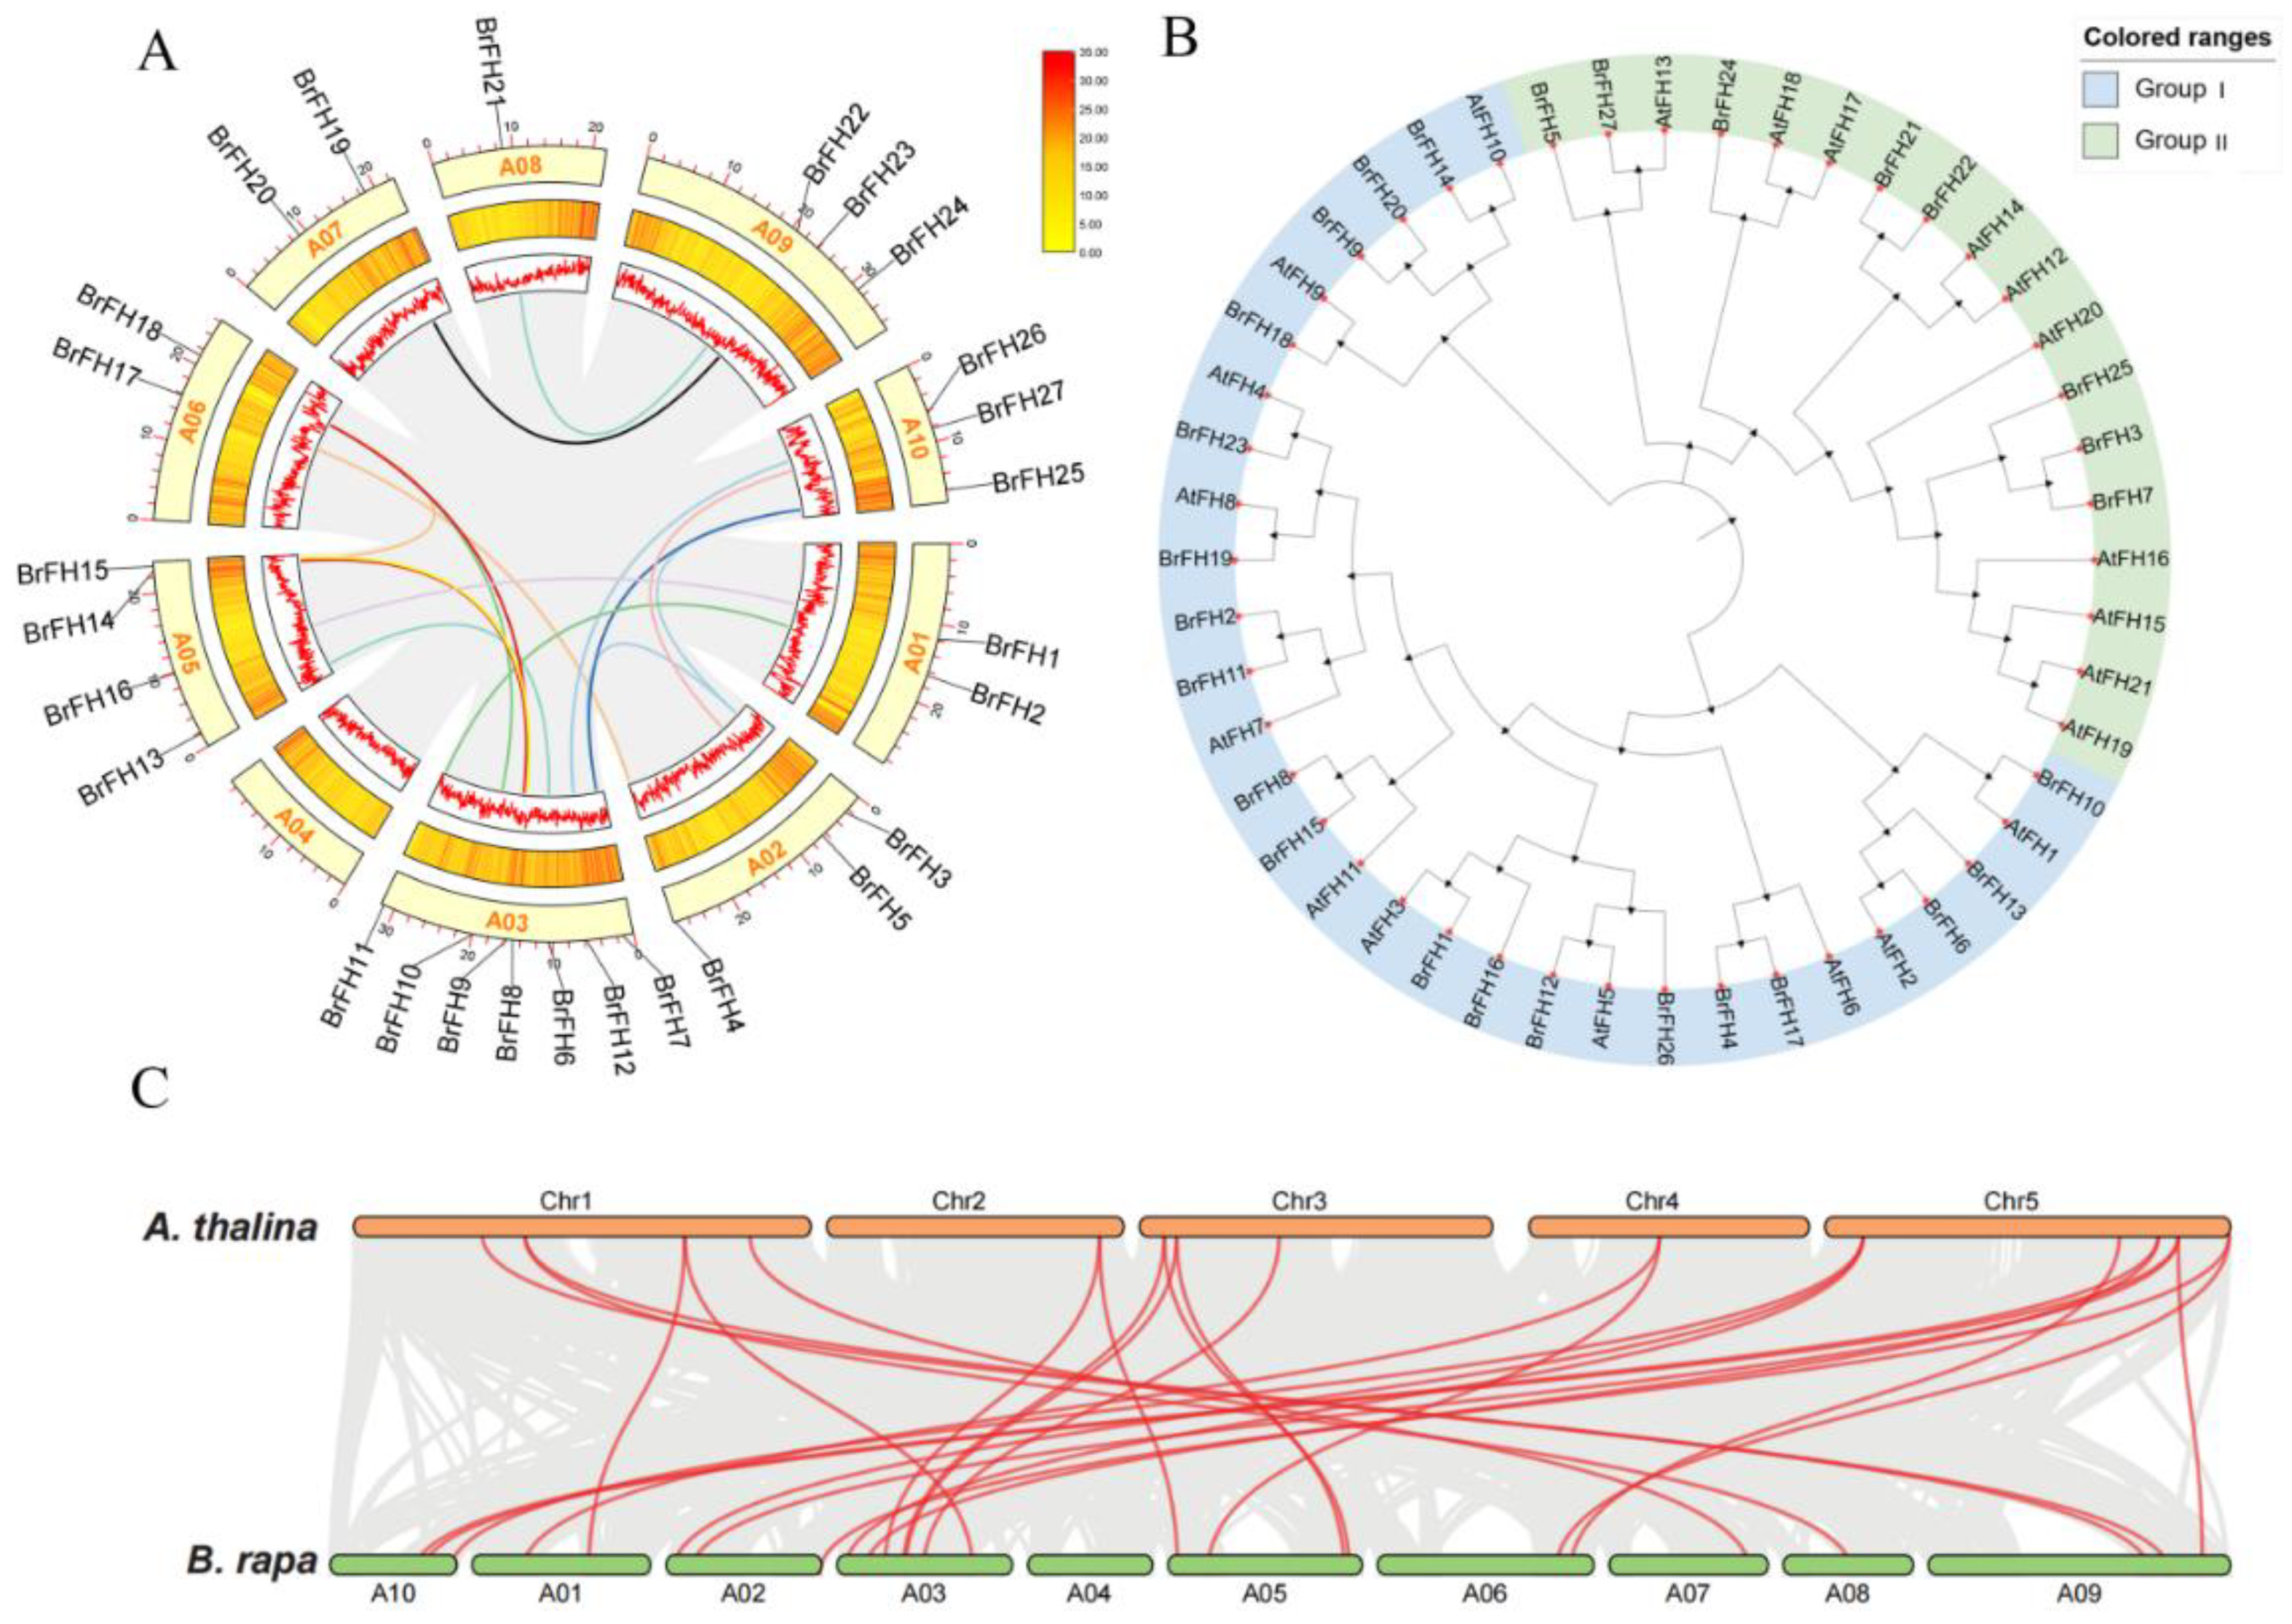
2.2. Chromosomal Localization, Synteny, and Phylogenetic Analysis

The chromosomal distribution of BrFH family was mapped through genome-wide chromosomal mapping of B. rapa, and their locations were visualized using TBtools [39]. Syntenic relationships of FH family between B. rapa and A. thaliana were analyzed using MCScanX to assess evolutionary conservation and collinearity [40].
Phylogenetic analysis was conducted using the maximum likelihood method in MEGAX with 1,000 bootstrap replicates, while all other parameters were set to default values [41]. The resulting phylogenetic trees were visualized using iTOL [42].

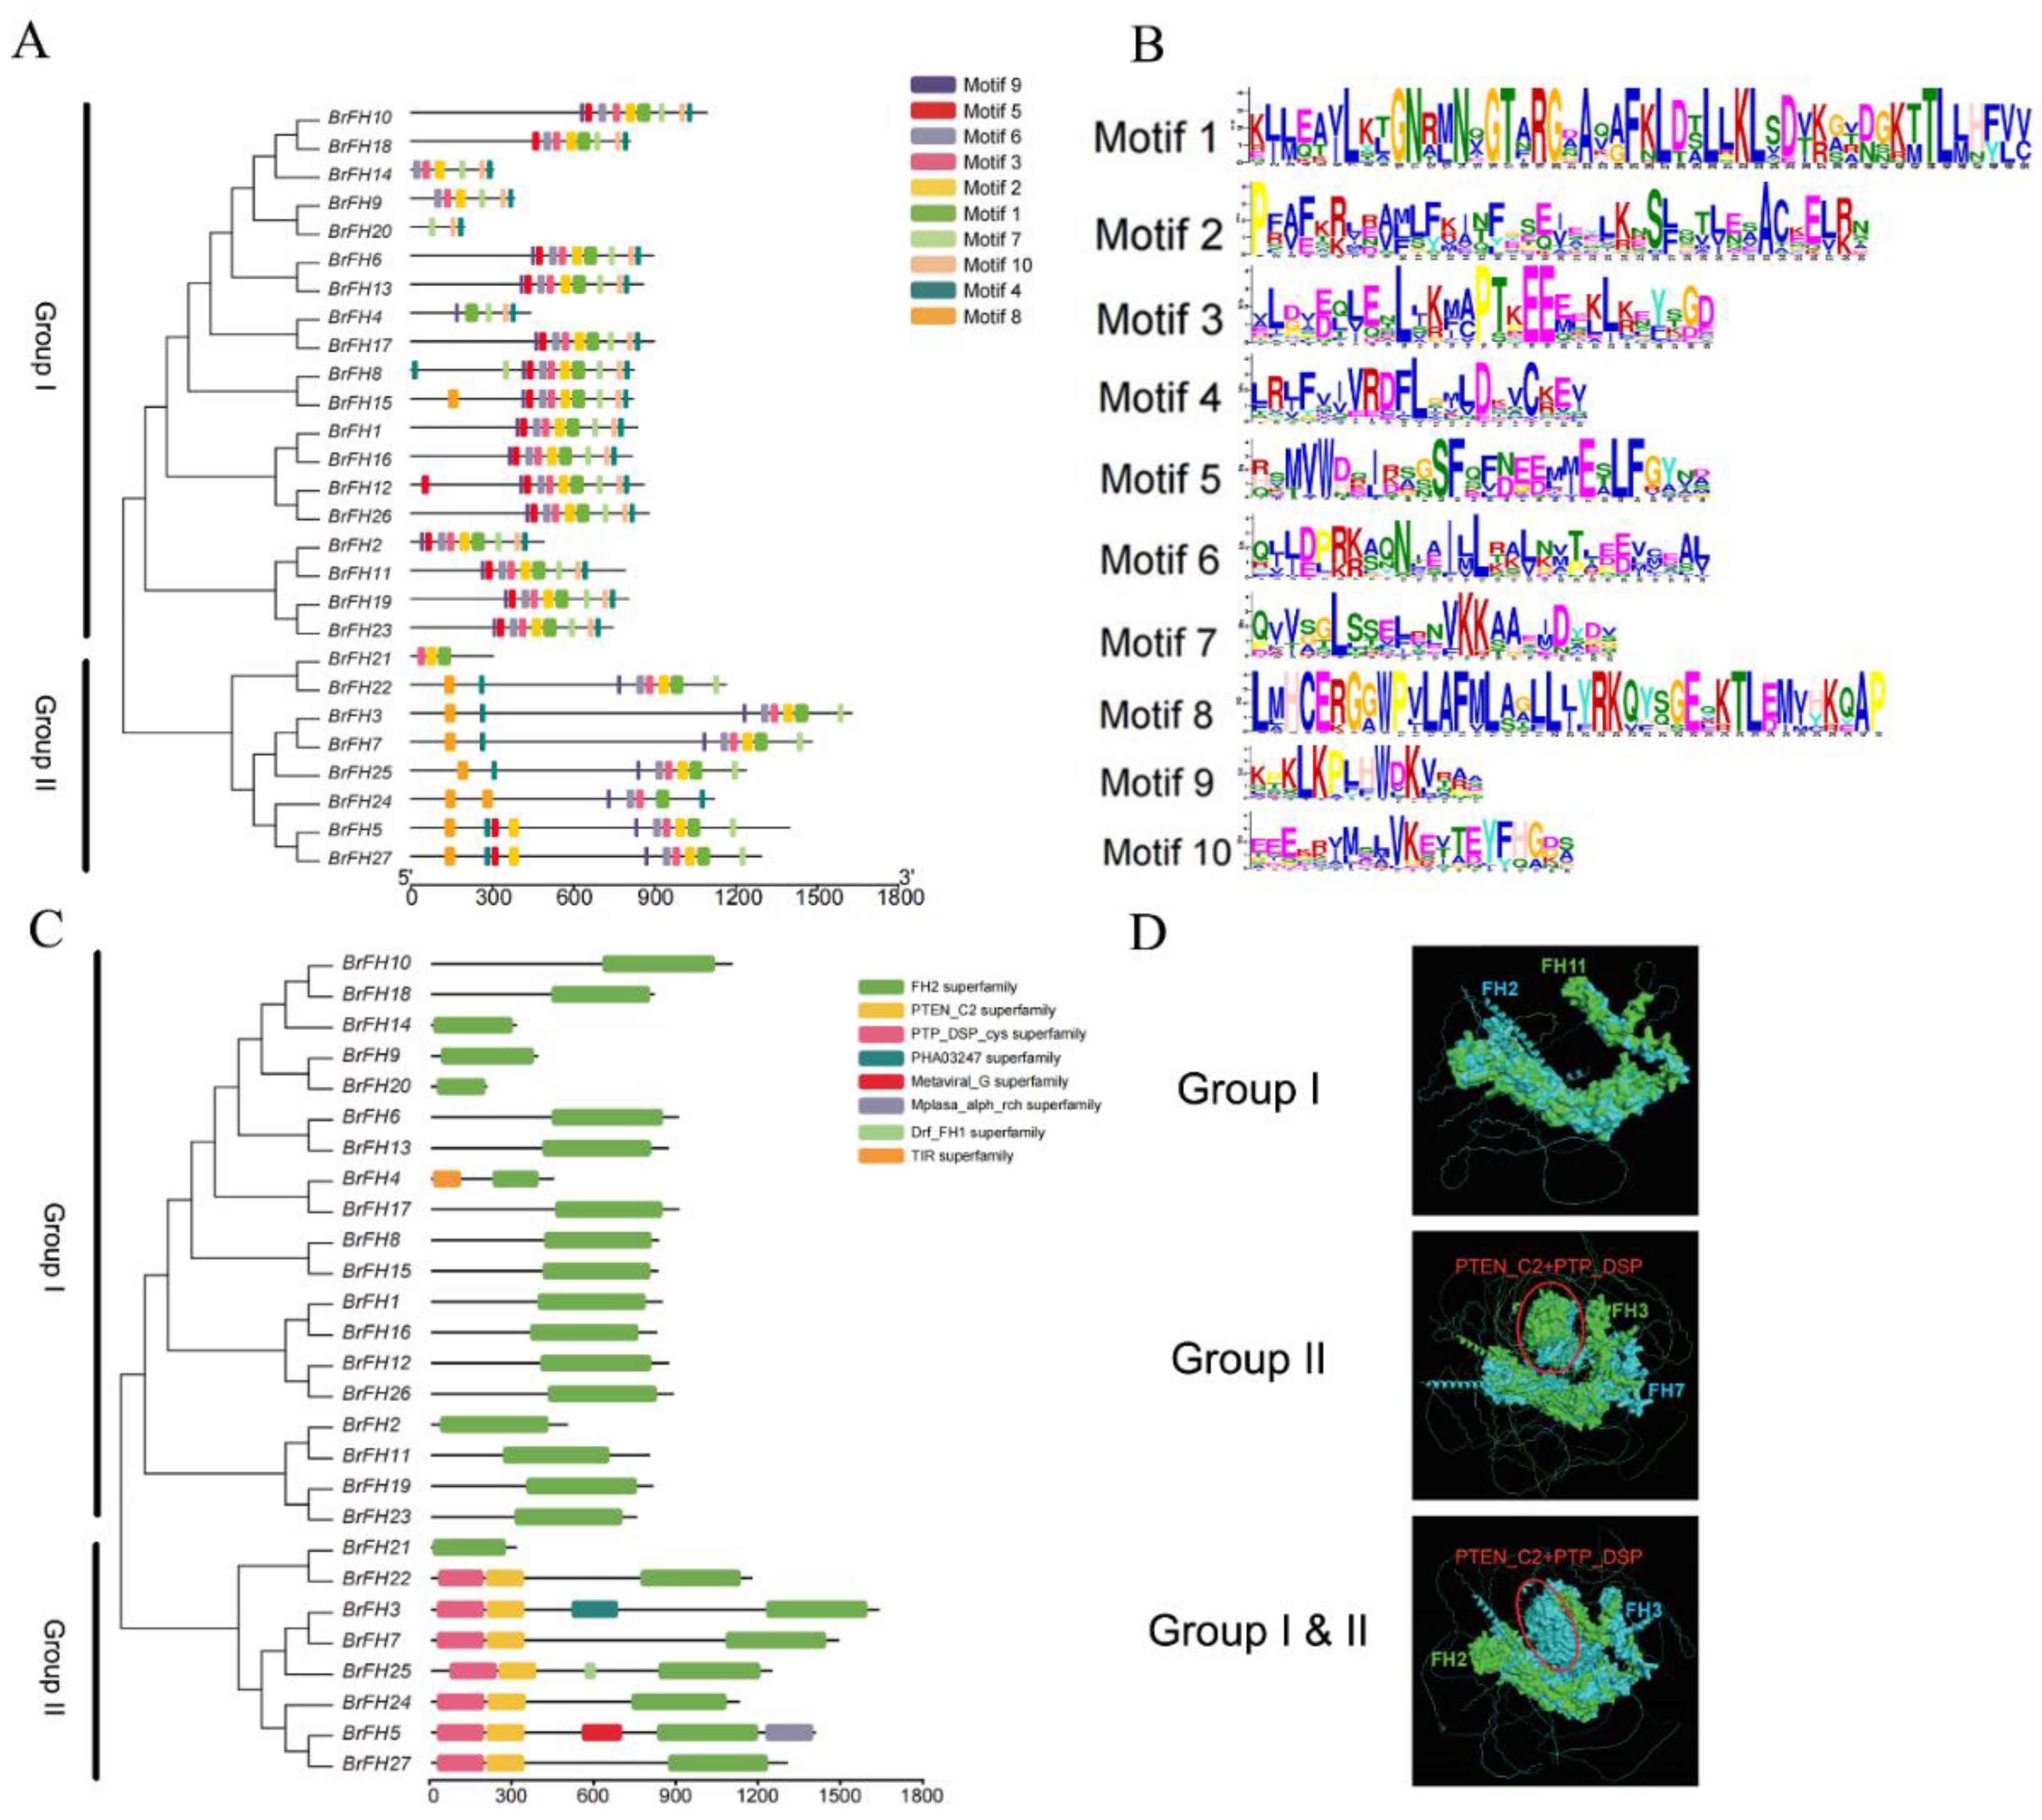
2.3. Motif and Conserved Domain, and Protein Structure Analysis

Conserved motifs were identified using the online software the MEME suite [43]. In MEME, the maximum number of motifs was set to 10, and the occurrences of a single motif were set to zero or one per sequence. NCBI’s Batch CD-Search (https://www.ncbi.nlm.nih.gov) was used to identify conserved domains, and these were visualized using “Visualize Pfam Domain Pattern” (from Pfam Search) in TBtools [44]. The tertiary structures of BrFH2 were predicted using AlphaFold [45], and structural ---visualization and comparison were performed using PyMOL [46].

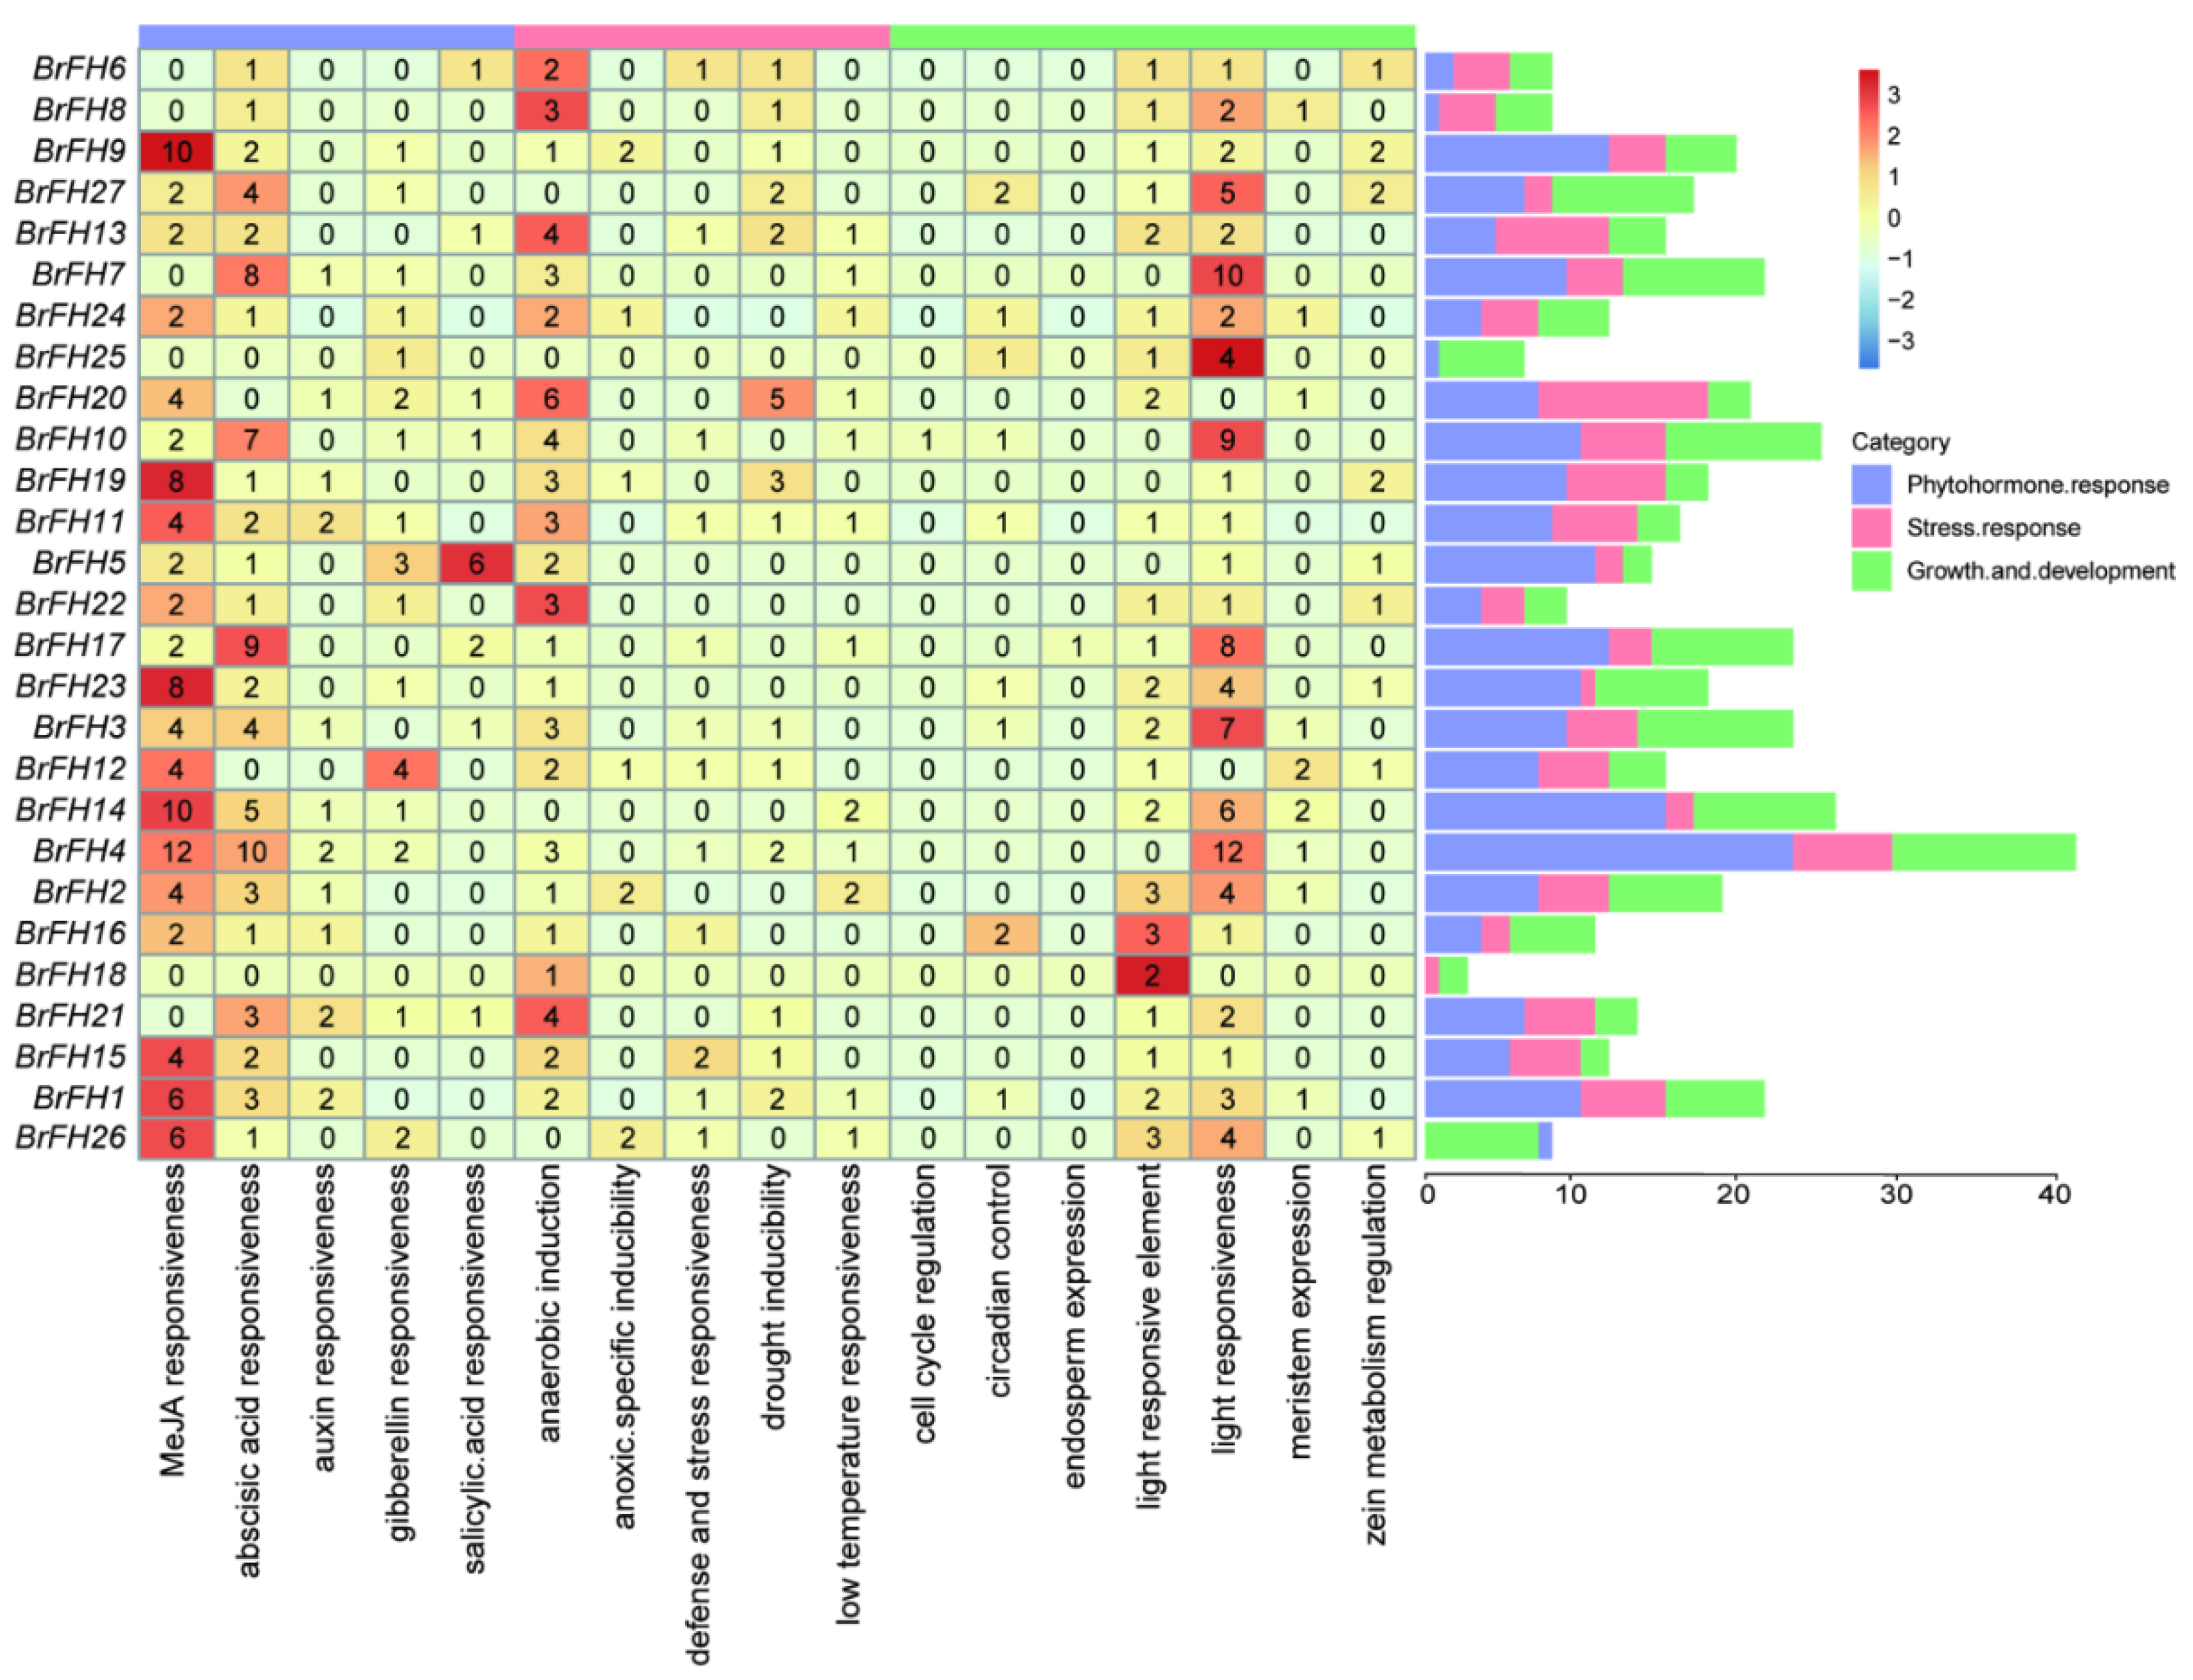
2.4. Cis-Acting Element Analysis

To investigate the potential regulatory mechanisms of BrFH family genes, a 2-kb sequence upstream of the translation start site of each gene was retrieved and subjected to cis-acting regulatory element analysis using the PlantCARE database with default parameters [47]. The type and abundance of these elements were visualized using R packages, with heatmaps and bar plots providing an intuitive overview of element types and frequencies across different gene promoters.

2.5. Expression Profiling of BrFH Genes in Different Tissues and Under Low-Temperature Stress

In order to explore the expression patterns of BrFH genes, transcriptomic data from various tissues of B. rapa were analyzed, including roots, stems, leaves, and flowers (Table S1). In addition, gene expression under different temperature conditions in cold-tolerant and cold-sensitive B. rapa accessions was examined to assess the potential involvement of BrFH genes in cold stress responses (Table S1). RNA-seq reads were aligned to the B. rapa Chiifu v1.5 reference genome using HISAT2 [48], and gene expression levels were quantified with featureCounts [49]. Transcript abundance was normalized as transcripts per million (TPM). The resulting expression profiles were visualized using R package, enabling the identification of both tissue-specific and cold-responsive expression patterns of BrFH genes.

2.6. Co-Expression Network Analysis

To investigate potential functional interactions between BrFH genes and other genes, a weighted gene co-expression network analysis (WGCNA) was conducted based on gene expression levels across various tissues and under cold stress conditions [50]. Pearson correlation coefficients were calculated to assess the expression relationships between BrFH genes and other transcriptionally active genes across various tissues and conditions. The resulting network was visualized using Cytoscape [51], enabling the identification of key BrFH genes potentially involved in shared biological pathways or regulatory modules.

2.7. Gene Ontology (GO) Enrichment Analysis

To gain insights into the potential biological functions of BrFH genes, GO enrichment analysis was performed. The genes co-expressed with BrFH family members were subjected to GO annotation and enrichment using the eggNOG-mapper [52], TBtools and clusterProfiler package in R [53], under default parameters. Significantly enriched GO terms (adjusted p < 0.05) were visualized using bubble charts.

2.8. qRT-PCR Analysis

Since the transcriptomic data were obtained from public databases, Chiifu was selected for subsequent analyses to further investigate the expression patterns of the candidate genes.
Seeds of chiifu were sown in an MS-modified medium (containing vitamins, sucrose, and agar) (PM10121-307) in a plant incubator at temperature of 24 ℃, relative humidity: 67%, light for 16 h, darkness for 8 h. The different test materials (‘848 Egg White’ Chinese cabbage) were subjected to cold stress (4 °C for 0, 6, 12, and 24 h) at State Key Laboratory of Crop Biology, Shandong Agricultural University (Tai’an, Shandong, China). Following exposure to stress, the materials were rapidly frozen in liquid nitrogen for further experiments. BrFH genes were subjected to Paired-end (PE) sequencing using Next-Generation Sequencing (NGS) based on the Illumina HiSeq sequencing platform by BioMarker Technologies (Beijing, China), and three biological replicates were collected for each sample.
Total RNA was extracted using a FastPure® Cell/Tissue Total RNA Isolation Kit V2 (Vazyme Biotech Co., Ltd., Nanjing, China); RNA integrity was assessed by 1% agarose gel electrophoresis, and the RNA concentration and purity were measured using a spectrophotometer (Thermo NanoDrop One). Primer sequences were obtained from the qPrimerDB-qPCR Primer Database (https://biodb.swu.edu.cn/qprimerdb/). The primer sequences are shown in Table S2. cDNA was obtained by reverse transcription using HiScript® II Q RT SuperMix with a qPCR sample kit (Novozymes); it was then diluted tenfold and stored at -20 °C. qRT-PCR reactions were 20 µL and contained the following components: 2×SYBR qPCR Master Mix 10.0 μL; upstream and downstream primers (10 μmol∙L-1) 0.4 μL each; cDNA template 1.0 μL; and ddH2O 8.2 μL. The thermal cycling conditions were as follows: 40 cycles of 95 °C for 30 s; 95 °C for 10 s; and 60 °C for 22 s, followed by 95 °C for 25 s; 60 °C for 60 s; and 95 °C for 7 s. BraActin 2 was used as the internal reference gene. The 2-∆∆CT method was used to analyze expression levels [54].

2.9. Ka/Ks Analysis

Ka and Ks values of FH gene pairs were calculated to evaluate selective pressure during evolution. Ka and Ks values were estimated using KaKs_Calculator under the YN model [55], and unreliable gene pairs were excluded. Ka/Ks ratios were used to infer selection patterns across plant lineages from chlorophytina to eudicots

3. Results

3.1. Genome-Wide Identification and Characterization of FH Family Genes

To identify potential FH genes in B. rapa, a comprehensive investigation was performed utilizing FH genes from A. thaliana as a query against the B. rapa genome. The resulting candidate genes were then screened for the presence of the FH domain (PF02181.27), which allowed the selection of genes to be further refined. The presence of 27 FH genes (designated BrFHs) were identified across the genome-wide level in B. rapa. These genes were distributed across eight chromosomes in the B. rapa genome, namely BrFH1 to BrFH27 according to their chromosomal positions (Table 1). The expectant polypeptides encoded by BrFH genes exhibited a prominent variation in length, ranging from 196 amino acids (BrFH20) to 1,627 amino acids (BrFH3), with predicted relative molecular weights (RMW) spanning from 22.01 kDa (BrFH20) to 175.3 kDa (BrFH3). The isoelectric point (pI) values exhibited a spectrum from 4.75 (BrFH20) to 9.51 (BrFH1). Notably, subcellular localization predictions predominantly placed most BrFH proteins within the plasma membrane, while the remaining 7 formin proteins were localized to the cytoplasm, 6 formin proteins were localized to the chloroplast, 4 formin proteins were localized to the nucleus, and 2 formin protein was localized to the vacuole. These findings mutually conduce to a nuanced understanding of the structure and functional attributes of identified BrFH genes in B. rapa.

3.2. Phylogenetic Analysis and Classification of FH Family Genes

The chromosomal distribution and synteny of BrFH genes were systematically analyzed based on genomic sequence data. A total of 27 BrFH genes were mapped onto the nine chromosomes of B. rapa, with no BrFH gene detected on chromosome 04 (Chr04), indicating an uneven genomic distribution. These BrFH genes are discretely distributed across the genome, with each chromosome harboring between one and seven members. Notably, chromosome 03 (Chr03) contains the largest number of BrFH genes (seven), whereas chromosome 08 (Chr08) harbors only a single BrFH gene (Figure 1A).
To further investigate the evolutionary relationships of BrFH genes, synteny analysis was performed between B. rapa and A. thaliana. A total of 26 BrFH genes exhibited syntenic relationships with FH genes in A. thaliana, indicating a high degree of syntenic conservation and suggesting a close evolutionary relationship between the two species (Figure 1B). To gain deeper insights into the evolutionary relationships within the BrFH family, FH proteins from A. thaliana and B. rapa were used to construct a phylogenetic tree. Phylogenetic analysis classified the BrFH proteins into two distinct groups, designated Group I and Group II (Figure 1C). Group I was the larger clade, comprising 19 BrFH members and accounting for 70.4% of the total BrFH members, whereas Group II contained eight BrFH members. The clustering of FH proteins within the same clades suggests a high degree of homology and implies potential functional similarities among BrFH proteins.

3.3. Analysis of Evolutionary Relationship, Gene Structure, and Conservative Motif of FH Family Genes

To comprehensively analyze the structural characteristics of BrFH genes, we conducted a detailed investigation of motif, conserved domains, and tertiary structure of protein across the 27 members of BrFH gene family. Motif analysis of the 27 BrFHs revealed the presence of 3 to 10 conserved motifs, with BrFH20 and BrFH21 containing the fewest (3 motifs each). Motif 4 was the most conserved, which was present in all genes, except BrFH21 (Figure 2A and 2B). Additionally, Motifs 2, 3, and 7 were highly conserved and were present in 92.6% of the genes. In contrast, Motif 8 was the least conserved, and predominantly found in Group II, with 70.3% of all genes containing this motif. Furthermore, Motif 10 was exclusively present in Group I. These findings indicate that the motifs vary among BrFH members, especially between the two groups.
All BrFH proteins containing a major conserved hallmark domain, FH2 superfamily domain (Figure 2C), which can affect the production or clearance of ROS by regulating the cytoskeleton. For example, the recombination of microfilaments may enhance the localization or activity of antioxidant enzymes such as SOD and CAT, thereby reducing oxidative damage [56]. Interestingly, PTEN-C2 and PTP_DSP_cys superfamily domains were only present in group II (Figure 2C), which can balance the production and clearance of ROS by regulating the phosphorylation status of signaling pathways [57]. Comparative analysis of the tertiary structures of BrFHs proteins between group I and group II revealed distinct structural conservation within each group but significant divergence between the two groups, particularly in the PTEN-C2 and PTP_DSP_cys superfamily domains (Figure 2D and Figure S1). Furthermore, several genes exhibited unique domain compositions, including PHA03247 in BrFH3, Metaviral_G and Mplasa_alph_rch in BrFH5, TIR in BrFH4, and Drf_FH1 in BrFH25 (Figure 2D). The substantial structural and domain variability among these members suggests potential functional diversification.

3.4. Cis-Acting Element Analysis of FH Family Genes

To elucidate the potential biological functions of cis-acting regulatory elements within the BrFH gene family, we scanned the 2,000 bp upstream promoter regions (relative to the transcriptional start site ATG) using the PlantCARE database [58]. The identified cis-regulatory elements were categorized into three major functional groups: (1) growth and development, encompassing elements involved in cell cycle regulation, endosperm-specific expression, light responsiveness, and meristem activity; (2) stress responses, including motifs associated with anaerobic induction, drought inducibility, and low-temperature responsiveness; and (3) phytohormone responses, comprising elements responsive to methyl jasmonate, abscisic acid, auxin, gibberellin, and salicylic acid (Figure 3). Among these genes, BrFH4 contains the highest number of cis-acting elements, primarily associated with phytohormone responses and plant growth and development, whereas BrFH18 possesses the fewest, predominantly related to plant growth and development. It is worth noting that approximately 85% of these genes contained abscisic acid, anaerobic induction and light responsiveness elements, indicating that these gene might participate in plant growth and development, and environment stresses in the plant. In addition, BrFH20 and BrFH19 may contribute to enhanced tolerance to drought stress, whereas BrFH2 and BrFH14 may confer increased tolerance to low-temperature stress by cis-acting element analysis. This comprehensive profile indicates that BrFH genes are likely modulated by a wide range of physiological processes and environmental cues.

3.5. Tissue-Specific Expression Patterns of FH Family Genes

To systematically evaluate across diverse tissues of the expression profiles in the BrFH family gene, revealing distinct expression patterns for each gene within the BrFH family. The comprehensive analysis encompassed four tissues, including roots, stems, leaves, and flowers (Figure 4A and Table S1). Tissue-specific expression analysis revealed distinct patterns among BrFH genes. BrFH4, BrFH9, BrFH14, and BrFH22 were predominantly expressed in roots, whereas BrFH2, BrFH3, BrFH5, BrFH19, BrFH23, BrFH24, BrFH26, and BrFH27 showed high expression levels in stems. In contrast, BrFH1, BrFH6, BrFH8, BrFH15, BrFH16, BrFH18, and BrFH21 were primarily expressed in flowers and exhibited expression patterns similar to those of floral development–related genes such as AP3, AGL10 and so on (Figure 4B and Table S3). Weighted Gene Co-expression Network Analysis (WGCNA) revealed that genes with expression patterns similar to highly flower-expressed BrFHs were significantly enriched in functions related to pollen tube development and cell growth processes (Figure 4C). Genes with expression patterns similar to highly stem-expressed BrFHs were associated with kinase activity, abscisic acid response, and cell wall biogenesis (Figure S2A,B). Genes with expression patterns resembling those of highly stem- and root- expressed BrFHs were potentially regulated by processes such as cell morphogenesis, root development, and transferase activity (Figure S2C,D). In addition, genes with expression patterns similar to highly root-expressed BrFHs were enriched in functions related to stimulus response, cell communication, plasma membrane organization, and signal transduction pathways (Figure S2E,F).
To further verify the tissue-specific function of the FH family, we choosed six genes (BrFH1, BrFH8, BrFH11, BrFH17, BrFH23 and BrFH27) to analyze their gene expression in different tissues (Figure 4D). The results showed that BrFH1 and BrFH8 exhibited the highest expression levels in flowers, whereas BrFH11, BrFH17, BrFH23, and BrFH27 were predominantly expressed in stems, consistent with the expression profiles obtained from transcriptome data. Therefore, the above results indicated members of the BrFH gene family exhibit distinct roles in the development of different tissues.

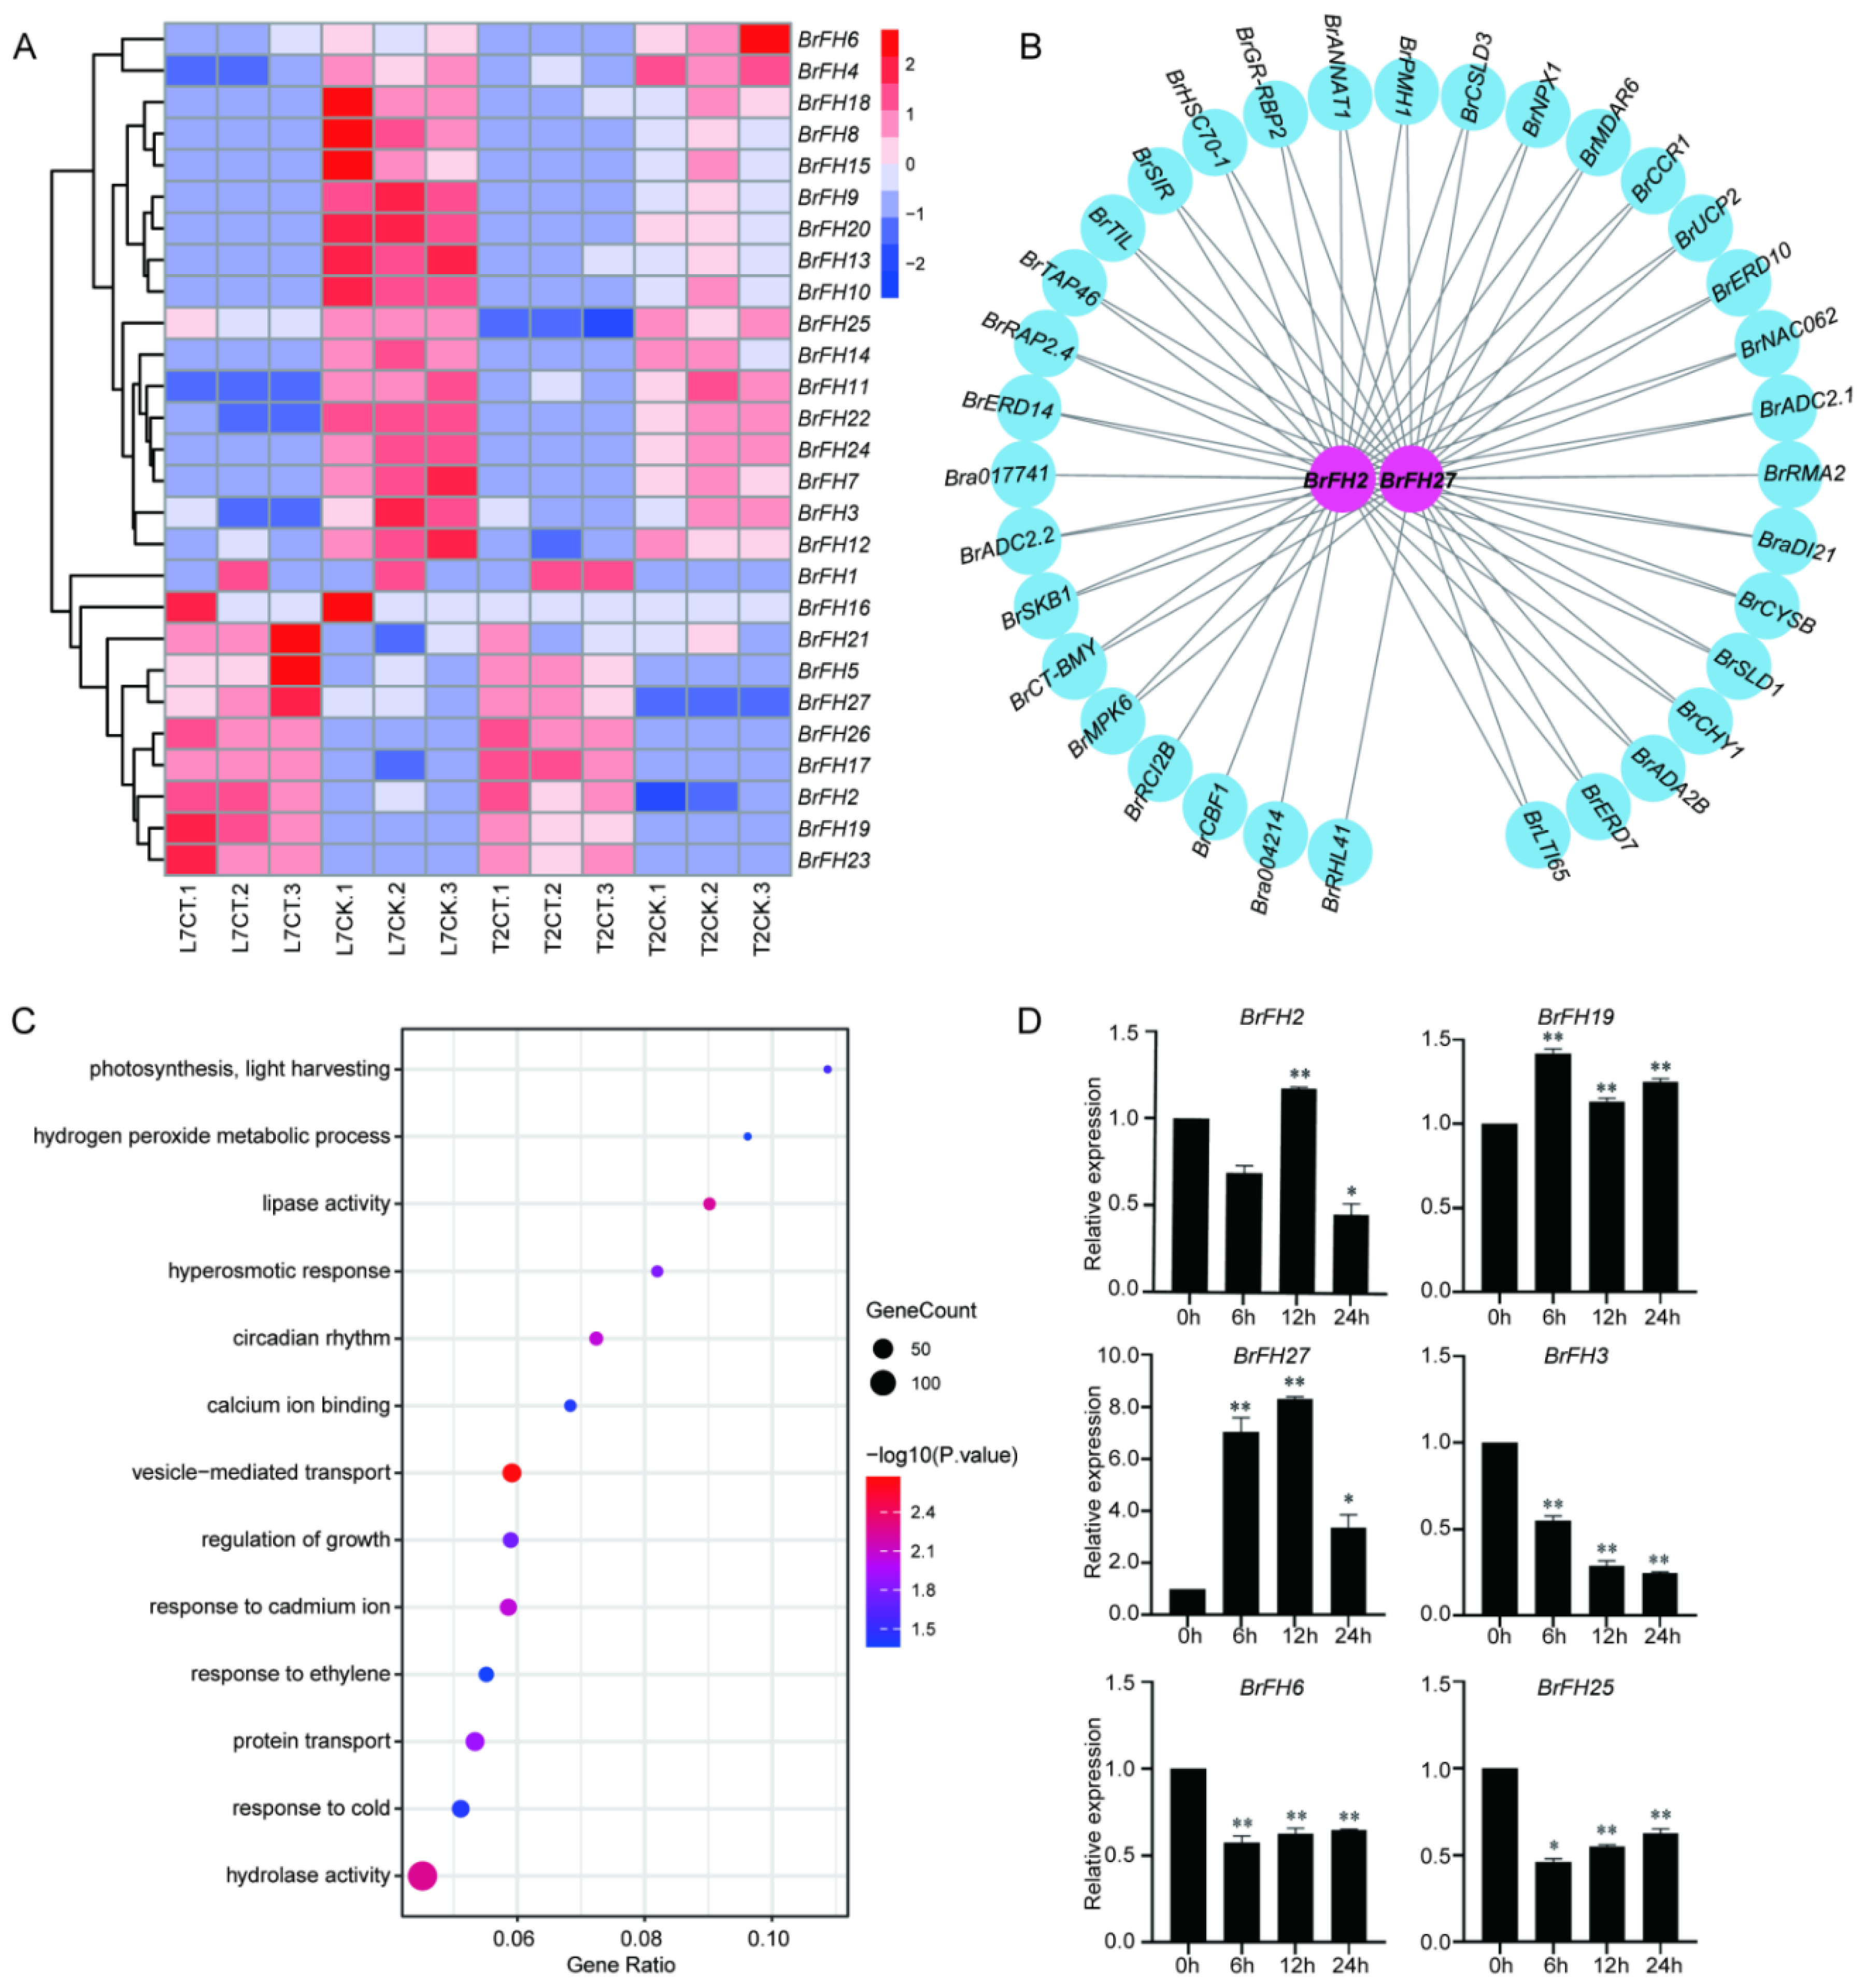
3.6. Transcriptome Analysis of BrFHs in Response to Cold Stress

To further characterize the BrFH gene family in response to low-temperature stress, transcriptome data were retrieved from the NCBI database (Table S1), comprising four treatment groups: L7CK (control under strong cold tolerance), L7CT (cold treatment under strong cold tolerance), T2CK (control under low cold tolerance), and T2CT (cold treatment under low cold tolerance). Among the BrFH gene family, BrFH2, BrFH5, BrFH17, BrFH19, BrFH21, BrFH23, BrFH26, and BrFH27 exhibited high expression levels in both strong and low cold-tolerance lines, with higher expression in the strong cold-tolerance line. In contrast, BrFH3, BrFH4, BrFH6, BrFH7, BrFH8, BrFH9, BrFH10, BrFH11, BrFH12, BrFH13, BrFH14, BrFH15, BrFH18, BrFH20, BrFH22, BrFH24, and BrFH25 were down-regulated under cold-tolerance conditions (Figure 5A). Meanwhile, WGCNA revealed that several BrFH genes, including BrFH2, BrFH27, and BrFH19, exhibited high expression levels in L7CT and showed expression patterns similar to those of cold-tolerance–related genes such as CBL1, CBF1, CCR1 and so on (Figure 5B, Figure S3A–C and Table S4) [59,60]. Genes co-expressed with these BrFHs were significantly enriched in biological processes associated with cold responses, hydrolase activity, and vesicle-mediated transport (Figure 5C and Figure S3D), suggesting that these BrFHs may contribute to the regulation of cold tolerance mechanisms.
To further validate the expression patterns of these genes under cold stress, we analyzed their transcript levels at 0, 6, 12, and 24 hours post-treatment. Among them, BrFH2, BrFH19, and BrFH27 exhibited high expression levels, whereas BrFH3, BrFH6, and BrFH25 were down-regulated, consistent with the expression patterns observed in the transcriptomic data. Taken together, these findings suggest that BrFHs may participate in response to cold stress and have diverse functions.

4. Discussion

B. rapa is an economically and nutritionally important vegetable that includes a wide range of leafy vegetables and oilseed crops cultivated worldwide [61]. As an important vegetable, understanding the molecular mechanisms underlying growth, development, and stress adaptation in B. rapa is of both theoretical and practical significance. Formins are key regulators of the actin cytoskeleton in eukaryotic cells, functioning as actin nucleation factors that initiate microfilament polymerization and contribute to the organization and dynamic remodeling of actin nessential for plant growth, development, and responses to abiotic stress [62]. To date, the formin gene family has been reported in several plant species, including A. thaliana and rice [15,16], but their functions in B. rapa remain unexplored. In this study, we identified and analyzed the physicochemical properties, protein structures, and expression patterns of 27 BrFHs during tissue development and in response to cold stresses (Figure 6). These results enhance our understanding of the roles of BrFHs in the molecular mechanisms underlying tissue development and cold stress responses.
Formins was proteins defined by the existence of FH-domain-containing, representing an evolutionarily conserved protein family. Evolutionary analyses revealed that the FH gene family is present in Chlorophytina plants, undergoing a progressive increase in gene copy number during plant evolution (Figure S4A and Table S5). This is particularly evident in magnoliids, monocots, and eudicots, suggesting lineage-specific amplification of the gene family throughout angiosperm evolution. The FH gene family was divided into two distinct subfamilies, consistent with the classification of FH genes reported in many other plant species [32,63]. Members of this family are characterized by two evolutionarily conserved and functionally divergent domains. Comparative domain analysis revealed that the FH2 domain is universally present in all examined plant lineages, wherea PTP_PTEN-like and PTP_DSP_cys superfamily appear to have emerged later during evolution and were first detected in Bryophyta (Figure S4B), suggesting lineage-specific domain acquisition during early land plant evolution. Meanwhile, the abundance of PTP_PTEN-like and PTP_DSP_cys superfamily domains increased markedly in eudicots, indicating that these newly acquired domains may have undergone expansion and functional diversification, thereby contributing more extensively to the biological functions of FH proteins in eudicot lineages.In addition, the BrFH gene family is relatively conserved within the species and across the examined plant taxa (Figure S4C). Furthermore, FH genes in plant lineages that evolved after Chlorophytina appear to have been predominantly subjected to purifying selection (Figure S4D), while exhibiting greater functional diversification in monocots and eudicots, indicating that these genes have maintained essential core functions while undergoing lineage-specific specialization during angiosperm evolution.
Gene structure and cis-regulatory elements play critical roles in shaping gene function by modulating transcriptional regulation, expression patterns, and functional specificity [64,65]. Here, motif and domain analyses revealed that the BrFH gene family can be divided into two distinct groups, consistent with the observed phylogenetic relationships, suggesting that evolutionary divergence is accompanied by structural differentiation (Figure 6). In addition, BrFHs harbor diverse cis-regulatory elements, which likely modulate their transcriptional responses to developmental cues and environmental stimuli, thereby contributing to the functional diversification.
Formins are proteins characterized by an FH2 domain and the ability to nucleate linear F-actin de novo, playing a pivotal role in cytoskeletal regulation and tissue development [66,67]. BrFHs exhibit distinct tissue-specific expression patterns (Figure 6). Genes with profiles similar to BrFH15 and BrFH18, which are highly expressed in flowers, were enriched for functions associated with floral organ development, particularly pollen tube growth, including key genes such as AP3, SEP3, and LRX11. Genes co-expressed with BrFH2 and BrFH27, highly expressed in stems, were enriched in kinase activity, calmodulin binding, and cell-cell communication. Similarly, genes with expression patterns resembling BrFH9, highly expressed in roots, were enriched in processes related to root morphogenesis and cell communication. The tissue-specific high expression of BrFHs indicates their contribution to tissue development and functional specialization, likely reflecting their roles in regulating cytoskeletal dynamics in different organs.
rapa possesses a robust capacity for cold acclimation, which confers significant chilling and freezing tolerance, thereby enabling the plant to successfully propagate, survive overwintering periods, and establish itself in temperate environments [68]. The actin cytoskeleton encoded by FH genes undergoes remodeling and interacts with various membranes (plasma membrane, vacuolar membrane, and nuclear membrane) under low-temperature stress, drought stress, and other types of stress in response to damage from the external environment. We found that BrFH2, BrFH27, and BrFH9 are highly expressed in cold-tolerant B. rapa plants under cold stress (Figure 6). Notably, BrFH2 and BrFH27 exhibit expression patterns similar to CBF1, CCR1, CHY1, ERD7, and other cold-responsive genes. CBF1, a member of the CBF (C-Repeat Binding Factor) transcription factor family, binds to the promoter regions of downstream cold-responsive genes, activating their expression and enhancing the plant’s ability to tolerate cold stress. In contrast, BrFH9 shows a co-expression pattern with genes such as CBL1, CIPK9, VIN3, and AGL20. Upon sensing calcium signaling changes, CBL interacts with and activates CIPK9, which subsequently modulates processes including ion transport and gene expression through phosphorylation of downstream target proteins, thereby contributing to the plant’s cold-resistance response [69]. These results suggest that BrFH2, BrFH27, and BrFH9 may play important roles in the cold stress response of B. rapa, potentially by coordinating with key cold-responsive pathways. Specifically, BrFH2 and BrFH27 may function in conjunction with the CBF-mediated transcriptional network, while BrFH9 may act through CBL-CIPK signaling to regulate downstream gene expression and ion homeostasis, highlighting the diverse mechanisms by which BrFHs contribute to cold tolerance.

5. Conclusions

In conclusion, this study systematically identified and characterized the formin gene family in Brassica rapa. The analyses of gene structure, phylogeny, cis-regulatory elements, and expression patterns indicate that BrFHs have diversified functions in tissue development and responses to abiotic stress, particularly cold stress. These findings provide a foundation for future functional studies of BrFHs and contribute to a better understanding of actin cytoskeleton regulation in B. rapa.

Supplementary Materials

The following supporting information can be downloaded at the website of this paper posted on Preprints.org.

Author Contributions

YQ.Y and SJ. L conceptualized and designed the research plan and the experiments, interpretated the results. N.W and SJ. L performed major experiments and data analysis with help from BX. H, ZK. H, GY. C and YH. W. All authors contributed to the article and approved the submitted version.

Funding

This work was supported by Key R&D Program of Shandong Province, China (2024LZGC036) and Shandong Natural Science Foundation, China (ZR2025MS445 and ZR2025QC240).

Data Availability Statement

Data are contained within the article and Supplementary Materials.

Competing interests

The authors declare no competing interests.

References

  1. Higgs, H.N.; Peterson, K. J. Phylogenetic analysis of the formin homology 2 domain. Mol. Biol. Cell 2005, 16, 1-13. [CrossRef]
  2. Faix, J.; Grosse, R. Staying in shape with formins. Dev. Cell 2006, 10, 693-706. [CrossRef]
  3. Higgs, H.N. Formin proteins: a domain-based approach. Trends Biochem. Sci. 2005, 30, 342-353. [CrossRef]
  4. Sagot, I.; Rodal, A.A.; Moseley, J.; Goode, B.L.; Pellman, D. An actin nucleation mechanism mediated by Bni1 and profilin. Nat. Cell Biol. 2002, 4, 626-631. [CrossRef]
  5. Courtemanche, N.; Pollard, T.D. Determinants of Formin Homology 1 (FH1) domain function in actin filament elongation by formins. J. Biol. Chem. 2012, 287, 7812-7820. [CrossRef]
  6. Xu, Y.; Moseley, J. B.; Sagot, I.; Poy, F.; Pellman, D.; Goode, B. L.; Eck, M. J. Crystal structures of a Formin Homology-2 domain reveal a tethered dimer architecture. Cell 2004, 116, 711-723. [CrossRef]
  7. Zweifel, M.E.; Courtemanche, N. Profilin’s Affinity for Formin Regulates the Availability of Filament Ends for Actin Monomer Binding. J. Mol. Biol. 2020, 432. [CrossRef]
  8. Dominguez, R. Actin filament nucleation and elongation factors--structure-function relationships. Crit. Rev. Biochem. Mol. Biol. 2009, 44, 351-366. [CrossRef]
  9. He, S.; Zhu, Q.; Pin, C.K.; Alma, T.; Xu, L.; Gao, Y.G.; Mu, Y.; Hou, X.; Miao, Y. Profilin negatively regulates formin-mediated actin assembly to modulate pamp-triggered plant immunity. Curr. Biol. 2018, 28, 1882-1895.
  10. Khuman, A.; Yadav, V.; Chaudhary, B. Evolutionary dynamics of the cytoskeletal profilin gene family in Brassica juncea L. reveal its roles in silique development and stress resilience. Int. J. Biol. Macromol. 2024, 266, 131247. [CrossRef]
  11. Cvrcková, F.; Novotný, M.; Pícková, D; Zárský, V. Formin homology 2 domains occur in multiple contexts in angiosperms. BMC Genomics 2004, 5. [CrossRef]
  12. Wang, X.; Mao, T. Understanding the functions and mechanisms of plant cytoskeleton in response to environmental signals. Curr. Opin. Plant Biol. 2019, 52, 86-96. [CrossRef]
  13. Li, J.; Staiger, C.J. Understanding Cytoskeletal Dynamics During the Plant Immune Response. Annu. Rev. Phytopathol. 2018, 56, 513-533. [CrossRef]
  14. Porter, K.; Day, B. From filaments to function: The role of the plant actin cytoskeleton in pathogen perception, signaling and immunity. J. Integr. Plant Biol. 2016, 58, 299-311. [CrossRef]
  15. Cheung, A.Y.; Wu, H.M. Overexpression of an Arabidopsis formin stimulates supernumerary actin cable formation from pollen tube cell membrane. Plant Cell 2004, 16, 257-269. [CrossRef]
  16. Li, B.; Du, Z.; Jiang, N.; He, S.; Shi, Y.; Xiao, K.; Xu, L.; Wang, K.; Wu, L; et al. Genome-Wide Identification and Expression Profiling of the FORMIN Gene Family Implies Their Potential Functions in Abiotic Stress Tolerance in Rice (Oryza sativa). Plant Mol. Biol. Rep. 2023, 41, 573-586. [CrossRef]
  17. Paul, S.K.; Islam, M.S.U.; Akter, N.; Zohra, F.T.; Rashid, S.B.; Ahmed, M.S.; Rahman, S.M.; Sarkar, M.A.R. Genome-wide identification and characterization of FORMIN gene family in cotton (Gossypium hirsutum L.) and their expression profiles in response to multiple abiotic stress treatments. PLoS One 2025, 20, e0319176. [CrossRef]
  18. Deeks, M.J.; Hussey, P.J.; Davies, B. Formins: intermediates in signal-transduction cascades that affect cytoskeletal reorganization. Trends Plant Sci. 2002, 7, 492-498. [CrossRef]
  19. Bouain, N.; Korte, A.; Satbhai, S. B.; Nam, H. I.; Rhee, S. Y.; Busch, W.; Rouached, H. Systems genomics approaches provide new insights into Arabidopsis thaliana root growth regulation under combinatorial mineral nutrient limitation. PLoS Genet. 2019, 15. [CrossRef]
  20. Shevchenko, G.V.; Krutovsky, K.V. Mechanical stress effects on transcriptional regulation of genes encoding microtubule- and actin-associated proteins. Physiol. Mol. Biol. Plants 2022, 28, 17-30. [CrossRef]
  21. Cheung, A.Y.; Niroomand, S.; Zou, Y; Wu, H.M. A transmembrane formin nucleates subapical actin assembly and controls tip-focused growth in pollen tubes. Proc. Natl. Acad. Sci. U. S. A. 2010, 107, 16390-16395. [CrossRef]
  22. Wu, J.Y.; Jin, C.; Qu, H.Y.; Tao, S.T.; Xu, G.H.; Wu, G.H.; Wu, J.; Wu, H.Q.; Zhang, S.L. Low temperature inhibits pollen viability by alteration of actin cytoskeleton and regulation of pollen plasma membrane ion channels in Pyrus pyrifolia. Environ. Exp. Bot. 2012, 78, 70-75. [CrossRef]
  23. Qian, D.; Li, T.; Chen, S.; Wan, D.; He, Y.; Zheng, C.; Li, J.; Sun, Z.; Li, J.; Sun, J.; et al. Evolution of the thermostability of actin-depolymerizing factors enhances the adaptation of pollen germination to high temperature. Plant cell 2023, 36, 881-898. [CrossRef]
  24. Deeks, M.J.; Cvrcková, F.; Machesky, L.M.; Mikitová, V.; Ketelaar, T.; Zársky, V.; Davies, B.; Hussey, P.J. Arabidopsis group Ie formins localize to specific cell membrane domains, interact with actin-binding proteins and cause defects in cell expansion upon aberrant expression. New Phytol. 2005, 168, 529-540. [CrossRef]
  25. Yi, K.; Guo, C.; Chen, D.; Zhao, B.; Yang, B.; Ren, H. Cloning and functional characterization of a formin-like protein (AtFH8) from Arabidopsis. Plant Physiol. 2005, 138, 1071-1082. [CrossRef]
  26. Blanchoin, L.; Boujemaa-Paterski, R.; Henty, J.L.; Khurana, P.; Staiger, C.J. Actin dynamics in plant cells: a team effort from multiple proteins orchestrates this very fast-paced game. Curr. Opin. Plant Biol. 2010, 13, 714-723. [CrossRef]
  27. Cvrčková, F.; Grunt, M.; Žárský, V. Expression of GFP-mTalin reveals an actin-related role for the Arabidopsis Class II formin AtFH12. Biol. Plant. 2012, 56, 431-440. [CrossRef]
  28. Li, Y.; Shen, Y.; Cai, C.; Zhong, C.; Zhu, L.; Yuan, M.; Ren, H. The type II Arabidopsis formin14 interacts with microtubules and microfilaments to regulate cell division. Plant Cell 2010, 22, 2710-2726. [CrossRef]
  29. Wang, J.; Zhang, Y.; Wu, J.; Meng, L.; Ren, H. AtFH16, an Arabidopsis type II formin, binds and bundles both microfilaments and microtubules, and preferentially binds to microtubules. J. Integr. Plant Biol. 2013, 55, 1002-1015. [CrossRef]
  30. Liang, P.; Schmitz, C.; Lace, B.; Ditengou, F.A.; Su, C.; Schulze, E.; Knerr, J.; Grosse, R.; Keller, J.; Libourel, C.; Delaux, P.M.; Ott, T. Formin-mediated bridging of cell wall, plasma membrane, and cytoskeleton in symbiotic infections of Medicago truncatula. Curr. Biol. 2021, 31, 2712-2719.e5. [CrossRef]
  31. Shing, P.; Islam, M.S.U.; Khatun, M.S.; Zohra, F.T.; Hasan, N.; Rahman, S.M.; Sarkar, M.A.R. Genome-wide identification, characterization and expression profiles of FORMIN gene family in cotton (Gossypium Raimondii L.). BMC Genom. Data 2024, 25, 105. [CrossRef]
  32. Zhang, Z.; Zhang, Z.; Shan, M.; Amjad, Z.; Xue, J.; Zhang, Z.; Wang, J.; Guo, Y. Genome-Wide Studies of FH Family Members in Soybean (Glycine max) and Their Responses under Abiotic Stresses. Plants (Basel) 2024, 13, 276. [CrossRef]
  33. Yang, Y.; Zhao, Y.; Zheng, W.; Zhao, Y.; Zhao, S.; Wang, Q.; Bai, L.; Zhang, T.; Huang, S.; Song, C.; Yuan, M.; Guo, Y. Phosphatidylinositol 3-phosphate regulates SCAB1-mediated F-actin reorganization during stomatal closure in Arabidopsis. Plant cell 2021, 34, 477-494. [CrossRef]
  34. Lee, J.; Lim, Y.P.; Han, C.T.; Nou, I.S.; Hur, Y. Genome-wide expression profiles of contrasting inbred lines of Chinese cabbage, Chiifu and Kenshin, under temperature stress. Genes Genom. 2013, 35, 273-288. [CrossRef]
  35. Song, Y.; Guo, X.; Wu J.; Liang, J.; Lin, R.; Yan, Z.; Wang, X. An optimized protocol for detecting guard cell specific gene expression by in situ RT-PCR in Brassica rapa. Hortic. Plant. 2022, 8, 311-318. [CrossRef]
  36. Artimo, P.; Jonnalagedda, M.; Arnold, K.; Baratin, D.; Csardi, G.; de Castro, E.; Duvaud, S.; Flegel, V.; Fortier, A.; Gasteiger, E.; et al. ExPASy: SIB bioinformatics resource portal. Nucleic Acids Res. 2012, 40, W597-603. [CrossRef]
  37. Xu, Q.; Dunbrack, R.L., Jr. Assignment of protein sequences to existing domain and family classification systems: Pfam and the PDB. Bioinformatics 2012, 28, 2763-2772. [CrossRef]
  38. Horton, P.; Park, K.J.; Obayashi, T.; Fujita, N.; Harada, H.; Adams-Collier, C.J.; Nakai, K. WoLF PSORT: protein localization predictor. Nucleic Acids Res. 2007, 35, W585-587. [CrossRef]
  39. Chen, C.; Chen, H.; Zhang, Y.; Thomas, H.R.; Frank, M.H.; He, Y.; Xia, R. TBtools: An Integrative Toolkit Developed for Interactive Analyses of Big Biological Data. Mol Plant. 2020, 13, 1194-1202. [CrossRef]
  40. Wang, Y.; Tang, H.; Debarry, J.D.; Tan, X.; Li, J.; Wang, X.; Lee, T.H.; Jin, H.; Marler, B.; Guo, H.; et al. MCScanX: a toolkit for detection and evolutionary analysis of gene synteny and collinearity. Nucleic Acids Res. 2012, 40, e49. [CrossRef]
  41. Kumar, S.; Stecher, G.; Li, M.; Knyaz, C.; Tamura, K. MEGA X: Molecular Evolutionary Genetics Analysis across Computing Platforms. Mol. Biol. Evol. 2018, 35, 1547-1549. [CrossRef]
  42. Letunic, I.; Bork, P. Interactive Tree of Life (iTOL) v5: an online tool for phylogenetic tree display and annotation. Nucleic Acids Res. 2021, 49, W293-w296. [CrossRef]
  43. Bailey, T.L.; Williams, N.; Misleh, C.; Li, W.W. MEME: discovering and analyzing DNA and protein sequence motifs. Nucleic Acids Res. 2006, 34, W369-373. [CrossRef]
  44. Marchler-Bauer, A.; Derbyshire, M.K.; Gonzales, N.R.; Lu, S.; Chitsaz, F.; Geer, L.Y.; Geer, R.C.; He, J.; Gwadz, M.; Hurwitz, D.I.; et al. CDD: NCBI’s conserved domain database. Nucleic Acids Res. 2015, 43, D222-226. [CrossRef]
  45. Abramson, J.; Adler, J.; Dunger, J.; Evans, R; Green, T.; Pritzel, A.; Ronneberger, O; Willmore, L; Ballard, A.J.; Bambrick, J.; et al. Accurate structure prediction of biomolecular interactions with AlphaFold 3. Nature 2024, 630, 493-50. [CrossRef]
  46. Rosignoli, S; Paiardini, A. Boosting the Full Potential of PyMOL with Structural Biology Plugins. Biomolecules 2022, 12, 1764. [CrossRef]
  47. Lescot, M.; Déhais, P.; Thijs, G.; Marchal, K.; Moreau, Y.; Van de Peer, Y.; Rouzé, P.; Rombauts, S. PlantCARE, a database of plant cis-acting regulatory elements and a portal to tools for in silico analysis of promoter sequences. Nucleic Acids Res. 2002, 30, 325-327. [CrossRef]
  48. Zhang, Y.; Park, C.; Bennett, C.; Thornton, M.; Kim, D. Rapid and accurate alignment of nucleotide conversion sequencing reads with HISAT-3N. Genome. Res. 2021, 31, 1290--1295. [CrossRef]
  49. Liao, Y.; Smyth, G.K.; Shi, W. featureCounts: an efficient general purpose program for assigning sequence reads to genomic features. Bioinformatic 2014, 30, 923-930. [CrossRef]
  50. Langfelder, P.; Horvath, S. WGCNA: an R package for weighted correlation network analysis. BMC Bioinformatics 2008, 9, 559. [CrossRef]
  51. Shannon, P.; Markiel, A.; Ozier, O.; Baliga, N.S.; Wang, J.T.; Ramage, D.; Amin, N.; Schwikowski, B.; Ideker, T. Cytoscape: a software environment for integrated models of biomolecular interaction networks. Genome Res. 2003, 13, 2498-2504. [CrossRef]
  52. Cantalapiedra, C.P.; Hernández-Plaza, A.; Letunic, I.; Bork, P.; Huerta-Cepas, J. eggNOG-mapper v2: Functional Annotation, Orthology Assignments, and Domain Prediction at the Metagenomic Scale. Mol Biol Evol. 2021, 38, 5825-5829. [CrossRef]
  53. Yu, G.; Wang, L.G.; Han, Y.; He, Q.Y. clusterProfiler: an R package for comparing biological themes among gene clusters. Omics 2012, 16, 284-287. [CrossRef]
  54. Livak, K. J.; Schmittgen, T. D. Analysis of relative gene expression data using real-time quantitative PCR and the 2(-Delta Delta C(T)) Method. Methods 2001, 25, 402–408. [CrossRef]
  55. Zhang. Z. KaKs_Calculator 3.0: Calculating Selective Pressure on Coding and Non-coding Sequences. Genomics Proteomics Bioinformatics. 2022, 20(3):536-540. [CrossRef]
  56. Martínez-Cenalmor, P., Martínez, A.E., Moneo-Corcuera, D., González-Jiménez, P., Pérez-Sala, D. Oxidative stress elicits the remodeling of vimentin filaments into biomolecular condensates. Redox Biol. 2024, 75, 103282. [CrossRef]
  57. Schwertassek, U., Haque, A., Krishnan, N., Greiner, R., Weingarten, L., Dick, T.P., Tonks, N.K. Reactivation of oxidized PTP1B and PTEN by thioredoxin 1. FEBS J. 2014 281(16):3545-58. [CrossRef]
  58. Khan, N., Hu, C.M., Khan, W.A., Wang, W., Ke, H., Huijie, D., Zhishuo, Z., Hou, X, Genome-wide Identification, Classification, and Expression Pattern of Homeobox Gene Family in Brassica rapa under Various Stresses. Sci Rep. 2018, 8(1):16265. [CrossRef]
  59. Kopeć, P., Rapacz, M., Arora, R., Post-translational activation of CBF for inducing freezing tolerance. Trends Plant Sci. 2022, 27(5):415-417. [CrossRef]
  60. Chen, L., Zhao, H., Chen, Y., Jiang, F., Zhou, F., Liu, Q., Fan, Y., Liu, T., Tu, W., Walther, D., Song, B. Comparative transcriptomics analysis reveals a calcineurin B-like gene to positively regulate constitutive and acclimated freezing tolerance in potato. Plant Cell Environ. 2022, 45(11):3305-3321. [CrossRef]
  61. Sun, R. Economic/Academic Importance of Brassica rapa. The Brassica rapa Genome, Compendium of Plant Genomes, 2015.
  62. Pruyne, D.; Evangelista, M.; Yang, C.; Bi, E.; Zigmond, S.; Bretscher, A; Boone, C. Role of Formins in Actin Assembly: Nucleation and Barbed-End Association. Science 2002, 297, 612-615. [CrossRef]
  63. Wang, J., Zhou, C. Genome-Wide Characterization and Analysis of the FH Gene Family in Medicago truncatula Under Abiotic Stresses. Genes (Basel). 2025, 16(5):555. [CrossRef]
  64. Oudelaar, A.M., Higgs, D.R. The relationship between genome structure and function. Nat Rev Genet. 2021, 22(3):154-168. [CrossRef]
  65. Lata, C., Prasad, M. Role of DREBs in regulation of abiotic stress responses in plants. J Exp Bot. 2011, 62(14):4731-48. [CrossRef]
  66. Liu, R., Linardopoulou, E.V., Osborn, G.E., Parkhurst, S.M. Formins in development: orchestrating body plan origami. Biochim Biophys Acta. 2010, 1803(2):207-25. [CrossRef]
  67. Faix, J., Grosse, R. Staying in shape with formins. Dev Cell. 2006,10(6):693-706. [CrossRef]
  68. Eom, S.H., Ahn, M.A., Kim, E., Lee, H.J., Lee, J.H., Wi, S.H., Kim, S.K., Lim, H.B., Hyun, T.K. Plant Response to Cold Stress: Cold Stress Changes Antioxidant Metabolism in Heading Type Kimchi Cabbage (Brassica rapa L. ssp. Pekinensis). Antioxidants (Basel). 2022, 11(4):700. [CrossRef]
  69. Kang, H.; Yang, Y.; Meng, Y. Functional Differentiation of the Duplicated Gene BrrCIPK9 in Turnip (Brassica rapa var. rapa). Genes, 2024, 15, 405. [CrossRef]
Figure 1. Chromosomal localization, phylogenetic classification and syntenic relationships of BrFHs between B.rapa and A.thaliana. (A) BrFH gene localization and replication on B. rapa chromosomes. The outermost yellow blocks are representative of the 10 chromosomes, and the middle and inner regions show the density of each chromosome. The curves of different colors link the FH genes in B. rapa, respectively. (B) Phylogenetic tree of FH in B. rapa and A. thaliana. Different colors correspond to different groups: blue indicates Group I, green indicates Group II. (C) Collinearity analysis between B. rapa and A. thaliana. Red lines indicate homologous genes.
Preprints 194474 g001
Figure 2. Gene structure and characterization of conserved motifs of BrFHs from B. rapa. (A) The motifs of BrFH proteins. (B) The conserved motifs of BrFHs. The integral height of each stack indicates the level of conservation at this site, and the amino acid frequency is indicated by the size of each letter. (C) The domain regions of BrFHs. (D) Protein tertiary structure diagrams showing domain differences in BrFHs between Group I and Group II.
Preprints 194474 g002
Figure 3. Analysis of cis-elements in promoter of FH genes in B. rapa. Different kinds of cis-elements and relative positions in every BrFH gene were represented by colored blocks.
Preprints 194474 g003
Figure 4. The BrFH gene family exhibits differential expression across various tissues. (A) Expression profile of FH genes in different tissues. (B) Gene network co-expression diagram of BrFH1, BrFH15, BrFH16 and BrFH18. Purple nodes represent FH genes, bule nodes represent interacted genes, and the lines connecting the nodes signify interactions between genes. (C) Gene enrichment analysis of BrFH1, BrFH15, BrFH16 and BrFH18. (D) Expression analysis of six BrFH genes selected in roots, flowers, leaves and stems. Data were shown as means; errors are shown as ±SD (t-test, * p < 0.05, ** p < 0.01).
Preprints 194474 g004
Figure 5. BrFH gene family exhibits distinct responses to low-temperature stress. (A) The expression of BrFHs under 4 °C were detected by RNA-seq. (B) Gene network co-expression diagram of BrFH2 and BrFH27. Blue-colored genes represent cold-resistant genes associated with BrFH2 and BrFH27. (C) GO enrichment of genes co-expressed with BrFH2 and BrFH27 in B. rapa. (D) Expression analysis of BrFH under cold stress at different time treatments. Data were shown as means; errors are shown as ±SD (t-test, * p < 0.05, ** p < 0.01).
Preprints 194474 g005
Figure 6. A model illustrating the functional diversification of the BrFH gene family. The red frames indicate genes that are up-regulated in response to cold stress. The green frames indicate genes that are down-regulated in response to cold stress.
Preprints 194474 g006
Table 1. Information of FH family members in B. rapa.
Gene ID Gene Name Chr. No Gene
Start Position
Gene
End Position
A.thaliana ID A.thaliana Name Subcellular
Localization
Amino Acid (aa) CDS (bp) MW (kDa) Isoelectric Point
Bra039561 BrFH1 A01 11,886,057 11,889,150 AT5G54650 AtFH5 Plasma membrane 837 2,514 92.22 9.44
Bra035415 BrFH2 A01 16,477,720 16,479,274 AT1G59910 AtFH7 Plasma membrane 490 1,473 53.40 7.07
Bra028684 BrFH3 A02 2,564,374 2,571,652 AT5G07770 AtFH16 Nucleus 1627 4,884 175.30 7.39
Bra031838 BrFH4 A02 27,611,349 27,613,482 AT5G67470 AtFH6 Cytoplasm 440 1,323 49.71 6.02
Bra020385 BrFH5 A02 6,491,606 6,497,627 AT5G58160 AtFH13 Chloroplast 1396 4,191 155.28 8.30
Bra000328 BrFH6 A03 10,561,399 10,564,306 AT2G43800 AtFH2 Plasma membrane 895 2,688 98.20 8.47
Bra005952 BrFH7 A03 1,373,493 1,380,081 AT5G07770 AtFH16 Nucleus 1480 4,443 160.67 6.85
Bra001148 BrFH8 A03 14,976,355 14,979,096 AT3G05470 AtFH11 Plasma membrane 823 2,472 91.02 8.82
Bra001256 BrFH9 A03 15,545,258 15,546,720 AT3G07540 AtFH10 Cytoplasm 381 1,146 42.77 5.30
Bra013217 BrFH10 A03 19,804,375 19,807,889 AT3G25500 AtFH1 Plasma membrane 1091 3,276 119.27 8.14
Bra017889 BrFH11 A03 31,345,005 31,356,742 AT1G59910 AtFH7 Plasma membrane 790 2,373 85.99 9.03
Bra029012 BrFH12 A03 5,866,076 5,869,007 AT5G54650 AtFH5 Plasma membrane 859 2,580 93.57 8.36
Bra004786 BrFH13 A05 1,882,215 1,825,011 AT2G43800 AtFH2 Chloroplast 857 2,574 94.10 8.64
Bra029655 BrFH14 A05 22,786,695 22,787,755 AT3G07540 AtFH10 Chloroplast 303 912 34.09 4.87
Bra039436 BrFH15 A05 23,324,560 23,327,524 AT3G05470 AtFH11 Plasma membrane 819 2,460 91.19 8.86
Bra037087 BrFH16 A05 9,934,103 9,936,953 AT5G54650 AtFH5 Plasma membrane 816 2,451 89.67 9.11
Bra024447 BrFH17 A06 15,802,206 15,805,576 AT5G67470 AtFH6 Plasma membrane 897 2,694 98.69 9.25
Bra037491 BrFH18 A06 21,200,697 21,203,353 AT5G48360 AtFH2 Chloroplast 807 2,424 88.31 5.78
Bra016233 BrFH19 A07 18,713,686 18,716,094 AT1G70140 AtFH8 Chloroplast, Vacuole 802 2,409 87.64 9.51
Bra012246 BrFH20 A07 9,097,123 9,097,833 AT3G07540 AtFH10 Cytoplasm 196 591 22.01 4.75
Bra038438 BrFH21 A08 8,735,316 8,737,759 AT1G31810 AtFH14 Cytoplasm 303 912 34.14 8.73
Bra023204 BrFH22 A09 20,717,185 20,722,757 AT1G31810 AtFH14 Nucleus 1163 3,492 128.06 6.72
Bra024640 BrFH23 A09 23,866,999 23,869,323 AT1G24150 AtFH4 Vacuole 744 2,235 81.94 9.20
Bra007822 BrFH24 A09 31,070,385 31,075,379 AT2G25050 AtFH18 Cytoplasm 1118 3,357 124.06 8.37
Bra009306 BrFH25 A10 16,073,796 16,079,751 AT5G07770 AtFH16 Chloroplast 1237 3,714 137.59 5.86
Bra002969 BrFH26 A10 6,365,088 6,368,134 AT5G54650 AtFH5 Plasma membrane 877 2,634 95.18 9.09
Bra002668 BrFH27 A10 8,324,945 8,330,743 AT5G58160 AtFH13 Cytoplasm 1292 3,879 142.04 6.67
Average \ \ \ \ \ \ \ 849.33 2,548 93.33 7.68
Disclaimer/Publisher’s Note: The statements, opinions and data contained in all publications are solely those of the individual author(s) and contributor(s) and not of MDPI and/or the editor(s). MDPI and/or the editor(s) disclaim responsibility for any injury to people or property resulting from any ideas, methods, instructions or products referred to in the content.
Copyright: This open access article is published under a Creative Commons CC BY 4.0 license, which permit the free download, distribution, and reuse, provided that the author and preprint are cited in any reuse.
Prerpints.org logo

Preprints.org is a free preprint server supported by MDPI in Basel, Switzerland.

Subscribe

Disclaimer

Terms of Use

Privacy Policy

Privacy Settings

© 2026 MDPI (Basel, Switzerland) unless otherwise stated