
Submitted:
12 December 2024
Posted:
12 December 2024
You are already at the latest version
Abstract
Heat stress transcription factors (HSFs) play a critical role in orchestrating cellular responses to elevated temperatures and various stress conditions. While extensively studied in model plants, the HSF gene family in Betula platyphylla remains unexplored, despite the availability of its sequenced genome. In this study, we employed bioinformatics approaches to identify 21 BpHSF genes within the B. platyphylla genome, revealing their uneven distribution across chromosomes. These genes were categorized into three subfamilies: A, B, and C. Each characterized by conserved protein motifs and gene structures, with notable divergence observed between subfamilies. Collinearity analysis suggested that segmental duplication events have driven the evolutionary expansion of the BpHSF gene family. Promoter region analysis identified an array of cis-acting elements linked to growth, development, hormonal regulation, and stress responses. Subcellular localization experiments confirmed the nuclear localization of BpHSFA2a, BpHSFB1a, and BpHSFC1a, consistent with in silico predictions. RNA-seq and RT-qPCR analyses revealed tissue-specific expression patterns of BpHSF genes and their dynamic responses to heat stress, with qPCR validation highlighting a significant upregulation of BpHSFA2a under high-temperature conditions. In summary, this study provided a comprehensive characterization of the HSF gene family in B. platyphylla, laying a solid foundation for future functional studies. Particularly, BpHSFA2a emerges as a promising candidate gene for enhancing heat tolerance in B. platyphylla, warranting further detailed investigation.
Keywords:
Betula platyphylla
; heat stress transcription factor
; subcellular localization
; high temperature stress
; gene expression
1. Introduction
Plants frequently face numerous abiotic stresses in their surroundings, including conditions like heat, drought and heavy metals stress throughout in their life cycle [1,2]. These environmental factors can negatively influence various aspects of plant health, encompassing growth rates, organ development, yield, and overall quality [3]. Over the course of their extensive evolutionary history, plants have developed a sophisticated transcriptional regulatory system to tackle external challenges, which includes a network governed by Transcription Factors (TFs). These factors are essential regulatory components within cells, overseeing gene transcription levels, engaging in cell differentiation, and mediating responses to environmental stimuli [4]. Transcription factors play a pivotal role in managing both abiotic and biotic stressors, including families such as NAC [5], TCP [6], Dof [7], GATA [8], bHLH [9], GRAS [10], and ERF [11], among others. Notably, HSF has been recognized as a key regulator in stress responses. Among various abiotic stressors, high temperature stress (HS) stands out due to its considerable adverse impact on plants [12,13,14]. Heat stress transcription factors represent a distinct class that becomes activated when plants endure increased temperatures. These activated factors can attach to specific DNA sequences known as Heat Shock Response Elements (HSE), which triggers the transcription of heat shock protein genes, aiding in the protection of plant cells against environmental stressors [15]. Investigating HSF is integral to developing new plant varieties capable of withstanding abiotic stress. In light of the growing global greenhouse effect and the rapid escalation of surface temperatures on Earth, understanding the mechanisms of HSF tolerance to abiotic stress is vital for the selection and breeding of heat-resistant species.
Similar to many transcription factors, the HSF family exhibits a modular architecture. While there is considerable variation in their sequences and sizes, the patterns of promoter recognition are highly conserved across eukaryotes. As illustrated in Figure 1A, the five key structural domains of HSFs include: the DNA-binding domain (DBD), the oligomerization domain (OD), the nuclear export signal (NES), the nuclear localization signal (NLS), and the C-terminal transcriptional activation domain (CTAD) [16]. The DBD, located near the N-terminus, is the most conserved region among HSFs and consists of approximately 100 amino acids, which form a hydrophobic core through three α-helices and four β-strands. This domain contains a conserved Helix-Turn-Helix (HTH) motif, a hallmark of catabolic activating proteins, which enables HSFs to bind specifically to Heat Shock Elements (HSEs: 5'-AGAAAnnTTCT-3'), thus modulating the expression of heat stress-responsive genes [17]. The OD domain, present in all HSFs, plays a critical role in oligomerization. It contains two hydrophobic heptapeptide repeat regions, HR-A and HR-B, each forming a characteristic leucine zipper structure. Under heat stress, HSFs oligomerize into homotrimers via this helical structure, facilitating their binding to HSEs and regulating heat stress responses [18]. The OD structure is also pivotal in classifying HSF family members [19]. Based on sequence homology and structural features of the OD, plant HSFs are categorized into three evolutionarily conserved classes: A, B, and C. Classes A and C feature a compact HR-A/B region, whereas class B HSFs exhibit a similar region but lack the amino acid insertions between HR-A and HR-B present in classes A and C—21 and 7 amino acids, respectively [20]. Most HSFs also contain both a nuclear localization signal (NLS) and a nuclear export signal (NES) at the C-terminus. The NLS, adjacent to the C-terminus of the OD, is enriched in basic amino acids such as lysine and arginine, facilitating nuclear entry. Some HSFs additionally possess a leucine-rich NES, which mediates protein export from the nucleus. Together, the NLS and NES work synergistically to regulate the subcellular distribution of HSFs between the nucleus and cytoplasm [21]. The CTAD, located at the C-terminus, is the least conserved region of HSFs and contains a short AHA motif composed of aromatic, hydrophobic, and acidic amino acids [16]. Although less conserved, the CTAD plays a crucial role in transcriptional activation. The AHA motif specifically enables class A HSFs to function as transcriptional activators, while class B and C HSFs, which lack this motif, generally do not exhibit transcriptional activation activity [22].
The Heat Shock Factor (HSF) family of transcription factors consists of highly conserved genes found across both eukaryotes and prokaryotes. The first HSF gene was identified and cloned in Saccharomyces cerevisiae [23], followed by the discovery of the first plant HSF in tomato [24]. With the advent of high-throughput sequencing technologies, an increasing number of HSF genes from diverse species have been characterized, including Arabidopsis thaliana [25], rice [26]and poplar [27]. These studies have revealed that HSF genes play critical roles in regulating plant growth, development, and responses to environmental stress [28]. For instance, the quadruple mutant of Arabidopsis thaliana (hsfa1a/b/d/e) exhibited severely impaired development, underscoring the pivotal role of HSFA1 in regulating plant growth and development [29]. Similarly, AtHSFA4c has been implicated in root development, with mutations in this gene leading to a reduction in lateral root formation in Arabidopsis thaliana [30]. AtHSFA2 modulates plant development in response to AtABI3 and is essential for seed development [31]. Over-expression of the sunflower HSFA9 gene in tobacco resulted in a substantial accumulation of heat shock proteins (HSPs), enhancing seed longevity and improving the water retention capacity of nutrient organs [32]. The HSFB2a and HsfB2b genes play crucial roles in the development of Arabidopsis thaliana hypocotyls [33,34], while AIHSFB1 accelerates senescence by repressing genes involved in growth and photosynthesis; conversely, its repression promotes growth and delays senescence [35]. In contrast, PpHSF5 in peach has been identified as a potential inhibitor of both root and aerial organ development [36]. These findings collectively suggest that HSFs are integral to the regulation of plant growth and development. High temperature is one of the most common abiotic stresses and a major focus of HSF-related research in stress physiology. The HSFA subfamily plays a central role in the heat stress response [37]. Tomato was the first plant to undergo detailed research on heat stress transcription factors, and overexpression of SlHsfA1 resulted in significantly improved heat tolerance compared to SlHsfA1-silenced plants. Similarly, SlHsfB1 has been shown to enhance heat resistance in tomato [38]. In Arabidopsis thaliana, HSFA6b not only contributes to the heat stress response but also functions as a positive regulator of ABA signaling, improving salt and drought tolerance [39]. Overexpression of HsfA2 in Arabidopsis confers enhanced tolerance to multiple environmental stresses, while knockdown of the gene reduces both basal and acquired thermotolerance as well as tolerance to oxidative stress [40]. In Capsicum annuum, the overexpression of CaHsfA2 [41], as well as the GmHsf-34 gene in soybean [42], significantly increased tolerance to drought and heat stress in Arabidopsis thaliana. Furthermore, heterologous expression of CsHsfA2 in tea plants enhanced the heat tolerance of transgenic yeast [43]. Recent studies have shown that transient expression of 35S: Gooseberry LcHsfA2a in seedlings resulted in significantly lower levels of hydrogen peroxide (H2O2) and enhanced heat tolerance following heat stress [44]. These studies highlight the diverse and essential roles of HSFs in plant stress responses. It is important to note that even within the same species, HSFs can exert markedly different, and sometimes opposing, effects on plant physiology. For example, in tomato, HSFB1 acts as a co-factor with HSFA in the heat stress response, while in Arabidopsis thaliana, AtHSFB1 inhibits the activities of AtHSFA2 and AtHSFA7 [45]. These findings uncover the diversity of HSF gene functions across different plant species, suggesting that the precise roles of individual HSFs need to be thoroughly investigated.
B. platyphylla, a deciduous tree belonging to the genus B. platyphylla in the Betulaceae family, is renowned for its environmental adaptability. This species is particularly well-suited for forest restoration in areas impacted by logging or wildfires due to its resilience. Its wood is highly valued in the production of plywood, furniture, and premium-quality paper [46]. While B. platyphylla is generally considered a hardy tree, it faces significant challenges posed by high summer temperatures. Since 1980, the growth of B. platyphylla has been increasingly affected by rising global temperatures. If current trends in global warming persist or intensify, the species' growth and development may face even greater constraints [47]. Given these challenges, exploring the heat tolerance mechanisms of B. platyphylla and enhancing its heat resilience through molecular breeding techniques has become a critical area of research. The recent release of the B. platyphylla genome sequence offers a valuable resource for studying the HSF (Heat Shock Factor) gene family [48]. Using bioinformatics approaches, 21 members of the HSF gene family were identified in B. platyphylla. Their fundamental characteristics were systematically analyzed, including protein multiple sequence alignment, gene structure, conserved domains, phylogenetic relationships, chromosomal distribution, intraspecific and interspecific collinearity, promoter cis-acting elements, and subcellular localization. Expression profiles of BpHSF genes were examined across different tissues (roots, stems, and leaves) and under high-temperature stress. Furthermore, qRT-PCR analysis revealed the expression patterns of genes with significant upregulation under heat stress. The results presented here provide a robust theoretical foundation for advancing the functional exploration of BpHSF genes in B. platyphylla.
2. Results
2.1. Identification and Physicochemical Characterization of the BpHSF Gene Family
Two complementary methods, namely two-way BLAST comparison and Hidden Markov Model (HMM) analysis, were utilized to characterize the HSF gene family in Betula platyphylla. The BLAST analysis identified 27 candidate proteins, while the HMM analysis identified 25. Functional domain verification using SMART software was then performed, excluding proteins lacking or exhibiting incomplete conserved domains. By intersecting the results from both methods, a final set of 21 unique HSF family proteins was identified. These proteins were designated as BpHSF, with the prefix "Bp" representing B. platyphylla, and were further named BpHSFA1a to BpHSFC1c based on their phylogenetic relationships with known Arabidopsis thaliana HSFs. Detailed information, including the physicochemical properties of the 21 BpHSF proteins, is presented in Table 1. The lengths of the BpHSF proteins ranged from 117 amino acids (BpHSFC1c) to 577 amino acids (BpHSFA3), with molecular weights varying from 18.69 kDa (BpHSFC1c) to 64.05 kDa (BpHSFA3). The theoretical isoelectric points (pI) spanned from 4.34 (BpHSFC1c) to 8.78 (BpHSFB1a). Notably, except for BpHSFB1a, BpHSFB4a, BpHSFB4b, and BpHSFB2c, all BpHSF proteins were classified as acidic (pI< 7). The average hydrophilicity values of the BpHSF proteins were negative, indicating a predominantly hydrophilic nature. Additionally, the average instability index of these proteins was calculated to be 55 (above the threshold of 40), suggesting they are likely to be unstable. Subcellular localization predictions revealed that all BpHSF proteins are localized within the nucleus.
2.2. BpHSF Protein Multiple Sequence Comparison
The HSF gene family protein sequences exhibited five characteristic conserved domains arranged sequentially from the N-terminus to the C-terminus: DBD, OD, NLS, AHA, and NES. Evidently, the DNA-binding domain (DBD) remains the most conserved, with all DBD regions sharing a secondary structure comprising three α-helices and four β-sheets. Variations in insertions or deletions are observed across these sequences. For instance, an 8-amino acid insertion is present in BpHSFB1a between α1 and β1(Figure 1B). Additionally, substantial amino acid deletions were identified in BpHSFC1b and BpHSFC1c. Consequently, these deletions may render certain biological functions inactive in B. platyphylla species.
2.3. Chromosomal Localization of BpHSF Genes
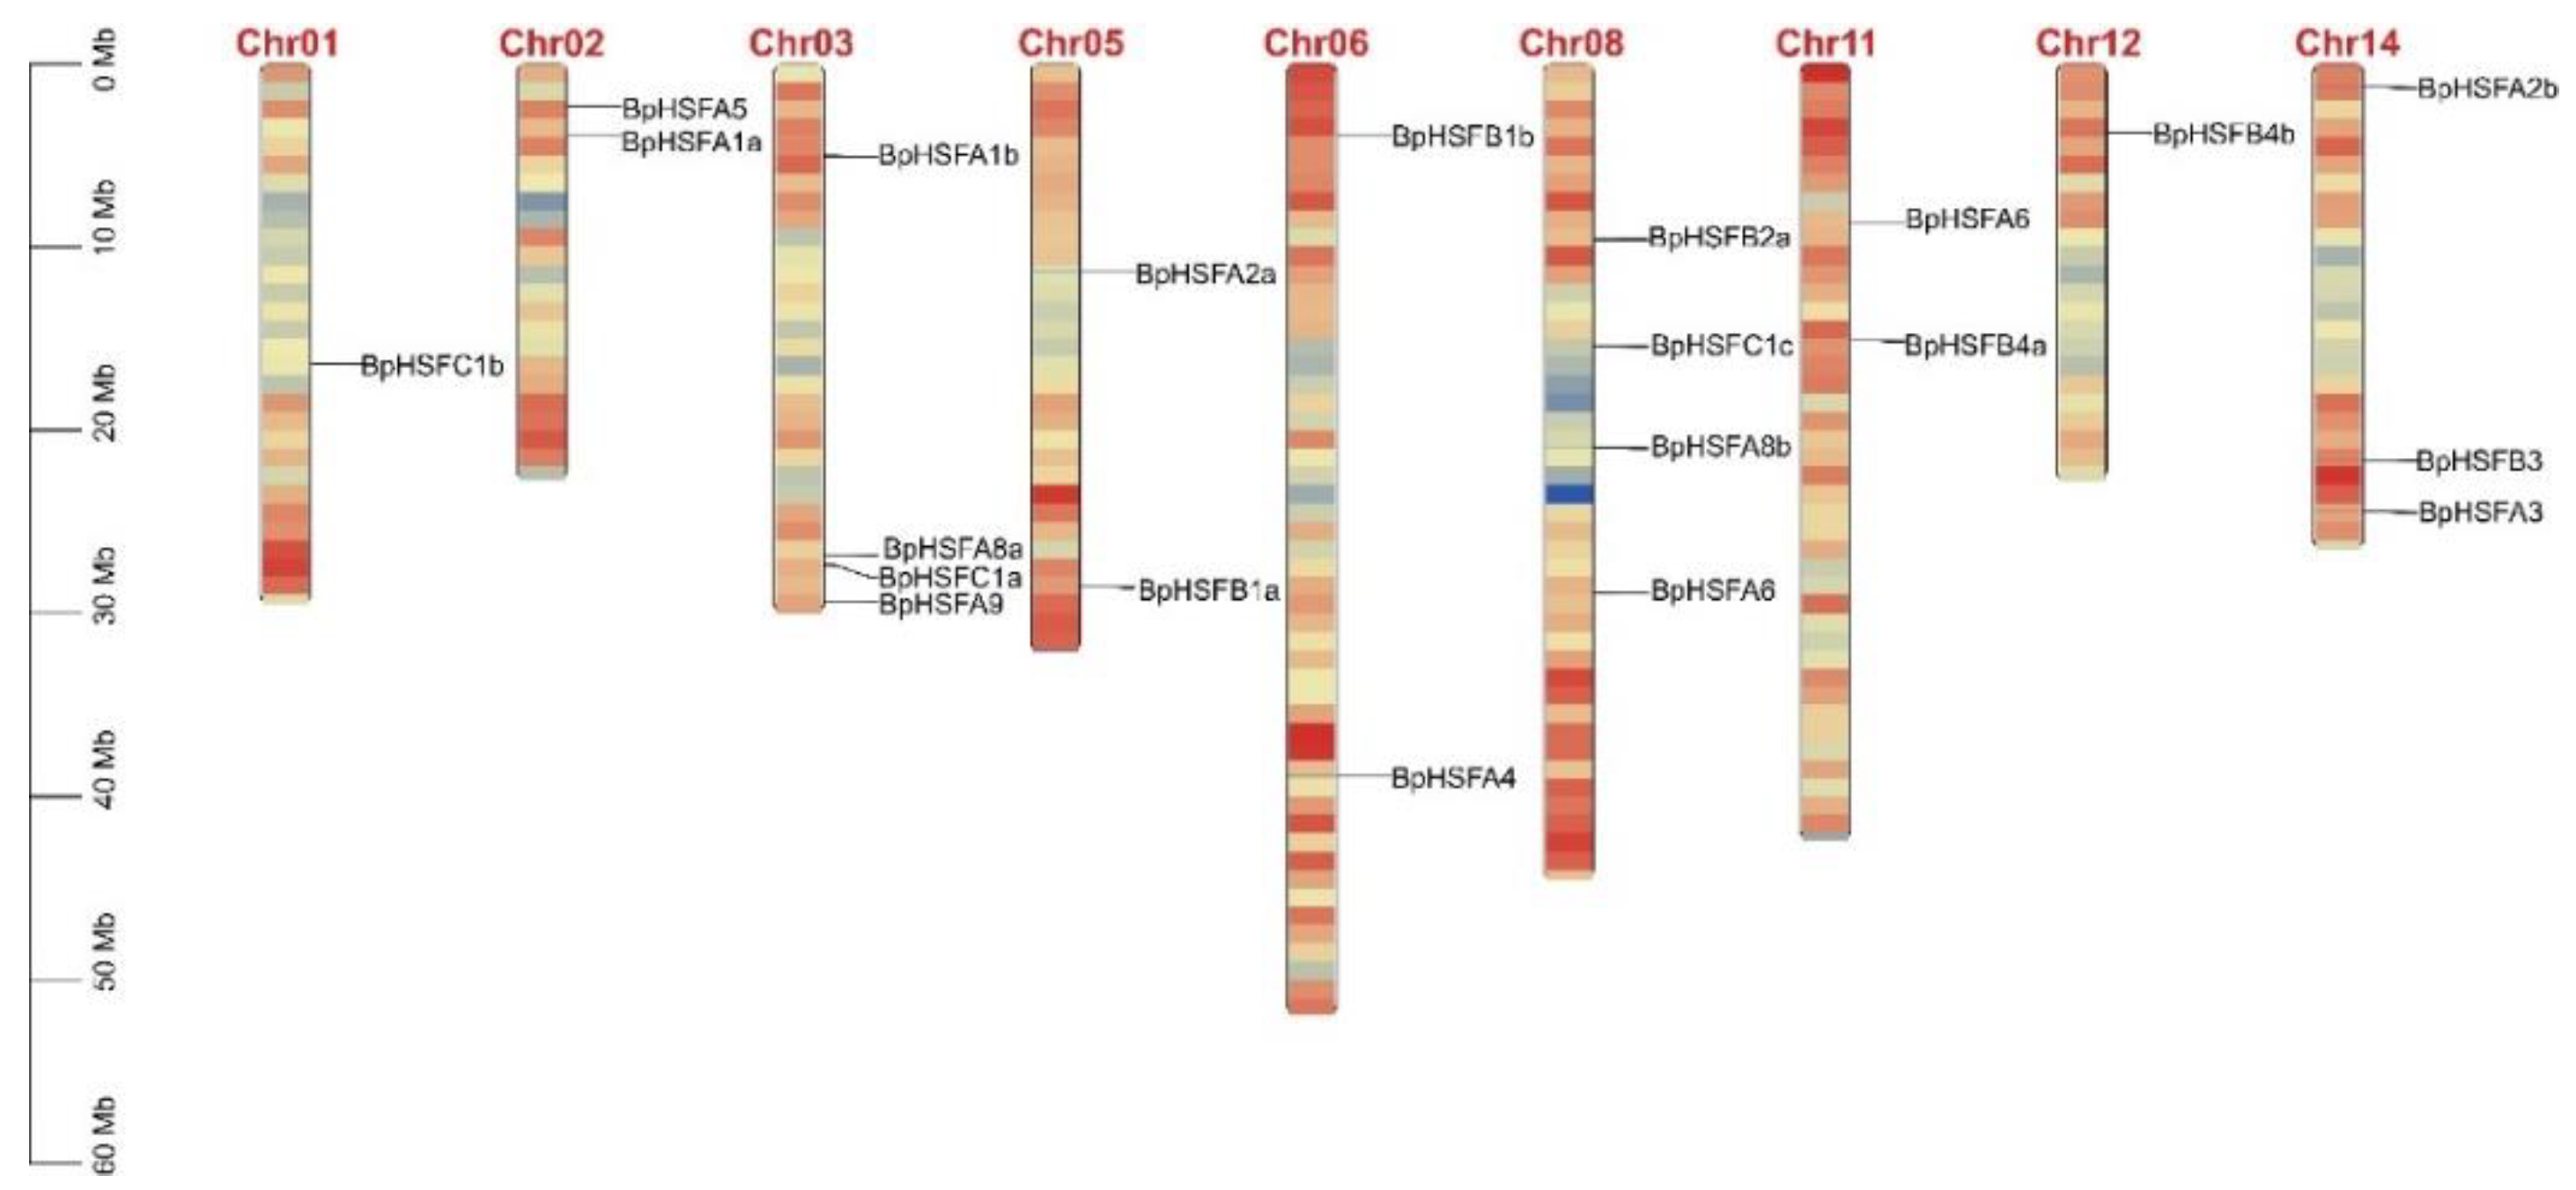
Chromosomal localization analysis revealed that the 21 BpHSF genes exhibit distinct distribution patterns across 14 chromosomes, with no BpHSF genes detected on chromosomes 4, 7, 9, and 10 (Figure 2). The gene counts vary among chromosomes, with chromosomes 3 and 8 containing the highest number of BpHSF genes, each hosting four genes. Specifically, BpHSFA9, BpHSFA1b, BpHSFA8a, and BpHSFC1 were located on chromosome 3, while BpHSFA8b, BpHSFA2b, BpHSFB2a, and BpHSFC1c were mapped to chromosome 8. In contrast, chromosomes 1 and 12 harbored only a single BpHSF gene, representing the lowest gene count observed.
Figure 2.
Chromosomal localization of the BpHSF gene. B. platyphylla has 14 chromosomes. Scale bars are in Mb, and chromosome numbers are shown above the corresponding chromosomes. Chr: Chromosome.
Figure 2.
Chromosomal localization of the BpHSF gene. B. platyphylla has 14 chromosomes. Scale bars are in Mb, and chromosome numbers are shown above the corresponding chromosomes. Chr: Chromosome.
2.4. BpHSF Evolutionary Tree Analysis
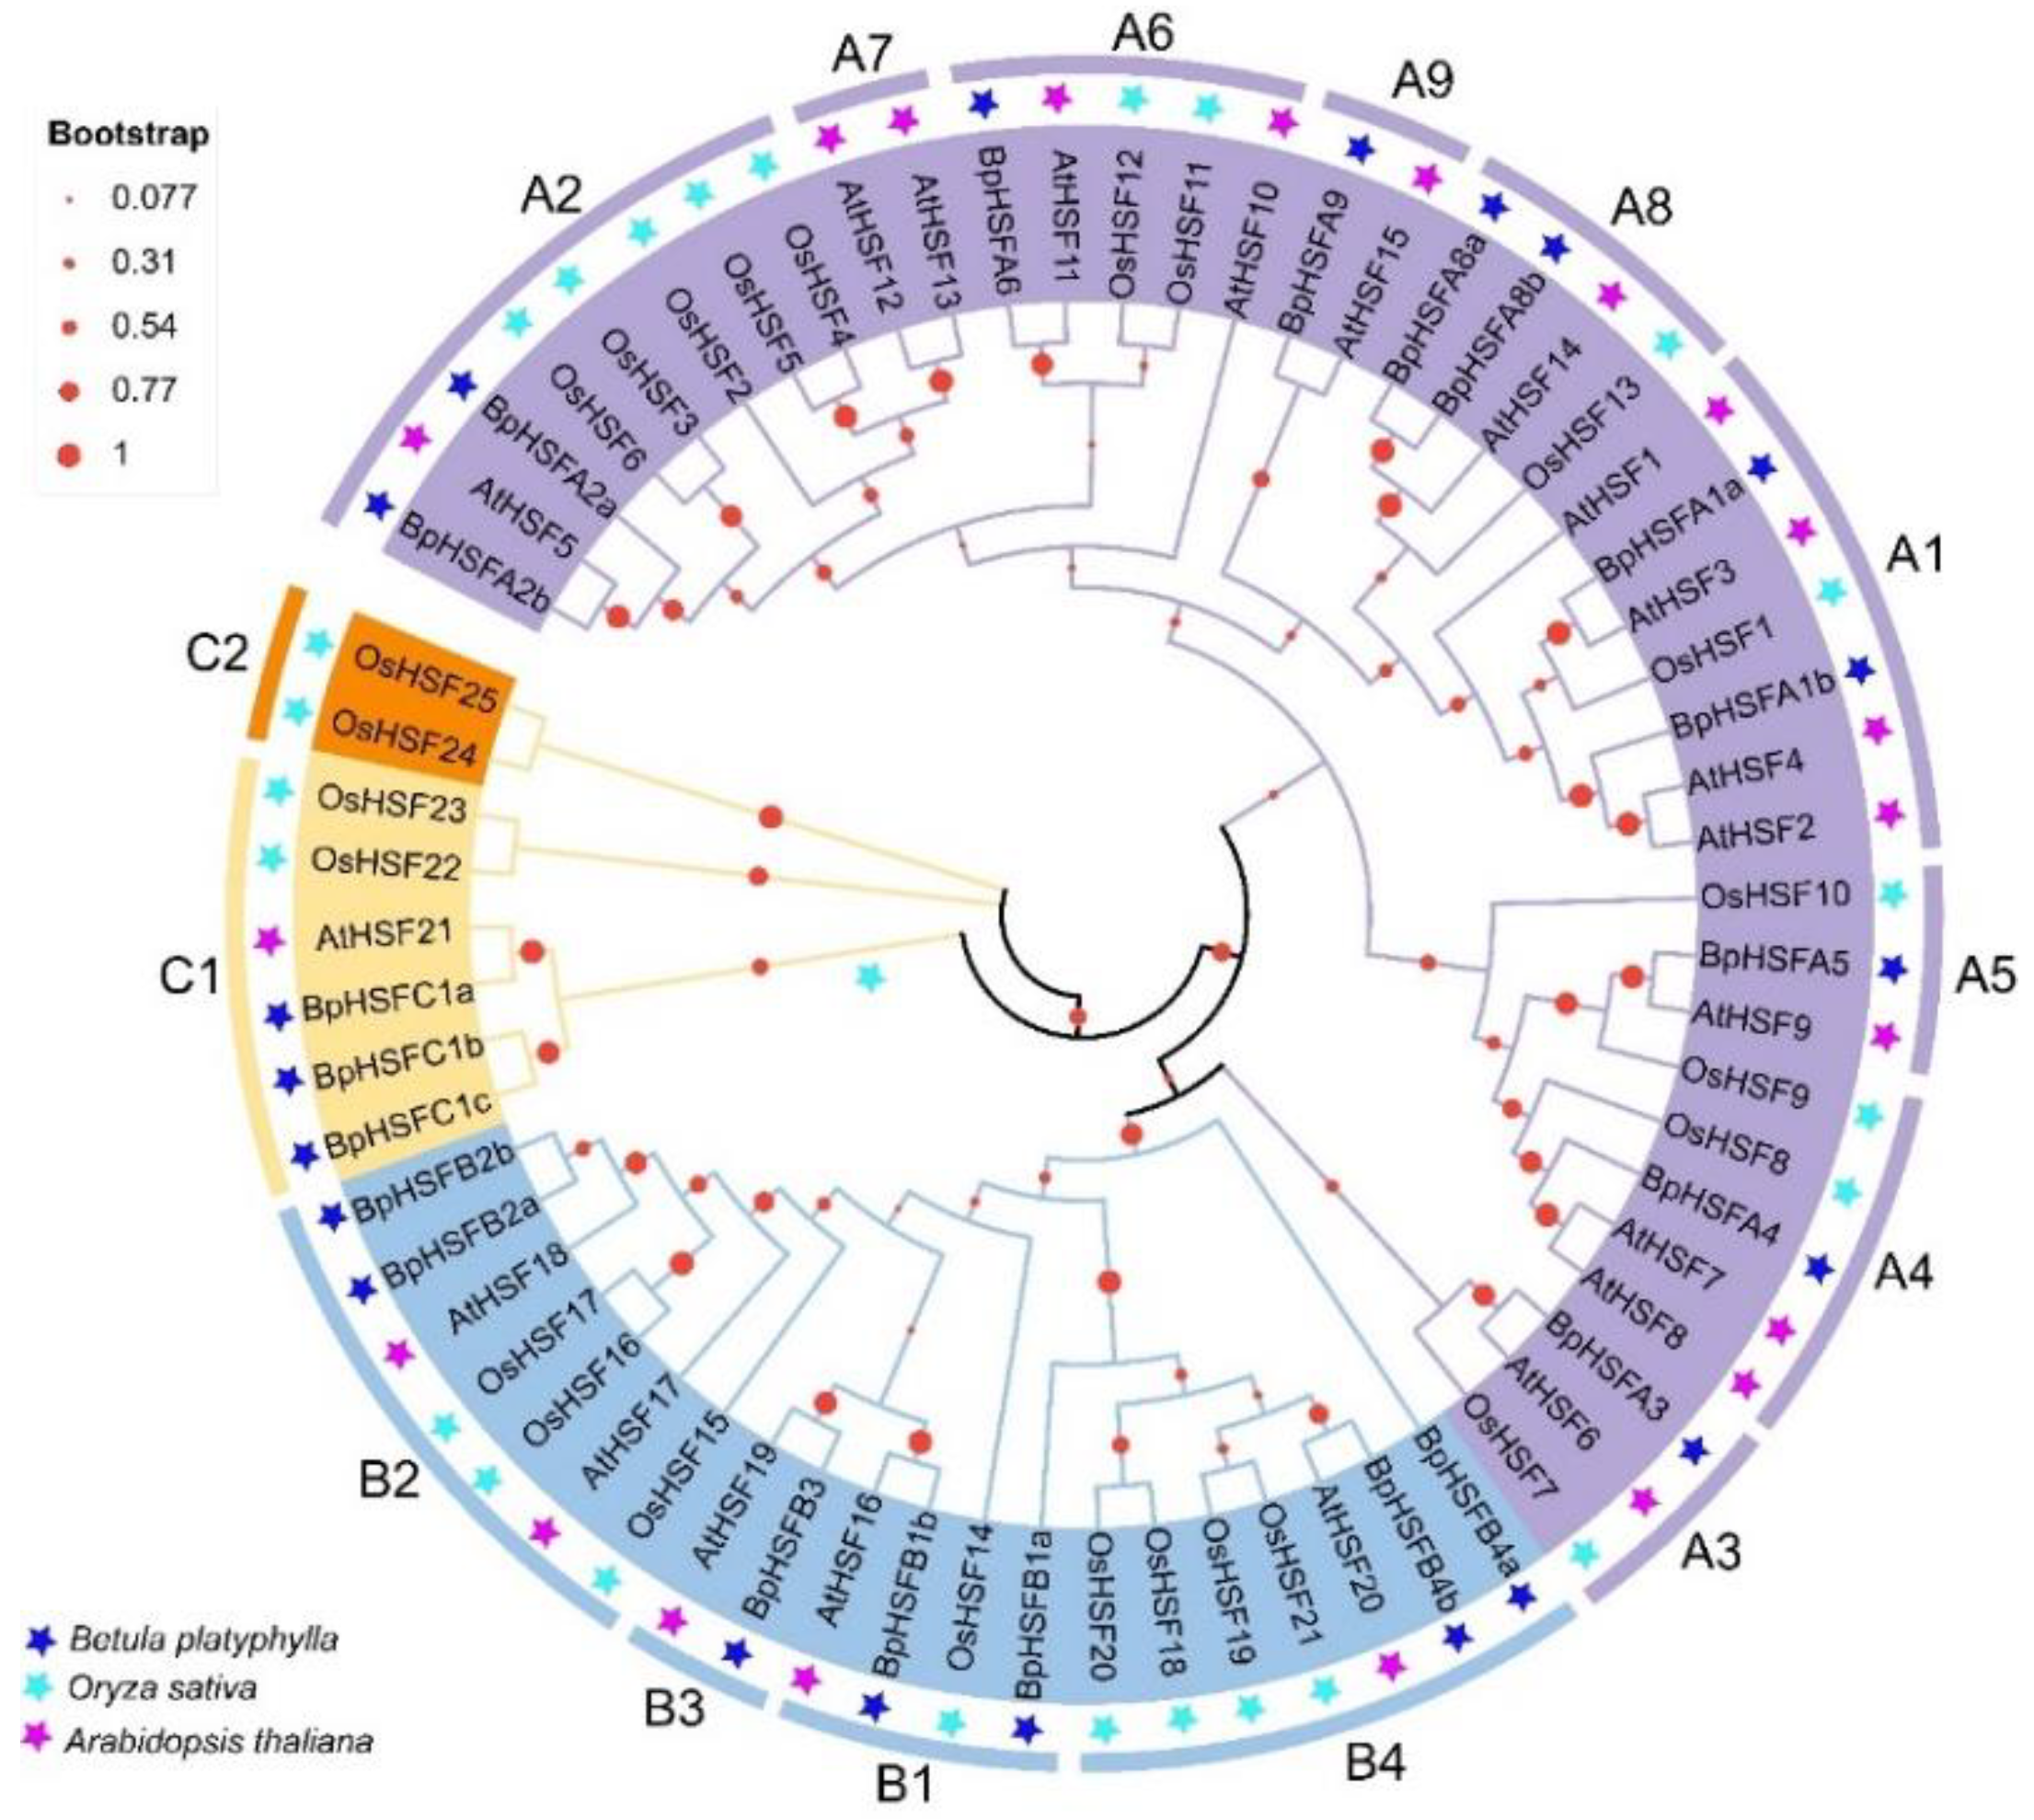
To investigate the evolutionary lineage of the HSF gene family in plants, HSF genes from B. platyphylla, Oryza sativa, and Arabidopsis thaliana were compared and analyzed phylogenetically using neighbor-joining phylogenetic trees. This analysis included 67 protein sequences: 21 from B. platyphylla, 25 from Oryza sativa, and 21 from Arabidopsis thaliana. The results classified BpHSF genes into three primary groups, corresponding to three subfamilies (A, B, and C) based on the classification systems of model plants Arabidopsis thaliana and tomato HSF protein families (Table S1). Subfamily A was further divided into nine subgroups (A1~A9), subfamily B into four (B1~B4), while subfamily C included C1 and C2. In B. platyphylla, subfamily A contained eleven BpHSF members, subfamily B contained seven, and subfamily C contained three. The distribution of genes across each subgroup varied, with no members of subfamily A7 detected in B. platyphylla. Additionally, the C2 subgroup appears unique to the OsHSF gene family in Oryza sativa.
Figure 3.
Phylogenetic analysis of BpHSF genes was conducted using HSF sequences from B. platyphylla (BpHSF), Arabidopsis thaliana (At), and Oryza sativa (Os). As a result different HSF classes are distinguished by pentagons in various colors, each representing a distinct class.
Figure 3.
Phylogenetic analysis of BpHSF genes was conducted using HSF sequences from B. platyphylla (BpHSF), Arabidopsis thaliana (At), and Oryza sativa (Os). As a result different HSF classes are distinguished by pentagons in various colors, each representing a distinct class.
2.5. Protein Motifs and Gene Structure of BpHSF Genes
The MEME tool was employed to identify potential motifs within the BpHSF family, revealing the presence of 10 conserved motifs, designated as motifs 1 through 10 (Figure 4B). Sequence details for each conserved motif were provided in Table S2, with the specific amino acid sequences represented by character strings at each position (Figure S1). Most motifs were approximately 50 amino acids in length, with BpHSFA3 displaying the longest sequence and BpHSFC1c the shortest. To further explore the structural diversity within the BpHSF gene family, a phylogenetic tree was constructed solely for BpHSF proteins, and their gene structures were analyzed (Figure 4A and 4C). Phylogenetic analysis revealed that BpHSF members within the same subfamily share similar motifs, whereas those from different subfamilies show distinct motif patterns, suggesting conservation in protein structure and potential function. In subfamily A, motif patterns were generally consistent, with the exception of BpHSFA8a, which lacks motif 8. Within subfamily B, both BpHSFA5 and BpHSFA4 contain motif 8, while other members exhibit a uniform motif structure. Strikingly, all BpHSF gene family members contain motif 4 and motif 1 universally, and all, except for BpHSFC1b and BpHSFC1c, also contain motif 2 in their amino acid sequences. Some motifs were unique to specific subfamilies: for instance, motifs 10 and 6 are exclusive to subfamily C, while motif 9, with an identical amino acid sequence, was found only in subfamily B.
Exon-intron structure analysis of the 21 BpHSF genes revealed that these genes contain between 1-6 exons and 1-5 introns, with the exception of BpHSFC1c in subfamily C, which lacks intron. The untranslated region (UTR) structure of the BpHSF genes was incomplete: six BpHSF genes possess both 5' UTR and 3' UTR sequences, while four genes (BpHSFA9, BpHSFB1a, BpHSFB4a, and BpHSFC1a) contained only a 5' UTR. While, 11 genes lack UTR sequences altogether.
2.6. Covarianceanalysis of BpHSF
To investigate the co-evolution of BpHSF family genes, we conducted a gene duplication analysis using MCScanX combined with TBtools-II. The analysis identified one tandem duplication pair (BpHSFA8a and BpHSFC1a) on chromosome 3 in the B. platyphylla genome (Figure 5). Additionally, four segmental duplication events were observed, involving the gene pairs BpHSFA1a/BpHSFA1b, BpHSFA6/BpHSFA2a, BpHSFA2b/BpHSFA9, and BpHSFB2a/BpHSFB2b. These findings suggest that gene duplication events have been crucial to the evolution and expansion of the BpHSF family, with segmental duplications particularly contributing to diversity and functional adaptation within the family.
To elucidate the evolutionary trajectory of the BpHSF genome, we conducted a comparative genomic analysis involving six representative species: four dicotyledons (Arabidopsis thaliana, potato, tomato, and poplar) and two monocotyledons (sorghum and Oryza sativa) (Figure 6). The results revealed syntenic relationships between the B. platyphylla genome and all six species, comprising 14 syntenic pairs with A. thaliana, 32 with poplar, 22 with tomato, 19 with potato, 11 with pineapple, and 8 with sorghum. Notably, B. platyphylla exhibited the highest number of collinear gene pairs with poplar (32 pairs), suggesting extensive gene exchange and a closer homologous relationship during their evolutionary history. Although synteny was observed across all representative species, the analyses demonstrated a pronounced trend of higher synteny with dicotyledons compared to monocotyledons, underscoring closer evolutionary affiliations among the dicot specie.
2.7. Analysis of BpHSF Promoter Cis-Acting Elements
Transcription factors are essential in mediating plant responses to biotic and abiotic stresses by regulating various cis-regulatory elements within gene promoter sequences. To explore the potential biological functions and regulatory network of BpHSF, we analyzed cis-regulatory elements within the promoter regions of BpHSF genes (spanning 2000 bp upstream of the start codon). This analysis identified a total of 533 cis-regulatory elements (Table S3), categorized into four groups: light response, stress response, hormone response, and growth and development response (Figure 8A). Light-responsive elements were the most prevalent, comprising 237 elements and accounting for 44.5% of the total, followed by hormone-responsive elements (208, or 39%). Growth and development-responsive elements were the least frequent, potentially indicating a more limited direct role for the BpHSF gene family in plant growth and development.
Evidently, a range of cis-regulatory elements were identified across the BpHSF genes, including the light-responsive G-box, the abscisic acid-responsive element (ABRE), the anaerobic-inducible element (ARE), the drought-inducible MYB-binding site (MBS), and low-temperature-responsive elements (LTRs). These findings suggest a pivotal role for the BpHSF gene family in various environmental stress responses (Figure 8B). However, no cis-elements directly associated with high-temperature responses were detected. Among the 21 BpHSF genes, four (BpHSFA1a, BpHSFA3, BpHSFB1a, and BpHSFB4b) contained more than 30 cis-regulatory elements each. Additionally, stress-responsive elements were particularly abundant in BpHSFB2a, BpHSFB4b, BpHSFA3, BpHSFB1a, and BpHSFA2, highlighting their potential roles in mediating plant responses to environmental challenges such as heat, salinity, and drought stress.
2.8. Secondary and Tertiary Structure Prediction and Subcellular Localisation of the BpHSF Protein
To further investigate the protein structures of BpHSF genes. The results showed that all of these proteins include α-helix, β-turn, irregular coil and extended chain, but the proportion of the secondary structure elements is variable, specifically, the proportion of irregular coil is the highest, varied from 31.12% to 59.1%, followed by α-helix (13.45% to 56.40%), and β-turn is the lowest ranging from 1.86% to 10.73%. α-helix accounted for a high percentage, which can predict that the protein has a high stability (Figure S2). Conserved structural domains of BpHSF proteins were visualized, six 3D structural models of BpHSF proteins were predicted (Table S4). The 3D structural models clearly showed the α-helical and β-folded structures of the DBD structural domains (Figure 9B). Further analysis revealed that BpHSF proteins of the same subfamily have similar three-dimensional structures. The tobacco transient expression analysis revealed that BpHSFA2a, BpHSFB1a and BpHSFC1a were localized within the nucleus (Figure 8B).
2.9. Expression of BpHSF Gene in Different Tissues and Its Response to High Temperature Stressf
The expression profiles of the 21 BpHSF genes were analyzed using the FPKM method based on transcriptome data from three tissues (roots, stems, and leaves) of B. platyphylla (Table S5, Figure 9A). The results revealed significant heterogeneity in the expression levels of BpHSF genes across different tissues, indicating that their expression is regulated in a tissue-specific manner. Conspicuously, three BpHSF genes (BpHSFA8a, BpHSFC1b, and BpHSFC1c) exhibited consistently low expression in all three tissues, suggesting their limited or nonessential roles in these tissues physiological processes. In contrast, other BpHSF genes displayed distinct tissue-specific expression profiles. For instance, BpHSFB1b and BpHSFB2a showed high expression in leaves, while BpHSFA2a, BpHSFA4, BpHSFA5, and BpHSFB1a were highly expressed in roots. Additionally, BpHSFA9, BpHSFA2b, and BpHSFA6 demonstrated elevated expression in stems. These differential tissue-specific expression patterns suggest that BpHSF genes may have important roles in the growth, development, and adaptive responses of B. platyphylla.
To further elucidate the potential roles of BpHSF genes in the heat stress response, we analyzed their dynamic expression patterns using previously acquired transcriptome data (Table S5, Figure 9B). Following 24 hours of heat stress, a subset of BpHSF genes, including BpHSFB2a, BpHSFB2b, BpHSFA2a, BpHSFA5, BpHSFB1b, BpHSFA9, BpHSFA2b, and BpHSFC1a, exhibited significant upregulation, strongly implicating these genes in the early response to high-temperature stress in Betula platyphylla. In contrast, the transcript levels of BpHSFC1c were undetectable, suggesting that this gene is either unresponsive to heat stress or not expressed in B. platyphylla leaves. As the heat stress persisted, several BpHSF genes initially upregulated, such as BpHSFA2a, BpHSFA2b, BpHSFB1b, and BpHSFC1a, underwent significant downregulation. Notably, the pronounced downregulation of BpHSFA2a may reflect an adaptive mechanism by which the plant conserves energy after the initial stress response. Meanwhile, a distinct group of BpHSF genes, including BpHSFA8a, BpHSFA1a, BpHSFA8b, and BpHSFA3, demonstrated marked increases in expression after seven days of continuous heat stress, suggesting their pivotal roles in regulating the late-stage heat stress response.
2.10. BpHSF Expression Validation Through qRT-PCR
Eight heat stress transcription factor genes (BpHSFB2a, BpHSFB2b, BpHSFA2a, BpHSFA5, BpHSFB1b, BpHSFA9, BpHSFA2b, and BpHSFC1a), identified as highly expressed under high-temperature conditions through transcriptome analysis, were further validated using qRT-PCR. The results (Figure 10) revealed that all eight genes reached peak expression levels after 24 hours of heat treatment, followed by varying degrees of decline as stress exposure elevated. Particularly, BpHSFA2a and BpHSFA2b showed significant up-regulation, at 24 hours. BpHSFA2a, in particular, exhibited an exceptional increase, being unregulated 80-100-fold compared to the control, but its expression rapidly returned to baseline levels after 48 hours, indicating a crucial role in the early stages of heat stress response. Further analysis indicated that members of the A subfamily (BpHSFA2a, BpHSFA2b, BpHSFA5, and BpHSFA9) had higher expression levels at 24 hours compared to those of the B and C subfamilies, suggesting an important role for A subfamily genes in the heat stress response. Conversely, BpHSFC1a, a member of subfamily C, exhibited the lowest expression level at 24 hours, being only 1-1.5-fold that of the control, implying a limited role in high-temperature response. These findings are consistent with transcriptomic data and provide a robust experimental foundation for understanding the regulatory dynamics of different HSF subfamilies under heat stress.
3. Discussion
HSFs are a class of transcription factors that play crucial roles in mediating plant responses to heat and various environmental stresses. The HSF gene family has been identified and analyzed in numerous terrestrial plant species. However, the number and composition of HSF gene families vary among species, likely reflecting differences in ecological adaptation, evolutionary history, and environmental stress response mechanisms. HSF gene families have been studied in different plants e.g, eggplant contains 24 SmHSFs [49], walnut has 29 JrHSFs [50], kale-type oilseed rape has 64 HSFs [51], while bread wheat has 78 HSFs [52], and wheat has 82 TaHSFs [53]. Despite these studies, the identification and characterization of the HSF gene family in B. platyphylla have not yet been reported. With the release of the B. platyphylla genome, we have now identified 21 BpHSF genes, which are unevenly distributed across 14 chromosomes. Interestingly, chromosome length did not necessarily correlate with the number of HSF genes. In angiosperms, the HSF gene family is divided into three subfamilies: A, B, and C. Subfamily A includes A1-A9, subfamily B includes B1-B5, and subfamily C contains C1. Based on gene structure and phylogenetic relationships, we classified the 21 BpHSF genes into three subfamilies: A, B, and C. Specifically, subfamily A contains 11 genes, subfamily B contains 7 genes, and subfamily C contains 3 genes. Although the total number of HSF genes in B. platyphylla is similar to that of Arabidopsis, differences were observed in the distribution of specific HSF subclasses. Crucially, the number of HSFA1 subclass members is higher in B. platyphylla, while no members of the HSFA7 subclass were identified. Additionally, there is only one member of the HSFA9 subclass, compared to four in chili pepper [41]. Subfamily C includes three members, of which two belong to class C2, consistent with findings in Oryza sativa (OsHSF) [54] and Minnan (PbHSF) [55], both monocotyledonous plants. Interestingly, the HSFB5 subclass was absent in all of the above studies, further supporting the accuracy of our identification of BpHSF genes in B. platyphylla. Analysis of the physiochemical properties of the proteins encoded by the BpHSF genes indicated that all of the proteins are hydrophilic and predominantly localized in the nucleus. This observation is consistent with findings in carnations [56,57] and turnips [58], suggesting a similar pattern of subcellular localization for HSF proteins.
The highly conserved DNA-binding domain (DBD) consists of approximately 100 amino acid residues across various plant species. Strikingly, the DBDs of BpHSFB1b, BpHSFC1a, and BpHSFC1b are shorter compared to other BpHSFs, possibly due to the genomic or genetic variation in B. platyphylla. Members of the same subfamily within the phylogenetic tree share consistent motif alignments, with motifs 1, 2, and 4 being present in nearly all BpHSFs. The similarity in motif composition among members of the same subfamily suggests that these proteins have conserved structural and functional roles, potentially sharing a common ancestor and being genetically more closely related. In plants, introns are crucial in regulating gene expression. While introns themselves do not encode proteins, they contribute to regulating gene expression, generating alternative mRNA isoforms, and influencing gene stability. Therefore, studying the structural features of BpHSF genes can provide deeper insights into their functions. Our analysis revealed that nearly all BpHSF genes contain between one and five introns, whereas BpHSFC1c lacks introns, which might imply a limited role in gene expression regulation. Additionally, BpHSF genes exhibit significant variation in the location and length of introns, suggesting functional divergence between subfamilies.In the prediction of three-dimensional structures, BpHSF proteins within the same subfamily manifested highly similar structural characteristics. These finding are consistent with studies of HSF genes in papaya [59] and poplar [60], which also showed similar motif compositions and tertiary structures. Previous studies have reported that most HSFs are localized in the nucleus, such as Rhododendron (RsHsf15, RsHsf16, and RsHsf19)[61], peanut (AhHsf20)[62], Salvia divinorum (SmHsf1 and SmHsf7) [63], wheat (TaHsfA2-10) [63], and buckwheat (FtHsf18 and FtHsf19) [65]. Consistent with these findings, our study demonstrated that BpHSFA1a, BpHSFB1a, and BpHSFC1 are all localized in the nucleus.
Studying gene duplication events and synteny relationships provides critical insights into the expansion, functional diversification, and evolutionary history of the BpHSF gene family. In the BpHSF gene family, only one tandem duplication event was identified, whereas five gene pairs exhibited segmental duplication events. These findings suggest that segmental duplication may have been the primary driver behind the expansion of the BpHSF gene family in B. platyphylla. A similar pattern has been observed in passion fruit [66] and hawthorn [67]. Covariance analysis among representative species revealed that B. platyphylla and Populus shared the highest number of covariant gene pairs (32), indicating frequent gene exchanges or shared genomic structures between these species during evolution. This evolutionary analysis of BpHSF genes provides an essential foundation for further functional and evolutionary studies. Cis-regulatory elements (cis-elements) in the promoter regions of gene family members are specific DNA sequences that regulate gene transcription by binding to transcription factors and other regulatory proteins, thereby precisely controlling the level and pattern of gene expression. Promoter analysis revealed that the promoter regions of BpHSF genes harbor different numbers and types of cis-elements, suggesting varied transcriptional regulation among these genes. The identified cis-elements include those responsive to stress, light, hormones, and growth and development, indicating the diverse regulatory roles of BpHSF genes. Interestingly, no heat shock elements (HSE) were detected in the BpHSF promoter regions, which aligns with findings in cannabis [68] and wild grape [69]. However, the presence of HSEs in the barley HSF gene family [70] suggests that the mechanism of HSF gene response to heat stress may vary among plant species. It remains unclear whether the expression of the BpHSF genes in B. platyphylla is directly regulated by heat stress, given the absence of typical HSE elements. Possibly the BpHSF genes responded to heat stress indirectly through other cis-elements. Therefore, further experimental studies are needed to verify the regulation of BpHSF gene expression under heat stress conditions and to elucidate potential alternative regulatory mechanisms involved in environmental stress responses.
Through RNA-seq analysis and qPCR validation, we observed that the BpHSF genes of B. platyphylla reached peak expression after 24 hours of high-temperature treatment, with subfamily A genes (e.g., BpHSFA2a and BpHSFA2b) showing particularly significant responses. Among them, BpHSFA2a exhibited the most pronounced response. These findings are consistent with previous studies in Camellia sinensis (tea tree) [43], Triticum aestivum (wheat) [71], and Capsicum annuum (chili pepper) [72], supporting the idea that HsfA subfamily genes play a crucial role in adopting plants to high-temperature stress by rapidly activating heat-responsive genes [73]. In addition, a recent study found that the transcription factor LpHSFA3, acting as a positive regulator of LpHSFA2a, enhances the heat tolerance of perennial ryegrass [74]. Similarly, DcaHsfA2a and DcaHsfA2b in carnations have been identified as potential candidates for heat tolerance breeding [75]. Under high-temperature stress, Zea mays (maize) genes ZmHsf-01 (A2), ZmHsf-03 (B), ZmHsf-04 (A2), ZmHsf-23 (A6), ZmHsf-24 (A9), and ZmHsf-25 (B) also showed significant upregulation [76]. In soybean, overexpression of the GmHsf-34 (A2) gene increased heat tolerance in Arabidopsis thaliana [77]. While some studies have suggested HSFC1 as a key gene for enhancing plant tolerance to heat and fungicidal stress [78,79]. Our findings indicated that the response of BpHSFC1a was not significant under high-temperature conditions, which diverges from previous reports. For example, PeHSF-C1a in passion fruit has been reported to be involved in the heat stress response [80]. Studies in Populus and Arabidopsis thaliana [81,82] have shown that HSF genes are often activated within 15 to 30 minutes of high-temperature treatment; similarly, genes such as LcHsfA2a, LcHsfA2b, and LcHsfA3 are highly expressed in loblolly pine after just one hour of heat exposure [44]. In contrast, BpHSF genes in B. platyphylla reached their peak expression after 24 hours, suggesting that white birch may employ a unique adaptive mechanism that favors a sustained response to cope with prolonged high-temperature stress. In this study, we found that birch HSF genes exhibited diverse expression responses to high-temperature stress, similar to the signaling and biological processes observed in most plants under heat stress. Thus, the HSF gene family plays an important role in coordinating plant responses to high-temperature stress, acting as a key component of stress signaling (Figure 11).
When ambient temperatures rise to approximately 40°C, intra-cellular calcium ion (Ca²⁺) levels increase, allowing Ca²⁺ to enter the cell and bind to calmodulin (CaM), forming the Ca²⁺/CaM complex. This complex activates various downstream responses, including reactive oxygen species (ROS) signaling and the activation of transcription factors (TFs). Under heat stress, protein denaturation leads to the dissociation of HSF from heat shock proteins (HSPs), resulting in HSF activation. Activated HSF binds to heat shock elements (HSEs) in gene promoters, initiating the expression of HSPs. HSPs assist cells in resisting protein denaturation, maintaining protein stability and function, thereby protecting cells from heat-induced damage. The accumulation of HSPs, along with other stress responses (e.g., ABA-induced stomatal closure), collectively enhances plant tolerance to high-temperature stress, promoting structural and functional regulation and improving overall stress resilience
4. Materials and Methods
4.1. BpHSF Gene Family Identification and Characterization
The complete genome and gene annotation (gff3) file of B. platyphylla were downloaded from Phytozome and analyzed using TBtools-II software [86]. These sequences were compared using TBtools-II, and a bidirectional BLAST search was performed against the full gene sequence database of B. platyphylla, applying a filtering threshold of E ≤ 10⁻⁵. The resulting sequences were considered as potential HSF family members in B. platyphylla.Simultaneously, the Hidden Markov Model (HMM) file for HSF(Pfam no.PF00447) was obtained from the InterPro(https://www.ebi.ac.uk/interpro) database, and HSF-related sequences were screened using HMMER 3.0 software to identify those containing HSF structural domains within the B. platyphylla genome. Protein sequences from B. platyphylla were similarly screened for HSF domains using the Hidden Markov Model. Candidate protein sequences from both methods were refined by removing duplicates and incomplete sequences. The remaining sequences were intersected using Venn plots in TBtools-II. Finally, functional structural domains were verified using the SMART online tool (http://smart.embl-heidelberg.de/), and sequences with missing or incomplete domains were excluded. As a result, 21 B. platyphylla HSF transcription factor family members were identified.The structural and physicochemical properties of the B. platyphylla HSF transcription factor proteins were analyzed using the Expasy ProtParam(https://web.expasy.org/protparam/) tool, which provided information on the number of amino acids(AA), molecular formula(MF), molecular weight(MW), theoretical isoelectric point (pI), , instability index(II), aliphatic index(AI), and Grand average of hydropathicity(GRAVY). Subcellular localization (SL)prediction of the B. platyphylla HSF transcription factor gene family using the online tool WoLF PSORT (https://wolfpsort.hgc.jp/?utm_source=chatgpt.com).
4.2. Multiple Sequence Alignment, Chromosomal Localization and Phylogeny
CLUSTALW(https://www.genome.jp/tools-bin/clustalw) Perform multiple sequence alignment on the BpHSF protein and visualize the structural domains of the BpHSF protein sequence using Jalview software. In order to generate a chromosome map of the HSF gene family in birch, TBtools II software was used to integrate the GFF3 file of birch with the BpHSF gene ID obtained through comparison. ClustalW using default parameters(https://www.genome.jp/tools-bin/clustalw) Multiple sequence alignment was performed on the full-length HSF amino acid sequences of birch, rice, and Arabidopsis Then, MEGA11 software was used for phylogenetic analysis, and the neighbor connection (NJ) method was applied for 1000 guided replicates. A phylogenetic tree generated using iTOL visualization(https://itol.embl.de/).
4.3. BpHSF Conserved Motif Prediction and Gene Structure Analysis
The conserved motifs of gene families were predicted using MEME software (http://memesuite.org/tools/meme) with the motif parameter set to 10, and the MAST XML output file was downloaded for visualization using TBtools-II. The B. platyphylla HSF gene sequences and their corresponding mRNA sequences were extracted, and the exon-intron structures were analyzed and visualized using the GSDS tool (http://gsds.cbi.pku.edu.cn/) [87].
4.4. Analysis of BpHSF Covarianceand Cis-Acting Elements
To investigate the evolutionary expansion and selective pressure acting on the B. platyphylla HSF gene family, gene covariance analysis was conducted. Tandem duplication events among B. platyphylla HSF genes were identified using TBtools-II and MCScanX tools. Subsequently, segmental duplication events and inter-species gene covariance were analyzed using TBtools-II, MCScanX, and BLASTP.
Promoter regions, defined as 2 kb upstream of the transcription start site of all BpHSF genes, were extracted using TBtools-II and submitted to the PlantCARE database (https://bioinformatics.psb.ugent.be/webtools/plantcare/html/) for cis-acting element analysis. All cis-elements in the promoter regions were screened, analyzed for redundancy, and those with significant functional importance were selected and visualized using TBtools-II.
4.5. BpHSF Protein Structure Prediction and Subcellular Localization
SOPMA (https://npsa-prabi.ibcp.fr/cgi-bin/npsa_automat.pl?page=npsasopma.html) is used for protein secondary structure prediction, using default parameters. The SWISS-MODEL database (https://swiss model.expasy.org/) was used to predict the tertiary structure of proteins by homology modeling.
To analyze subcellular localization, transient expression assays were performed in tobacco. Tobacco plants were grown for 4-5 weeks under conditions of 14 h light/10 h dark, 25°C, and 70% relative humidity. Full-length CDSs of BpHSFA2a, BpHSFB1a, and BpHSFC1a were amplified from B. platyphylla leaf cDNA, using primers detailed in Table S6, and cloned into the pCAMBIA2300-eGFP vector. The resulting expression plasmids were transformed into Agrobacterium tumefaciens strain GV3101, with appropriate antibiotics added during culture. The constructed Agrobacterium was then injected into leaves of Nicotiana benthamiana, with the pCAMBIA2300-eGFP empty vector serving as a control. Following injection, tobacco plants were kept in darkness for 12 hours before being transferred to normal light conditions. After 40 hours, fluorescence in the injected areas was observed using a laser confocal microscope (Olympus FV1200), and images were captured. The imaging data were subsequently processed using Adobe Photoshop 2024.
4.6. Plant Materials and Treatments
The experiment was conducted at the field base of Fujian Agriculture and Forestry University. Healthy B. platyphylla seeds were first selected,then soaked, and germinated before being sown in 12-hole seedling trays filled with specialized seedling substrate. The seedlings were kept moist by daily moderate watering to maintain optimal substrate moisture for approximately two weeks. The B. platyphylla seedlings were subsequently grown in a greenhouse at 25°C, with a relative humidity of 60-70%, a photoperiod of 16 h light/8 h dark, and regular moderate watering. After 24 weeks, uniformly grown plants were transplanted from seedling trays and acclimated in Hoagland nutrient solution for one week.
High-temperature stress treatment was conducted using a multi-chamber, multi-temperature gradient thermostat incubator (model: MTI-201B/202B, five chambers, 31 L per chamber). Samples of B. platyphylla roots, stems, and leaves were collected at room temperature (25°C). For the high-temperature treatment, the temperature was set to 40°C, with a humidity of 65% light intensity of 100-110 µmol/(m²·s), and sampling time points at 0, 12, 24, and 48 hours. B. platyphylla leaves collected at 0 h served as the control group. All samples were immediately frozen in liquid nitrogen and stored at -80°C for further analysis. Each treatment was performed in three biological replicates, with 12 B. platyphylla seedlings randomly selected per replicate.
4.7. Expression Profiles Based on RNA-Seq Data
Publicly available Betula platyphylla RNA-seq raw sequencing data were obtained from the NCBI Sequence Read Archive (SRA), including roots (accession no. SRR8953232), stems (accession no. SRR8953231), leaves (accession no. SRR28840994), and samples subjected to high-temperature conditions (accession no. SRP361895) at time points of 6 h, 24 h, 2 days, 7 days, and 14 days, with 0 h (25°C) serving as the control. The raw sequencing data were initially filtered using Fastp v0.23.1.[88] with default parameters to obtain clean data for subsequent analysis. The filtered data were then aligned to the B. platyphylla genome using Hisat2 v2.1.0 [89]. Transcript quantification for each sample was performed using featureCounts v2.0.3 [90]. Gene expression was calculated as the FPKM value for each BpHSF member, log2 transformed, and then visualized as a heatmap using the pheatmap package in R software.
4.8. RNA Extraction and Quantitative Real-Time PCR Analysis
Total RNA was extracted from each tissue sample using the RNA prep PureTotal RNA Extraction Kit for Polysaccharide-Polyphenol Plants (DP441). The RNA was then reverse-transcribed into cDNA using the HiScript III 1st Strand cDNA Synthesis Kit (+gDNA wiper). Primers for RT-qPCR were designed using Primer3Plus (https://www.primer3plus.com) to target eight highly expressed BpHSF genes (BpHSFB2a, BpHSFB2b, BpHSFA2a, BpHSFA5, BpHSFB1b, BpHSFA9, BpHSFA2b, and BpHSFC1a), with all the primer sequences listed in Table S6. 18S rRNA and α-Tubulin were used as internal reference genes [91]. The RT-qPCR reaction mixture consisted of 7 µL ddH₂O, 1 µL cDNA, 2 µL specific primers, and 10 µL SYBR Premix Ex Taq™ II. The RT-qPCR cycling conditions were as follows: pre-denaturation at 95°C for 30 s, followed by denaturation at 95°C for 5 s, annealing at 60°C for 30 s, amplification at 95°C for 5 s, annealing at 60°C for 60 s, and a melting curve analysis (95°C for 5 s, 60°C for 60 s, and 50°C for 30 s). The relative expression levels of BpHSF genes were calculated using the 2⁻ΔΔCT method [92]. Statistical analyses were performed using one-way ANOVA followed by Duncan's multiple comparison test in SPSS 22.0 software. Graphical representation of data was carried out using GraphPad Prism 10.0.
5. Conclusions
In this study, 21 BpHSF genes were identified in Betula platyphylla, with an uneven distribution across the chromosomes. Comprehensive analyses were performed on the BpHSF genes and their encoded proteins, encompassing phylogenetic classification, conserved motifs, gene structures, subcellular localization, synteny relationships, cis-acting regulatory elements, and expression profiles. The findings revealed dynamic, tissue-specific expression patterns of BpHSF genes. Significantly, the expression levels of BpHSFA2a, BpHSFA2b, BpHSFB1b, and BpHSFC1a were significantly upregulated under high-temperature stress, with BpHSFA2a exhibiting the highest expression after 24 hours of heat treatment. These results suggest that BpHSFA2a plays a pivotal role in the heat stress response of B. platyphylla. We propose that BpHSFA2a functions as a key regulatory gene, contributing to an effective defense mechanism that enhances heat tolerance. Consequently, BpHSFA2a emerges as a promising candidate for improving high-temperature stress resilience in B. platyphylla.
Supplementary Materials
The following supporting information can be downloaded at the website of this paper posted on Preprints.org.
Author Contributions
Conceptualization, H.W.; Data curation, X.L.; Formal analysis, Z.X., H.Y., Q.L., Z.Z. and Xiaomin Liu; Funding acquisition, S.C. and K.W.; Investigation, H.Y. and S.W.; Methodology, S.G.and S.W.; Project administration, S.C.and K.W.; Resources, H.Y. and H.L.; Software, Q.L.; Supervision, K.W.; Validation, H.W. and H.F.; Visualization, H. C.and Z.X.; Writing – original draft, S.G. and H.C.; Writing – review & editing, S.G., S.C. and K.W. All authors have read and agreed to the published version of the manuscript.
Funding
This work was supported by the Fujian Agriculture and Forestry University Forestry Peak Discipline Construction project (71201800739).
Institutional Review Board Statement
Not applicable.
Informed Consent Statement
Not applicable.
Data Availability Statement
Data are contained within the article and the Supplementary Materials.
Conflicts of Interest
The authors declare no conflict of interest.
References
- Suzuki, N.; Rivero, R. M.; Shulaev, V.; Blumwald, E.; Mittler, R. Abiotic and biotic stress combinations. New Phytol. 2014, 203, 32–43. [Google Scholar] [CrossRef] [PubMed]
- Cushman, J. C.; Denby, K.; Mittler, R. Plant responses and adaptations to a changing climate. Plant J. 2022, 109, 319–322. [Google Scholar] [CrossRef] [PubMed]
- Ramegowda, V.; Senthil-Kumar, M. The interactive effects of simultaneous biotic and abiotic stresses on plants: Mechanistic understanding from drought and pathogen combination. J Plant Physiol. 2015, 176, 47–54. [Google Scholar] [CrossRef] [PubMed]
- Koyama, T. Regulatory mechanisms of transcription factors in plant morphology and function. Int J Mol Sci. 2023, 24, 7039. [Google Scholar] [CrossRef]
- Xu, B.; Ohtani, M.; Yamaguchi, M.; Toyooka, K.; Wakazaki, M.; Sato, M.; Kubo, M.; Nakano, Y.; Sano, R.; Hiwatashi, Y.; Murata, T.; Kurata, T.; Yoneda, A.; Kato, K.; Hasebe, M.; Demura, T. Contribution of NAC transcription factors to plant adaptation to land. Science. 2014, 343, 1505–1508. [Google Scholar] [CrossRef]
- Yang, M.; He, G.; Hou, Q.; Fan, Y.; Duan, L.; Li, K.; Wei, X.; Qiu, Z.; Chen, E.; He, T. Systematic analysis and expression profiles of TCP gene family in Tartary buckwheat (Fagopyrum tataricum (L.) Gaertn.) revealed the potential function of FtTCP15 and FtTCP18 in response to abiotic stress. BMC genomics 2022, 23, 415. [Google Scholar] [CrossRef]
- Zou, X. M.; Sun, H. M. DOF transcription factors: Specific regulators of plant biological processes. Front Plant Sci 2023, 14, 1044918. [Google Scholar] [CrossRef]
- Abunimye, D. A.; Okafor, I. M.; Okorowo, H.; Obeagu, E. I. The role of GATA family transcriptional factors in haematological malignancies: A review. Medicine. 2024, 103, e37487. [Google Scholar] [CrossRef]
- Liang, J.; Fang, Y.; An, C.; Yao, Y.; Wang, X.; Zhang, W.; Liu, R.; Wang, L.; Aslam, M.; Cheng, Y. Genome-wide identification and expression analysis of the bHLH gene family in passion fruit (Passiflora edulis) and its response to abiotic stress. Int. J. Biol. Macromol. 2023, 225, 389–403. [Google Scholar] [CrossRef]
- He, L. L.; Liu, Y.; Mao, Y. W.; Wu, X. Y.; Zheng, X. L.; Zhao, W. Y.; Mo, X. Y.; Wang, R. R.; Wu, Q.; Wang, D. F.; Li, Y. H.; Yang, Y. F.; Bai, Q. Z.; Zhang, X. J.; Zhou, S. L.; Zhao, B. L.; Liu, C. N.; Liu, Y.; Tadege, M.; Chen, J. H. GRAS transcription factor PINNATE-LIKE PENTAFOLIATA2 controls compound leaf morphogenesis in Medicago truncatula. Plant Cell. 2024, 36, 1755–1776. [Google Scholar] [CrossRef]
- Chen, K.; Tang, W. S.; Zhou, Y. B.; Chen, J.; Xu, Z. S.; Ma, R.; Dong, Y. S.; Ma, Y. Z.; Chen, M. AP2/ERF transcription factor confers drought tolerance in transgenic soybean by interacting with GmERFs. Plant Physiol Bioch. 2022, 170, 287–295. [Google Scholar] [CrossRef] [PubMed]
- Sharma, L.; Priya, M.; Kaushal, N.; Bhandhari, K.; Chaudhary, S.; Dhankher, O. P.; Prasad, P. V. V.; Siddique, K. H. M.; Nayyar, H. Plant growth-regulating molecules as thermoprotectants: functional relevance and prospects for improving heat tolerance in food crops. J Exp Bot. 2020, 71, 569–594. [Google Scholar] [CrossRef] [PubMed]
- Xu, Y.; Yuan, Y. H.; Du, N. S.; Wang, Y.; Shu, S.; Sun, J.; Guo, S. R. Proteomic analysis of heat stress resistance of cucumber leaves when grafted onto Momordica rootstock. Hortic Res-England 2018, 5, 23. [Google Scholar] [CrossRef] [PubMed]
- Sato, H.; Mizoi, J.; Shinozaki, K.; Yamaguchi-Shinozaki, K. Complex plant responses to drought and heat stress under climate change. Plant J. 2024, 117, 1873–1892. [Google Scholar] [CrossRef]
- Wu, T. Y.; Hoh, K. L.; Boonyaves, K.; Krishnamoorthi, S.; Urano, D. Diversification of heat shock transcription factors expanded thermal stress responses during early plant evolution. Plant Cell. 2022, 34, 3557–3576. [Google Scholar] [CrossRef]
- Scharf, K. D.; Berberich, T.; Ebersberger, I.; Nover, L. The plant heat stress transcription factor (Hsf) family: structure, function and evolution. Biochim Biophys Acta. 2012, 1819, 104–119. [Google Scholar] [CrossRef]
- Andrási, N.; Pettkó-Szandtner, A.; Szabados, L. Diversity of plant heat shock factors: regulation, interactions, and functions. J Exp Bot. 2021, 72, 1558–1575. [Google Scholar] [CrossRef]
- Peteranderl, R.; Rabenstein, M.; Shin, Y. K.; Liu, C. W.; Wemmer, D. E.; King, D. S.; Nelson, H. C. Biochemical and biophysical characterization of the trimerization domain from the heat shock transcription factor. Biochemistry 1999, 38(12), 3559–69. [Google Scholar] [CrossRef]
- Nover, L.; Bharti, K.; Döring, P.; Mishra, S. K.; Ganguli, A.; Scharf, K. D. Arabidopsis and the heat stress transcription factor world: how many heat stress transcription factors do we need? Cell Stress Chaperones. 2001, 6, 177–89. [Google Scholar] [CrossRef]
- Kotak, S.; Port, M.; Ganguli, A.; Bicker, F.; von Koskull-Döring, P. , Characterization of C-terminal domains of Arabidopsis heat stress transcription factors (Hsfs) and identification of a new signature combination of plant class A Hsfs with AHA and NES motifs essential for activator function and intracellular localization. Plant J. 2004, 39, 98–112. [Google Scholar] [CrossRef]
- Heerklotz, D.; Döring, P.; Bonzelius, F.; Winkelhaus, S.; Nover, L. The balance of nuclear import and export determines the intracellular distribution and function of tomato heat stress transcription factor HsfA2. Mol Cell Biol. 2001, 21, 1759–68. [Google Scholar] [CrossRef] [PubMed]
- von Koskull-Döring, P.; Scharf, K. D.; Nover, L. The diversity of plant heat stress transcription factors. Trends Plant Sci. 2007, 12, 452–457. [Google Scholar] [CrossRef] [PubMed]
- Wiederrecht, G.; Seto, D.; Parker, C. S. Isolation of the gene encoding the S. cerevisiae heat shock transcription factor. Cell. 1988, 54, 841–853. [Google Scholar] [CrossRef] [PubMed]
- Scharf, K. D.; Rose, S.; Zott, W.; Schöffl, F.; Nover, L. Three tomato genes code for heat stress transcription factors with a region of remarkable homology to the DNA-binding domain of the yeast HSF. Embo J. 1990, 9, 4495–5501. [Google Scholar] [CrossRef]
- Guo, J.; Wu, J.; Ji, Q.; Wang, C.; Luo, L.; Yuan, Y.; Wang, Y.; Wang, J. Genome-wide analysis of heat shock transcription factor families in rice and Arabidopsis thaliana. J Genet Genomics. 2008, 35, 105–118. [Google Scholar] [CrossRef]
- Wang, C.; Zhang, Q.; Shou, H. X. Identification and expression analysis of OsHsfs in rice. J Zhejiang Univ Sci B. 2009, 10, 291–300. [Google Scholar] [CrossRef]
- Wang, F.; Dong, Q.; Jiang, H.; Zhu, S.; Chen, B.; Xiang, Y. Genome-wide analysis of the heat shock transcription factors in Populus trichocarpa and Medicago truncatula. Mol Biol Rep. 2012, 39, 1877–1886. [Google Scholar] [CrossRef]
- Zheng, R.; Chen, J.; Peng, Y.; Zhu, X.; Niu, M.; Chen, X.; Xie, K.; Huang, R.; Zhan, S.; Su, Q.; Shen, M.; Peng, D.; Ahmad, S.; Zhao, K.; Liu, Z. J.; Zhou, Y. General analysis of heat shock factors in the cymbidium ensifolium genome provided insights into their evolution and special roles with response to temperature. Int J Mol Sci. 2024, 25, 1002. [Google Scholar] [CrossRef]
- Yoshida, T.; Ohama, N.; Nakajima, J.; Kidokoro, S.; Mizoi, J.; Nakashima, K.; Maruyama, K.; Kim, J. M.; Seki, M.; Todaka, D.; Osakabe, Y.; Sakuma, Y.; Schöffl, F.; Shinozaki, K.; Yamaguchi-Shinozaki, K. Arabidopsis HsfA1 transcription factors function as the main positive regulators in heat shock-responsive gene expression. Mol Genet Genomics. 2011, 286, 321–332. [Google Scholar] [CrossRef]
- Chen, S.; Yu, M.; Li, H.; Wang, Y.; Lu, Z.; Zhang, Y.; Liu, M.; Qiao, G.; Wu, L.; Han, X.; Zhuo, R. SaHsfA4c from sedum alfredii hance enhances cadmium tolerance by regulating ROS-Scavenger activities and heat shock proteins expression. Front Plant Sci. 2020, 11, 142. [Google Scholar] [CrossRef]
- Resentini, F.; Orozco-Arroyo, G.; Cucinotta, M.; Mendes, M. A. The impact of heat stress in plant reproduction. Front Plant Sci. 2023, 14, 1271644. [Google Scholar] [CrossRef] [PubMed]
- Almoguera, C.; Prieto-Dapena, P.; Díaz-Martín, J.; Espinosa, J. M.; Carranco, R.; Jordano, J. The HaDREB2 transcription factor enhances basal thermotolerance and longevity of seeds through functional interaction with HaHSFA9. BMC Plant Biol. 2009, 9, 75. [Google Scholar] [CrossRef] [PubMed]
- Kolmos, E.; Chow, B. Y.; Pruneda-Paz, J. L.; Kay, S. A. HsfB2b-mediated repression of PRR7 directs abiotic stress responses of the circadian clock. Proc Natl Acad Sci U S A. 2014, 111, 16172–16177. [Google Scholar] [CrossRef] [PubMed]
- Wunderlich, M.; Gross-Hardt, R.; Schöffl, F. Heat shock factor HSFB2a involved in gametophyte development of Arabidopsis thaliana and its expression is controlled by a heat-inducible long non-coding antisense RNA. Plant Mol Biol. 2014, 85, 541–550. [Google Scholar] [CrossRef]
- Gonzalez-Bayon, R.; Shen, Y.; Groszmann, M.; Zhu, A.; Wang, A.; Allu, A. D.; Dennis, E. S.; Peacock, W. J.; Greaves, I. K. Senescence and defense pathways contribute to heterosis. Plant Physiol. 2019, 180, 240–252. [Google Scholar] [CrossRef]
- Tan, B.; Yan, L.; Li, H.; Lian, X.; Cheng, J.; Wang, W.; Zheng, X.; Wang, X.; Li, J.; Ye, X.; Zhang, L.; Li, Z.; Feng, J. Genome-wide identification of HSF family in peach and functional analysis of PpHSF5 involvement in root and aerial organ development. PeerJ 2021, 9, e10961. [Google Scholar] [CrossRef]
- Ogawa, D.; Yamaguchi, K.; Nishiuchi, T. High-level overexpression of the Arabidopsis thaliana HsfA2 gene confers not only increased themotolerance but also salt/osmotic stress tolerance and enhanced callus growth. J Exp Bot. 2007, 58, 3373–3383. [Google Scholar] [CrossRef]
- Chan-Schaminet, K. Y.; Baniwal, S. K.; Bublak, D.; Nover, L.; Scharf, K. D. Specific Interaction between tomato HsfA1 and HsfA2 creates hetero-oligomeric superactivator complexes for synergistic activation of heat stress gene expression. J Biol Chem. 2009, 284, 20848–20857. [Google Scholar] [CrossRef]
- Huang, Y. C.; Niu, C. Y.; Yang, C. R.; Jinn, T. L. The heat stress factor HSFA6b connects ABA signaling and ABA-Mediated heat responses. Plant Physiology. 2016, 172, 1182–1199. [Google Scholar] [CrossRef]
- Nishizawa, A.; Yabuta, Y.; Yoshida, E.; Maruta, T.; Yoshimura, K.; Shigeoka, S. Arabidopsis thaliana heat shock transcription factor A2 as a key regulator in response to several types of environmental stress. Plant J. 2006, 48, 535–547. [Google Scholar] [CrossRef]
- Guo, M.; Lu, J. P.; Zhai, Y. F.; Chai, W. G.; Gong, Z. H.; Lu, M. H. Genome-wide analysis, expression profile of heat shock factor gene family (CaHsfs) and characterisation of CaHsfA2 in pepper (Capsicum annuum L.). Bmc Plant Biology 2015, 15, 1–20. [Google Scholar] [CrossRef] [PubMed]
- Li, P. S.; Yu, T. F.; He, G. H.; Chen, M.; Zhou, Y. B.; Chai, S. C.; Xu, Z. S.; Ma, Y. Z. Genome-wide analysis of the Hsf family in soybean and functional identification of GmHsf-34 involvement in drought and heat stresses. Bmc Genomics. 2014, 15, 1–16. [Google Scholar] [CrossRef] [PubMed]
- Zhang, X.; Xu, W.; Ni, D.; Wang, M.; Guo, G. Genome-wide characterization of tea plant (Camellia sinensis) Hsf transcription factor family and role of CsHsfA2 in heat tolerance. BMC Plant Biol. 2020, 20, 1–17. [Google Scholar] [CrossRef]
- Yang, Y.; Yin, J.; Zhu, L.; Xu, L.; Wu, W.; Lu, Y.; Chen, J.; Shi, J.; Hao, Z. Genome-wide analysis of the liriodendron chinense Hsf gene family under abiotic stress and characterization of the LcHsfA2a gene. Int J Mol Sci. 2024, 25, 2733. [Google Scholar] [CrossRef]
- Ikeda, M.; Mitsuda, N.; Ohme-Takagi, M. Arabidopsis HsfB1 and HsfB2b act as repressors of the expression of heat-inducible Hsfs but positively regulate the acquired thermotolerance. Plant Physiol. 2011, 157, 1243–1254. [Google Scholar] [CrossRef]
- Rastogi, S.; Pandey, M. M.; Rawat, A. K. S. Medicinal plants of the Betula-Traditional uses and a phytochemical-pharmacological review. J Ethnopharmacol. 2015, 159, 62–83. [Google Scholar] [CrossRef]
- Liu, D.; An, Y.; Li, Z.; Wang, Z. H.; Zhao, Y. H.; Wang, X. C. Differences and similarities in radial growth of Betula species to climate change. J Forestry Res. 2024, 35, 40. [Google Scholar] [CrossRef]
- Chen, S.; Wang, Y. C.; Yu, L. L.; Zheng, T.; Wang, S.; Yue, Z.; Jiang, J.; Kumari, S.; Zheng, C. F.; Tang, B.; Li, J.; Li, Y. Q.; Chen, J. J.; Zhang, W. B.; Kuang, H. H.; Robertson, J. S.; Zhao, P. X.; Li, H. Y.; Shu, S. Q.; Yordanov, Y. S.; Huang, H. J.; Goodstein, D. M.; Gai, Y.; Qi, Q.; Min, J. M.; Xu, C. Y.; Wang, S. B.; Qu, G. Z.; Paterson, A. H.; Sankoff, D.; Wei, H. R.; Liu, G. F.; Yang, C. P. Genome sequence and evolution of B. platyphylla. Hortic Res. 2021, 8, 37. [Google Scholar] [CrossRef]
- Wang, J.; Hu, H.; Wang, W.; Wei, Q.; Hu, T.; Bao, C. Genome-wide identification and functional characterization of the heat shock factor family in eggplant (Solanum melongena L.) under abiotic stress conditions. Plants 2020, 9, 915. [Google Scholar] [CrossRef]
- Liu, X. J.; Meng, P. P.; Yang, G. Y.; Zhang, M. Y.; Peng, S. B.; Zhai, M. Z. Genome-wide identification and transcript profiles of walnut heat stress transcription factor involved in abiotic stress. Bmc Genomics. 2020, 21, 1–13. [Google Scholar] [CrossRef]
- Zhu, X. Y.; Huang, C. Q.; Zhang, L.; Liu, H. F.; Yu, J. H.; Hu, Z. Y.; Hua, W. Systematic analysis of family genes in the genome reveals novel responses to heat, drought and high CO2 stresses. Front Plant Sci. 2017, 8, 1174. [Google Scholar] [CrossRef]
- Zhou, M.; Zheng, S. G.; Liu, R.; Lu, J.; Lu, L.; Zhang, C. H.; Liu, Z. H.; Luo, C. P.; Zhang, L.; Yant, L.; Wu, Y. Genome-wide identification, phylogenetic and expression analysis of the heat shock transcription factor family in bread wheat (Triticum aestivum L.). Bmc Genomics 2019, 20, 1–18. [Google Scholar] [CrossRef] [PubMed]
- Duan, S. N.; Liu, B. H.; Zhang, Y. Y.; Li, G. L.; Guo, X. L. Genome-wide identification and abiotic stress-responsive pattern of heat shock transcription factor family in Triticum aestivum L. Bmc Genomics. 2019, 20, 1–20. [Google Scholar] [CrossRef] [PubMed]
- Shamshad, A.; Rashid, M.; Zaman, Q. U. In-silico analysis of heat shock transcription factor (OsHSF) gene family in rice (Oryza sativa L.). Bmc Plant Biology 2023, 23, 395. [Google Scholar] [CrossRef] [PubMed]
- Liao, W. H.; Tang, X. H.; Li, J. S.; Zheng, Q. M.; Wang, T.; Cheng, S. Z.; Chen, S. P.; Cao, S. J.; Cao, G. Q. Genome wide investigation of Hsf gene family in Phoebe bournei: identification, evolution, and expression after abiotic stresses. J Forestry Res. 2024, 35, 11. [Google Scholar] [CrossRef]
- Li, W.; Wan, X. L.; Yu, J. Y.; Wang, K. L.; Zhang, J. Genome-wide identification, classification, and expression analysis of the Hsf gene family in carnation (Dianthus caryophyllus). Int J Mol Sci. 2019, 20, 5233. [Google Scholar] [CrossRef]
- Giorno, F.; Guerriero, G.; Baric, S.; Mariani, C. Heat shock transcriptional factors in Malus domestica: identification, classification and expression analysis. Bmc Genomics. 2012, 13, 1–13. [Google Scholar] [CrossRef]
- Tang, M. J.; Xu, L.; Wang, Y.; Cheng, W. W.; Luo, X. B.; Xie, Y.; Fan, L. X.; Liu, L. W. Genome-wide characterization and evolutionary analysis of heat shock transcription factors (HSFs) to reveal their potential role under abiotic stresses in radish (Raphanus sativus L.). Bmc Genomics 2019, 20, 1–13. [Google Scholar] [CrossRef]
- Bautista-Bautista, Y.; Arroyo-Alvarez, E.; Fuentes, G.; Girón-Ramírez, A.; Chan-León, A.; Estrella-Maldonado, H.; Xoconostle, B.; Santamaría, J. M. Genome-wide analysis of HSF genes and their role in the response to drought stress in wild and commercial Carica papaya L. genotypes. Sci Hortic-Amsterdam 2024, 328, 112889. [Google Scholar] [CrossRef]
- Zhao, K.; Dang, H.; Zhou, L. D.; Hu, J.; Jin, X.; Han, Y. Z.; Wang, S. J. Genome-wide identification and expression analysis of the HSF gene family in Poplar. Forests. 2023, 14, 510. [Google Scholar] [CrossRef]
- Xu, Y. A.; Jin, Y.; He, D.; Di, H. C.; Liang, Y.; Xu, Y. X. A Genome-Wide analysis and expression profile of heat shock transcription factor (Hsf) gene family in Rhododendron simsii. Plants. 2023, 12, 3917. [Google Scholar] [CrossRef] [PubMed]
- Wang, Q.; Zhang, Z. B.; Guo, C.; Zhao, X. B.; Li, Z. Y.; Mou, Y. F.; Sun, Q. X.; Wang, J.; Yuan, C. L.; Li, C. J.; Cong, P.; Shan, S. H. Hsf transcription factor gene family in peanut (Arachis hypogaea L.): genome-wide characterization and expression analysis under drought and salt stresses. Front Plant Sci 2023, 14, 1214732. [Google Scholar] [CrossRef] [PubMed]
- Qu, R. J.; Wang, S. W.; Wang, X. X.; Peng, J. M.; Guo, J.; Cui, G. H.; Chen, M. L.; Mu, J.; Lai, C. J. S.; Huang, L. Q.; Wang, S.; Shen, Y. Genome-Wide characterization and expression of the Hsf gene family in Salvia miltiorrhiza (Danshen) and the potential thermotolerance of SmHsf1 and SmHsf7 in Yeast. Int J Mol Sci. 2023, 24, 8461. [Google Scholar] [CrossRef] [PubMed]
- Guo, X. L.; Yuan, S. N.; Zhang, H. N.; Zhang, Y. Y.; Zhang, Y. J.; Wang, G. Y.; Li, Y. Q.; Li, G. L. Heat-response patterns of the heat shock transcription factor family in advanced development stages of wheat (Triticum aestivum L.) and thermotolerance-regulation by TaHsfA2-10. Bmc Plant Biology 2020, 20, 1–18. [Google Scholar] [CrossRef] [PubMed]
- Liu, M.; Huang, Q.; Sun, W.; Ma, Z.; Huang, L.; Wu, Q.; Tang, Z.; Bu, T.; Li, C.; Chen, H. Genome-wide investigation of the heat shock transcription factor (Hsf) gene family in Tartary buckwheat (Fagopyrum tataricum). Bmc Genomics. 2019, 20, 1–17. [Google Scholar] [CrossRef]
- Wang, L. L.; Liu, Y. H.; Chai, G. F.; Zhang, D.; Fang, Y. Y.; Deng, K.; Aslam, M.; Niu, X. P.; Zhang, W. B.; Qin, Y.; Wang, X. M. Identification of passion fruit gene family and the functional analysis of in response to heat and osmotic stress. Plant Physiol Bioch. 2023, 200, 107800. [Google Scholar] [CrossRef]
- Zhao, D. X.; Qi, X. Y.; Zhang, Y.; Zhang, R. L.; Wang, C.; Sun, T. X.; Zheng, J.; Lu, Y. Z. Genome-wide analysis of the heat shock transcription factor gene family in (Hance) Hedl identifies potential candidates for resistance to abiotic stresses. Plant Physiol Bioch. 2022, 175, 68–80. [Google Scholar] [CrossRef]
- Qian, G. T.; Meng, X. X.; Wang, S. F.; Mi, Y. L.; Qin, Z. F.; Liu, T. X.; Zhang, Y. M.; Wan, H. H.; Chen, W. Q.; Sun, W.; Cao, X.; Li, L. X. Genome-wide identification of HSF gene family and their expression analysis in vegetative tissue of young seedlings of hemp under different light treatments. Ind Crop Prod. 2023, 204, 117375. [Google Scholar] [CrossRef]
- Hu, Y.; Han, Y. T.; Zhang, K.; Zhao, F. L.; Li, Y. J.; Zheng, Y.; Wang, Y. J.; Wen, Y. Q. Identification and expression analysis of heat shock transcription factors in the wild Chinese grapevine (Vitis pseudoreticulata). Plant Physiol Bioch. 2016, 99, 1–10. [Google Scholar] [CrossRef]
- Mishra, S. K.; Poonia, A. K.; Chaudhary, R.; Baranwal, V. K.; Arora, D.; Kumar, R.; Chauhan, H. Genome-wide identification, phylogeny and expression analysis of HSF gene family in barley during abiotic stress response and reproductive development. Plant Gene. 2020, 23, 100231. [Google Scholar] [CrossRef]
- Zhang, L.; Li, T.; Wang, L.; Cao, K.; Gao, W.; Yan, S.; Cao, J.; Lu, J.; Ma, C.; Chang, C.; Zhang, H. A wheat heat shock transcription factor gene, TaHsf-7A, regulates seed dormancy and germination. Plant Physiol Biochem. 2024, 210, 108541. [Google Scholar] [CrossRef] [PubMed]
- Guo, M.; Lu, J. P.; Zhai, Y. F.; Chai, W. G.; Gong, Z. H.; Lu, M. H. Genome-wide analysis, expression profile of heat shock factor gene family (CaHsfs) and characterisation of CaHsfA2 in pepper (Capsicum annuum L.). BMC Plant Biol. 2015, 15, 151. [Google Scholar] [CrossRef] [PubMed]
- Liu, X.; Meng, P.; Yang, G.; Zhang, M.; Peng, S.; Zhai, M. Z. Genome-wide identification and transcript profiles of walnut heat stress transcription factor involved in abiotic stress. BMC Genomics. 2020, 21, 474. [Google Scholar] [CrossRef]
- Sun, T.; Wang, W.; Hu, X.; Meng, L.; Xiang, L.; Wang, Y.; Wang, C.; Luo, H.; Ziyomo, C.; Chan, Z. HSFA3 functions as a positive regulator of HSFA2a to enhance thermotolerance in perennial ryegrass. Plant Physiol Biochem. 2024, 208, 108512. [Google Scholar] [CrossRef]
- Li, W.; Wan, X. L.; Yu, J. Y.; Wang, K. L.; Zhang, J. Genome-Wide identification, classification, and expression analysis of the Hsf gene family in Carnation (Dianthus caryophyllus). Int J Mol Sci. 2019, 20, 5233. [Google Scholar] [CrossRef]
- Lin, Y. X.; Jiang, H. Y.; Chu, Z. X.; Tang, X. L.; Zhu, S. W.; Cheng, B. J. Genome-wide identification, classification and analysis of heat shock transcription factor family in maize. BMC Genomics. 2011, 12, 1–14. [Google Scholar] [CrossRef]
- Li, P. S.; Yu, T. F.; He, G. H.; Chen, M.; Zhou, Y. B.; Chai, S. C.; Xu, Z. S.; Ma, Y. Z. Genome-wide analysis of the Hsf family in soybean and functional identification of GmHsf-34 involvement in drought and heat stresses. BMC Genomics. 2014, 15, 1–16. [Google Scholar] [CrossRef]
- Banakar, S. N.; PrasannaKumar, M. K.; Mahesh, H. B.; Parivallal, P. B.; Puneeth, M. E.; Gautam, C.; Pramesh, D.; Shiva Kumara, T. N.; Girish, T. R.; Nori, S.; Narayan, S. S. Red-seaweed biostimulants differentially alleviate the impact of fungicidal stress in rice (Oryza sativa L.). Sci Rep. 2022, 12, 5993. [Google Scholar] [CrossRef]
- Zhang, J.; Jia, H.; Li, J.; Li, Y.; Lu, M.; Hu, J. Molecular evolution and expression divergence of the Populus euphratica Hsf genes provide insight into the stress acclimation of desert poplar. Sci Rep. 2016, 6, 30050. [Google Scholar] [CrossRef]
- Wang, L.; Liu, Y.; Chai, G.; Zhang, D.; Fang, Y.; Deng, K.; Aslam, M.; Niu, X.; Zhang, W.; Qin, Y.; Wang, X. Identification of passion fruit HSF gene family and the functional analysis of PeHSF-C1a in response to heat and osmotic stress. Plant Physiol Biochem. 2023, 200, 107800. [Google Scholar] [CrossRef]
- Zhang, J.; Liu, B.; Li, J.; Zhang, L.; Wang, Y.; Zheng, H.; Lu, M.; Chen, J. Hsf and Hsp gene families in Populus: genome-wide identification, organization and correlated expression during development and in stress responses. BMC Genomics. 2015, 16, 1–19. [Google Scholar] [CrossRef] [PubMed]
- Evrard, A.; Kumar, M.; Lecourieux, D.; Lucks, J.; von Koskull-Döring, P.; Hirt, H. Regulation of the heat stress response in Arabidopsis by MPK6-targeted phosphorylation of the heat stress factor HsfA2. PeerJ. 2013, 1, e59. [Google Scholar] [CrossRef] [PubMed]
- Bakery, A.; Vraggalas, S.; Shalha, B.; Chauhan, H.; Benhamed, M.; Fragkostefanakis, S. Heat stress transcription factors as the central molecular rheostat to optimize plant survival and recovery from heat stress. New phytologist. 2024, 244, 51–64. [Google Scholar] [CrossRef] [PubMed]
- Zhang, Q.; Geng, J.; Du, Y.; Zhao, Q.; Zhang, W.; Fang, Q.; Yin, Z.; Li, J.; Yuan, X.; Fan, Y. Heat shock transcription factor (Hsf) gene family in common bean (Phaseolus vulgaris): Genome-wide identification, phylogeny, evolutionary expansion and expression analyses at the sprout stage under abiotic stress. BMC Plant Biology. 2022, 22, 33. [Google Scholar] [CrossRef]
- Guo, M.; Liu, J.H.; Ma, X.; Luo, D.X.; Gong, Z.H.; Lu, M.H. The plant heat stress transcription factors (HSFs): structure, regulation, and function in response to abiotic stresses. Frontiers in plant science. 2016, 7, 114. [Google Scholar] [CrossRef]
- Chen, C. J.; Wu, Y.; Li, J. W.; Wang, X.; Zeng, Z. H.; Xu, J.; Liu, Y. L.; Feng, J. T.; Chen, H.; He, Y. H.; Xia, R. TBtools-II: A "one for all, all for one" bioinformatics platform for biological big-data mining. Mol Plant. 2023, 16, 1733–1742. [Google Scholar] [CrossRef]
- Hu, B.; Jin, J.; Guo, A. Y.; Zhang, H.; Luo, J.; Gao, G. GSDS 2.0: an upgraded gene feature visualization server. Bioinformatics. 2015, 31, 1296–1297. [Google Scholar] [CrossRef]
- Chen, S.; Zhou, Y.; Chen, Y.; Gu, J. fastp: an ultra-fast all-in-one FASTQ preprocessor. Bioinformatics. 2018, 34, i884–i890. [Google Scholar] [CrossRef]
- Kim, D.; Paggi, J. M.; Park, C.; Bennett, C.; Salzberg, S. L. Graph-based genome alignment and genotyping with HISAT2 and HISAT-genotype. Nat Biotechnol. 2019, 37, 907–915. [Google Scholar] [CrossRef]
- Liao, Y.; Smyth, G. K.; Shi, W. feature counts: an efficient general purpose program for assigning sequence reads to genomic features. Bioinformatics. 2014, 30, 923–930. [Google Scholar] [CrossRef]
- Peng, Y.; Fang, T.; Zhang, Y.; Zhang, M.; Zeng, L. Genome-Wide identification and expression analysis of auxin response factor (ARF) gene family in Longan (Dimocarpus longan L.). Plants (Basel) 2020, 9, 221. [Google Scholar] [CrossRef]
- Livak, K. J.; Schmittgen, T. D. Analysis of relative gene expression data using real-time quantitative PCR and the 2−ΔΔCT Method. Methods. 2001, 25, 402–408. [Google Scholar] [CrossRef]
Figure 1.
BpHSF protein structural domains and multiple sequence comparison.(A) BpHSF protein structural domains, different colored rectangles represent different structural domains (refer to Scharf et al.[16]) (B) DBD conserved structural domain of BpHSF.
Figure 1.
BpHSF protein structural domains and multiple sequence comparison.(A) BpHSF protein structural domains, different colored rectangles represent different structural domains (refer to Scharf et al.[16]) (B) DBD conserved structural domain of BpHSF.
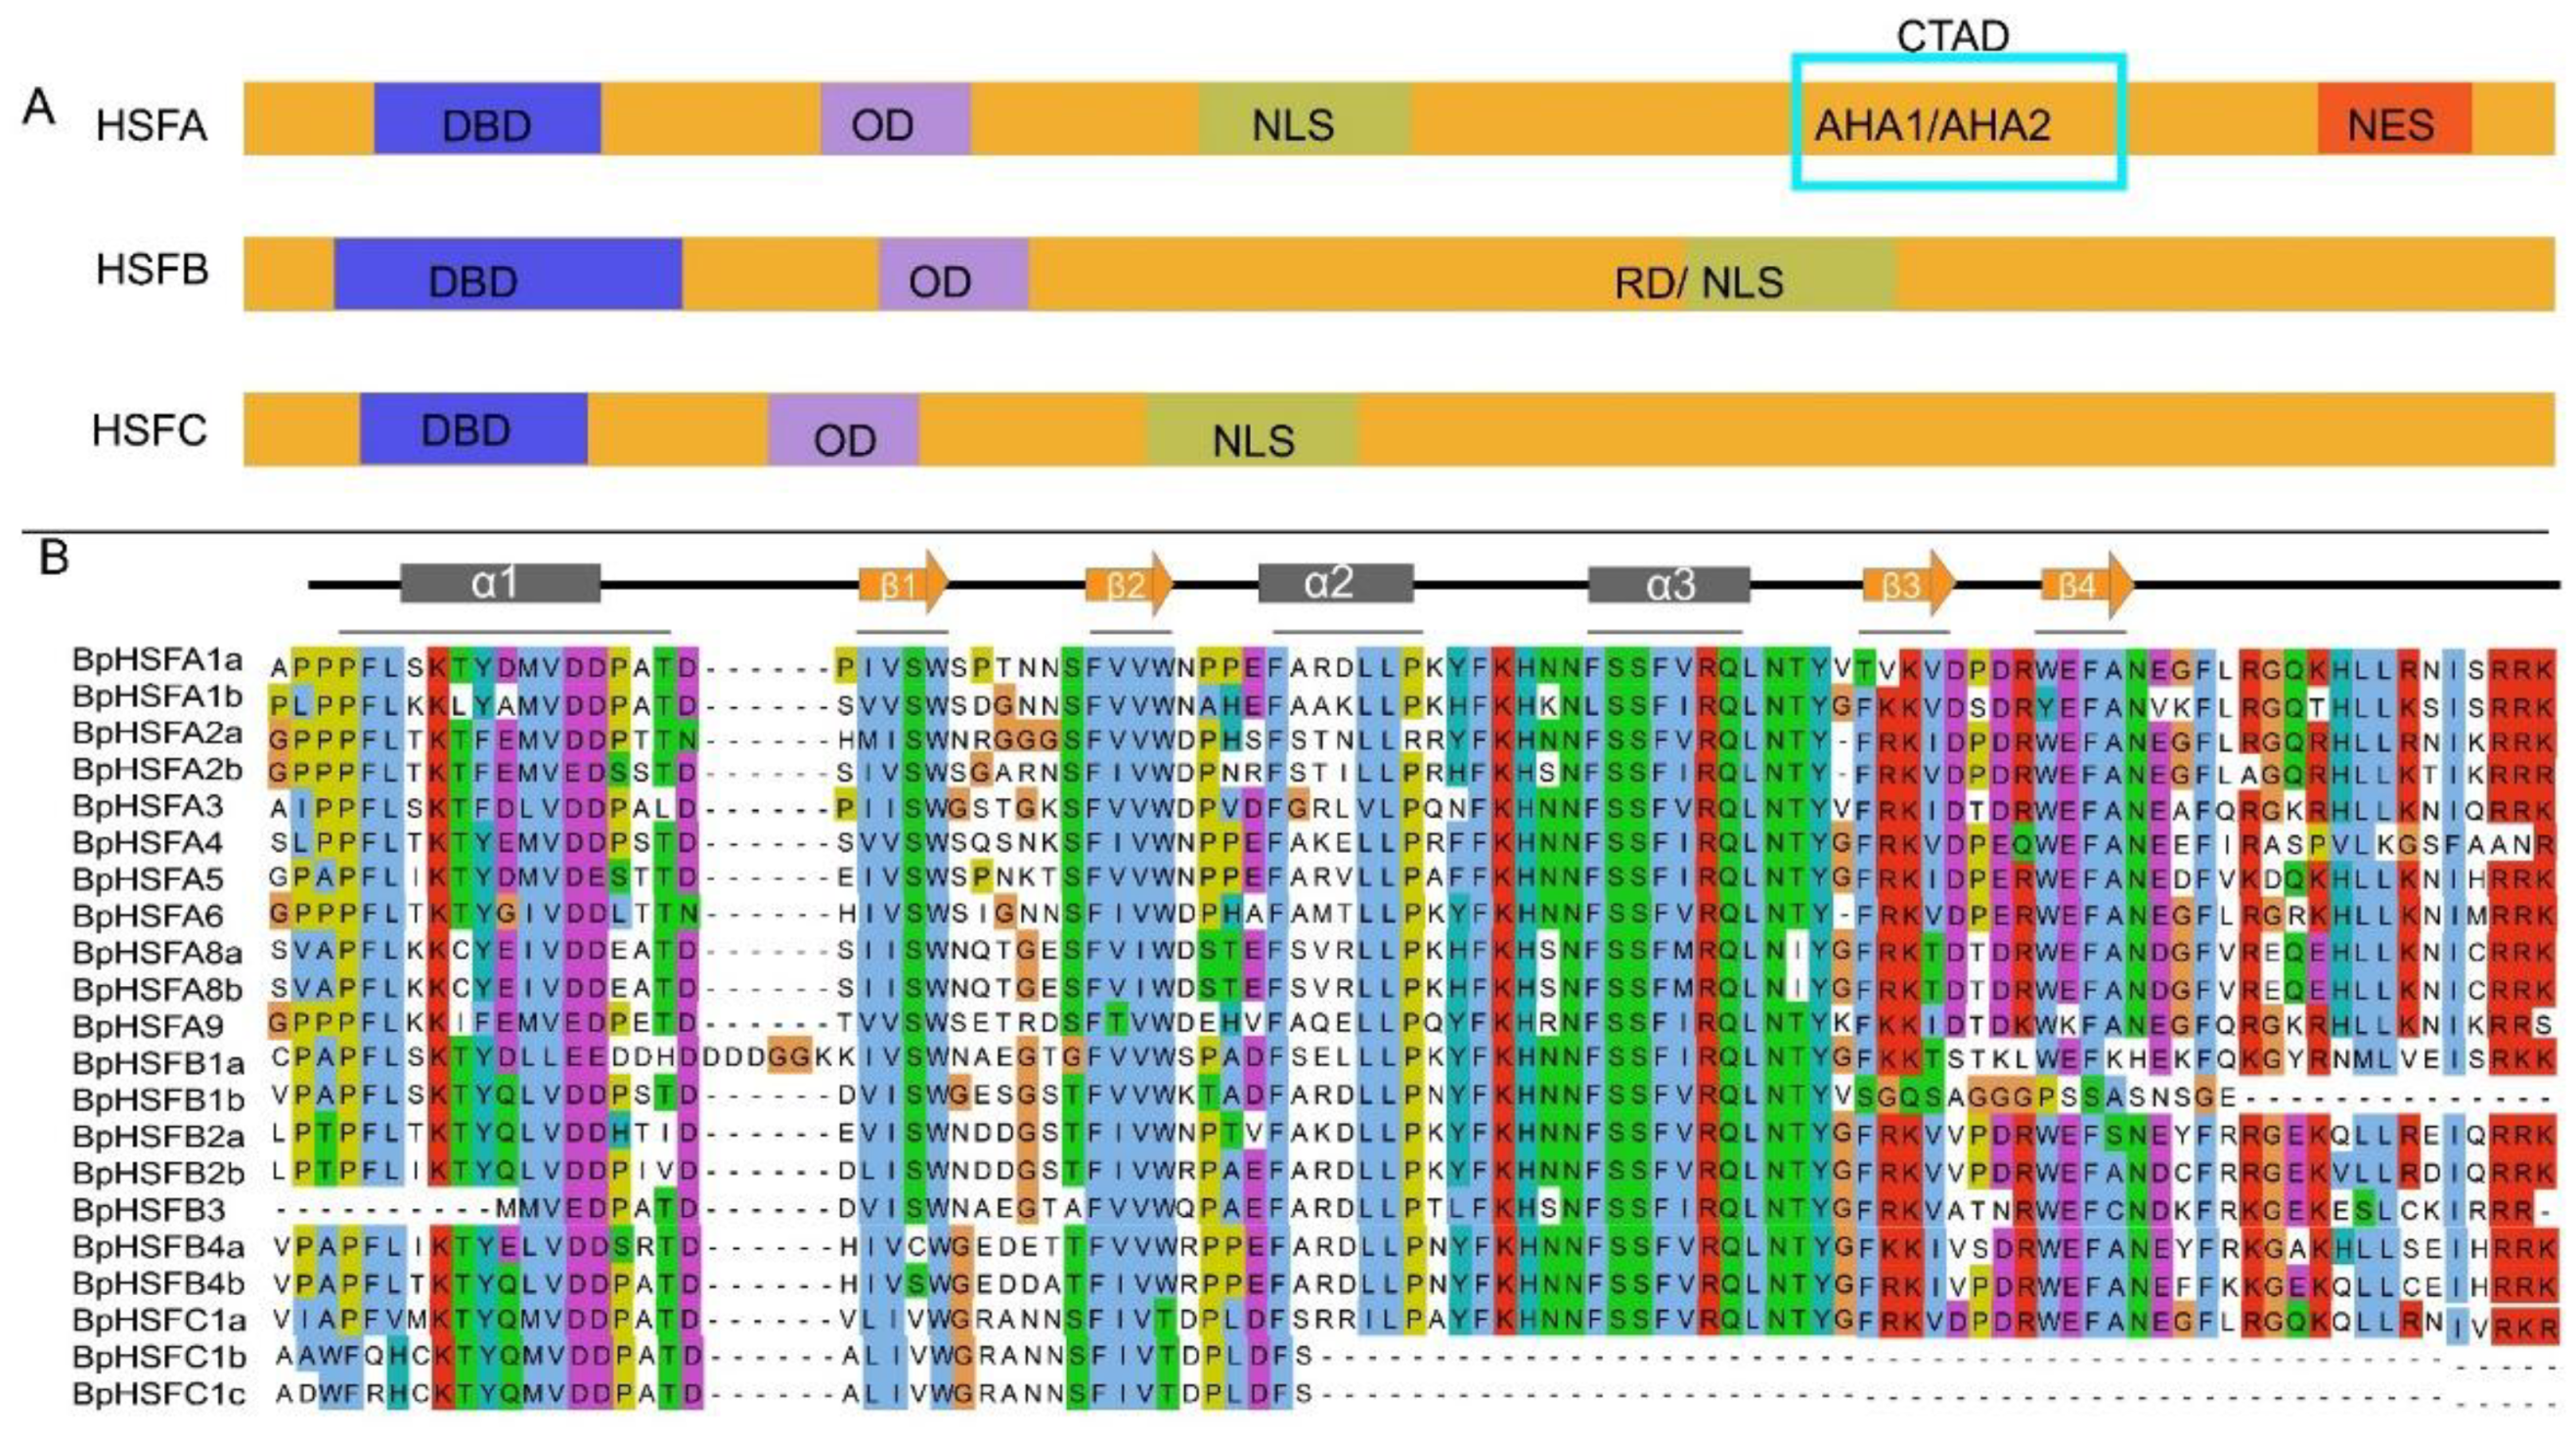
Figure 4.
BpHSF gene structure and conserved motifs. (A) Evolutionary analysis among BpHSF genes, subfamily A is indicated in green, subfamily B in yellow, and subfamily C in blue; (B) BpHSF protein conserved motifs, indicated by different colored rectangles; (C) BpHSFgene structure, with orange rectangles indicating CDS (coding sequence), purple rectangles indicate UTRs (untranslated regions), black lines indicate introns.
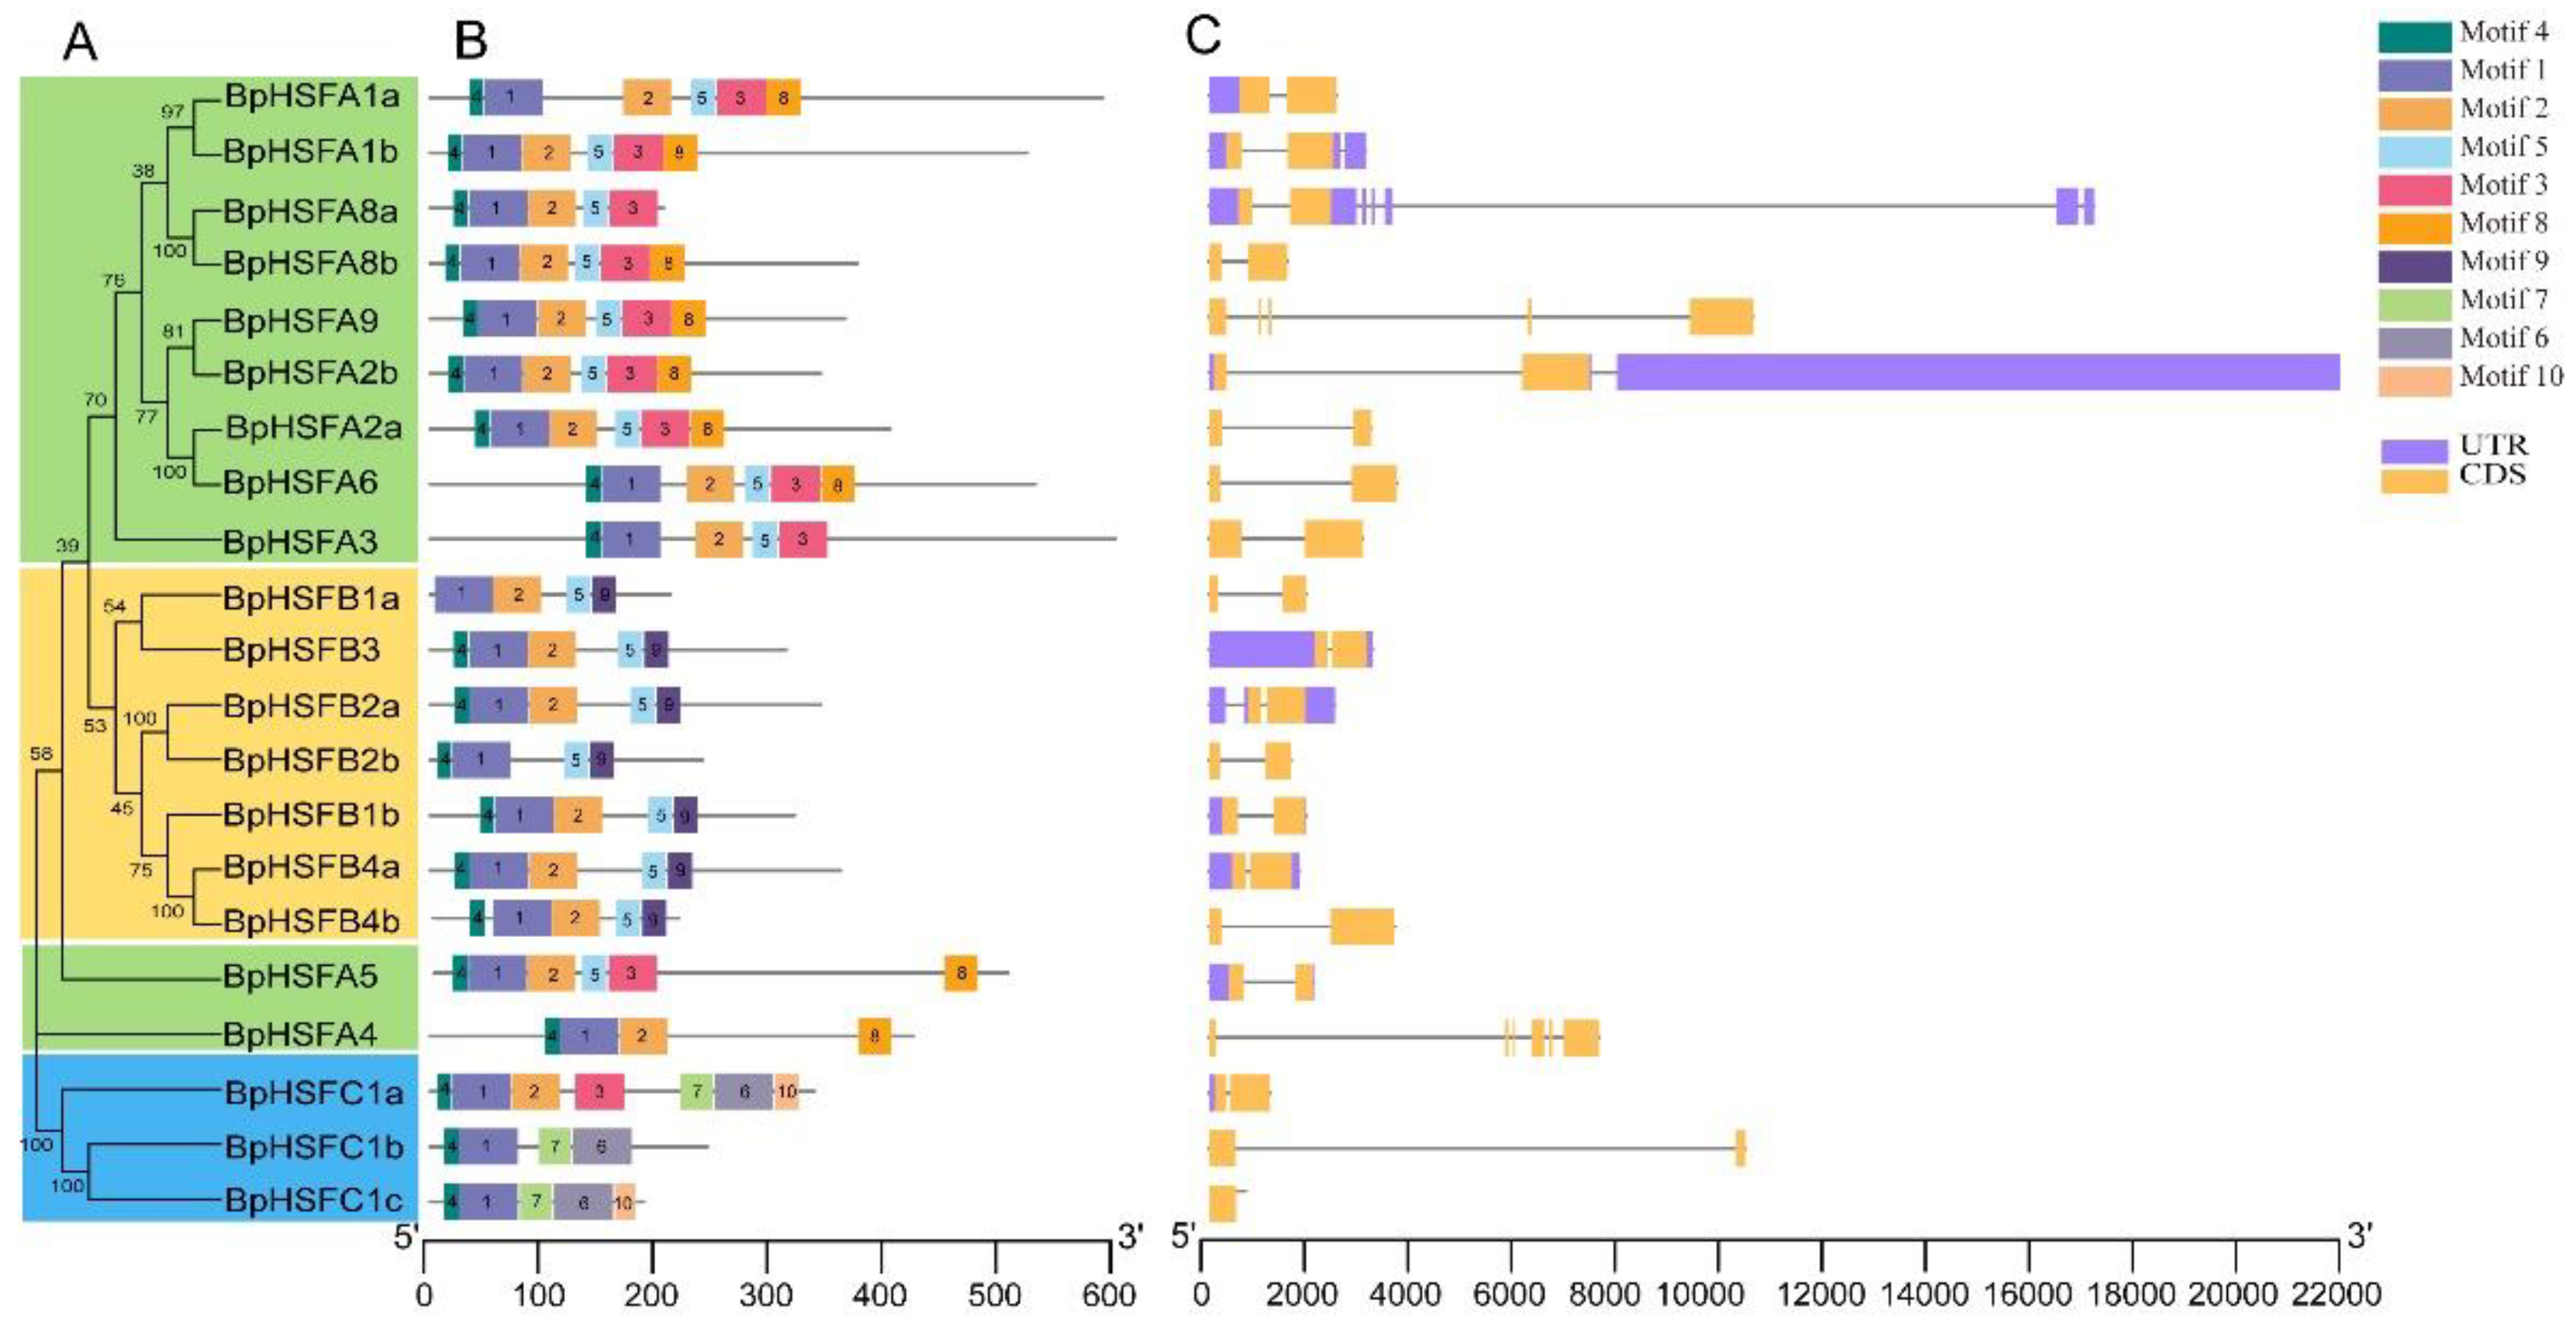
Figure 5.
Intraspecies covariance analysis of BpHSF genes. The red line in the outer ring represents the gene density per chromosome. Co-linear genes are indicated by light gray lines; BpHSF gene pairs are shown as red lines.
Figure 5.
Intraspecies covariance analysis of BpHSF genes. The red line in the outer ring represents the gene density per chromosome. Co-linear genes are indicated by light gray lines; BpHSF gene pairs are shown as red lines.
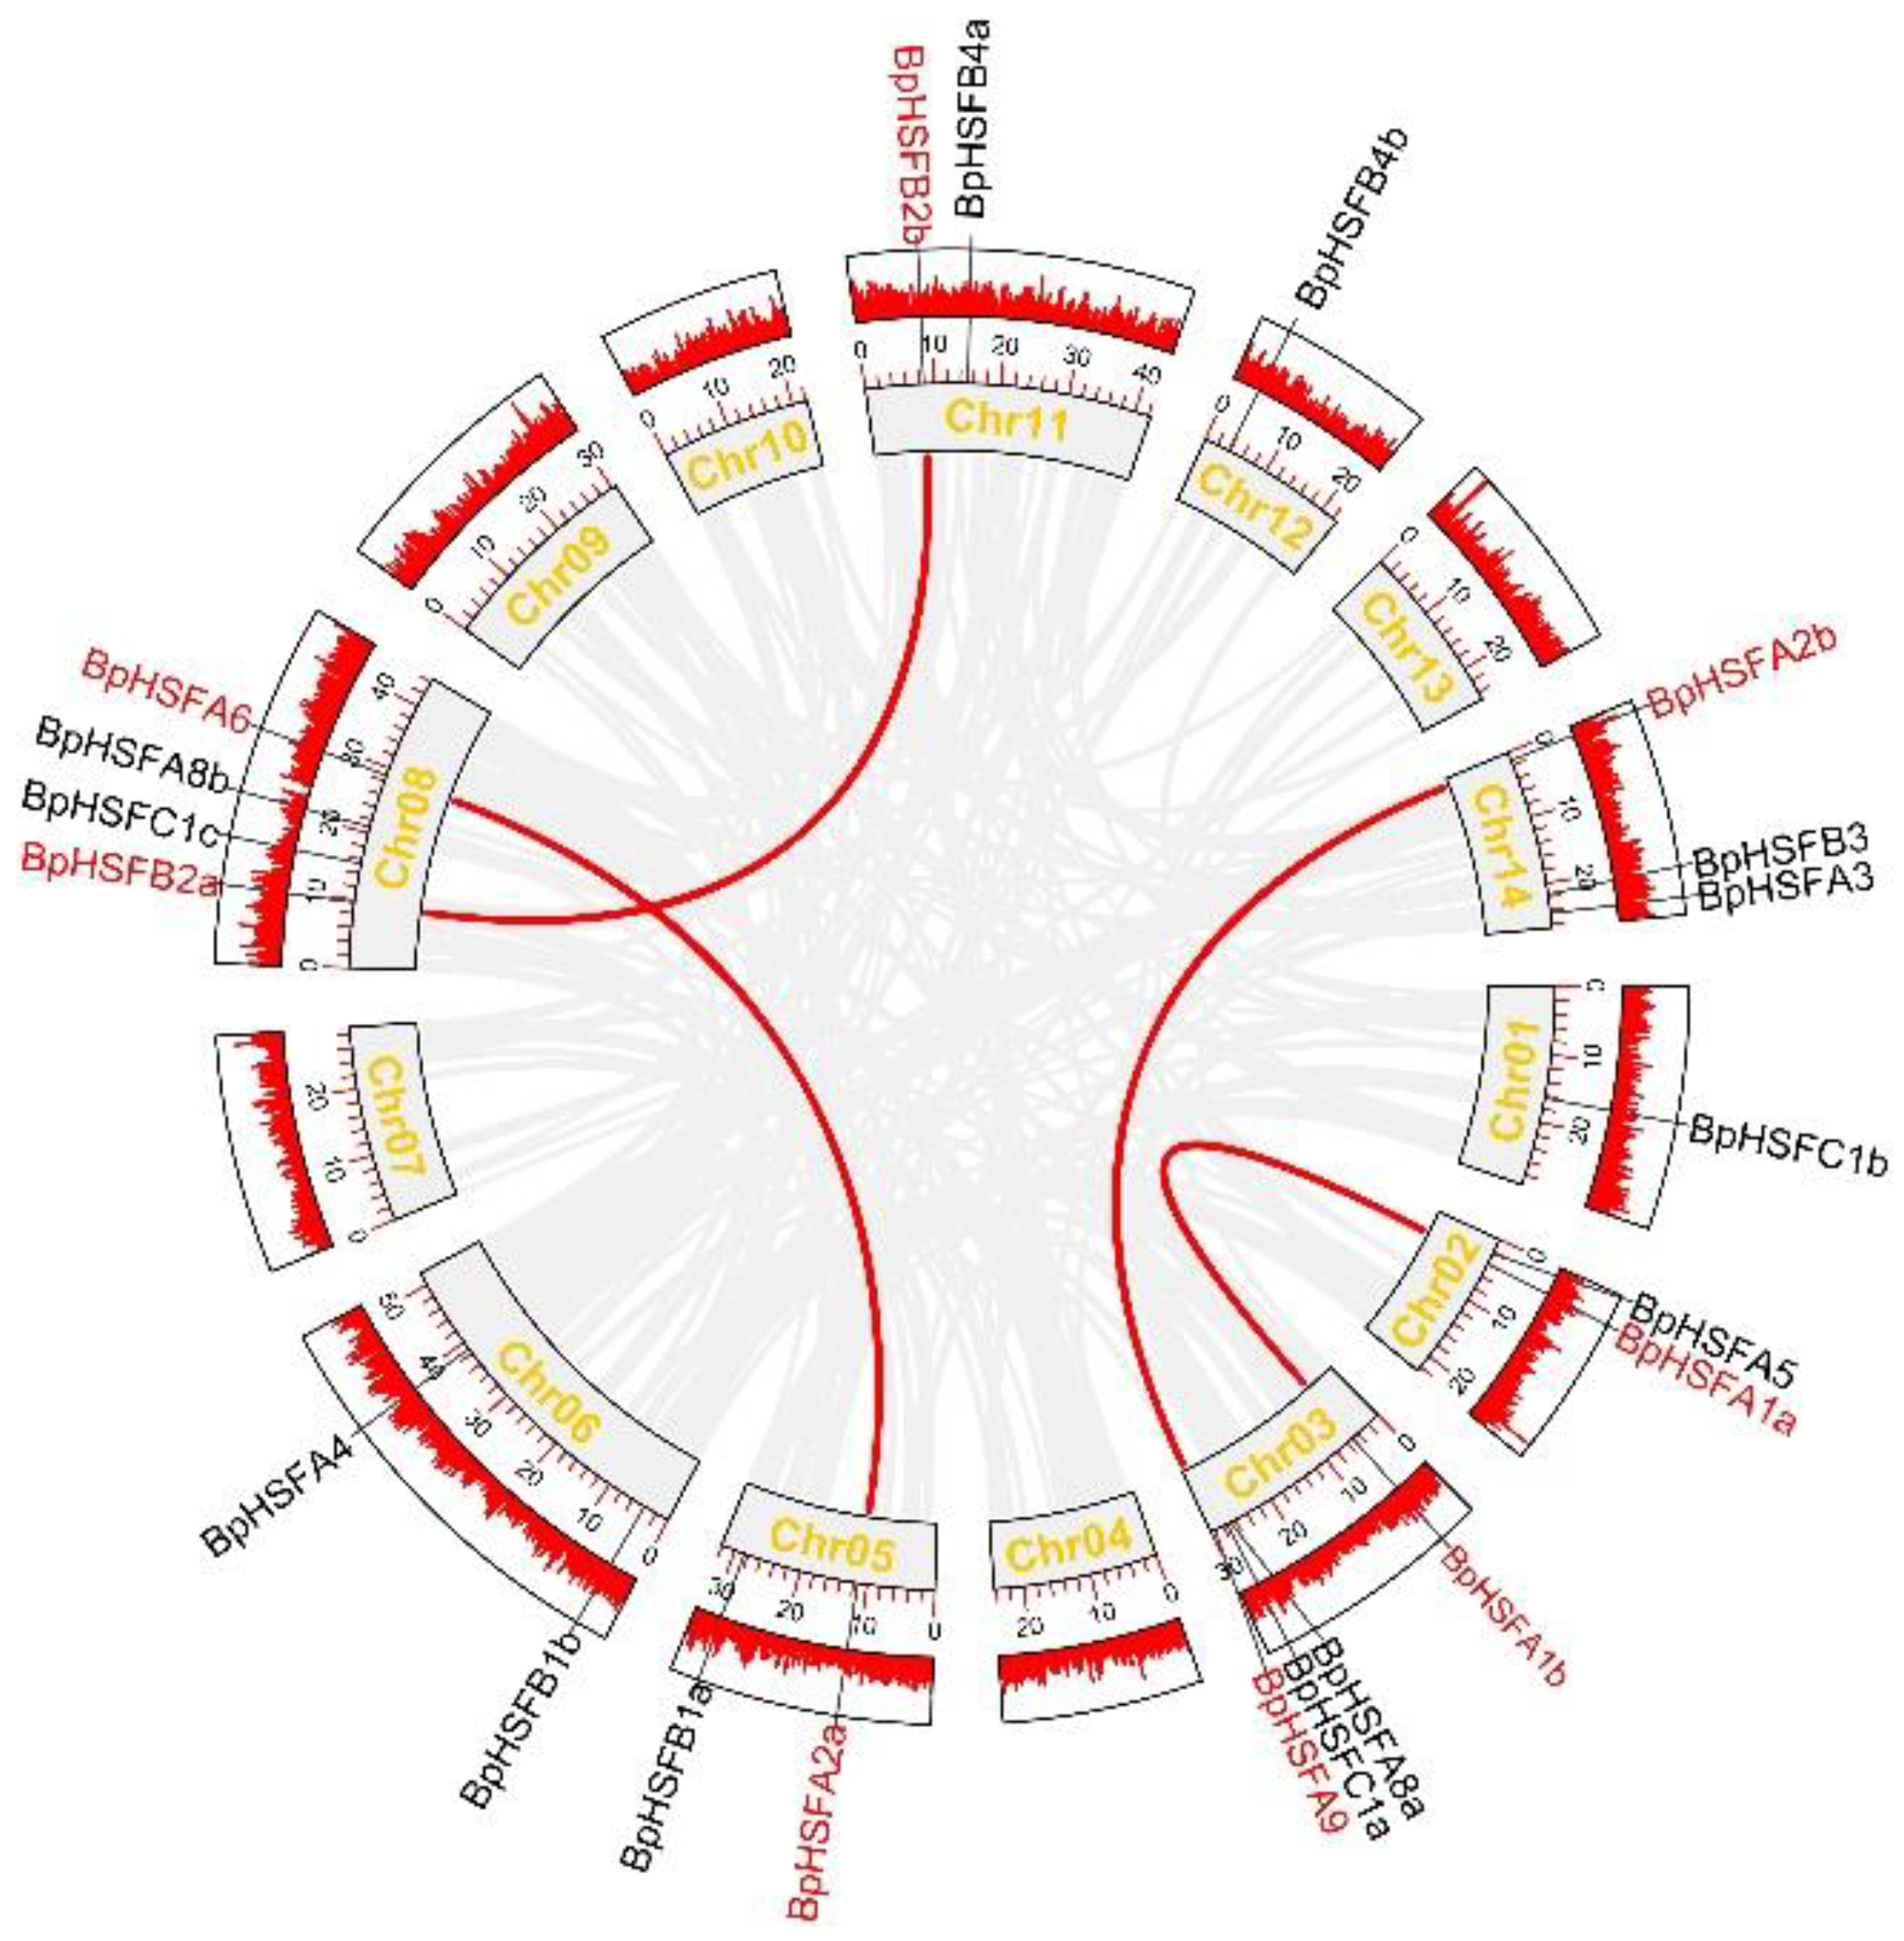
Figure 6.
Analysis of BpHSF gene colinearity with sixrepresentative plants. In the figuregray lines indicateregions of colinearity within the genomes of B. platyphylla and other plants, whileother colored lineshighlight thecolinear HSF gene pair.
Figure 6.
Analysis of BpHSF gene colinearity with sixrepresentative plants. In the figuregray lines indicateregions of colinearity within the genomes of B. platyphylla and other plants, whileother colored lineshighlight thecolinear HSF gene pair.
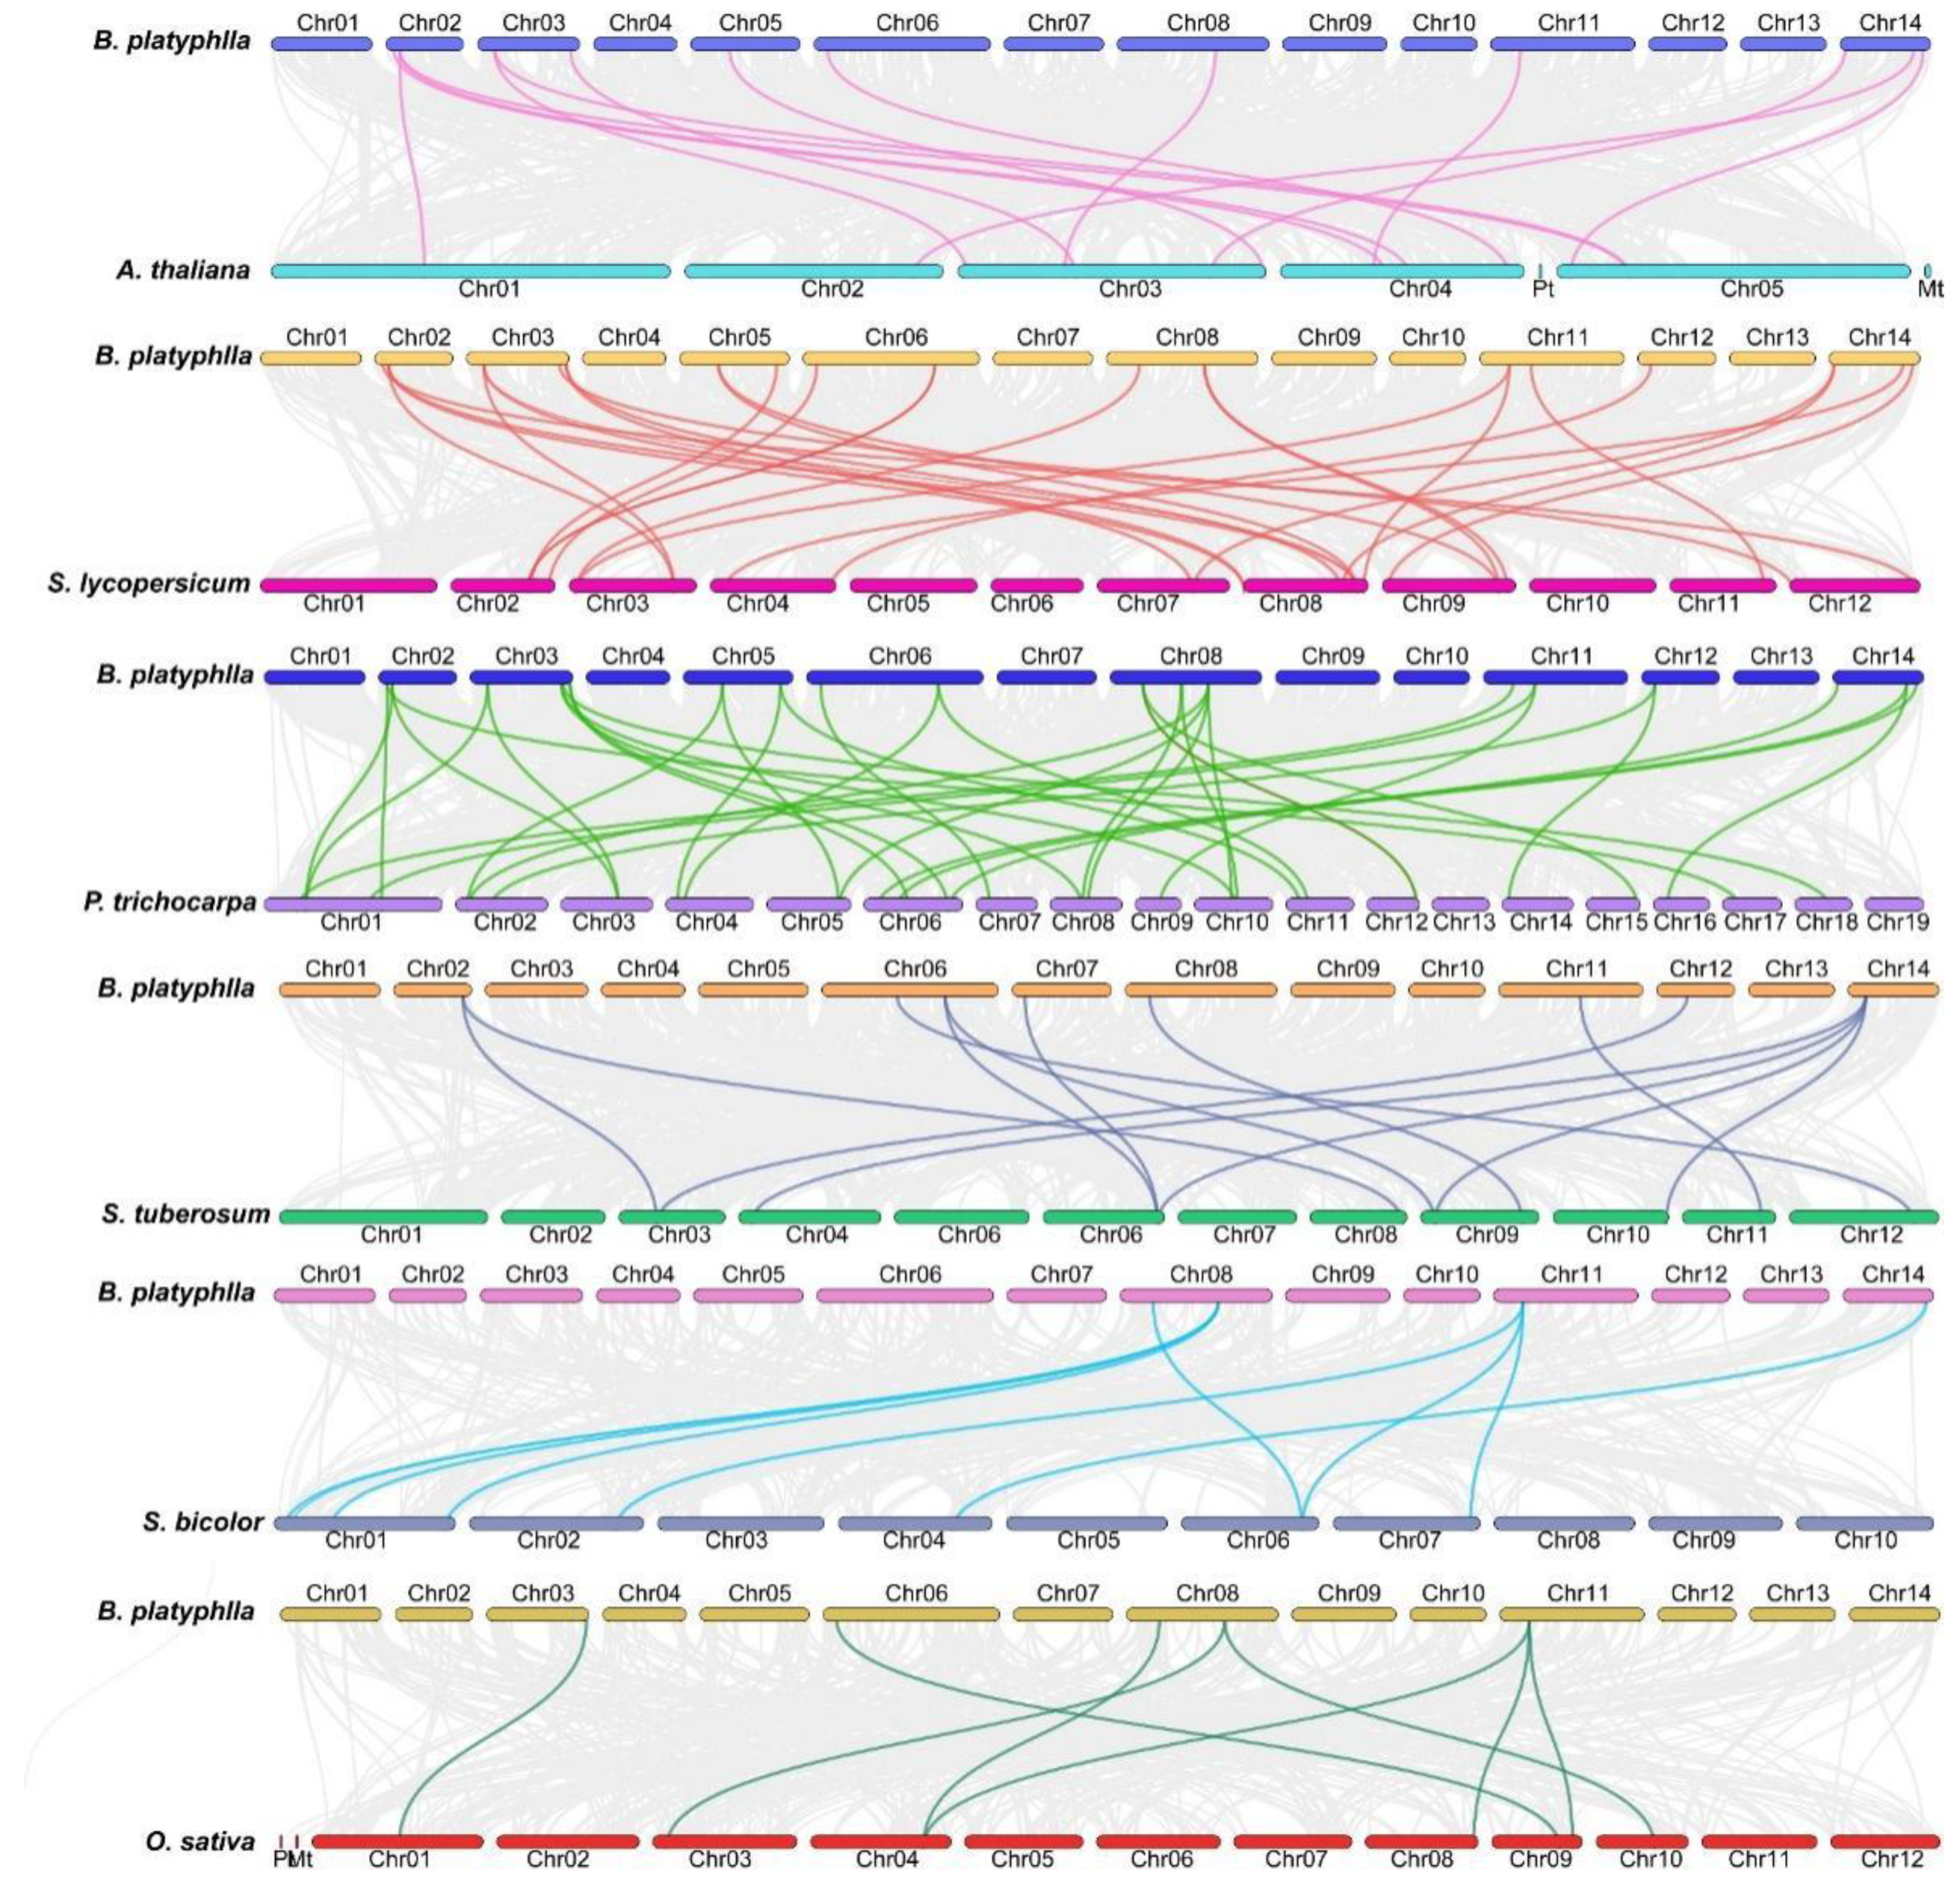
Figure 7.
Analysis of cis-acting regulatory elements (CREs) in the BpHSF gene family. (A) Positional distribution of various CRE types within the promoter regions, with distinct colored boxes representing different CRE types, some of which may overlap. (B) Number of cis-acting elements in the promoter regions of BpHSF genes, displayed in a heatmap where each cell indicates the number of specific CREs; cells in white denote the absence of corresponding elements.
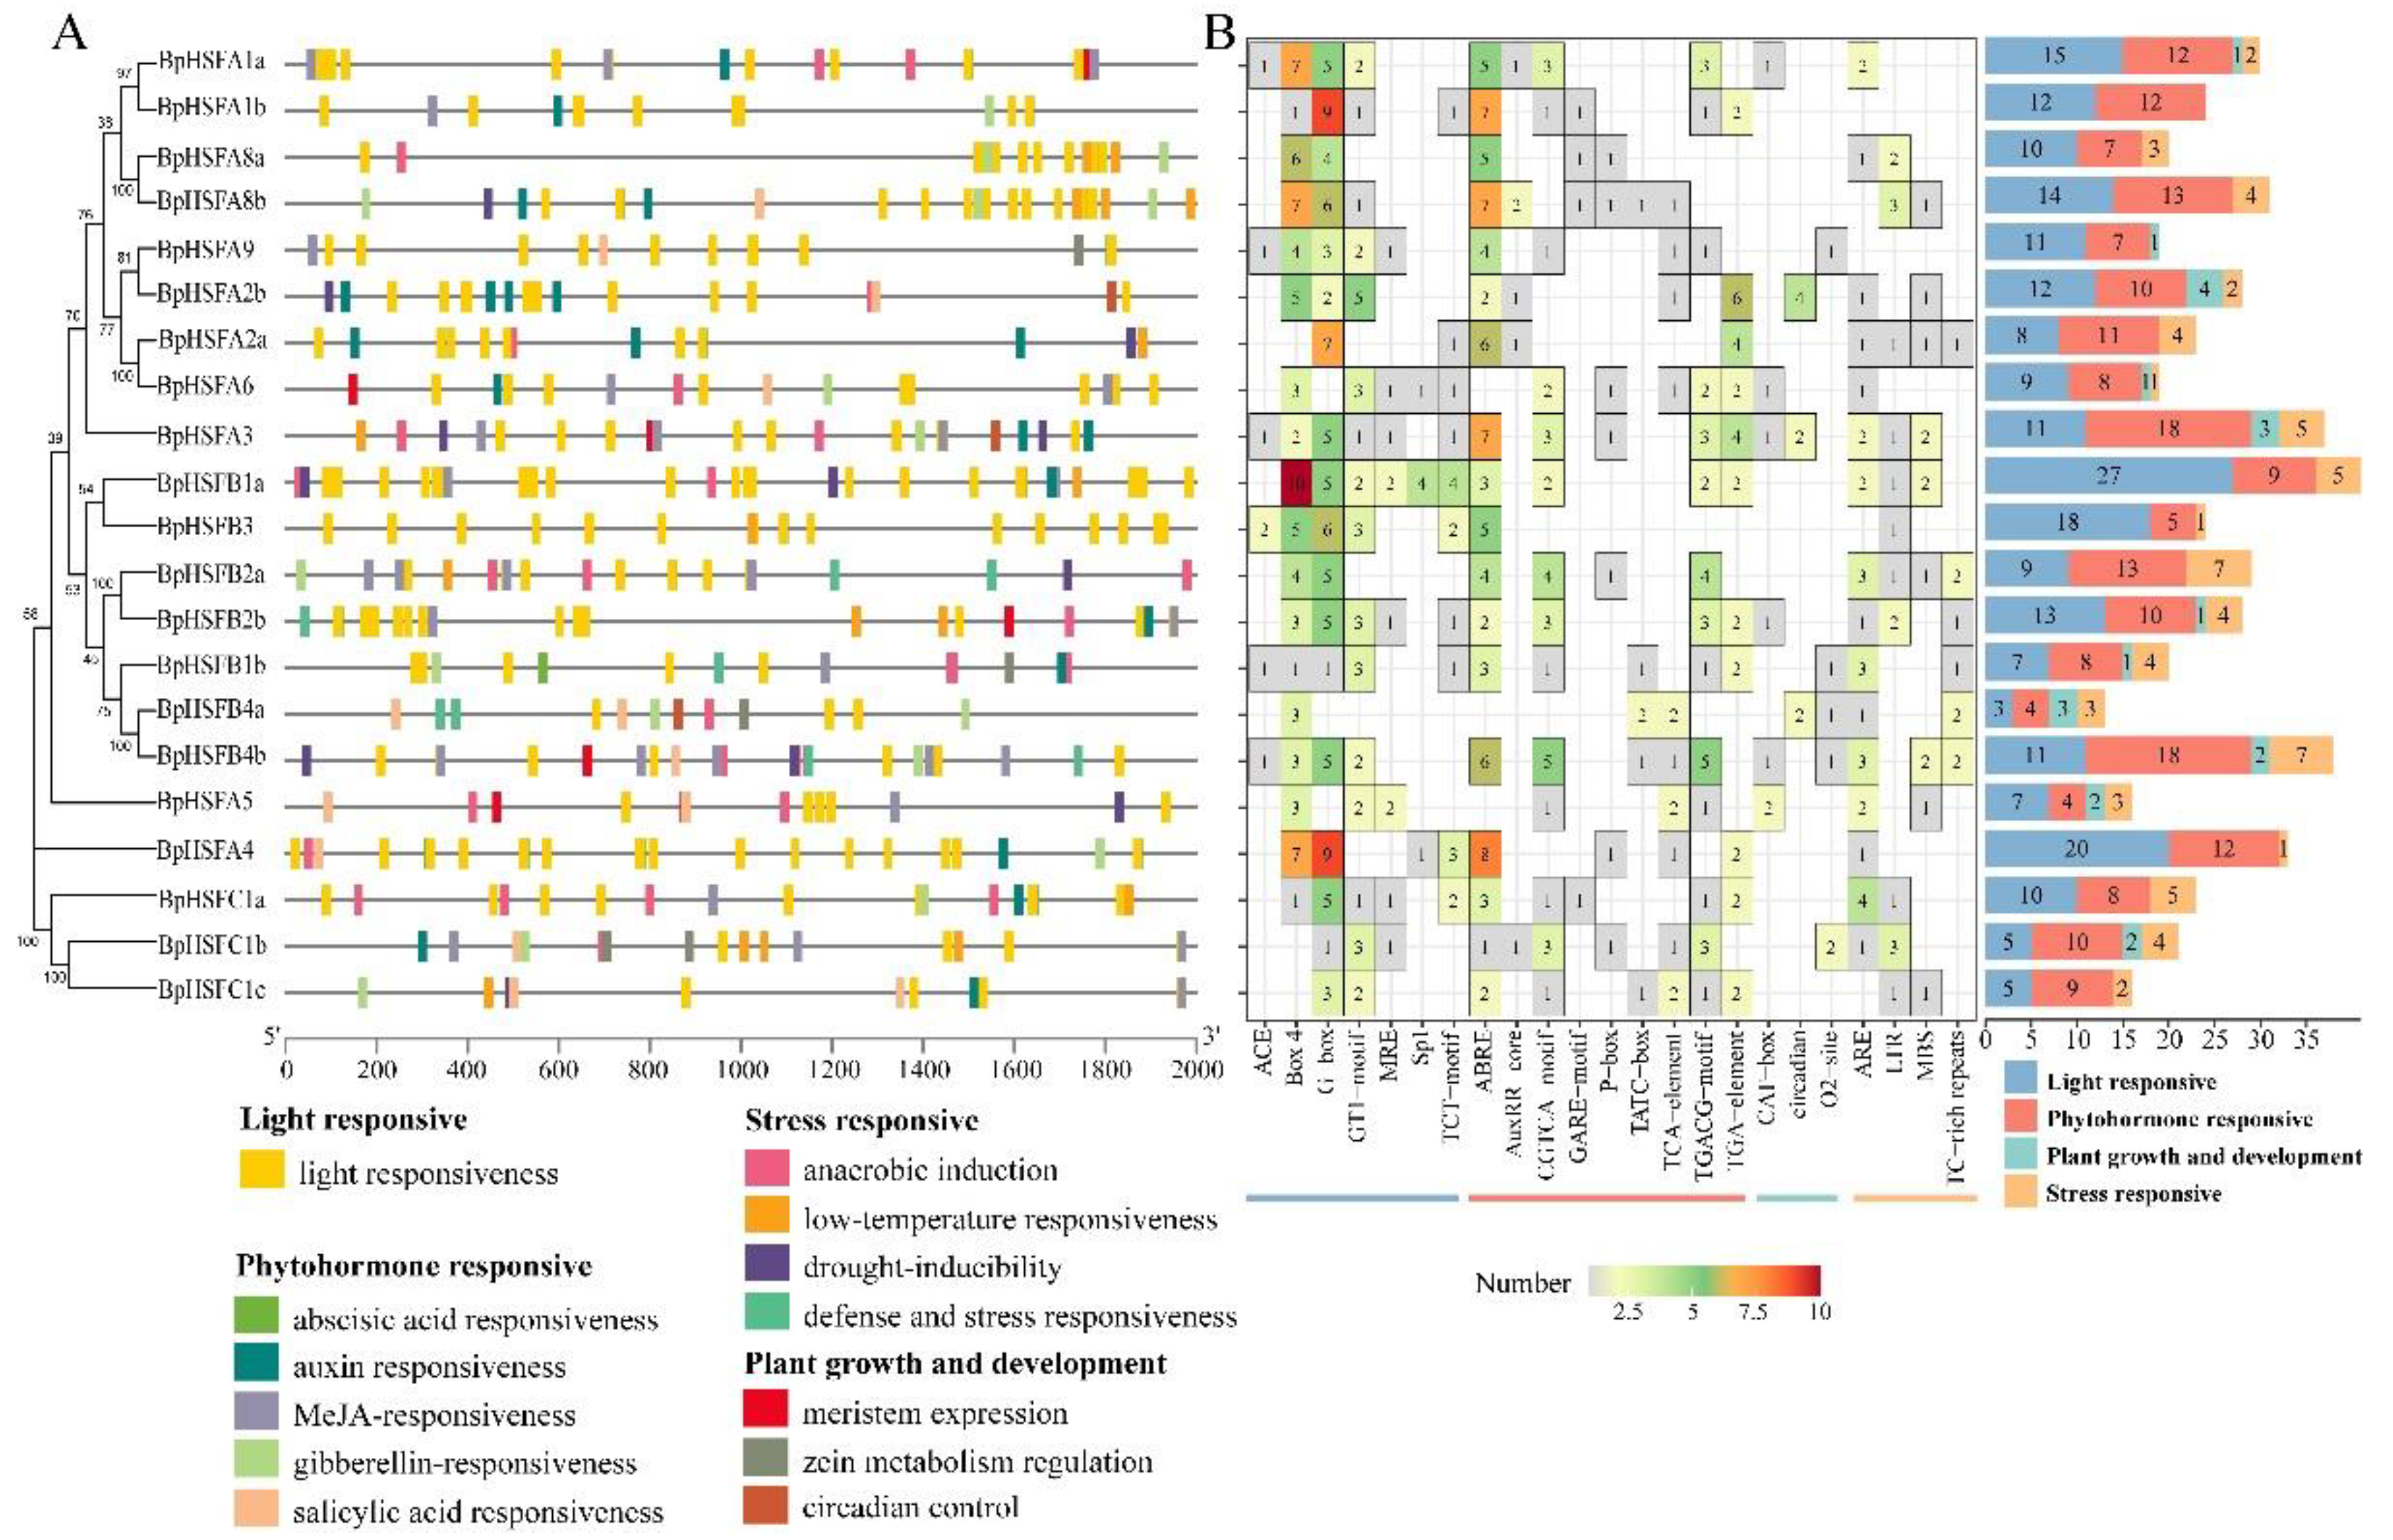
Figure 8.
Secondary and tertiary structure and subcellular localization of BpHSF proteins. (A) Predicted 3D structure of the BpHSF protein sequence, with α-helical domains indicated in blue and β-turn domains in dark red. (B) Subcellular localization of BpHSF proteins.
Figure 8.
Secondary and tertiary structure and subcellular localization of BpHSF proteins. (A) Predicted 3D structure of the BpHSF protein sequence, with α-helical domains indicated in blue and β-turn domains in dark red. (B) Subcellular localization of BpHSF proteins.
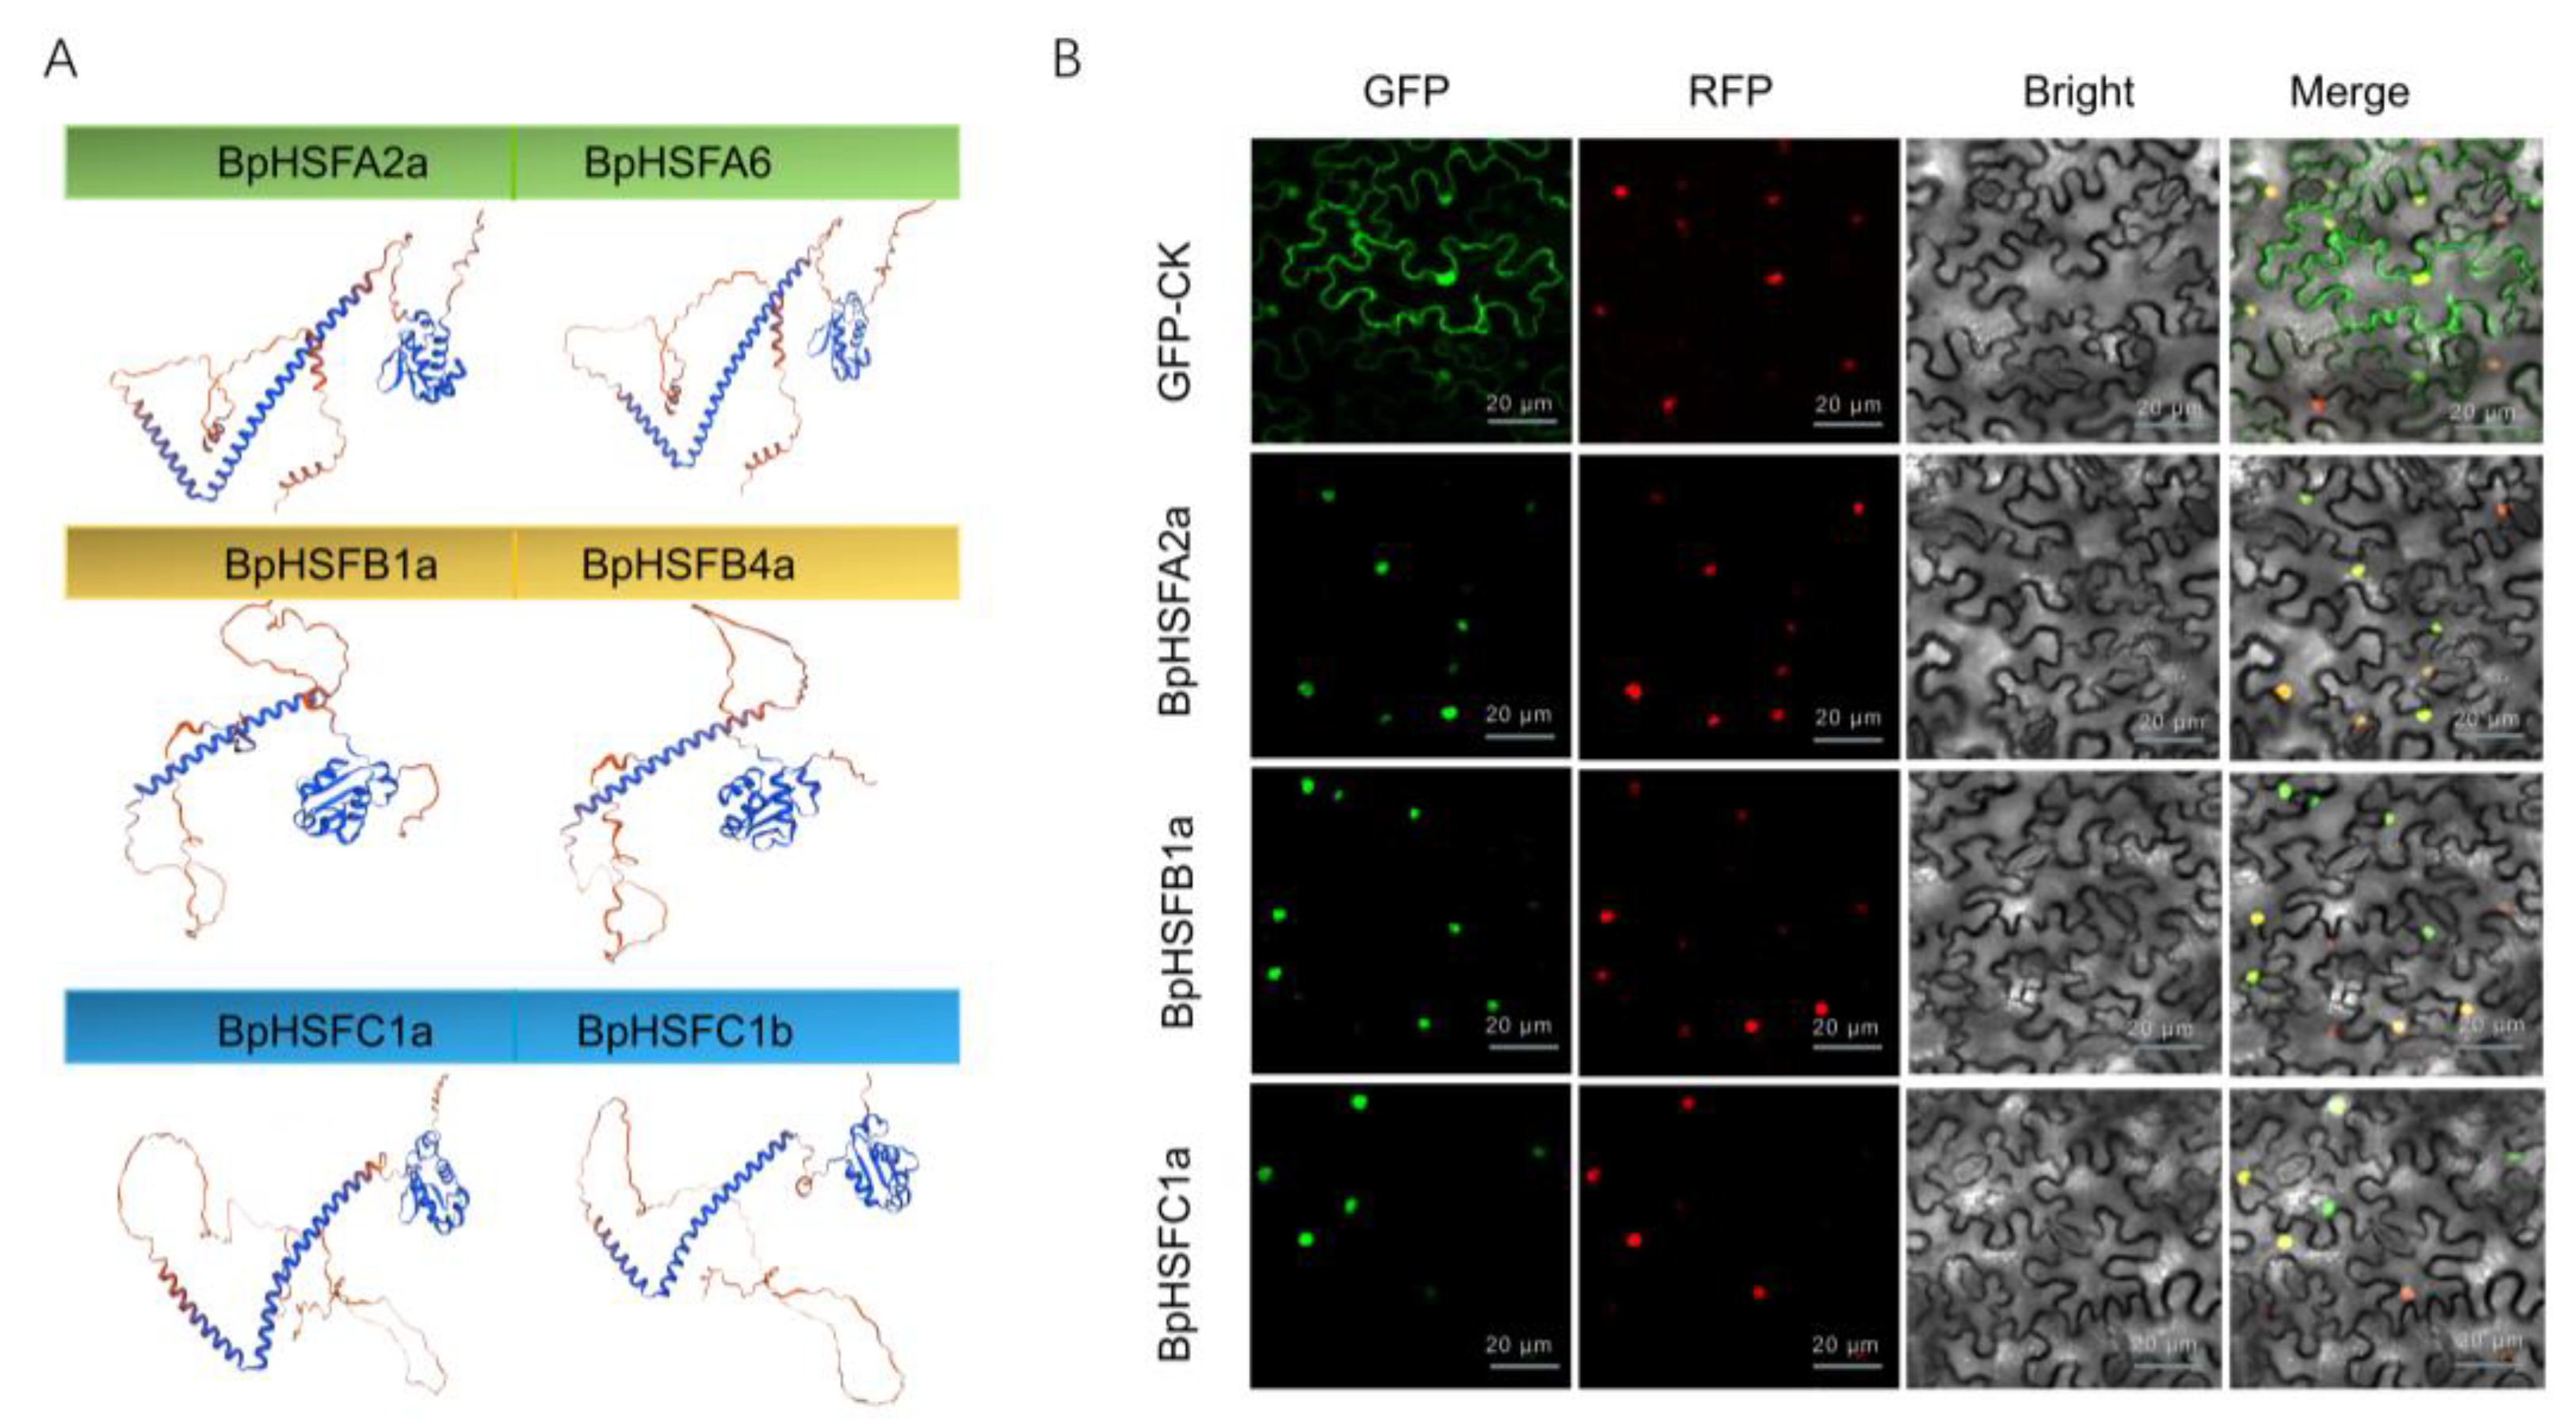
Figure 9.
Transcriptome-based expression profiling of BpHSF genes. (A) Tissue-specific expression patterns of BpHSF genes across three different tissues: roots, stems, and leaves. (B) Differential expression patterns of BpHSF genes under heat stress conditions. The color bars represent normalized expression levels (log2-transformed fold change), with red indicating upregulated genes, blue indicating downregulated genes, and white indicating no expression.
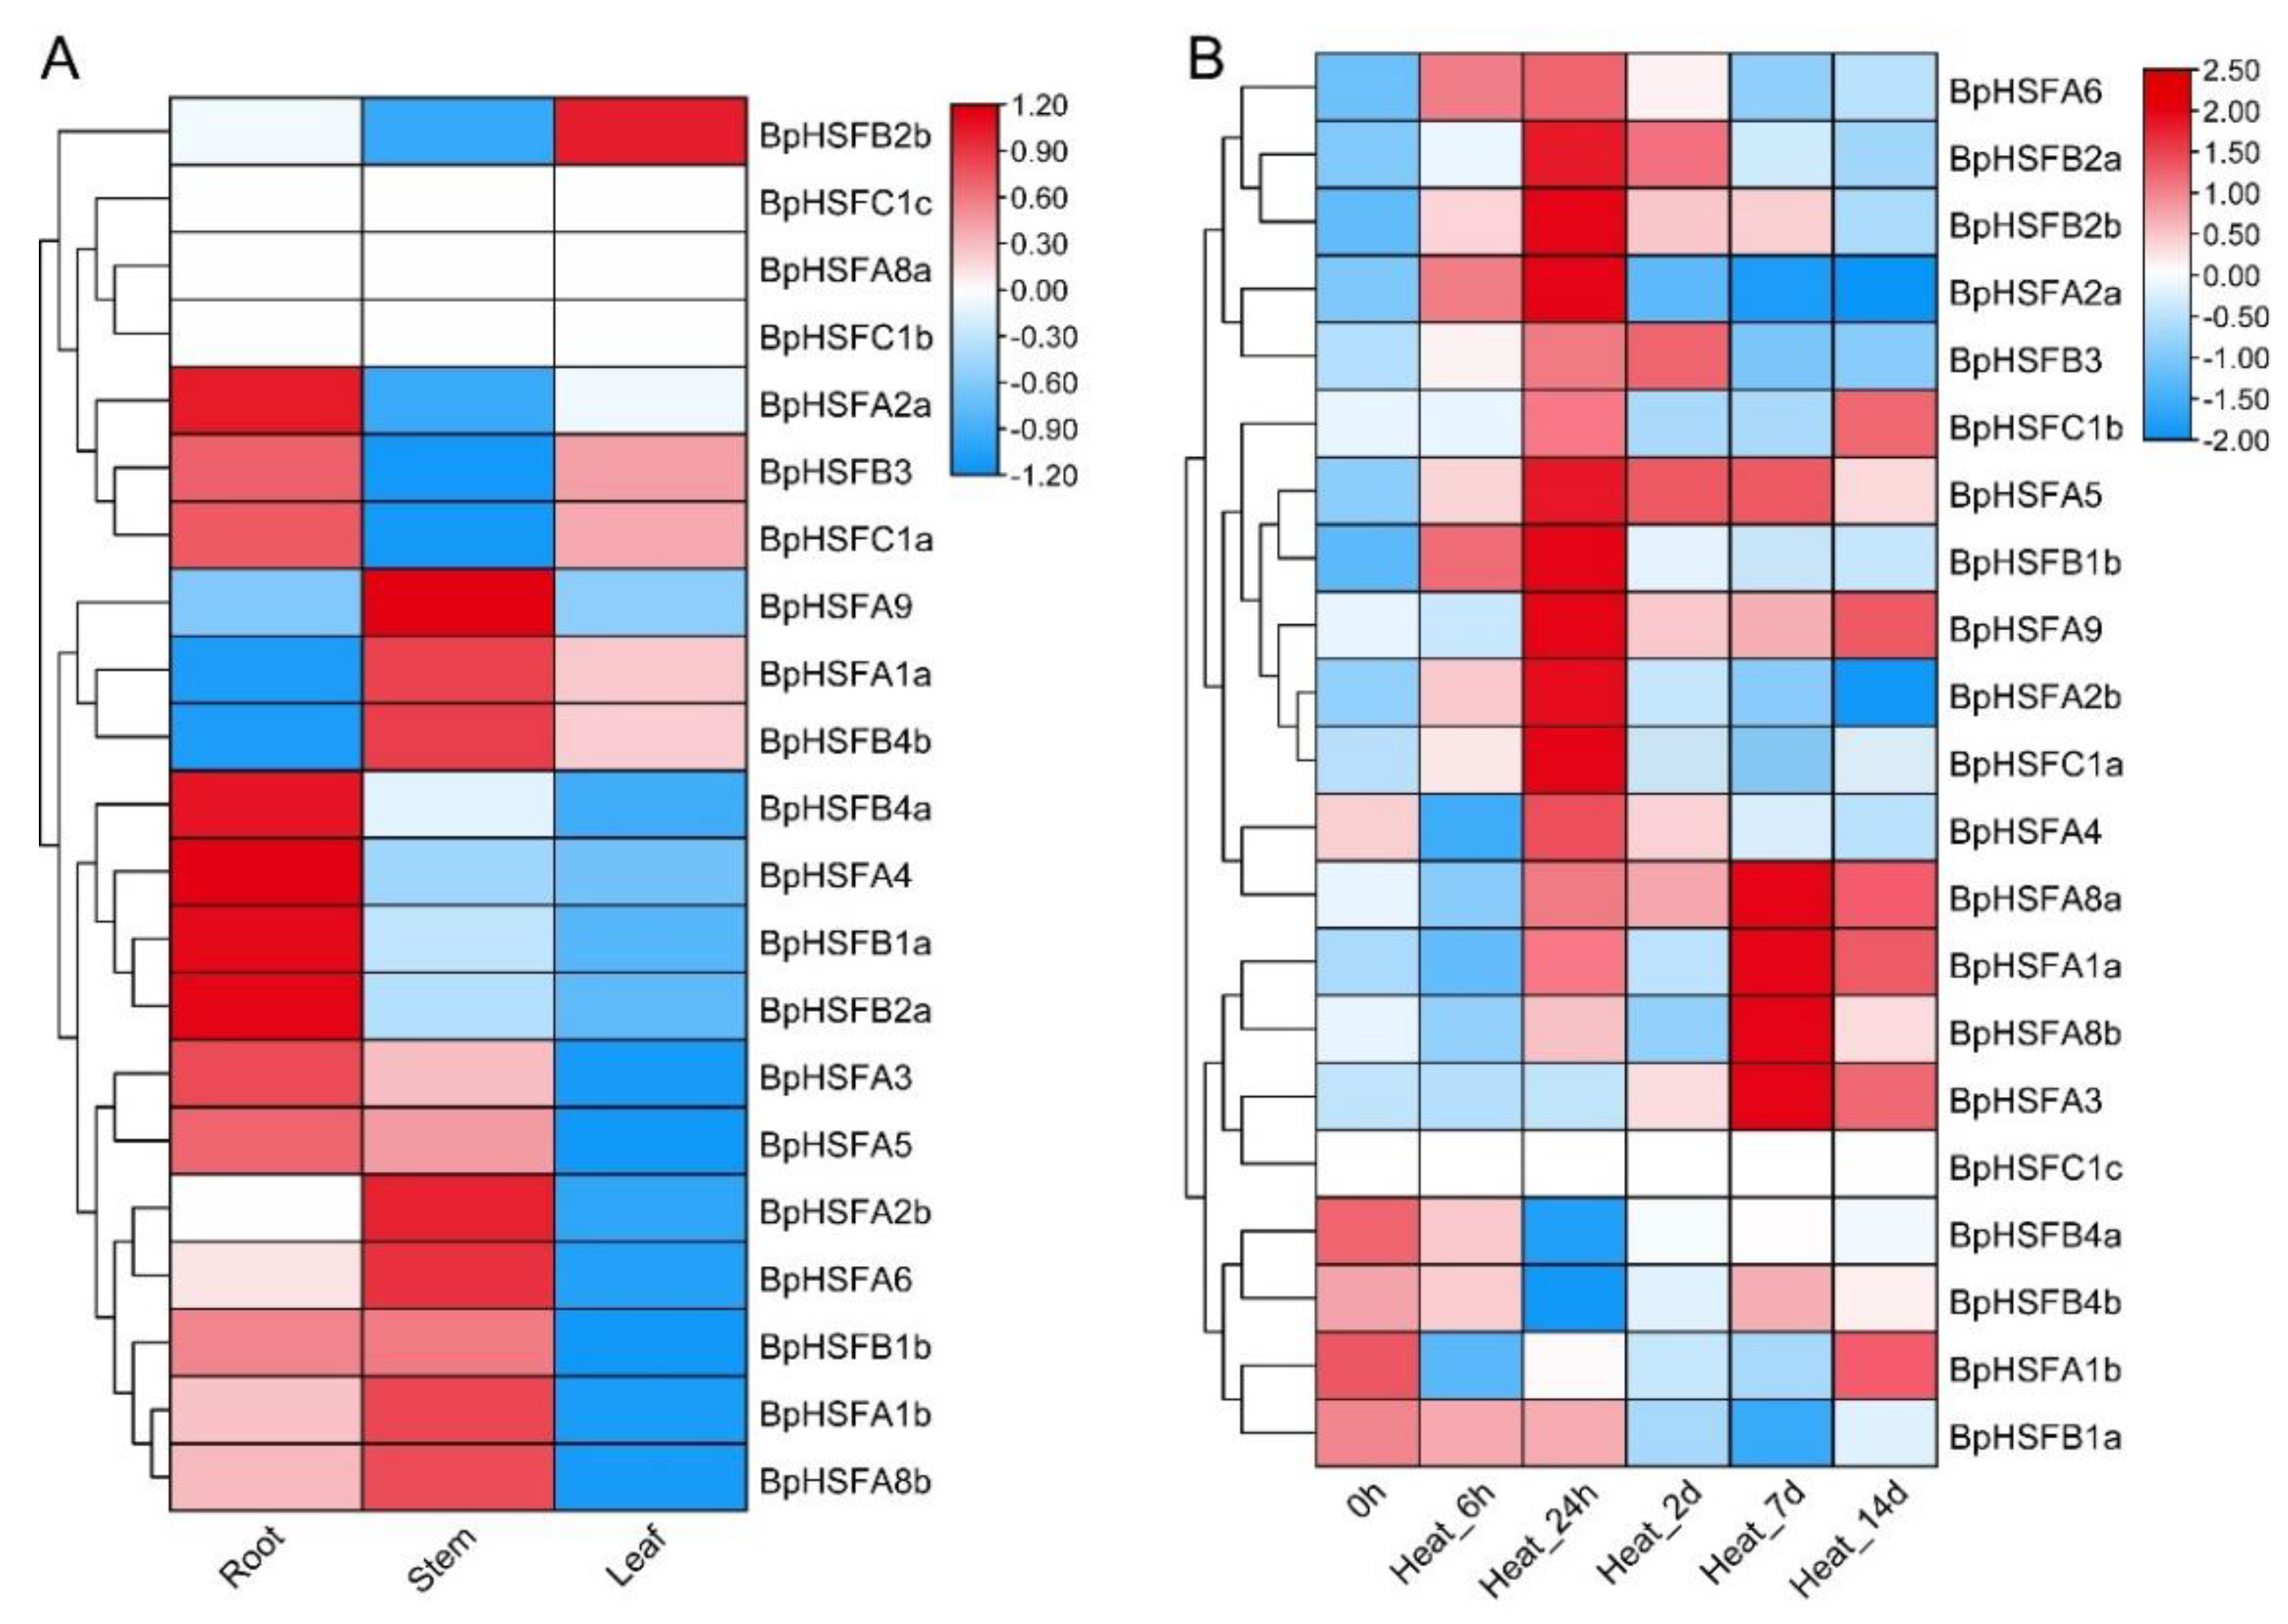
Figure 10.
qRT-PCR analysis of selected highly responsive BpHSF genes in leaf tissues under high-temperature stress. Asterisks above the bars indicate statistically significant differences between the stress-treated samples and their corresponding controls (* p < 0.05, ** p < 0.01, *** p < 0.0005, **** p < 0.0001).
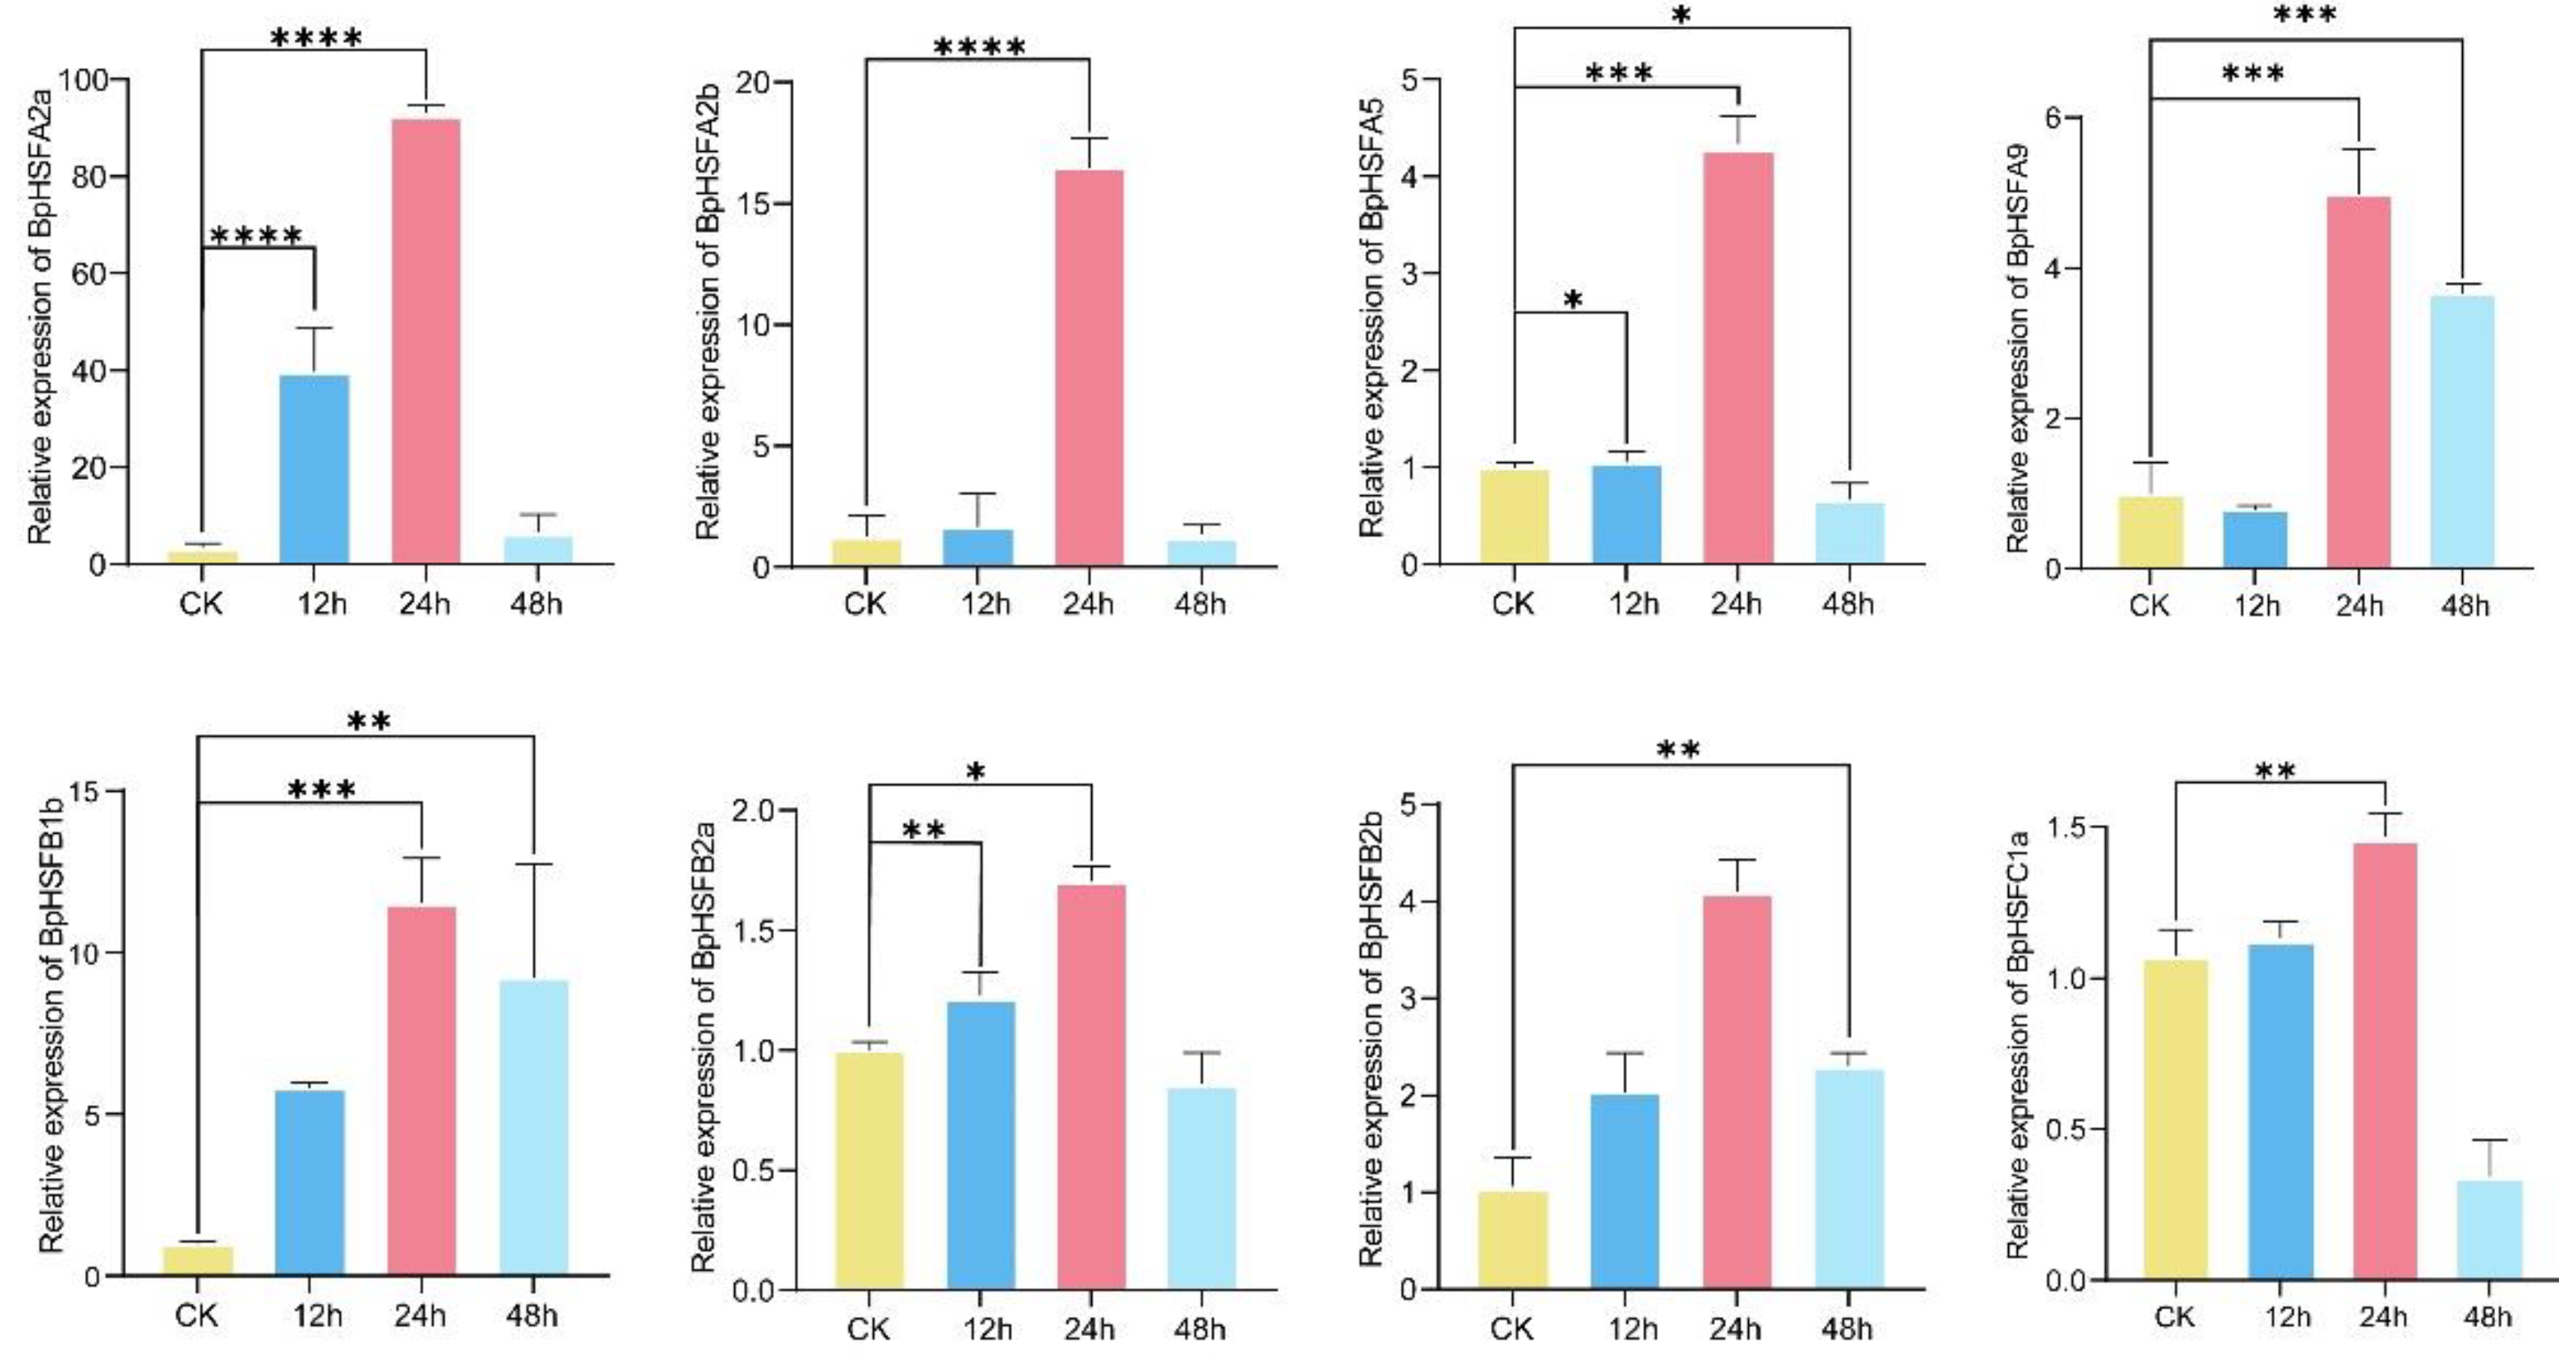
Figure 11.
Schematic representation of the mechanism underlying HSF transcription factor response to high temperature (modified from Bakery et al.[83];Zhang et al.[84];Guo et al. [85]). CaM, calmodulin; ROS, reactive oxygen species; TF, transcription factor; HSP, heat shock protein; ABA, abscisic acid; HSF, heat shock transcription factor; HSE, heat shock element.
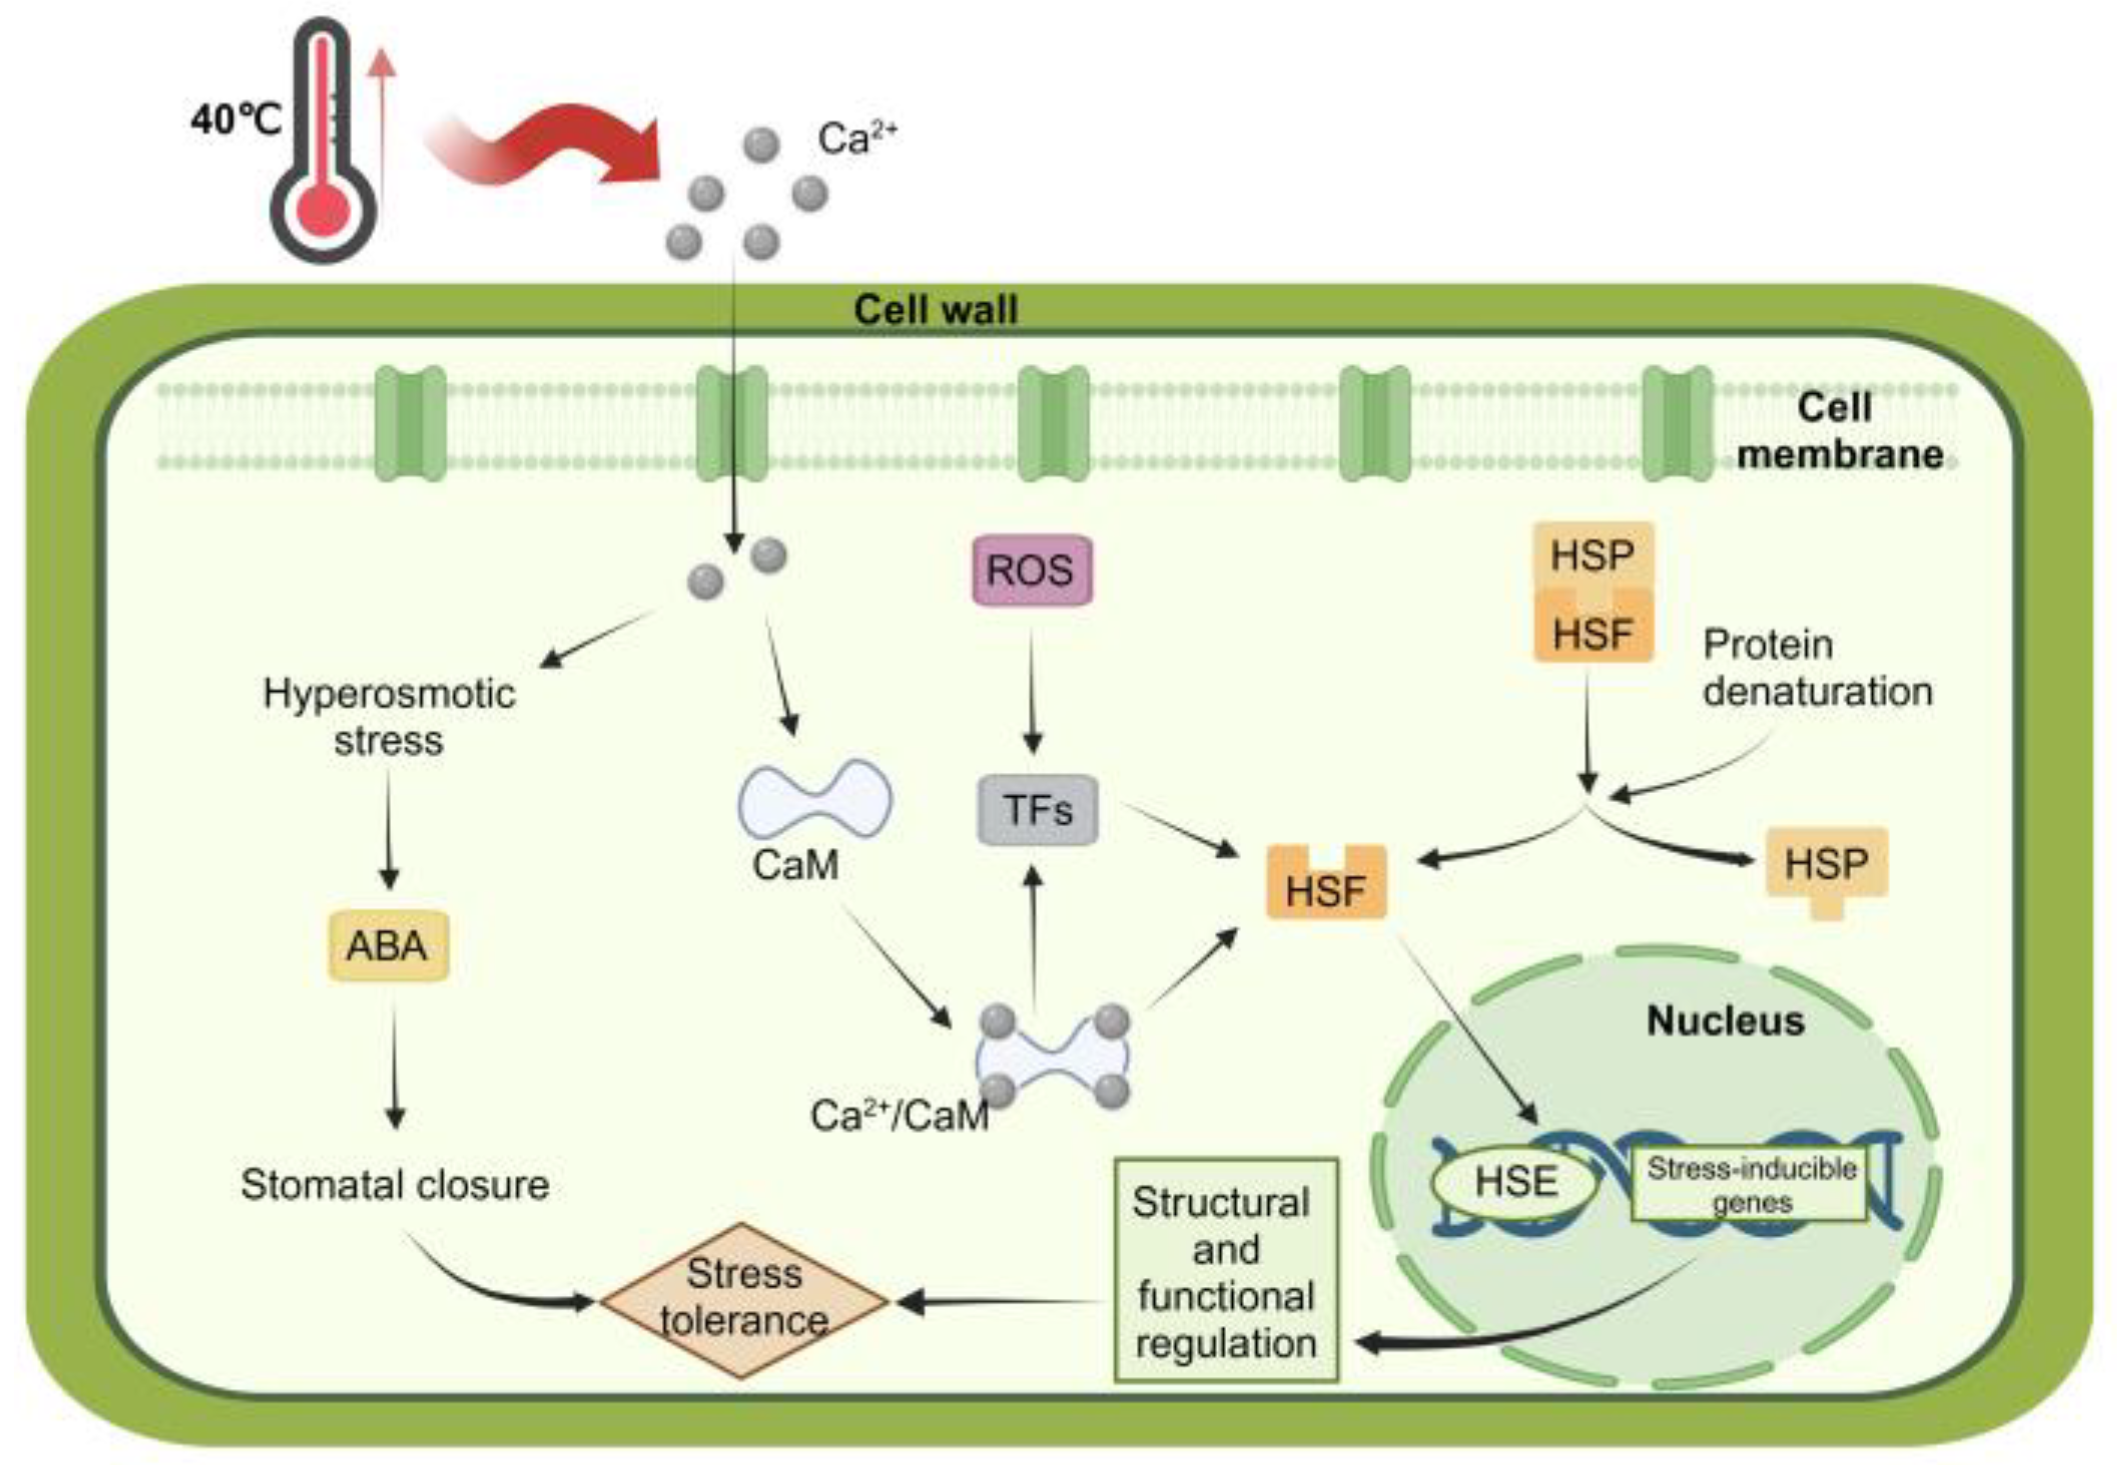

Table 1.
Physicochemical properties of proteins encoded by the 21 BpHSF genes in B. platyphylla.
| Number | Gene name | MF | MW | pI | II | AI | GRAVY | SL |
| 1 | BpHSFA1a | C2707H4259N761O880S27 | 62410.79 | 4.85 | 67.51 | 68.25 | -0.615 | Nucleus |
| 2 | BpHSFA1b | C2443H3836N696O789S23 | 56318.90 | 5.14 | 52.68 | 69.32 | -0.643 | Nucleus |
| 3 | BpHSFA2a | C1760H2779N509O536S14 | 40094.36 | 5.94 | 63.46 | 64.21 | -0.908 | Nucleus |
| 4 | BpHSFA2b | C1878H2982N540O608S13 | 43270.37 | 4.86 | 58.74 | 79.59 | -0.517 | Nucleus |
| 5 | BpHSFA3 | C2831H4389N759O901S18 | 64050.62 | 4.77 | 57.57 | 70.76 | -0.511 | Nucleus |
| 6 | BpHSFA4 | C1993H3072N552O615S16 | 45118.61 | 5.50 | 39.18 | 67.27 | -0.476 | Nucleus |
| 7 | BpHSFA5 | C2363H3686N678O765S13 | 54250.12 | 5.50 | 59.56 | 63.02 | -0.774 | Nucleus |
| 8 | BpHSFA6 | C1673H2617N473O507S12 | 37853.77 | 5.39 | 56.14 | 78.14 | -0.700 | Nucleus |
| 9 | BpHSFA9 | C2463H3909N681O822S22 | 56918.52 | 4.73 | 70.13 | 69.69 | -0.707 | Nucleus |
| 10 | BpHSFA8a | C1022H1586N284O309S7 | 23019.97 | 6.15 | 43.09 | 69.59 | -0.763 | Nucleus |
| 11 | BpHSFA8b | C1795H2828N490O578S23 | 41258.52 | 4.80 | 49.06 | 67.60 | -0.772 | Nucleus |
| 12 | BpHSFB1a | C1046H1643N291O315S11 | 23687.97 | 8.78 | 49.70 | 66.80 | -0.726 | Nucleus |
| 13 | BpHSFB1b | C1055H1653N305O364S9 | 24722.10 | 4.90 | 30.82 | 56.64 | -0.707 | Nucleus |
| 14 | BpHSFB2a | C1475H2318N416O468S10 | 33687.74 | 5.47 | 53.72 | 67.22 | -0.687 | Nucleus |
| 15 | BpHSFB2b | C1579H2492N454O528S6 | 36476.24 | 4.64 | 54.29 | 74.85 | -0.702 | Nucleus |
| 16 | BpHSFB3 | C1013H1615N293O316S10 | 23275.34 | 8.61 | 58.36 | 64.75 | -0.766 | Nucleus |
| 17 | BpHSFB4a | C1583H2405N441O469S10 | 35438.78 | 7.31 | 57.09 | 64.90 | -0.708 | Nucleus |
| 18 | BpHSFB4b | C1718H2657N475O508S13 | 38510.65 | 8.20 | 60.45 | 74.93 | -0.462 | Nucleus |
| 19 | BpHSFC1a | C1602H2508N446O496S19 | 36561.37 | 5.29 | 68.69 | 66.41 | -0.550 | Nucleus |
| 20 | BpHSFC1b | C1139H1770N310O349S15 | 25871.35 | 5.76 | 54.05 | 67.00 | -0.340 | Nucleus |
| 21 | BpHSFC1c | C822H1226N216O267S9 | 18694.60 | 4.34 | 55.65 | 53.63 | -0.351 | Nucleus |
Disclaimer/Publisher’s Note: The statements, opinions and data contained in all publications are solely those of the individual author(s) and contributor(s) and not of MDPI and/or the editor(s). MDPI and/or the editor(s) disclaim responsibility for any injury to people or property resulting from any ideas, methods, instructions or products referred to in the content. |
© 2024 by the authors. Licensee MDPI, Basel, Switzerland. This article is an open access article distributed under the terms and conditions of the Creative Commons Attribution (CC BY) license (http://creativecommons.org/licenses/by/4.0/).
Copyright: This open access article is published under a Creative Commons CC BY 4.0 license, which permit the free download, distribution, and reuse, provided that the author and preprint are cited in any reuse.


