
Submitted:
31 October 2025
Posted:
04 November 2025
You are already at the latest version
Abstract
C2H2-type zinc-finger proteins (ZFPs) are key transcriptional regulators of plant stress biology, yet their diversity and function in safflower remain unclear. Leveraging the “Jihong-1” reference, we investigated the C2H2 repertoire in safflower and identified 62 CtC2H2 genes. Comparative phylogeny with Arabidopsis resolved six robust subfamilies that share diagnostic exon-intron organizations and the conserved QALGGH motif. Promoter surveys uncovered abundant light-responsive elements (G-box, Box 4, GT1-motif) together with hormone-responsive ABRE and CGTCA/TGACG motifs, indicating multilayered regulation. Consistent with these features, RNA-seq and qRT-PCR revealed tissue-specific expression and strong inducibility under four treatments (cold, abscisic acid (ABA), methyl jasmonate (MeJA), and UV-B, with ABA eliciting the most pronounced responses, many genes peaking at 24 h. Functionally, ABA treatment doubled total leaf flavonoids at 24 h and shifted the flavonoid pathway transcriptome: CtCHS, CtFLS, CtDFR and CtANS increased, while CtF3H and CtF3′H decreased, aligning with induction of several CtC2H2 members (e.g., CtC2H2-02/15/21/22/23/24/35/45/47). All CtC2H2 proteins are predicted nuclear, hydrophilic factors with diverse pI values, supporting a role in transcriptional control. Together, these results establish a curated catalogue of safflower C2H2 ZFPs, define their stress- and hormone-responsive expression modules, and nominate candidate regulators linking ABA signaling to flavonoid biosynthesis. This resource provides tractable targets for engineering stress resilience and metabolite accumulation in a medicinal and oilseed crop.
Keywords:
C2H2 zinc-finger proteins
; Carthamus tinctorius
; abiotic stress response
; transcription factors
; flavonoid biosynthesis
; methyl jasmonate
1. Introduction
The introduction should briefly place the study in a broad context and highlight why it is important. It should define the purpose of the work and its significance. The current state of the research field should be carefully reviewed and key publications cited. Please highlight controversial and diverging hypotheses when necessary. Finally, briefly mention the main aim of the work and highlight the principal conclusions. As far as possible, please keep the introduction comprehensible to scientists outside your particular field of research. References should be numbered in order of appearance and indicated by a numeral or numerals in square brackets-e.g., [1] or [2,3], or [4,5,6]. See the end of the document for further details on references. Safflower (Carthamus tinctorius L.) is a widely cultivated member of the Asteraceae family valued in traditional Chinese medicine and as an oilseed crop, with pharmacological activities such as hypolipidemic [1], hypoglycemic [2], anti-inflammatory [3], antitumor [4], antithrombotic and neuroprotective [5] effects [6]. Its major metabolites include flavonoids, phenolic acids, and quinones. Among these, flavonoids serve as polyphenolic secondary metabolites involved in auxin transport, signal transduction, pigmentation, and abiotic-stress mitigation [7].
Zinc-finger proteins (ZFPs) are transcription factors with finger-like domains ubiquitous in eukaryotes that play pivotal roles in plant growth, development, and stress responses. ZFPs were first identified in Xenopus laevis oocytes [8] and contain a canonical Cys2/His2 motif (X_2C-X_2–4C-X_12H-X_2–8H) [9]. The tetrahedral “zinc finger” is formed when two Cys and two His residues chelate a zinc ion, stabilizing a β-hairpin/α-helix structure. ZFPs are classified by the number and spacing of these residues, including C2H2 (TFIIIA), C3HC4 (RING), C4 (GATA-type), and others [10]. The C2H2 subgroup constitutes one of the largest transcription-factor families in plants and is intimately linked to growth regulation. These genes are closely associated with plant development, hormonal signaling, and tolerance to biotic and abiotic stresses. Their proteins typically harbor a QALGGH DNA-binding motif, an EAR repression motif, a nuclear-localization B-box, a DLN transcriptional-regulation box, and a leucine-rich L-box[11].
Accumulating evidence demonstrates their functional breadth: EAR-type C2H2 factors enhance salt (AtZAT7) [12] and cold (AtZAT10) [13]. tolerance; others modulate trichome initiation, flowering time via histone modification of FLC [14],and fruit ripening. Genome-wide surveys now span numerous crops, including Arabidopsis [15], alfalfa [16], tomato [17], apple [18], rice [19], peppers [20], cucumis [21], potato [22], ginseng [23], lotus [24], and sweet potato [25]. Recent functional studies further show that overexpressing C2H2-ZFPs improves drought resilience in poplar [26], enhances root growth under osmotic stress in wheat [27], and modulates apple drought responses [28], highlighting their biotechnological promise.
However, to date no systematic analysis of C2H2-ZFPs has been conducted in safflower, despite the availability of its “Jihong-1” reference genome. Here, we identify 62 CtC2H2 genes and comprehensively analyze their physicochemical properties, phylogenetic relationships, gene structures, and expression profiles under low-temperature, ABA, MeJA, and UV-B treatments. Given that flavonoid accumulation is a hallmark of safflower’s medicinal value and a common stress response, our work lays a genomic foundation for unraveling the regulatory nexus between CtC2H2 transcription factors, secondary-metabolite biosynthesis, and stress adaptation, ultimately facilitating molecular breeding of stress-resilient, high-value cultivars.
2. Materials and Methods
2.1. Plant Material and Abiotic-Stress Treatments in Carthamus Tinctorius L.
The Jihong No.1 safflower variety (maintained at the Bioreactor Platform, Jilin Agricultural University) was germinated in moist germination trays. The seedlings were grown in an artificial-climate chamber at 25°C, 40% humidity, and 16 h light / 8 h dark photoperiod. After 3 days (d) of germination, the plants were cultured for 4 weeks, and uniformly sized seedlings were selected for several stress assays, including ultraviolet-B irradiation (UV-B 20,000 lx), abscisic acid (ABA, 200 μM), methyl jasmonate (MeJA, 200 μM), and low temperature exposure (4°C) [29]. Seedlings were sprayed with the respective solutions or sterile water (control) and incubated at 25 °C under normal light. For UV-B, samples were harvested at 0, 6, 12, 24, 36 and 48 h; for the other stresses at 0, 3, 6, 9, 12 and 24 h. Three biological replicates per time-point were snap-frozen in liquid nitrogen and stored at -80 °C for RNA extraction and metabolite analysis.
2.2. Identification of C2H2 Genes
Protein sequences of Arabidopsis thaliana C2H2-ZFPs were downloaded from TAIR (https://www.arabidopsis.org/) and used as queries in a bidirectional BLASTP search against the “Jihong-1” safflower genome implemented in TBtools. To obtain a comprehensive candidate list, we first screened plant C2H2-type zinc-finger proteins reported in the literature and then retrieved the Hidden Markov Model (HMM) profile for the C2H2 domain (PF00096) from Pfam 33.1 (https://pfam.xfam.org/). The PF00096 HMM was used in HMMER3 (v3.3) [30] to search the safflower proteome, complementing the BLASTP approach and ensuring recovery of highly divergent members. All putative sequences were uploaded to the NCBI Conserved Domain Search Service (CD-Search) to verify the presence of the canonical Cys₂His₂ motif and thereby confirm membership in the C2H2 family. Physicochemical parameters, including molecular weight (MW), theoretical isoelectric point (pI) and grand average of hydropathicity (GRAVY) were calculated with ProtParam (http://web.expasy.org/protparam/). Sub-cellular localization was predicted in WoLF PSORT (https://wolfpsort.hgc.jp/). Finally, redundant isoforms were removed, and domain-validated proteins were cataloged as CtC2H2 family members for downstream analyses.
2.3. Motifs and Gene Structure of the CtC2H2-ZFPs
Conserved motifs were identified with MEME Suite v5.5.3 (https://meme-suite.org; [31]) using a maximum of 15 motifs (width = 6–60 aa). Sequence logos were rendered in WebLogo 3 [32]. Coding sequences were aligned to their genomic loci, and exon–intron arrangements were extracted in TBtools v2.315 (https://github.com/CJ-Chen/TBtools)[33]. Motif and gene-structure diagrams were integrated side-by-side in TBtools for comparative visualization.
2.4. Phylogenetic Analysis of CtC2H2 Genes
Protein sequences of Arabidopsis thaliana C2H2-ZFPs (downloaded from TAIR, https://www.arabidopsis.org/) were included as reference taxa. Multiple-sequence alignment and neighbor-joining phylogeny were generated in MEGA 11 (https://www.megasoftware.net) [34] with 1 000 bootstrap replications (other settings default). The resulting topology was formatted and color-coded in EvolView v2 (https://www.evolgenius.info/evolview-v2/#login) [35] to obtain a publication-quality tree.
2.5. Cis-Elements Analysis in CtC2H2 Promoters
Based on the nucleotide sequences 2000 bp upstream of the transcription start site (TSS) of the 62 CtC2H2 genes downloaded from the safflower Genome Database, the sequences were submitted to the online database PlantCARE (Plant Cis-Acting Regulatory Element) [36] (http://bioinformatics.psb.ugent.be/webtools/plantcare/html/) for promoter cis-acting element analysis. The identified regulatory elements were categorized based on their functional roles, including light responsiveness, hormone regulation, and stress-related motifs [37]. The results were visualized using TBtools [33].
2.6. GO Functional Annotation Analysis of CtC2H2 Genes
Functional annotation analysis of the CtC2H2 gene family was performed using Blast2GO Version 6.0 [38,39] to annotate the gene family members in three key aspects: cellular component (CC), biological process (BP), and molecular functi-on (MF). The Gene Ontology (GO) enrichment analysis was conducted to categorize the genes based on their functional roles, including but not limited to transcriptional regulation, zinc ion binding, and response to abiotic stress [40].The data were processed, and the corresponding graphs, including bar plots and scatter plots representing GO term distributions, were plotted using R[41] with the ggplot2 package [42].
2.7. RNA Extraction and Real-Time Quantitative PCR
For expression validation, twelve CtC2H2 genes containing hormone-responsive cis-acting elements were selected as candidate genes. Gene-specific primers were designed using Primer3Plus [43] and synthesized by Bioengineering (Changchun) Co., Ltd (primers listed in Supplementary Table S2). Total RNA was extracted from samples using RNAiso Plus reagent (Takara Bio, Shiga, Japan) following the manufacturer's protocol. RNA quality and concentration were verified using a NanoDrop spectrophotometer (Thermo Fisher Scientific) and agarose gel electrophoresis. First-strand cDNA was synthesized from 1 μg of total RNA using ToloScript All-in-one RT EasyMix for qPCR (TOLOBIO, Shanghai, China), with oligo(dT) primers in a 20 μL reaction volume.
Quantitative real-time PCR (qRT-PCR) was performed on a QuantStudio 3 Real-Time PCR System (Applied Biosystems) using 2×Q5 SYBR qPCR Master Mix (Universal) (TOLOBIO). Each reaction mixture (20 μL total volume) contained: 2×Q5 SYBR qPCR Master Mix (10 μL); Gene-specific forward and reverse primers (0.4 μL each, 10 μM); cDNA template (1 μL); Nuclease-free dH2O (8.2 μL). The thermal cycling conditions were as follows: Initial denaturation: 95°C for 30 s; 40 cycles of (Denaturation: 95°C for 10 s; Annealing/extension: 60°C for 30 s); Melting curve analysis: performed using the instrument's default program to verify amplification specificity [44]). All reactions were performed in technical triplicates, along with no-template controls (NTCs) for each primer pair. The expression data were analyzed using the 2-ΔΔCt method [45], with Ct60S (KJ634810) employed as the internal reference gene for normalization [46]. Relative gene expression levels were calculated and presented as fold-changes compared to control samples.
2.8. Tissue-Specific CtC2H2 Gene Expression and Validation
To examine the spatial and temporal expression patterns of the CtC2H2 gene family, we analyzed the transcriptome data of safflower across multiple developmental stages. The expression profiles (FPKM values) of CtC2H2 genes were examined in various tissues including root, stem, leaf, bud, primordial, full bloom, decline, 10-day seedlings, 20-day seedling, and 30-day seedlings. Hierarchical clustering analysis was performed, and heat maps were plotted to visualize expression patterns using TBtools software [33],with a red to blue color gradient indicating relative transcript abundance high to low levels, respectively. This visualization approach effectively revealed tissue-specific and developmentally regulated expression patterns among CtC2H2 family members [47].
For Experimental validation, twelve CtC2H2 genes containing cis-acting regulatory elements associated with hormone-responsive pathways were selected for quantitative Real-time PCR analysis [44]. Total RNA was extracted from flowers, stems, and leaves of mature plants using TRIzol reagent (Invitrogen) following the manufacturer's protocol, and cDNA was synthesized using reverse transcriptase (Takara Bio). The qPCR reactions were performed in triplicate using SYBR Green Master Mix (Applied Biosystems) with gene-specific primers. Expression levels were normalized using reference genes (Ct60S (KJ634810)) and calculated using the 2-ΔΔCt method [45]. This validation confirmed the tissue-specific expression patterns observed in the transcriptome analysis.
2.9. Determination of Total Flavonoid Content and Detection of Key Flavonoid-Biosynthetic Genes
A 0.10 g aliquot of freeze-dried leaf tissue was finely ground and extracted with 2 mL of HPLC-grade methanol. The suspension was sonicated (40 kHz) at 50 °C for 1 h, cooled on ice, and centrifuged at 12 000 × g for 10 min. The supernatant was filtered through a 0.22 µm PTFE syringe filter and stored at –20 °C until analysis. Chromatographic separation and quantification were performed on an Agilent 1200 HPLC equipped with a ZORBAX 300SB-C18 column (5 µm, 4.6 × 250 mm). The isocratic mobile phase consisted of methanol : 0.4 % (v/v) formic-acid water = 1 : 1 at 1 mL min⁻¹. Detection was set at 360 nm and 25 °C. Rutin (Solarbio, Beijing) served as the external standard; a five-point calibration curve (0.01–0.20 mg mL⁻¹; R² > 0.999) was used to express results as mg rutin g⁻¹ DW [48]. Three biological replicates and three technical injections were analyzed for each treatment. Expression of key flavonoid-biosynthetic genes (CtCHS, CtCHI, CtF3H, CtF3′H, CtFLS, CtDFR, CtANS) was quantified by qRT-PCR exactly as described in 2.8; primer sequences are provided in Table S1. Relative transcript levels were normalized to Ct60S and calculated with the 2–ΔΔCt method [45].
2.10. Statistical Analysis
The qRT-PCR fold changes were calculated with the 2–ΔΔCt method [45]. All numerical values are expressed as mean ± standard error of three independent biological replicates unless otherwise indicated. Data processing and graph generation were performed in GraphPad Prism v8.0 (GraphPad Software, San Diego, CA, USA). One-way analysis of variance (ANOVA) followed by Tukey’s honestly significant difference (HSD) post-hoc test was used to assess statistical significance among multiple treatments. Significance levels are denoted as *P < 0.05, **P < 0.01, and *P < 0.001.
3. Results
3.1. Identification of CtC2H2 Gene and Analysis of Physicochemical Properties
A total of 62 C2H2-type zinc-finger transcription factors (TFs) were retrieved from the safflower genome by BLASTP screening and subsequent verification with the NCBI's Batch CD-Search software to to confirm the presence of the canonical Cys₂/His₂ domain. These genes were designated CtC2H2-01 through CtC2H2-62 (Table S1). Protein lengths span 134–1 191 aa, with calculated molecular weights of 15.57–132.76 kDa and theoretical pI values of 4.84–10.91. Instability indices vary from 31.1 to 85.9; only CtC2H2-17, -19, -53, and -57 fall below the empirical stability threshold (II < 40). Aliphatic indices range between 47.64 and 79.93, whereas grand average hydropathicity (GRAVY) scores from –1.137 to –0.305 indicate that all CtC2H2 proteins are strongly hydrophilic. WoLF PSORT classified every CtC2H2 protein as nuclear, supporting their function as transcription factors [49]. The CtC2H2 complement (n = 62) is close to the 58-member C2H2 set recently documented in apple [18] yet markedly smaller than the 99 genes identified in tomato [17], highlighting lineage-specific expansion among dicotyledons.
3.2. Phylogenetic Analysis
To clarify the evolutionary relationship between safflower and Arabidopsis C2H2-type zinc-finger proteins, we constructed a phylogenetic tree from 62 CtC2H2 proteins and 39 Arabidopsis C2H2 members using MEGA 11 (neighbor-joining algorithm, 1 000 bootstrap replications) [34]. The resulting topology (Figure 1) resolved the CtC2H2 family into six well-supported subfamilies (Ⅰ–Ⅵ), mirroring the clade structure reported for tomato [17] and apple [18]. Subfamily counts were as follows: I, 12 genes; II, 12 genes; III, 5 genes; IV, 16 genes; V, 10 genes; and VI, 7 genes—together accounting for all 62 CtC2H2 members. This pattern suggests lineage-specific gene expansion, particularly in subfamily IV, which harbors >25 % of the total family and may reflect adaptive diversification in safflower.
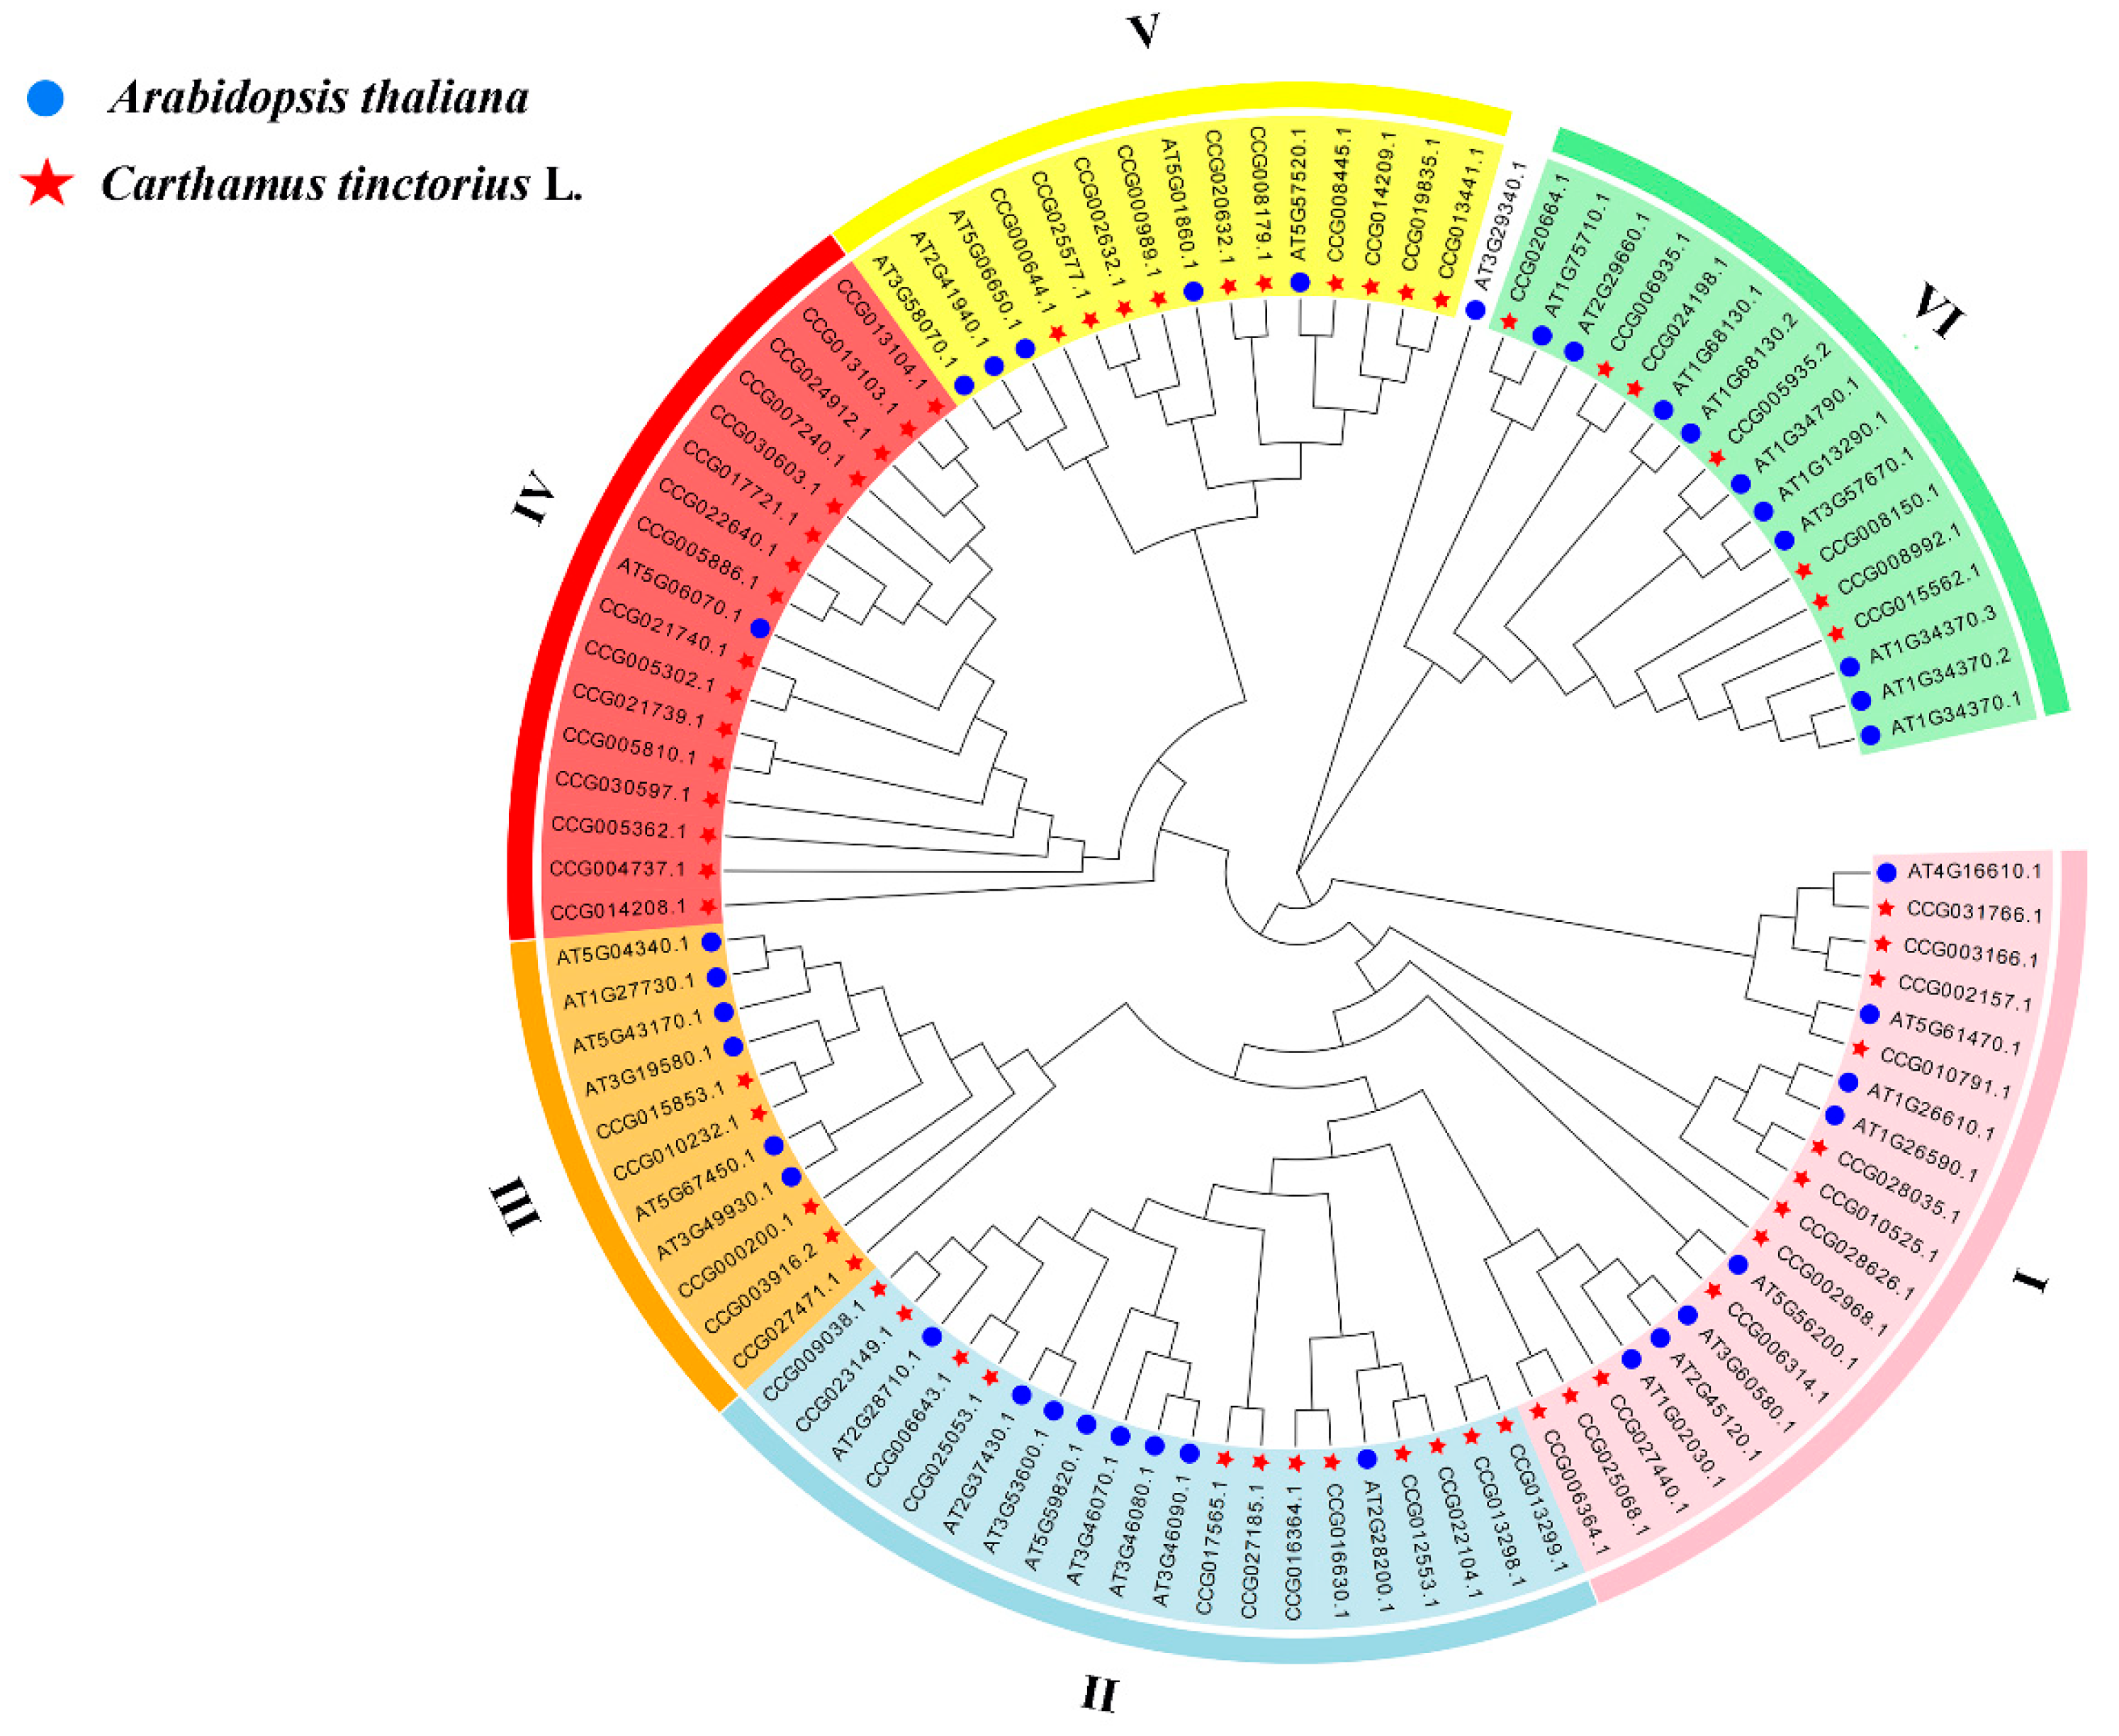
Figure 1.
Phylogenetic tree of C2H2 proteins in Arabidopsis thaliana and Carthamus tinctorius L. The C2H2 protein sequences of the two species were aligned by MEGA X and the tree was built with the NJ method. The tree was further categorized into six distinct subfamilies in different colors.
Figure 1.
Phylogenetic tree of C2H2 proteins in Arabidopsis thaliana and Carthamus tinctorius L. The C2H2 protein sequences of the two species were aligned by MEGA X and the tree was built with the NJ method. The tree was further categorized into six distinct subfamilies in different colors.
3.3. Cis-Acting Elements of the CtC2H2-ZFPs
In order to reveal the diversity of the CtC2H2 family, 15 conserved motifs in its full-length protein sequence were analyzed according to the phylogenetic tree using MEME and TBtools, and the 15 motifs analyzed were named Motif 1-15. Among them, Motif 1 is present in 62 CtC2H2 genes, suggesting that it is highly conserved and potentially important in the CtC2H2 gene family. In addition, other motifs have inter-family similarities. For example, subfamilies I, II, and III all contain Motif 1 and Motif 2, and subfamilies IV and V all contain Motif 1 and Motif 7. Motif 1 and Motif 2 both contain the QALGGH sequence, a core sequence, and Motif 5 contains the DLNL sequence, an EAR motif that has been shown to play an important role in transcriptional repression and abiotic stress response (Figure S3). Motif 3 contains EXEXXAXCLXXL (L-box), a leucine-rich region thought to play an important role in protein-protein interactions. Among the C2H2-ZFPs identified, four of the 12 members of subfamily I are intron-deficient; there are no introns in subfamilies II and V; among the five members of subfamily III, one intron is missing; among the 16 members of subfamily IV, four are intron-deficient; and among the seven members of subfamily VI, five are intron-deficient. Among them, subfamily IV has the highest proportion of intron-deficient genes (71.4%).
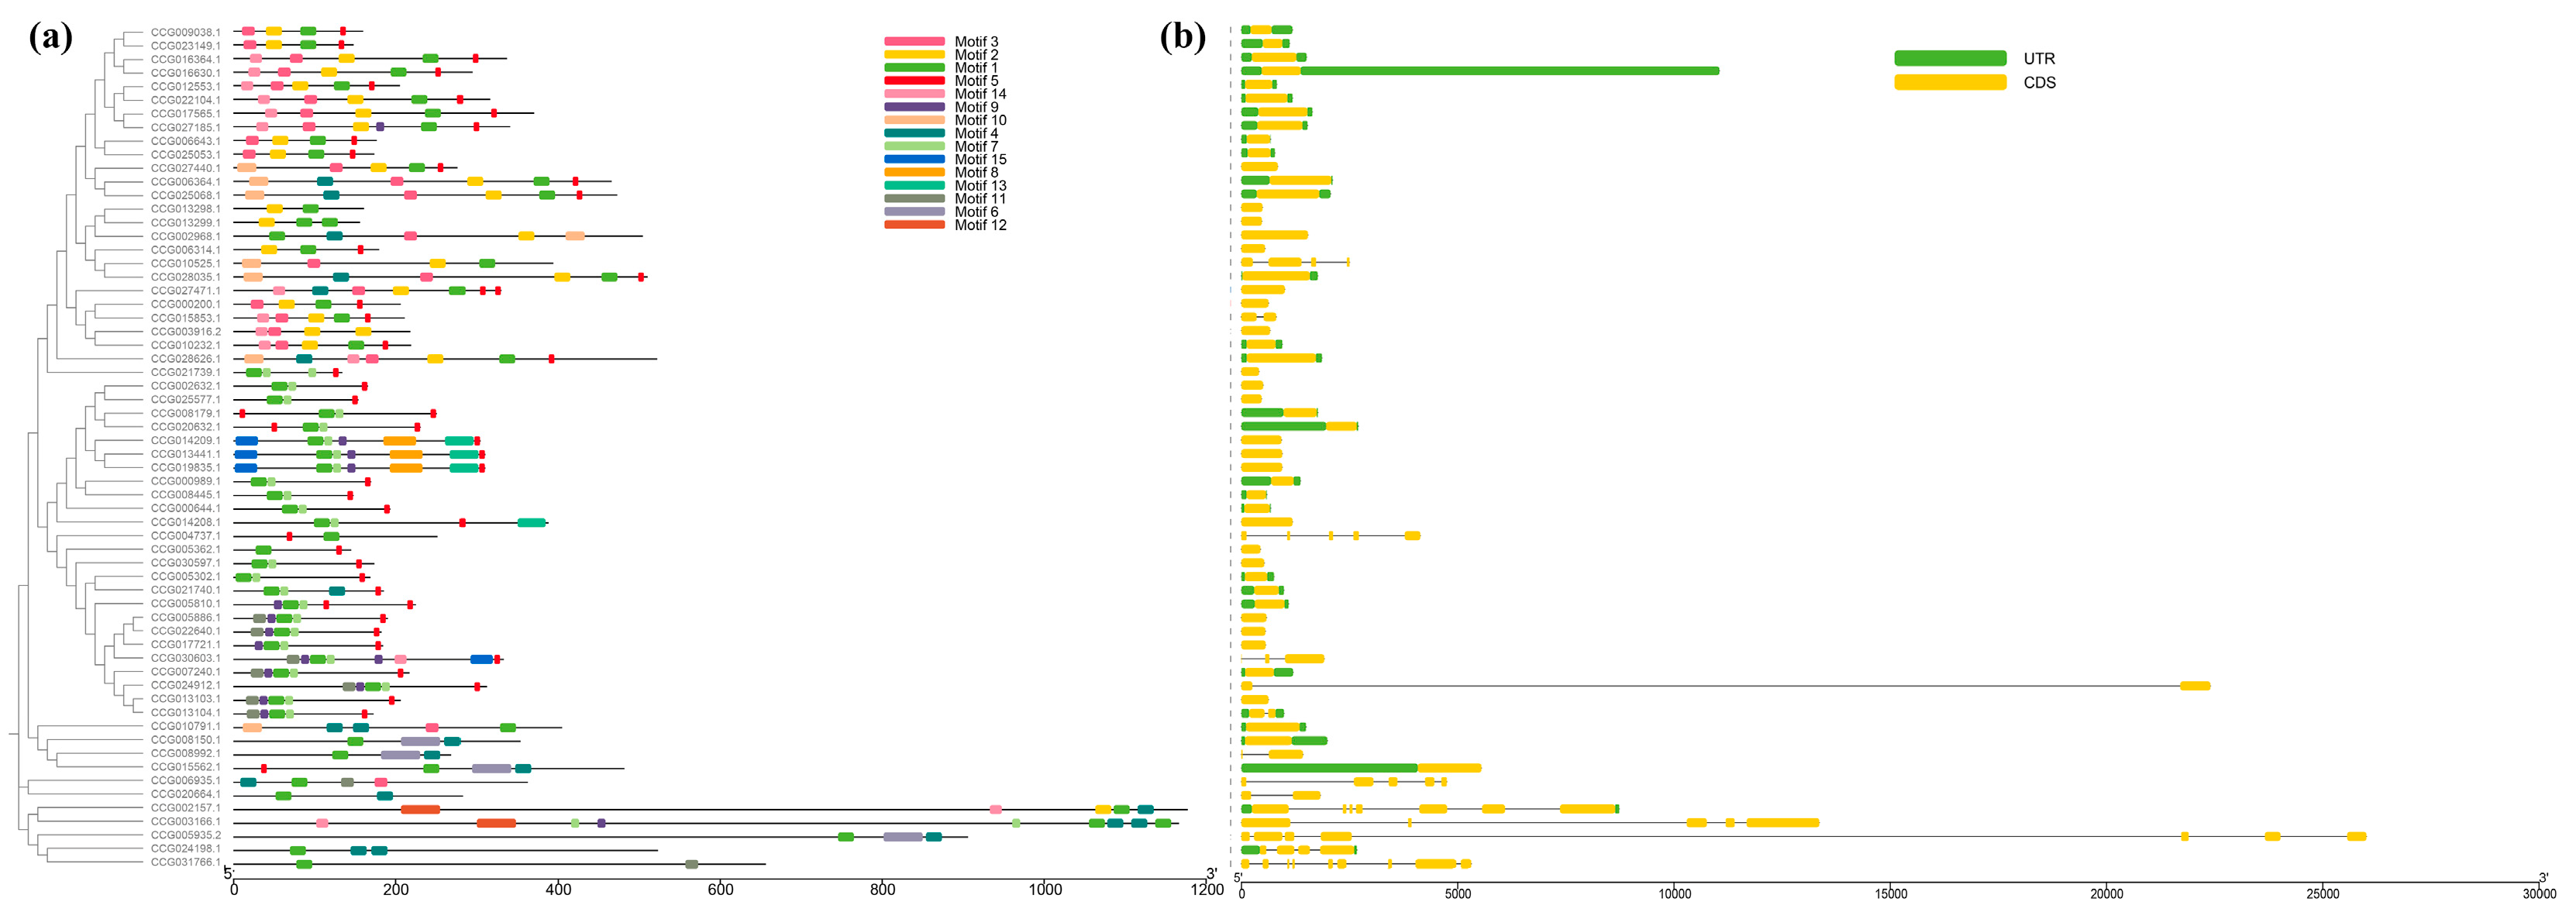
Figure 2.
Structural features of the CtC2H2 zinc finger gene family in safflower. (a) Conserved motif composition of CtC2H2 proteins identified using MEME suite. Colored boxes represent distinct conserved motifs, and their relative positions and arrangements indicate potential functional divergence among CtC2H2 members. (b) Gene structure organization of CtC2H2 family members, showing the distribution of exons, introns, and untranslated regions (UTRs). Exons are represented by colored boxes, introns by black lines, and UTRs by gray boxes. The comparison of motif distribution and gene structure highlights evolutionary conservation and structural diversity within the CtC2H2 family.
3.4. Analysis of Cis-Acting Elements of Gene Promoters
The promoter regions of 62 CtC2H2 genes upstream of the 2000 bp fragment in safflower were analyzed, and the results showed that the cis-acting elements of the safflower C2H2 promoter region could be classified into three major categories: growth and developmental elements, hormone-responsive elements, and biotic and abiotic stress elements. Most of the safflower C2H2 was enriched with light-responsive elements, such as G-box, Box 4, and GT1-motif, suggesting that safflower C2H2 may be involved in the regulation of light signaling pathways that affect plant photomorphogenesis. Most safflower C2H2 promoters contain hormone response elements, such as ABRE (abscisic acid response element), CGTCA-motif (methyl jasmonate response element), TGACG-motif (methyl jasmonate response element), etc., which suggests that the C2H2-type zinc-lipoprotein family of genes may be involved in resistance to adversity stress by regulating plant hormone response pathways. All the promoter sequences of C2H2-type zinc lipoprotein family members contained elements related to biotic and abiotic stress response, and most of the member promoter regions contained multiple MYB binding sites, suggesting that these genes may play an active role in response to abiotic stresses such as drought, flooding, and cold damage. The results of promoter cis-acting element analyses indicated that members of the safflower C2H2-type zinc finger protein family are widely involved in the growth and development of safflower and play important roles in the response to adversity stress. In addition, there are cis-acting elements in the promoter region of the safflower CtC2H2 gene that are related to adversity stress, such as low temperature response, hypoxia-induced and cis-acting elements expressed in meristematic tissues, and phytohormone-responsive elements, such as gibberellin-responsive element (GARE) and abscisic acid-responsive element (ABRE), etc. The C2H2 gene is a cis-acting element in the C2H2 gene promoter region.
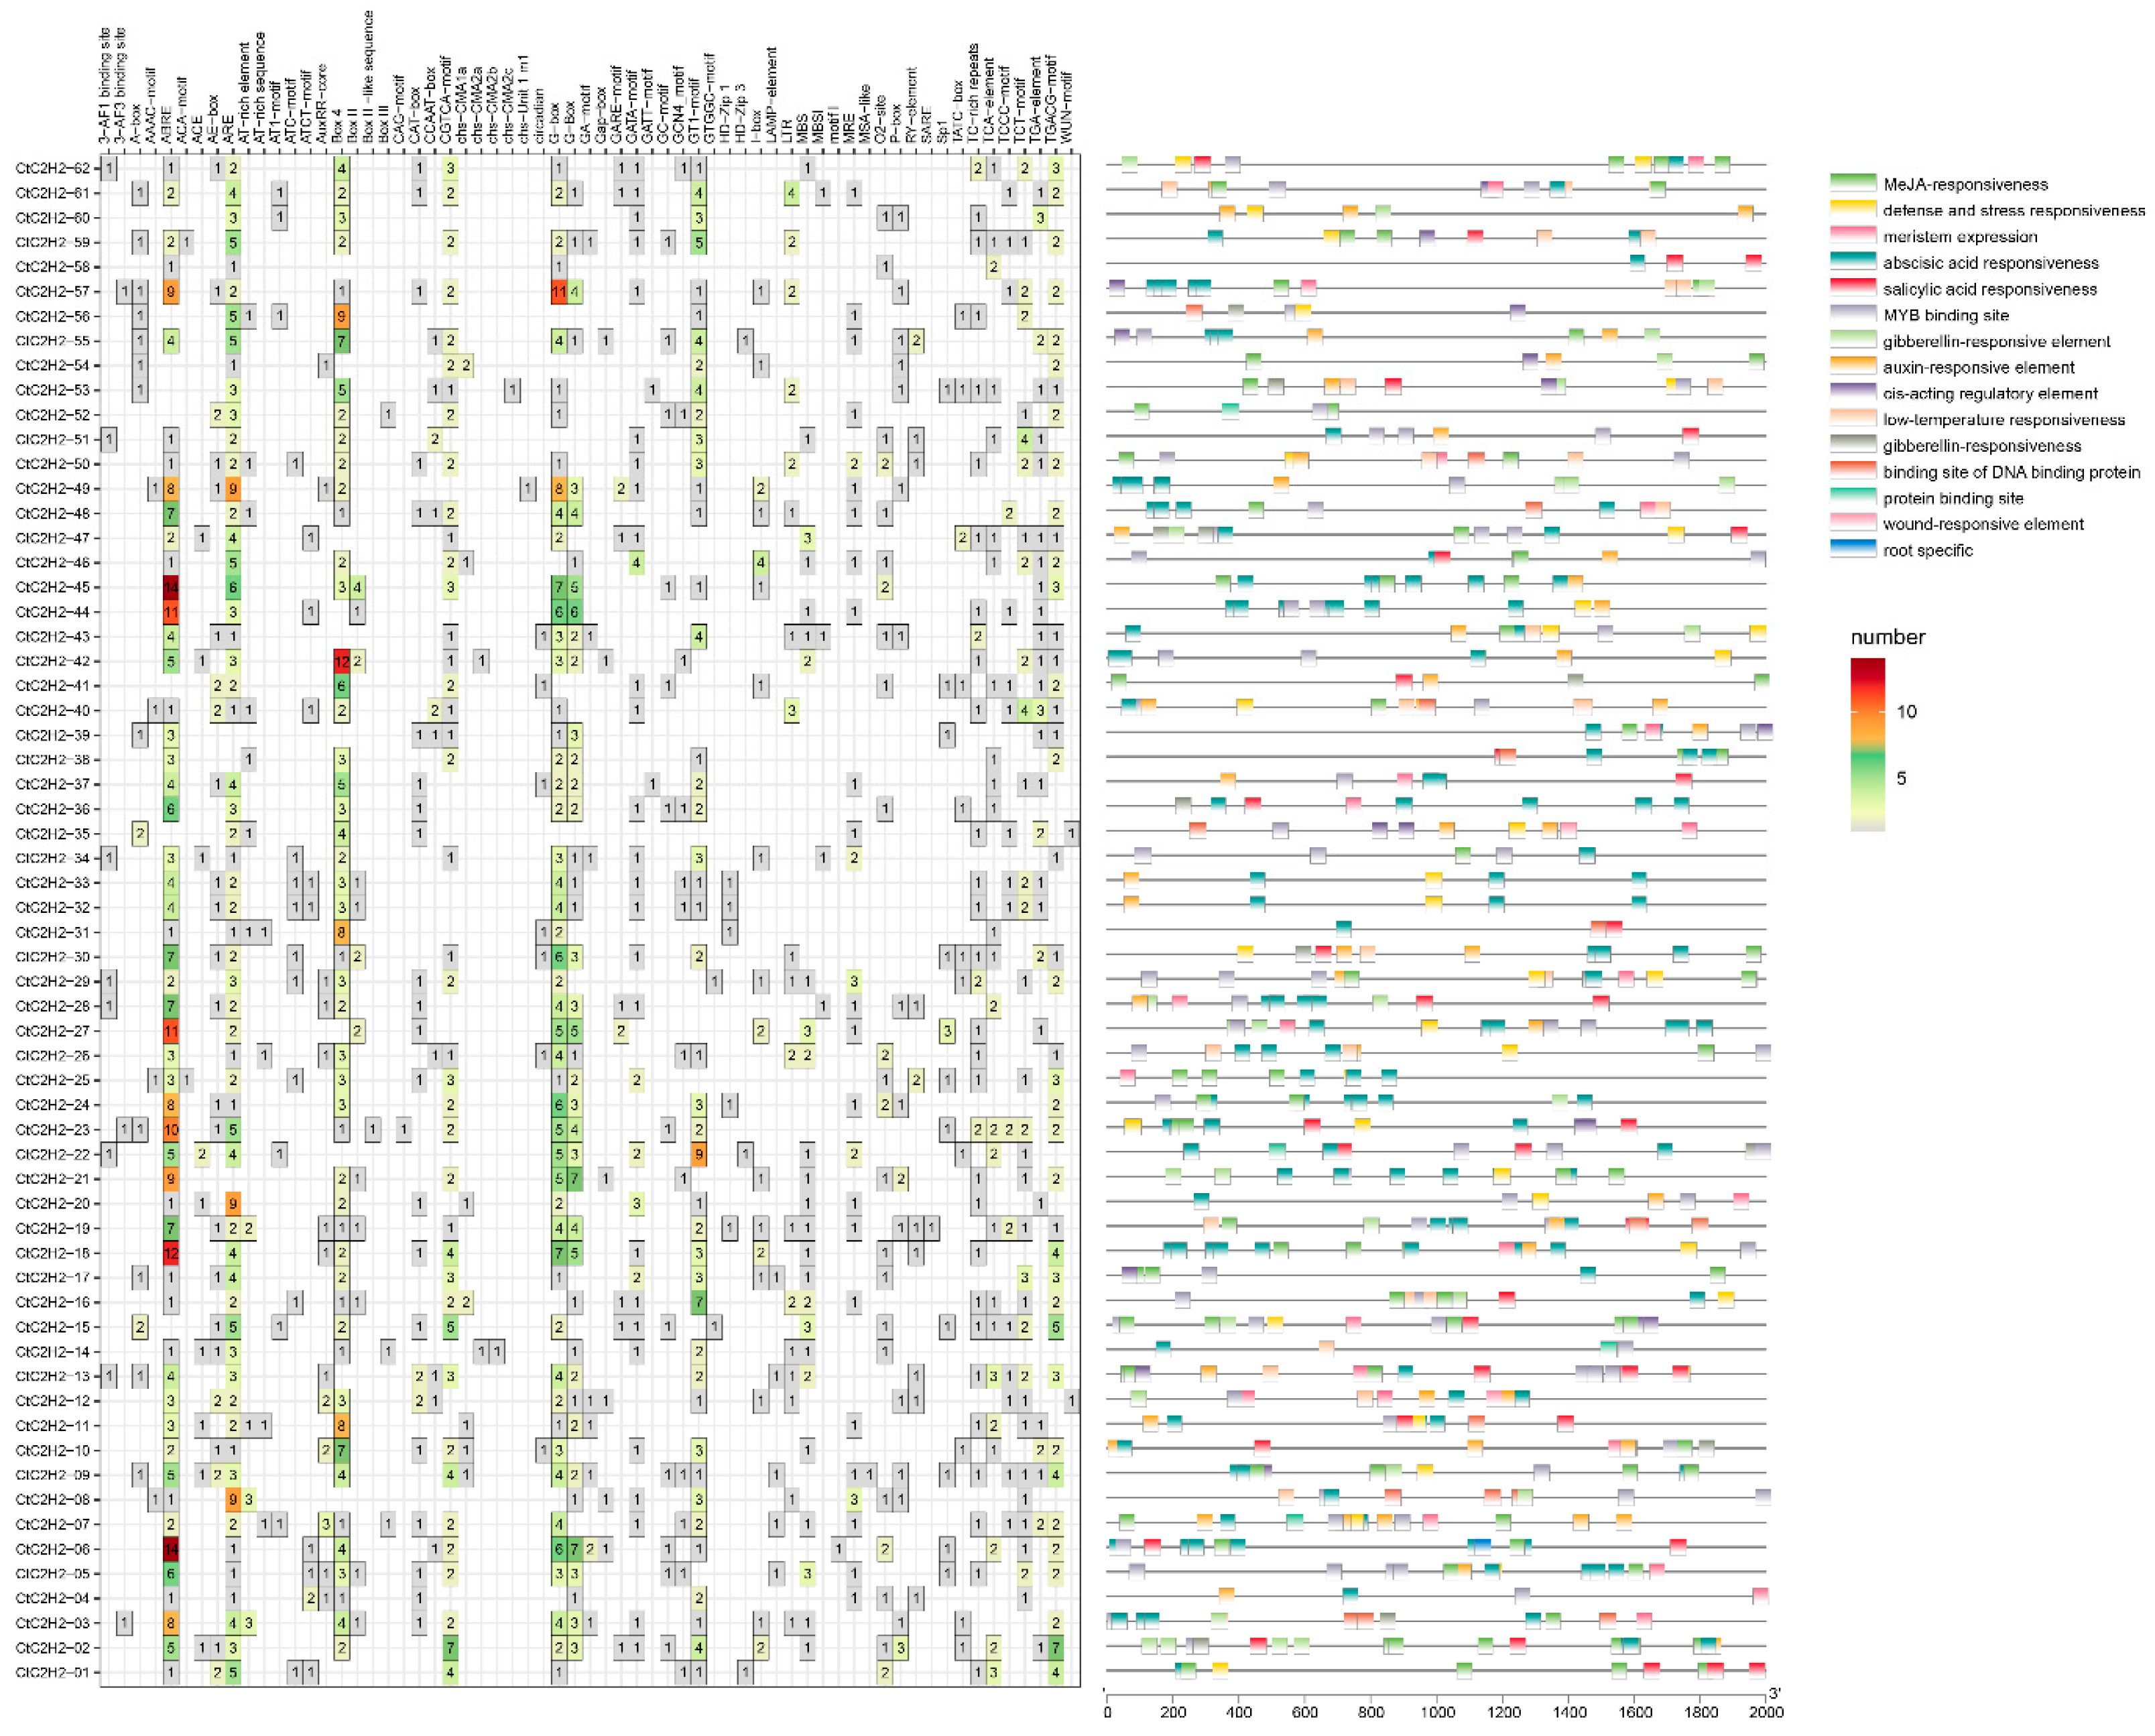
Figure 3.
Analysis of cis-acting elements of the safflower C2H2-type zinc finger protein family promoter. The cis-acting elements were predicted in the promoter sequences of the CtC2H2 genes. Rectangular boxes of distinct colored boxes represent the different types of cis-acting elements.
Figure 3.
Analysis of cis-acting elements of the safflower C2H2-type zinc finger protein family promoter. The cis-acting elements were predicted in the promoter sequences of the CtC2H2 genes. Rectangular boxes of distinct colored boxes represent the different types of cis-acting elements.
3.5. Functional Categorization and Annotation Enrichment of CtC2H2 Gene Family
To further understand the functional relationships among the CtC2H2s gene family members, the safflower C2H2 gene family was analyzed by GO functional annotation for functional annotation (Figure 4). As shown in Figure 4a, among the 62 transcripts, 62 genes were annotated to at least one of the three major functions: 27 were annotated to biological process (BP), 38 to cellular component (CC), and 61 to molecular function (MF). Eighteen of these transcripts were annotated for only one function, 26 transcripts were annotated with two major functions, and 18 transcripts were annotated with three major functions. At Level 2 (Figure 4b), seven sub-levels were enriched in BP: regulation of biological process (GO:0050789), negative regulation of biological process (GO:0048519), response to stimulus (GO:0050896), cellular process (GO:0009987), multicellular organismal process (GO:0032501), biological regulation (GO:006500), developmental process (GO:0032502); one sub-level was enriched as a cellular anatomical structure (GO:0110165) in CC; and two sub-levels were enriched in MF sub-levels for binding (GO:0005488), transcription regulator activity (GO:0140110). GO functional classification and enrichment results indicate that safflower CtC2H2 proteins are proteins with transcriptional regulatory functions that are widely involved in plant growth and development, environmental response, and fine regulation of various biological processes.
3.6. Tissue-Specific Expression Analysis of C2H2 Family Genes in Safflower
In order to study the expression pattern of the C2H2 zinc lipoprotein family genes in safflower, the transcriptome data of safflower “Jihong No.1” were analyzed at the root, stem, leaf, flower and seed stages. As shown in Figure 4a, the transcriptome data showed that CtC2H2-02, CtC2H2-23 and CtC2H2-24 had the highest expression in the seed period; CtC2H2-06 and CtC2H2-22 had the highest expression in petals during the decline period; CtC2H2-10 had the highest expression in leaves; and CtC2H2-21, CtC2H2-29 and CtC2H2-47 had the highest expression in roots ; CtC2H2-35 had the highest expression in stems. Twelve genes were selected for qPCR validation, and the results were shown in Figure 4b. The trends of these 12 genes in stems, leaves, and flowers were consistent with the transcriptome data, proving the accuracy of the transcriptome data.
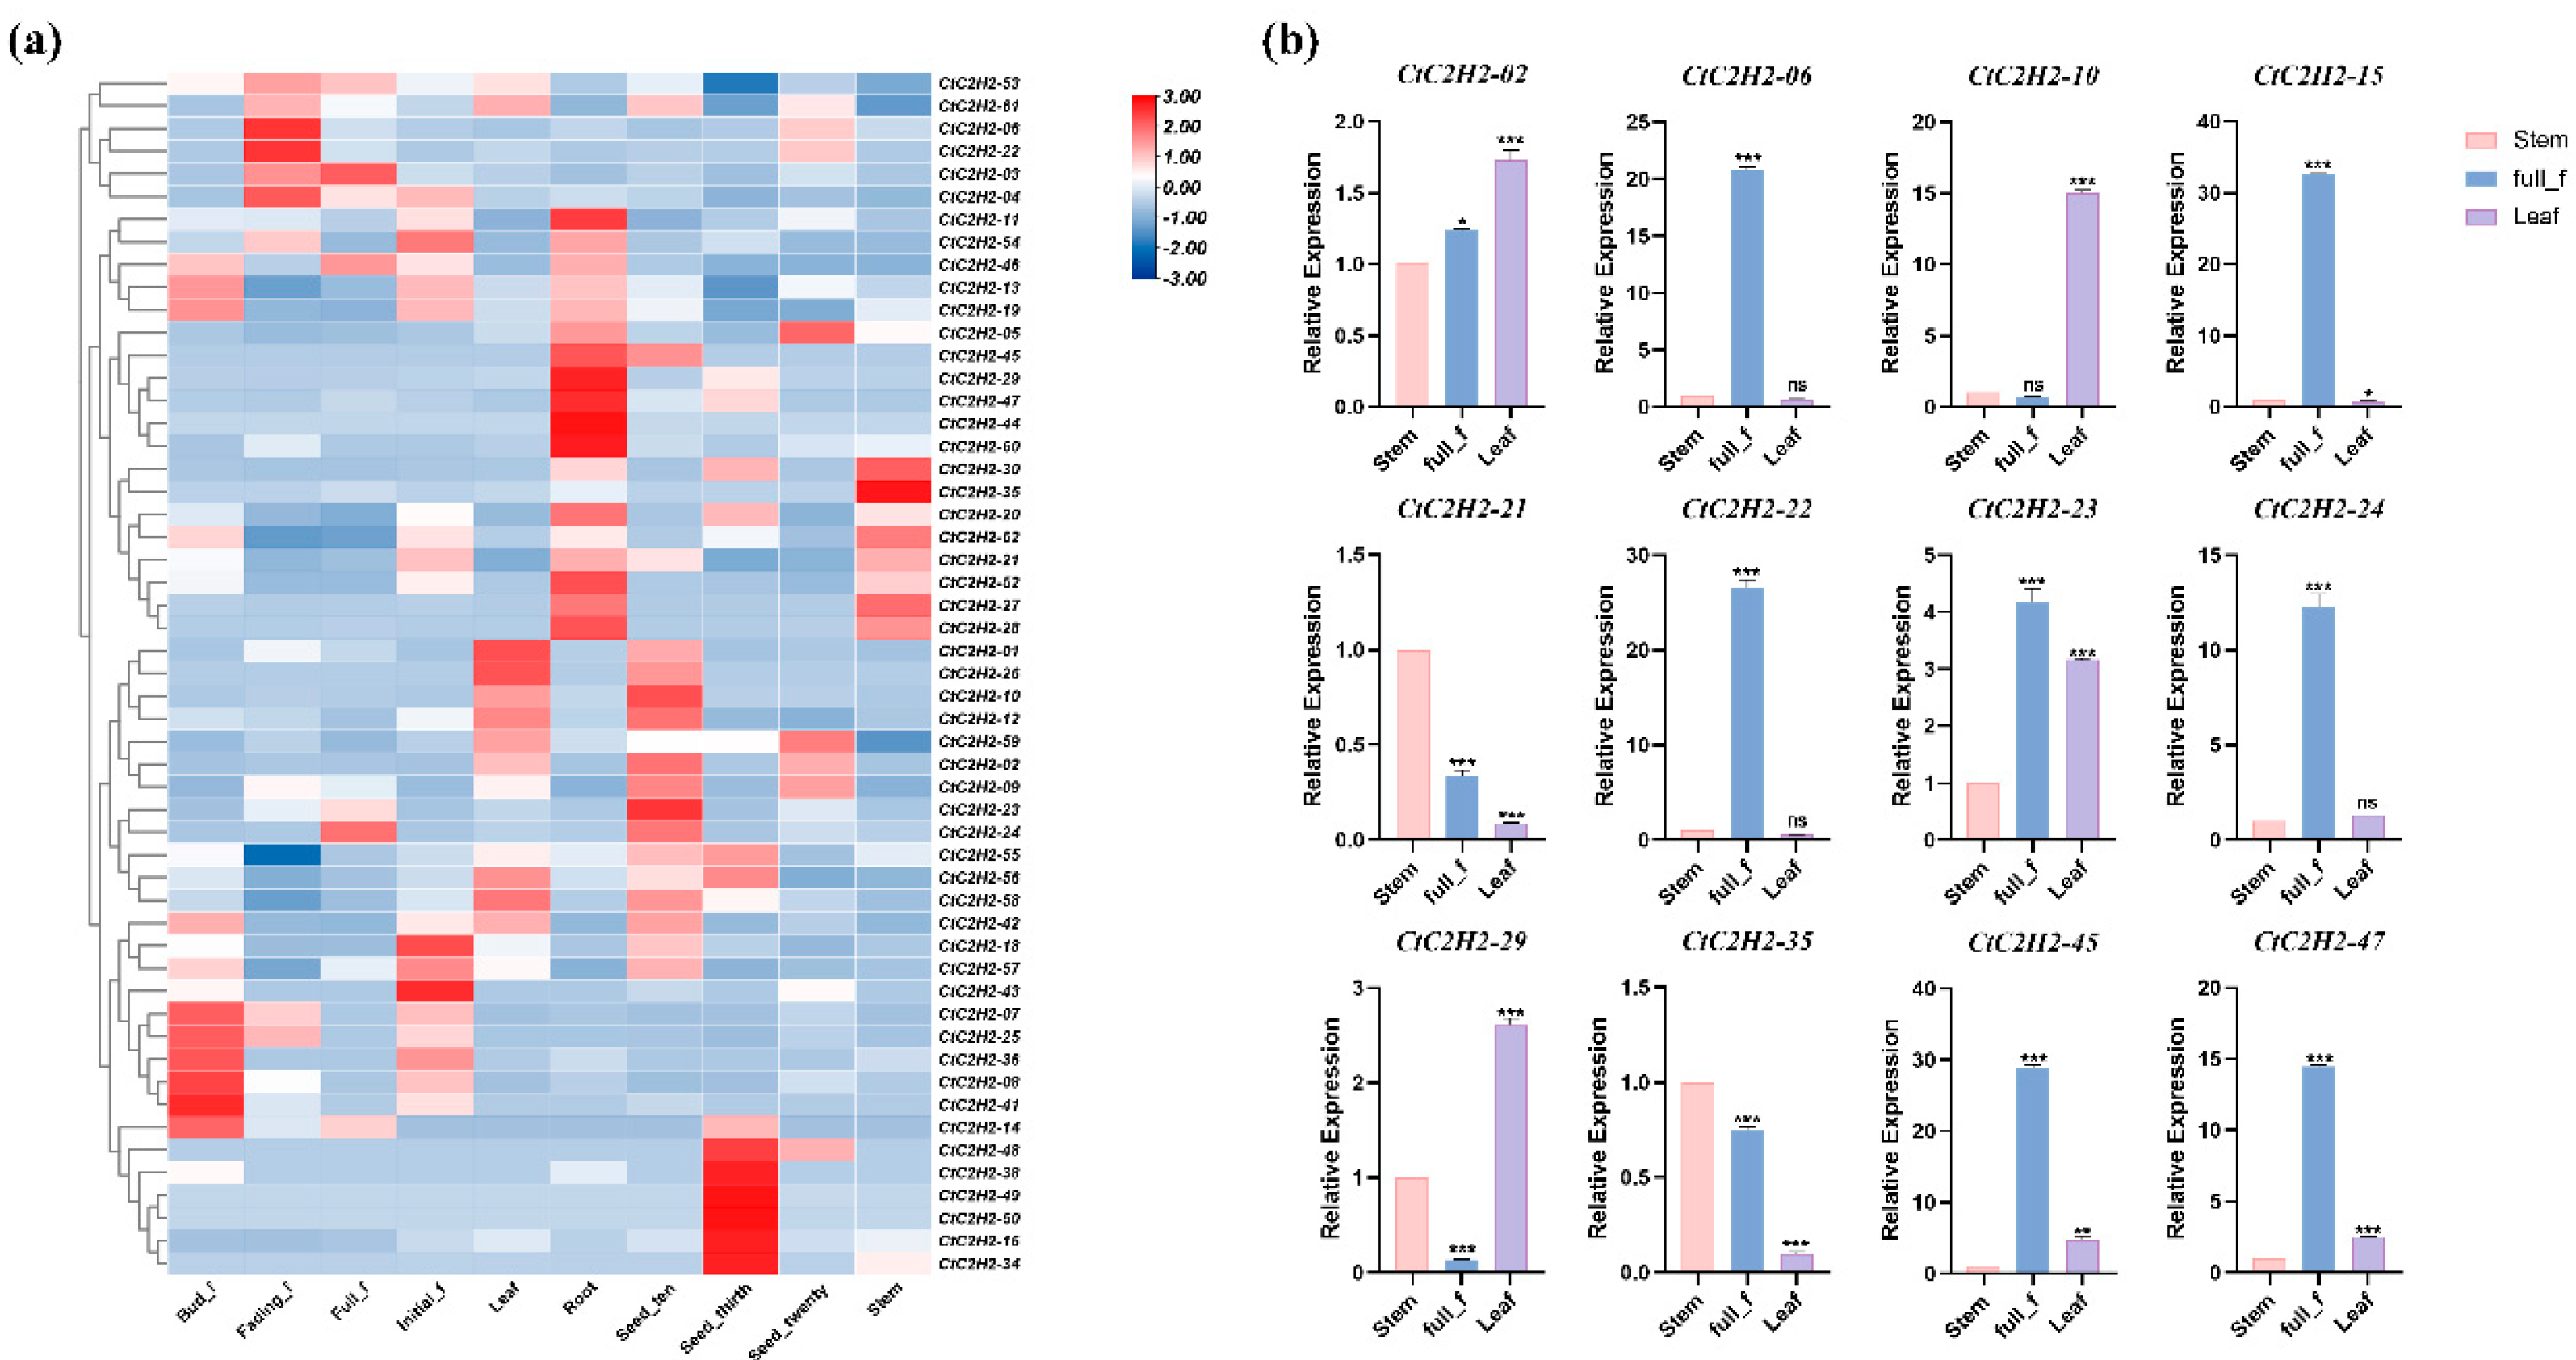
Figure 5.
Gene expression pattern analysis of the CtC2H2-ZFPs. (a) Expression profiles of the safflower CtC2H2 gene family in different tissues; (b) qPCR Validation of Expression Patterns of 12 CtC2H2 Genes in Roots, Stems, and Petals at Bloom Stage (*, p<0.05; **, p<0.01; ***, p<0.001).
Figure 5.
Gene expression pattern analysis of the CtC2H2-ZFPs. (a) Expression profiles of the safflower CtC2H2 gene family in different tissues; (b) qPCR Validation of Expression Patterns of 12 CtC2H2 Genes in Roots, Stems, and Petals at Bloom Stage (*, p<0.05; **, p<0.01; ***, p<0.001).
3.7. Cold Stress Triggers Differential and Dynamic Regulation of CtC2H2-ZFPs
The gene expression analysis was carried out on the leaves of safflower seedlings treated at different time points (3, 6, 9, 12, 24 h) at 4°C, and normalized expression was demonstrated using normothermic treatment (25°C) as the 0 h control treatment. The results, as shown in Figure 6, indicated that the expression pattern of CtC2H2-02, 06, 15, 22, and 45, the five genes, was of ascending and then descending type, and there were differences in the time to reach the peak of expression. These five genes reached the peak expression after 3, 6 or 12 h of low-temperature treatment, and decreased thereafter; the expression pattern of CtC2H2-10, 21, 23, 24, 29, 35 and 47, the seven genes, reached the peak expression at 6 or 9 h, and then the expression rebounded at 12 or 24 h. However, the expression trend of CtC2H2-29 gene was in line with the first increase, then decrease, then rebound type, although its overall expression was lower than that of the control group,the overall expression of CtC2H2-29 was lower than that of the control group. As a result, different CtC2H2-ZFPs genes responded differently to low-temperature treatments, indicating the diversity of functions they perform under low-temperature adversity.
3.8. Differential Expression Responses of CtC2H2-ZFP Genes to ABA and ABA+MeJA Treatments
Expression analysis under 200 μM ABA treatment, ABA + MeJA treatments was performed to gain a preliminary understanding of the response of different types of CtC2H2-ZFPs genes to these adversity conditions. Under ABA treatment conditions, as shown in Figure 7, the expression patterns of CtC2H2-02, 15, 21, 22, 23, 24, 35, 45, and these eight genes were firstly rising, then decreasing, and then rebounding; these eight genes rose at 3 or 6 h of 200 μM ABA treatment, and the expression rebounded at 9 or 12 h. The expression of these eight genes was also analyzed under ABA and MeJA treatments. The expression pattern of these three genes, CtC2H2-06, 10, and 47, was decreasing and then increasing, with the lowest peak of expression at 6 or 9 h. However, the highest peak of expression of CtC2H2-06, 10, and 2 genes did not exceed that of the control samples, and that of CtC2H2-47 was significantly higher than that of the control samples. The CtC2H2-29 gene conformed to a rise, then a fall, then a rebound, but the expression was significantly lower than that of the controls.
3.9. CtC2H2-ZFPs Exhibit Distinct Suppressed and Fluctuating Expression Profiles Under UV-B Exposure
Under UV-B treatment conditions, as shown in Figure 8, two main expression patterns can be distinguished, one is the expression significantly suppressed model, such as CtC2H2-10, CtC2H2-22, CtC2H2-23 and CtC2H2-24; The other is a rising and falling cyclic recurring type, in which the expression of all remaining genes rises after 6 h of UV-B irradiation, and in the subsequent continuous irradiation, the gene expression is folded, falling and then rising and then falling again, but the overall tendency is to decrease, except for CtC2H2-02, which peaks in expression at a further 48 h. The expression of CtC2H2-02 is also shown in a folded pattern.
3.10. Distinct and Complex Expression Profiles of CtC2H2-ZFPs Under MeJA Stress
Under MeJA treatment conditions, as shown in Figure 9, can be categorized into four expression patterns, the first, first rise, then fall and then rebound type of expression pattern, CtC2H2-02, CtC2H2-47 expression rises at 3 or 6 h of MeJA treatment, and is at a trough at 9 h, and then rebounds; In the second, first rise then fall type expression pattern, CtC2H2-06, CtC2H2-29 expression increased or remained unchanged after 3 h of treatment, and both decreased significantly after 6 h, and continued to decrease unchanged; The third, rising-then-decreasing-then-rising-then-decreasing type expression pattern, CtC2H2-10,CtC2H2-15, CtC2H2-21, CtC2H2-22, CtC2H2-23 and CtC2H2-24 peaked at 3 or 6 h of treatment, and then peaked again at 12 h, and CtC2H2-35 also belonged to the third expression pattern, but the 3 h expression was not different from the control, but the trend was consistent; In the fourth, decreasing and then increasing type of expression pattern, CtC2H2-45 expression decreased all the way after treatment and peaked at 24 h. These results suggest that the functions that CtC2H2-ZFPs may play in response to abiotic adversity are very complex, and that there are large differences in different genes in response to different adversities.
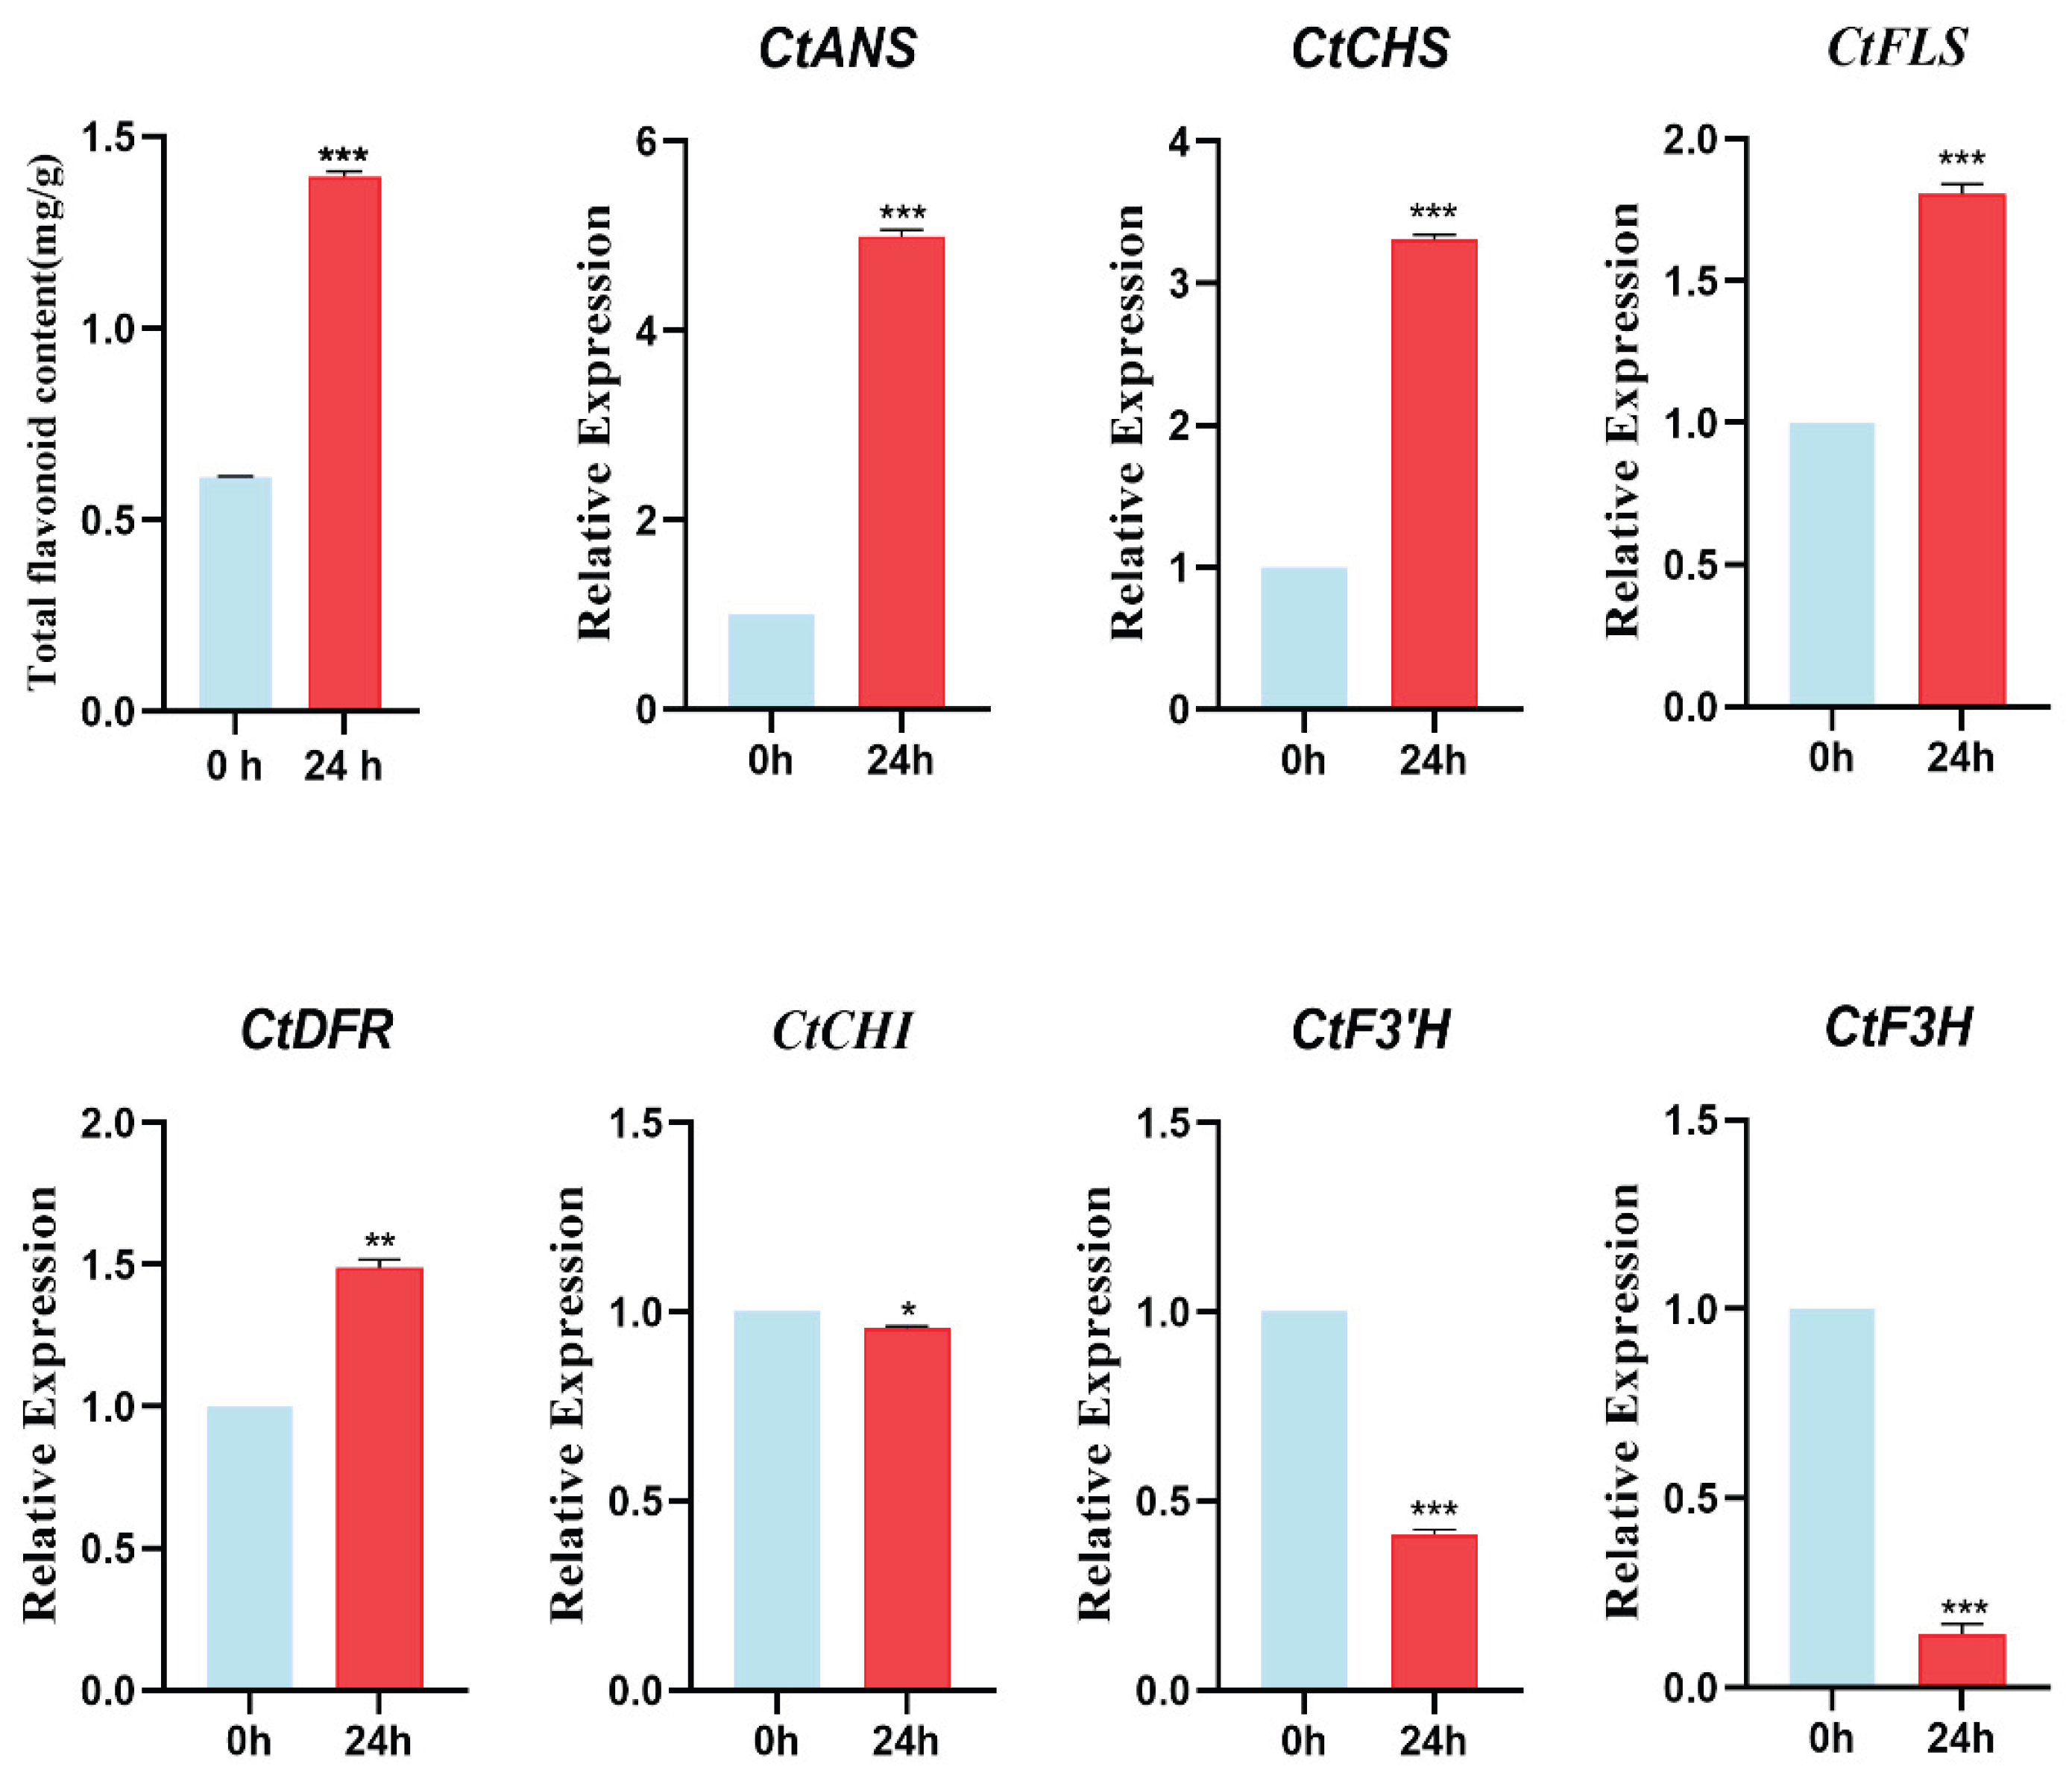
3.11. Changes in Total Flavonoids Content and Key Genes of the Flavonoid Pathway Under ABA Treatment
As shown in Figure 7 above, the expression of most safflower CtC2H2-ZFPs increased significantly at 24 h under 200 μmol/L ABA treatment. Therefore, we extracted total flavonoids from untreated (0 h) versus ABA-treated 24 h saffron leaves. The flavonoid content was elevated about 2-fold after 200 μmol/L ABA treatment (Figure 10). Meanwhile, we extracted RNA from 0h and 24 h leaves and quantified the key enzyme genes for flavonoid synthesis. The results, as shown in Figure 10, showed that the contents of CtANS, CtCHS, CtFLS, and CtDFR were elevated after ABA treatment, while the contents of CtF3'H, and CtF3H were reduced after the treatment, and there was no significant change in CtCHI. According to Figure 7,we can see that CtC2H2-02, CtC2H2-15, CtC2H2-21, CtC2H2-22, CtC2H2-23, CtC2H2-24, CtC2H2-35, CtC2H2-45, and CtC2H2-47 contents were increased after 24 h of ABA treatment, which was in line with the contents of CtFLS, CtCHS, CtDFR, and CtANS, while the contents of CtC2H2-06, CtC2H2-10, and CtC2H2-29 were decreased, which was consistent with the trend of CtF3'H and CtF3H. Therefore, we hypothesized that the safflower CtC2H2 gene might interact with genes for key enzymes of flavonoid synthesis under ABA induction to regulate flavonoid synthesis.
4. Discussion
Safflower is a traditional Chinese herbal medicine and a new cash crop in China. Safflower is rich in a variety of nutrients and chemically active substances, including fatty acids, proteins, pigments, volatile oils and flavonoids [50]. According to reports, C2H2-ZFPs transcription factors are involved in eukaryotic biological processes through phytohormone signaling, transcriptional regulation, plant growth and development, and stress response [26,27,51]. However, studies in safflower have not been reported. In this study, we screened 62 CtC2H2 genes in the safflower gene pool by bioinformatics methods and analyzed the physicochemical properties, evolutionary relationships, gene structures, conserved motifs, and cis-acting elements of the CtC2H2-ZFPs family members. Analysis of the physicochemical properties of 62 CtC2H2-ZFPs proteins revealed that acidic proteins accounted for (pI < 7) 38.7 % of the safflower CtC2H2 proteins,Alkaline proteins (pI > 7) 61.3 % of the total;All except CtC2H2-17, CtC2H2-19, CtC2H2-53, and CtC2H2-57 are unstable proteins in vitro; and all CtC2H2 proteins are hydrophilic. Subcellular localization analysis of the CtC2H2 gene family revealed that all CtC2H2 were localized to the nucleus (Table S1).We constructed a phylogenetic evolutionary tree of all C2H2 genes of Arabidopsis and safflower and classified them into six subfamilies, named I-VI, in which the numbers of CtC2H2-containing ones were 12, 12, 5, 16, 10, and 7, respectively (Figure 1). Furthermore, by analyzing the conserved motifs of CtC2H2-ZFPs, we found that all C2H2s contain the conserved motif motif1, while different individual conserved motifs exist in different subfamilies. We also analyzed the introns and exons of CtC2H2-ZFPs and found that most of the genes contained no introns and only one exon, and 14 genes contained multiple introns.
To investigate the gene function of safflower CtC2H2-ZFPs, we analyzed their promoter sequences for cis-acting elements (Figure 3). It was found that its cis-acting elements could be categorized into three major groups, namely, growth and developmental elements, hormone response elements, and biotic and abiotic stress elements, with light-responsive elements, and hormone-responsive elements, such as ABRE, CGTCA-motif, and TGACG-motif, which suggests that the CtC2H2-ZFPs may play an important role under abiotic stresses. According to the results of Gene Ontology (GO) functional annotation (Figure 4), Sixty-one transcripts were annotated as molecular function, mainly containing binding and transcription regulator activity, demonstrating that they are binding proteins with transcriptional activity, capable of activating or repressing the transcription of target genes.Thirty-eight transcripts were annotated as cellular component (CC), mainly containing regulation of biological process, negative regulation of biological process, biological regulation, response to stimulus, developmental process,multicellular organismal process,cellular process,This indicates that members of this family are widely involved in regulating various biological processes. They are particularly notable for their ability to negatively regulate, or inhibit, specific biological processes. They are also involved in sensing and responding to signals from external and internal environments, as well as regulating plant growth and morphogenesis.To further investigate the function of CtC2H2-ZFPs, we first selected three parts of stems, leaves, and flowers to validate the expression patterns of some genes, which were found to be consistent with the results of RNA-seq data (Figure 5). Since the analysis of its cis-acting elements indicated that it might be affected by abiotic stresses such as light, hormone, cold, etc., we chose the conditions of ABA, MeJA, Cold and UV-B to treat the safflower seedlings, and found that the expression of the safflower CtC2H2 gene varied under the treatment of these factors, among which the gene expression was the most significant under the treatment of ABA and most of the expression was significantly elevated after 24 h treatment. Therefore, the samples under ABA treatment were selected and the total flavonoids were extracted from the 24 h samples, as shown in Figure 10, the total flavonoids content was significantly elevated after 24 h of ABA treatment. Meanwhile, qRT-PCR analysis of key enzyme genes for flavonoid synthesis at 0 h and 24 h revealed that the contents of CtFLS, CtCHS, CtDFR, and CtANS were elevated, and the contents of CtF3'H and CtF3H were decreased by ABA treatment. Therefore, we hypothesized that the CtC2H2 gene might regulate flavonoid content changes under ABA stress.
Safflower is rich in flavonoids, which have important functions in plant resistance to various stresses [52], mainly as antioxidants and regulators of plant polar growth hormone transport (PAT) [53]. Flavonoids are able to accumulate at the level of epidermal cell layers as protective UV radiation absorbers during UV-B stress [54], as well as acting as food repellents in the face of herbivores [55], among others. Under drought conditions, flavonoids are necessary to prevent damage caused by drought. Plants accumulate flavonoids to increase antioxidant activity, promote photosynthesis, influence stomatal activity and regulate root growth, thereby enhancing plant resistance to drought [56]. When plants are exposed to cold stress, they are able to accumulate flavonoids in large quantities to increase their cold resistance and reduce cold damage [57]. Exposure of plants to low temperatures leads to the rapid induction of genes encoding transcriptional activators belonging to the AP2/ERF structural domain family of DNA binding proteins called C-repeat binding factors (CBF) [58]. Stress effects on the regulation of genes related to flavonoid synthesis in plants. When plants are subjected to stress, excessive free radicals are produced, which can disrupt the free radical balance in the plant, causing oxidative damage and other unfavorable intracellular flavonoid translocation processes. Flavonoids have strong scavenging effects on certain free radicals [59], and after plants are subjected to stress, excess free radicals in the body are mainly scavenged by flavonoids, and especially the scavenging of ROS is an important mechanism by which flavonoids help plants to resist stress damage [60]. Secondary metabolites are produced when plants respond to external adversarial environments, and secondary metabolites protect plants in harsh environments. These indicate that plants increase the accumulation of secondary metabolites when they are stressed, and the CtC2H2-ZFPs gene family up-regulates or down-regulates gene expression when safflower is stressed, suggesting that the CtC2H2-ZFPs gene family may affect safflower secondary metabolites. Therefore, exploring the key genes regulating the synthesis of secondary metabolites will be helpful to study the biosynthesis of relevant metabolites in plants, especially medicinal plants, for the purpose of mass production.
Since C2H2-type zinc finger proteins are a typical class of transcription factors, and the GO functional enrichment analysis of the CtC2H2 gene family in safflower (Carthamus tinctorius) clearly shows that its members are significantly enriched in the “transcriptional regulatory activity” and other related functions, this further confirms that this family plays a central role in transcriptional regulation in safflower. Therefore, in-depth investigation of the biological functions of CtC2H2 genes is of great theoretical and applied value. Follow-up studies could focus on the construction of overexpression lines and loss-of-function mutant lines of CtC2H2 gene, and systematically compare the differences in key physiological and biochemical traits between them. Based on its transcriptional properties and enrichment analysis, CtC2H2 is likely to affect the transcription levels of key enzyme genes (e.g., CHS, CHI, FNS, etc.) in the flavonoid biosynthesis pathway through regulating the expression of downstream target genes, and thus participate in the metabolic regulation of saffron active ingredients; on the other hand, CtC2H2 may be involved in the metabolic control of saffron active ingredients through activating or repressing the expression of stress-related genes, and may play an important role in the response of saffron to non-biological factors such as drought, salinity and alkalinity. In this study, the functional prediction of the CtC2H2 family provides solid bioinformatic support for the nature of its transcription factors. It also establishes an important theoretical foundation for in-depth analysis of its specific regulatory mechanisms in safflower flavonoid synthesis and adaptation to adversity. Furthermore, it points out a clear direction for future research.
Supplementary Materials
The following supporting information can be downloaded at the website of this paper posted on Preprints.org, Table S1: C2H2 Analysis of physicochemical properties; Table S2: Primer sequences; Figure S3: Conserved motif 1-15.
Author Contributions
Investigation, Writing-original draft and Visualization Y.C., A.W.U., M.M., Conceptualization, N.A. and X.L; Writing-review & editing, A.W.U. and N.A; Formal analysis, Y.Z.; Funding acquisition and Supervision, X.L. and N.A. All authors read and approved the final manuscript.
Funding
This research was funded by grants from the Science and Technology Development Project of Jilin Province (No. 20220204058YY).
Institutional Review Board Statement
Not applicable.
Informed Consent Statement
Not Applicable.
Data Availability Statement
All data supporting the findings of this study are included in the article and its supplementary files (e.g., Table S1 for gene lists and primers). Materials and any additional datasets (such as raw qRT-PCR Ct values and representative HPLC chromatograms) are available from the corresponding author on reasonable request.
Acknowledgments
We acknowledge the institutional support provided by Jilin Agricultural University (including the Bioreactor Platform) and by the affiliated institutes of all co-authors. We are grateful for administrative and technical assistance that facilitated the experiments and data analyses. This work was supported by the funding sources listed in the Funding section.
Conflicts of Interest
The authors declare no conflicts of interest.
References
- Alshareef, N.S.; AlSedairy, S.A.; Al-Harbi, L.N.; Alshammari, G.M.; Yahya, M.A. Carthamus tinctorius L. (Safflower) Flower Extract Attenuates Hepatic Injury and Steatosis in a Rat Model of Type 2 Diabetes Mellitus via Nrf2-Dependent Hypoglycemic, Antioxidant, and Hypolipidemic Effects. Antioxidants (Basel) 2024, 13. [Google Scholar] [CrossRef] [PubMed]
- Yin, C.; Fang, R.; Xu, Y.; Li, K.; Ai, T.; Wan, J.; Qin, Y.; Lyu, X.; Liu, H.; Qin, R.; et al. Safflower petal water-extract consumption reduces blood glucose via modulating hepatic gluconeogenesis and gut microbiota. Journal of Functional Foods 2024, 123. [Google Scholar] [CrossRef]
- Bacchetti, T.; Morresi, C.; Bellachioma, L.; Ferretti, G. Antioxidant and Pro-Oxidant Properties of Carthamus Tinctorius, Hydroxy Safflor Yellow A, and Safflor Yellow A. Antioxidants (Basel) 2020, 9. [Google Scholar] [CrossRef] [PubMed]
- Liu, L.; Si, N.; Ma, Y.; Ge, D.; Yu, X.; Fan, A.; Wang, X.; Hu, J.; Wei, P.; Ma, L.; et al. Hydroxysafflor-Yellow A Induces Human Gastric Carcinoma BGC-823 Cell Apoptosis by Activating Peroxisome Proliferator-Activated Receptor Gamma (PPARγ). Med Sci Monit 2018, 24, 803–811. [Google Scholar] [CrossRef]
- Zhu, H.; Wang, Z.; Ma, C.; Tian, J.; Fu, F.; Li, C.; Guo, D.; Roeder, E.; Liu, K. Neuroprotective effects of hydroxysafflor yellow A: in vivo and in vitro studies. Planta Med 2003, 69, 429–433. [Google Scholar] [CrossRef]
- Xian, B.; Wang, R.; Jiang, H.; Zhou, Y.; Yan, J.; Huang, X.; Chen, J.; Wu, Q.; Chen, C.; Xi, Z.; et al. Comprehensive review of two groups of flavonoids in Carthamus tinctorius L. Biomedicine & Pharmacotherapy 2022, 153. [CrossRef]
- Petrussa, E.; Braidot, E.; Zancani, M.; Peresson, C.; Bertolini, A.; Patui, S.; Vianello, A. Plant flavonoids--biosynthesis, transport and involvement in stress responses. Int J Mol Sci 2013, 14, 14950–14973. [Google Scholar] [CrossRef]
- Miller, J.; McLachlan, A.D.; Klug, A. Repetitive zinc-binding domains in the protein transcription factor IIIA from Xenopus oocytes. Embo j 1985, 4, 1609–1614. [Google Scholar] [CrossRef]
- Kielbowicz-Matuk, A. Involvement of plant C<sub>2</sub>H<sub>2</sub>-type zinc finger transcription factors in stress responses. Plant Science 2012, 185, 78–85. [Google Scholar] [CrossRef]
- Berg, J.M.; Shi, Y. The galvanization of biology: a growing appreciation for the roles of zinc. Science (New York, N.Y.) 1996, 271, 1081–1085. [Google Scholar] [CrossRef]
- Takatsuji, H. Zinc-finger proteins: the classical zinc finger emerges in contemporary plant science. Plant Mol Biol 1999, 39, 1073–1078. [Google Scholar] [CrossRef]
- Ciftci-Yilmaz, S.; Morsy, M.R.; Song, L.; Coutu, A.; Krizek, B.A.; Lewis, M.W.; Warren, D.; Cushman, J.; Connolly, E.L.; Mittler, R. The EAR-motif of the Cys2/His2-type zinc finger protein Zat7 plays a key role in the defense response of Arabidopsis to salinity stress. J Biol Chem 2007, 282, 9260–9268. [Google Scholar] [CrossRef] [PubMed]
- Mittler, R.; Kim, Y.; Song, L.; Coutu, J.; Coutu, A.; Ciftci-Yilmaz, S.; Lee, H.; Stevenson, B.; Zhu, J.K. Gain- and loss-of-function mutations in Zat10 enhance the tolerance of plants to abiotic stress. FEBS Lett 2006, 580, 6537–6542. [Google Scholar] [CrossRef] [PubMed]
- Lyu, T.; Cao, J. Cys₂/His₂ Zinc-Finger Proteins in Transcriptional Regulation of Flower Development. Int J Mol Sci 2018, 19. [Google Scholar] [CrossRef] [PubMed]
- Riechmann, J.L.; Heard, J.; Martin, G.; Reuber, L.; Jiang, C.; Keddie, J.; Adam, L.; Pineda, O.; Ratcliffe, O.J.; Samaha, R.R.; et al. Arabidopsis transcription factors: genome-wide comparative analysis among eukaryotes. Science 2000, 290, 2105–2110. [Google Scholar] [CrossRef]
- Pu, J.; Li, M.; Mao, P.; Zhou, Q.; Liu, W.; Liu, Z. Genome-Wide Identification of the Q-type C2H2 Transcription Factor Family in Alfalfa (Medicago sativa) and Expression Analysis under Different Abiotic Stresses. Genes (Basel) 2021, 12. [Google Scholar] [CrossRef]
- Hu, X.; Zhu, L.; Zhang, Y.; Xu, L.; Li, N.; Zhang, X.; Pan, Y. Genome-wide identification of C2H2 zinc-finger genes and their expression patterns under heat stress in tomato (Solanum lycopersicum L.). PeerJ 2019, 7, e7929. [Google Scholar] [CrossRef]
- Liu, K.; Hou, Q.; Yu, R.; Deng, H.; Shen, L.; Wang, Q.; Wen, X. Genome-wide analysis of C2H2 zinc finger family and their response to abiotic stresses in apple. Gene 2024, 904, 148164. [Google Scholar] [CrossRef]
- Agarwal, P.; Arora, R.; Ray, S.; Singh, A.K.; Singh, V.P.; Takatsuji, H.; Kapoor, S.; Tyagi, A.K. Genome-wide identification of C2H2 zinc-finger gene family in rice and their phylogeny and expression analysis. Plant Mol Biol 2007, 65, 467–485. [Google Scholar] [CrossRef]
- Sharma, R.; Mahanty, B.; Mishra, R.; Joshi, R.K. Genome wide identification and expression analysis of pepper C(2)H(2) zinc finger transcription factors in response to anthracnose pathogen Colletotrichum truncatum. 3 Biotech 2021, 11, 118. [Google Scholar] [CrossRef]
- Yin, J.; Wang, L.; Zhao, J.; Li, Y.; Huang, R.; Jiang, X.; Zhou, X.; Zhu, X.; He, Y.; He, Y.; et al. Genome-wide characterization of the C2H2 zinc-finger genes in Cucumis sativus and functional analyses of four CsZFPs in response to stresses. BMC Plant Biol 2020, 20, 359. [Google Scholar] [CrossRef]
- Liu, Z.; Coulter, J.A.; Li, Y.; Zhang, X.; Meng, J.; Zhang, J.; Liu, Y. Genome-wide identification and analysis of the Q-type C2H2 gene family in potato (Solanum tuberosum L.). Int J Biol Macromol 2020, 153, 327–340. [Google Scholar] [CrossRef]
- Jiang, Y.; Liu, L.; Pan, Z.; Zhao, M.; Zhu, L.; Han, Y.; Li, L.; Wang, Y.; Wang, K.; Liu, S.; et al. Genome-wide analysis of the C2H2 zinc finger protein gene family and its response to salt stress in ginseng, Panax ginseng Meyer. Sci Rep 2022, 12, 10165. [Google Scholar] [CrossRef]
- Liu, H.; Liu, Y.; Liu, F.; Zeng, L.; Xu, Y.; Jin, Q.; Wang, Y. Genome-wide identification of the Q-type C2H2 zinc finger protein gene family and expression analysis under abiotic stress in lotus (Nelumbo nucifera G.). BMC Genomics 2024, 25, 648. [Google Scholar] [CrossRef]
- Du, T.; Zhou, Y.; Qin, Z.; Li, A.; Wang, Q.; Li, Z.; Hou, F.; Zhang, L. Genome-wide identification of the C2H2 zinc finger gene family and expression analysis under salt stress in sweetpotato. Front Plant Sci 2023, 14, 1301848. [Google Scholar] [CrossRef]
- Bai, Q.; Niu, Z.; Chen, Q.; Gao, C.; Zhu, M.; Bai, J.; Liu, M.; He, L.; Liu, J.; Jiang, Y.; et al. The C(2) H(2) -type zinc finger transcription factor OSIC1 positively regulates stomatal closure under osmotic stress in poplar. Plant Biotechnol J 2023, 21, 943–960. [Google Scholar] [CrossRef] [PubMed]
- Chen, L.; Wang, R.; Hu, X.; Wang, D.; Wang, Y.; Xue, R.; Wu, M.; Li, H. Overexpression of wheat C2H2 zinc finger protein transcription factor TaZAT8-5B enhances drought tolerance and root growth in Arabidopsis thaliana. Planta 2024, 260, 126. [Google Scholar] [CrossRef] [PubMed]
- Yang, K.; Li, C.Y.; An, J.P.; Wang, D.R.; Wang, X.; Wang, C.K.; You, C.X. The C2H2-type zinc finger transcription factor MdZAT10 negatively regulates drought tolerance in apple. Plant Physiol Biochem 2021, 167, 390–399. [Google Scholar] [CrossRef]
- Han, G.; Lu, C.; Guo, J.; Qiao, Z.; Sui, N.; Qiu, N.; Wang, B. C2H2 Zinc Finger Proteins: Master Regulators of Abiotic Stress Responses in Plants. Front Plant Sci 2020, 11, 115. [Google Scholar] [CrossRef]
- Eddy, S.R. Accelerated Profile HMM Searches. PLoS Comput Biol 2011, 7, e1002195. [Google Scholar] [CrossRef]
- Bailey, T.L.; Johnson, J.; Grant, C.E.; Noble, W.S. The MEME Suite. Nucleic Acids Res 2015, 43, W39–49. [Google Scholar] [CrossRef]
- Crooks, G.E.; Hon, G.; Chandonia, J.M.; Brenner, S.E. WebLogo: a sequence logo generator. Genome Res 2004, 14, 1188–1190. [Google Scholar] [CrossRef]
- Chen, C.; Chen, H.; Zhang, Y.; Thomas, H.R.; Frank, M.H.; He, Y.; Xia, R. TBtools: An Integrative Toolkit Developed for Interactive Analyses of Big Biological Data. Mol Plant 2020, 13, 1194–1202. [Google Scholar] [CrossRef]
- Tamura, K.; Stecher, G.; Kumar, S. MEGA11: Molecular Evolutionary Genetics Analysis Version 11. Mol Biol Evol 2021, 38, 3022–3027. [Google Scholar] [CrossRef] [PubMed]
- Subramanian, B.; Gao, S.; Lercher, M.J.; Hu, S.; Chen, W.H. Evolview v3: a webserver for visualization, annotation, and management of phylogenetic trees. Nucleic Acids Res 2019, 47, W270–w275. [Google Scholar] [CrossRef] [PubMed]
- Lescot, M.; Déhais, P.; Thijs, G.; Marchal, K.; Moreau, Y.; Van de Peer, Y.; Rouzé, P.; Rombauts, S. PlantCARE, a database of plant cis-acting regulatory elements and a portal to tools for in silico analysis of promoter sequences. Nucleic Acids Res 2002, 30, 325–327. [Google Scholar] [CrossRef] [PubMed]
- Yamaguchi-Shinozaki, K.; Shinozaki, K. Organization of cis-acting regulatory elements in osmotic- and cold-stress-responsive promoters. Trends Plant Sci 2005, 10, 88–94. [Google Scholar] [CrossRef]
- Conesa, A.; Götz, S.; García-Gómez, J.M.; Terol, J.; Talón, M.; Robles, M. Blast2GO: a universal tool for annotation, visualization and analysis in functional genomics research. Bioinformatics 2005, 21, 3674–3676. [Google Scholar] [CrossRef]
- Götz, S.; García-Gómez, J.M.; Terol, J.; Williams, T.D.; Nagaraj, S.H.; Nueda, M.J.; Robles, M.; Talón, M.; Dopazo, J.; Conesa, A. High-throughput functional annotation and data mining with the Blast2GO suite. Nucleic Acids Res 2008, 36, 3420–3435. [Google Scholar] [CrossRef]
- Ashburner, M.; Ball, C.A.; Blake, J.A.; Botstein, D.; Butler, H.; Cherry, J.M.; Davis, A.P.; Dolinski, K.; Dwight, S.S.; Eppig, J.T.; et al. Gene ontology: tool for the unification of biology. The Gene Ontology Consortium. Nat Genet 2000, 25, 25–29. [Google Scholar] [CrossRef]
- Team, R.C. R: A language and environment for statistical computing. MSOR connections 2014, 1. [Google Scholar]
- Ginestet, C. ggplot2: Elegant Graphics for Data Analysis. Journal of the Royal Statistical Society Series a-Statistics in Society 2011, 174, 245–245. [Google Scholar] [CrossRef]
- Untergasser, A.; Cutcutache, I.; Koressaar, T.; Ye, J.; Faircloth, B.C.; Remm, M.; Rozen, S.G. Primer3--new capabilities and interfaces. Nucleic Acids Res 2012, 40, e115. [Google Scholar] [CrossRef]
- Bustin, S.A.; Benes, V.; Garson, J.A.; Hellemans, J.; Huggett, J.; Kubista, M.; Mueller, R.; Nolan, T.; Pfaffl, M.W.; Shipley, G.L.; et al. The MIQE guidelines: minimum information for publication of quantitative real-time PCR experiments. Clin Chem 2009, 55, 611–622. [Google Scholar] [CrossRef] [PubMed]
- Livak, K.J.; Schmittgen, T.D. Analysis of relative gene expression data using real-time quantitative PCR and the 2(-Delta Delta C(T)) Method. Methods 2001, 25, 402–408. [Google Scholar] [CrossRef] [PubMed]
- Vandesompele, J.; De Preter, K.; Pattyn, F.; Poppe, B.; Van Roy, N.; De Paepe, A.; Speleman, F. Accurate normalization of real-time quantitative RT-PCR data by geometric averaging of multiple internal control genes. Genome Biol 2002, 3, Research0034. [Google Scholar] [CrossRef] [PubMed]
- Mortazavi, A.; Williams, B.A.; McCue, K.; Schaeffer, L.; Wold, B. Mapping and quantifying mammalian transcriptomes by RNA-Seq. Nat Methods 2008, 5, 621–628. [Google Scholar] [CrossRef]
- Lee, J.S.; Paje, L.A.; Kim, M.J.; Jang, S.H.; Kim, J.T.; Lee, S. Validation of an optimized HPLC–UV method for the quantification of formononetin and biochanin A in Trifolium pratense extract. Applied Biological Chemistry 2021, 64, 57. [Google Scholar] [CrossRef]
- Horton, P.; Park, K.J.; Obayashi, T.; Fujita, N.; Harada, H.; Adams-Collier, C.J.; Nakai, K. WoLF PSORT: protein localization predictor. Nucleic Acids Res 2007, 35, W585–587. [Google Scholar] [CrossRef]
- Liu, Y.; Wang, M.; Cao, Y.; Zeng, M.; Zhang, Q.; Ren, Y.; Chen, X.; He, C.; Fan, X.; Zheng, X.; et al. Chemical Constituents from the Flowers of Carthamus tinctorius L. and Their Lung Protective Activity. Molecules 2022, 27. [Google Scholar] [CrossRef]
- Yang, K.; Li, C.-Y.; An, J.-P.; Wang, D.-R.; Wang, X.; Wang, C.-K.; You, C.-X. The C2H2-type zinc finger transcription factor MdZAT10 negatively regulates drought tolerance in apple. Plant Physiology and Biochemistry 2021, 167, 390–399. [Google Scholar] [CrossRef]
- Liu Yi-jie, X.U.E.Y.-c. The Research Progress of Flavonoids in Plants. China Biotechnology 2016, 36, 81–86. [Google Scholar] [CrossRef]
- Wu, J.; Lv, S.; Zhao, L.; Gao, T.; Yu, C.; Hu, J.; Ma, F. Advances in the study of the function and mechanism of the action of flavonoids in plants under environmental stresses. Planta 2023, 257, 108. [Google Scholar] [CrossRef] [PubMed]
- Agati, G.; Brunetti, C.; Di Ferdinando, M.; Ferrini, F.; Pollastri, S.; Tattini, M. Functional roles of flavonoids in photoprotection: new evidence, lessons from the past. Plant Physiol Biochem 2013, 72, 35–45. [Google Scholar] [CrossRef] [PubMed]
- Morimoto, M.; Kumeda, S.; Komai, K. Insect antifeedant flavonoids from Gnaphalium affine D. Don. J Agric Food Chem 2000, 48, 1888–1891. [Google Scholar] [CrossRef] [PubMed]
- Jan, R.; Khan, M.-A.; Asaf, S.; Lubna; Waqas, M.; Park, J.-R.; Asif, S.; Kim, N.; Lee, I.-J.; Kim, K.-M. Drought and UV Radiation Stress Tolerance in Rice Is Improved by Overaccumulation of Non-Enzymatic Antioxidant Flavonoids. Antioxidants 2022, 11. [CrossRef]
- Bao, H.; Yuan, L.; Luo, Y.; Jing, X.; Zhang, Z.; Wang, J.; Zhu, G. A freezing responsive UDP-glycosyltransferase improves potato freezing tolerance via modifying flavonoid metabolism. Horticultural Plant Journal 2024. [Google Scholar] [CrossRef]
- Ritonga, F.N.; Ngatia, J.N.; Wang, Y.; Khoso, M.A.; Farooq, U.; Chen, S. AP2/ERF, an important cold stress-related transcription factor family in plants: A review. Physiology and Molecular Biology of Plants 2021, 27, 1953–1968. [Google Scholar] [CrossRef]
- Jabeen, E.; Janjua, N.K.; Ahmed, S.; Murtaza, I.; Ali, T.; Hameed, S. Radical scavenging propensity of Cu2+, Fe3+ complexes of flavonoids and in-vivo radical scavenging by Fe3+-primuletin. Spectrochimica Acta Part A: Molecular and Biomolecular Spectroscopy 2017, 171, 432–438. [Google Scholar] [CrossRef]
- Wang, L.; Li, C.; Luo, K. Biosynthesis and metabolic engineering of isoflavonoids in model plants and crops: a review. Front Plant Sci 2024, 15, 1384091. [Google Scholar] [CrossRef]
Figure 4.
Functional categorization and annotation enrichment analysis of the CtC2H2 genes. (a) A Venn network of the CtC2H2 genes were among the biological process (BP), cellular component (CC), and molecular function (MF) functional categories; (b) The CtC2H2 gene was categorized into ten Gene Ontology (GO) functional categories: seven biological process (BP) categories (circles), one cellular component (CC) category (triangles), and two molecular function (MF) categories (squares).
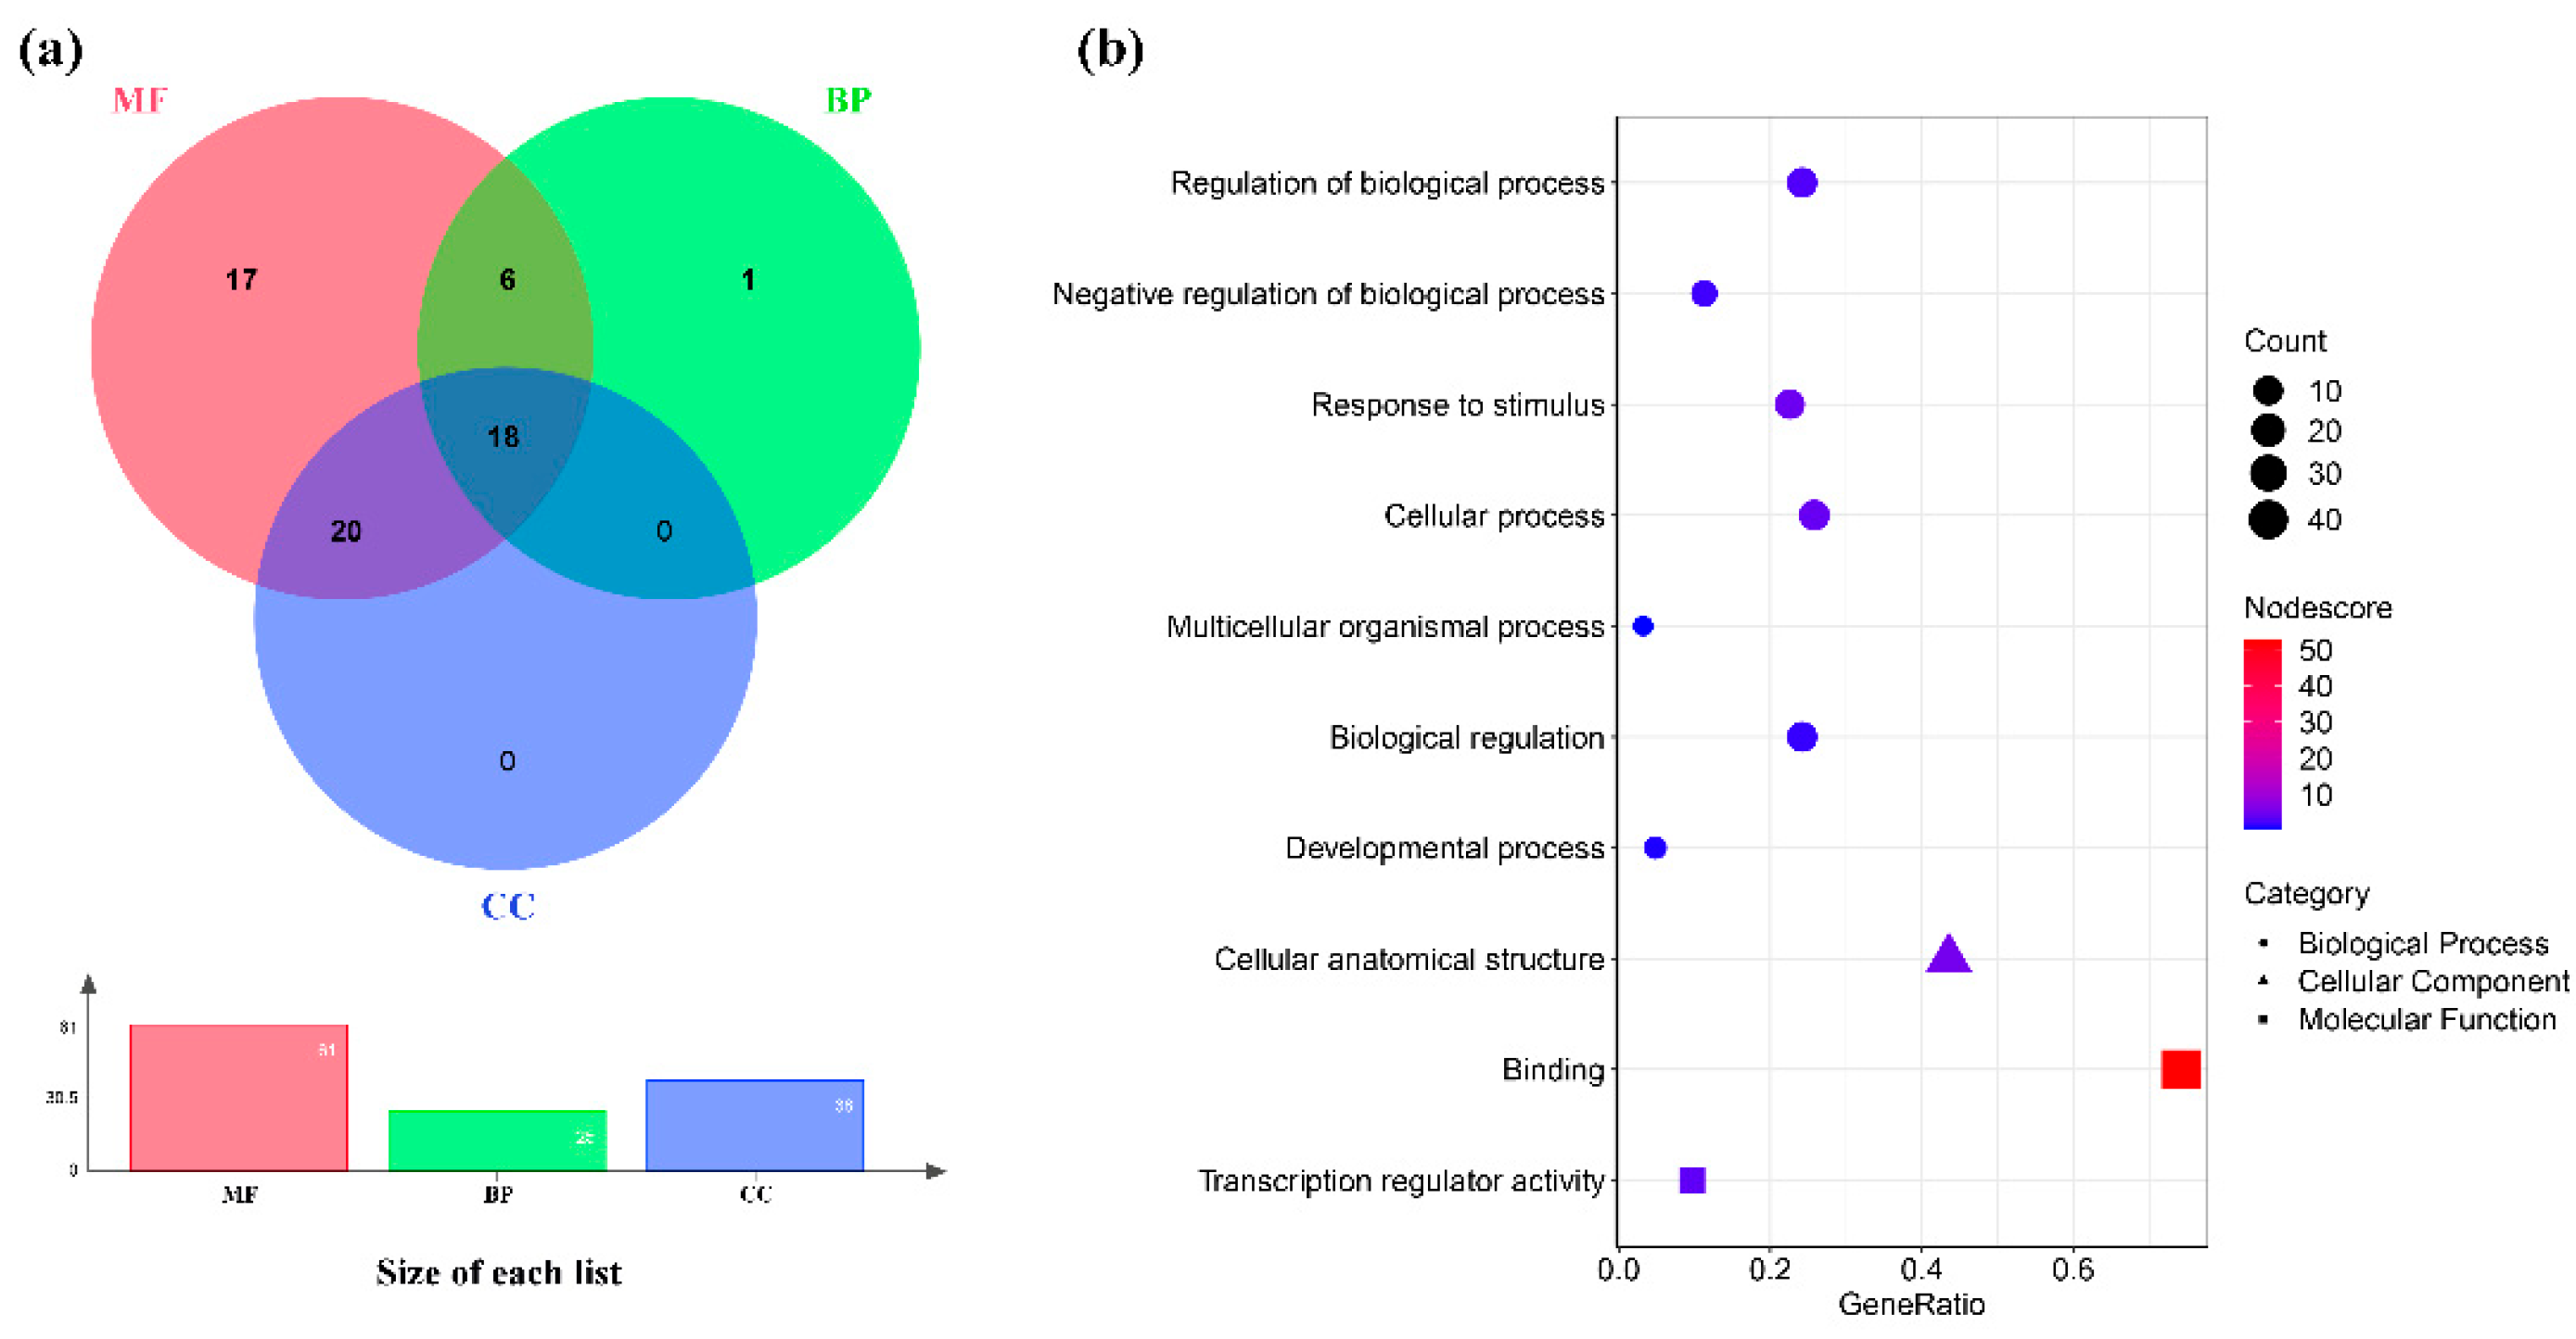
Figure 6.
Changes in the expression of CtC2H2-ZFPs under cold stress conditions; 4℃ treatment 0 h,3 h,6 h,9 h,12 h,24 h(*, p<0.05; **, p<0.01; ***, p<0.001).
Figure 6.
Changes in the expression of CtC2H2-ZFPs under cold stress conditions; 4℃ treatment 0 h,3 h,6 h,9 h,12 h,24 h(*, p<0.05; **, p<0.01; ***, p<0.001).
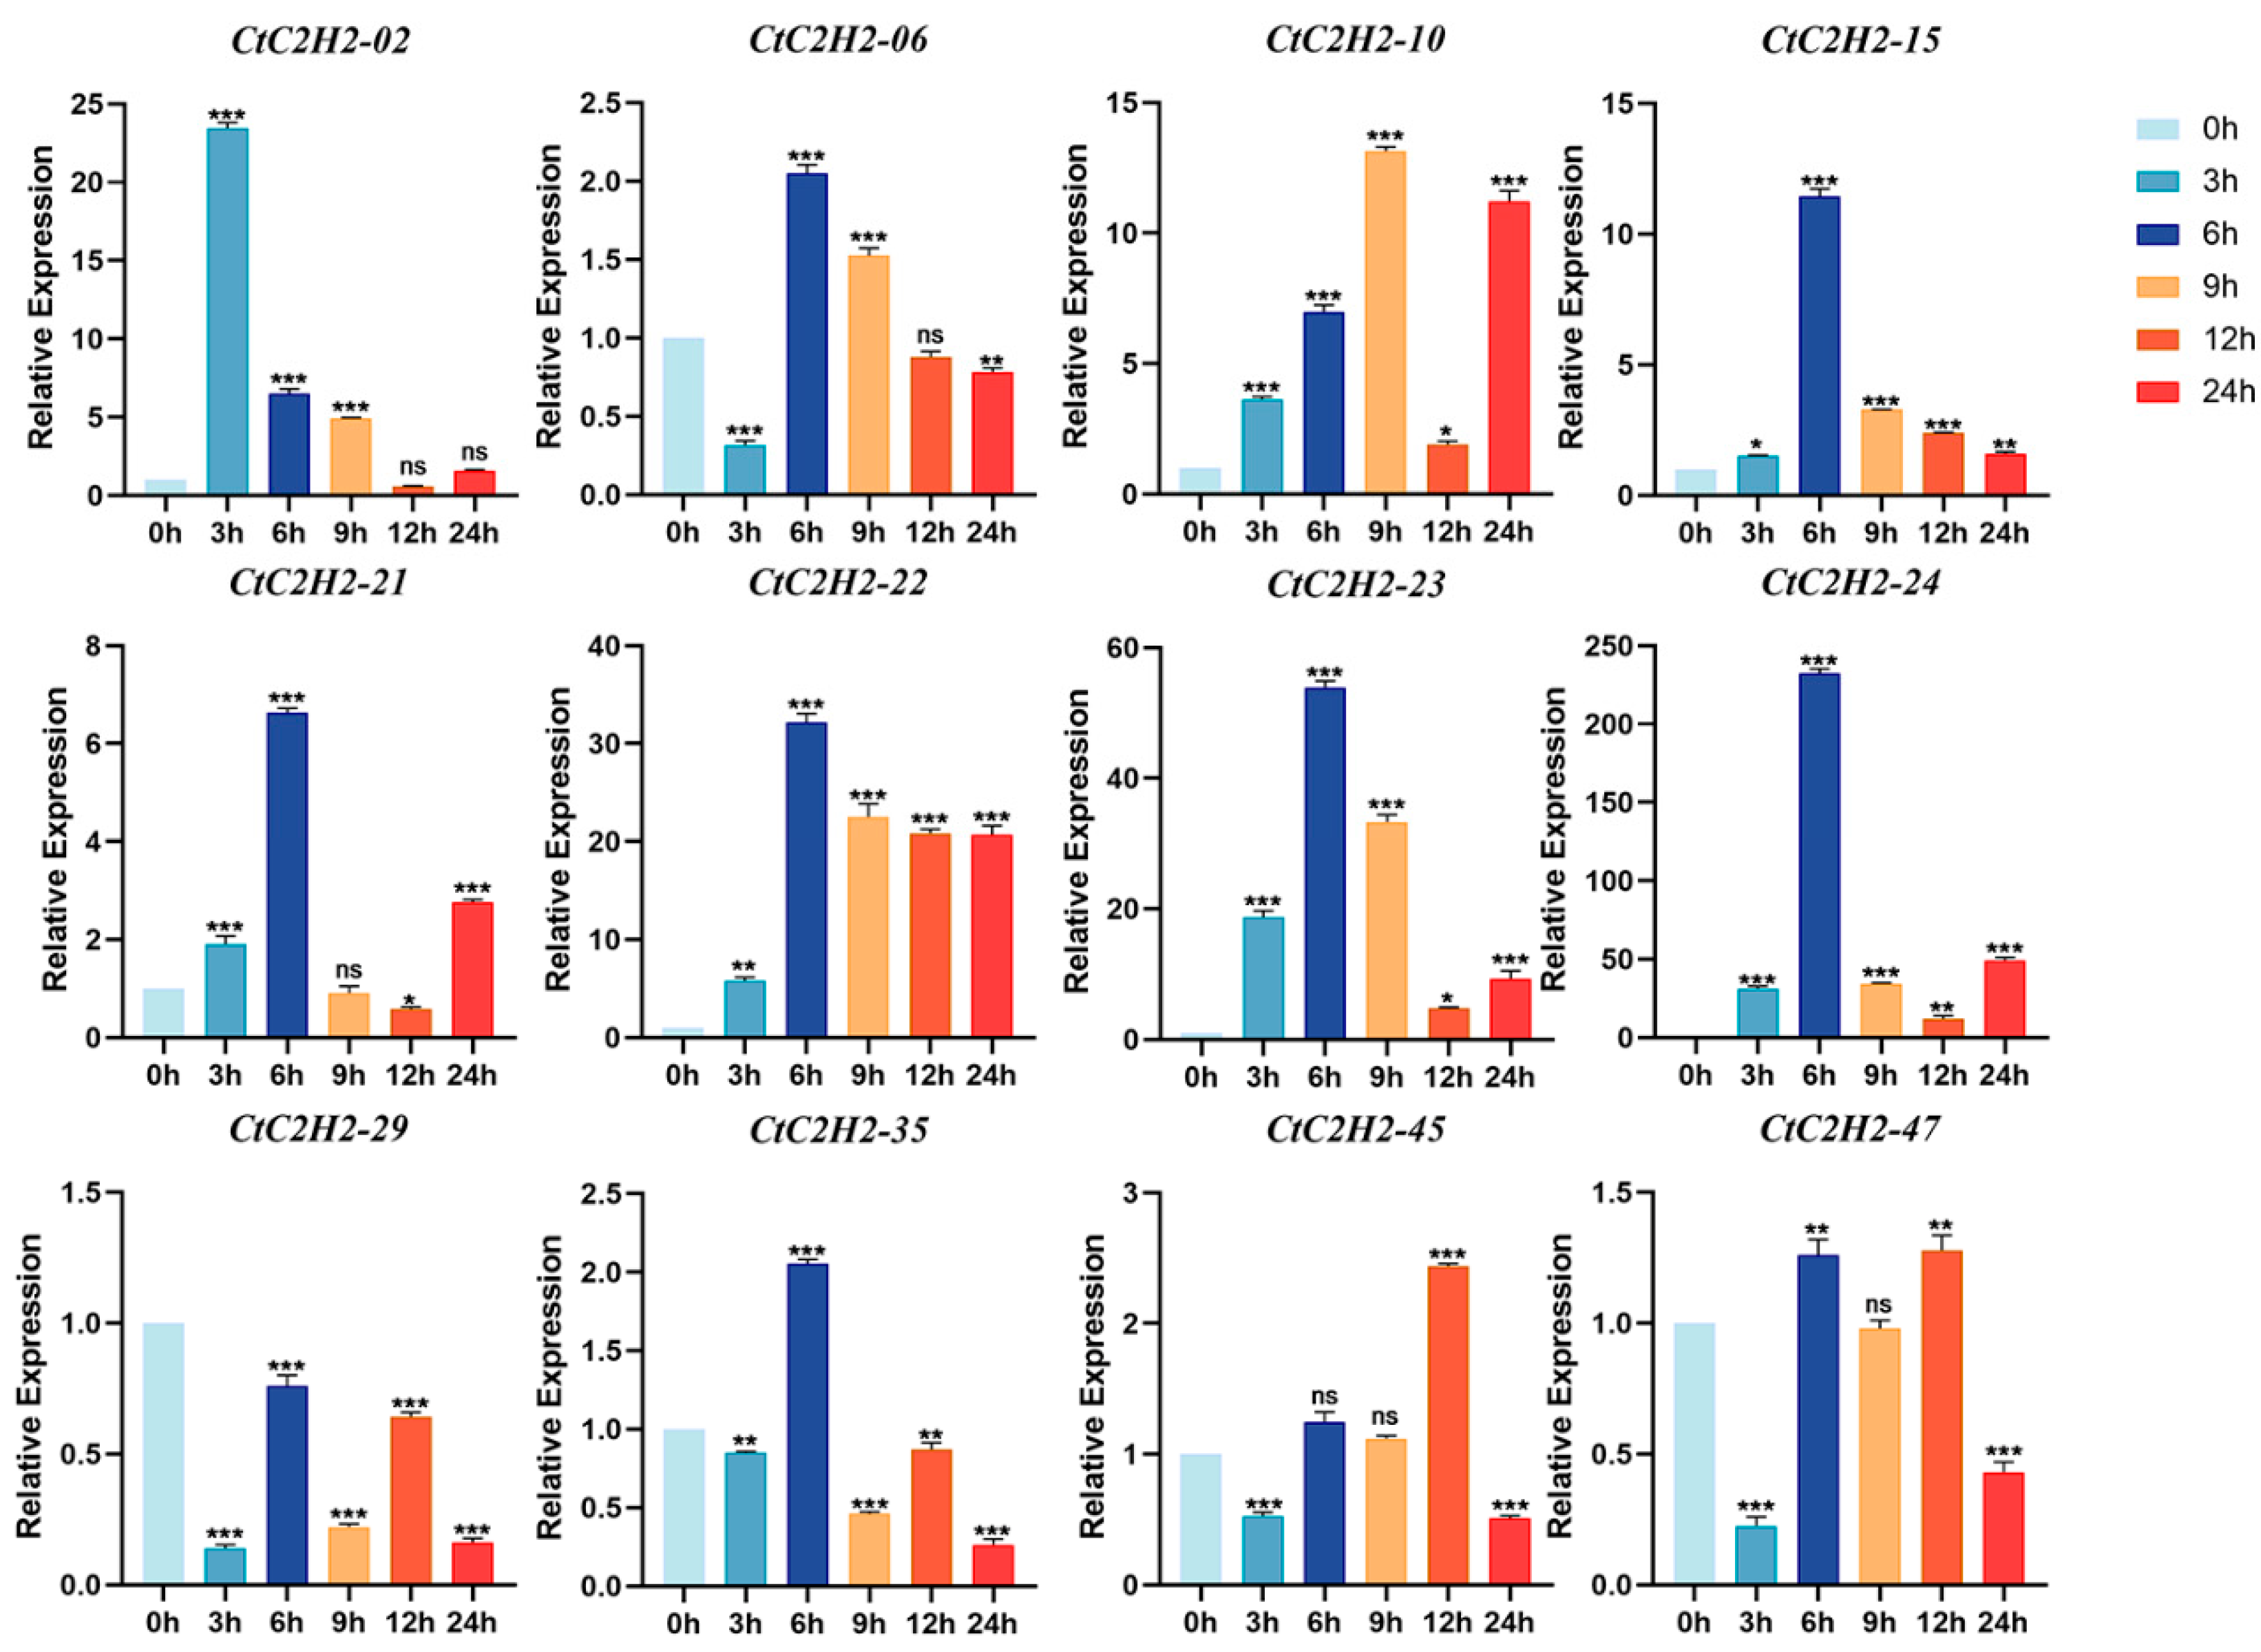
Figure 7.
Expression dynamics of CtC2H2-ZFP genes in safflower under ABA treatment. Relative transcript levels of selected CtC2H2-ZFP genes were analyzed at 0, 3, 6, 9, 12, and 24 hours following treatment with 200 μmol·L⁻¹ abscisic acid (ABA). Expression values were quantified by qRT-PCR and normalized against the internal control gene. Error bars represent the mean ± standard deviation (SD) of three biological replicates. Asterisks indicate statistically significant differences compared with the 0 h control (*p < 0.05, **p < 0.01, ***p < 0.001), revealing distinct temporal expression patterns of CtC2H2-ZFPs in response to ABA-induced stress.
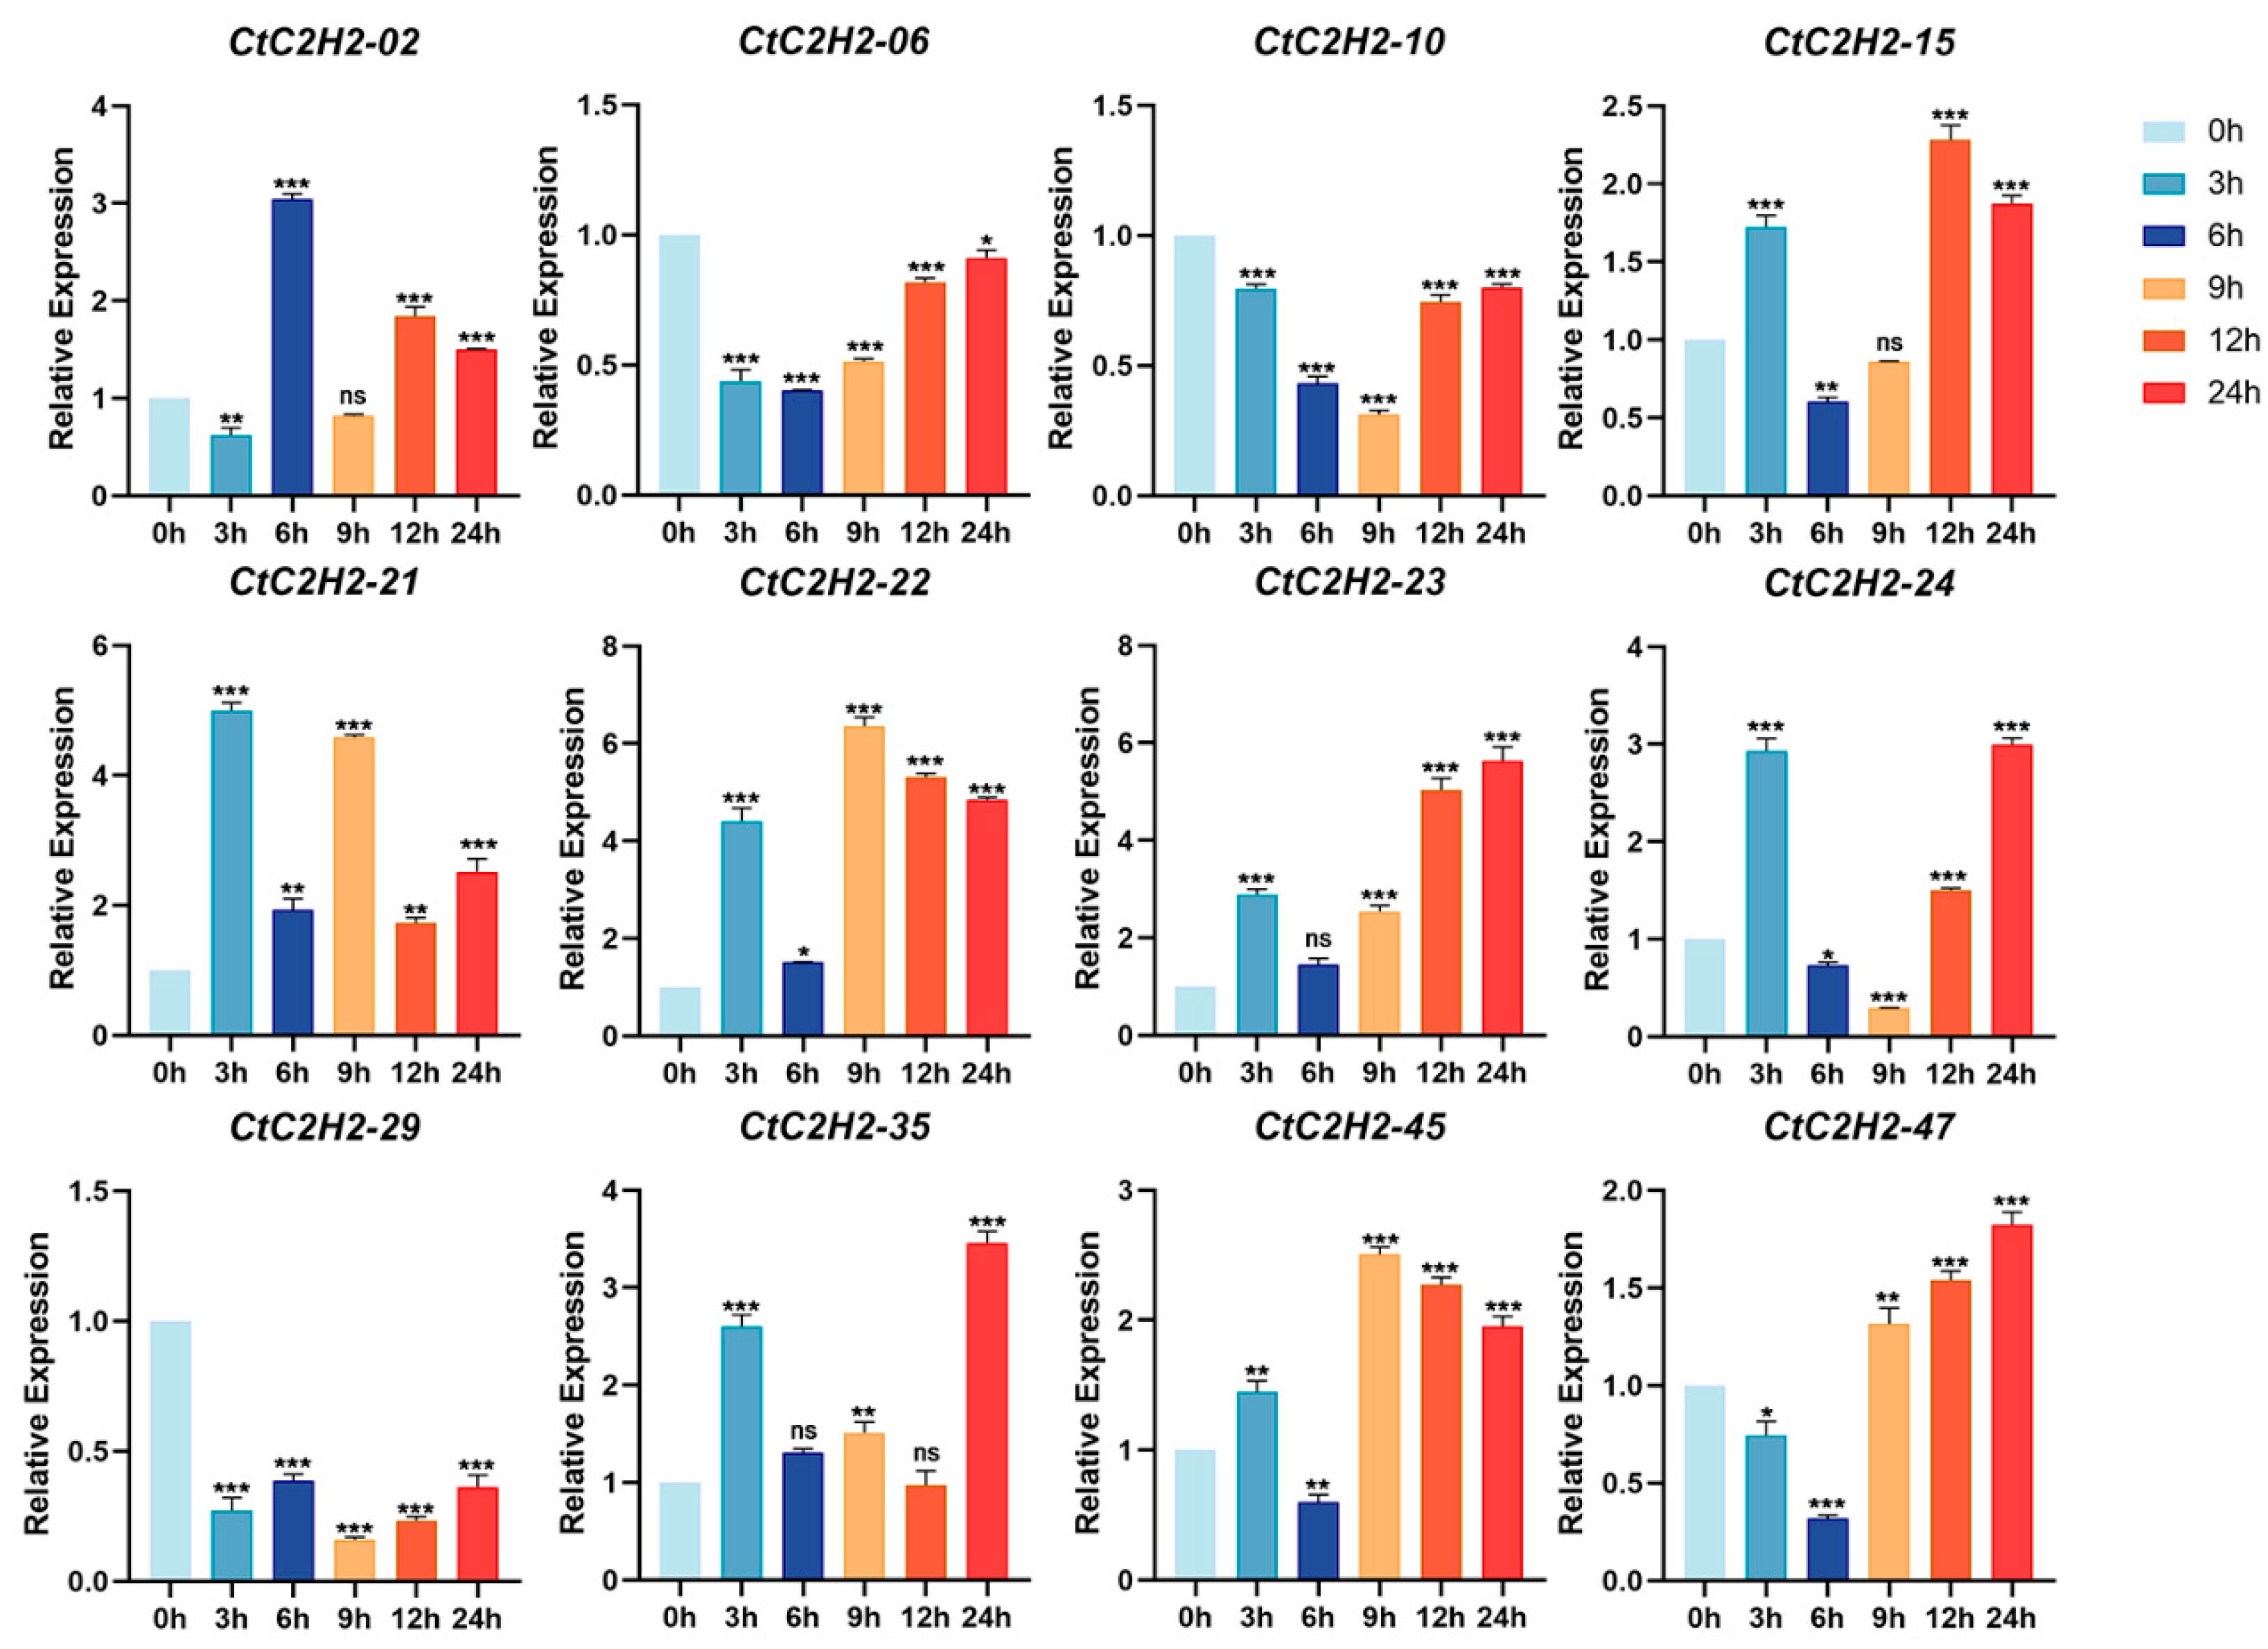
Figure 8.
Expression patterns of CtC2H2-ZFP genes in safflower under UV-B stress. Relative expression levels of selected CtC2H2-ZFP genes were measured at 0, 6, 12, 24, 36, and 48 hours following UV-B radiation treatment. Transcript abundance was quantified by qRT-PCR and normalized against the internal reference gene. Error bars represent the mean ± standard deviation (SD) of three biological replicates. Asterisks denote statistically significant differences compared with the 0 h control (*p < 0.05, **p < 0.01, ***p < 0.001), illustrating time-dependent transcriptional responses of CtC2H2-ZFPs to UV-B-induced stress.
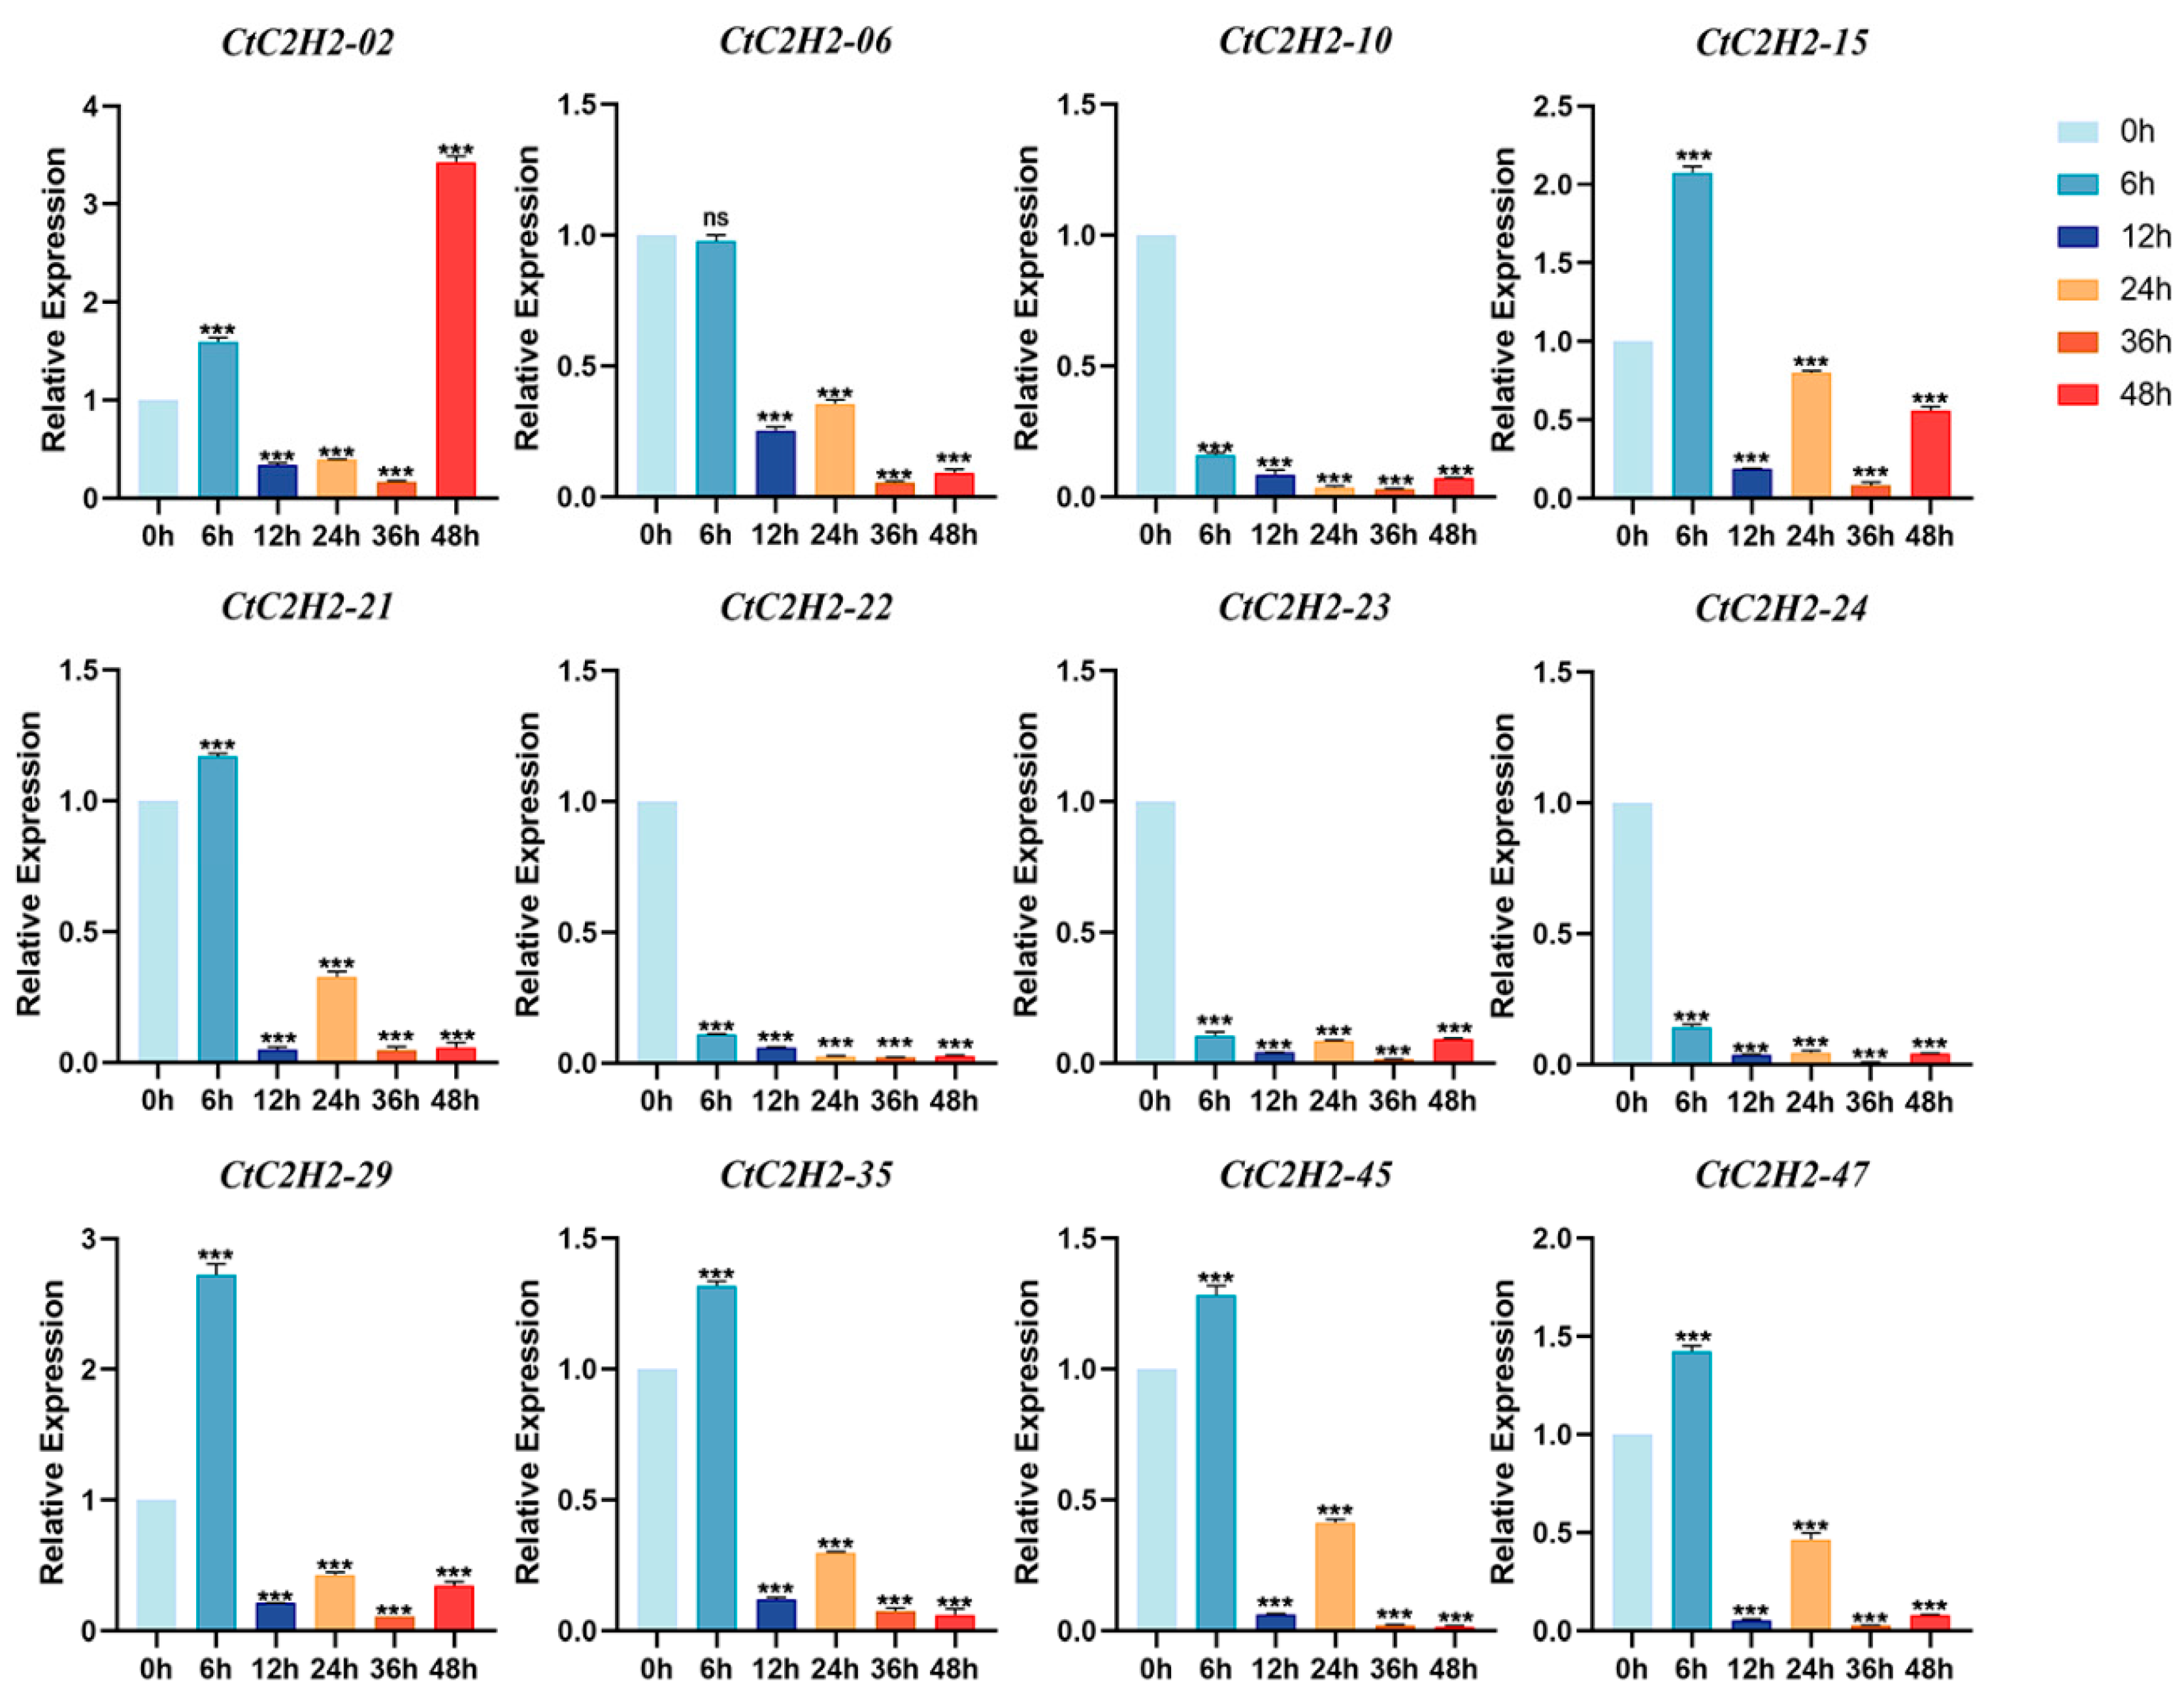
Figure 9.
Expression dynamics of CtC2H2-ZFP genes in safflower under MeJA treatment. Relative transcript levels of selected CtC2H2-ZFP genes were determined at 0, 3, 6, 9, 12, and 24 hours following treatment with 200 μmol·L⁻¹ methyl jasmonate (MeJA). Gene expression was quantified by qRT-PCR and normalized against the internal control gene. Error bars represent the mean ± standard deviation (SD) of three biological replicates. Asterisks indicate statistically significant differences compared with the 0 h control (*p < 0.05, **p < 0.01, ***p < 0.001), highlighting the transcriptional responses of CtC2H2-ZFPs to MeJA-induced signaling.
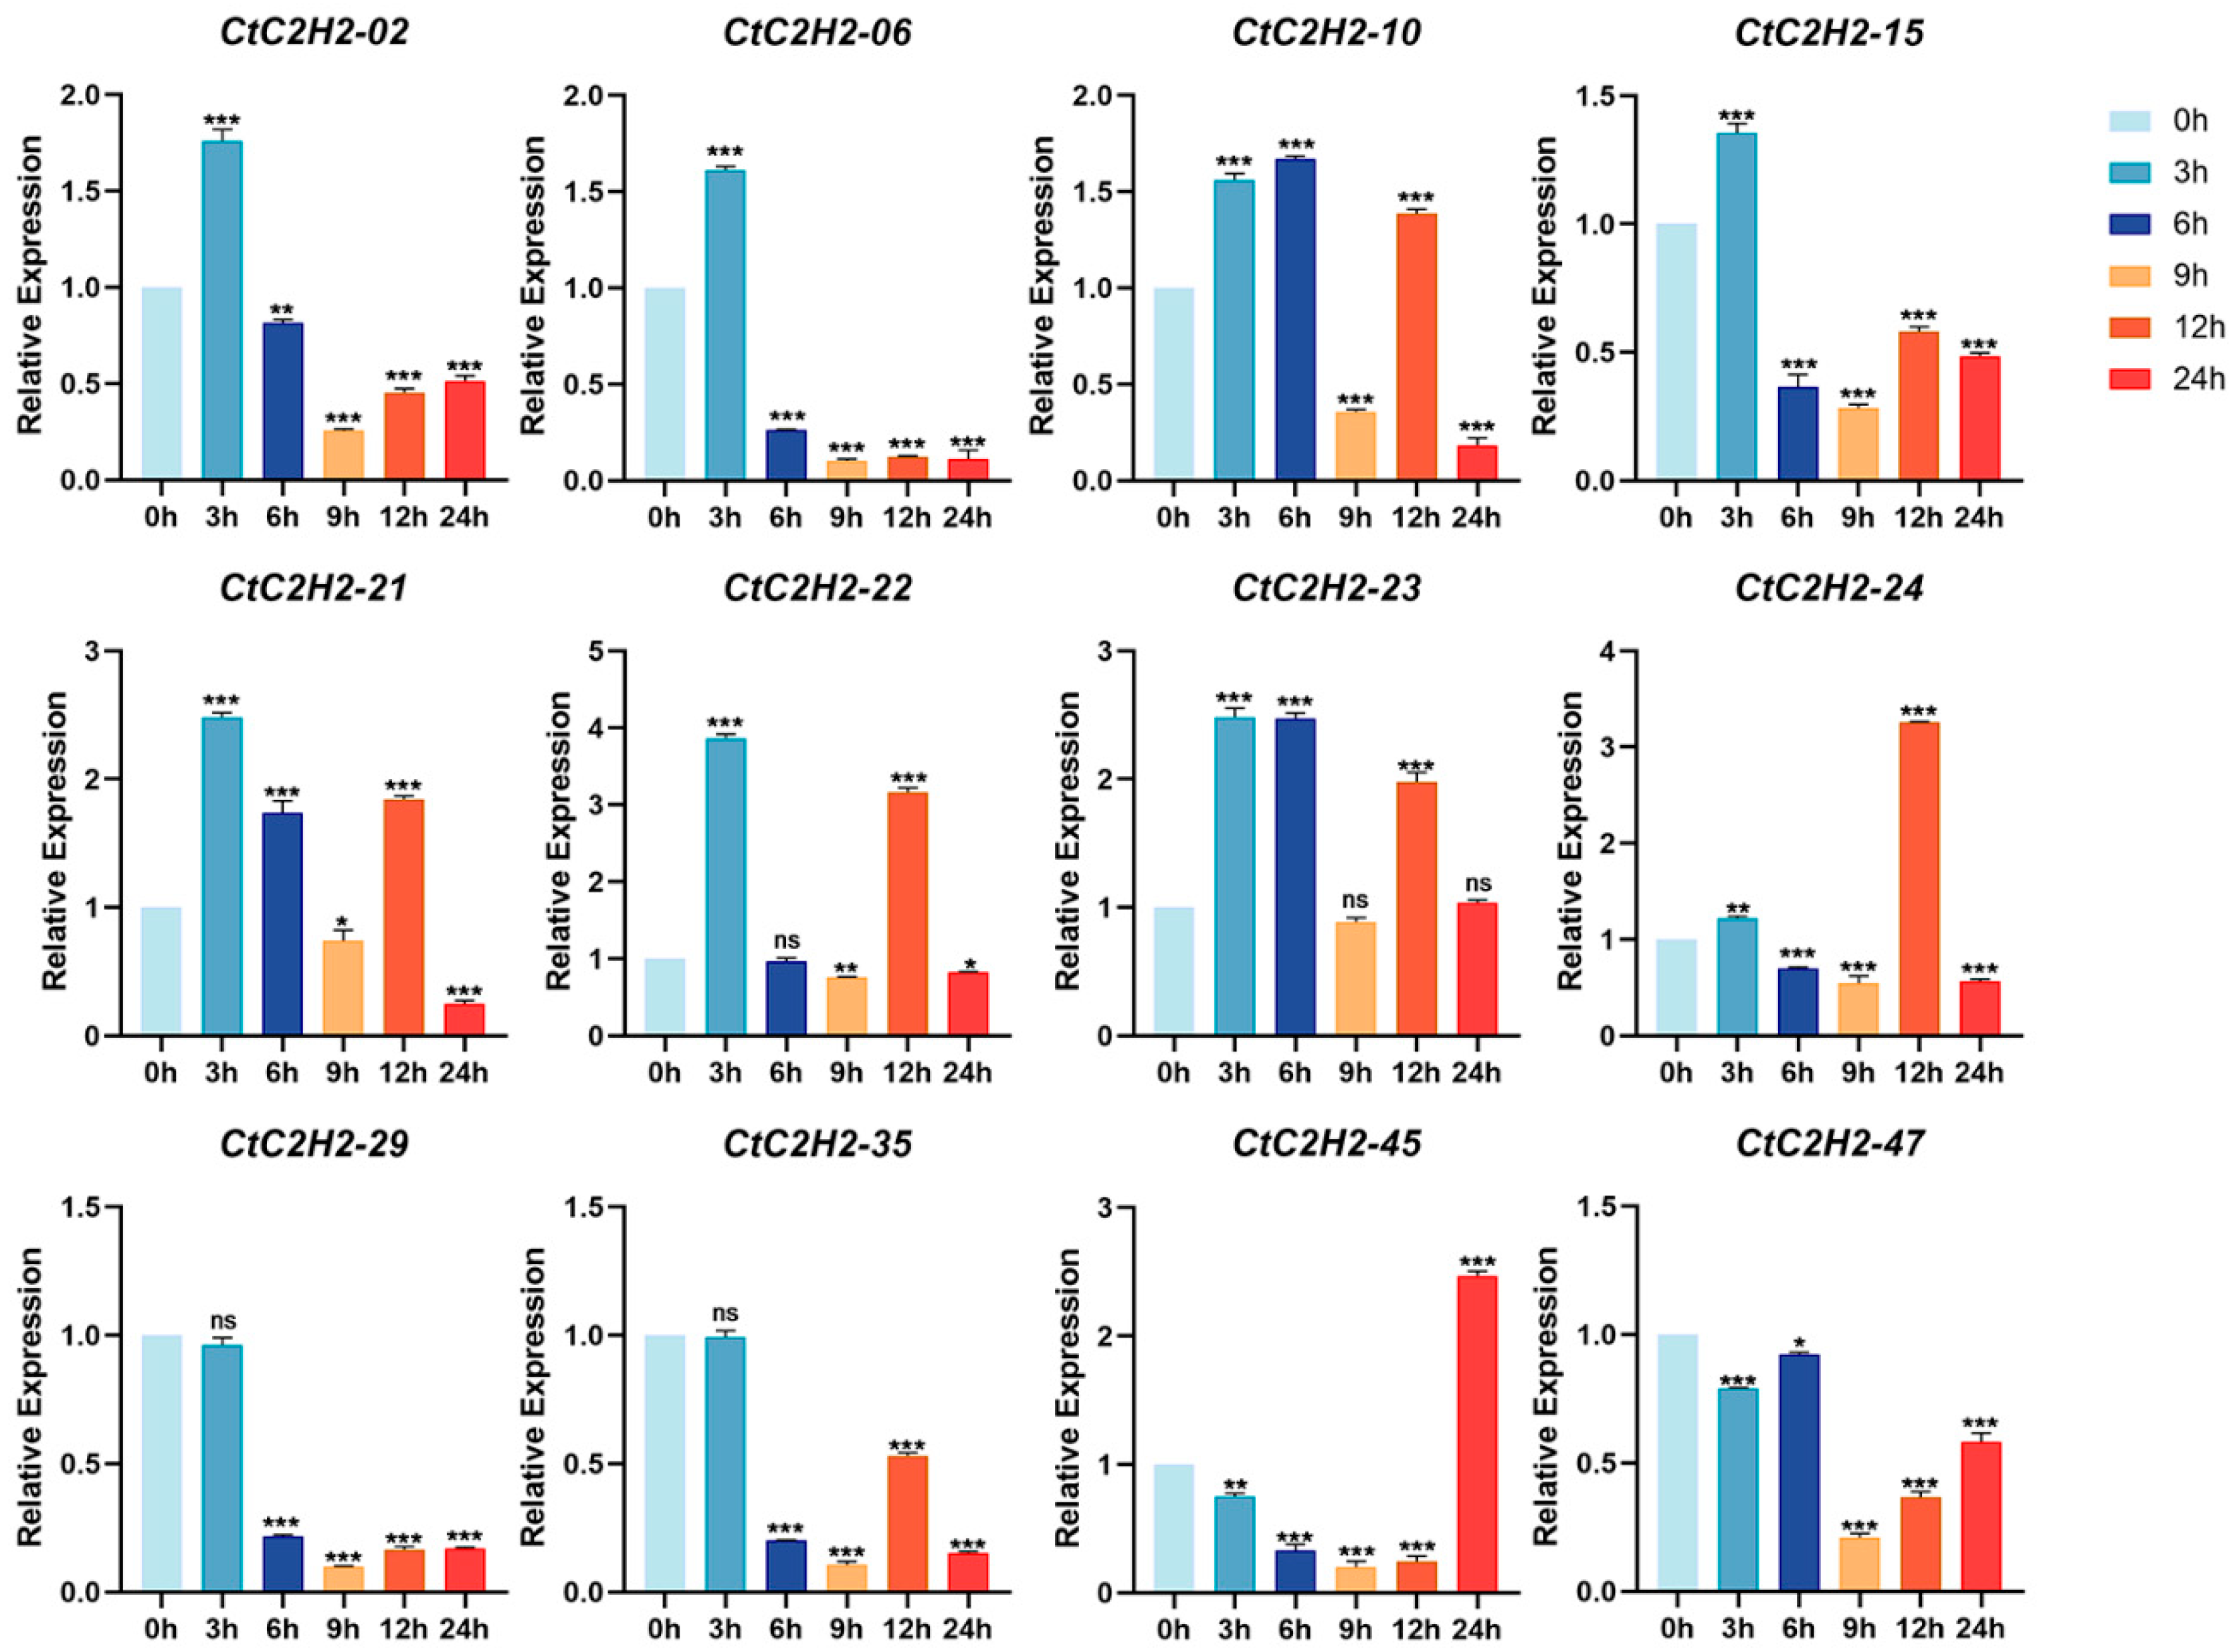
Figure 10.
Total flavonoid content and expression profiles of key flavonoid biosynthetic genes under ABA treatment. The upper panel shows the total flavonoid content in safflower was determined at 0 h and 24 h following treatment with 200 μmol·L⁻¹ abscisic acid (ABA). Data represent the mean ± standard deviation (SD) of three biological replicates.The lower panel shows relative expression levels of key enzyme genes involved in the flavonoid biosynthesis pathway were analyzed by qRT-PCR at 0 h and 24 h under the same ABA treatment conditions. Transcript levels were normalized against the internal reference gene. Statistical significance compared with the 0 h control is indicated (*p < 0.05, **p < 0.01, ***p < 0.001), revealing ABA-induced modulation of flavonoid accumulation and associated biosynthetic gene expression.
Disclaimer/Publisher’s Note: The statements, opinions and data contained in all publications are solely those of the individual author(s) and contributor(s) and not of MDPI and/or the editor(s). MDPI and/or the editor(s) disclaim responsibility for any injury to people or property resulting from any ideas, methods, instructions or products referred to in the content. |
© 2025 by the authors. Licensee MDPI, Basel, Switzerland. This article is an open access article distributed under the terms and conditions of the Creative Commons Attribution (CC BY) license (http://creativecommons.org/licenses/by/4.0/).
Copyright: This open access article is published under a Creative Commons CC BY 4.0 license, which permit the free download, distribution, and reuse, provided that the author and preprint are cited in any reuse.


