
Submitted:
15 January 2026
Posted:
16 January 2026
You are already at the latest version
Abstract
Volume fraction, or one-point statistics, is commonly used to homogenize composites. However, it contains no geometric information regarding the spatial distribution of the phases. The spatial distribution can be characterized using higher-order statistics. Two-point statistics (f2) quantify average relative phase positions, and the geometric features encoded in f2 influence material properties. However, just as a single volume fraction can describe multiple unique microstructures, some f2 map to multiple distinct microstructures. The existence of multiple microstructures possessing the same f2 is termed ‘degeneracy’ and is problematic for microstructure-sensitive design because unique microstructures may map to the same f2 yet exhibit different properties. This study quantifies how pervasive degeneracy is in f2 through exhaustive enumeration of all 236 ≈ 6.910 possible 6 × 6 binary microstructures, and tests other metrics as ways to uniquely characterize microstructures with degenerate f2. We determined that using nondirectional f2 (i.e., orientation-averaged f2) substantially increases degeneracy, nearly doubling the probability that a randomly selected microstructure will share the same f2 as some other symmetry-inequivalent microstructure. Notably, the fraction of nontrivially degenerate microstructures does not increase monotonically with system size—a counterintuitive finding that challenges prior theoretical predictions. Finally, for the small microstructures examined, we determined that three-point statistics will fully resolve the degeneracy at a computational cost that scales as n4 (where n is side length), while two-point cluster functions resolve the majority of degeneracies with substantially lower computational overhead.
Keywords:
two-point statistics
; microstructure characterization
; two-phase composites
; spatial phase distribution
; degeneracy
; directional correlations
; cluster functions
; higher-order statistics
; lineal path function
; microstructure-sensitive design
1. Introduction
Two-point statistics (denoted throughout this paper)1 quantify the average relative positions of phases within a composite. They can be used to gauge the mass density of outer space [2], the relative positions of biological tissue types [3], and the distribution and size of components in a composite [1]. The geometric characteristics of a material captured by the clearly influence the physical properties. In fact, effective properties such as elastic modulus or electrical conductivity can be estimated from microstructure statistics via homogenization bounds; Hashin-Shtrikman bounds require only volume fraction and phase properties, while tighter bounds (such as Beran-Molyneux bounds) incorporate two-point correlation information [1]. This makes a convenient and powerful analogue for the full microstructure when designing structures with optimal properties. However, it is well known that there is no 1-1 relationship between all possible structures and the space of [4]. The existence of more than one microstructure possessing the same is termed `degeneracy’. This degeneracy creates ambiguity when attempting to construct a microstructure with a specific target property.
Gommes et al. [5] developed an information-theoretic framework relating degeneracy to the information content of correlation functions. They showed that the configuration space of a reconstruction problem forms a hypercube with Hamming distance, and the “roughness” of the energy landscape (measured by how quickly the autocorrelation energy increases with Hamming distance from a ground state) serves as a proxy for ground-state degeneracy. Their key insight was that for accurate reconstructions, the information content of the two-point correlation function (in bits) should be comparable to the number of pixels in the microstructure. They hypothesized that degeneracy grows exponentially with system size; however, no systematic enumeration of degeneracy across all possible microstructures has been performed to validate this hypothesis. The present study addresses this gap by providing the first exhaustive enumeration of degeneracy.
The purpose of this study is to quantify the prevalence of degeneracy by exhaustively counting the fraction of microstructures with degenerate for two-phase composites across a range of small window sizes (side lengths of 4, 5, and 6 pixels) and then evaluating ways of breaking that degeneracy by using additional statistical metrics. While the small system sizes limit direct applicability to realistic microstructures, this exhaustive enumeration approach provides ground-truth data that is impossible to obtain for larger systems and enables systematic validation of theoretical predictions. Additionally, this work connects to the broader hierarchy of microstructure descriptors outlined in Torquato’s seminal text [1], where represents a fundamental but incomplete characterization—complete characterization requiring, in principle, all n-point correlation functions.
In materials science, N-point statistics are a tool used to characterize the distribution of different phases within a microstructure. The microstructure function, (h), tells us the volume fraction of the microstructure of phase h at position s. When the microstructure is averaged across all positions, the one-point statistics ( for readability and in the equations) can be calculated, as shown in Equation (1) [6].
Most commonly used estimates of global/sample properties are based upon volume fraction data. This may work for composites with randomly distributed phases, but more information is required to determine the properties of phases that have more complex distributions. Hence the motivation for higher order statistics. Two-point statistics ( for readability and in the equations) help capture this distribution by quantifying the probability of finding two local states (h and ) separated by a vector :
in equation (2) is also described as a correlation function. When a correlation function is used to measure the probability of finding the same state separated by a given vector (i.e. ), it is referred to as an autocorrelation function. This study will only consider two-phase composites with a periodic boundary condition, in which case there are four possible correlations: , , , and . However, only one of the four correlations is independent for a two-phase material [7]. Hence, only the autocorrelation function is usually considered.
Higher order statistics can capture more features of the distribution of microstructural phases. As an example, three-point statistics ( for readability and in the equations) can be defined as
As the order of the N-point statistics increases, the information characterizing the microstructure gains higher fidelity. For example, , or volume fraction, is a scalar and could describe many microstructures with the same volume fraction. Higher order statistics are able to resolve differences in spatial distribution between microstructures, but this higher characterization comes at the cost of data storage and computation requirements. As the order of the statistics is increased to , the autocorrelation function characterizing the microstructure is now a array where n is the side length (i.e., the number of pixels along one edge) for a 2D square microstructure, the type considered in this study. This side length parameter directly determines the spatial resolution and total number of pixels () in the discretized microstructure representation. The quantity of data describing the microstructure significantly increases as the order increases to . Since depends on two independent 2D vectors and , the dimensionality increases to an array (i.e., total entries) for a single autocorrelation function.
can also have a large data storage burden and is often compressed to nondirectional to reduce dimensionality. A nondirectional correlation function is obtained by integrating hh′ over all directions for a given value of ; it is the probability of finding phase h and separated by distance . This compression of leads to information loss, but the nondirectional form is sufficient for isotropic materials where the spatial distribution of phases does not change with direction.
In many cases, it can be convenient to work with the statistics of a microstructure rather than specific microstructural arrangements. Working in space allows for operations such as averaging or combining microstructure statistics, which is not possible in microstructure space. Microstructure design can be efficiently accomplished by searching statistical space for a desirable set of statistics. The statistics can then be transformed into a microstructure with the desired physical characteristics. The transformation between space and microstructure space is known as a reconstruction. This is usually done through Monte Carlo-based simulated annealing algorithms [4] or phase recovery algorithms [8]. However, Jiao et al. demonstrated the inadequacy of in generating good reconstructions partially due to the issue of degeneracy [9]. Several studies have investigated combining with other metrics to improve reconstructions [4,10,11].
1.1. Degeneracy
Degeneracy occurs when multiple distinct microstructures share the same . The harm of degenerate is that some distinct microstructures with the same can demonstrate unique properties [12]; as a result, multiple distinct microstructures can be homogenized using , resulting in an inability to differentiate the properties based on alone. For example, in a composite of 50% disconnected spheres in 50% matrix, both the connected and disconnected phase have the same regardless of connectivity differences as shown in Figure 1. If the black phase has much higher electrical conductivity than the white phase, then the two microstructures in Figure 1 would exhibit very different properties despite having identical . [8].
Degeneracy is typically divided into two different categories: trivial and nontrivial. Trivially degenerate occur when microstructures with the same are symmetry-equivalent, meaning they can be related by a combination of 180° rotations and translation, assuming periodic boundary conditions. While this symmetry yields the same , it also yields the same properties, so the inability to distinguish these microstructures is not problematic. Of the possible microstructures (where n is the side length of a square 2D microstructure), almost all have trivially degenerate . Nontrivially degenerate occur when all microstructures with the same are symmetry-inequivalent, i.e. they cannot be related by a combination of rotations and translations. Nontrivial degeneracy in is problematic due to the possibility of unique microstructures with the same exhibiting distinct properties.
1.1.1. Quantifying Degeneracy
Although degeneracy has been observed in literature, the pervasiveness of degeneracy has not been adequately quantified. One study hypothesized that the degeneracy would increase exponentially as the size of the microstructure increases [5], but a quantified analysis of degeneracy has not yet validated such theories.
Increased degeneracy is introduced by the compression of information when simplifying to nondirectional , an example of which can be seen in Figure 2. Gommes et al. [5] have observed high rates of degeneracy in nondirectional .
Secondary methods of characterizing microstructures have been used in conjunction with to mitigate the effects of degeneracy and potentially arrive at a 1-1 relationship between microstructures and their statistical descriptors. This is referred to as reducing or breaking the degeneracy. An example of this involves the use of secondary metrics to promote unique reconstructions of microstructures from . Higher-order statistics, such as , have been shown to display less degeneracy than , but are more computationally expensive and have received mixed assessment of value. In a cosmology study by Vafaei et al. [2] they concluded that a combination of nondirectional and nondirectional reduced the degeneracy. However, in microstructure specific studies [5,9], some have claimed that minimal additional information can be gained from nondirectional , and that do not justify the additional computational expense. From a theoretical perspective, complete microstructure characterization requires the infinite hierarchy of n-point correlation functions [1]; in practice, truncation at finite order introduces inherent information loss that manifests as degeneracy.
In addition to higher-order N-point statistics, other metrics, such as the lineal path function and two-point cluster function, have been used to resolve degeneracy in microstructure homogenization and increase the likelihood of unique reconstructions. The lineal path function gives the probability that a straight line segment of length z lies entirely within a single phase [13]. Mathematically, (the autocorrelation at that distance), with equality holding only when the phase is perfectly connected along all paths of length z. The lineal path function therefore provides information about the connectivity of the system that is not captured by alone. Notably, this connectivity is critical for transport properties—two microstructures with identical but different connectivity (see Figure 1) can exhibit vastly different electrical conductivity or permeability. Early work by Yeong and Torquato identified that reconstructions incorporating both the lineal path function and had a higher fidelity than reconstructions from alone [4]. However, the lineal path function has known flaws. Jiao et al. found that the lineal path function tends to underestimate the grain size, where a grain is a continuous single-phase region, due to end points of a line existing in the same grain while the line crosses some other phase [11].
For this reason, the two-point cluster function has been developed as a more complete connectivity descriptor [14]. Unlike , which only requires both endpoints to be in the same phase, requires both endpoints to belong to the same connected grain. This provides a direct measure of topological connectedness that is essential for continuum percolation analysis and transport property prediction. The relationship establishes a hierarchy among these functions: is most restrictive (both points must be in the same grain), L is intermediate (all intervening points must be in the same phase), and is least restrictive (only the two endpoints matter). This hierarchy means the two-point cluster function captures the most detailed connectivity information. The two-point cluster function has been used in conjunction with to reduce degeneracy [9] and significantly improve reconstruction accuracy [11], particularly for materials where phase connectivity governs macroscopic behavior.
This work computes the for all possible two-phase 2D square microstructures with side lengths 4, 5, and 6. Even for these small systems, exhaustive enumeration is computationally demanding: a system has possible binary microstructures, requiring careful algorithmic optimization to make the analysis tractable. The percentage of degeneracy associated with each volume fraction is quantified, and the increase in degeneracy due to nondirectional is assessed by identifying how many microstructures correspond to a single directional and nondirectional . Using the metrics introduced above, this study attempts to uniquely characterize (i.e., break the degeneracy of) a set of microstructures with degenerate . The fidelity of these metrics and their computational cost are then compared.
2. Methods
To fully capture the degeneracy present in a microstructure of a given side length, all possible microstructures of that side length must be generated and their must be calculated and compared. Because the number of possible permutations of a 2-phase microstructure scales as , this quickly becomes computationally intractable for large values of n. Therefore, this study specifically analyzed square microstructures with side lengths of 4, 5, and 6.
Once all microstructures for a given side length have been enumerated, their must be calculated and compared to determine what degeneracies are present. Fortunately, the computational burden can be simplified in a few ways. First, for the simple two-phase microstructures analyzed in this study, only the autocorrelation for one phase needs to be calculated, stored, and compared; as mentioned, the autocorrelation of the other phase and the two cross-correlations can be determined from the autocorrelation of the first phase. This also means that the are phase-agnostic, so once all possible volume fractions up to 0.5 are calculated, the remainder of the calculations are rendered unnecessary. Additionally, contains the volume fraction, which means that microstructures of different volume fractions cannot produce the same and therefore cannot be degenerate. Therefore, the calculations of different volume fractions for a given side length can be computed in parallel. Finally, each microstructure has potential trivial degeneracies (as described in step 6 of the following procedure). Therefore, once for one microstructure in the trivially degenerate set has been calculated, all other microstructures in the set can be skipped.
Even once these simplifications have been made, calculating , comparing it to the of every other microstructure of a given volume fraction, and storing the number of matches in a brute force manner would still be computationally intractable for . To further reduce the computation time, the procedure described below was followed for each side length and volume fraction.
- 1.
- Generate a list of all microstructures with a given side length n and volume fraction. Each microstructure is an matrix where some elements are 1 and the rest are 0, representing two different phases, where the phase represented by 1 is the phase of interest. The number of elements in the matrix that are phase 1 is determined from the volume fraction.
- 2.
- Select a microstructure from the set of microstructures described in 1.
- 3.
- Create all symmetry-equivalent microstructures (translations and 180° rotations) and remove them from the list of microstructures to evaluate. These microstructures will have trivially degenerate .
- 4.
- Calculate the autocorrelation for the microstructure as described in Equation (2). In practice, these statistics are calculated as follows: for a vector t that can be drawn between two points in the microstructure, create a copy of the microstructure and shift it by t. Compare the microstructure to its shifted copy and sum the number of locations where both are phase 1. Divide this sum by the microstructure area. Repeat for all vectors t that can be drawn between pixels in the microstructure.
- 5.
- Once the microstructure and its are calculated, create a hash map to store them. A hash map contains a set of keys. Each key represents a location where a value or list of values can be stored that are associated with that key. Hash maps are utilized because insertion and retrieval in a hash map are constant time operations, meaning they do not depend on the current size of the hash map. This substantially accelerates computation and comparison.
- 6.
- Generate the keys by taking the unnormalized , flattening the matrix to a 1D array, and converting each element of the matrix into a character array. The single digit values are unchanged and the double digit values 10-18 are converted to letters A-I. Encode the associated microstructure as a 64-bit integer; each microstructure contains only 1s and 0s, so the microstructure matrices are flattened to a 1D array of length and treated as binary digits. Check the hash map to see if the key exists. If it does not, create it and store the microstructure at the key location; otherwise, add the microstructure to the list of microstructures present at that key location.
- 7.
- Continue until there are no microstructures left to evaluate for the current side length and volume fraction. Save the hash map
This algorithm outputs a hash map for each volume fraction and side length that can then be analyzed to determine the prevalence of degeneracy. This analysis is performed by evaluating how many keys (autocorrelations) have multiple values (microstructures), indicating a degenerate . The extent of that specific degeneracy can be determined by counting the number of values that correspond to a the given key. More values for a single key indicates that there are more symmetry-inequivalent microstructures that map to a single .
2.1. Degeneracy Breaking Approaches
To test the ability of other metrics to break degeneracy, a subset of microstructures with nontrivially degenerate was reexamined with a new metrics to determine if they could break the degeneracy; i.e., additional metrics are applied to the dataset during the analysis to see if any of them could reduce the amount of degenerate by applying another identifier to keep unique microstructures separate. Each metric evaluated here was calculated assuming periodic boundary conditions.
2.1.1. Three-Point Statistics ()
Whereas the autocorrelation of represents the probability that two points of a microstructure separated by some vector will have the same phase, the autocorrelation of represents the probability that three points will share the same phase. Therefore, the autocorrelation can be calculated in a manner similar to , as follows: for two vectors t and that can be drawn between two points in the microstructure, create two copies of the microstructure. Shift one copy by t and the other by . Compare the original microstructure to both shifted copies and sum the number of locations where all three are phase 1. Divide this sum by the microstructure area. This process is repeated for all vectors that can be drawn between pixels in the microstructure.
2.1.2. The Lineal Path Function
There are several ways in which the lineal path function is calculated in literature. One is by using randomly oriented lines of a specified length that stay within a single phase [11] to provide more information on the geometry of the microstructure. The second is very similar to the first except it constrains the lines to either a horizontal or vertical orientation [4]. Some artifacts can be introduced by reconstructions from the horizontal/vertical approach. This method is unable to resolve round surfaces in a microstructure. However, due to the small scale of our microstructures, the horizontal/vertical method was used. The quantity of each horizontal and vertical length were stored separately, to preserve anisotropy, then compared across each of the microstructures.
2.1.3. Grain Size Distribution
The grain size distribution was found by quantifying the number of pixels in each grain of a single phase. A grain is defined as a connected group of pixels all of the same phase. Pixels of the same phase that share only a corner are not considered part of the same grain. Like with the , the grain size distribution was calculated using a periodic boundary assumption. However, each pixel was counted only once. The number of pixels per grain in a single microstructure was recorded. The resulting array for each microstructure was then used to further identify correlating .
2.1.4. Two-Point Cluster Functions
The two-point cluster function represents the odds that two pixels on the ends of a vector t will simultaneously share the same phase and belong to the same grain. To calculate this function, each grain was numbered using a breadth first search algorithm, resulting in a matrix with zeros for one phase and numbers 1 to x representing the second phase, where x is the number of grains. This will be referred to as the grain-labeled microstructure. For a vector t that can be drawn between two points in the microstructure, a copy of this grain-labeled microstructure is created and shifted by t. The grain-labeled microstructure is then compared to its shifted copy, and the number of locations where both microstructures are nonzero and share the same grain number are summed. This sum is then divided by the microstructure area, and the process is repeated for all vectors t that can be drawn between pixels in the microstructure.
3. Results and Discussion
Prevalence of Degeneracy
In this paper, we enumerate the degeneracy found in for all two-phase microstructures of size 4×4, 5×5, and 6×6. Figure 3 shows an example degenerate and several of the microstructures that correspond to it.
Gommes et al. [5] state that as the size of the system increases, the degeneracy is expected to grow exponentially. It is inherently true that the number of microstructures that have trivially degenerate grows with structure size because any microstructure with side length n can have up to trivial degeneracies. However, Figure 4 shows that as the size of the system increases, the fraction of nontrivial degeneracy does not increase monotonically. Figure 4 demonstrates that, at least in small systems, the chances of finding a microstructure with nontrivially degenerate can decrease as the size of the system increases. Importantly, these statistics were calculated using the directional ; results for the nondirectional will be discussed later.
Figure 5 shows how the fraction of structures with degenerate varies as the volume fraction of the system increases. Although the fraction of degeneracy generally increases with an increase in the volume fraction, there are some volume fractions that seem to result in an unusually high number of microstructures with degenerate . In the case of the 4×4 system, these occur at volume fractions 4/16, 6/16, and 8/16. In the case of the 5×5 system, volume fractions 5/25 and 10/25 have unusually high amounts of degeneracy. Similar behavior is observed in the 6×6 system for volume fractions 6/36, 9/36, 12/36, 15/36, and 18/36. These results indicate a relationship between the side length of the system and the volume fractions with increased nontrivial degeneracy. In the 4×4, 5×5, and 6×6 cases, the special volume fractions all follow the following formula:
where n is the side length of the microstructure and k is an index () that results in the numerator being an integer. For example, for an odd side length of 5, k can only take values of 0 or 2 because results in a non integer value in the numerator. This odd/even distinction may be significant: even side lengths permit more “special” volume fractions satisfying this formula than odd side lengths, potentially contributing to the observed non-monotonic behavior in degeneracy with increasing system size. For higher values of n, this equation may indicate which volume fractions would result in the most nontrivially degenerate , but this result has not been tested.
In many applications of , the volume fraction is set, and the side length of the image or microstructure being analyzed can be easily changed. Thus, a more useful form of this equation solves for n in terms of the volume fraction ().
Findings up to this point were based on the directional , but to simplify the metric, many studies utilize nondirectional instead. As described previously, nondirectional treat the contributions from vectors of the same length as equivalent, even when the vectors differ in direction. Compressing the data in this way will inevitably result in a higher degree of degeneracy, but the degree of increased degeneracy has not previously been explored. For the systems analyzed in this study, the percentage of nontrivial degeneracy using nondirectional is shown in Figure 6. Clearly, using nondirectional results in a significantly higher amount of structures with degenerate as nearly all microstructures have a degenerate nondirectional , indicating that nondirectional reduce the fidelity of information in the system significantly.
When the fraction of degeneracy is broken down by volume fraction as shown in Figure 7, it becomes clear that the increase in degeneracy is widespread. All volume fractions have significantly higher fractions of degeneracy compared to the directional case.
3.1. Breaking Degeneracy
In practice, can be combined with other metrics to reconstruct a more unique microstructure or determine more accurate properties. In order to attempt to break the nontrivial degeneracy found in for 4×4, 5×5, and 6×6 systems, the , lineal path function, grain size distribution, and two-point cluster functions were calculated for certain degenerate sets of to demonstrate their effectiveness in breaking degeneracy.
Before diving into the influence of additional metrics on degeneracy, we first describe the subset selection methodology. Calculating these metrics for every microstructure would require prohibitive computational time and resources. For example, calculating, storing and comparing the for every 6×6 microstructure with a volume fraction of would take on the order of 10 days of wall time on a supercomputer and would require approximately 3 TB of RAM.
To circumvent this problem, a small subset of exhibiting significant degeneracy was selected for further analysis. In the data analyzed, each unique represents a group of microstructures, and this group can vary in size. Figure 2, Figure 3, Figure 4, Figure 5, Figure 6 and Figure 7 show what percentage of corresponds to at least two microstructures but do not capture the distribution of these group sizes. Figure 8 depicts how these group sizes are distributed for a 6×6 microstructure with a volume fraction of and shows how this distribution shifts for directional and nondirectional . The distribution for directional is relatively narrow, and most statistics in this case represent only a single microstructure. However, using nondirectional significantly increases the range of possible degenerate group sizes, and the most common group size is a group of 4 equivalent microstructures. These facts taken together demonstrate another shortcoming of nondirectional : not only are fewer microstructures represented by a unique nondirectional , the groups of equivalent microstructures can be significantly larger.
Since directional exhibits clear advantages, the analysis of breaking degeneracy focused on how well the chosen metrics are able to differentiate microstructures with equivalent directional . It was assumed without proof that the most difficult groups of microstructures to completely differentiate would be the largest degenerate groups. Therefore, all that represented the largest degenerate group sizes for each side length and volume fraction were chosen for further analysis. Figure 8 highlights in red the set of microstructures that would be selected for a 6×6 microstructure with a volume fraction of .
This maximum degenerate group size varies considerably with changes in microstructure size and volume fraction. Generally, the relationship is direct: increases in microstructure size and volume fraction result in larger degenerate group sizes. Because of this, the 4×4 and 5×5 microstructures have relatively small degenerate group sizes to begin with, and analysis of breaking the degeneracy in this case is less informative due to the small sample sizes. Furthermore, visually comparing all volume fractions of the 6×6 microstructures would introduce visual clutter. For these reasons, Figure 9, which compares the efficacy of different metrics in breaking the degeneracy in , only displays the results for high volume fraction 6×6 microstructures. The same trends shown in Figure 9 are also present in the smaller microstructures and the microstructures with lower volume fraction, but those microstructures are omitted from the figure.
Figure 9 shows that breaks the degeneracy in for these small microstructures. However, previous studies have found that contains minimal additional information compared to [5,9]. shares the same weakness as : it cannot encode connectivity information. Although there is a 1-1 correspondence between and microstructure for the studied microstructures, the lack of connectivity information in and means using both metrics together may not be able to accurately represent all properties.
Figure 9 also shows that the grain size distribution is unable to fully break the degeneracy of the nontrivially degenerate . This is due in part to the small window size, which does not allow for much variation in the grain size distribution between microstructures. However, even for large systems, if the grain size is also large and few grains exist in the window size, the grain size distribution is likely to be an inadequate metric to distinguish microstructures or their . Furthermore, Figure 9 shows that the grain size distribution seems to struggle more as the volume fraction increases. This could be because there are likely to be fewer grains at higher volume fractions.
The lineal path function also failed to fully break the degeneracy of the nontrivially degenerate , as seen in Figure 9. This could be due to the restriction of line angles that can be readily analyzed in small microstructures. Yeong and Torquato demonstrated that the lineal path function helped improve reconstruction techniques because they incorporated connectivity information not found in [4]. However, other metrics such as the two-point cluster function have been found to further improve reconstruction performance; these metrics may perform better than the lineal path function partially because of its inability to fully break the degeneracy of .
Jiao et al. highlighted the superiority of the two-point cluster function over other metrics commonly used to describe a microstructure’s connectivity and spatial correlation [9], and their results are further validated in this study. Figure 9 demonstrates that the two-point cluster function nearly completely breaks the degeneracy of , a significant improvement on the lineal path function and grain size distribution. These results also suggest that the two-point cluster function’s ability to break the degeneracy of could help explain why it is such a valuable tool in reconstruction algorithms.
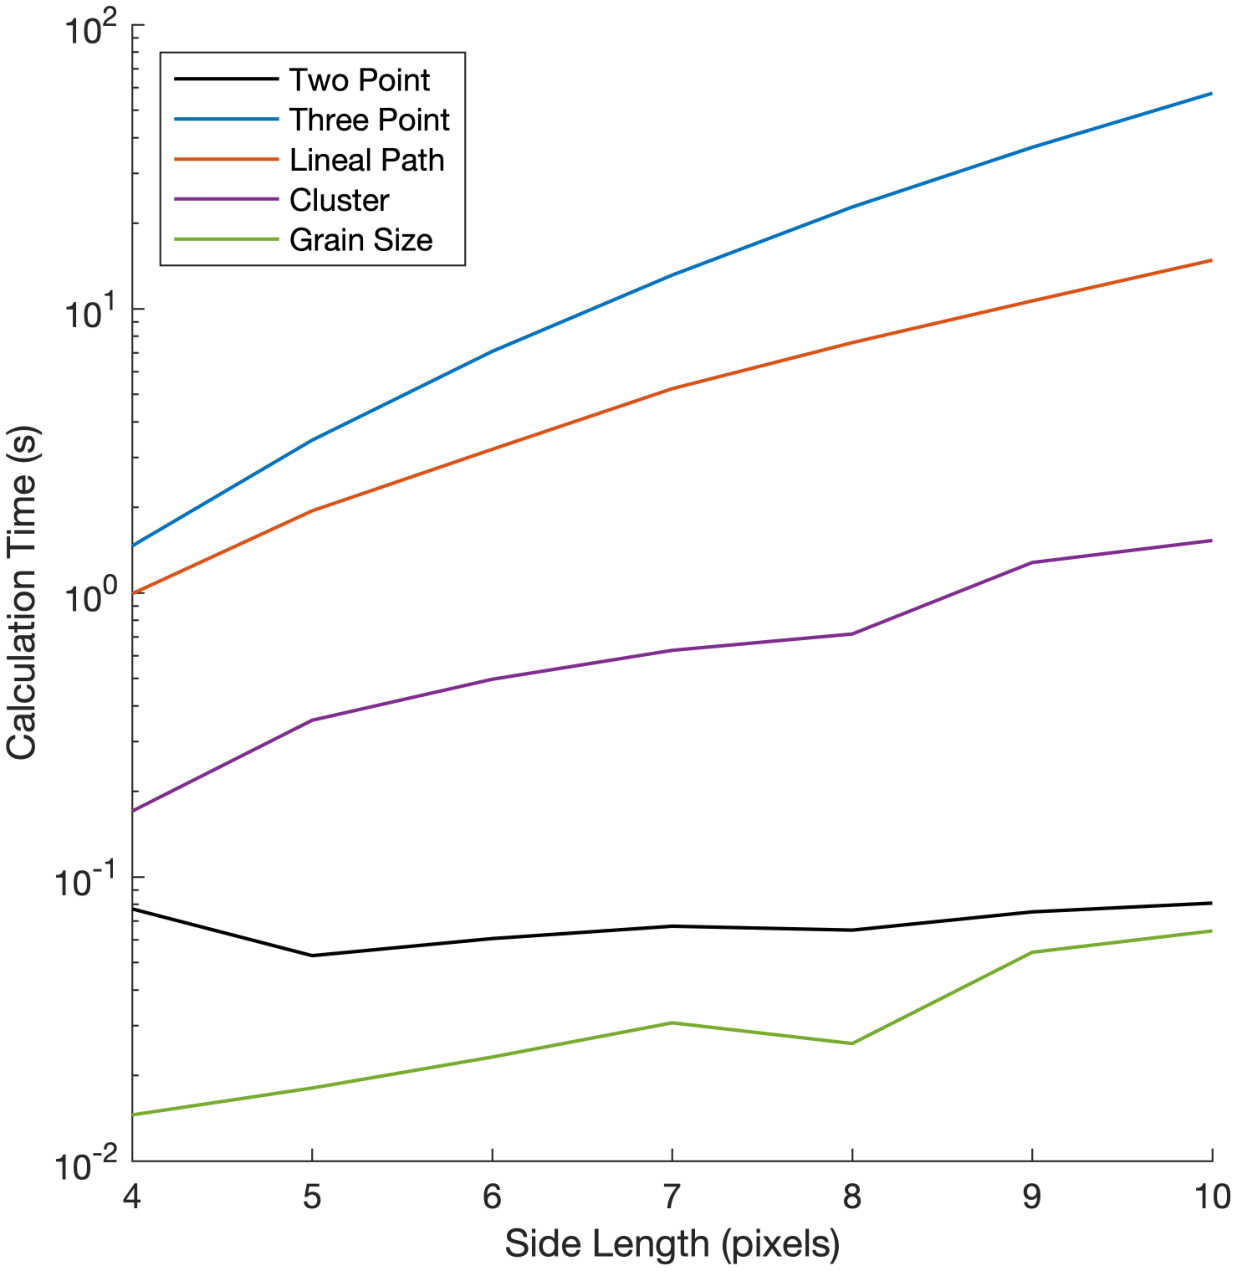
Based solely on the ability of a metric to break the degeneracy of , it seems that is the best metric to combine with to uniquely characterize a microstructure. The two-point cluster function also mostly eliminates degeneracy, whereas the lineal path function and grain size distribution performed worse than the other two metrics. However, for real microstructures, which are larger than the simple examples used in this paper, the computational burden must also be considered. Figure 10 shows that the computational cost of explodes as the microstructure increases in size. Such calculations are tractable on the small set of microstructures analyzed here, but it is still orders of magnitude more time-consuming than the other metrics analyzed. Figure 10 also shows the high computational cost of the two-point cluster function and the lineal path function compared to , although this cost could be decreased with further optimization of the algorithms. Overall, the two-point cluster function emerges as a strong candidate metric to combine with due to its ability to break the degeneracy of at a relatively low computational cost.
3.2. Limitations and Generalizability
Boundary Conditions: This study exclusively employed periodic boundary conditions, which assume the microstructure repeats infinitely in all directions. Real materials often exhibit edge effects and non-periodic arrangements. The use of periodic boundaries may affect the observed degeneracy, as structures that would be distinct under non-periodic conditions may become equivalent when periodicity is enforced.
System Size Constraints: The maximum system size examined ( pixels, i.e., 36 total pixels) is substantially smaller than typical microstructure images used in materials characterization, which may contain millions of pixels. The exhaustive enumeration approach employed here becomes computationally intractable for larger systems because the number of possible microstructures grows as . For a system, this would require evaluating microstructures, making complete enumeration impractical with current computational resources. Importantly, small system sizes preclude the observation of emergent phenomena such as percolation transitions, which typically occur at critical volume fractions (e.g., ∼0.59 for site percolation on a 2D square lattice) and require large system sizes to manifest clearly [1].
Isotropy and Symmetry: The degeneracy observed in small systems may not extrapolate directly to larger, more realistic microstructures. Larger systems can exhibit emergent features such as long-range correlations, percolation thresholds, and complex connectivity that cannot manifest in small windows. However, a different mechanism may also be at play: as system size increases, the information content of the correlation functions grows relative to the complexity of the microstructure. As a result, Gommes et al. [5] suggest that the relative impact of degeneracy may decrease for larger systems as the information content of the correlation functions increases relative to the microstructure complexity. From an information-theoretic perspective, they showed that accurate reconstruction requires the information content (in bits) to be comparable to the number of pixels—a condition more likely satisfied as system size increases.
Two-Phase Limitation: Only two-phase microstructures were examined. Multi-phase materials, which are common in engineering applications, may exhibit different degeneracy behavior due to the increased complexity of possible phase arrangements and the larger number of independent correlation functions required. For an M-phase system, the number of independent autocorrelations is (due to the normalization constraint that volume fractions sum to unity), substantially increasing the descriptor space dimensionality compared to the two-phase case where only a single autocorrelation is needed.
Metric Comparison: The comparison of degeneracy-breaking metrics was performed on a subset of the most degenerate cases rather than on all degenerate microstructures. While this approach targeted the most challenging scenarios, the relative performance of these metrics may differ for less severely degenerate cases. Furthermore, the computational complexity analysis (Figure 10) reflects unoptimized implementations; recent algorithmic advances, particularly using FFT-based methods, can substantially accelerate and two-point cluster function calculations for larger systems.
Property Prediction Implications: While this study focuses on microstructure characterization, the practical implications for property prediction deserve consideration. The Hashin-Shtrikman bounds on effective properties (conductivity, elasticity) depend only on volume fraction and phase properties—not on detailed microstructure geometry. Tighter bounds incorporating two-point information exist, but the property error introduced by degeneracy depends strongly on the contrast ratio between phases and the specific property of interest. For low-contrast composites, degenerate microstructures may exhibit similar properties; for high-contrast systems (e.g., conductor-insulator composites), even small structural differences can dramatically affect properties through connectivity changes.
Despite these limitations, the exhaustive enumeration approach provides ground-truth data that establishes a baseline for understanding degeneracy in and validates the effectiveness of various degeneracy-breaking metrics under controlled conditions. Future work extending these results to larger systems would necessarily employ sampling approaches (e.g., Monte Carlo estimation of degeneracy) rather than exhaustive enumeration.
4. Conclusion
In this work, the for all possible 4×4, 5×5, and 6×6 two phase microstructures were calculated. The fraction of nontrivially degenerate was reported for both directional and nondirectional . The fraction of degeneracy for nondirectional increases monotonically with increasing side length, whereas the fraction of degeneracy for directional generally increases, but not monotonically. The use of nondirectional was shown to nearly double the chances that a randomly selected microstructure will share the same as some other symmetry-inequivalent microstructure for the microstructures evaluated. Using directional in place of nondirectional was therefore concluded to be the best practice.
Several methods for breaking the degeneracy found in were examined, with completely breaking the degeneracy for the microstructures analyzed. While and other higher-order statistics break the degeneracy in , they quickly become computationally intractable as microstructure size increases. Other statistical metrics, such as the two-point cluster function, lineal path function, and grain size distributions, eliminated a significant amount of degeneracy with varying improvements in efficiency over . The best metric to combine with to reduce degeneracy without greatly increasing computational cost for larger microstructures was determined to be the two-point cluster function. One of the most common uses of these metrics in combination with is to arrive at more unique and higher fidelity reconstructions. Therefore, the two-point cluster function, combined with , was concluded to be the strongest candidate for producing accurate reconstructions of microstructures in reasonable time frames.
Finally, removing the degeneracy in does not necessarily result in an ability to accurately estimate some properties. This fact is validated by the study because is shown to completely break the degeneracy in the studied microstructures; however, it does not provide any connectivity information, which is essential to estimate some properties. Additional metrics that provide this connectivity information and break the degeneracy in must be included to accurately estimate properties.
From a practical perspective, the presence of degeneracy in has direct implications for microstructure-sensitive design and property prediction. When designing materials with targeted properties, practitioners should be aware that multiple distinct microstructures may produce identical while exhibiting different physical properties—particularly properties dependent on connectivity, such as electrical and thermal conductivity or permeability. The two-point cluster function emerges as a practical compromise: it provides connectivity information missing from , effectively breaks most degeneracies at reasonable computational cost, and has been shown to improve reconstruction fidelity in prior studies [9,11]. For applications requiring high-fidelity microstructure characterization, combining with the two-point cluster function is recommended as standard practice.
Author Contributions
Conceptualization, E.C., R.W., C.N., B.J., and D.F.; methodology, E.C. and R.W.; software, E.C. and R.W.; validation, E.C. and R.W.; formal analysis, E.C. and R.W.; investigation, E.C. and R.W.; resources, D.F.; data curation, E.C. and R.W.; writing—original draft preparation, C.N., B.J., R.W., and E.C.; writing—review and editing, C.N., B.J., R.W., E.C., S.B., and D.F.; visualization, E.C. and R.W.; supervision, D.F.; project administration, D.F.; funding acquisition, D.F. All authors have read and agreed to the published version of the manuscript.
Funding
DF was supported by National Science Foundation grant CMMI 2147126.
Data Availability Statement
All of the code used to calculate and evaluate as well the other statistical metrics can be found on GitHub here: https://github.com/EthanCluff/TwoPointStatisticsDegeneracy.
Acknowledgments
This work was supported in part through computational resources provided by Brigham Young University’s Office of Research Computing.
Conflicts of Interest
The authors declare no conflicts of interest.
Abbreviations
The following abbreviations are used in this manuscript:
| One-point statistics (volume fraction) | |
| Two-point statistics | |
| Three-point statistics | |
| n | Side length of a 2D square microstructure |
| t | Vector between two pixels in a microstructure |
References
- Torquato, S. Random Heterogeneous Materials; Springer New York, 2002; Vol. 16. [Google Scholar] [CrossRef]
- Vafaei, S.; Lu, T.; van Waerbeke, L.; Semboloni, E.; Heymans, C.; Pen, U.L. Breaking the degeneracy: Optimal use of three-point weak lensing statistics. Astroparticle Physics 2010, 32, 340–351. [Google Scholar] [CrossRef]
- Cooper, L.; Saltz, J.; MacHiraju, R.; Huang, K. Two-point correlation as a feature for histology images: Feature space structure and correlation updating. 2010 IEEE Computer Society Conference on Computer Vision and Pattern Recognition - Workshops CVPRW 2010 2010, 79–86. [CrossRef]
- Yeong, C.L.; Torquato, S. Reconstructing random media. Physical Review E 1998, 57, 495. [Google Scholar] [CrossRef]
- Gommes, C.J.; Jiao, Y.; Torquato, S. Microstructural degeneracy associated with a two-point correlation function and its information content. Physical Review E 2012, 85, 051140. [Google Scholar] [CrossRef] [PubMed]
- Niezgoda, S.R.; Turner, D.M.; Fullwood, D.T.; Kalidindi, S.R. Optimized structure based representative volume element sets reflecting the ensemble-averaged 2-point statistics. Acta Materialia 2010, 58, 4432–4445. [Google Scholar] [CrossRef]
- Frisch, H.; Stillinger, F. Contribution to the statistical geometric basis of radiation scattering. The Journal of Chemical Physics 1963, 38, 2200–2207. [Google Scholar] [CrossRef]
- Fullwood, D.T.; Niezgoda, S.R.; Kalidindi, S.R. Microstructure reconstructions from 2-point statistics using phase-recovery algorithms. Acta Materialia 2008, 56, 942–948. [Google Scholar] [CrossRef]
- Jiao, Y.; Stillinger, F.H.; Torquato, S. A superior descriptor of random textures and its predictive capacity. Proceedings of the National Academy of Sciences 2009, 106, 17634–17639. [Google Scholar] [CrossRef] [PubMed]
- Davis, M.A.; Walsh, S.D.; Saar, M.O. Statistically reconstructing continuous isotropic and anisotropic two-phase media while preserving macroscopic material properties. Physical Review E - Statistical, Nonlinear, and Soft Matter Physics 2011, 83. [Google Scholar] [CrossRef] [PubMed]
- Jiao, Y.; Chawla, N. Modeling and characterizing anisotropic inclusion orientation in heterogeneous material via directional cluster functions and stochastic microstructure reconstruction. Journal of Applied Physics 2014, 115, 93511. [Google Scholar] [CrossRef]
- Skolnick, M.; Torquato, S. Understanding degeneracy of two-point correlation functions via Debye random media. PHYSICAL REVIEW E 2021, 104, 45306. [Google Scholar] [CrossRef] [PubMed]
- Lu, B.; Torquato, S. Lineal-path function for random heterogeneous materials. Physical Review A 1992, 45, 922–929. [Google Scholar] [CrossRef] [PubMed]
- Torquato, S.; Beasley, J.D.; Chiew, Y.C. Two-point cluster function for continuum percolation. The Journal of Chemical Physics 1988, 88, 6540–6547. [Google Scholar] [CrossRef]
| 1 | Also known as the two-point probability function in Torquato’s notation [1]; we use consistently throughout. |
Figure 1.
Example of nontrivial degeneracy: two microstructures (left and right) that produce the same (center) despite being symmetry-inequivalent—i.e., they cannot be related by any combination of 180° rotations or translations under periodic boundary conditions. This type of degeneracy is problematic because these distinct microstructures may exhibit different physical properties.
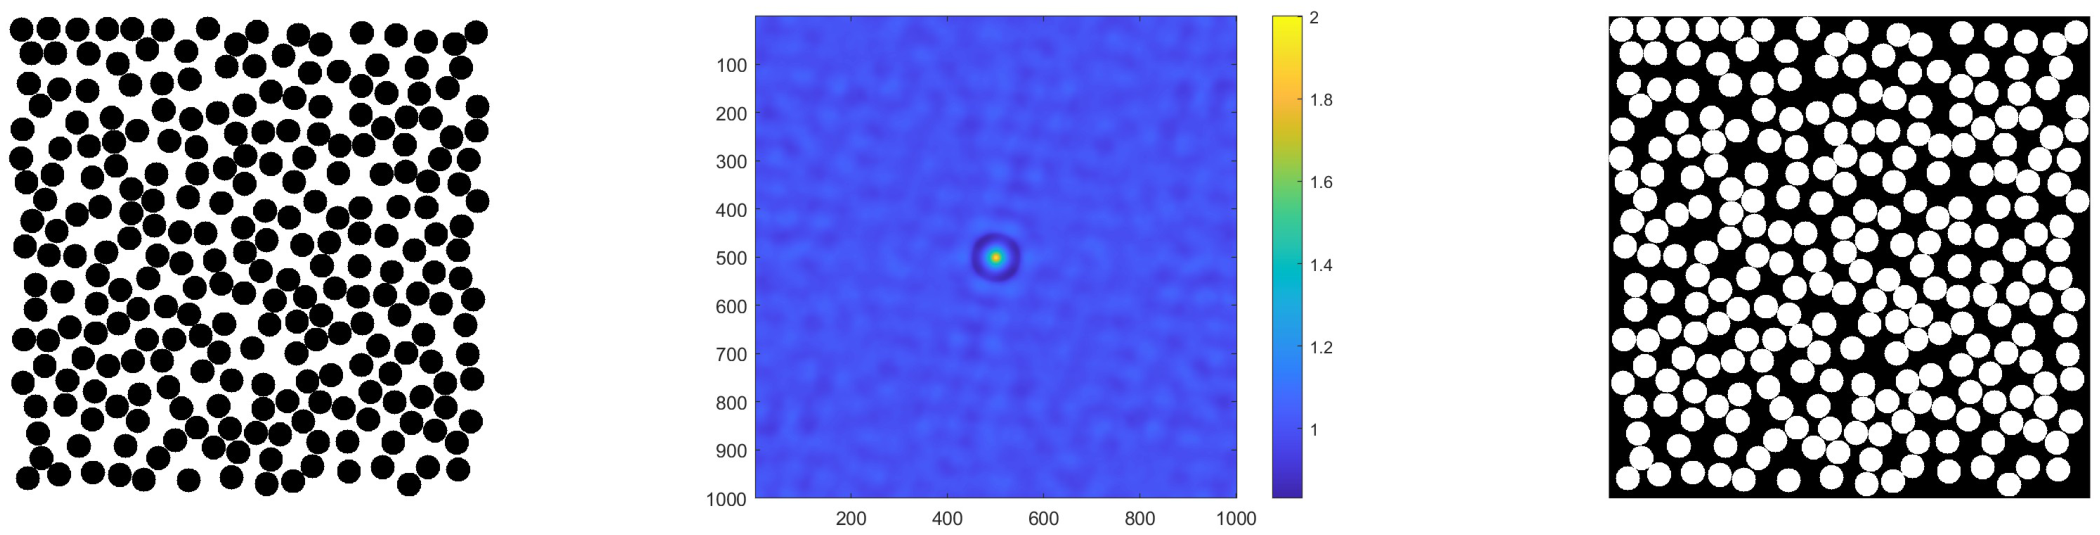
Figure 2.
An example of the directional and non-directional for a given microstructure. The microstructure is the same as Figure 1. While the are the same as in Figure 1, they are intentionally displayed as a 3D surface to show the matching profile between the directional and nondirectional .
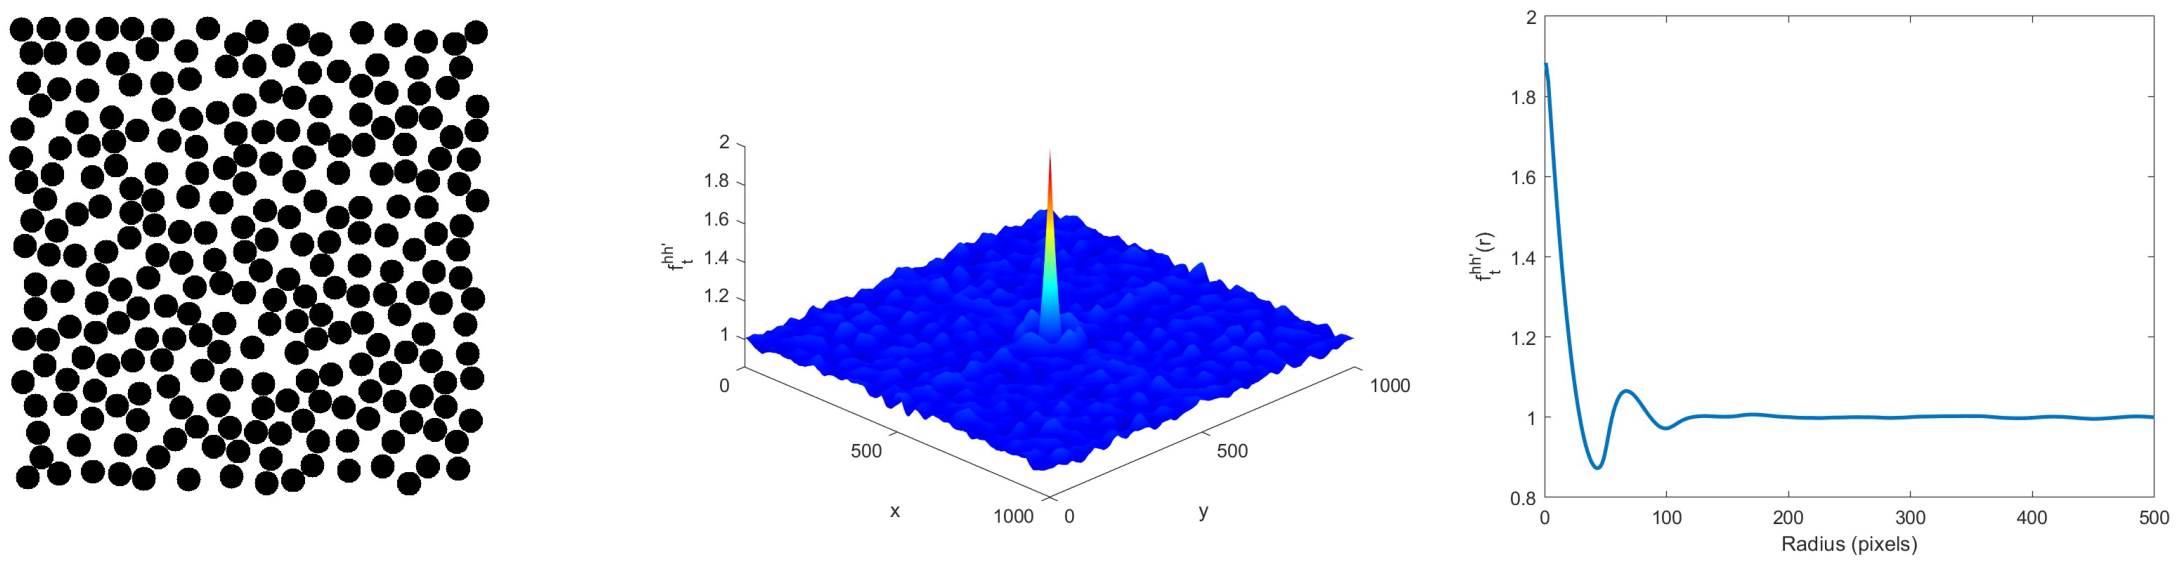
Figure 3.
Example of nontrivial degeneracy in 6×6 microstructures. All microstructures shown share the same directional (center) despite being symmetry-inequivalent—none can be obtained from another by 180° rotation or translation under periodic boundary conditions. This illustrates how multiple structurally distinct microstructures can map to identical two-point statistics.
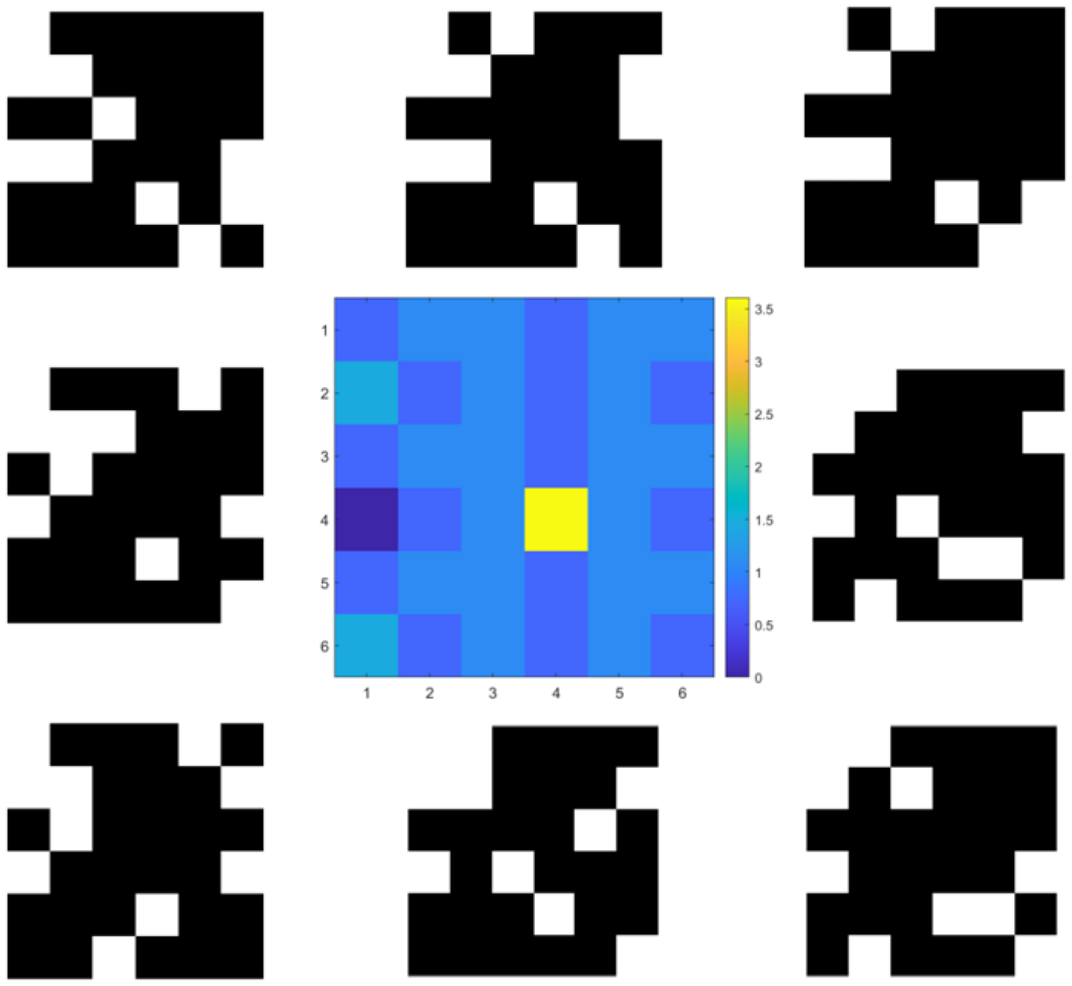
Figure 4.
Fraction of microstructures exhibiting nontrivial degeneracy (i.e., sharing with at least one symmetry-inequivalent microstructure) for different system sizes using directional . Trivially degenerate microstructures—those related by 180° rotation or translation—are excluded from these counts. The non-monotonic trend suggests that the relationship between system size and degeneracy prevalence is complex.
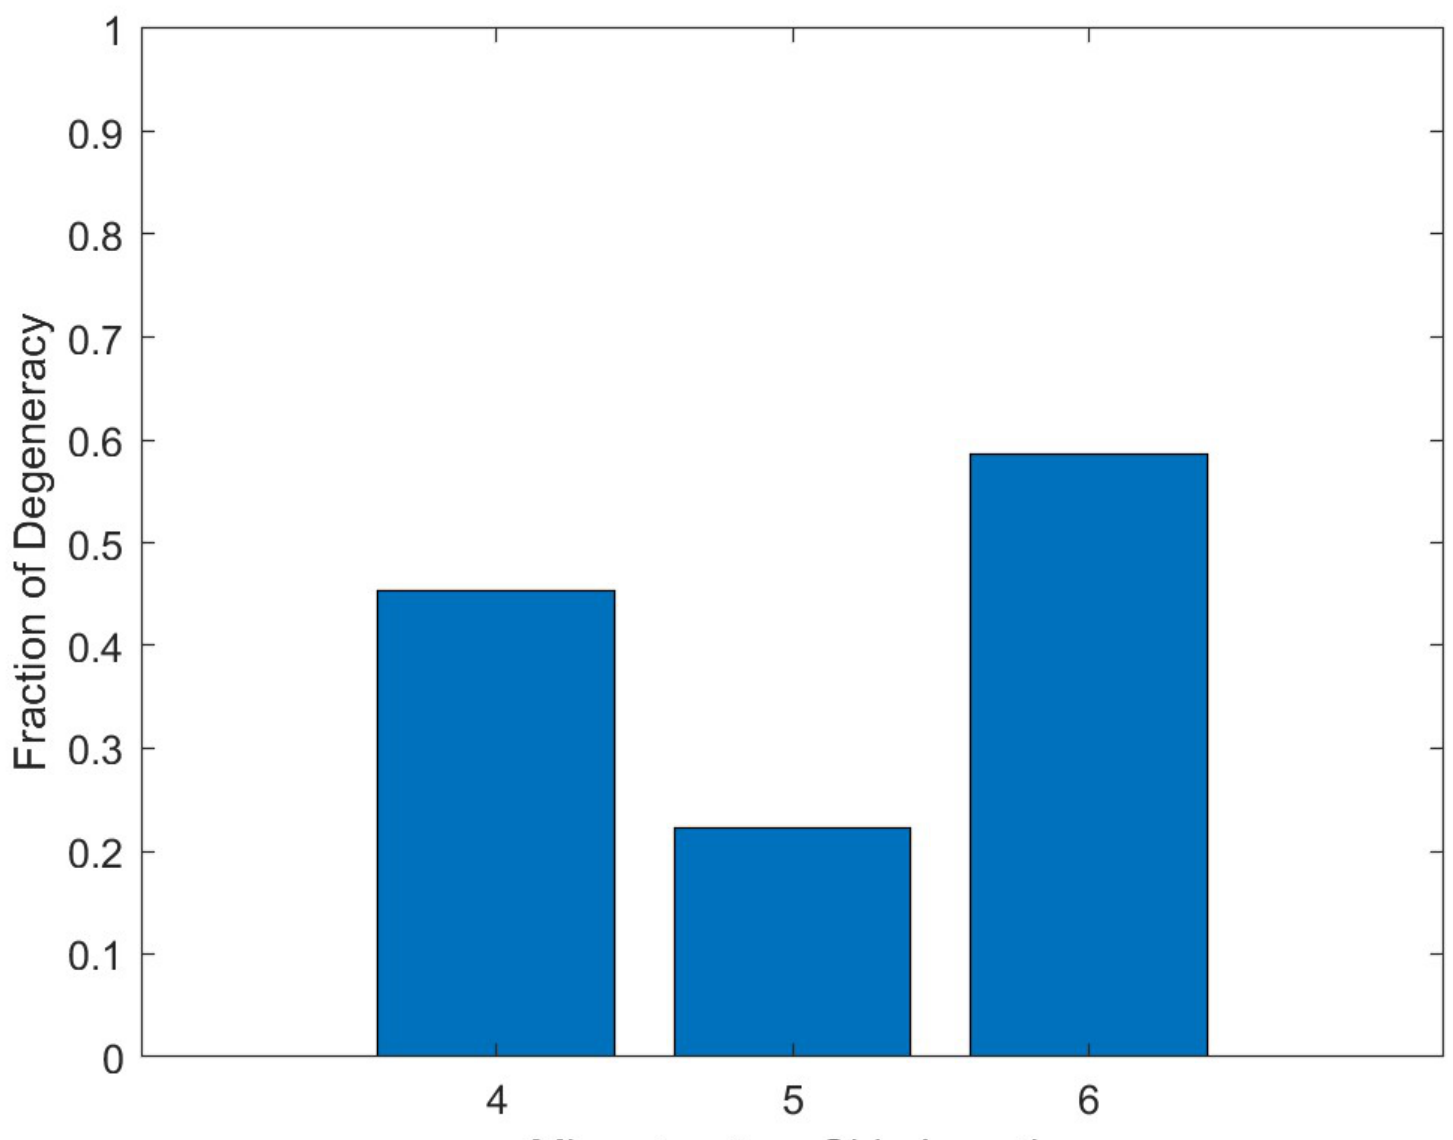
Figure 5.
Fraction of microstructures with nontrivially degenerate directional as a function of volume fraction. Nontrivial degeneracy refers to microstructures that share but cannot be related by 180° rotation or translation. Each bar represents a single system size and volume fraction combination. The bars are colored according to the total number of microstructures they represent (logarithmic scale). Note the peaks at specific volume fractions following the pattern .
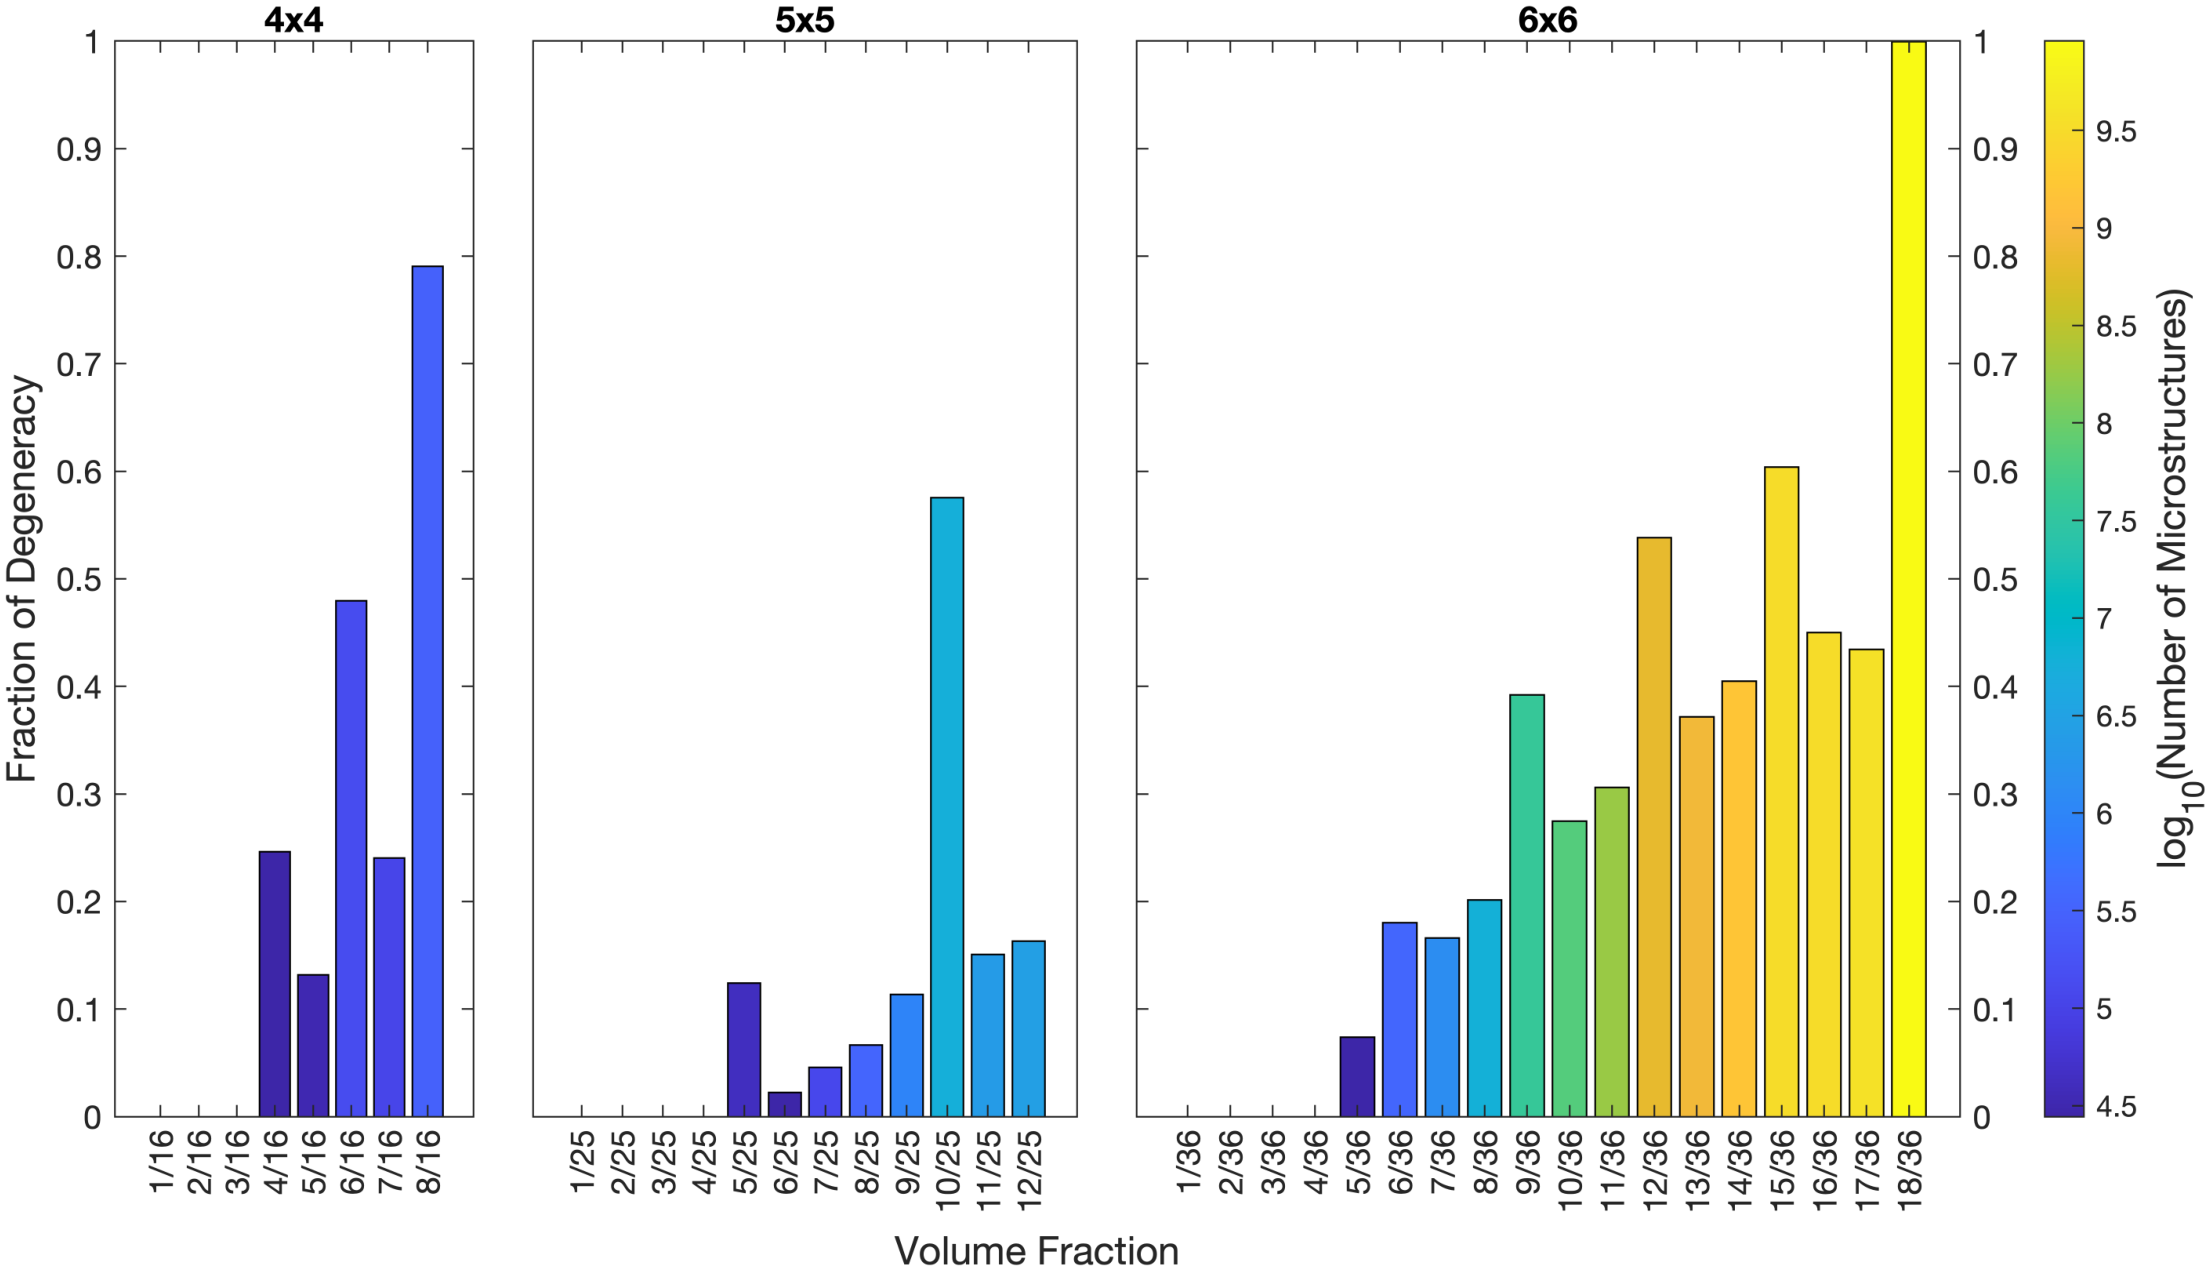
Figure 6.
Fraction of microstructures with nontrivially degenerate using nondirectional (orientation-averaged) . Compared to directional (Figure 2), the compression of directional information dramatically increases degeneracy, with nearly all becoming degenerate regardless of system size.
Figure 6.
Fraction of microstructures with nontrivially degenerate using nondirectional (orientation-averaged) . Compared to directional (Figure 2), the compression of directional information dramatically increases degeneracy, with nearly all becoming degenerate regardless of system size.
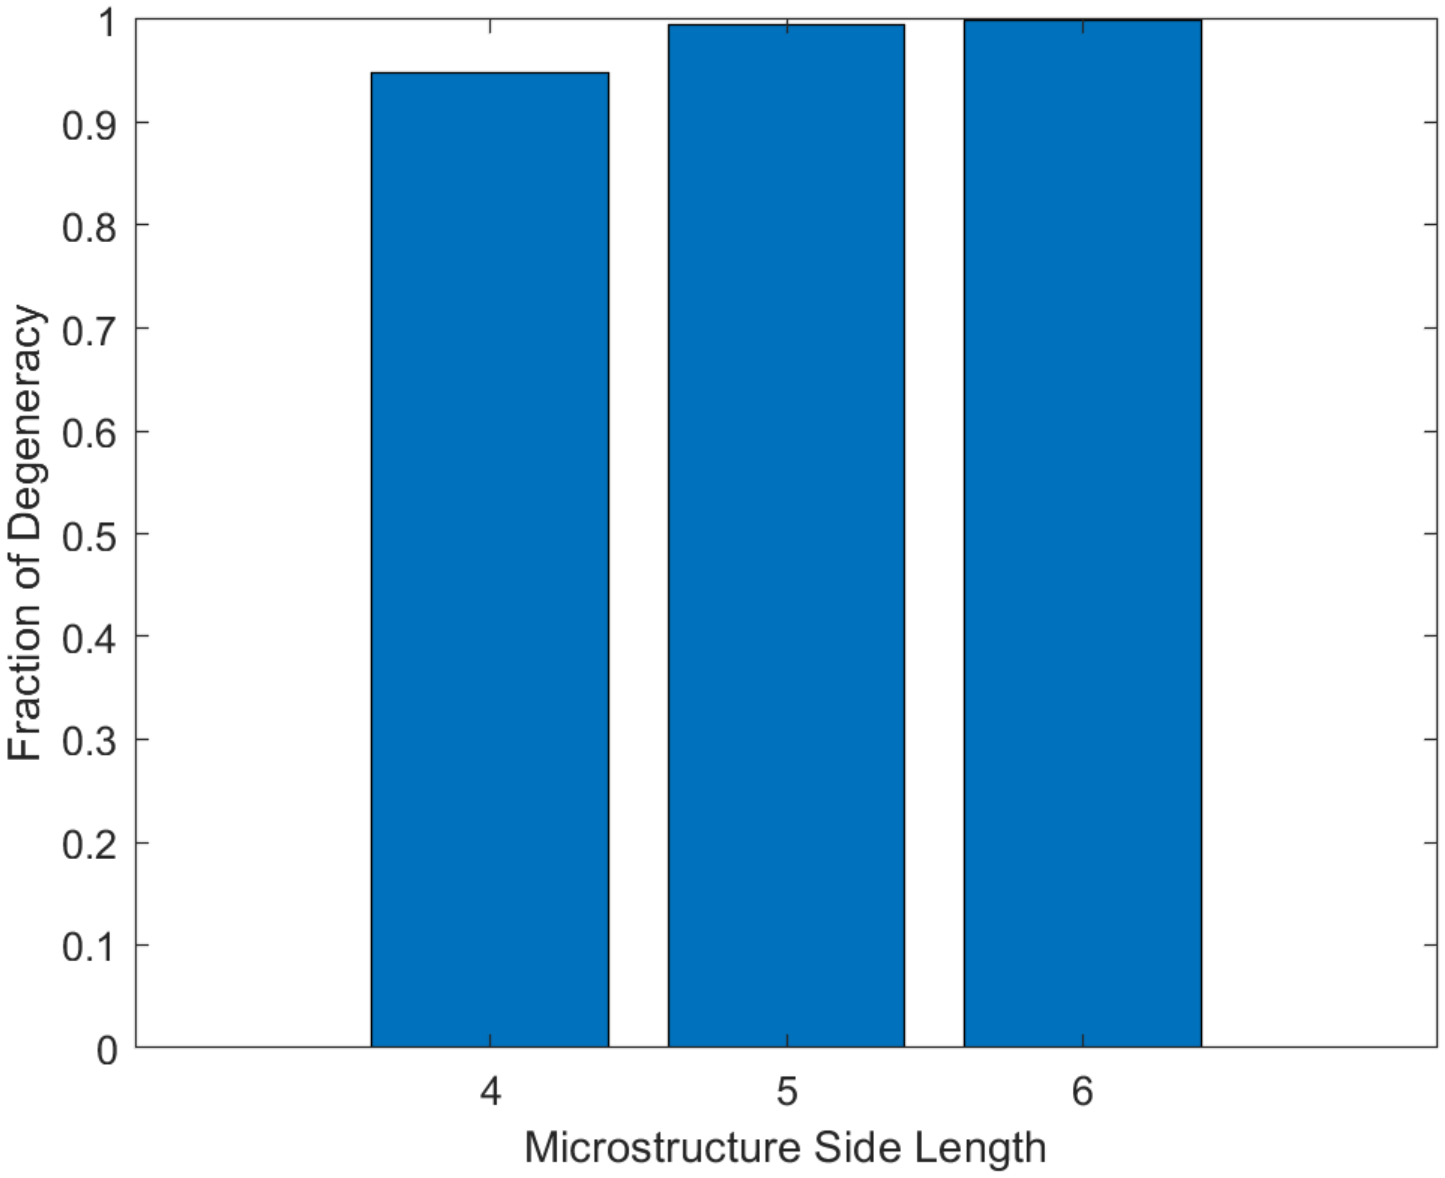
Figure 7.
Fraction of microstructures with nontrivially degenerate nondirectional as a function of volume fraction. The bars are colored according to the total number of microstructures they represent (logarithmic scale). Unlike the directional case (Figure 5), nearly all volume fractions exhibit very high degeneracy (>90%), demonstrating the significant information loss when using orientation-averaged statistics.
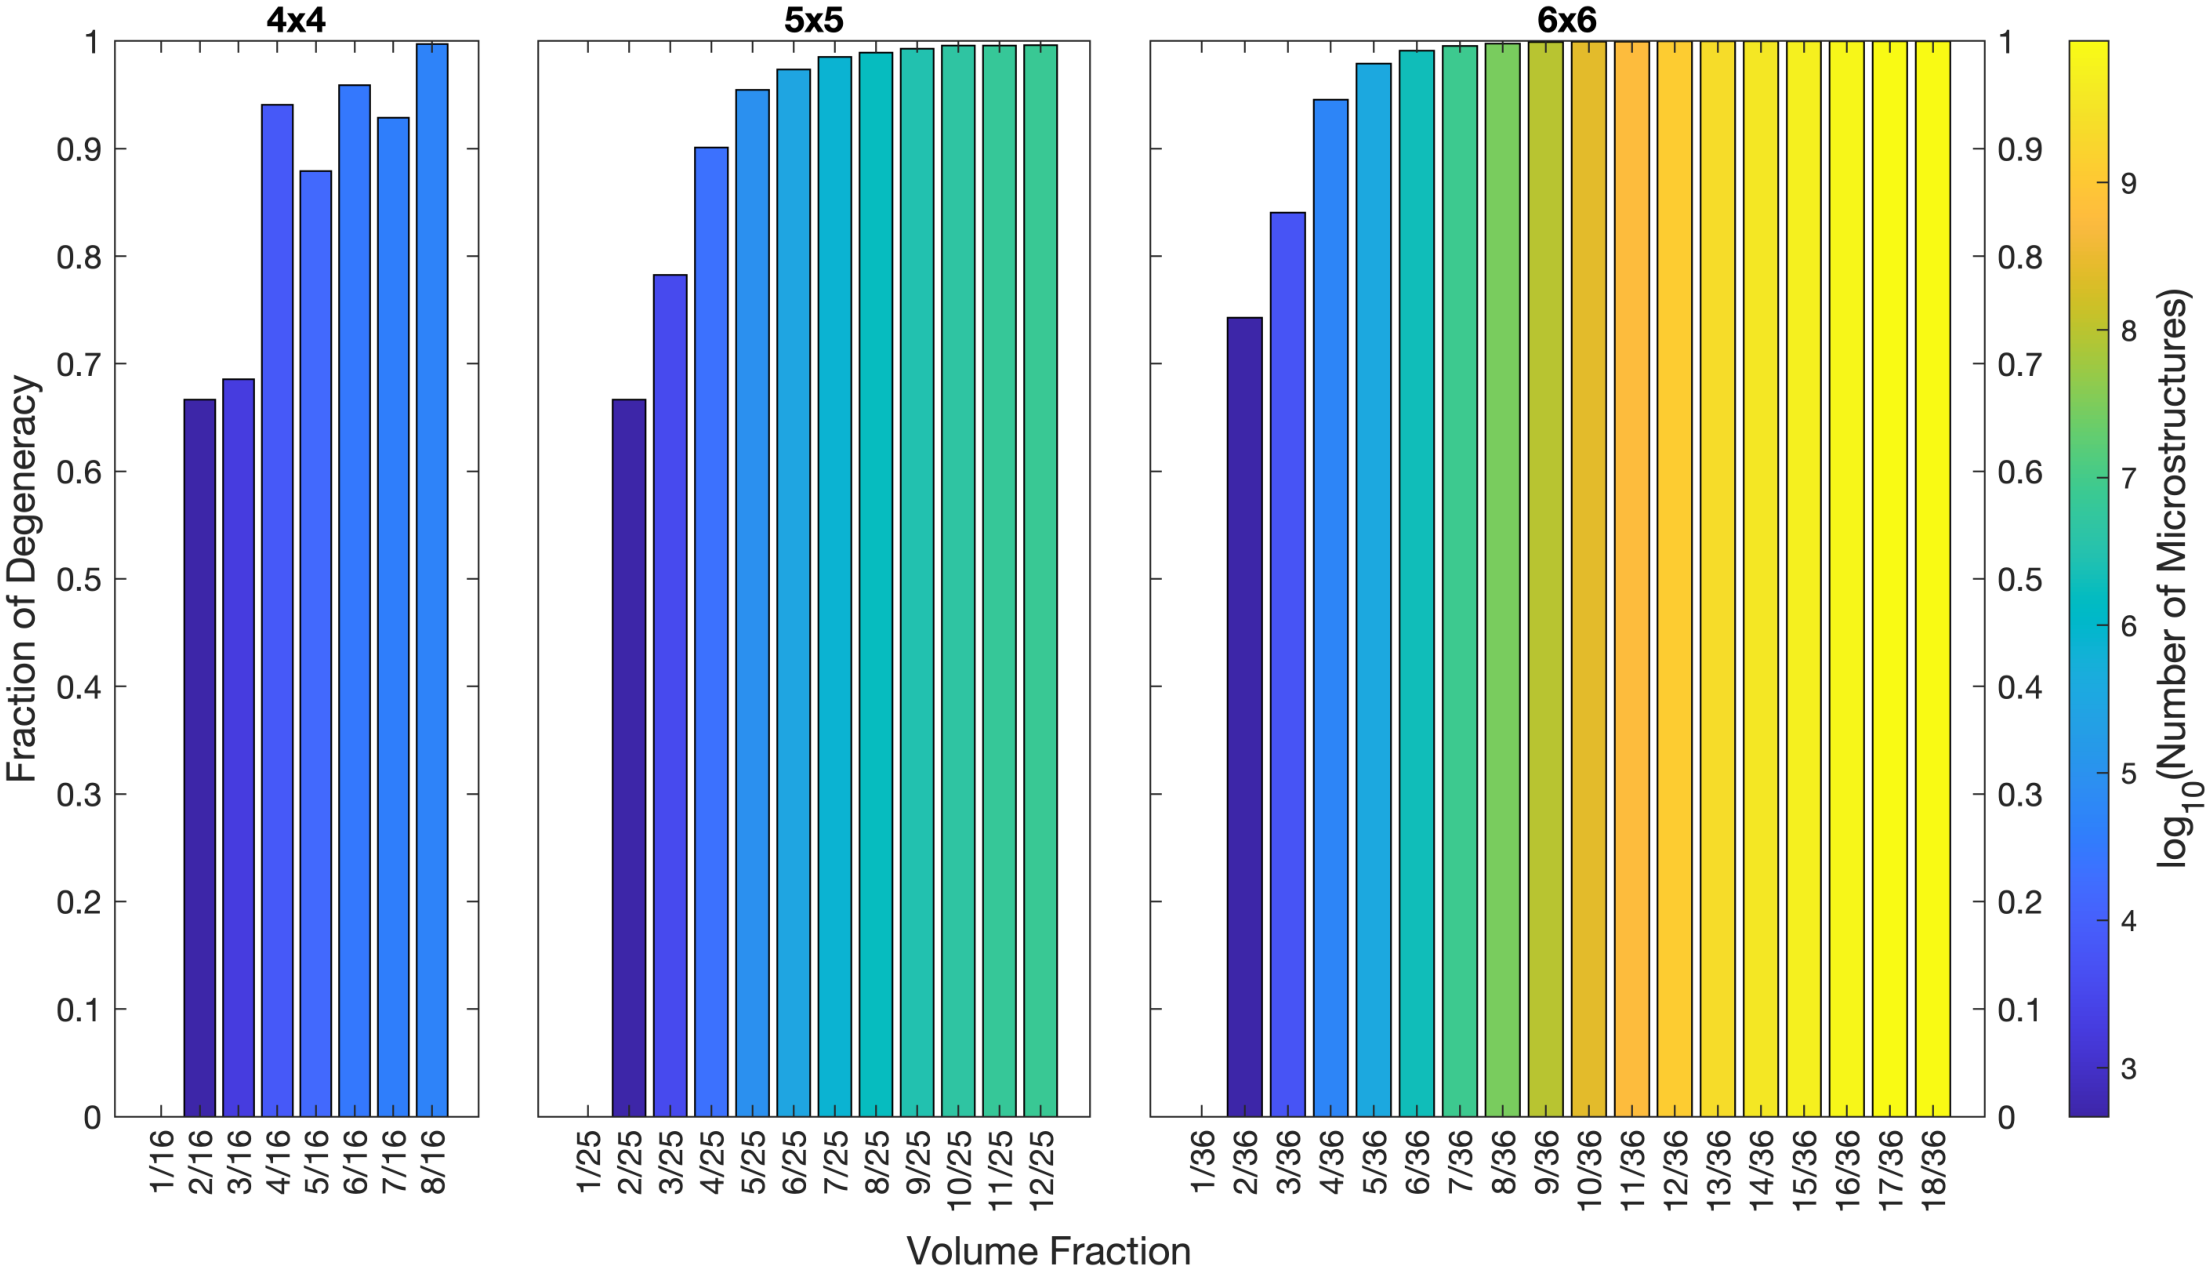
Figure 8.
An example of the probability distribution of different degenerate group sizes. These distributions were produced from all 6×6 microstructures with a volume fraction of . The x value of each bar represents the number of nontrivially different microstructures that are equivalent under the given statistical measure (directional or nondirectional ), and its height corresponds to the fraction of total microstructures that have that group size. Note the logarithmic scale on the y-axis. The bar highlighted in red represents the largest equivalent group size under directional , and this is the group of microstructures that was selected for further analysis using additional metrics.
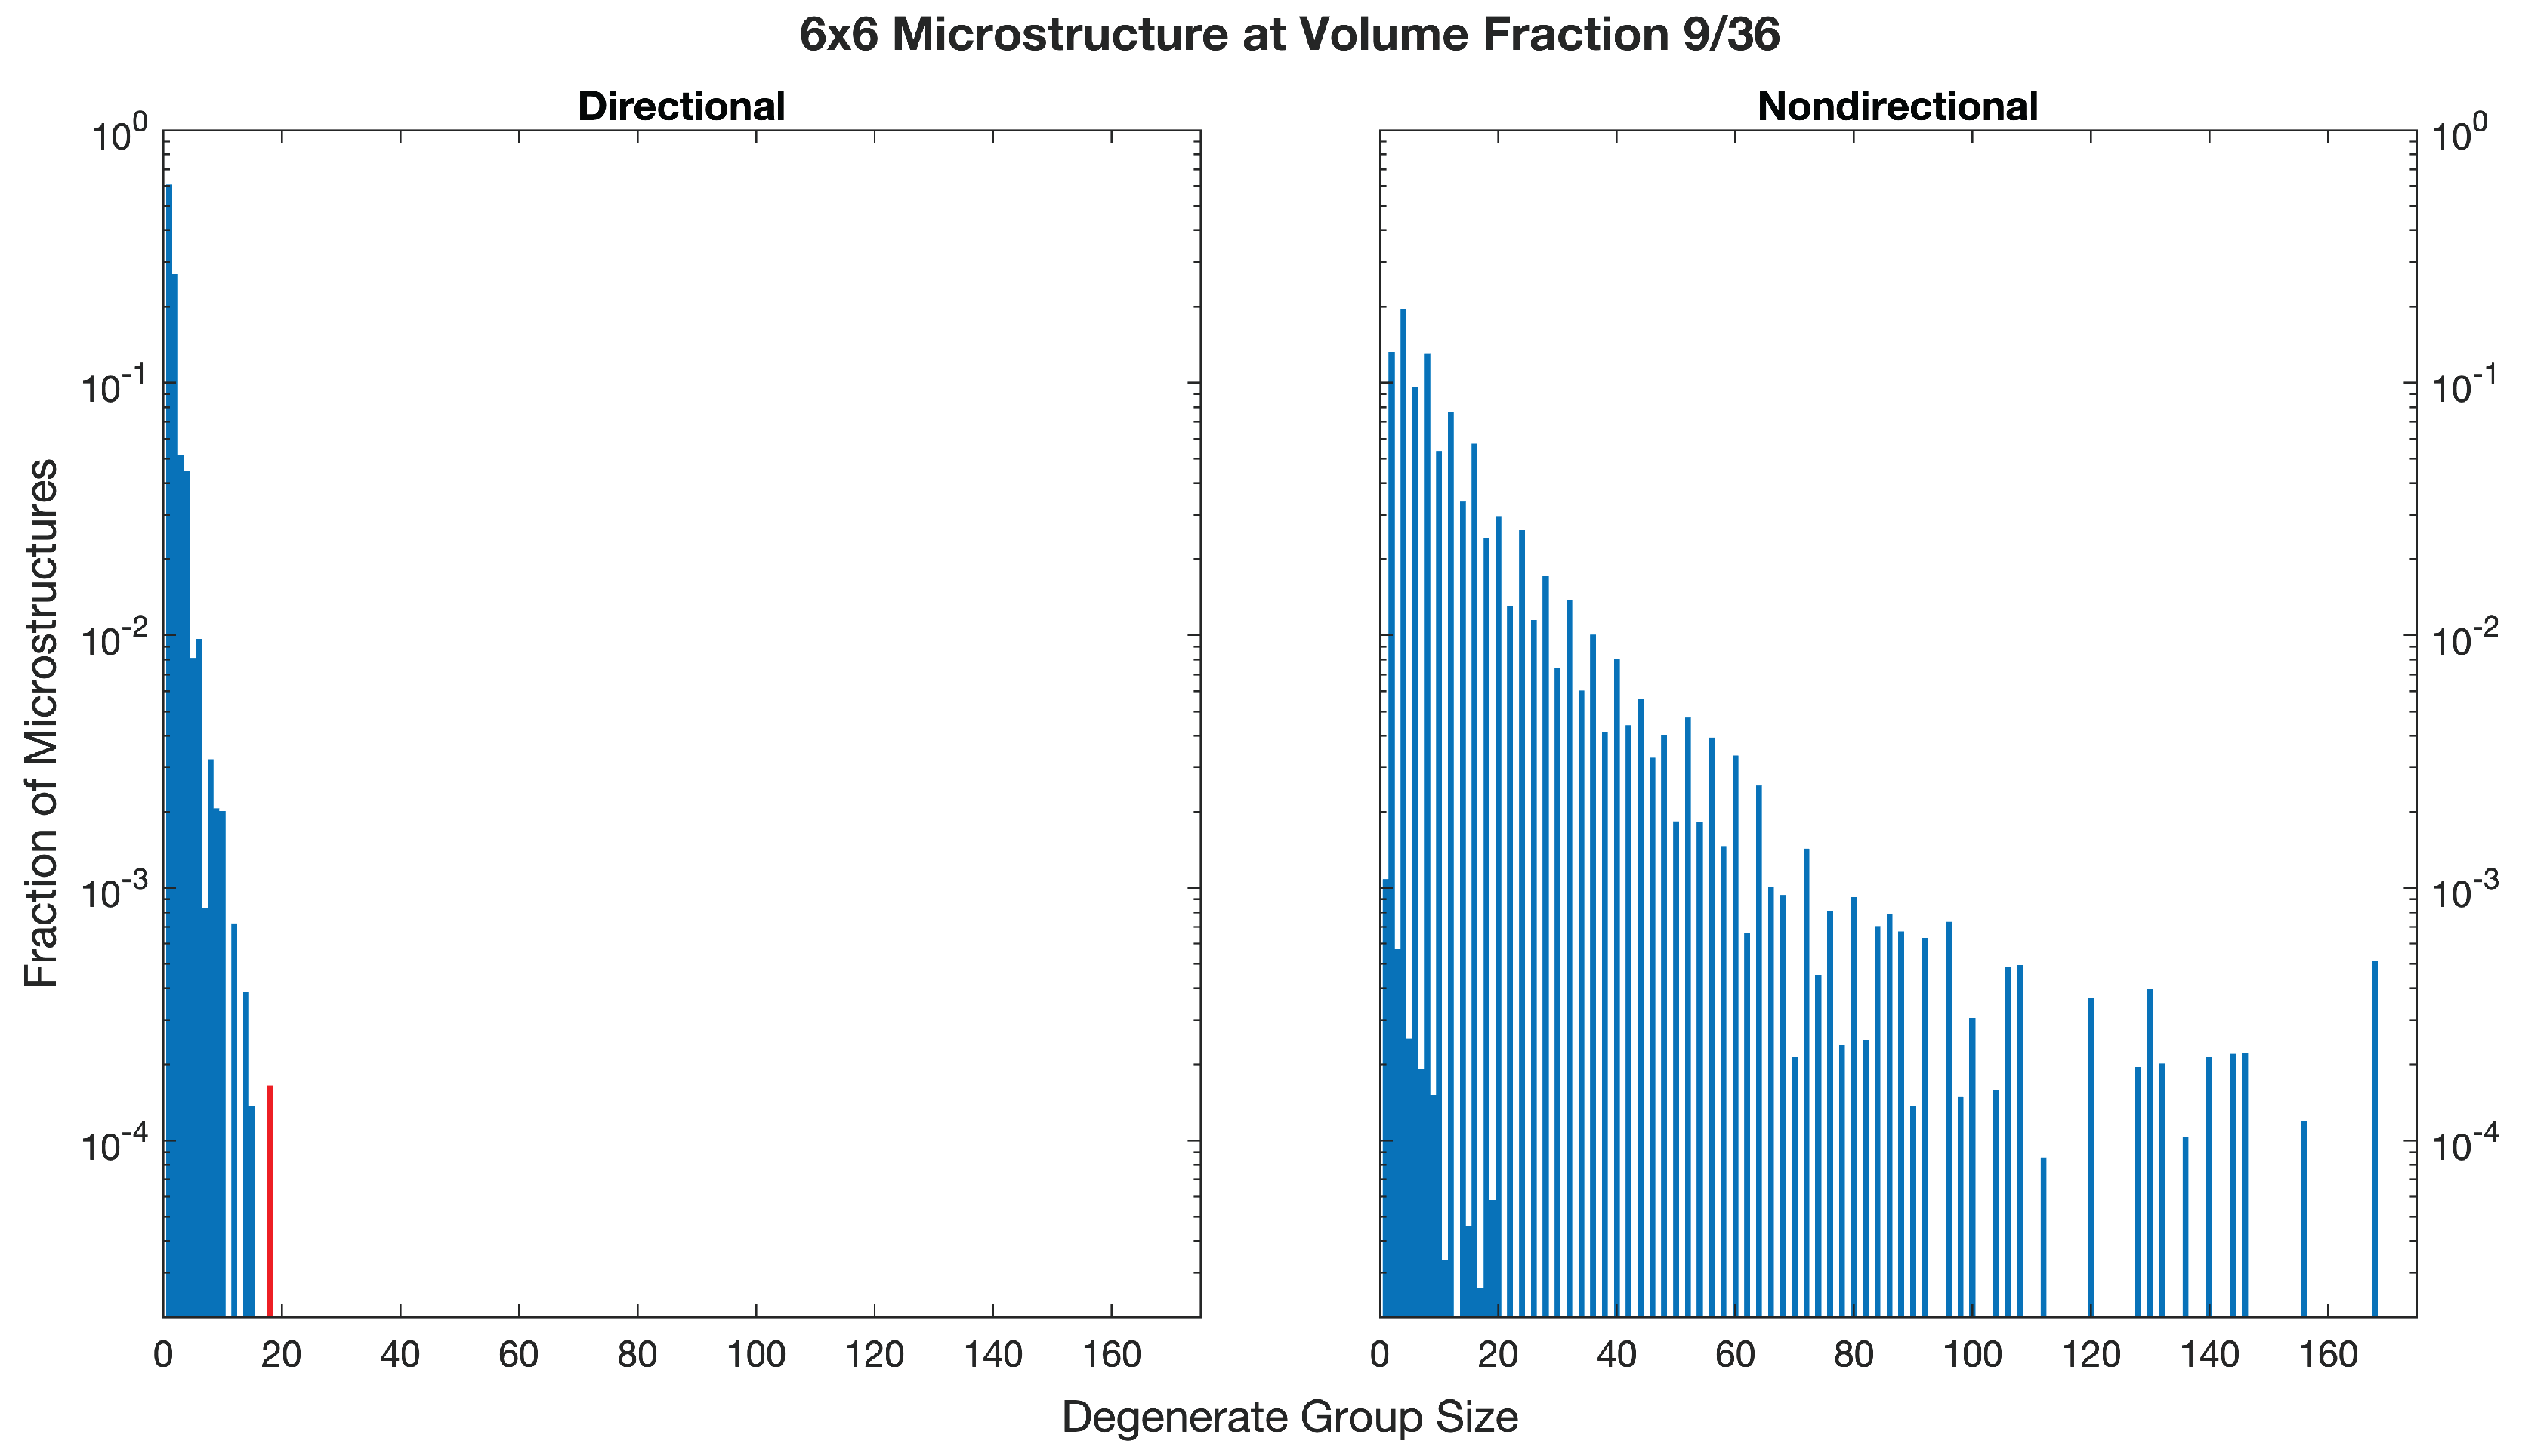
Figure 9.
Average number of microstructures in the selected degenerate group that are equivalent under each metric used. For visual clarity, this plot only shows results for the 6×6 microstructures with high volume fractions. All selected microstructures were equivalent under , so the height of the black bar for each volume fraction represents the original size of the group. was able to uniquely identify each microstructure in the group, so it has an average group size of 1.
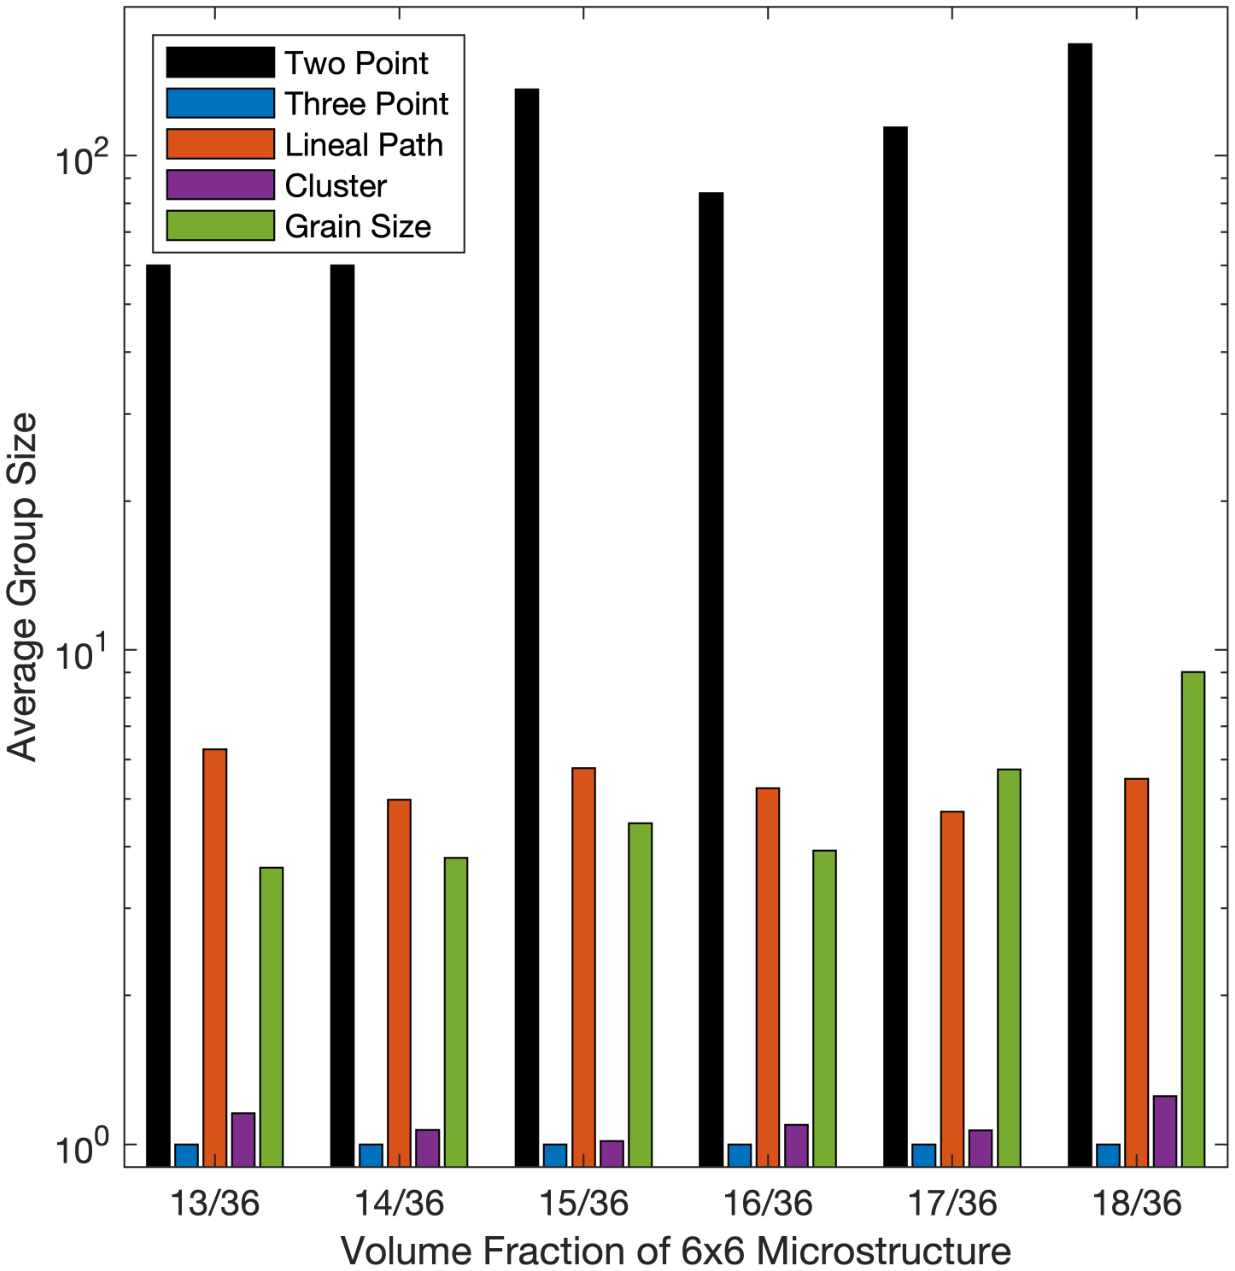
Figure 10.
The amount of time required to run 10,000 iterations of each algorithm on a random microstructure as a function of side length. Note the logarithmic scale on the y-axis
Figure 10.
The amount of time required to run 10,000 iterations of each algorithm on a random microstructure as a function of side length. Note the logarithmic scale on the y-axis
Disclaimer/Publisher’s Note: The statements, opinions and data contained in all publications are solely those of the individual author(s) and contributor(s) and not of MDPI and/or the editor(s). MDPI and/or the editor(s) disclaim responsibility for any injury to people or property resulting from any ideas, methods, instructions or products referred to in the content. |
© 2026 by the authors. Licensee MDPI, Basel, Switzerland. This article is an open access article distributed under the terms and conditions of the Creative Commons Attribution (CC BY) license (http://creativecommons.org/licenses/by/4.0/).
Copyright: This open access article is published under a Creative Commons CC BY 4.0 license, which permit the free download, distribution, and reuse, provided that the author and preprint are cited in any reuse.


