
Submitted:
14 January 2026
Posted:
15 January 2026
You are already at the latest version
Abstract
High-energy methods dominate the development of lipid nanoparticles but often require specialized equipment that increases production costs. Low-energy approaches, particularly those free of organic solvents, offer a promising alternative. This study aimed to obtain nanostructured lipid carriers (NLC) using a solvent-free, low-energy process combining microemulsification and phase inversion. Cetearyl alcohol and PEG-40 hydrogenated castor oil were selected as solid lipid and surfactant, respectively, the formulation and process were optimized through a Box–Behnken Design. Incorporation of ionic surfactant extended colloidal stability, while poloxamer in the aqueous phase enhanced steric stabilization. Resveratrol was efficiently encapsulated (E.E. = 98%), contributing to reduced particle size (291 nm), improved homogeneity (PDI = 0.25), and positive surface charge (+43 mV). Scale-up yielded stable particles carrying resveratrol with mean size of 507 nm, PDI = 0.24, and ZP = +52 mV. The optimized formulation remained stable for 90 days at 8 °C. In vitro release demonstrated a sustained and controlled release profile, with significantly lower resveratrol release compared to the free compound. Thermal analysis confirmed drug incorporation within the lipid matrix, while transmission electron microscopy (TEM) revealed spherical particles (~200 nm) and SAXS indicated a nanostructure of ~50 nm. Overall, this study demonstrates that solvent-free, low-energy processing can produce stable and scalable NLC formulations, successfully encapsulating resveratrol with favorable physicochemical properties and controlled release behavior. These findings highlight a simple, cost-effective strategy for developing lipid-based nanocarriers with potential applications in drug delivery.
Keywords:
nanostructured lipid carriers
; resveratrol
; low-energy method
; controlled release
; physicochemical stability
1. Introduction
Nanostructured Lipid Carriers (NLCs) represent the most recent generation of lipid-based nanoparticles, developed to overcome the limitations associated with the low long-term encapsulation efficiency typically observed in solid lipid nanoparticles (SLNs) [1]. These nanocarriers, composed of a mixture of biocompatible solid and liquid lipids, have been extensively investigated in the scientific literature for the delivery of highly lipophilic drugs. Their main advantages include enhanced bioavailability, controlled and sustained drug release, and, in some cases, targeted delivery to specific tissues and biological structures. Due to these attributes, NLCs have been widely explored for applications in pharmaceuticals, cosmetics, and functional foods [2]
The production of NLCs and other nanostructured systems is predominantly based on high-energy methods, such as high-pressure homogenization, ultrasonication, and microfluidization. These techniques enable the preparation of small, stable particles with high reproducibility. However, their main drawbacks include the requirement for specialized, high-cost equipment [3]. As an alternative, low-energy approaches have emerged as promising strategies, which may be conducted with or without the use of organic solvents. In particular, solvent-free low-energy methods stand out as simpler, more sustainable, and cost-effective approaches for the development of lipid-based nanoparticles [4].
Microemulsification is one such low-energy technique, in which nanoparticles are formed from a hot microemulsion that undergoes solidification during cooling [5]. Similarly, the phase inversion method relies on the spontaneous change in surfactant curvature induced by modifications in the system composition or temperature, leading to the formation of nanostructured systems [6]. Both approaches are considered experimentally straightforward, requiring only routine laboratory procedures—such as magnetic stirring, phase mixing, and cooling—without the need for sophisticated equipment, organic solvents, or additional purification steps. These features significantly reduce process complexity and production costs [7,8,9]
Resveratrol is a natural polyphenol widely studied for its antioxidant, anti-inflammatory, anticancer, and cardioprotective properties. However, its physicochemical characteristics—namely poor stability, low aqueous solubility leading to reduced bioavailability, and rapid metabolism—pose major challenges for the development of effective pharmaceutical formulations [10]. To address these limitations, several studies have investigated lipid-based nanocarriers for resveratrol delivery. Nevertheless, recent research focusing on resveratrol encapsulation in NLCs produced by low-energy methods remains scarce.
In this context, resveratrol was selected as a model bioactive compound to evaluate encapsulation efficiency in NLCs prepared through a combination of two low-energy methods—microemulsification and phase inversion. The central objectives of this study are to optimize both the formulation and production process, determine whether the presence of the bioactive compound interferes with nanostructure formation, assess formulation stability under different storage conditions, and characterize the release profile of the bioactive compound.
2. Materials and Methods
2.1. Materials
Oleth-20 (Graxion® O20), Ceteareth-20 (Graxion® CS20), Caprylic/Capric Triglyceride (Polymol 812), Cetearyl Alcohol (Alcohol C 1618-S), Glyceryl Stearate (Methilan® GMS), cetyltrimethylammonium chloride (Sunquart CT-50®), Sodium Lauryl Sulfate (Laurion 100) were purchased from Aqia (Guarulhos, Brazil). PEG-40 Hydrogenated Castor Oil (Kolliphor® RH 40), Polyvinylpyrrolidone K30 (Kollidon® 30) and poloxamer 188 (Kolliphor® P 188) were purchased from BASF (São Paulo, Brazil) and Resveratrol (REGU®-FADE) from DSM (Campinas, Brazil). Disodium Phosphate Dodecahydrate (Na₂HPO₄12H₂O), Sodium Phosphate (NaH2PO4) and Polysorbate 80 (Tween 80) were purchased from Labsynth (Diadema, Brazil) and Ethanol (≥99.5%) was purchased from Dinâmica Química (Indaiatuba, Brazil). Polietilenoglicol 400 (PEG-400) was purchased from Oxiteno (Mauá, Brazil), Purified water used in all experiments was obtained by reverse osmosis (OS10LXE, Gehaka).
2.2. Preparation of NLC Formulation
The formulation components were weighed separately and divided into two phases. The oil phase consisted of solid lipid, liquid lipid and a nonionic surfactant, whereas the aqueous phase was composed of polyvinylpyrrolidone (PVP) solution and polyethylene glycol 400 (PEG-400). Both phases were heated in a water bath to 65 °C. Under magnetic stirring on a heating plate, the oil phase received successive additions of the aqueous phase in aliquots of approximately 200–300 µL, until the formation of a microemulsion, characterized as a transparent and viscous gel. Subsequently, the remaining aqueous phase was slowly added to the oil phase, promoting system dilution and phase inversion, with the transition from a water-in-oil (W/O) to an oil-in-water (O/W) structure. The formulation was maintained under continuous stirring until the system cooled at room temperature.
2.3. Selection of Solid Lipid and Surfactant
At this stage, six distinct formulations were developed by varying the solid lipid (2%)—either glyceryl stearate (GMS) or cetearyl alcohol (ACE)—in combination with one of three surfactants (5%): Oleth-20 (AOE), Ceteareth-20 (ACEE), or PEG-40 hydrogenated castor oil (CORH40). The formulations also contained caprylic/capric triglyceride (TCC, 2%) as the liquid lipid, and an aqueous phase comprising a 50% polyvinylpyrrolidone (PVP) solution (2%), PEG-400 (2%), and purified water to volume.
Particle size distribution was determined by laser diffraction, and the results were used to select the most suitable excipients. The following criteria were adopted: percentage of particles ≤ 500 nm greater than 75% (%p≤500nm), mean particle diameter below 500 nm, SPAM index lower than 3, and a uniformity ratio (UR) below 10. Formulations meeting these specifications were reproduced to confirm consistency and subsequently subjected to a short-term stability assessment under ambient conditions for two days, during which the same analytical evaluation was performed.
2.4. Formulation Optimization
To optimize the composition, a Design of Experiments (DoE) was performed using the Box–Behnken Design (BBD) approach implemented in Minitab® software (version 18.1). The independent variables selected were surfactant concentration ([surfactant]), the proportion of PEG-40 hydrogenated castor oil (%CORH40) with the complementary fraction adjusted by Ceteareth-20 (ACEE), and the total oily phase concentration ([oily phase]). Each factor was investigated at two levels (−1 and +1) with an additional central point (0).
The dependent variables corresponded to particle size distribution (PSD) parameters determined by laser diffraction: percentage of particles ≤ 500 nm (%p≤500nm), mean particle diameter, SPAM index, and uniformity ratio (UR). Data were analyzed using response surface methodology (RSM) to assess the influence of the independent variables on particle size and distribution homogeneity.
Optimization criteria were established as follows: %p≤500nm = 99%, mean particle diameter = 190 nm, SPAM = 1,65, and UR = 3,9. The optimized formulation was subsequently monitored for stability by laser diffraction analysis at 0, 1, 2, 7, and 15 days to evaluate changes in particle size and uniformity over time.
2.5. Process Optimization
A second experimental design was implemented to optimize the processing conditions. The independent variables included temperature (°C), stirring speed (rpm), the initial volume of aqueous phase added (µL), and the mode of aqueous phase incorporation—either fractionated (two-step addition: water and PEG-400 first, followed by the PVP solution) or total (single-step addition: PEG-400 and PVP solution combined).
The response variables were identical to those used for formulation optimization, with the predefined targets to optimization (%p≤500nm = 95%, mean diameter = 200 nm, SPAM = 2, and UR = 3). Data were processed using RSM and optimization was performed according to these criteria.
To validate the optimized conditions, the final formulation was reproduced at a tenfold larger scale to assess reproducibility, particle size stability, distribution uniformity, and overall process robustness under scale-up conditions. The resulting formulations were monitored over 15 days to evaluate stability.
2.6. Stability Improvement
2.6.1. Incorporation of Surface Ionic Charge
To investigate the effect of surface charge on particle size and the extension of formulation stability, two ionic surfactants were incorporated into the aqueous phase of the optimized formulation: the anionic sodium lauryl sulfate (SLS) and the cationic cetyltrimethylammonium chloride (CTAC), at concentrations of 0.05%, 0.1%, and 0.2%.
The formulations were stored at ambient temperature under light-protected conditions and evaluated by dynamic light scattering (DLS) at 0, 7 and 14 days post-preparation. Measurements included particle size, polydispersity index (PDI), and zeta potential (ZP) to monitor stability over time.
2.6.2. Modification of the Dispersing Polymer
To enhance viscosity and thereby reduce nanoparticle mobility and aggregation, adjustments were made to the dispersing polymer type or concentration. This strategy was intended to prolong particle size stability and preserve the initially obtained PDI values.
Three formulations were prepared with modifications to the aqueous phase composition:
F1: 50% aqueous phase containing PVP 2%, q.s. water to 100%
F2: 50% aqueous phase containing PVP 10%, q.s. water to 100%
F3: 50% aqueous phase containing PVP 2%, q.s. Poloxamer 2.5% to 100%
The formulations were stored at ambient temperature under light-protected conditions and evaluated by DLS at 0, 7 and 14 days post-preparation to monitor stability.
2.7. Resveratrol Incorporation, Formulation Scale-Up and Stability
A 5% resveratrol (RVL) solution in ethanol (EtOH) was prepared, and an appropriate volume was incorporated into the oil phase to obtain a final concentration of 250 µg/mL. Four formulations were produced: blank formulation at 20 g scale (20B-NLC), resveratrol-loaded formulation at 20 g scale (20R-NLC), blank formulation at 200 g scale (200B-NLC), and resveratrol-loaded formulation at 200 g scale (200R-NLC). Data obtained by DLS at time zero were analyzed using a two-factor factorial ANOVA with interaction (2²), considering production scale and RVL incorporation as independent factors. The effects of these variables on particle diameter, PDI, and ZP were evaluated.
Following preparation, all formulations were stored at 8 °C, room temperature, and 40 °C for a 90-day stability study. Dynamic light scattering (DLS) was employed to monitor hydrodynamic diameter and polydispersity index (PDI). Chemical stability was assessed by UV–Vis spectrophotometry at 306 nm to quantify RVL content. Samples were diluted in EtOH (1:100), and concentrations were determined against a previously constructed calibration curve.
2.8. Encapsulation Efficiency
Encapsulation efficiency (EE%) represents the proportion of resveratrol (RVL) successfully incorporated into the lipid nanoparticles relative to the total amount initially added to the formulation. To determine EE%, 1 mL of each formulation was subjected to ultracentrifugation at 5000 rpm for 90 minutes using Amicon tubes with a 10 kDa molecular weight cutoff. The unencapsulated RVL in the filtrate was diluted in ethanol and quantified by UV–Vis spectrophotometry at 306 nm. EE% was calculated using the following formula: EE% = 100 − ([RVL]filtrate / Total recovered RVL × 250) × 100. Where: [RVL]filtrate = concentration of unencapsulated resveratrol (µg/mL), 250 = theoretical initial resveratrol concentration (µg/mL), total recovered RVL = ratio of the actual to theoretical initial RVL concentration.
2.9. In Vitro Release Assay
In vitro release studies were performed using Franz diffusion cells equipped with a cellulose dialysis membrane (10 kDa). In the donor compartment, 1 mL of each formulation was applied, and 0.5 mL aliquots were withdrawn at 0, 0.5, 1, 2, 4, 6, 8, 10, 22, and 24 hours. The receptor compartment contained approximately 5 mL of phosphate-buffered saline (PBS, pH 7.4) supplemented with 0.5% w/v Tween 80.
The receptor phase was maintained at 32 °C ± 1 °C throughout the experiment. The formulations R-NLC (250 µg/mL) and B-NLC, as well as a hydroalcoholic solution (1:1) containing RVL at the same concentration (250 µg/mL), were evaluated under identical conditions.
2.10. Characterization of the NLC Formulation
Particle size distribution (PSD) was determined by laser diffraction using a Cilas 1190 Particle Size Analyzer (WI, USA). This technique enables the evaluation of particles within a range of 0.04–2500 μm, applying Mie light scattering theory to calculate particle size parameters. The parameters assessed included the percentage of particles ≤ 500 nm (%p≤500nm), mean diameter (μm, volume-based), SPAM and uniformity ratio (UR), the latter two serving as indicators of system homogeneity [11].
Dynamic light scattering (DLS) was employed to determine hydrodynamic diameter, zeta potential (ZP), and polydispersity index (PDI) using a Zetasizer PRO (Malvern Panalytical, UK). For size and PDI determination, samples were diluted in water (1:10,000) and analyzed in a polystyrene cuvette (model DTS0012). For ZP measurements, samples were diluted in water (1:100) and analyzed using a folded capillary zeta cuvette (model DTS1070).
For thermal analysis, samples of the formulations with and without resveratrol (R-NLC and B-NLC, respectively), as well as their isolated raw materials, were frozen at −20 °C and subsequently lyophilized in a L108 Lyophilizer (Liotop) for 48 h (44 μHg, −57 °C). Differential scanning calorimetry and thermogravimetric analyses (DSC/TG) were performed on a Simultaneous Thermal Analyzer DSC/TGA Discovery SDT 650 instrument (TA Instruments, Delaware, USA) under a synthetic air atmosphere (50 mL·min⁻¹), with a heating rate of 10 °C·min⁻¹, across a temperature range of 10–650 °C. Analyses were conducted in 110 μL platinum crucibles with open lids, using sample masses between 7 and 15 mg. Data processing was performed with the Universal Analysis 200 (Trios) software (TA Instruments).
Fourier-transform infrared (FTIR) spectra of lyophilized samples (B-NLC, R-NLC, and isolated raw materials) were obtained using an Agilent Cary 630 FTIR spectrometer equipped with an attenuated total reflectance (ATR) accessory, within the range of 4000–400 cm⁻¹ [12].
Transmission electron microscopy (TEM) was performed with a JEM 2100 electron microscope (JEOL, Japan) operating at 200 kV at the Analytical Center of the Institute of Chemistry, University of São Paulo (USP). Copper grids (300 mesh, 77.5 × 41.0 × 9.0 mm; Pelco, Ted Pella, USA), coated with carbon film, were used. R-NLC samples were diluted in water (1:10.000 v/v), stained with 1% phosphotungstic acid (Sigma-Aldrich), and air-dried at room temperature [13,14].
Small-angle X-ray scattering (SAXS) experiments were carried out at the bioSAXS beamline B21 at the Diamond Light Source (UK). Solutions containing 1 wt% R-NLC were loaded into PCR tubes in an automated sample changer. Data were collected using a Dectris PILATUS 2M detector at a fixed camera length of 3.9 m and a wavelength of 1 Å. Results are presented as a function of q = 4π sin θ / λ, where 2θ represents the scattering angle.
2.11. Cell Maintenance and MTT Cell Viability Assay
HaCaT cells were cultured in 75 cm² flasks with DMEM (Gibco®) supplemented with 10% heat-inactivated fetal bovine sérum (Gibco®), 2 mM L-glutamine (Gibco®), and 1% penicillin/streptomycin, in a humidified incubator at 37 °C with 5% CO₂. After reaching 80% confluence, cells were trypsinized, centrifuged at 1500 rpm for 5 min, resuspended in fresh medium, and the cell concentration was adjusted using a Neubauer chamber. For the viability cell assay, HaCaT cells (2 × 10⁴) were seeded in 96-well plates and incubated for 24 h at 37 °C with 5% CO₂. Nanoparticles were diluted 1:400 (FM/FMR: 0.347 mg/mL ) and serially diluted twofold (C8–C1). After 48 h of exposure, cells were treated with MTT (0.5 mg/mL) for 2 h, and the resulting formazan crystals were solubilized with isopropanol. Absorbance was measured at 570 nm, and IC₅₀ values were determined using Phototox® software (v1.0, 2001).
2.12. Statistical Analysis
All experiments were conducted at least in triplicate. Statistical analyses were performed using Minitab software (version 18, Minitab Inc., USA). Mean values were compared by one-way ANOVA, and when significant differences were observed, Tukey’s post-hoc test was applied. Design of Experiments (DoE) creation, data analysis via RSM, and formulation optimization were carried out using the same software, along with the generation of Pareto charts and contour plots. A significance level of 5% was adopted for all analyses.
3. Results and Discussion
3.1. Selection of Solid Lipid and Surfactant
The microemulsification technique was selected for its simplicity, cost-effectiveness, and environmental sustainability, as it requires neither specialized equipment nor organic solvents [15]. Additionally, the phase inversion method, a low-energy strategy, enables the production of nanoemulsions, SLN, and NLC by exploiting the spontaneous curvature of surfactant molecules induced by formulation composition or temperature, thereby generating small and uniform particles [16,17,18].
Among the tested formulations, F3 and F5 met all criteria for particle size distribution (Table 1). ANOVA confirmed significant differences (p < 0.05), and the Tukey test identified six distinct groups for %p ≤ 500 nm, mean diameter and SPAM. UR showed no differences only for F2 and F6 (p = 0.596).
F3 and F5 remained stable for three days, while all other formulations, except F4, also showed stability but failed to meet size and uniformity thresholds (Figure S1). In reproducibility tests (Table S1), F3 exhibited minimal variation (<10% in most parameters, except UR), whereas F5 showed poor reproducibility, with variations >100% in nearly all parameters, except %p ≤ 500 nm (12.3%).
Thus, F3 was identified as the best formulation, composed of Cetearyl Alcohol (ACE) and PEG-40 Castor Oil (CORH40), and selected for further investigation. Cetearyl Alcohol has been previously incorporated into NLC formulations [19,20,21]. Similarly, PEG-40 Castor Oil has been used to develop the same type of nanoparticle for various applications [22,23], as well as nanoemulsions obtained through simple and low-energy methods [24,25].
3.2. Factorial Study for Formulation-Related Variables
Through the DoE, 15 formulations were developed with variations in composition to determine the optimal concentrations of surfactant and oily phase, which are critical for lipid nanoparticle formation [26,27]. The DoE results and the PSD of the prepared formulations are summarized in Table 2. The nanostructured formulations exhibited %p ≤ 500 nm ranging from 88.22 to 100%, mean diameters between 180 and 320 nm, SPAM values between 1.56 and 2.43, and UR values between 2.78 and 6.4. Overall, all formulations demonstrated small particle sizes and good uniformity. The only exception was formulation R7F1, which did not achieve the target values for %p ≤ 500 nm and UR; all others met the predefined criteria.
3.2.1. Effect of Independent Variables on Particle Size Distribuition
As previously described, the factorial design considered surfactant concentration, CORH40 ratio, and lipid phase concentration as independent variables, while PSD values obtained by laser diffraction analysis served as dependent variables. Based on this design, the RSM analysis yielded R² values of 83.56, 79.07, 83.35, and 59.96% for %p ≤ 500 nm, mean diameter, SPAM, and UR, respectively. The Pareto charts (Figure 1) indicate that the interaction between surfactant concentration and CORH40 ratio, as well as the CORH40 ratio alone, were the most influential factors for %p ≤ 500 nm and mean diameter. Surfactant and lipid phase concentrations alone were not significant for the first parameter. For SPAM, all variables and their interactions were significant, except for lipid phase concentration. Regarding UR, the quadratic interaction of CORH40 ratio and surfactant concentration alone was the most relevant factor influencing particle uniformity. The quadratic regression model equations, including linear, quadratic, and interaction terms, are presented in the supplementary material (Table S2).
RSM is a statistical data analysis method designed to identify optimal conditions and determine which variables are truly significant for the studied responses [28]. The Box–Behnken design has been widely applied in recent literature for the development of lipid nanoparticles across different purposes and applications [29,30,31,32].
The contour plots (Figure 2) enable the prediction of optimal conditions for achieving the smallest particle size with the highest uniformity. For higher %p ≤ 500 nm and consequently smaller mean diameters, the CORH40 ratio and lipid phase concentration should be set at either the highest or lowest levels, combined with low to intermediate surfactant concentrations. To minimize SPAM values, low surfactant concentrations are required, provided that CORH40 accounts for 100%. Regarding UR, a large uniform region is observed in graph D (Figure 2), indicating that when surfactant concentration is fixed at 5%, both lipid phase concentration and CORH40 ratio can vary from low to high levels while maintaining UR below 3.5. This observation highlights the robustness of the method against compositional variations. Additional variable combinations affecting the responses are presented in the supplementary material (Figure S2).
The use of CORH40 is common in NLC preparation and has proven to be a safe and effective surfactant in terms of toxicity. Moreover, its combination with PEG-400 has been shown to successfully produce nanoemulsions through spontaneous emulsification [33].
3.2.2. Formulation Optimization
The next objective was to optimize the NLC formulation to achieve the smallest particle size and highest uniformity using the low-energy method. According to the software prediction (Minitab), the optimized composition consisted of 5.8% surfactant, entirely composed of CORH40, and 5.9% lipid phase. The optimized formulation met the target PSD parameters, yielding a high desirability value of 0.9976. Predicted and observed results for %p ≤ 500 nm were 98% and 93%, respectively. For mean diameter, the predicted value was 0.19 μm and the observed value 0.22 μm. SPAM values were predicted at 1.69 and observed at 2.16, while UR values were predicted at 4.04 and observed at 4.16.
Stability analysis revealed that the optimized NLC formulation began to lose stability after the seventh day, marked by increases in particle size and, consequently, in SPAM and UR values (Figure 3, a, b). This indicated a transition from a homogeneous system to a heterogeneous one, with a mixed-size particle distribution. By the fifteenth day, only about 50% of the particles remained ≤ 500 nm, and the mean diameter had increased to approximately 3.5 μm. Nevertheless, no phase separation was observed at any time point (Figure 3, c).
3.3. Factorial Study of Process-Related Variables
Optimization of NLCs using BBD has been extensively explored in the literature, with most studies focusing on compositional variables. In contrast, few reports address the influence of process variables on NLC formation. Among those, processing time and equipment parameters such as homogenization or sonication are typically assessed [34,35]. In the present work, NLCs were obtained through low-energy methods; therefore, temperature, agitation, and mode of phase transfer were selected as the main process factors [36].
The factorial design yielded 26 formulations, of which 13 met the pre-established criteria for PSD. The %p≤500 nm ranged from 33.72% to 95.51%, mean diameters varied between 0.21 and 10.19 μm, SPAM values ranged from 2 to 78.29 and UR ranged from 3 to 254.83. Thus, some formulations were nanostructured, while others were classified as emulsions due to particle sizes exceeding 1 μm (Table 3).
3.3.1. Effect of Independent Variables on Particle Size and Uniformity
RSM analysis revealed that, nearly all independent variables and their interactions significantly influenced nanoparticle formation. Phases temperature alone and in combination with the aqueous phase addition method (fractional or total), emerged as a critical determinant across all four response parameters. Similarly, the interaction between stirring speed and the initial aqueous phase volume was relevant for particle size and uniformity (Figure 4). Quadratic regression model equations are provided in the Supplementary Material (Table S3).
Contour plots indicated that higher phase temperatures favored smaller particle sizes. Optimal stirring speeds ranged between 400–550 rpm; increasing agitation to 700 rpm resulted in larger particles. For the aqueous phase, both minimal (200 μl) and maximal (400 μl) initial additions promoted smaller particle sizes. When the aqueous phase was added in total, SPAM values frequently remained below 3, ensuring greater uniformity under diverse conditions and thereby enhancing process robustness. UR values below 5 were observed within narrow ranges when the initial aqueous phase was fixed at 300 μl, particularly at stirring speeds of 450–550 rpm (Figure 5). Additional variable-response interactions are available in the Supplementary Material (Figure S3).
3.3.2. Process Optimization
Based on these findings, process optimization was performed using defined PSD targets. Minitab software identified the optimal conditions (desirability index: 0.9757) as: temperature = 63 °C, stirring speed = 548 rpm, initial aqueous phase = 300 μl, and total aqueous phase addition. Under these conditions, the observed values were: %p ≤ 500 nm = 95, mean diameter = 0.21 μm, SPAM = 2.06, and UR = 3.5, closely matching the predicted values (%p ≤ 500 nm = 95, mean diameter = 0.20 μm, SPAM = 2.15, and UR = 3.23), confirming the success of the optimization.
The optimized formulation (OFM) was prepared in a standard batch (20 g) and assessed for PSD and phase separation. To evaluate scalability, a larger batch (200 g, SFM) was produced under the same conditions. PSD profiles demonstrated the stability of both formulations (Figure 6). No differences were observed visually in the PSD graphs, indicating that scaling up did not affect composition or process performance, which aligns with the factorial design approach used to establish optimal conditions. However, statistical analysis revealed significant differences between OFM and SFM at T0 across all parameters, though no significant differences were detected for mean diameter, SPAM, or UR at T15. Overall, both formulations retained nanometric size throughout the stability study, with mean diameters around 500 nm, SPAM near 5, and UR around 9. Phase separation was more pronounced in SFM compared to OFM, suggesting that this effect may be related to batch size rather than formulation or processing variables (Figure 6).
3.4. Stability Improvement
3.4.1. Surface Ionic Charge Addition
The formulations exhibited particle sizes ranging from 124 to 180 nm, with F1 showing the smallest size (Table 4). Statistically significant differences were observed among the formulations (p<0.05); F1 differed from all others, while some clustered together (F2–F4 and F7–F5). The addition of CTAC (0.1%)- F5, did not improve particle size compared with the absence of ionic surfactant (F7), as no significant difference was found. Similarly, no difference was observed between F2 and F4, indicating that LSS (0.1%) and CTAC (0.05%) provided comparable effects on particle size.
The polydispersity index (PDI), ranging from 0 to 1, reflects particle size uniformity: values near 0 indicate monodisperse systems, whereas values close to 1 denote broad distributions typical of polydisperse systems [37]. The formulations showed initial values between 0.34 and 0.58, with F1 exhibiting the lowest PDI and F4 the highest (Table 4). ANOVA revealed significant differences (p=0.001), and Tukey’s test grouped the formulations into three clusters. F7, F4, and F2, which presented the highest PDI values, did not differ from one another, indicating that LSS (0.1%) and CTAC (0.05%) had no positive impact on size uniformity, comparable to the absence of ionic surfactant (F7). Although F1 displayed the lowest mean size and PDI, it did not differ significantly from most formulations, except F4 and F7. Overall, initial results indicate that LSS at the lower concentration (0.05%) was the most effective condition for achieving smaller and more uniform particles.
Zeta potential (PZ) values confirmed the surface charge of nanoparticles. Formulations containing LSS exhibited negative charges below –40 mV, which became increasingly negative with higher concentrations. Conversely, with CTAC, values increased with concentration, all above +55 mV. F7, which contained only the nonionic surfactant, showed a negative PZ value close to zero (Table 4). ANOVA indicated significant differences among formulations (p<0.05). According to Tukey’s test, only F6–F5 and F5–F4 showed no significant differences; all others were statistically distinct and allocated into separate groups.
The formulation that initially showed the best performance (F1) did not remain stable over 14 days, with particle size increasing nearly threefold. Conversely, F4, which at baseline did not differ significantly from the control (F7), exhibited the lowest variation (53%) after 14 days (Figure 7, a). ANOVA confirmed significant differences among formulations (p<0.05), particularly between F5 and F7. Although the addition of 0.1% CTAC did not affect nanoparticle formation, it significantly improved stability: while the control (F7) increased from 140 nm to 643 nm (358% variation), F5 reached only 206 nm within the same period. In contrast, F4 showed the poorest stability, with particle size exceeding the nanometric range (~2 μm), being isolated from all others in Tukey’s test. F5, in turn, differed significantly from all formulations and maintained the smallest particle size after 14 days.
Zeta potential (PZ) values remained largely stable, except for F4 and F7 at day 14 (Figure 7B). ANOVA (p<0.05) and Tukey’s test revealed differences among all formulations, except between F6 and F5. Since zeta potential values above +30 mV or below –30 mV are required for electrostatic stabilization of NLCs, these findings underscore the role of electrostatic repulsion in preventing aggregation [38].
Regarding PDI, all formulations exhibited variations during the stability study (Figure 7, a). F1, which initially had the lowest PDI (0.342), reached ~0.6 by day 14. F2 showed the least variation, whereas F5, despite better size stability, increased from 0.4 to 0.6, indicating reduced uniformity. ANOVA (p=0.008) and Tukey’s test separated the formulations into two groups: higher PDI values (F4, F5, F1, F7) and the remaining formulations, with F4 consistently being the least satisfactory in terms of diameter and uniformity.
From a visual perspective, no formulation exhibited changes in appearance during 14 days at room temperature (Figure 7, c), including F7 (control without ionic surfactant), which contrasts with earlier experimental tests.
Based on particle size, PDI, zeta potential, and preliminary stability, formulation F5 was selected for the next stage, primarily due to its lower size variation over time, maintaining particles around 200 nm, stable zeta potential (~60 mV), and absence of phase separation. However, none of the formulations exhibited an adequate PDI after 14 days, and the 58% increase in particle size cannot be regarded as satisfactory stability, indicating that F5 still requires optimization regarding size uniformity.
Surface charge is also critical in the context of biological interactions and can be deliberately modulated to facilitate specific processes [39]. Cationic nanoparticles interact electrostatically with negatively charged cellular membranes and are widely employed for intracellular nucleic acid delivery, as they adsorb onto cell surfaces and are internalized via endocytosis [40,41]. They have also been investigated in acne therapies targeting follicular delivery and enhanced skin permeability [42], as well as in hair care formulations such as conditioners. The most commonly used cationic surfactants are quaternary ammonium salts [43], such as CTAC, which is also widely applied as an antiseptic [11].
3.4.2. Modification of the Dispersing Polymer
Steric stabilization involves coating particles with hydrophilic polymers to prevent close contact and aggregation, thereby enhancing stability [44]. This effect can also be achieved with nonionic surfactants, even in systems with low zeta potential and limited electrostatic stabilization [45]. PVP is a nonionic, hydrophilic, and nontoxic polymer widely applied in pharmaceutical formulations as a steric stabilizer and surface modifier, with long-established safety (GRAS), similar to poloxamer 188 [46,47]. Poloxamer 188 is an amphiphilic, biocompatible, nonionic copolymer with surfactant properties, commonly employed in cosmetic and pharmaceutical formulations [48]. Recent evidence demonstrated stabilization of NLS for up to 180 days using 2.5% poloxamer 188 [49], supporting its selection in this study.
The formulations produced displayed particle sizes of 126 nm (F1) and 158 nm (F2, F3). PDI values were 0.289 (F1), 0.456 (F2), and 0.371 (F3), while zeta potential values were 54.4 mV (F1), 53.5 mV (F2), and 55.7 mV (F3). Statistical analysis showed significant differences only for particle size (p=0.011), with F1 differing from F2 and F3, whereas no significant differences were observed for PDI (p=0.068) or PZ (p=0.539). Thus, only particle size was influenced by the dispersion polymer, with PVP 2% (F1) yielding smaller particles.
Over time (Figure 8, a), particle size increased by day 7, particularly in F2. With PVP 2% (F1), particle size continued to rise, while PVP 10% (F2) and poloxamer 2.5% (F3) appeared to suppress this growth. By day 14, significant differences were observed (p=0.03), specifically between F1 and F3, the latter showing the smallest mean diameter. For PDI (Figure 8, b), F1 exhibited the greatest increase, whereas F3 maintained the lowest values; at day 14, differences were significant (p=0.013), with F1 differing from F2 and F3. Although PZ was not significantly different at day 0, differences emerged at day 14 (p=0.0017), with F3 displaying the highest mean values (figure 8, c). No phase separation occurred in any formulation, indicating that changes in dispersion polymer did not compromise physical stability (Figure 8, d).
Dispersion polymer modification significantly influenced stability outcomes, with F3 consistently outperforming other formulations, showing smaller size, lower PDI, and higher PZ. These findings demonstrate the feasibility of incorporating 2.5% poloxamer 188 in formulations.
3.5. Resveratrol Incorporation, Formulation Scale-Up and Stability
Particle sizes ranged from 291 to 601 nm, with PDI values between 0.24 and 0.53. As anticipated, the zeta potential (ZP) was positive owing to the presence of CTAC, ranging from +43 to +57 mV. The theoretical RVL concentration was 250 μg/mL; however, measured values exceeded this estimate, with 20R-NLC 8.6% higher and 200R-NLC 2.6% higher than expected (Table 5).
Two-way ANOVA (Table S4) revealed that scale, RVL incorporation, and their interaction significantly influenced particle size (p < 0.05). Tukey’s test showed that increasing the production scale led to larger particle sizes regardless of RVL addition. Conversely, the presence of RVL reduced mean diameter in both standard and scaled-up formulations. When considering the interaction, the effect of RVL was particularly pronounced at larger scale, as the mean size of the scaled-up RVL-containing formulation differed significantly from its counterpart without RVL and from both small-scale formulations
For PDI, all factors and their interaction were significant (p < 0.05). Larger scale production resulted in more heterogeneous dispersions, whereas RVL incorporation reduced PDI, promoting greater homogeneity. The highest PDI values were observed in the scaled-up formulation without RVL. In contrast, the addition of RVL lowered PDI at both scales suggesting that RVL mitigates the negative impact of scaling on size uniformity (Table S4).
Regarding zeta potential, only scale had a significant effect (p = 0.0476), with scaled-up formulations exhibiting higher mean ZP values than standard-scale formulations. Thus, larger-scale production may enhance ZP, potentially extending colloidal stability. Neither RVL addition (p = 0.3946) nor factor interaction (p = 0.2571) significantly affected this parameter (Table S4).
With respect to stability, both standard- and large-scale formulations, with or without RVL, showed the most stable particle diameters at 8 °C, whereas 40 °C was most detrimental, leading to particle growth above 2000 nm and loss of nanoscale characteristics. Notably, 200B-NLC exceeded 1000 nm even at 8 °C after 90 days (Figure 9, a). Overall, refrigeration proved essential for preserving particle size across all conditions.
PDI analysis indicated that small-scale formulations (20B-NLC and 20R-NLC) exhibited lower variations, and all formulations stored at 8 °C maintained smaller PDI values. In contrast, 200B-NLC reached PDI values close to 1 under all conditions by the end of the study, characterizing it as a highly heterogeneous and unstable system. The most homogeneous system was 20B-NLC, which maintained values near 0.3 throughout the storage period, but only under refrigeration. Both room temperature and 40 °C conditions negatively affected PDI, leading to higher values and reduced system uniformity (Figure 9, b).
RVL content fluctuated throughout the storage period; however, concentrations generally remained above the theoretical 250 μg/mL, particularly in formulations kept at 8 °C. At room temperature, reductions in RVL levels were observed across all formulations, though less pronounced than at 40 °C, where the most substantial losses occurred (Figure 9, c). These findings highlight the protective effect of refrigerated storage in maintaining NLC size, uniformity and RVL content compared with higher temperature conditions.
3.6. Encapsulation Efficiency
Encapsulation efficiency (E.E.) was determined using tubes with a 10 kDa semipermeable membrane, which retained the nanoparticles while allowing free resveratrol to diffuse through. The filtrate exhibited an absorbance of 0.0923 ± 0.007, corresponding to a free resveratrol concentration of 4.55 µg/mL (1.15%). Based on these results, the E.E. was calculated as 98.41%, confirming the high capacity of the formulation to incorporate resveratrol into the nanoparticles.
3.7. In Vitro Release Assay
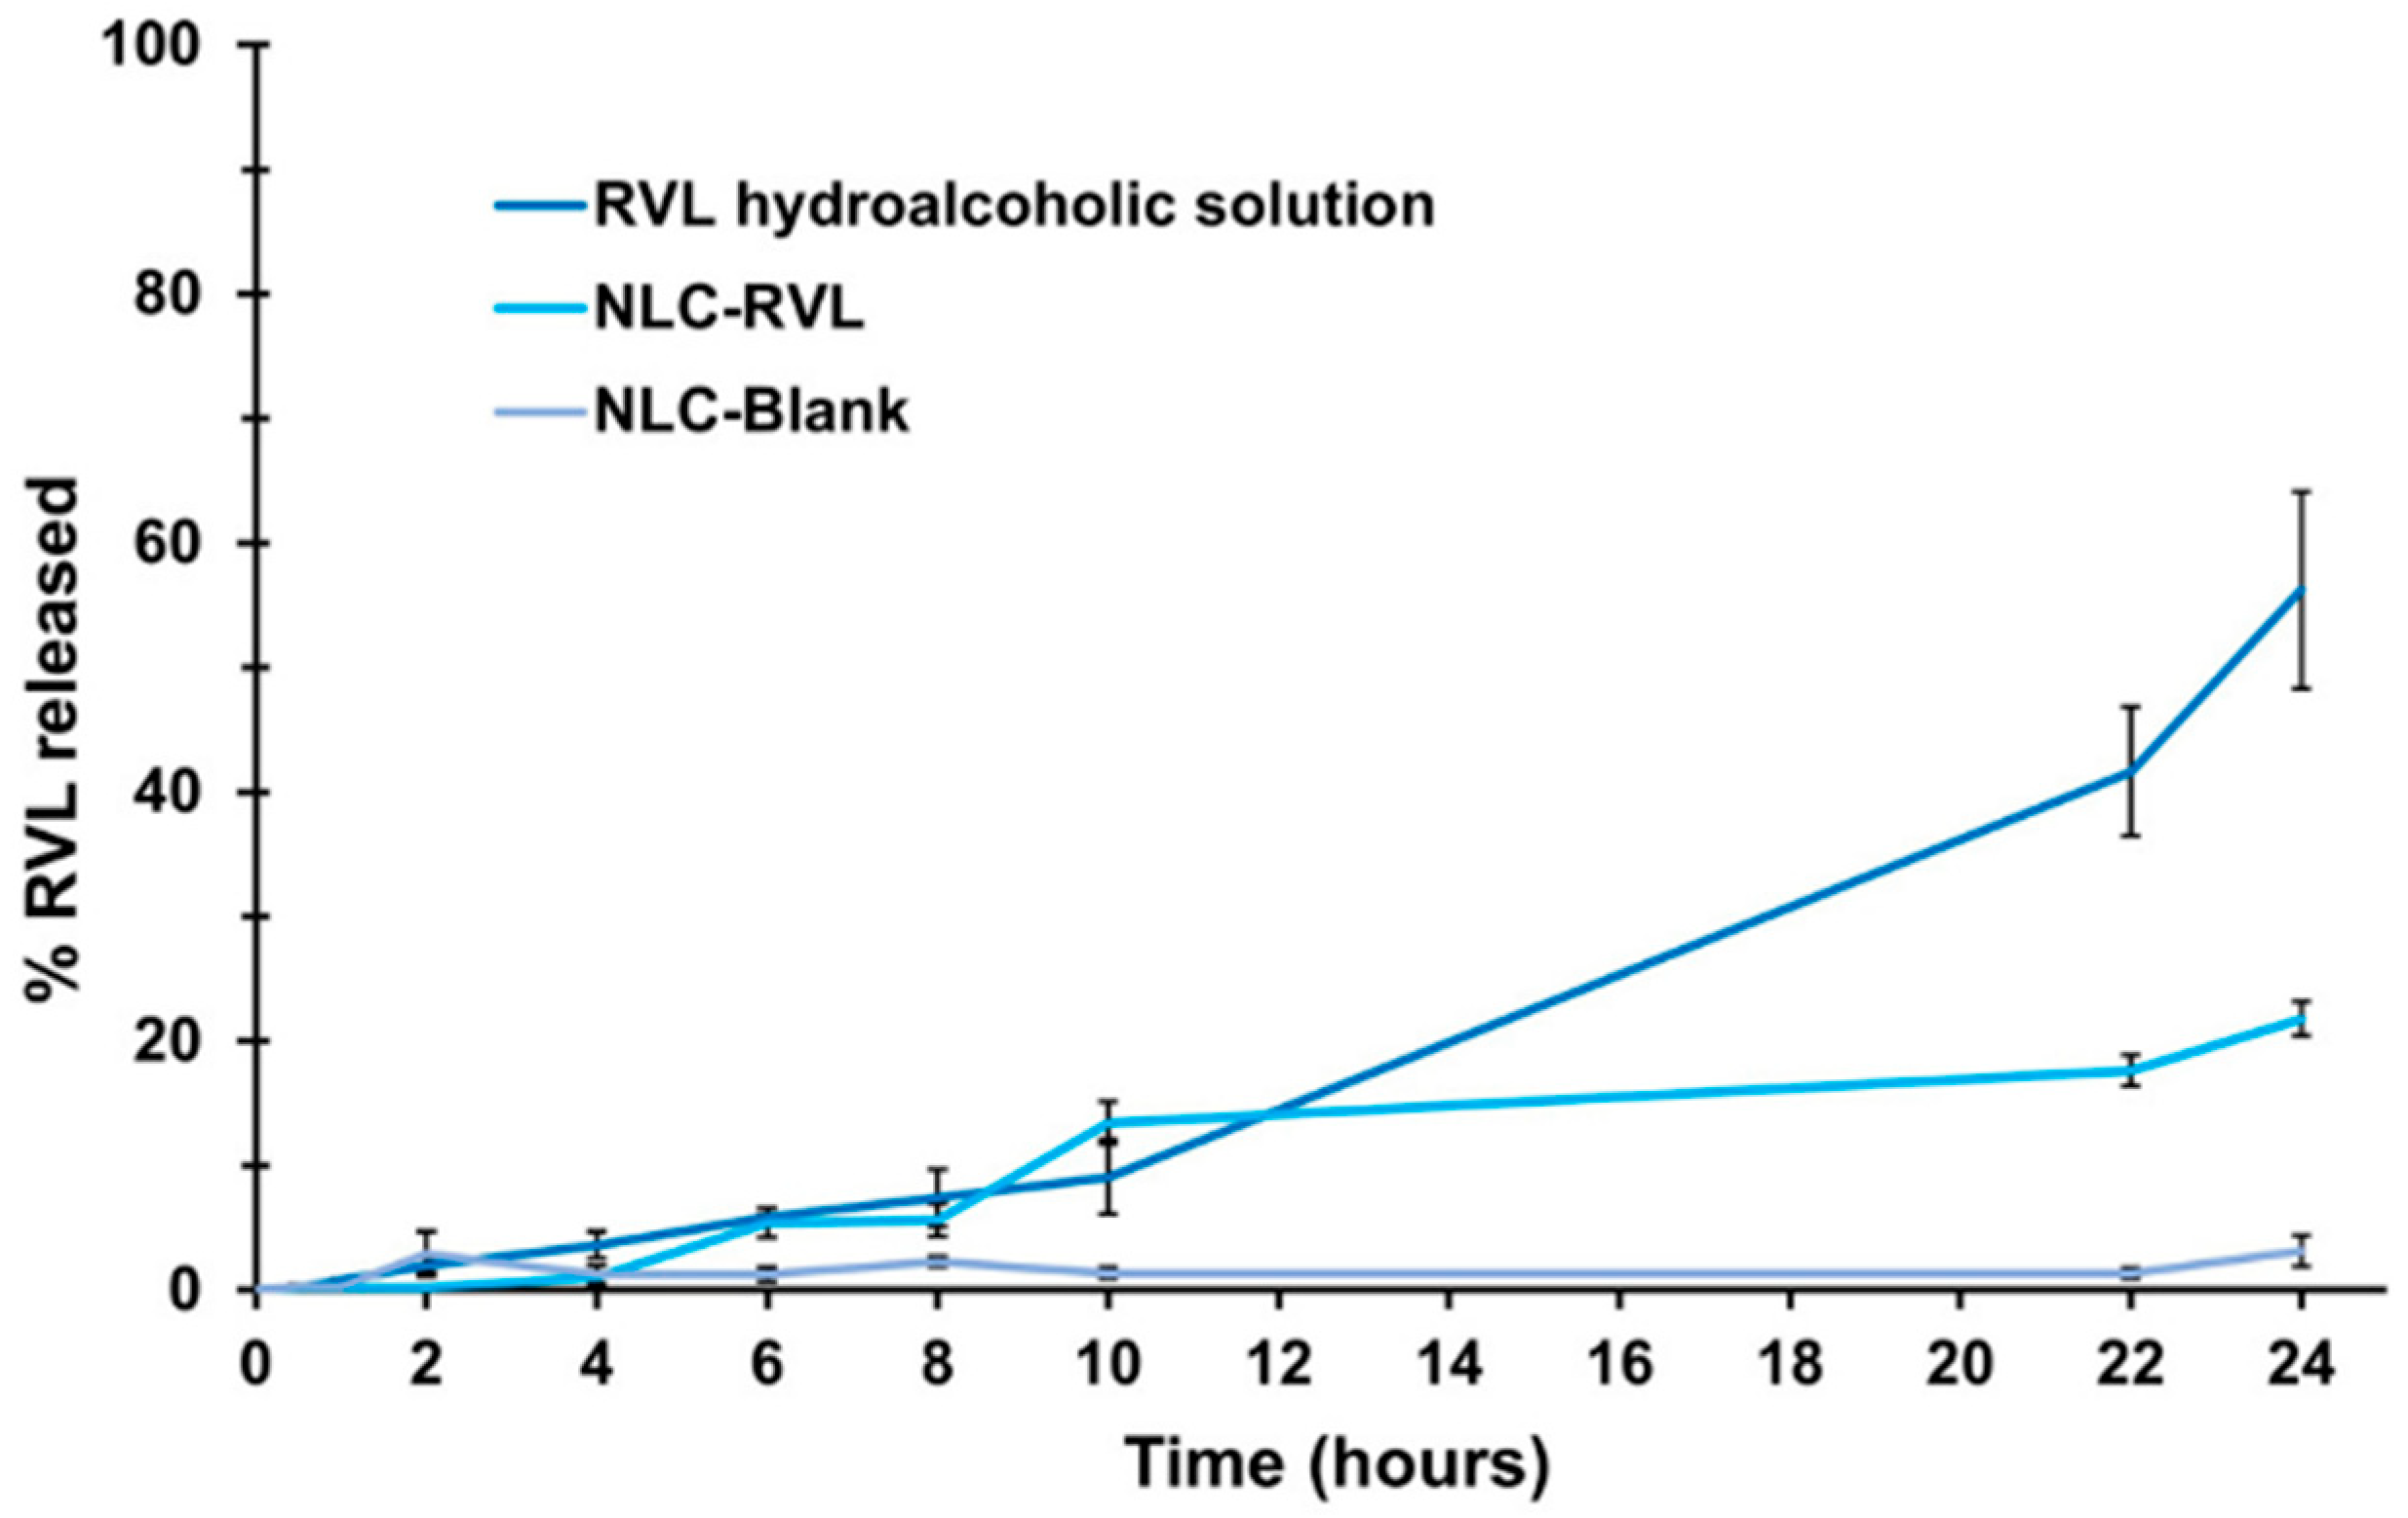
The optimized resveratrol-loaded nanostructured lipid carrier (NLC-RVL) and the hydroalcoholic resveratrol solution were prepared with a target concentration of 250 µg/mL. Experimental measurements confirmed concentrations of 241.89 µg /mL for NLC-RVL and 253.94 µg/mL for the solution.
Release kinetics (Figure 12) demonstrated a markedly faster diffusion of resveratrol when dissolved in the hydroalcoholic solution, reaching nearly 60% release by the end of the assay. In contrast, the nanostructured system exhibited a sustained release pattern, with only 5% of resveratrol released within the first 6 hours, 13% after 10 hours, and a cumulative release of 21% at the end of the evaluation period. Notably, less than 1% release was observed at the 4-hour time point, highlighting the formulation’s capacity to provide controlled and prolonged drug release.
Figure 10.
Release kinetics of resveratrol-loaded NLC and resveratrol solution.
3.8. Characterization of the NLC Formulation
3.8.1. Differential Scanning Calorimetry (DSC) and Thermogravimetry (TG)
The thermal analysis of NLC formulations with (NLC-RVL) and without resveratrol (NLC-blank) is shown in Figure 11 and table 6. Both systems exhibited an initial endothermic event at ~45 °C (step 1), consistent with the instability observed during storage at 40 °C, near the melting transition. Weight loss initiated around 100 °C and reached ~90% by 400 °C, corresponding to degradation of organic components and characterized by exothermic peaks (step 2).
The incorporation of resveratrol was confirmed by distinct decomposition patterns in step 2. Compared to blank NLCs, NLC-RVL exhibited higher Tonset (223 vs. 232 °C, respectively) and DTG Tpeak values (263 vs. 276 °C, respectively), indicating delayed degradation and improved thermal stability. Furthermore, the main DSC exothermic peak shifted from 331 °C (NLC-blank) to 272 °C (NLC-RVL), while the secondary peak nearly disappeared. These changes suggest that resveratrol modifies the heat-release profile, either by interacting with intermediate degradation products or through its own decomposition.

Table 6.
Results of thermal analysis (TGA/DTG and DSC) of NLC formulations.
| Steps | Temperature Range (°C) | Parameters | NLC-blank | NLC-RVL |
| 1 | 25 - 150 | Δw (%) | 1.9 | 1.3 |
| Tonset (°C) | 56 | 59 | ||
| Tpeak DTG (°C) | 55 | 61 | ||
| Tpeak DSC (°C) | 42 (⭣) | 47 (⭣) | ||
| 2 | 150 - 400 | Δw (%) | 89.4 | 91.4 |
| Tonset (°C) | 223 | 232 | ||
| Tpeak DTG (°C) | 263 | 276 | ||
| Tpeak DSC (°C) | 331 (⭡) | 272 (⭡) | ||
| 3 | 400 - 650 | Δw (%) | 6.8 | 7.4 |
| Tonset (°C) | 464 | 411 | ||
| Tpeak DTG (°C) | 494 | 504 | ||
| Tpeak DSC (°C) | 485 (⭡) | 492 (⭡) | ||
| Residue at 650 °C (Δw %) | 1.8 | 0.05 | ||
T: temperature; Δw: weight loss; ⭡: exothermic peak; ⭣: endothermic peak.
3.8.2. Fourier Transform Infrared Spectroscopy (FTIR)
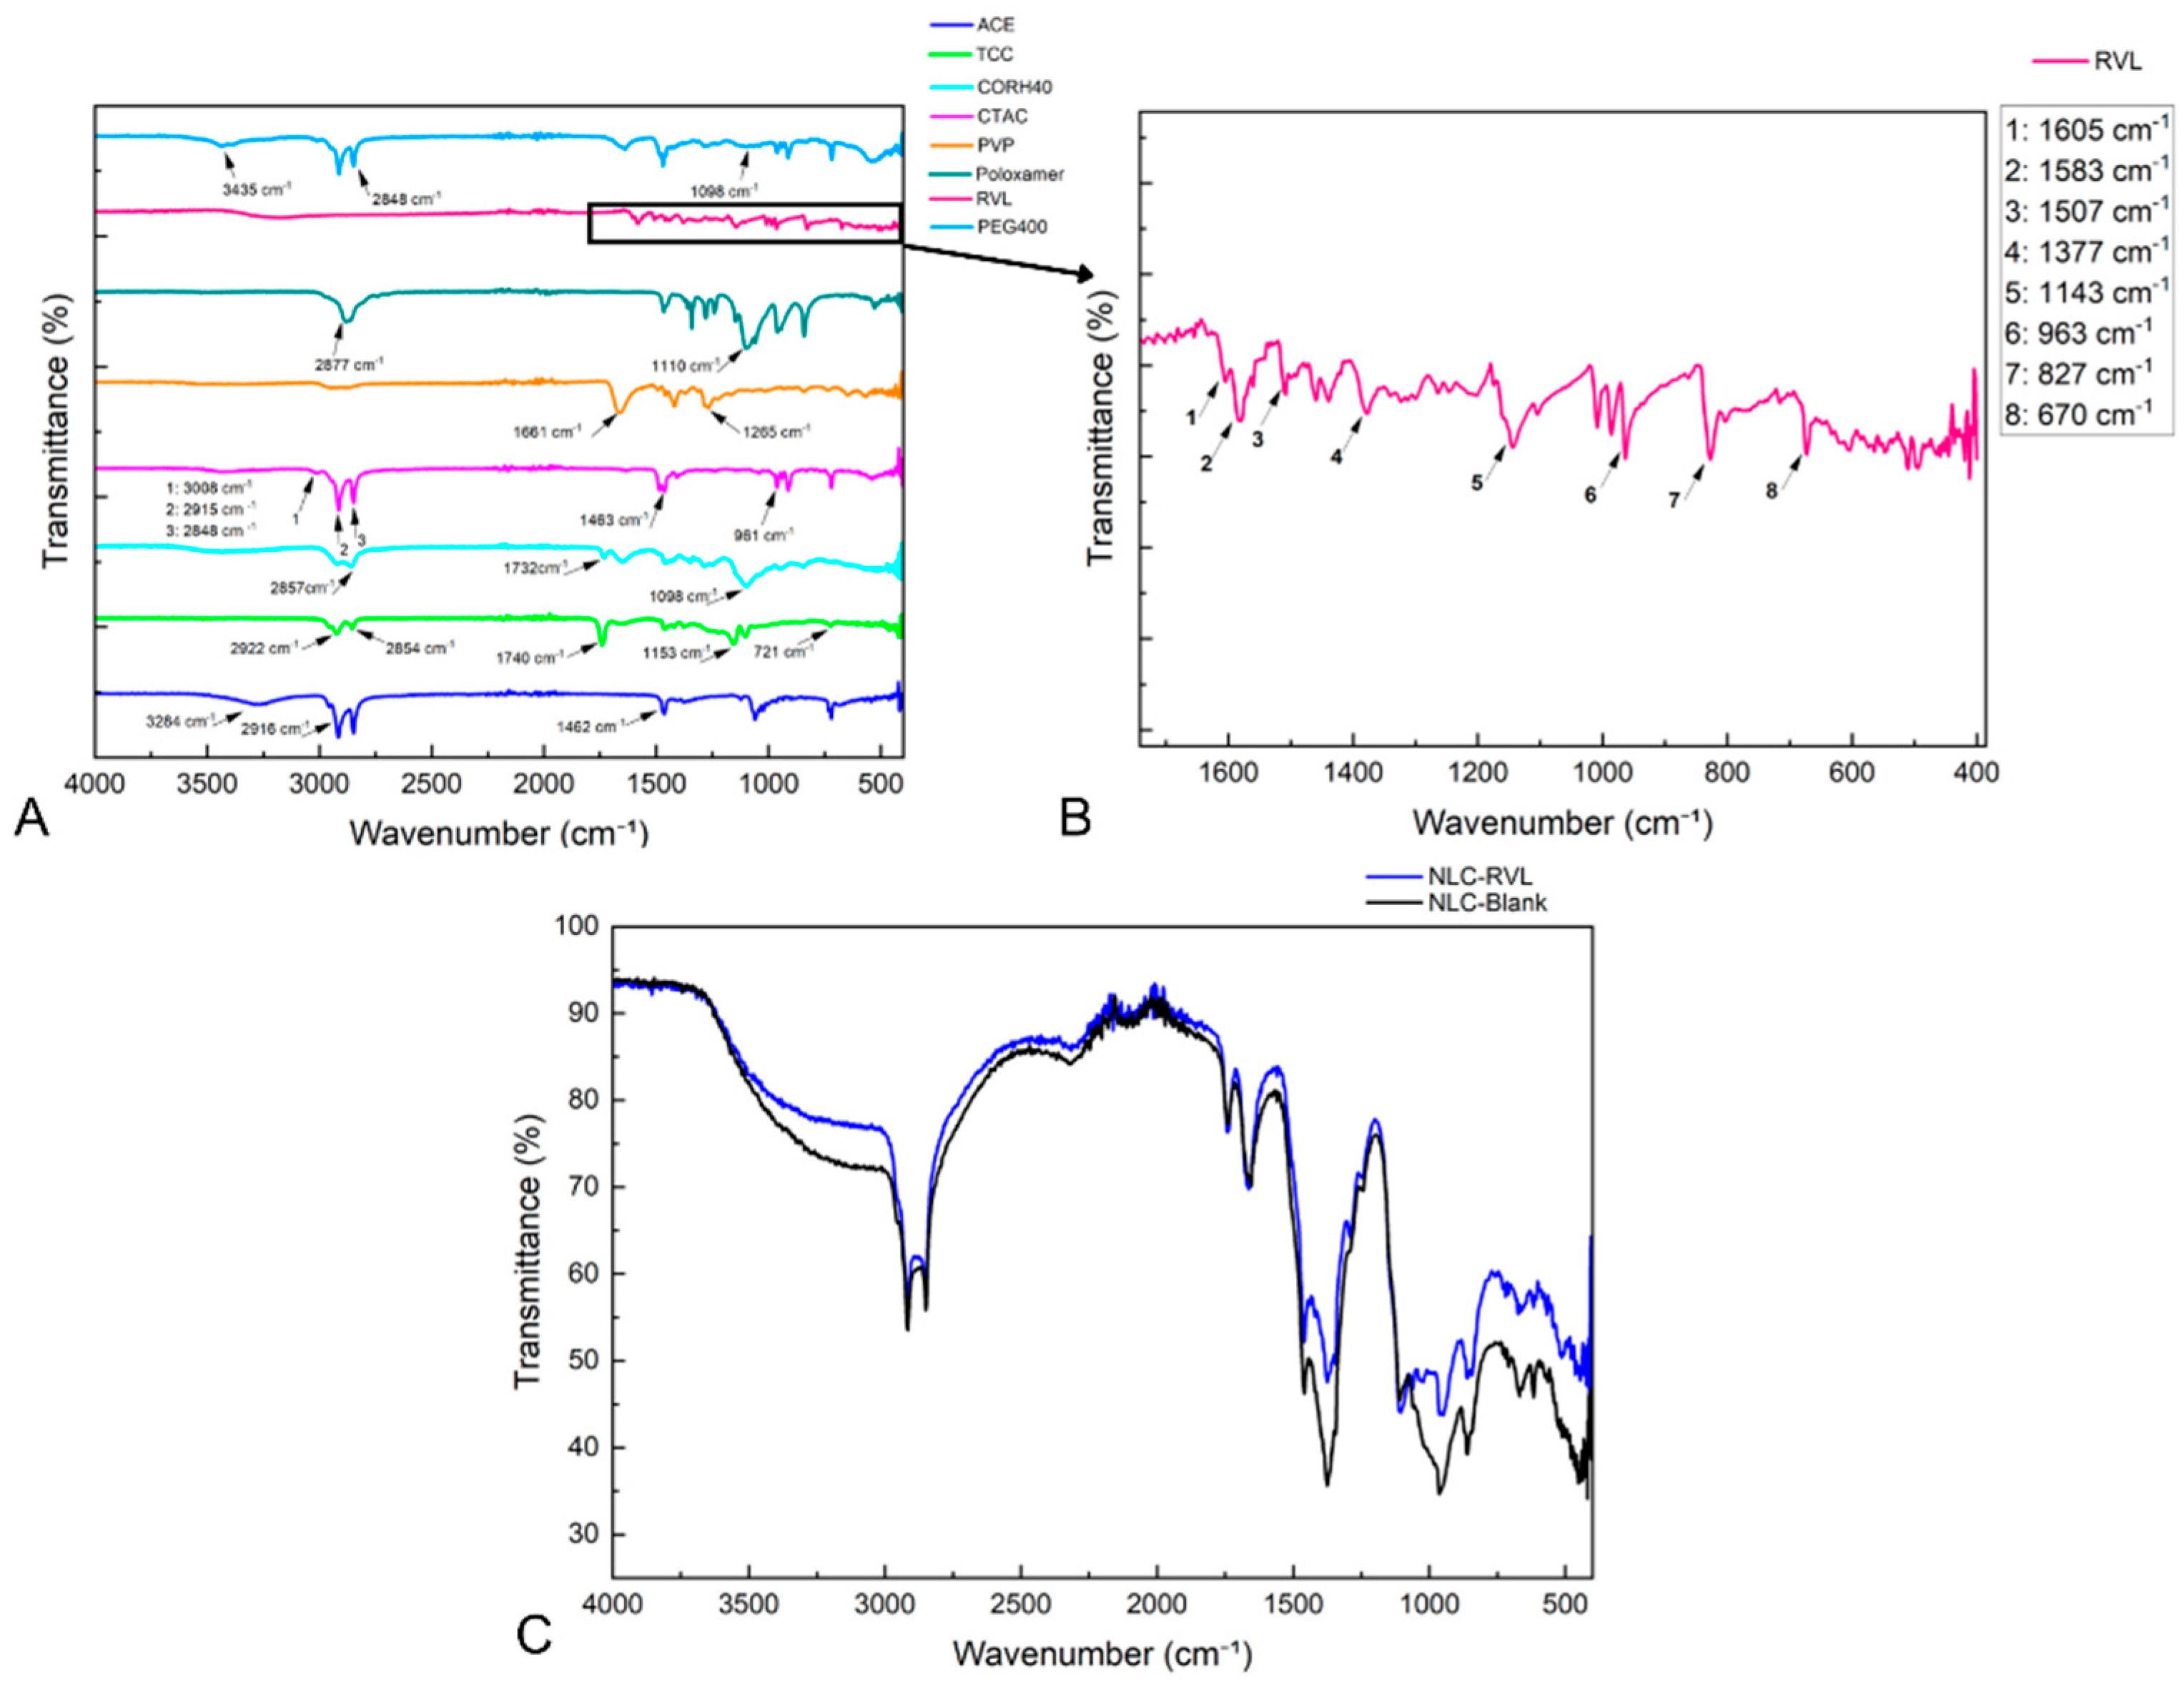
FTIR spectra were obtained for the raw materials of NLC formulations (Figure 12A). Cetearyl alcohol (ACE) exhibited characteristic bands of symmetric stretching of the methylene –CH2 group at 2916 cm⁻¹, scissoring of –CH2 and asymmetric bending of CH3 groups at 1462 cm⁻¹, rocking vibrations of –CH2 at 718 cm⁻¹, and hydroxyl (OH) stretching at 3284 cm⁻¹ [50].
Caprylic/capric triglyceride (TCC) displayed signals typical of aliphatic chains, including CH2 stretching at 2922 cm⁻¹, O–CH2 vibration at 2854 cm⁻¹, a carbonyl (C=O) peak at 1740 cm⁻¹, and CH2 bending at 721 cm⁻¹ [51], In addition, C–O–C stretching was detected at 1153 cm⁻¹ [52].
The surfactant CORH40 presented bands associated with OH stretching at 3502 cm⁻¹, CH stretching at 2857 cm⁻¹, C=O vibration at 1732 cm⁻¹, and C–O–C ether stretching at 1098 cm⁻¹ [53]. For CTAC, the trimethylammonium head was identified by the asymmetric stretching of CH3 at 3008 cm⁻¹. Asymmetric and symmetric CH2 stretching appeared at 2915 and 2848 cm⁻¹, respectively. The band at 1463 cm⁻¹ was related to methylene and methyl bending, while the one at 961 cm⁻¹ corresponded to C–N vibration of the cationic headgroup [54].
PEG-400 showed peaks at 3435 cm⁻¹ (OH stretching), 2848 cm⁻¹ (–CH3), and 1098 cm⁻¹ (C–O–C stretching) [55]. PVP presented absorption bands at 1661 cm⁻¹ and 1265 cm⁻¹, corresponding to C=O and C–N vibrations, respectively [56]. Poloxamer displayed signals at 2877 cm⁻¹ and 1100 cm⁻¹, attributed to CH and C–O stretching, respectively [57].
Resveratrol (Figure 12, b), exhibited a typical spectrum with bands at 1605, 1583, and 1507 cm⁻¹ related to aromatic C=C stretching of benzene rings; 1377 cm⁻¹ corresponding to hydroxyl groups; and 1143 cm⁻¹ associated with C=O stretching of phenolic compounds. The band at 963 cm⁻¹ indicated CH vibrations of the trans-configuration, while peaks at 827 and 670 cm⁻¹ represented C–H vibration band of arene conjugated to olefinic group and =C-H of olefinic groups, respectively [58].
The spectra of NLC-RVL and NLC-Blank (Figure 12, c) were almost indistinguishable, with overlapping bands at the same wavenumbers. This overlap is attributed to the relatively low proportion of RVL in the formulations compared to the much higher concentrations of excipients such as lipids and surfactants. As a result, the spectral response is dominated by these major components, making the RVL contribution less evident in the overall analysis.
Figure 12.
FTIR spectra of raw materials (a), resveratrol (b) and NLC formulations (c). ACE: Cetearyl Alcohol; TCC: Caprylic/Capric Triglyceride; CORH40: PEG-40 Hydrogenated Castor Oil; CTAC: cetyltrimethylammonium chloride; PVP: Polyvinylpyrrolidone K30; RVL: Resveratrol;.
Figure 12.
FTIR spectra of raw materials (a), resveratrol (b) and NLC formulations (c). ACE: Cetearyl Alcohol; TCC: Caprylic/Capric Triglyceride; CORH40: PEG-40 Hydrogenated Castor Oil; CTAC: cetyltrimethylammonium chloride; PVP: Polyvinylpyrrolidone K30; RVL: Resveratrol;.
3.8.3. Transmission Electron Microscopy (TEM)
3.8.7. Small-Angle X-Ray Scattering (SAXS)
The SAXS data were fitted using the SASFit software [59]. The red curve in Figure 14 represents the Gaussian mass fractal form factor. In this case, an average particle diameter of 25.9 nm was obtained, which is relatively smaller than the results observed from TEM and DLS images, with a scattering intensity of 3.75 nm.
3.9. MTT Cell Viability Assay
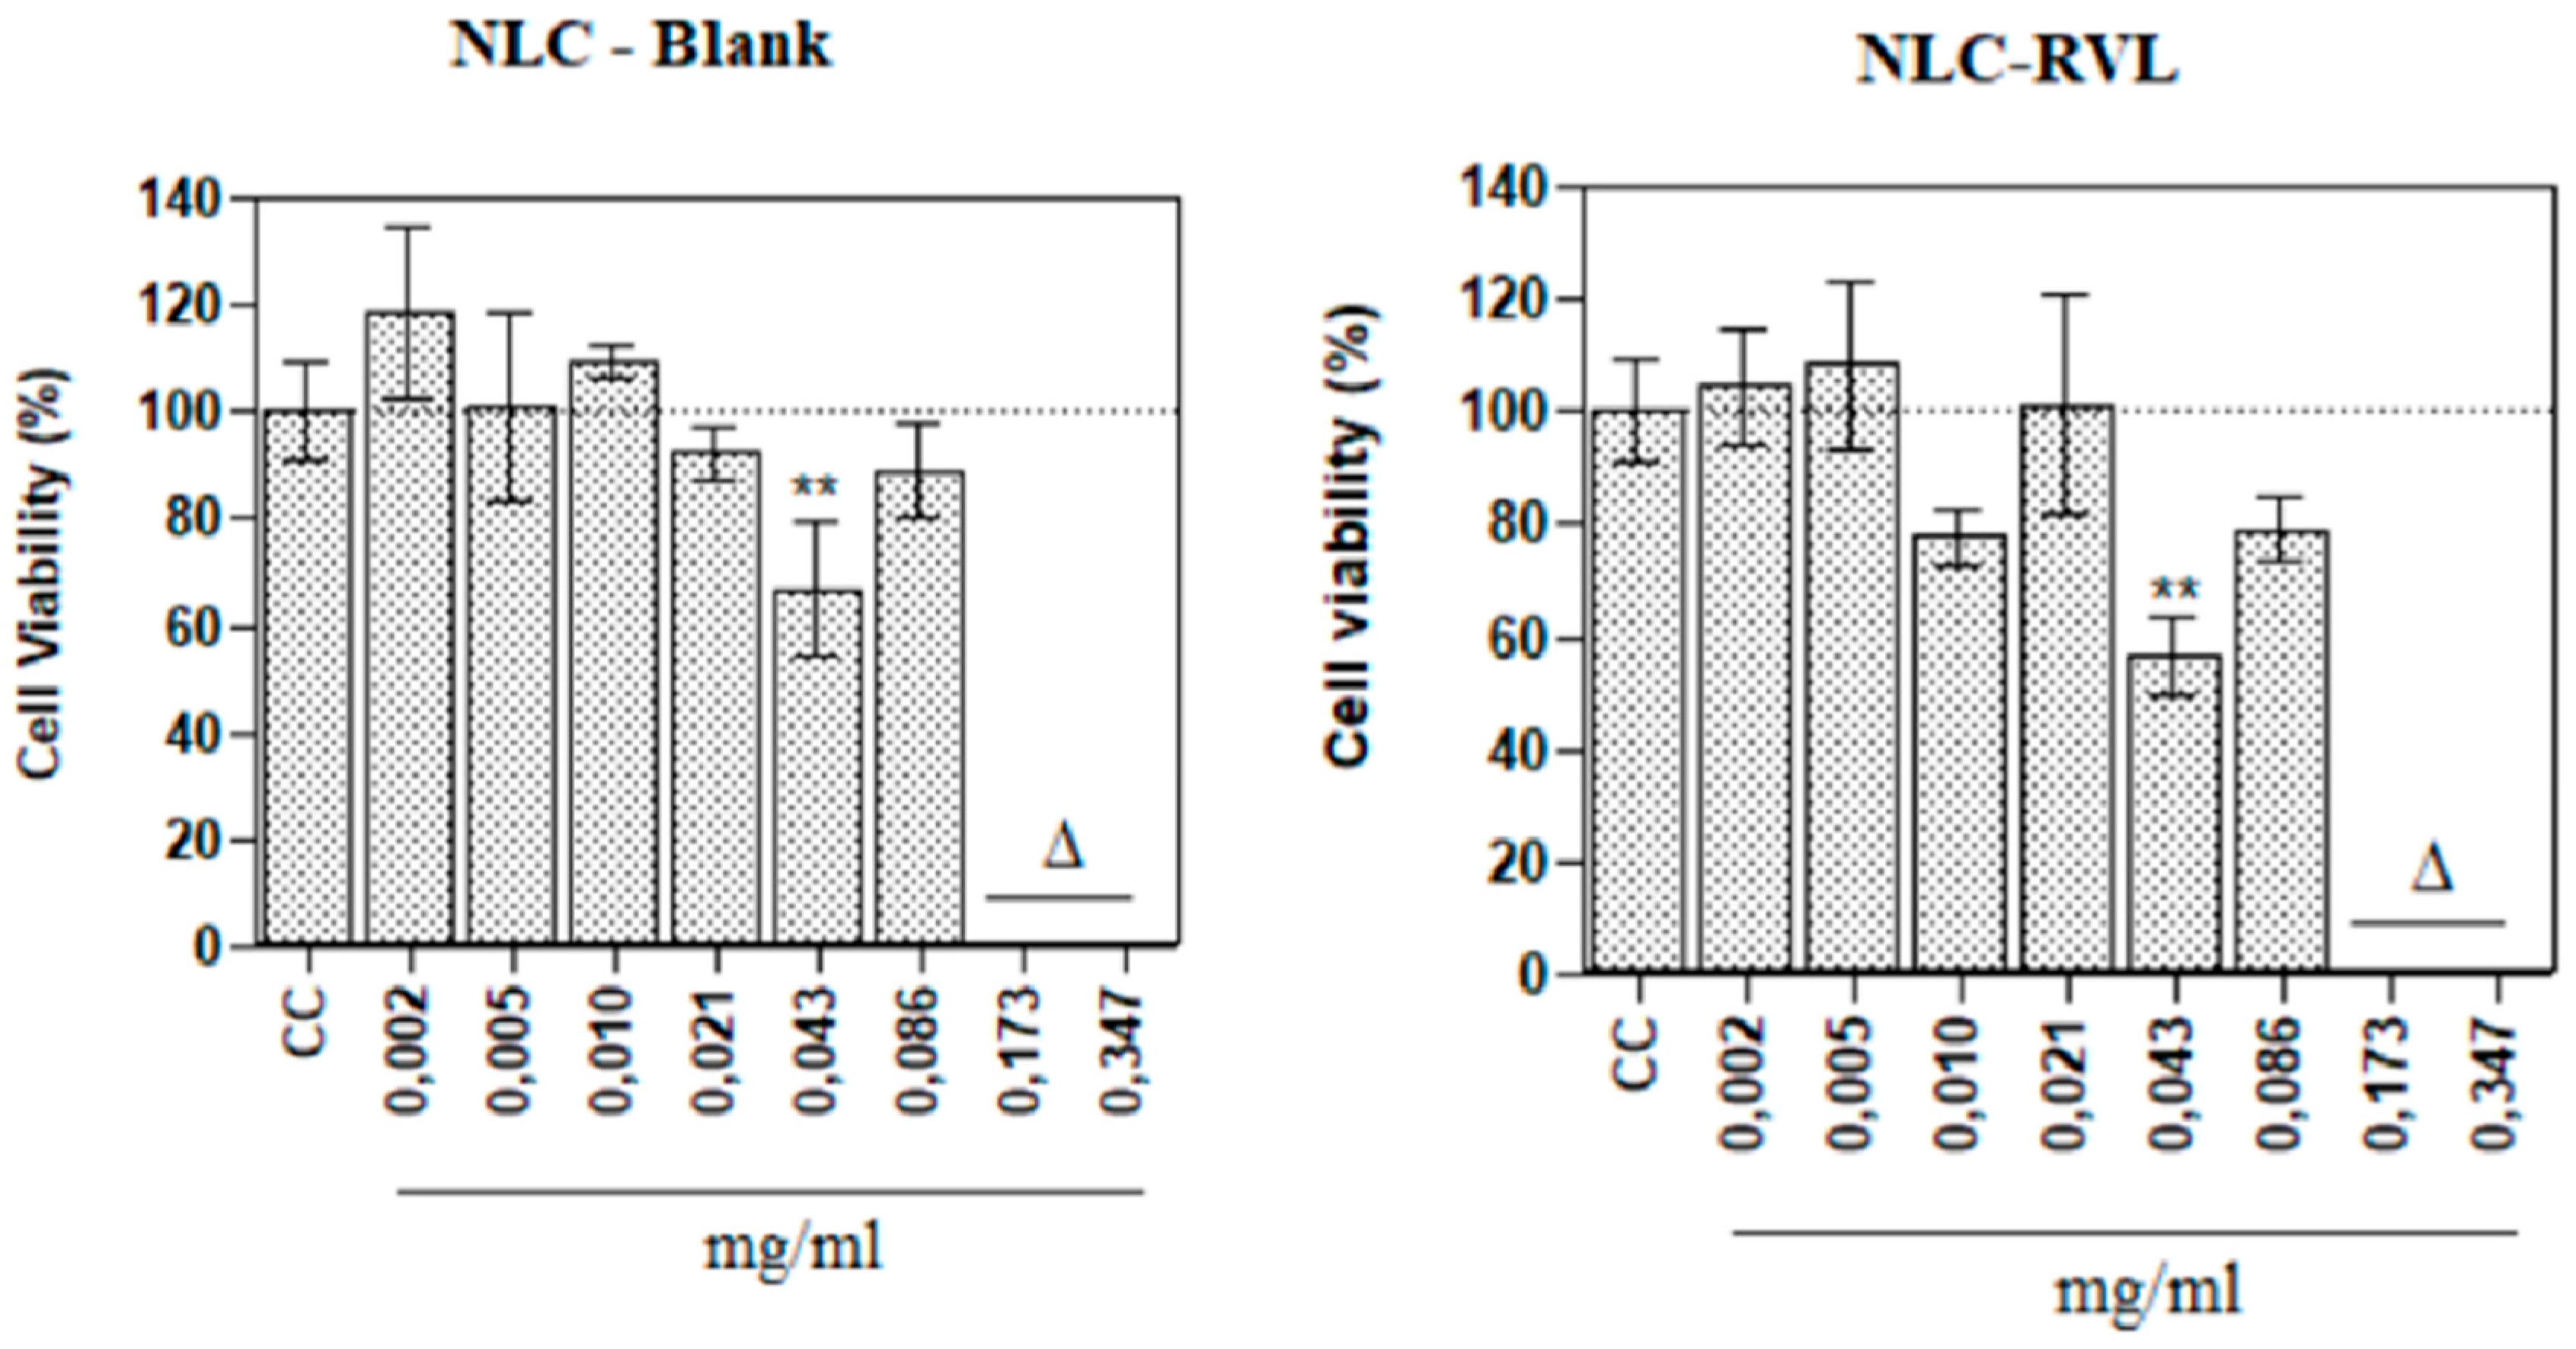
The cytotoxic effect of the nanostructure was evaluated in HaCaT cells after 48 hours of incubation with the dye. Different concentrations of the nanostructure (0.347, 0.173, 0.086, 0.043, 0.021, 0.010, 0.005, and 0.002 mg/mL) were pre-treated, and a control group (CC) was measured without treatment. The results show that the nanoparticles exhibited a reduction in cell viability only at the two highest concentrations (Figure 16). The half-maximal inhibitory concentration (IC₅₀), obtained using the Phototox® software based on absorbance values from the cytotoxicity assay, were 0.133 and 0.119 mg/mL for NLC-blank and NLC-RVL, respectively. Therefore, NLC-RVL was the more toxic formulation.
The results obtained in this study diverge from the literature regarding the decrease in cell viability with increasing nanoparticle concentration, as the graphs here demonstrate a viability higher than the control for both formulations. Furthermore, the IC₅₀ values observed were considerably lower than those reported in another study, in which the MTT assay was performed using CLN and NLS encapsulating resveratrol, with IC₅₀ values ranging from 0.3 to 0.9 mg/mL, indicating lower cytotoxicity than that observed in the present work [60].
Figure 15.
MTT cell viability assay. Data were presented as mean ± SD in quadruplicate and analyzed by ANOVA statistical test with Bonferroni’s as post-test. All data were compared with the cell control (CC). Δ =P<0.001, **p<0.01. The dotted line indicates 100% viability.
Figure 15.
MTT cell viability assay. Data were presented as mean ± SD in quadruplicate and analyzed by ANOVA statistical test with Bonferroni’s as post-test. All data were compared with the cell control (CC). Δ =P<0.001, **p<0.01. The dotted line indicates 100% viability.
4. Conclusion
Initially, laser diffraction analysis enabled the selection of cetearyl alcohol and PEG-40 hydrogenated castor oil as the solid lipid and surfactant, respectively. In the second stage, the formulation composition was optimized by determining the appropriate concentrations of the surfactant and the oil phase. Subsequently, the process was optimized by defining the optimal temperature, as well as the quantity and mode of addition of the aqueous phase. Thereafter, CTAC was incorporated as a cationic surfactant and poloxamer as a stabilizing polymer, aiming to enhance electrostatic and steric stability, respectively.
The resveratrol-loaded NLCs were developed through successive evaluation steps until the final product was obtained, exhibiting a mean particle size of approximately 290 nm, a PDI of 0.2, a zeta potential of +43 mV, an encapsulation efficiency of 98%, and a controlled release profile. Resveratrol incorporation proved not only feasible but also advantageous, promoting particle size reduction in scaled-up formulations. Refrigerated storage was shown to be essential for maintaining physicochemical stability. Thermal analysis confirmed the presence of resveratrol; however, FTIR analysis did not reveal significant differences between NLC-blank and NLC-RVL. TEM images showed particles predominantly around ~200 nm, along with smaller populations of ~100 nm, indicating system heterogeneity. Conversely, SAXS analysis provided contradictory results, suggesting even smaller structures of approximately 25 nm.
In summary, the study successfully achieved its objective, demonstrating that the proposed low-energy, solvent-free method enabled the development and optimization of nanoscale, stable NLCs with efficient incorporation of a model bioactive. These findings underscore the potential of this platform as a promising alternative to conventional techniques that rely on high-energy input or organic solvents.
Supplementary Materials
The following supporting information can be downloaded at the website of this paper posted on Preprints.org.
Author Contributions
N.T.R.B: conceptualization, data curation, formal analysis, investigation, methodology, visualization, writing – original draft, review and editing. L.R.S.M: investigation, methodology, visualization, review. J.N.B.D.P, R.A.G.B.S and M.S.A: data curation, formal analysis, investigation, methodology. T.S.M: data curation, formal analysis, investigation, methodology, review and editing. I.W.H: investigation, methodology. P.S.L and V.R.L.S: supervision, resources and review. N.A.F: conceptualization, funding acquisition, methodology, project administration, resources, supervision, writing – original draft, review and editing.
Data Availability Statement
The original contributions presented in this study are included in the article. Further inquiries can be directed to the corresponding author.
Acknowledgments
The authors would like to thank Coordenação de Aperfeiçoamento de Pessoal de Nível Superior-Brazil (CAPES) Finance Code 001 and São Paulo Research Foundation (FAPESP), Process Number 2024/07308-5 and 2024/03198-0 for student scholarships. Professor Vania R Leite-Silva is highly thankful to the Brazilian National Council for Scientific and Technological Development (CNPq), for the Productivity Scholarship in technological development and innovative extension (CNPq, Process 302153/2023-3).
References
- Ghasemiyeh, P.; Mohammadi-Samani, S. Solid lipid nanoparticles and nanostructured lipid carriers as novel drug delivery systems: applications, advantages and disadvantages. Res. Pharm. Sci. 2018, 13, 288. [Google Scholar] [CrossRef]
- Fitriani, E. W.; Avanti, C.; Rosana, Y.; Surini, S. Nanostructured lipid carriers: A prospective dermal drug delivery system for natural active ingredients. Pharmacia 2024, 71, 1–15. [Google Scholar] [CrossRef]
- Graván, P.; Aguilera-Garrido, A.; Marchal, J. A.; Navarro-Marchal, S. A.; Galisteo-González, F. Lipid-core nanoparticles: Classification, preparation methods, routes of administration and recent advances in cancer treatment. Adv. Colloid Interface Sci. 2023, 314, 102871. [Google Scholar] [CrossRef] [PubMed]
- Gordillo-Galeano, A.; Mora-Huertas, C. E. Solid lipid nanoparticles and nanostructured lipid carriers: A review emphasizing on particle structure and drug release. Eur. J. Pharm. Biopharm. 2018, 133, 285–308. [Google Scholar] [CrossRef] [PubMed]
- Duong, V.-A.; Nguyen, T.-T.-L.; Maeng, H.-J. Preparation of Solid Lipid Nanoparticles and Nanostructured Lipid Carriers for Drug Delivery and the Effects of Preparation Parameters of Solvent Injection Method. Molecules 2020, 25, 4781. [Google Scholar] [CrossRef]
- Adena, S. K. R.; Herneisey, M.; Pierce, E.; Hartmeier, P. R.; Adlakha, S.; Hosfeld, M. A. I.; Drennen, J. K.; Janjic, J. M. Quality by Design Methodology Applied to Process Optimization and Scale up of Curcumin Nanoemulsions Produced by Catastrophic Phase Inversion. Pharmaceutics 2021, 13, 880. [Google Scholar] [CrossRef]
- Almeida, F.; Corrêa, M.; Zaera, A. M.; Garrigues, T.; Isaac, V. Influence of different surfactants on development of nanoemulsion containing fixed oil from an Amazon palm species. Colloids Surf. Physicochem. Eng. Asp. 2022, 643, 128721. [Google Scholar]
- Dikpati, A.; Mohammadi, F.; Greffard, K.; Quéant, C.; Arnaud, P.; Bastiat, G.; Rudkowska, I.; Bertrand, N. Residual Solvents in Nanomedicine and Lipid-Based Drug Delivery Systems: a Case Study to Better Understand Processes. Pharm. Res. 2020, 37, 149. [Google Scholar] [CrossRef]
- Lozada, M. I. O.; Maldonade, I. R.; Rodrigues, D. B.; Santos, D. S.; Ortega Sanchez, B. A.; De Souza, P. E. Narcizo; Longo, J. P.; Amaro, G. Bernardo; De Oliveira, L. De Lacerda. Physicochemical characterization and nano-emulsification of three species of pumpkin seed oils with focus on their physical stability. Food Chem. 2021, 343, 128512. [Google Scholar] [CrossRef]
- Radeva, L.; Yoncheva, K. Resveratrol—A Promising Therapeutic Agent with Problematic Properties. Pharmaceutics 2025, 17, 134. [Google Scholar] [CrossRef] [PubMed]
- Machado, A. C. H. R.; Marinheiro, L. J.; Benson, H. A. E.; Grice, J. E.; Martins, T. D. S.; Lan, A.; Lopes, P. S.; Andreo-Filho, N.; Leite-Silva, V. R. A Novel Handrub Tablet Loaded with Pre- and Post-Biotic Solid Lipid Nanoparticles Combining Virucidal Activity and Maintenance of the Skin Barrier and Microbiome. Pharmaceutics 2023, 15, 2793. [Google Scholar] [CrossRef]
- Losito, D. W.; Lopes, P. S.; Ueoka, A. R.; Fantini, M. C. A.; Oseliero Filho, P. L.; Andréo-Filho, N.; Martins, T. S. Biocomposites based on SBA-15 and papain: Characterization, enzymatic activity and cytotoxicity evaluation. Microporous Mesoporous Mater. 2021, 325, 111316. [Google Scholar] [CrossRef]
- Asadi, J.; Ferguson, S.; Raja, H.; Hacker, C.; Marius, P.; Ward, R.; Pliotas, C.; Naismith, J.; Lucocq, J. Enhanced imaging of lipid rich nanoparticles embedded in methylcellulose films for transmission electron microscopy using mixtures of heavy metals. Micron 2017, 99, 40–48. [Google Scholar] [CrossRef] [PubMed]
- Taylor, E. N.; Kummer, K. M.; Dyondi, D.; Webster, T. J.; Banerjee, R. Multi-scale strategy to eradicate Pseudomonas aeruginosa on surfaces using solid lipid nanoparticles loaded with free fatty acids. Nanoscale 2014, 6, 825–832. [Google Scholar] [CrossRef] [PubMed]
- Abla, K. K.; Hijazi, S. M.; Mehanna, M. M. Augmented efficiency of azithromycin for MRSA ocular infections management: Limonene-based nanostructured lipid carriers in-situ approach. J. Drug Deliv. Sci. Technol. 2023, 87, 104764. [Google Scholar] [CrossRef]
- Ren, G.; Sun, Z.; Wang, Z.; Zheng, X.; Xu, Z.; Sun, D. Nanoemulsion formation by the phase inversion temperature method using polyoxypropylene surfactants. J. Colloid Interface Sci. 2019, 540, 177–184. [Google Scholar] [CrossRef]
- Simão, D. O.; Honorato, T. D.; Gobo, G. G.; Piva, H. L.; Goto, P. L.; Rolim, L. A.; Turrin, C.-O.; Blanzat, M.; Tedesco, A. C.; Siqueira-Moura, M. P. Preparation and cytotoxicity of lipid nanocarriers containing a hydrophobic flavanone. Colloids Surf. Physicochem. Eng. Asp. 2020, 601, 124982. [Google Scholar] [CrossRef]
- Weerapol, Y.; Manmuan, S.; Chaothanaphat, N.; Limmatvapirat, S.; Sirirak, J.; Tamdee, P.; Tubtimsri, S. New Approach for Preparing Solid Lipid Nanoparticles with Volatile Oil-Loaded Quercetin Using the Phase-Inversion Temperature Method. Pharmaceutics 2022, 14, 1984. [Google Scholar] [CrossRef]
- Elmowafy, M.; Shalaby, K.; Badran, M. M.; Ali, H. M.; Abdel-Bakky, M. S.; El-Bagory, I. Fatty alcohol containing nanostructured lipid carrier (NLC) for progesterone oral delivery: In vitro and ex vivo studies. J. Drug Deliv. Sci. Technol. 2018, 45, 230–239. [Google Scholar] [CrossRef]
- Tanyapanyachon, P.; Dana, P.; Thumsongsiri, N.; Chonniyom, W.; Saengkrit, N. Interrupting the blood-testis barrier with a flutamide-loaded nanostructured lipid carrier: A novel nonsurgical contraceptive approach for male animals. Theriogenology 2023, 206, 96–105. [Google Scholar]
- Youshia, J.; Kamel, A. O.; El Shamy, A.; Mansour, S. Gamma sterilization and in vivo evaluation of cationic nanostructured lipid carriers as potential ocular delivery systems for antiglaucoma drugs. Eur. J. Pharm. Sci. 2021, 163, 105887. [Google Scholar] [CrossRef]
- Czajkowska-Kośnik, A.; Szymańska, E.; Czarnomysy, R.; Jacyna, J.; Markuszewski, M.; Basa, A.; Winnicka, K. Nanostructured Lipid Carriers Engineered as Topical Delivery of Etodolac: Optimization and Cytotoxicity Studies. Materials 2021, 14, 596. [Google Scholar] [CrossRef]
- Dumont, B.; Jannin, V.; Miolane, C.; Lelong, Q.; Valour, J.-P.; Urbaniak, S.; Fessi, H.; Bourgeois, S. A proof-of-concept for developing oral lipidized peptide Nanostructured Lipid Carrier formulations. J. Drug Deliv. Sci. Technol. 2019, 54, 101394. [Google Scholar]
- Abdelhamid, S. M.; Edris, A. E.; Sadek, Z. Novel approach for the inhibition of Helicobacter pylori contamination in yogurt using selected probiotics combined with eugenol and cinnamaldehyde nanoemulsions. Food Chem. 2023, 417, 135877. [Google Scholar] [CrossRef]
- Srivastava, V.; Pardhi, E. R.; Yadav, R.; Singh, V.; Khatri, D. K.; Mehra, N. K. QbD-driven thymoquinone laden nanoemulsion for glaucoma management: In vitro, ex vivo, and pre-clinical evaluation. J. Drug Deliv. Sci. Technol. 2024, 94, 105493. [Google Scholar]
- Mura, P.; Maestrelli, F.; D’Ambrosio, M.; Luceri, C.; Cirri, M. Evaluation and Comparison of Solid Lipid Nanoparticles (SLNs) and Nanostructured Lipid Carriers (NLCs) as Vectors to Develop Hydrochlorothiazide Effective and Safe Pediatric Oral Liquid Formulations. Pharmaceutics 2021, 13, 437. [Google Scholar] [CrossRef] [PubMed]
- Sakellari, G. I.; Zafeiri, I.; Batchelor, H.; Spyropoulos, F. Formulation design, production and characterisation of solid lipid nanoparticles (SLN) and nanostructured lipid carriers (NLC) for the encapsulation of a model hydrophobic active. Food Hydrocoll. Health 2021, 1, 100024. [Google Scholar]
- George, A. J.; Saju, F.; Mishra, B. Development of Size Optimized Bromelain Loaded Nanocarriers by Box- Behnken Design. Int. J. DRUG Deliv. Technol. 2023, 13, 10–16. [Google Scholar] [CrossRef]
- Pradhan, M.; Singh, D.; Singh, M. R. Fabrication, optimization and characterization of Triamcinolone acetonide loaded nanostructured lipid carriers for topical treatment of psoriasis: Application of Box Behnken design, in vitro and ex vivo studies. J. Drug Deliv. Sci. Technol. 2017, 41, 325–333. [Google Scholar] [CrossRef]
- Asfour, M. H.; Kassem, A. A.; Salama, A. Topical nanostructured lipid carriers/inorganic sunscreen combination for alleviation of all-trans retinoic acid-induced photosensitivity: Box-Behnken design optimization, in vitro and in vivo evaluation. Eur. J. Pharm. Sci. 2019, 134, 219–232. [Google Scholar] [CrossRef]
- Alhalmi, A.; Amin, S.; Beg, S.; Al-Salahi, R.; Mir, S. R.; Kohli, K. Formulation and optimization of naringin loaded nanostructured lipid carriers using Box-Behnken based design: In vitro and ex vivo evaluation. J. Drug Deliv. Sci. Technol. 2022, 74, 103590. [Google Scholar] [CrossRef]
- Gidwani, B.; Vyas, A. Preparation, characterization, and optimization of altretamine-loaded solid lipid nanoparticles using Box-Behnken design and response surface methodology. Artif. Cells Nanomedicine Biotechnol. 2016, 44, 571–580. [Google Scholar]
- Rachmawati, H.; Novel, M.; Ayu, S.; Berlian, G.; Tandrasasmita, O.; Tjandrawinata, R.; Anggadiredja, K. The In Vitro–In Vivo Safety Confirmation of PEG-40 Hydrogenated Castor Oil as a Surfactant for Oral Nanoemulsion Formulation. Sci. Pharm. 2017, 85, 18. [Google Scholar] [CrossRef]
- Chandan, C.; Phani Kumar, G.; Jawahar, N.; Sushma, B. V.; Amachawadi, R. G.; Shati, A. A.; Alfaifi, M. Y.; Elbehairi, S. E. I.; Prasad, S. K.; Shivamallu, C.; Jeyaprakash, M. R.; Kollur, S. Prasad. Design, development and characterization of Papain-loaded nanostructured lipid carriers for enhanced stability and bio-accessibility in acidic environments. Results Chem. 2024, 8, 101571. [Google Scholar]
- Qureshi, M.; Qadir, A.; Aqil, M.; Sultana, Y.; Warsi, M. H.; Ismail, M. V.; Talegaonkar, S. Berberine loaded dermal quality by design adapted chemically engineered lipid nano-constructs-gel formulation for the treatment of skin acne. J. Drug Deliv. Sci. Technol. 2021, 66, 102805. [Google Scholar] [CrossRef]
- Ortiz, A. C.; Yañez, O.; Salas-Huenuleo, E.; Morales, J. O. Development of a Nanostructured Lipid Carrier (NLC) by a Low-Energy Method, Comparison of Release Kinetics and Molecular Dynamics Simulation. Pharmaceutics 2021, 13, 531. [Google Scholar] [CrossRef] [PubMed]
- Mahbubul, M. Preparation, Characterization, Properties and Application of Nanofluid; Elsevier, 2019; pp. 1–13. [Google Scholar]
- Krambeck; Silva, V.; Silva, R.; Fernandes, C.; Cagide, F.; Borges, F.; Santos, D.; Otero-Espinar, F.; Lobo, J. M. S.; Amaral, M. H. Design and characterization of Nanostructured lipid carriers (NLC) and Nanostructured lipid carrier-based hydrogels containing Passiflora edulis seeds oil. Int. J. Pharm. 2021, 600, 120444. [Google Scholar] [CrossRef]
- Viegas, A.; Patrício, A. B.; Prata, J. M.; Nadhman, A.; Chintamaneni, P. K.; Fonte, P. Solid Lipid Nanoparticles vs. Nanostructured Lipid Carriers: A Comparative Review. Pharmaceutics 2023, 15, 1593. [Google Scholar] [CrossRef] [PubMed]
- Tenchov, R.; Bird, R.; Curtze, A. E.; Zhou, Q. Lipid Nanoparticles─From Liposomes to mRNA Vaccine Delivery, a Landscape of Research Diversity and Advancement. ACS Nano 2021, 15, 16982–17015. [Google Scholar] [CrossRef]
- Veider, F.; Akkuş-Dağdeviren, Z. B.; Knoll, P.; Bernkop-Schnürch, A. Design of nanostructured lipid carriers and solid lipid nanoparticles for enhanced cellular uptake. Int. J. Pharm. 2022, 624, 122014. [Google Scholar] [CrossRef]
- Elmowafy, M.; Shalaby, K.; Ali, H. M.; Alruwaili, N. K.; Salama, A.; Ibrahim, M. F.; Akl, M. A.; Ahmed, T. A. Impact of nanostructured lipid carriers on dapsone delivery to the skin: in vitro and in vivo studies. Int. J. Pharm. 2019, 572, 118781. [Google Scholar] [CrossRef]
- Wilson, R. J.; Li, Y.; Yang, G.; Zhao, C.-X. Nanoemulsions for drug delivery. Particuology 2022, 64, 85–97. [Google Scholar] [CrossRef]
- Mishra, V.; Bansal, K. K.; Verma, A.; Yadav, N.; Thakur, S.; Sudhakar, K.; Rosenholm, J. M. Solid Lipid Nanoparticles: Emerging Colloidal Nano Drug Delivery Systems. Pharmaceutics 2018, 10, 191. [Google Scholar] [CrossRef]
- Dhiman, N.; Awasthi, R.; Sharma, B.; Kharkwal, H.; Kulkarni, G. T. Lipid Nanoparticles as Carriers for Bioactive Delivery. Front. Chem. 2021, 9, 580118. [Google Scholar] [CrossRef]
- Basso; Mendes, M.; Cova, T.; Sousa, J.; Pais, A.; Fortuna, A.; Vitorino, R.; Vitorino, C. A Stepwise Framework for the Systematic Development of Lipid Nanoparticles. Biomolecules 2022, 12, 223. [Google Scholar] [CrossRef]
- Joshy, S.; Snigdha, S.; Anne, G.; Nandakumar, K.; Laly, P.A.T. Poly (vinyl pyrrolidone)-lipid based hybrid nanoparticles for anti viral drug delivery. Chem. Phys. Lipids 2018, 210, 82–89. [Google Scholar] [CrossRef]
- Chen, W. N.; Shaikh, M. F.; Bhuvanendran, S.; Date, A.; Ansari, M. T.; Radhakrishnan, A. K.; Othman, I. Poloxamer 188 (P188), A Potential Polymeric Protective Agent for CentralNervous System Disorders: A Systematic Review. Curr. Neuropharmacol. 2022, 20, 799–808. [Google Scholar] [PubMed]
- Chantaburanan, T.; Teeranachaideekul, V.; Jintapattanakit, A.; Chantasart, D.; Junyaprasert, V. B. Enhanced stability and skin permeation of ibuprofen-loaded solid lipid nanoparticles based binary solid lipid matrix: Effect of surfactant and lipid compositions. Int. J. Pharm. X 2023, 6, 100205. [Google Scholar] [CrossRef]
- Narvaez, E. M.; Carrillo, M. P.; Cardona-Jaramillo, J. E. C.; Vallejo, B. M.; Ferreira, L. M. D. M. C.; Silva-Júnior, J. O. C.; Ribeiro-Costa, R. M. Novel Organogels from Mauritia flexuosa L.f and Caryodendron orinocense Karst.: A Topical Alternative. Pharmaceutics 2023, 15, 2681. [Google Scholar] [CrossRef] [PubMed]
- Guilherme, V. A.; Ribeiro, L. N. M.; Alcântara, A. C. S.; Castro, S. R.; Rodrigues Da Silva, G. H.; Da Silva, C. G.; Breitkreitz, M. C.; Clemente-Napimoga, J.; Macedo, C. G.; Abdalla, H. B.; Bonfante, R.; Cereda, C. M. S.; De Paula, E. Improved efficacy of naproxen-loaded NLC for temporomandibular joint administration. Sci. Rep. 2019, 9, 11160. [Google Scholar] [CrossRef] [PubMed]
- Ye, K.; Zhao, D.; Shi, X.; Lu, X. Use of caprylic/capric triglyceride in the encapsulation of dementholized peppermint fragrance leading to smaller and better distributed nanocapsules. RSC Adv. 2016, 6, 84119–84126. [Google Scholar] [CrossRef]
- Kraisit, P.; Hirun, N.; Limpamanoch, P.; Sawaengsuk, Y.; Janchoochai, N.; Manasaksirikul, O.; Limmatvapirat, S. Effect of Cremophor RH40, Hydroxypropyl Methylcellulose, and Mixing Speed on Physicochemical Properties of Films Containing Nanostructured Lipid Carriers Loaded with Furosemide Using the Box–Behnken Design. Polymers 2024, 16, 1605. [Google Scholar] [CrossRef]
- Podlesnaia, E.; Stanca, S. E.; Çinçin, B.; Zieger, G.; Csáki, A.; Fritzsche, W. Customizable ligand exchange on the surface of gold nanotriangles enables their application in LSPR-based sensing. Nanoscale Adv. 2024, 6, 5430–5440. [Google Scholar] [CrossRef] [PubMed]
- Marcos; Cabaleiro, D.; Guimarey, M.; Comuñas, M.; Fedele, L.; Fernández, J.; Lugo, L. PEG 400-Based Phase Change Materials Nano-Enhanced with Functionalized Graphene Nanoplatelets. Nanomaterials 2017, 8, 16. [Google Scholar] [CrossRef] [PubMed]
- Hung, Y.-C.; Hsieh, S.-C.; Hou, S.-R.; Kung, J.-Y.; Tang, C.-M.; Chang, C.-J. In Vivo Evaluation of PVP-Gelatin-Chitosan Composite Blended with Egg-Yolk Oil for Radiodermatitis. Appl. Sci. 2021, 11, 10290. [Google Scholar] [CrossRef]
- Mishra, H.; Behera, A.; Kar, S. S.; Dash, S.; Moharana, S.; Sagadevan, S. Development and Optimization of Cefuroxime Axetil Nanosuspension for Improved Oral Bioavailability: In-Vitro and In-Vivo Investigations. BioNanoScience 2023, 13, 2371–2384. [Google Scholar]
- Jermy, B. R.; Al-Jindan, R. Y.; Ravinayagam, V.; El-Badry, A. A. Anti-blastocystosis activity of antioxidant coated ZIF-8 combined with mesoporous silicas MCM-41 and KIT-6. Sci. Rep. 2022, 12, 6403. [Google Scholar] [CrossRef]
- Breßler; Kohlbrecher, J.; Thünemann, A. F. SASfit: a tool for small-angle scattering data analysis using a library of analytical expressions. J. Appl. Crystallogr. 2015, 48, 1587–1598. [Google Scholar] [CrossRef]
- Rocha, V.; Marques, C.; Figueiredo, J. L.; Gaio, A. R.; Costa, P. C.; Sousa Lobo, J. M.; Almeida, I. F. In vitro cytotoxicity evaluation of resveratrol-loaded nanoparticles: Focus on the challenges of in vitro methodologies. Food Chem. Toxicol. 2017, 103, 214–222. [Google Scholar] [CrossRef]
Figure 1.
Pareto charts revealing the significant factors in the composition of the formulations for each PSD response (A) %p≤500nm (B) Average diameter (μm) (C) SPAM (D) UR.
Figure 1.
Pareto charts revealing the significant factors in the composition of the formulations for each PSD response (A) %p≤500nm (B) Average diameter (μm) (C) SPAM (D) UR.
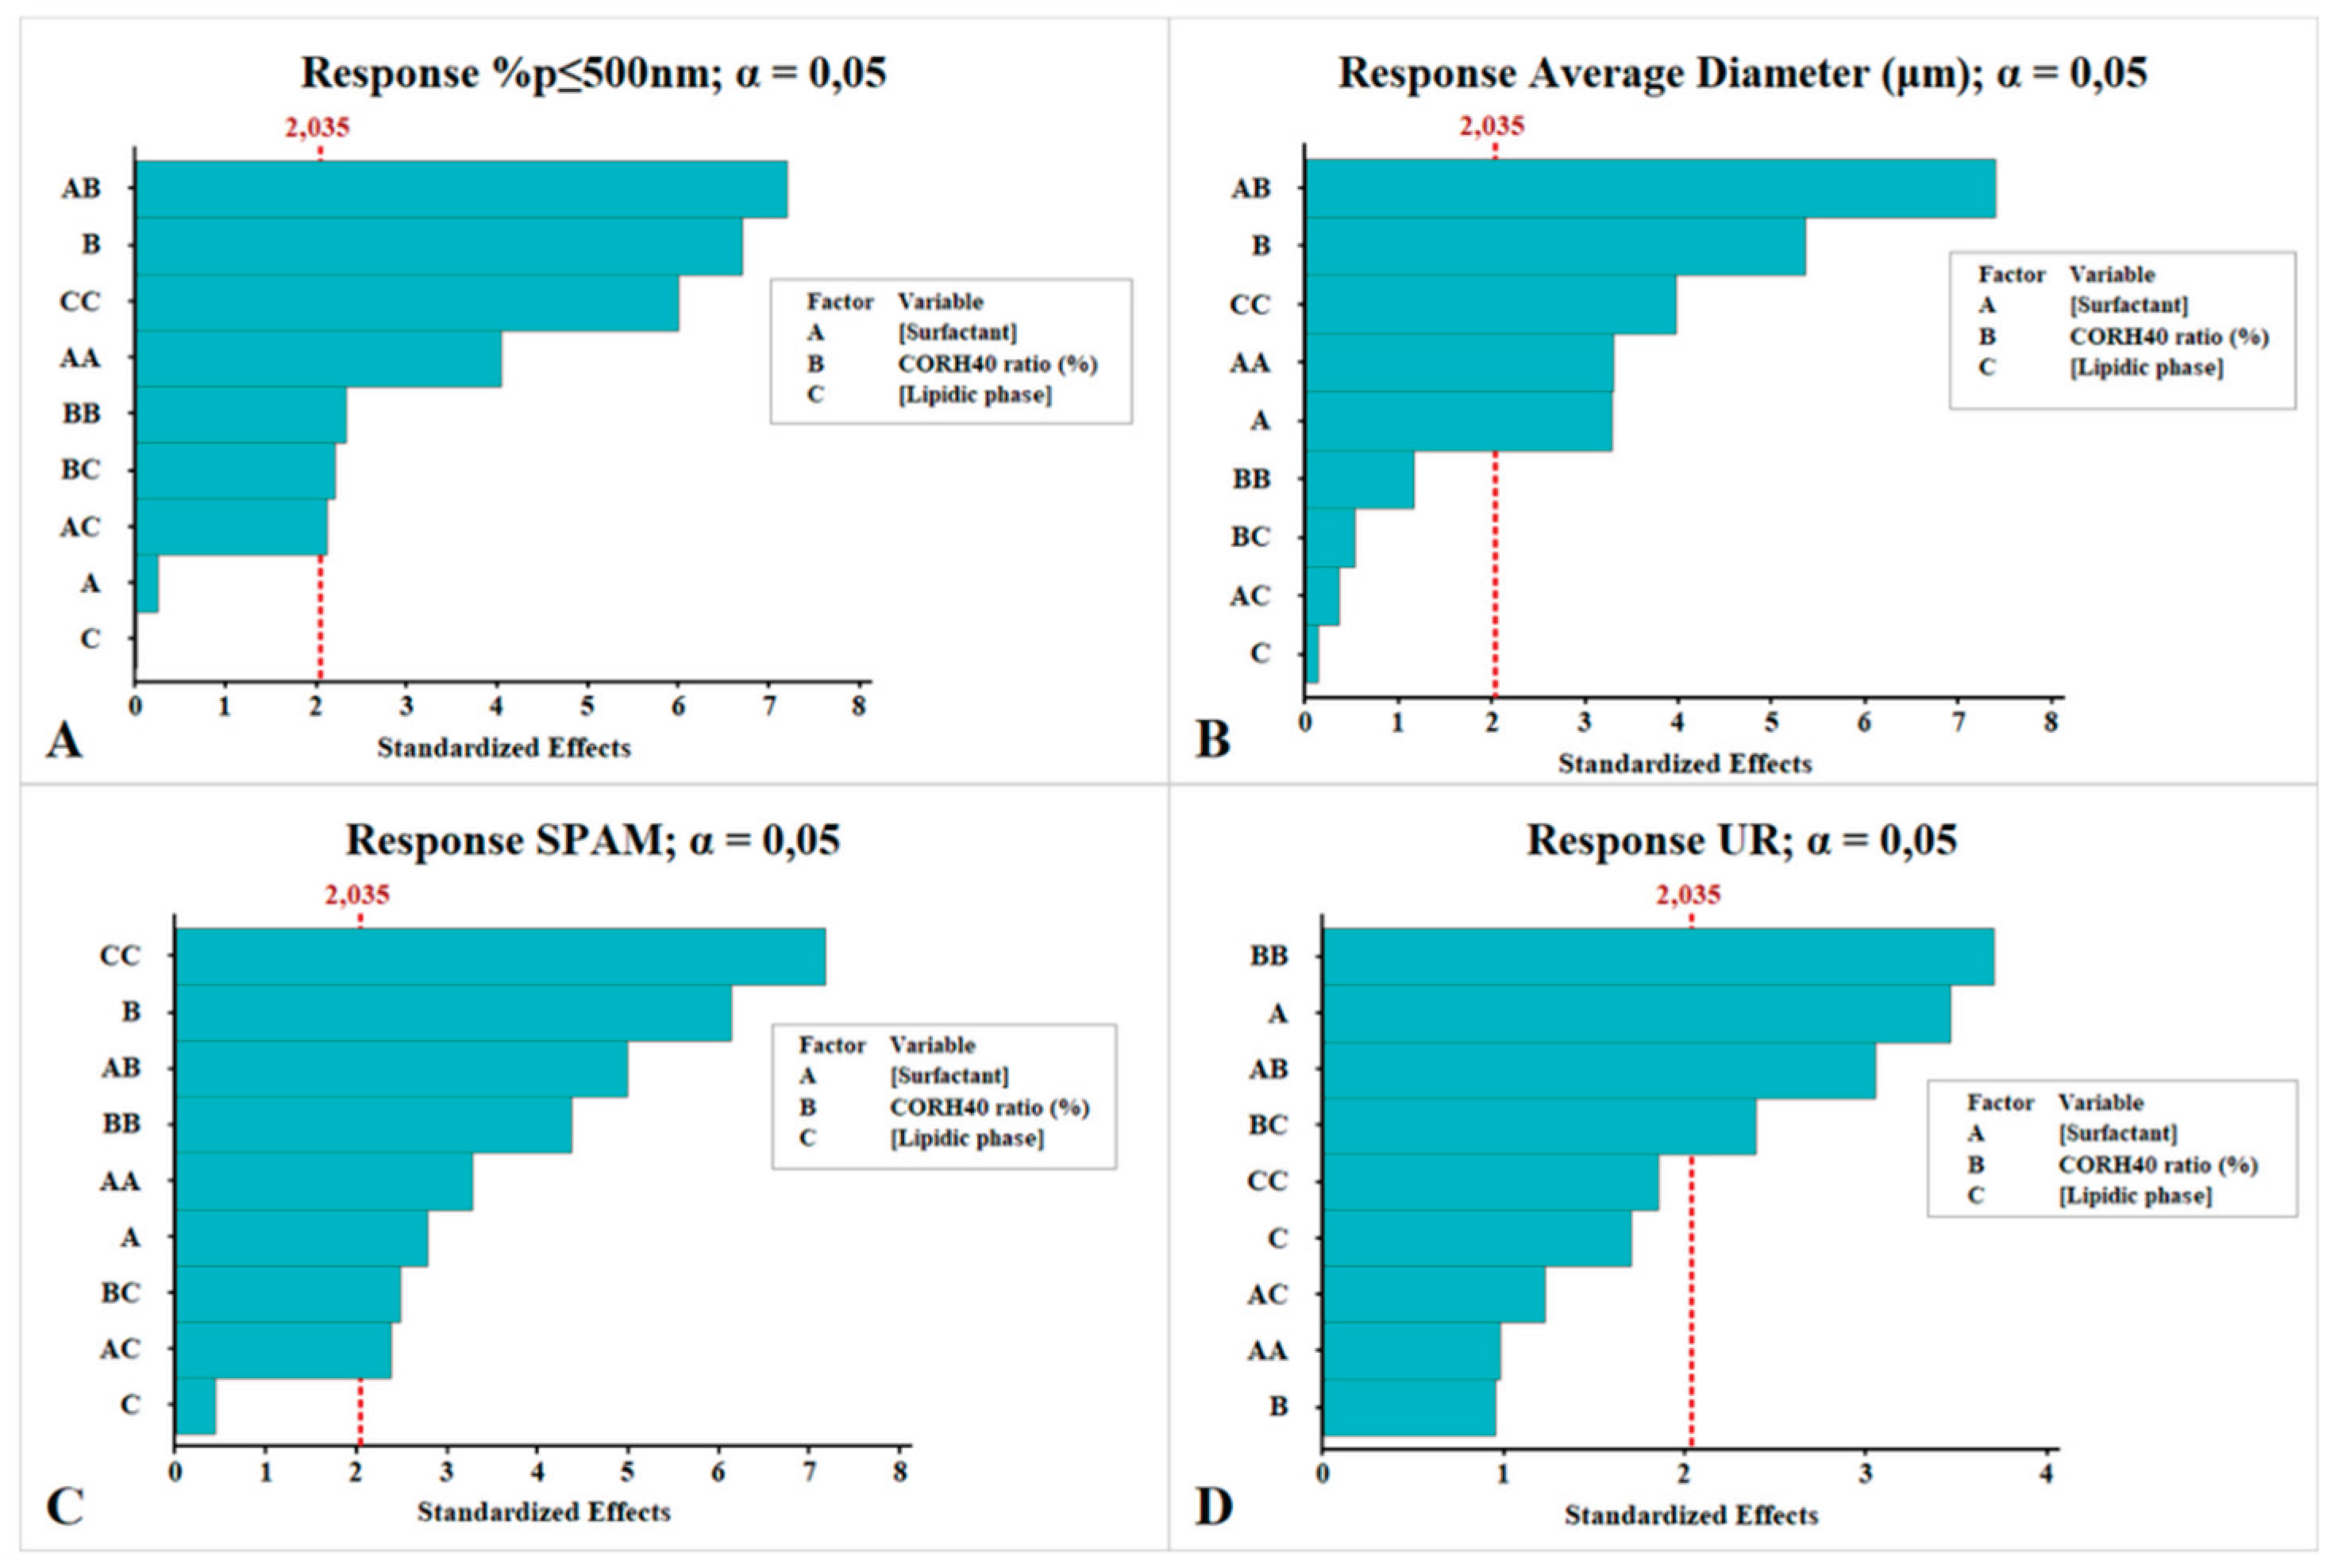
Figure 2.
Contour plots generated by RSM for different interactions between formulation composition variables to optimize PSD values. (A) %p≤ 500nm (B) average diameter (µm) (C) SPAM, (D) UR.
Figure 2.
Contour plots generated by RSM for different interactions between formulation composition variables to optimize PSD values. (A) %p≤ 500nm (B) average diameter (µm) (C) SPAM, (D) UR.
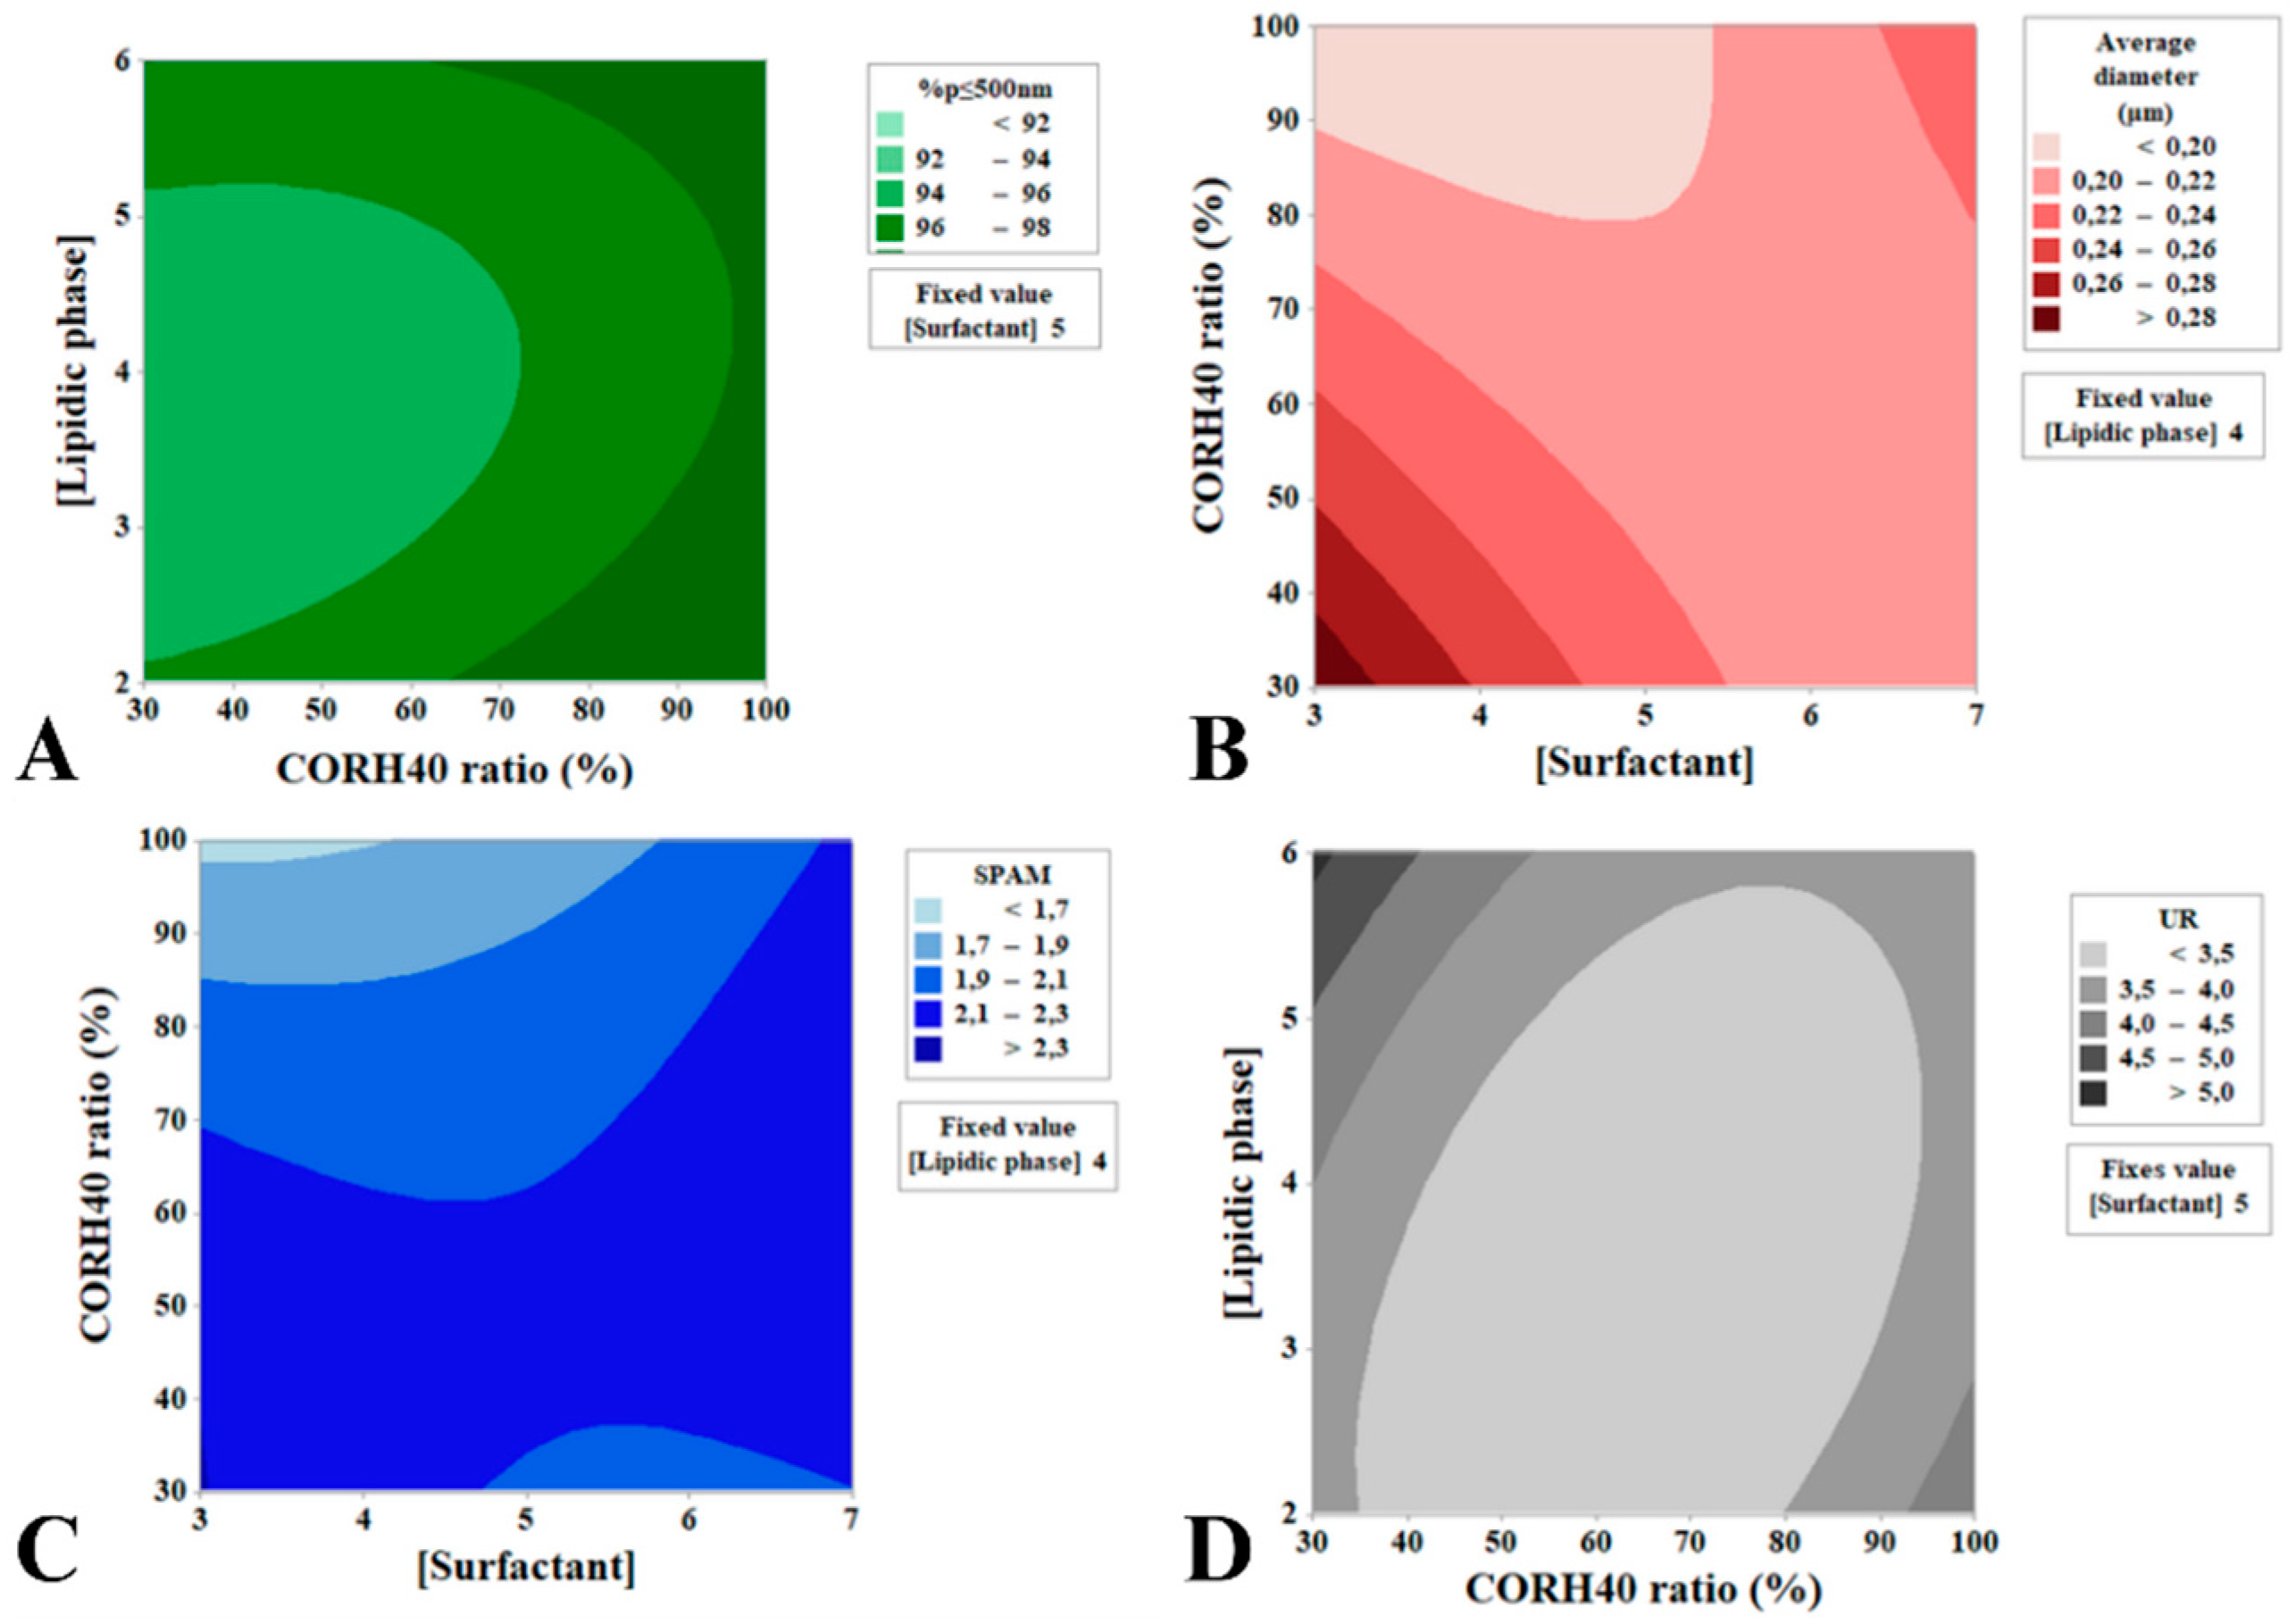
Figure 3.
Preliminary stability of optimized formulation (A) %p≤ 500nm and average diameter (µm), (B) SPAM and UR (C) Aspect.
Figure 3.
Preliminary stability of optimized formulation (A) %p≤ 500nm and average diameter (µm), (B) SPAM and UR (C) Aspect.
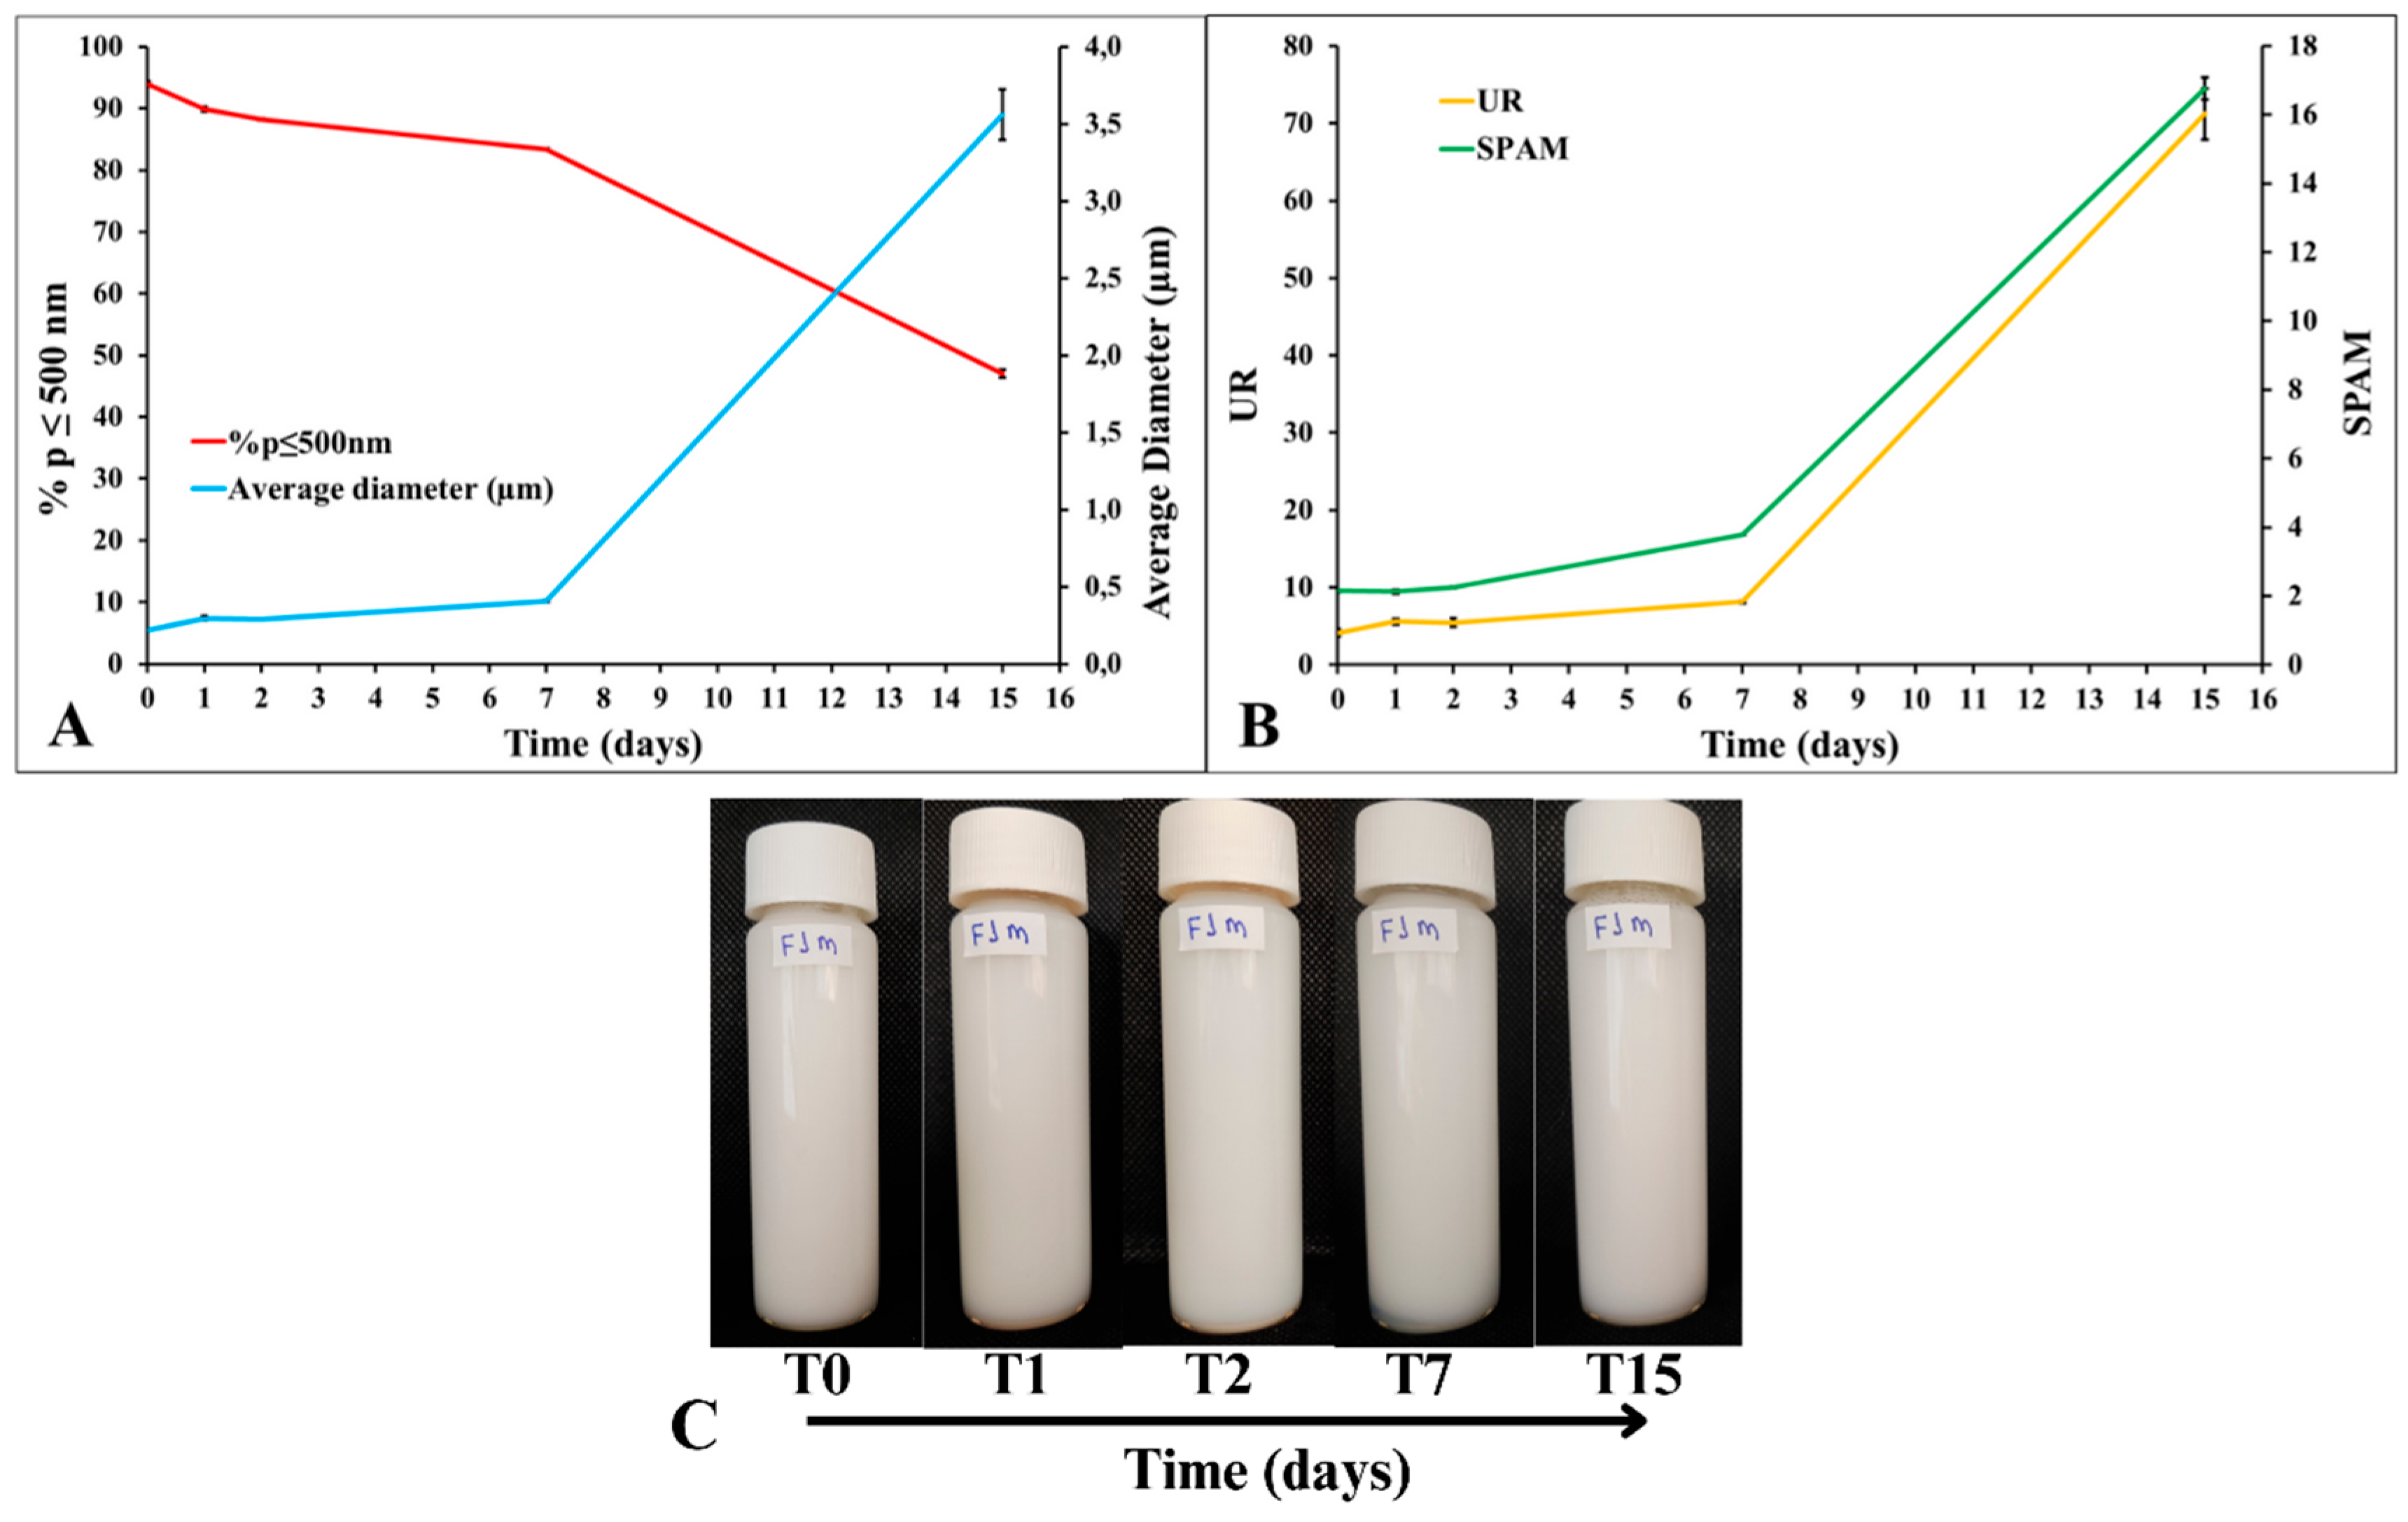
Figure 4.
Pareto charts showing the significant process factors for each response related to particle size distribution (A) %p≤500nm (B) Average diameter (μm) (C) SPAM (D) UR.
Figure 4.
Pareto charts showing the significant process factors for each response related to particle size distribution (A) %p≤500nm (B) Average diameter (μm) (C) SPAM (D) UR.
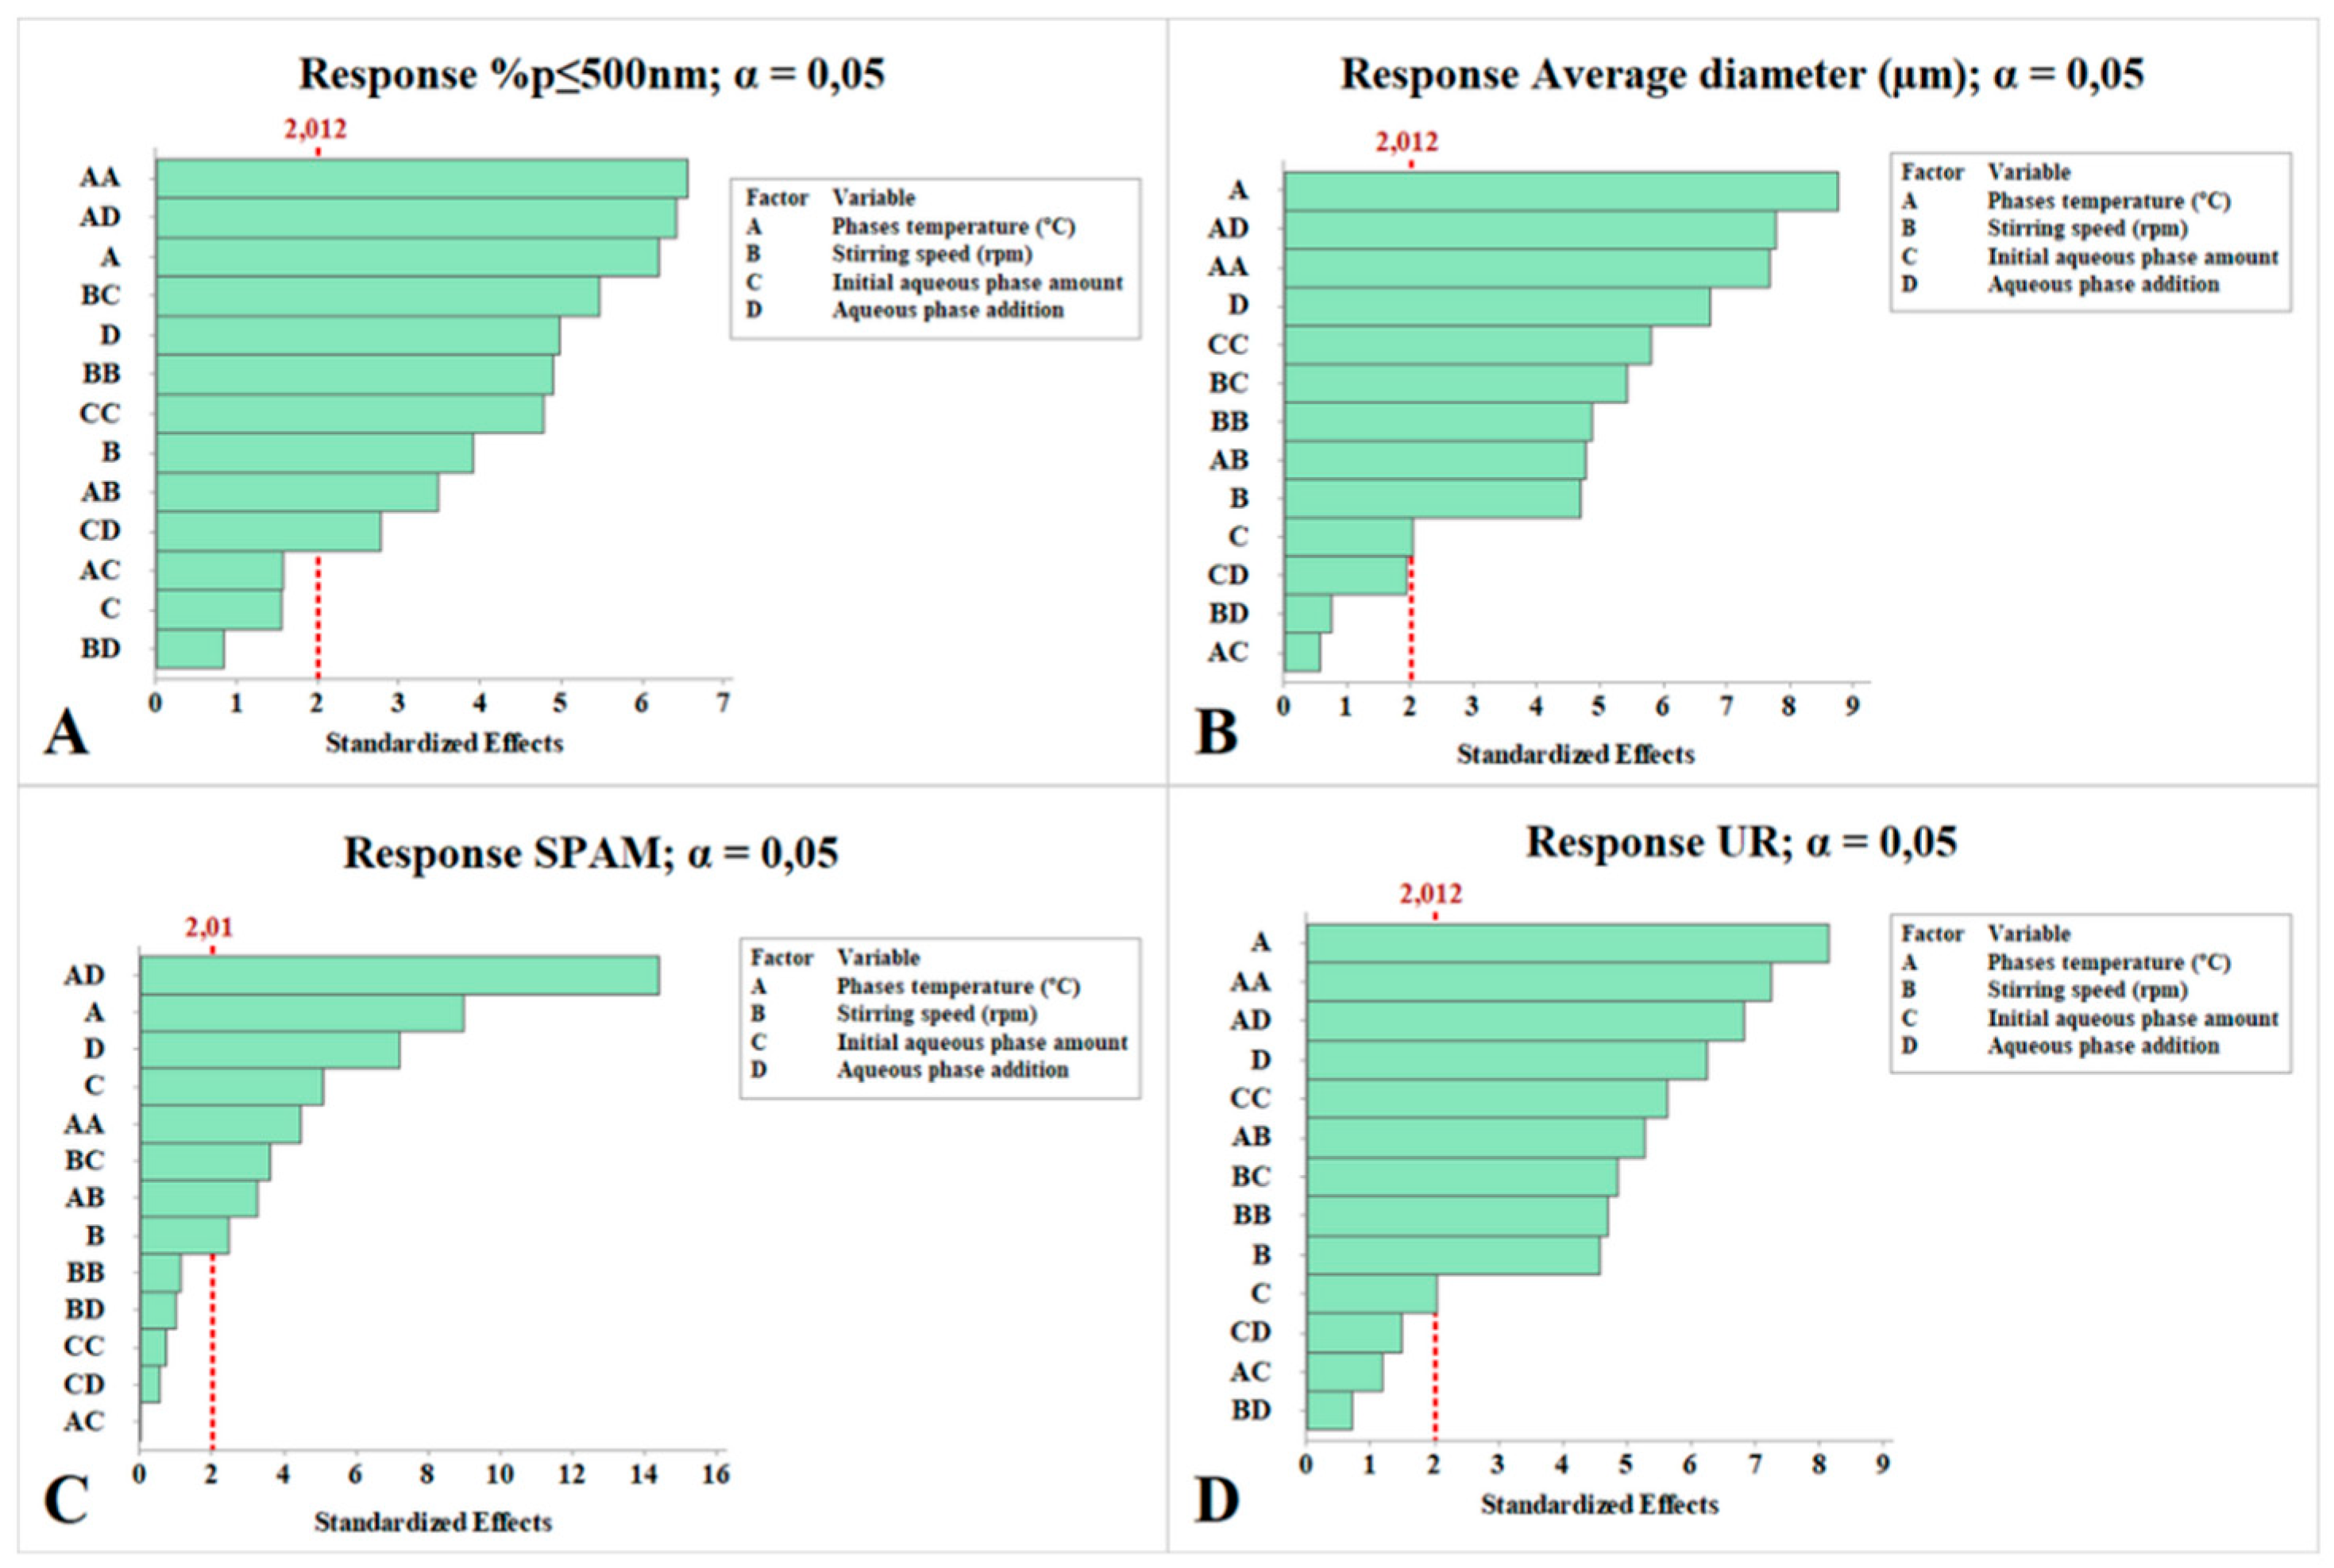
Figure 5.
Contour plots generated by RSM for different interactions among the process variables.
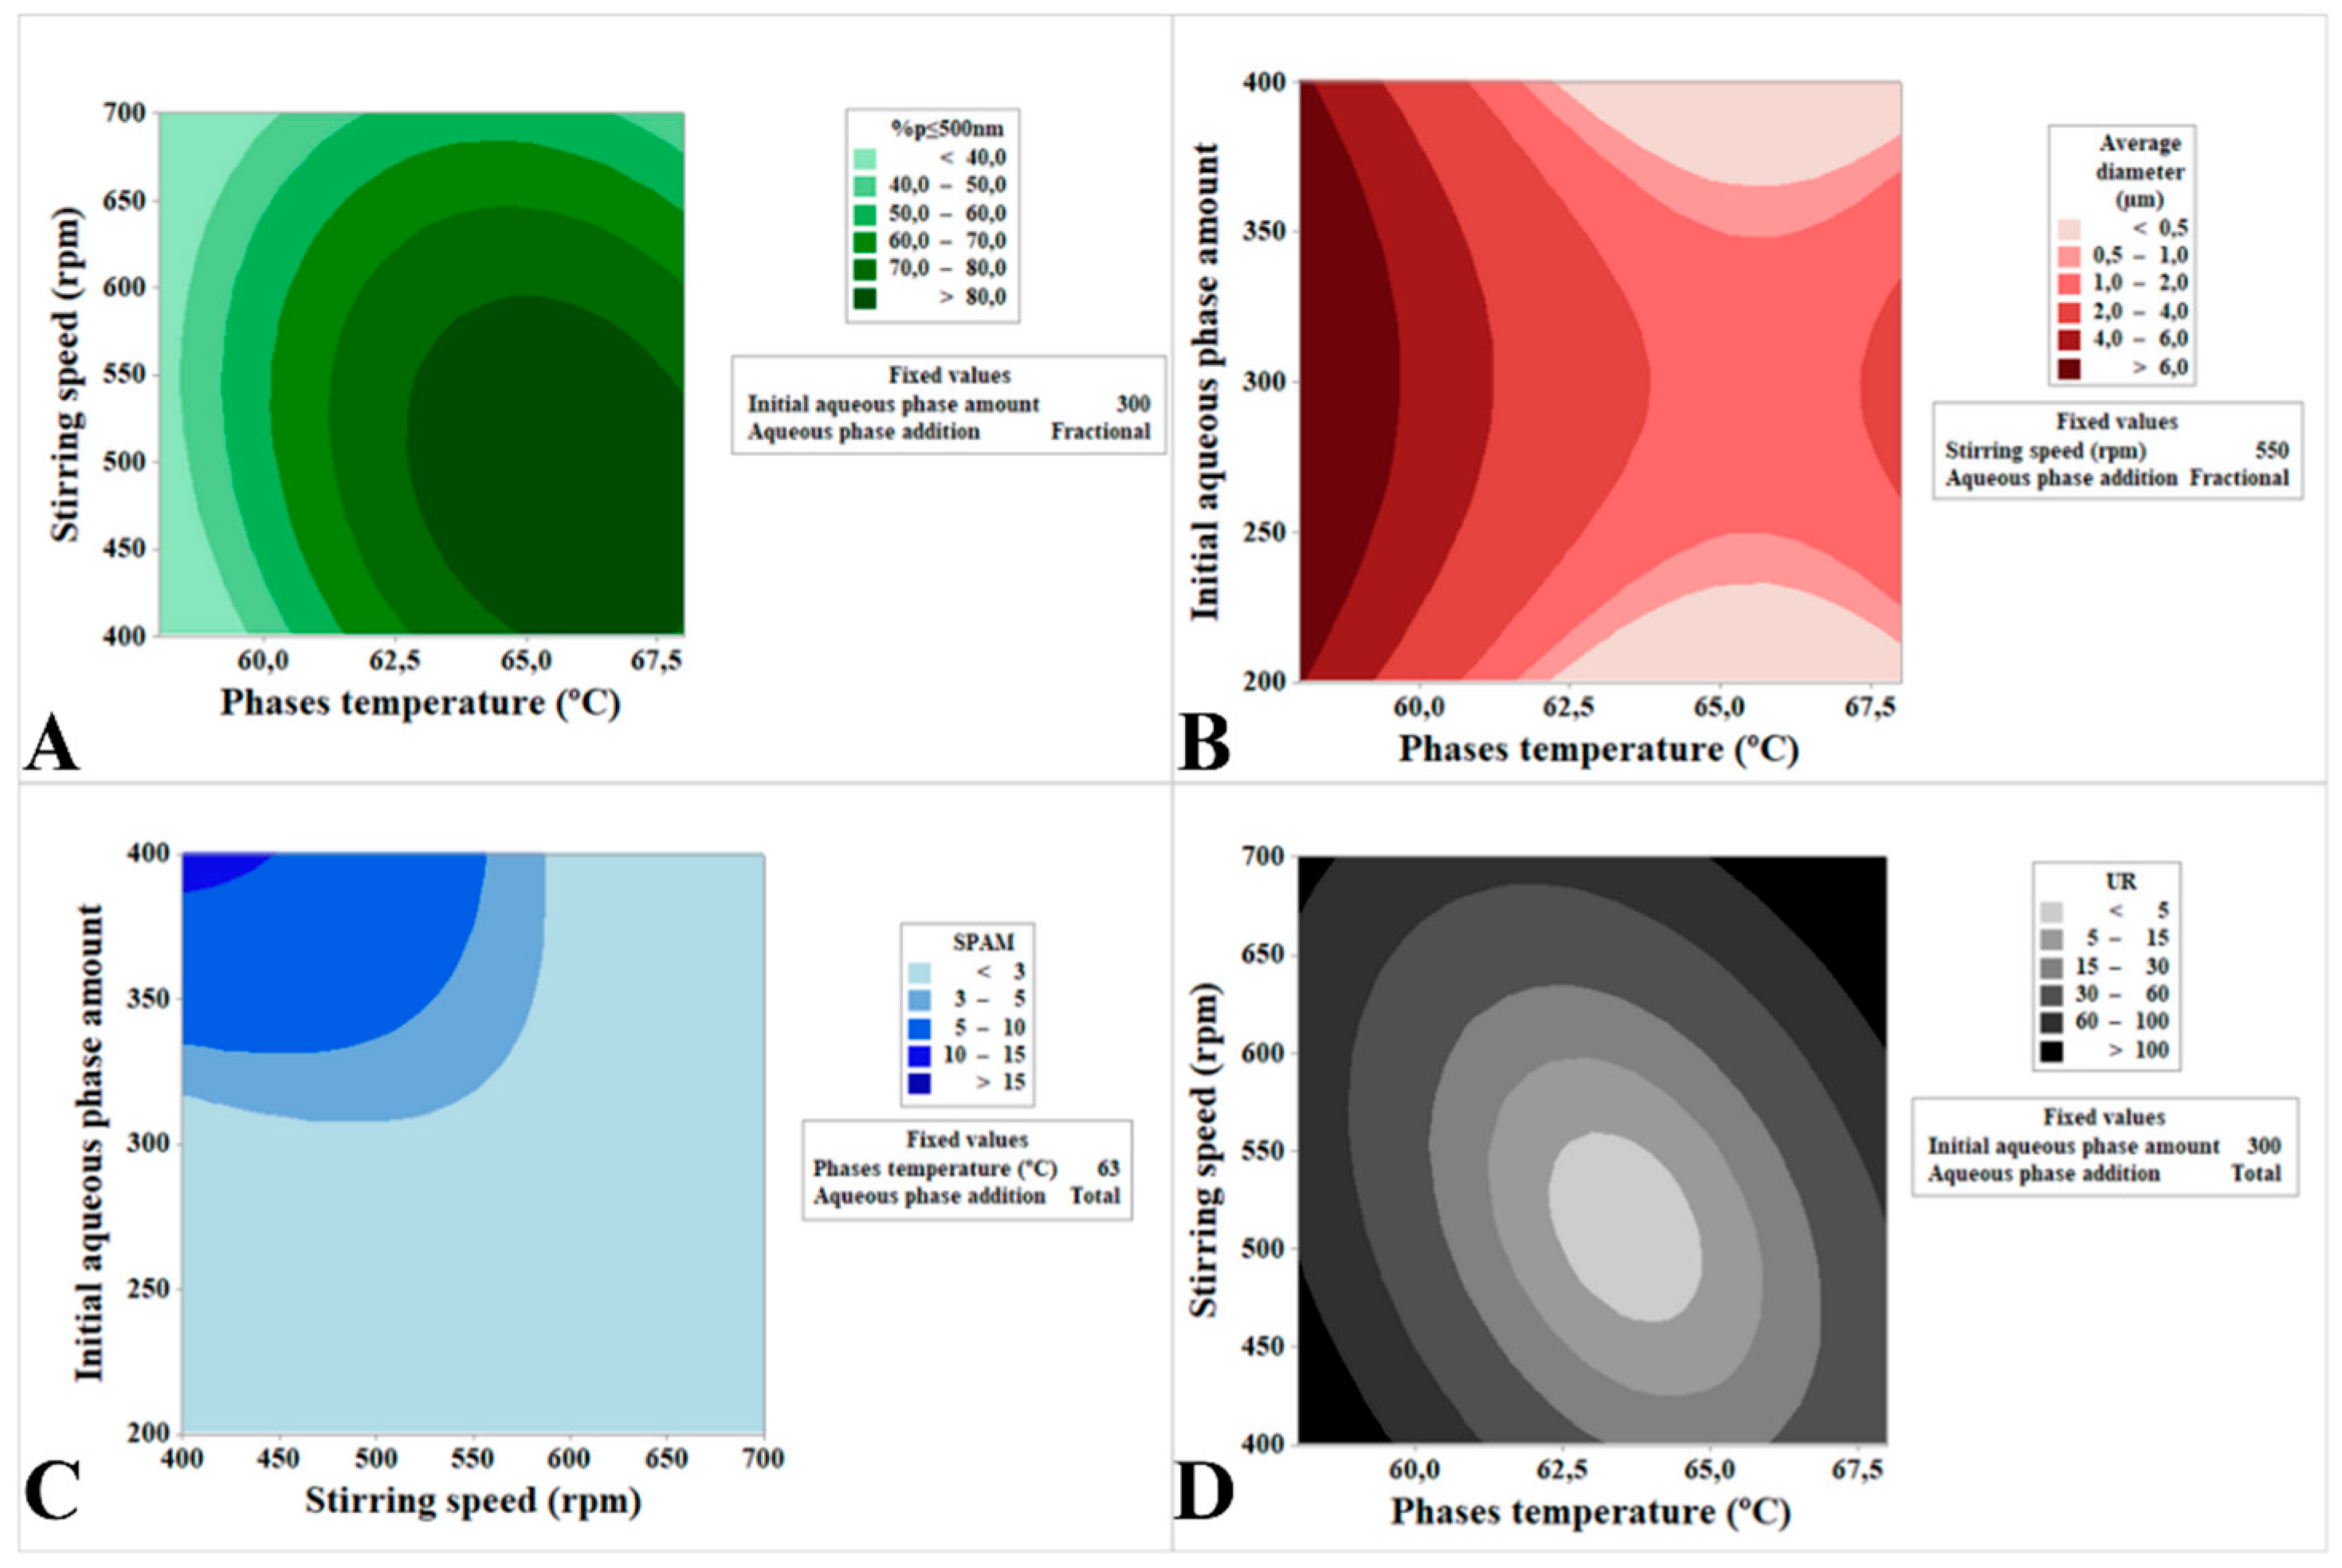
Figure 6.
Stability of the optimized and scaled-up NLC formulation. * means p < 0,05; OFE: optimized formulation, SFE: scaled-up formulation, (A) % p≤500nm, (B) average diameter (µm), (C) SPAM (D) UR, (E) OFE aspect, (F) SFE aspect, T0: preparation day, T15: 15-days after preparation.
Figure 6.
Stability of the optimized and scaled-up NLC formulation. * means p < 0,05; OFE: optimized formulation, SFE: scaled-up formulation, (A) % p≤500nm, (B) average diameter (µm), (C) SPAM (D) UR, (E) OFE aspect, (F) SFE aspect, T0: preparation day, T15: 15-days after preparation.
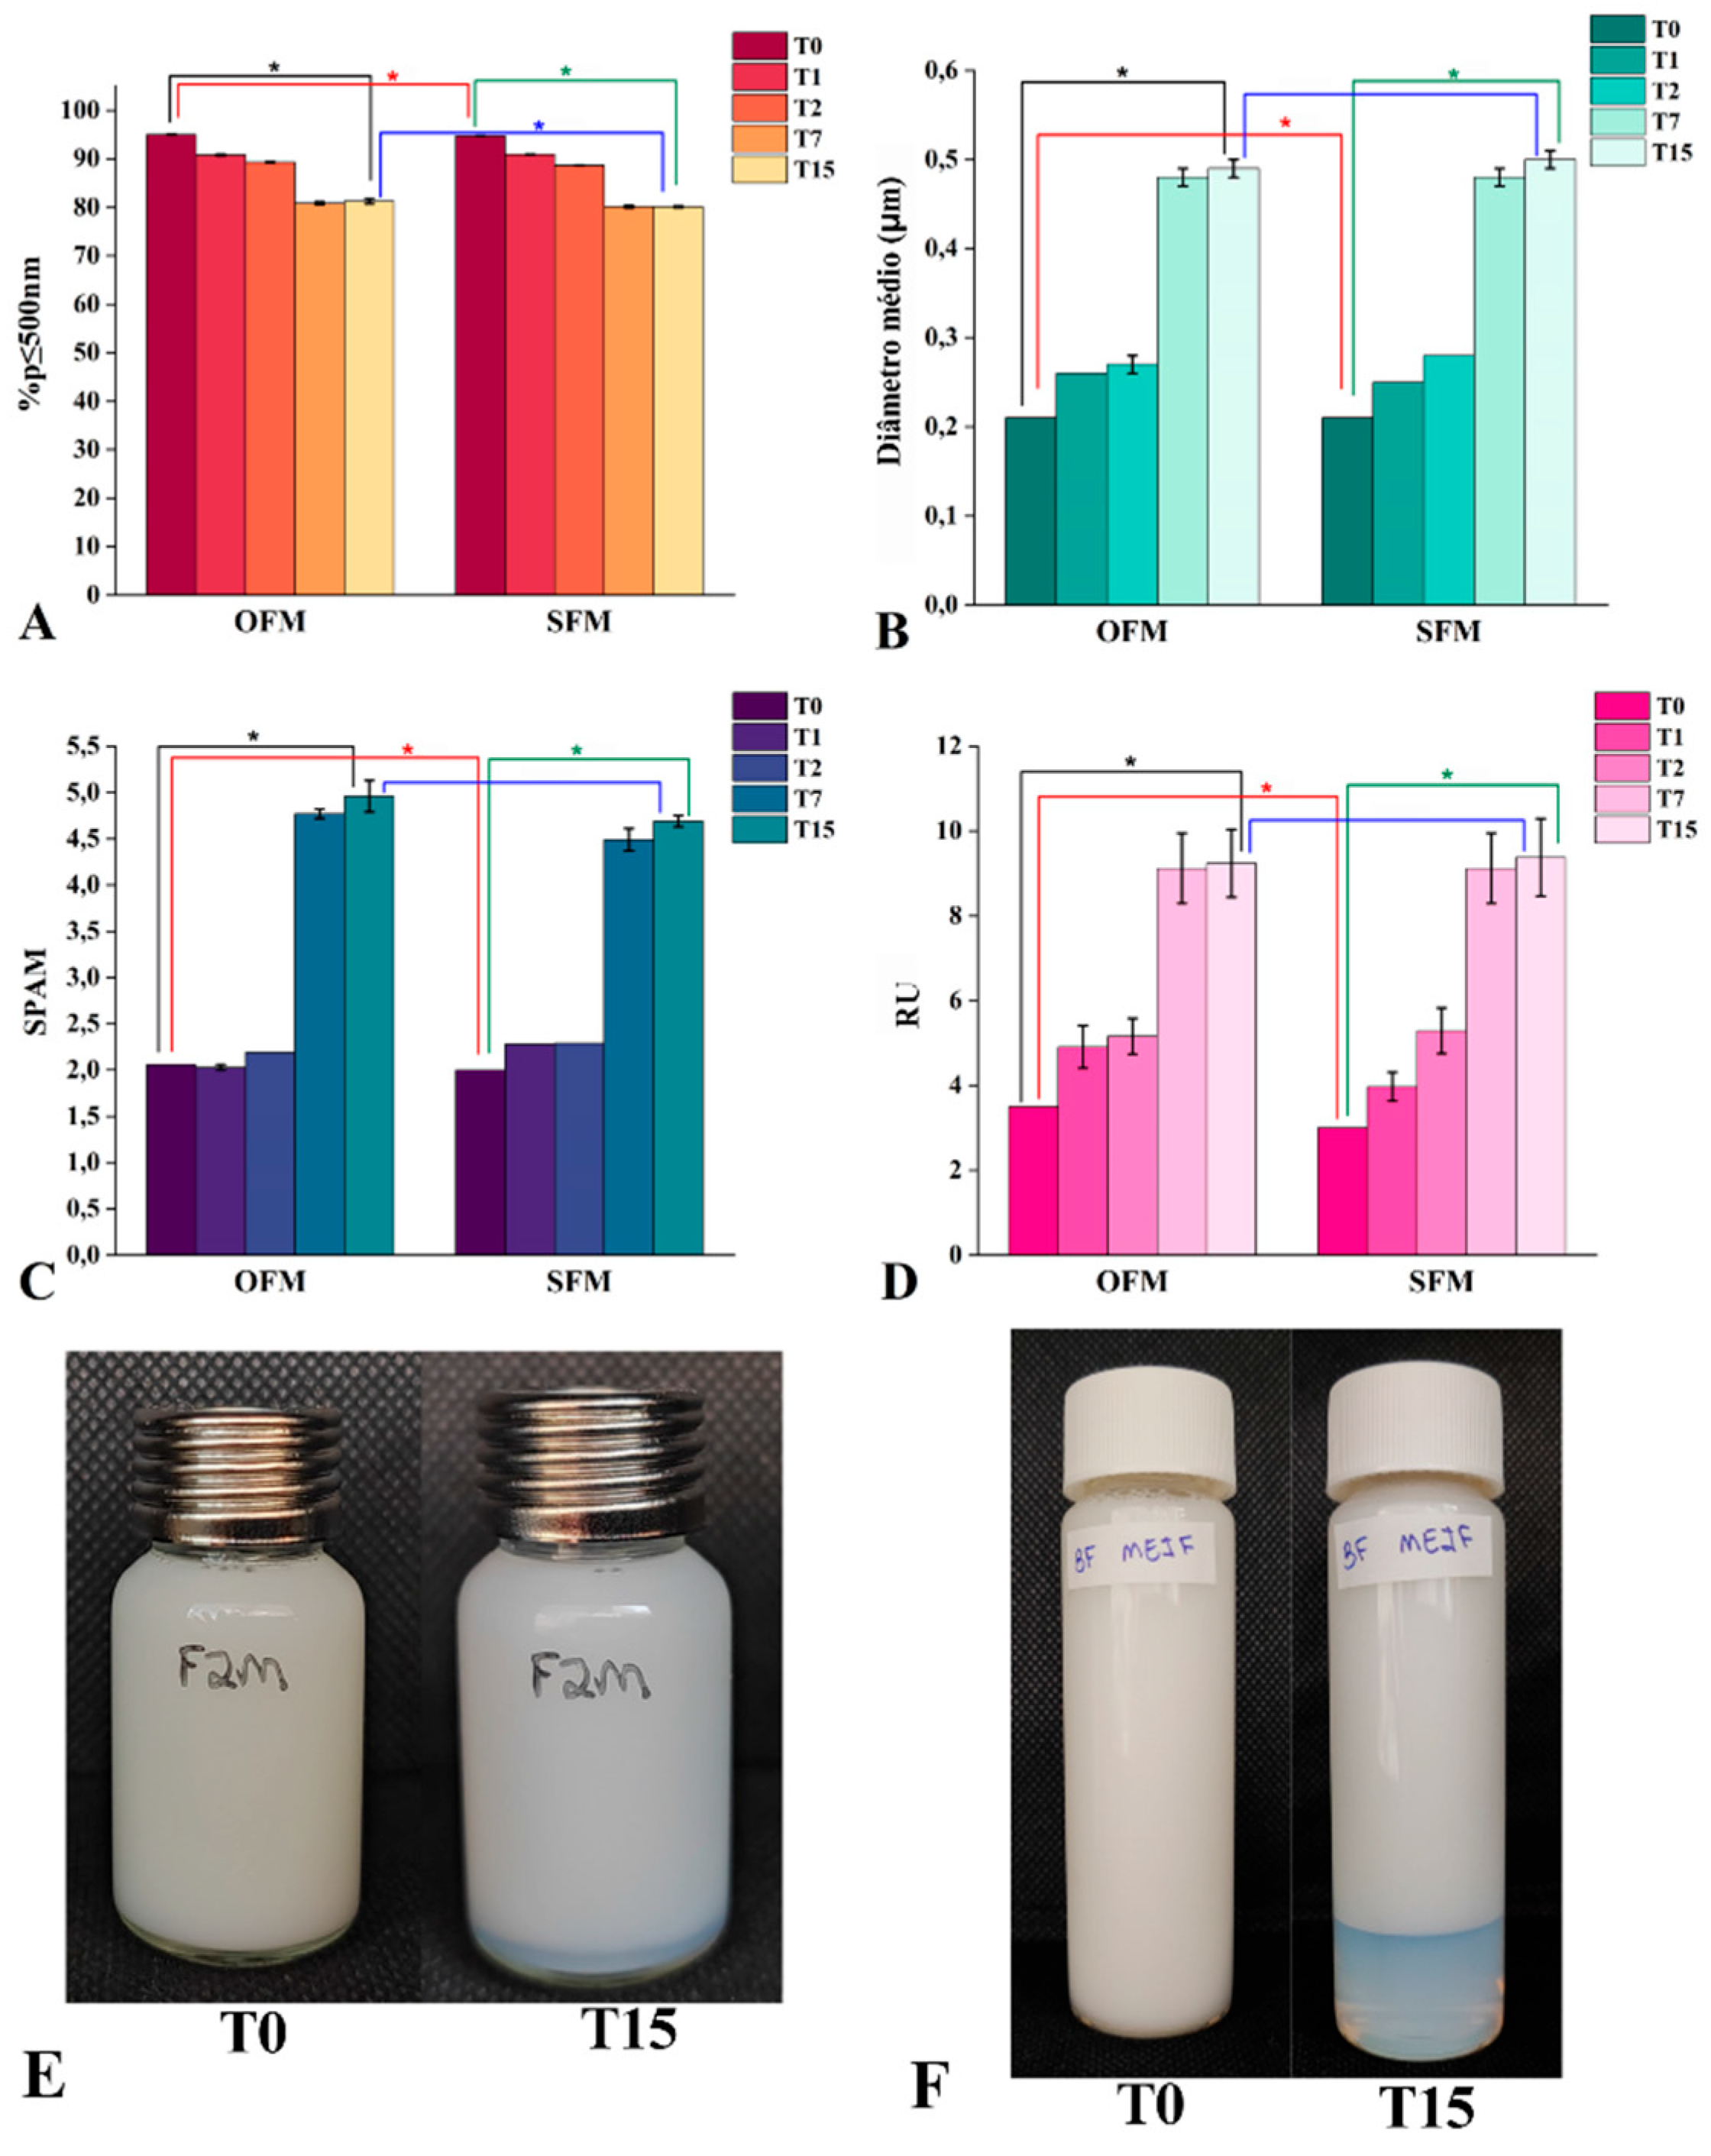
Figure 7.
Preliminary stability of NLC formulations with added ionic surfactants: (A) Particle size and PDI, (B) Zeta potential, (C) Visual appearance of the formulations.
Figure 7.
Preliminary stability of NLC formulations with added ionic surfactants: (A) Particle size and PDI, (B) Zeta potential, (C) Visual appearance of the formulations.
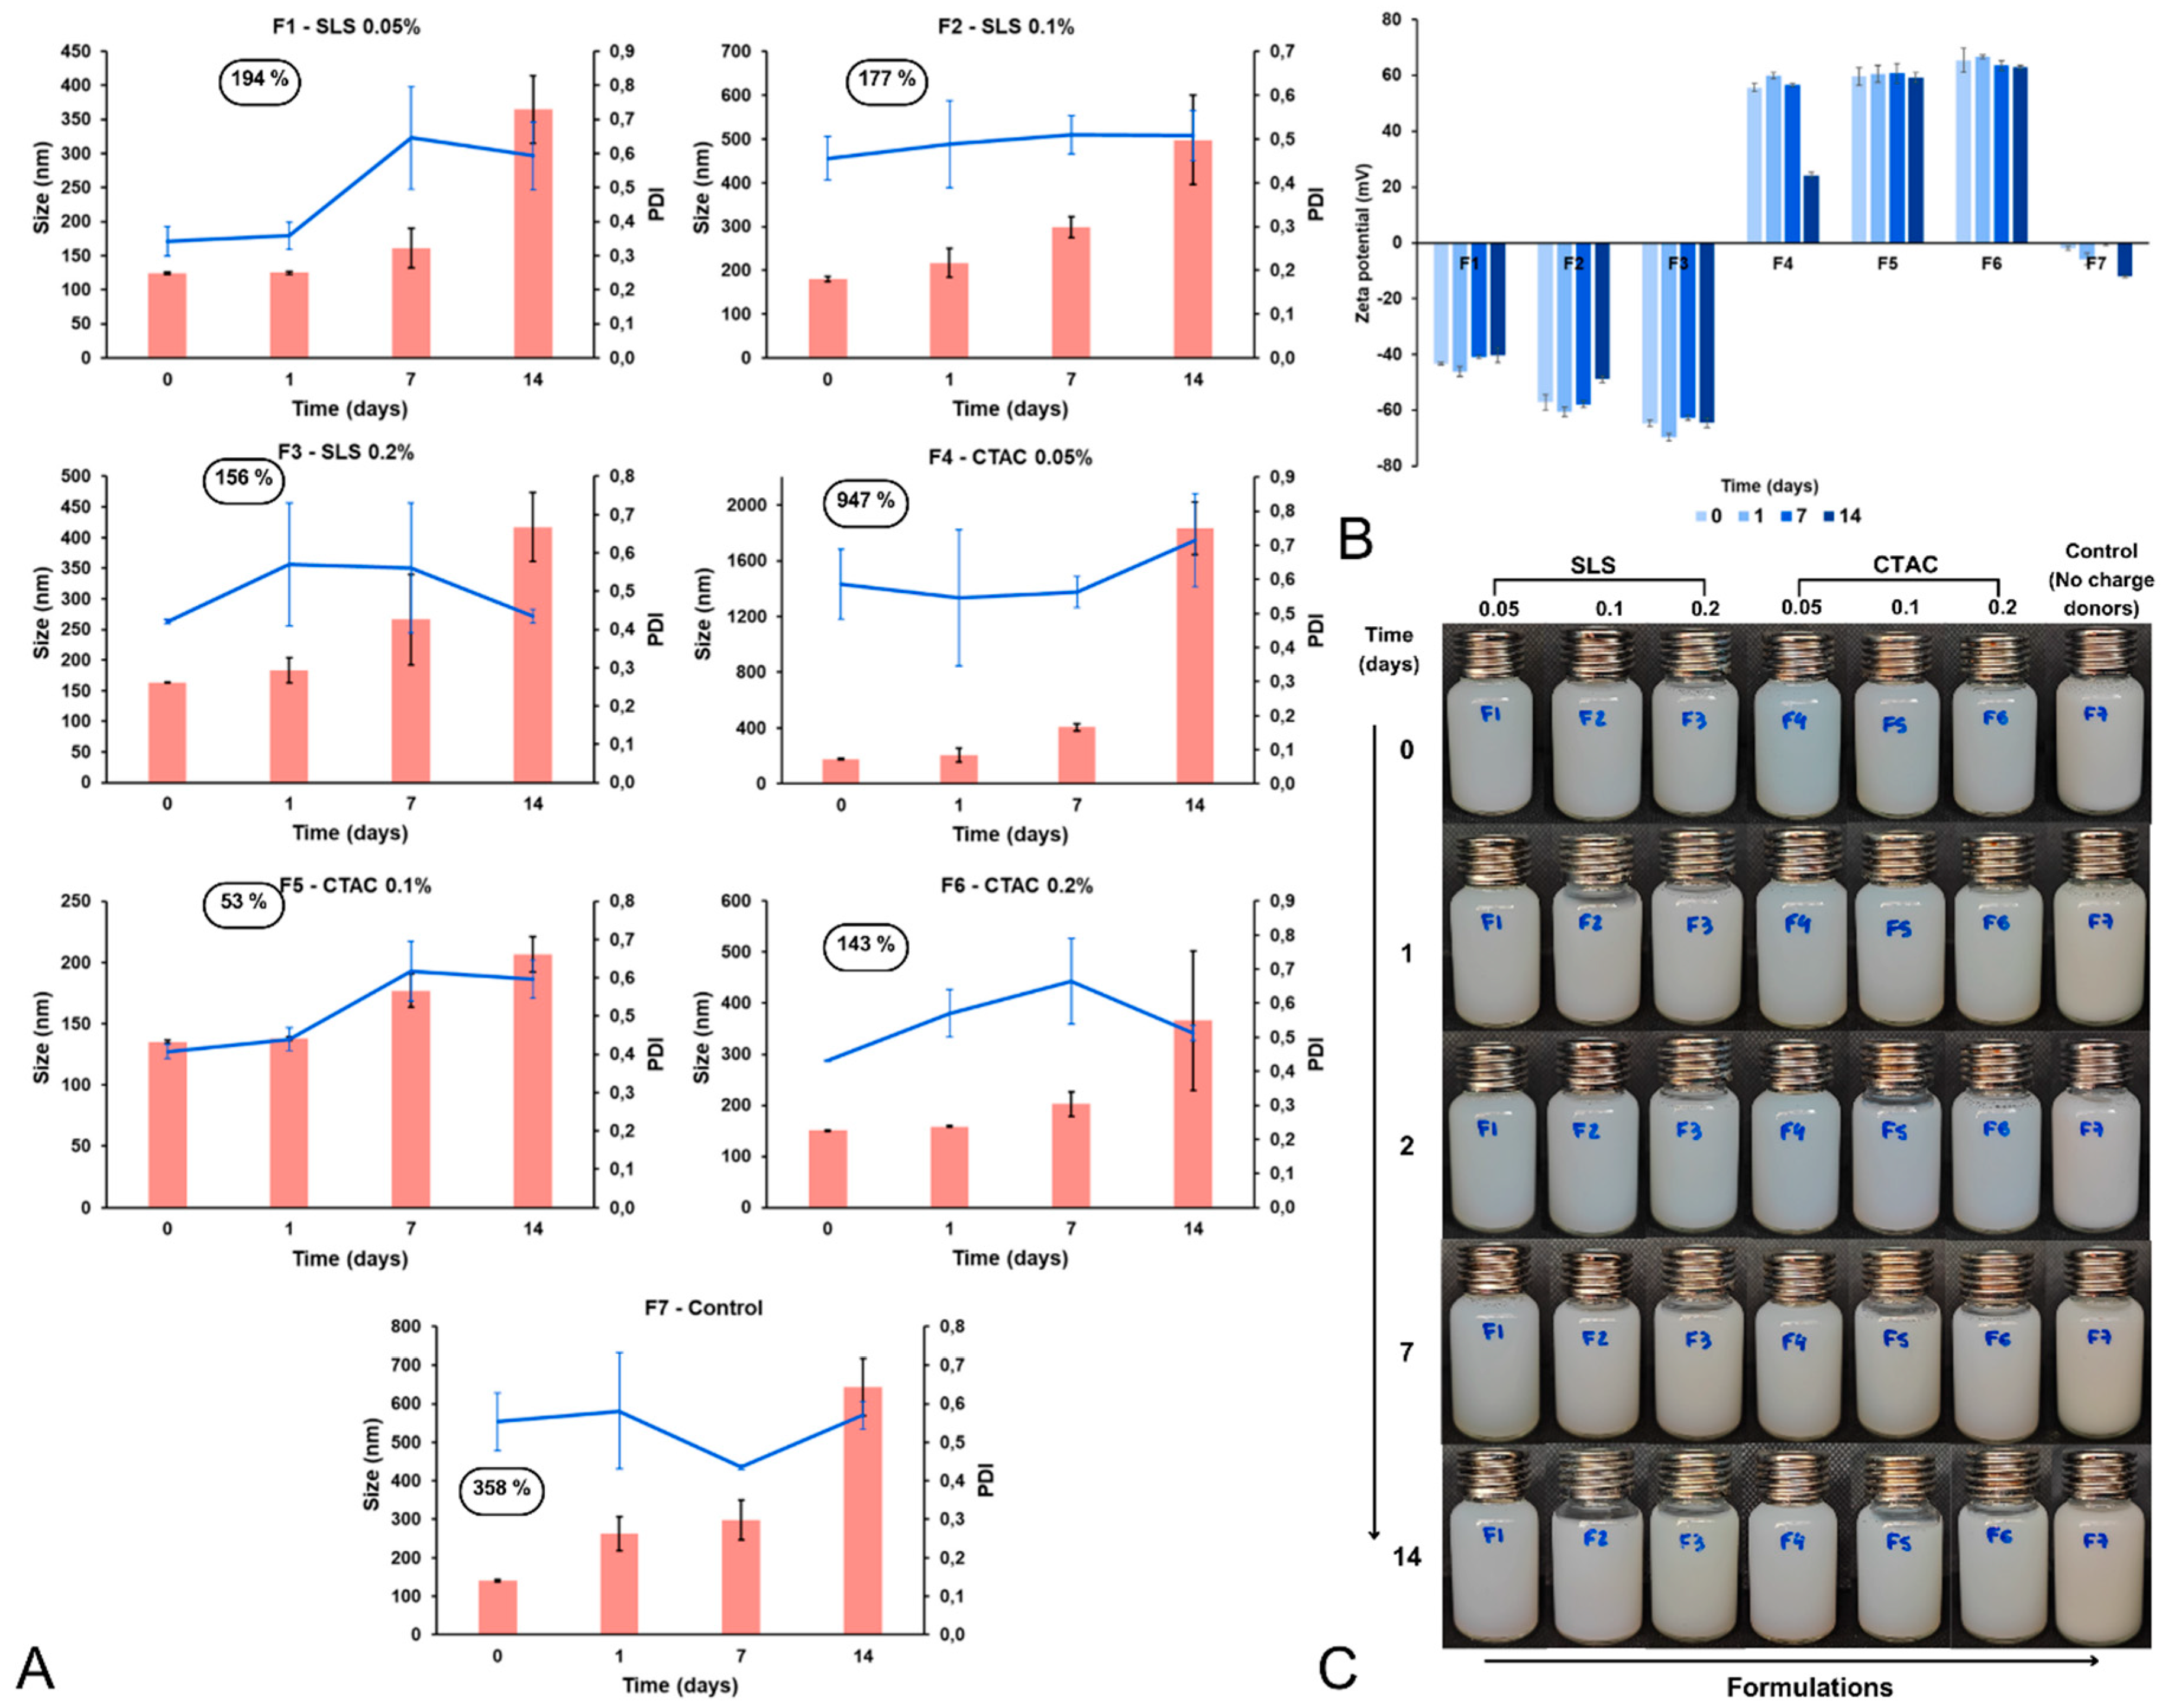
Figure 8.
Preliminary stability of NLC formulations with modified dispersion Polymer. (A) Particle size, (B) PDI, (C) zeta potential, (D) appearance of formulations. F1: PVP 2% – control (unmodified), F2: PVP 10%, F3: Poloxamer 2.5% + PVP 2%.
Figure 8.
Preliminary stability of NLC formulations with modified dispersion Polymer. (A) Particle size, (B) PDI, (C) zeta potential, (D) appearance of formulations. F1: PVP 2% – control (unmodified), F2: PVP 10%, F3: Poloxamer 2.5% + PVP 2%.
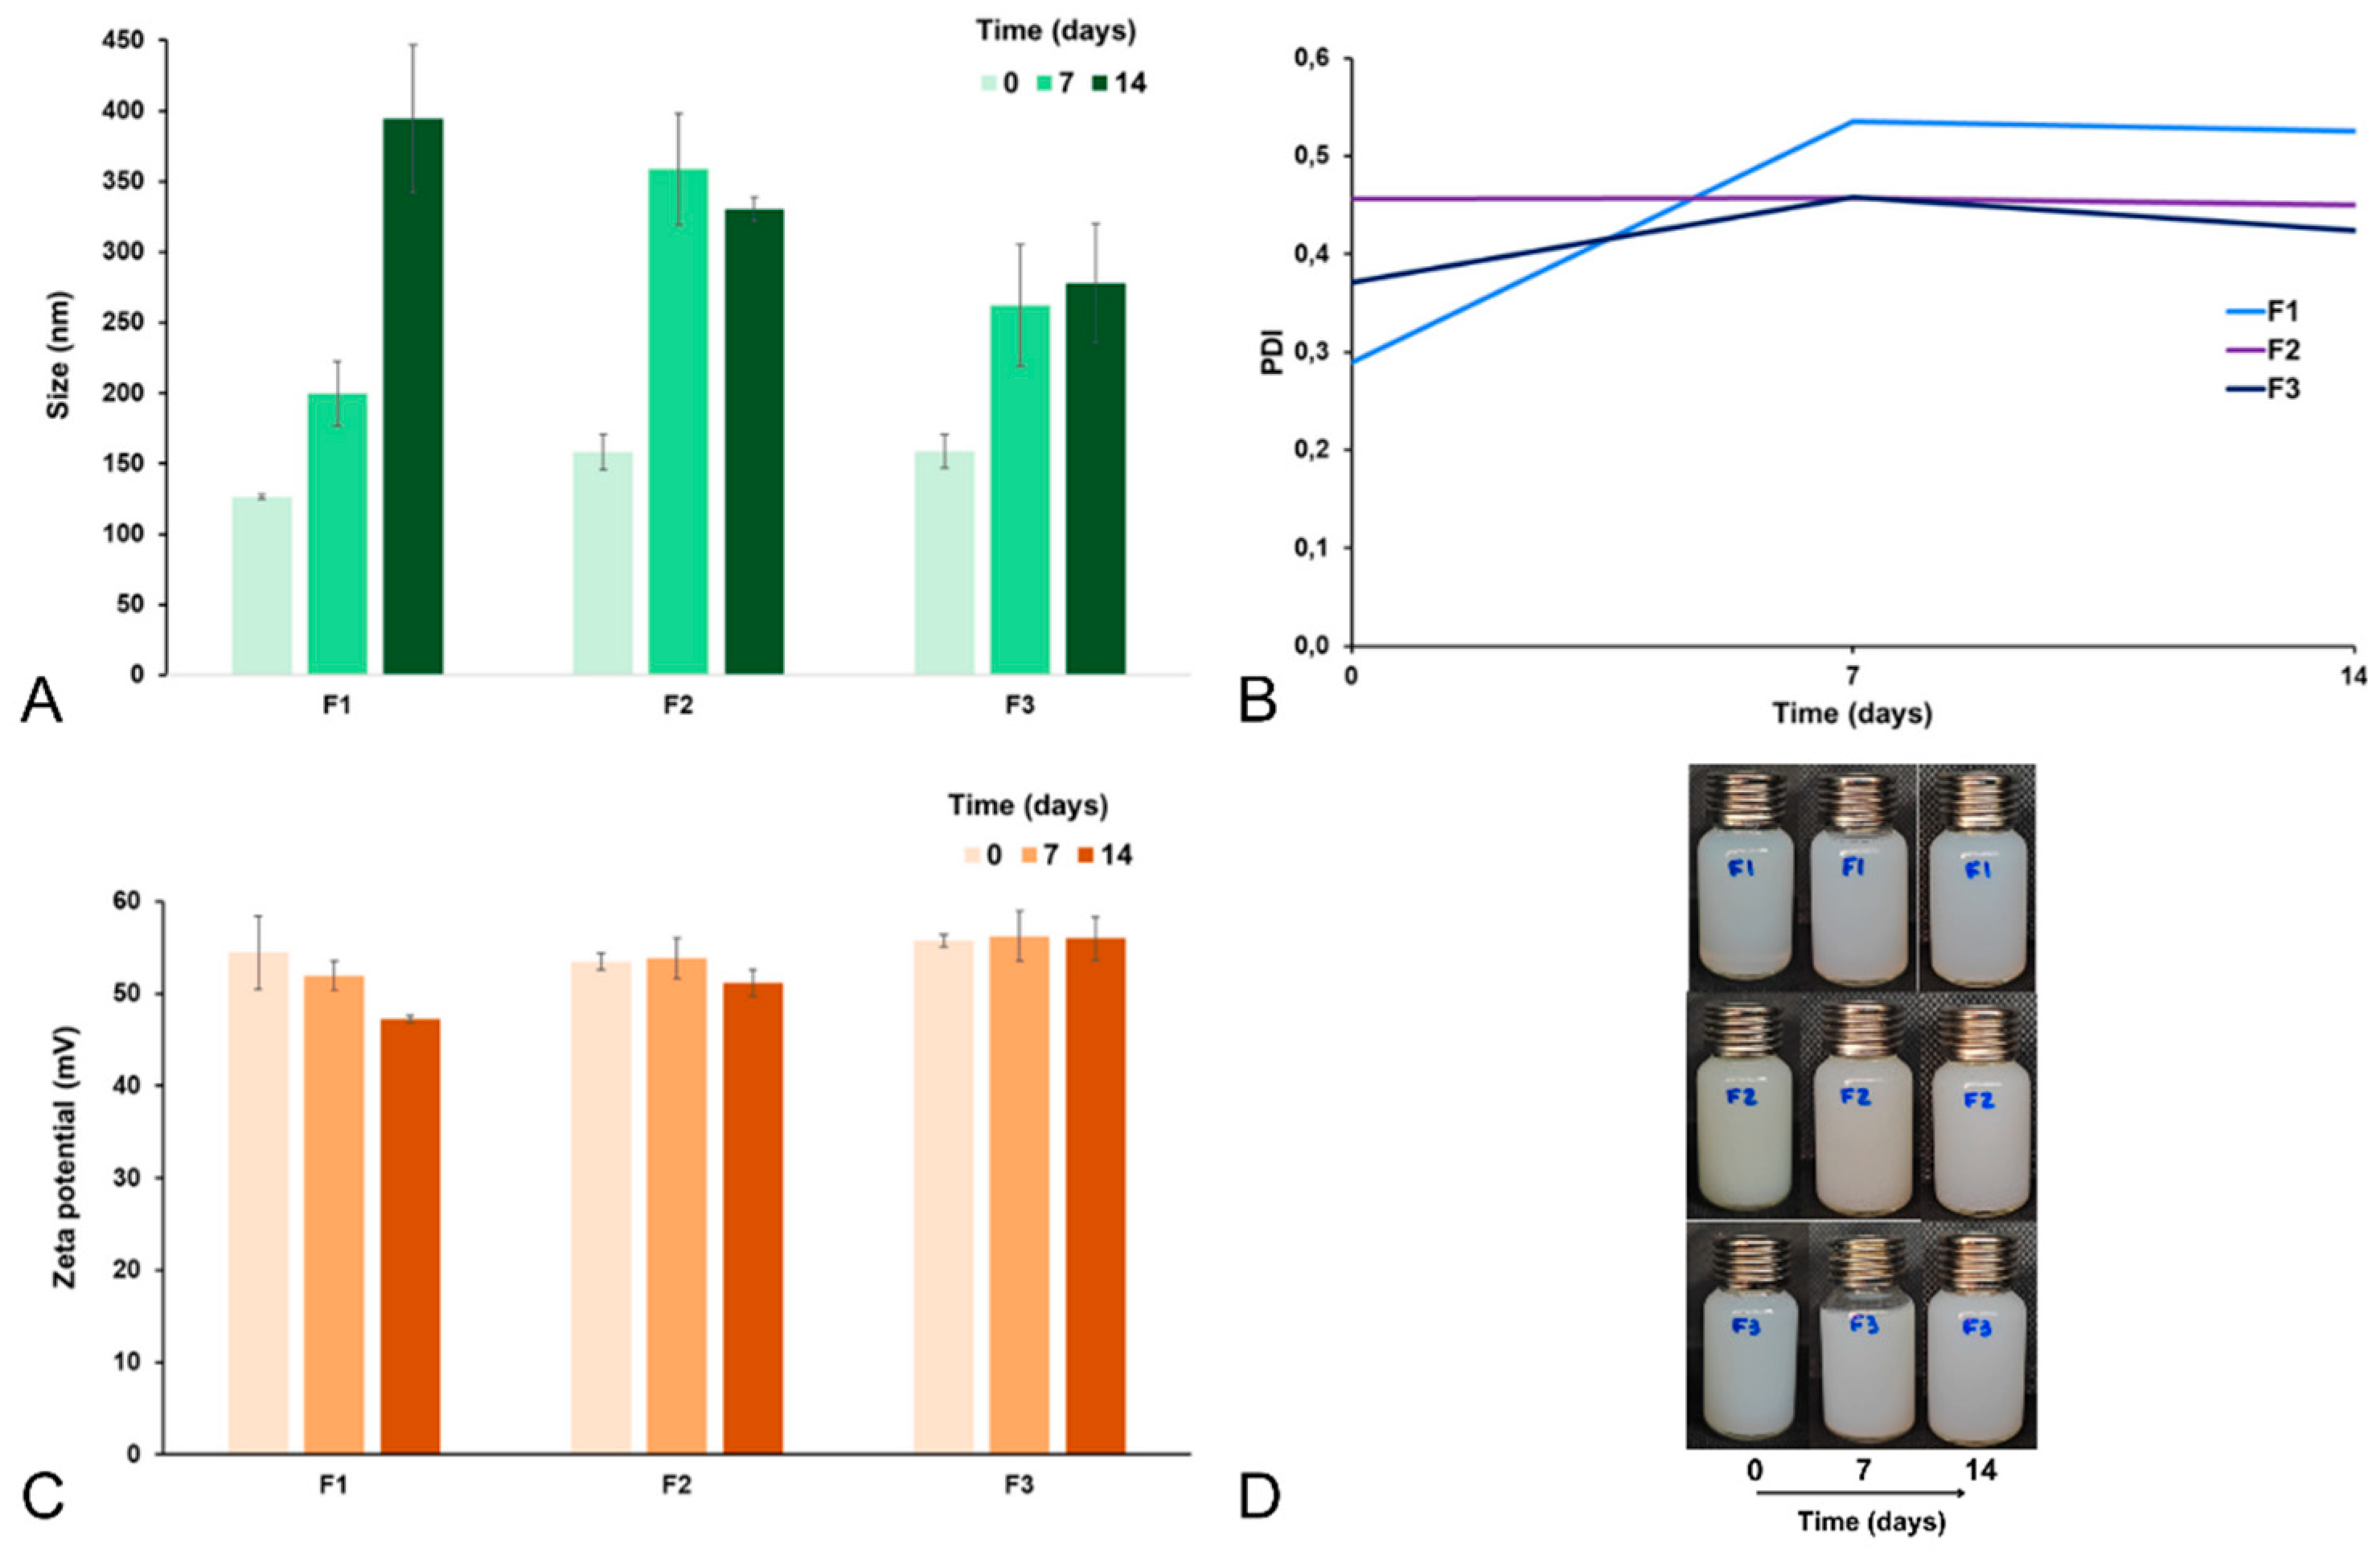
Figure 9.
Stability assessment of the formulations over 90 days at different temperatures.
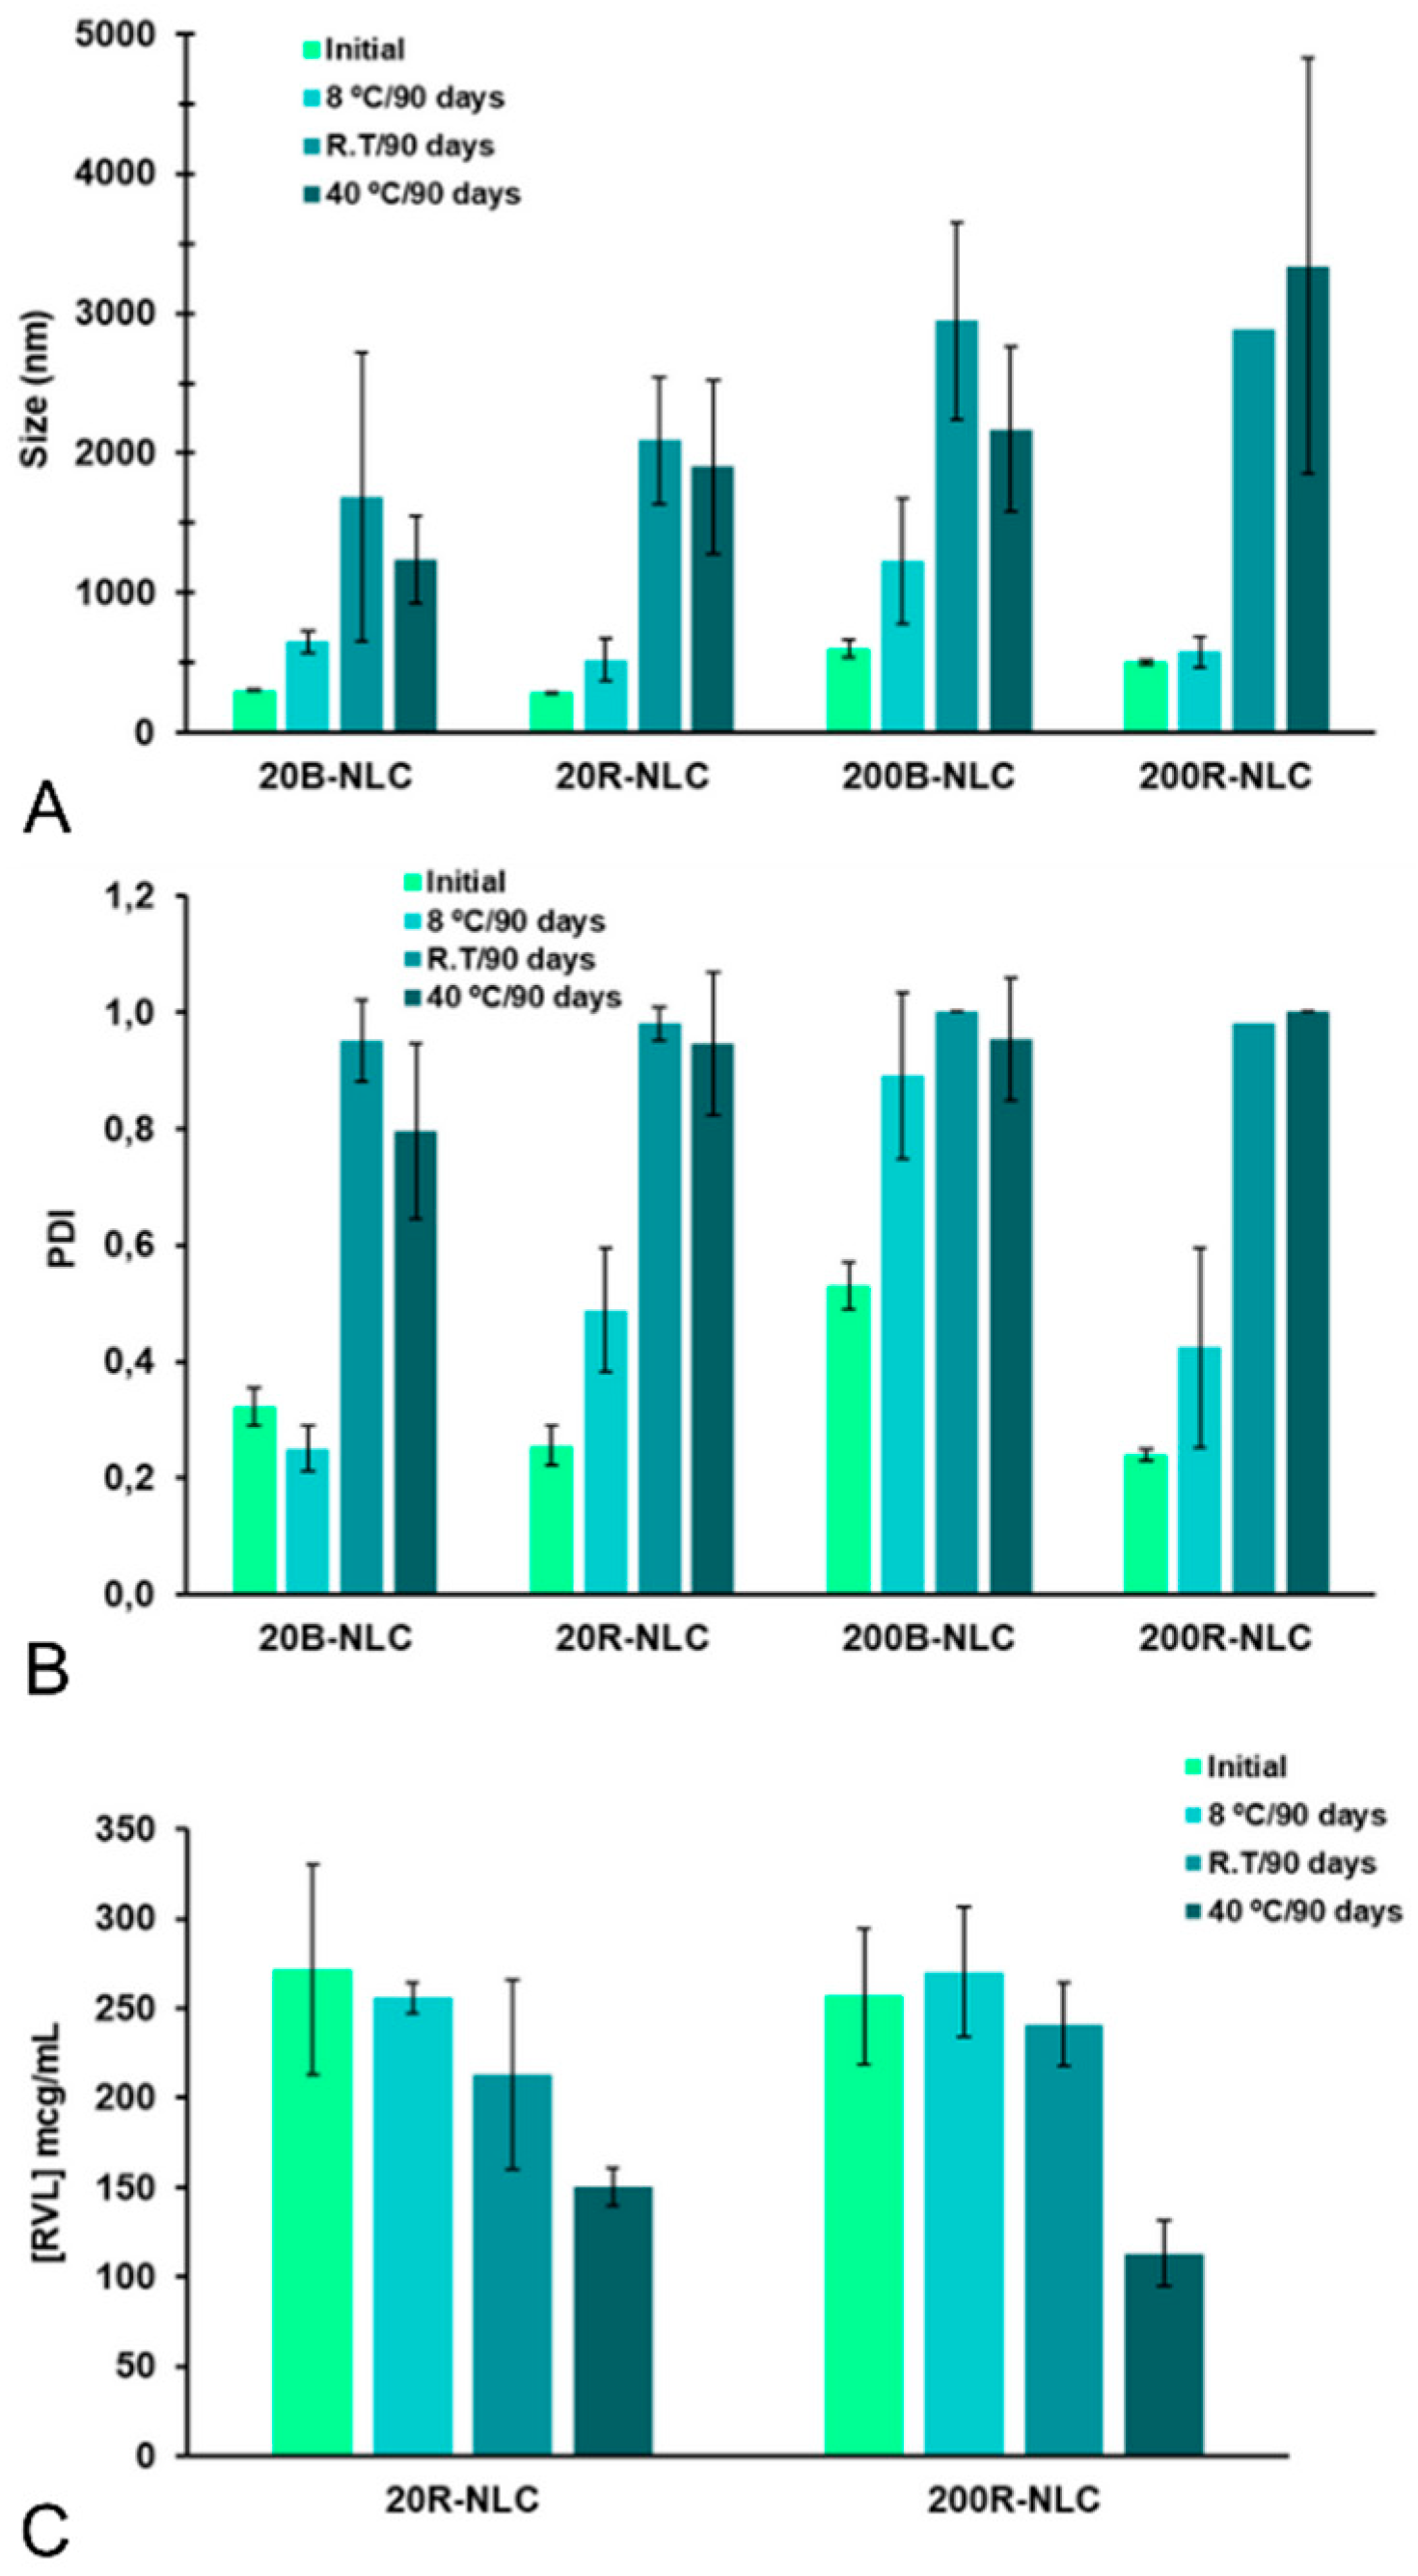
Figure 11.
DSC/TG of NLC-blank and NLC-RVL. DSC- blue line, TG- green line, DTG- red line.
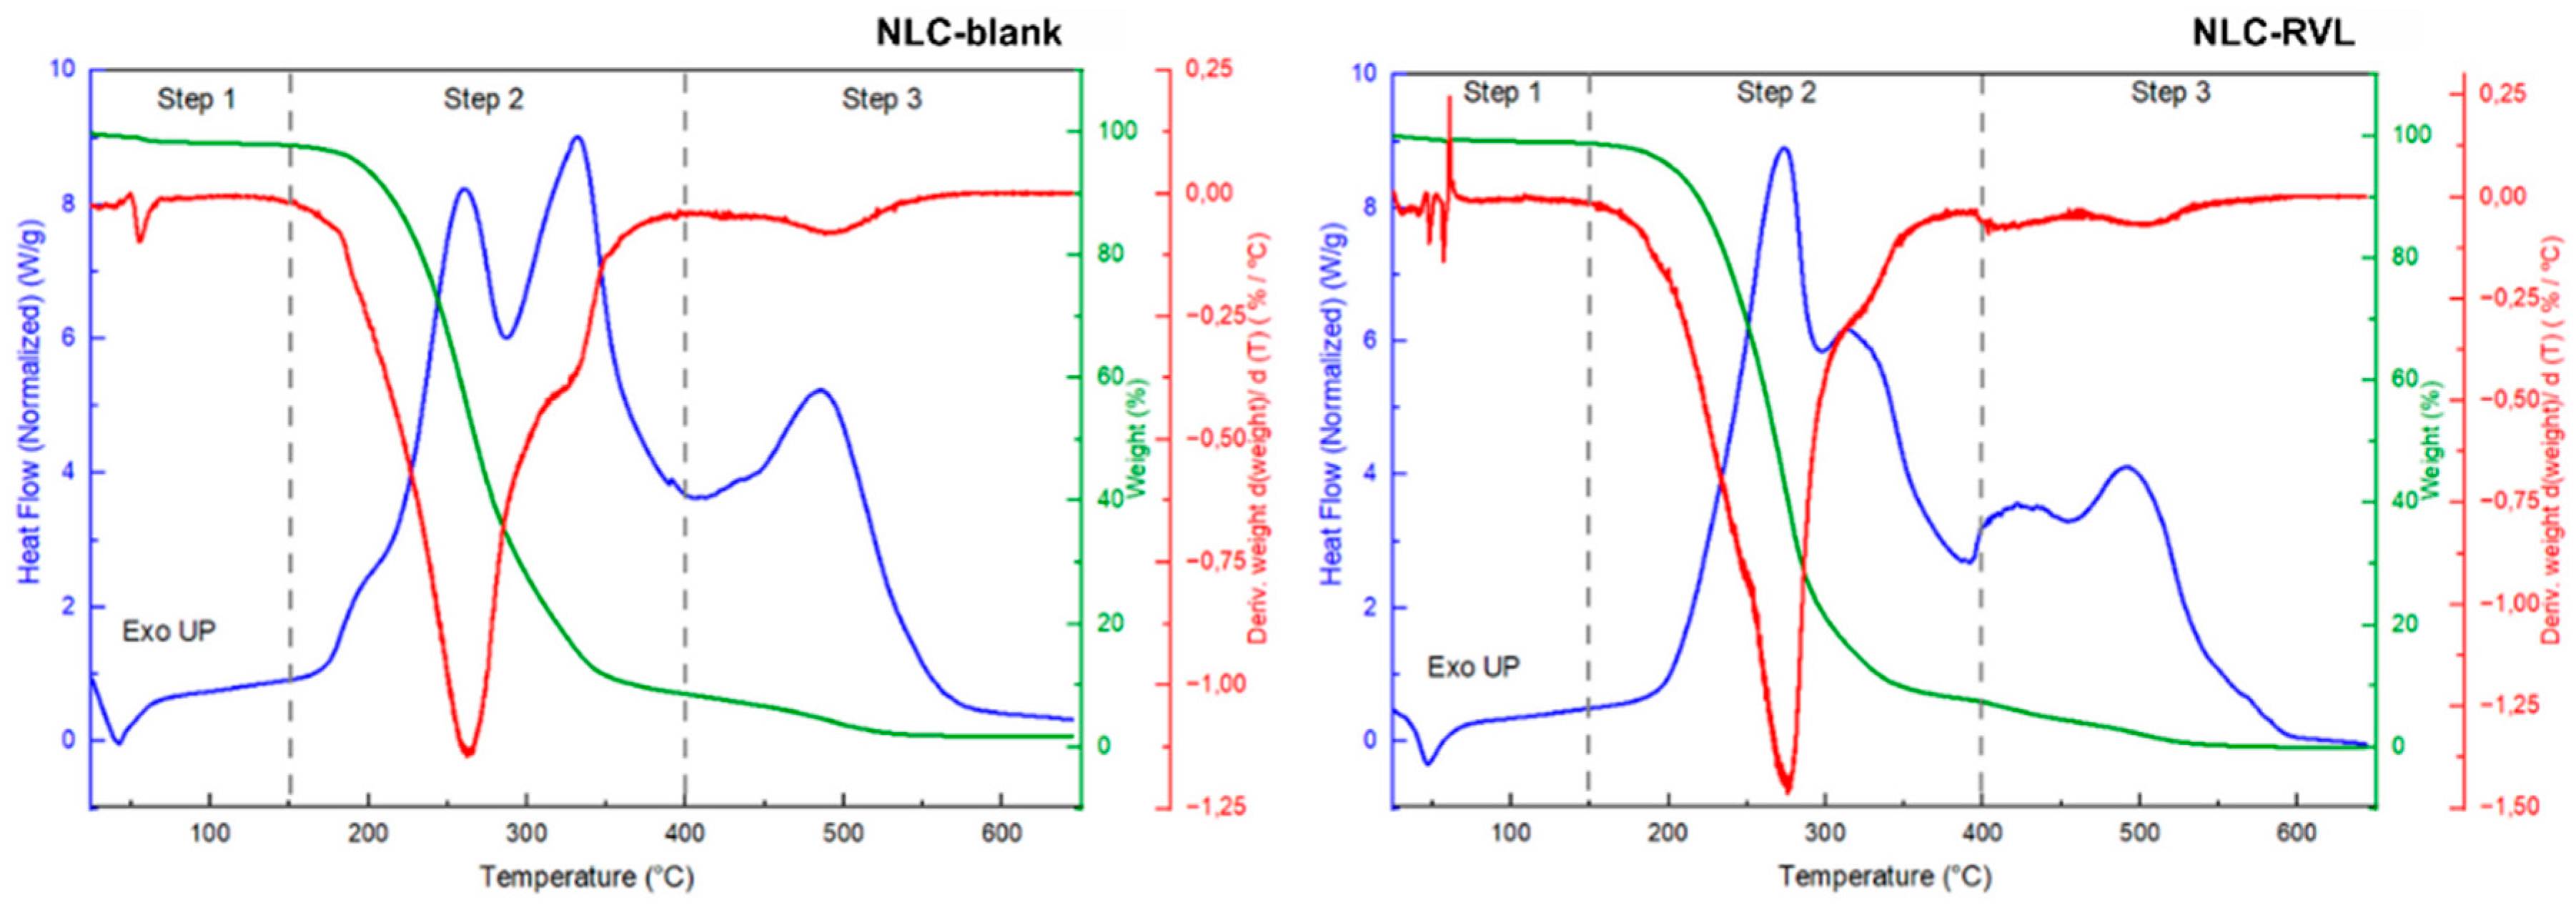
Figure 13.
Transmission electron microscopy of NLC-RVL.
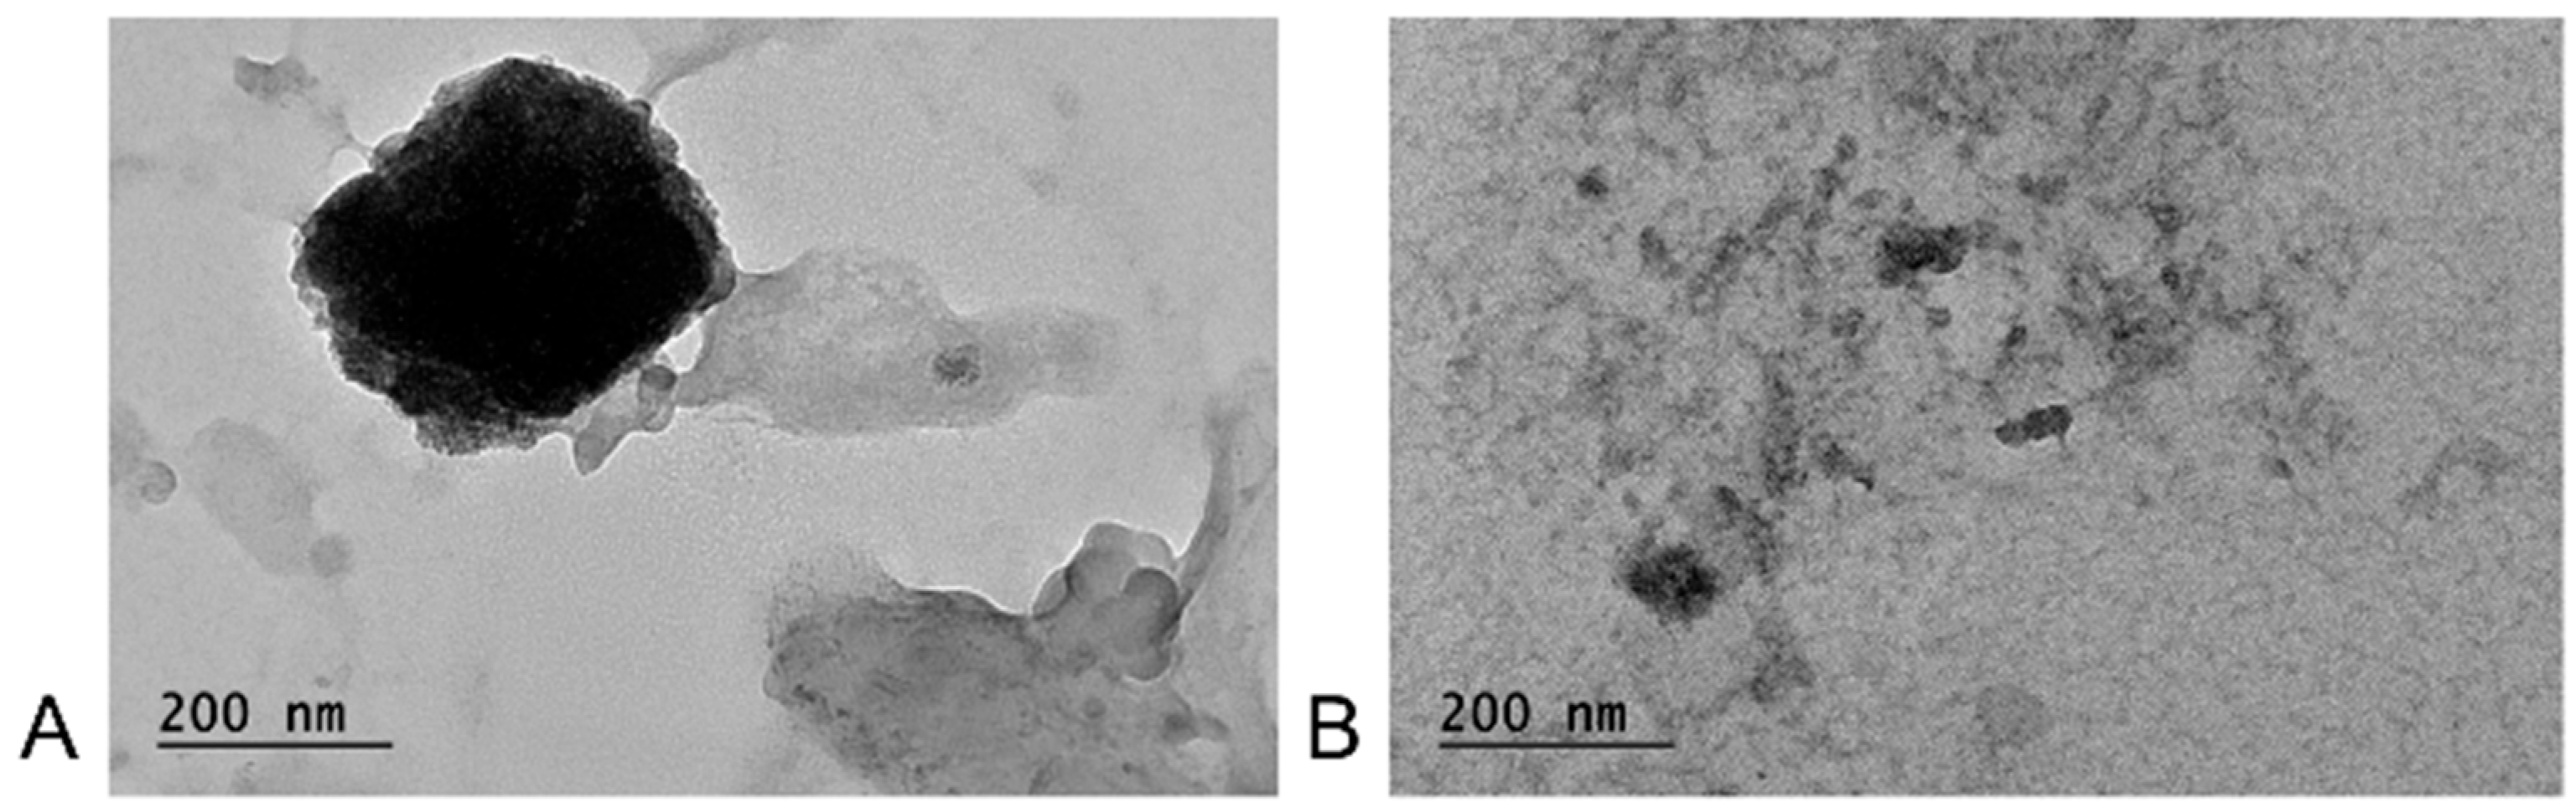
Figure 14.
SAXS of NLC-RVL.
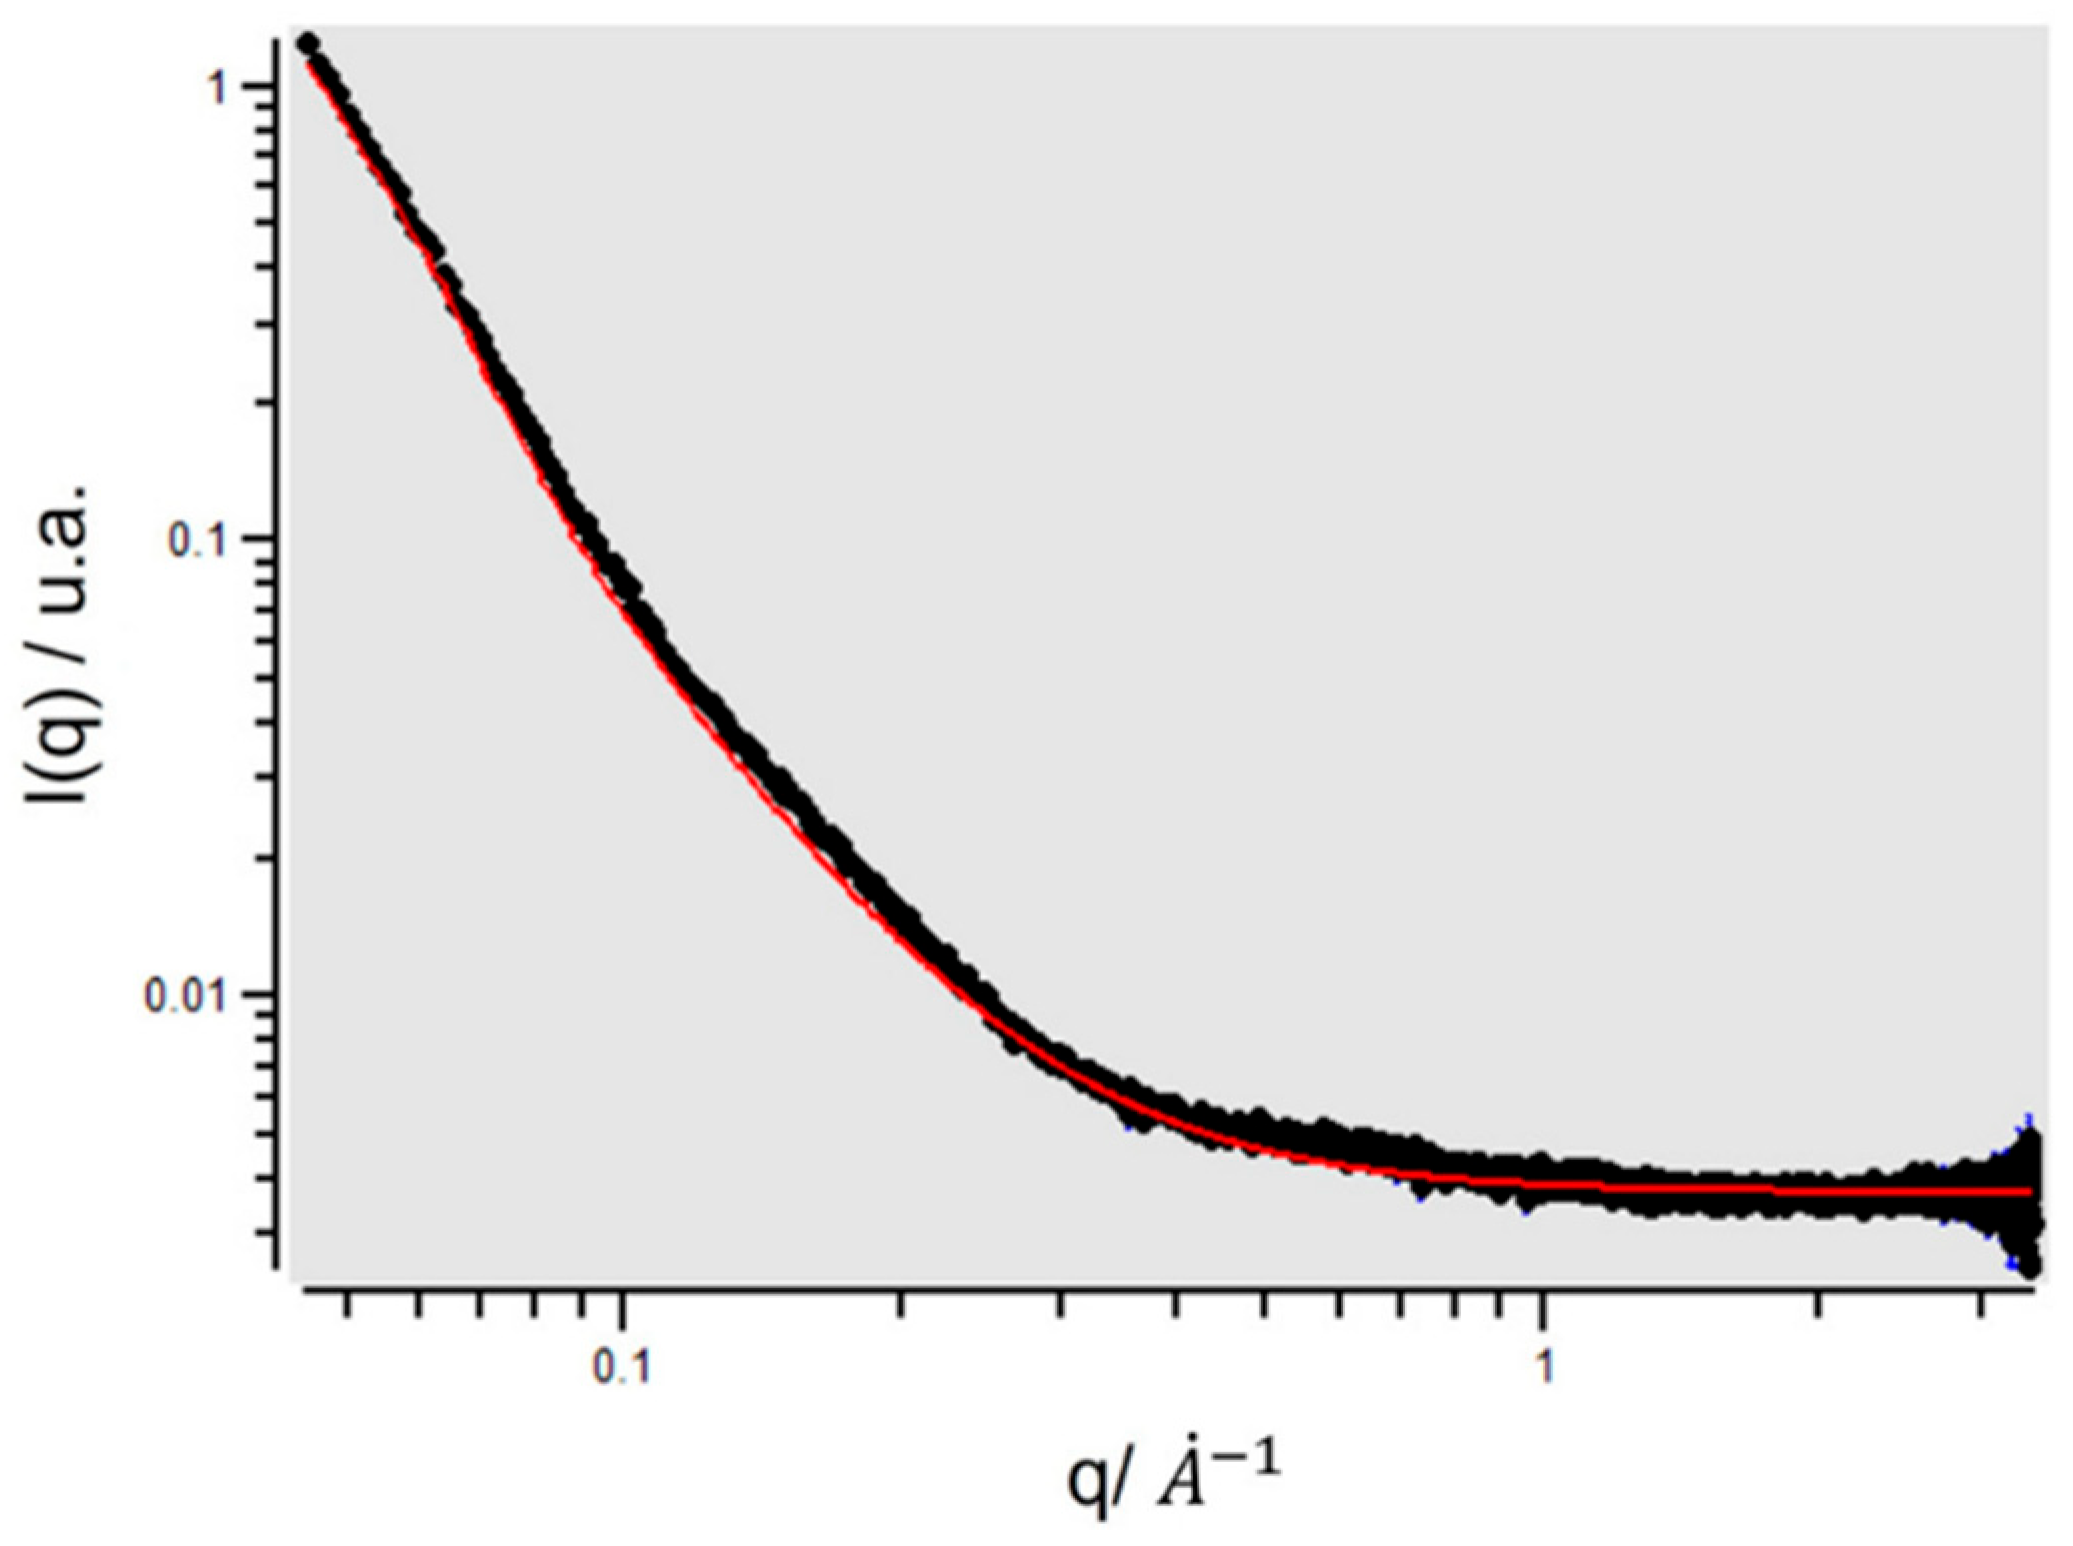
Table 1.
Particle size distribution obtained by laser diffraction with variations in the type of surfactant and solid lipid used.
Table 1.
Particle size distribution obtained by laser diffraction with variations in the type of surfactant and solid lipid used.
| Evaluated parameters | F1 | F2 | F3 | F4 | F5 | F6 |
| Surfactant | AOE | ACEE | CORH40 | AOE | ACEE | CORH40 |
| Solid lipid | ACE | ACE | ACE | GMS | GMS | GMS |
| %p ≤ 500nm ± SD | 50.23 ± 0.08 | 41.21 ± 0.20 | 100 ± 0.00 | 76.39 ± 0.04 | 83.30 ± 0.03 | 55.96 ± 0.58 |
| Average Diameter (μm) ± SD | 1.11 ± 0.00 | 1.48 ± 0.01 | 0.18 ± 0.00 | 0.45 ± 0.00 | 0.37 ± 0.00 | 1.20 ± 0.02 |
| SPAM ± SD | 5.83 ± 0.02 | 6.02 ± 0.07 | 1.65 ± 0.00 | 4.40 ± 0.00 | 3.62 ± 0.03 | 8.24 ± 0.10 |
| RU ± SD | 13.36 ± 0.89 | 16.41 ± 0.13 | 3.60 ± 0.00 | 9.00 ± 0.00 | 7.40 ± 0.00 | 15.66 ± 1.04 |
%p≤500nm ± SD: percentage of particles with diameter less than or equal to 500 nm ± standard deviation; SPAM ± SD: dispersity ± standard deviation; UR ± SD: Uniformity Ratio ± standard deviation; F0: Initial Formulation; FR: Repeated Formulation. AOE: Oleth-20; ACEE: Ceteareth-20; CORH40: PEG-40 Hydrogenated Castor Oil; ACE: Cetearyl Alcohol; GMS: Glyceryl Stearate.
Table 2.
DoE and PSD for formulations prepared with variations in composition. * means formulation R7F1 did not achieve adequate PSD values, **means ACEE was used to reach 100% of surfactant when [CORH40] was lower than 100%, *** means Lipid phase compounded with TCC:ACE (1:1).
Table 2.
DoE and PSD for formulations prepared with variations in composition. * means formulation R7F1 did not achieve adequate PSD values, **means ACEE was used to reach 100% of surfactant when [CORH40] was lower than 100%, *** means Lipid phase compounded with TCC:ACE (1:1).
| Run Order | Formulation code | [Surfactant] | CORH40 ratio** | [Lipid phase]*** | %p ≤ 500nm ± SD | Average diameter (μm) ± SD | SPAM ± SD | UR ± SD |
| 1 | 3 | 3 | 100 | 4 | 100 ± 0.00 | 0.18 ± 0.00 | 1.65 ± 0.00 | 3.6 ± 0.00 |
| 2 | 9 | 5 | 30 | 2 | 96.38 ± 0.09 | 0.20 ± 0.00 | 1.96 ± 0.04 | 2.78 ± 0.48 |
| 3 | 10 | 5 | 100 | 2 | 99.95 ± 0.04 | 0.19 ± 0.00 | 1.61 ± 0.00 | 4.75 ± 0.00 |
| 4 | 7 | 3 | 65 | 6 | 95.21 ± 0.04 | 0.21 ± 0.00 | 2 ± 0.00 | 3.5 ± 0.00 |
| 5 | 14 | 5 | 65 | 4 | 95.33 ± 0.05 | 0.21 ± 0.00 | 2.13 ± 0.00 | 3.33 ± 0.29 |
| 6 | 13 | 5 | 65 | 4 | 95.49 ± 0.07 | 0.21 ± 0.00 | 2.13 ± 0.00 | 3 ± 0.00 |
| 7 * | 1 | 3 | 30 | 4 | 88.22 ± 0.13 | 0.32 ± 0.00 | 2.43 ± 0.00 | 6.4 ± 0.00 |
| 8 | 8 | 7 | 65 | 6 | 95.74 ± 0.09 | 0.20 ± 0.01 | 2.08 ± 0.04 | 3.84 ± 0.45 |
| 9 | 2 | 7 | 30 | 4 | 95.52 ± 0.21 | 0.21 ± 0.01 | 2.10 ± 0.04 | 3.28 ± 0.25 |
| 10 | 5 | 3 | 65 | 2 | 98.75 ± 2.17 | 0.20 ± 0.02 | 1.65 ± 0.09 | 4.00 ± 0.35 |
| 11 | 15 | 5 | 65 | 4 | 95.85 ± 0.11 | 0.20 ± 0.00 | 2.02 ± 0.04 | 2.86 ± 0.00 |
| 12 | 4 | 7 | 100 | 4 | 95.59 ± 0.08 | 0.21 ± 0.00 | 2.02 ± 0.04 | 3.00 ± 0.00 |
| 13 | 6 | 7 | 65 | 2 | 95.85 ± 0.04 | 0.20 ± 0.00 | 2.06 ± 0.00 | 3.33 ± 0.00 |
| 14 | 12 | 5 | 100 | 6 | 100 ± 0.00 | 0.19 ± 0.00 | 1.56 ± 0.00 | 4.75 ± 0.00 |
| 15 | 11 | 5 | 30 | 6 | 100 ± 0.00 | 0.19 ± 0.00 | 1.56 ± 0.00 | 4.75 ± 0.00 |
Table 3.
DoE and PSD of formulations obtained using process variables. (*) indicate NLC formulations that met the predefined ideal parameters.
Table 3.
DoE and PSD of formulations obtained using process variables. (*) indicate NLC formulations that met the predefined ideal parameters.
| Formulation (run + code) | Temperature (ºC) | Stirring speed (rpm) | Initial aqueous phase amount (µl) | Aqueous phase addition | %p ≤ 500nm | Average diameter (μm) | SPAM | RU |
| R1F16 | 58 | 700 | 300 | Total | 44.04 | 6.31 | 5.92 | 147.45 |
| R2F17 | 68 | 700 | 300 | Total | 44.88 | 6.73 | 3.73 | 168.25 |
| R3F23* | 63 | 700 | 200 | Total | 95.45 | 0.21 | 2.13 | 3.50 |
| R4F26* | 63 | 550 | 300 | Total | 95.12 | 0.21 | 2.06 | 3.50 |
| R5F9* | 63 | 400 | 200 | Fractional | 95.23 | 0.21 | 2.06 | 4.20 |
| R6F4 | 68 | 700 | 300 | Fractional | 56.68 | 4.38 | 39.63 | 109.58 |
| R7F2* | 68 | 400 | 300 | Fractional | 95.22 | 0.21 | 2.00 | 3.50 |
| R8F25* | 63 | 700 | 400 | Total | 94.60 | 0.21 | 2.10 | 4.27 |
| R9F15 | 68 | 400 | 300 | Total | 66.17 | 2.94 | 38.17 | 58.73 |
| R10F18* | 58 | 550 | 200 | Total | 95.02 | 0.21 | 2.06 | 3.50 |
| R11F21 | 68 | 550 | 400 | Total | 67.76 | 2.32 | 31.21 | 46.33 |
| R12F11 | 63 | 400 | 400 | Fractional | 65.48 | 2.72 | 34.68 | 54.40 |
| R13F8* | 68 | 550 | 400 | Fractional | 94.63 | 0.21 | 2.12 | 3.50 |
| R14F10 | 63 | 700 | 200 | Fractional | 46.46 | 5.76 | 8.11 | 135.15 |
| R15F6 | 68 | 550 | 200 | Fractional | 95.39 | 0.21 | 2.00 | 3.50 |
| R16F19* | 68 | 550 | 200 | Total | 95.27 | 0.21 | 2.06 | 3.00 |
| R17F5 | 58 | 550 | 200 | Fractional | 60.11 | 4.39 | 48.54 | 87.87 |
| R18F14 | 58 | 400 | 300 | Total | 42.40 | 7.02 | 4.93 | 175.50 |
| R19F1 | 58 | 400 | 300 | Fractional | 65.99 | 3.26 | 43.20 | 65.13 |
| R20F22 | 63 | 400 | 200 | Total | 33.72 | 6.41 | 2.80 | 149.90 |
| R21F3* | 58 | 700 | 300 | Fractional | 94.73 | 0.21 | 2.10 | 4.20 |
| R22F12* | 63 | 700 | 400 | Fractional | 95.03 | 0.21 | 2.06 | 3.50 |
| R23F24* | 63 | 400 | 400 | Total | 94.83 | 0.21 | 2.08 | 3.97 |
| R24F20* | 58 | 550 | 400 | Total | 95.51 | 0.21 | 2.06 | 3.00 |
| R25F7 | 58 | 550 | 400 | Fractional | 57.55 | 7.57 | 78.29 | 189.17 |
| R26F13 | 63 | 550 | 300 | Fractional | 50.12 | 10.19 | 42.71 | 254.83 |
Table 4.
DLS results for formulations containing ionic surfactants at different concentrations. F1–F3: SLS; F4–F6: CTAC; F7: control formulation without charge-donating surfactants.
Table 4.
DLS results for formulations containing ionic surfactants at different concentrations. F1–F3: SLS; F4–F6: CTAC; F7: control formulation without charge-donating surfactants.
| Formulation code | Surfactant + concentration (%) | Size (nm) | PDI | ZP (mV) |
| F1 | SLS 0.05 | 123.97 ± 1.47 | 0.342 ± 0.04 | -43.3 ± 0.46 |
| F2 | SLS 0.1 | 179.93 ± 6.14 | 0.456 ± 0.05 | -57.17 ± 2.68 |
| F3 | SLS 0.2 | 163.1 ± 0.56 | 0.42 ± 0.01 | -64.7 ± 1.15 |
| F4 | CTAC 0.05 | 175.13 ± 5.1 | 0.585 ± 0.1 | 55.63 ± 1.35 |
| F5 | CTAC 0.1 | 135.07 ± 1.76 | 0.408 ± 0.02 | 59.98 ± 3.1 |
| F6 | CTAC 0.2 | 150.47 ± 1.2 | 0.431 ± 0 | 65.38 ± 4.24 |
| F7 | - | 140.43 ± 2.89 | 0.554 ± 0.07 | -1.95 ± 0.71 |
Table 5.
Particle size, PDI, Zeta potential, and RVL concentration determined by DLS and spectrophotometry analysis.
Table 5.
Particle size, PDI, Zeta potential, and RVL concentration determined by DLS and spectrophotometry analysis.
| Formulation | Size (nm) ± SD | PDI ± SD | ZP (mV) ± SD | [RVL] μg/mL |
| 20B-NLC | 304.4 ± 6.18 | 0.323 ± 0.03 | +48.47 ± 1.39 | - |
| 20R-NLC | 291.2 ± 3.83 | 0.256 ± 0.03 | +43.15 ± 3.28 | 271.5 |
| 200B-NLC | 601.2 ± 65.91 | 0.531 ± 0.04 | +57.27 ± 7.90 | - |
| 200R-NLC | 507.08 ± 14.6 | 0.241 ± 0.01 | +52.07 ± 0.61 | 256.6 |
[RVL]: resveratrol concentration;.
Disclaimer/Publisher’s Note: The statements, opinions and data contained in all publications are solely those of the individual author(s) and contributor(s) and not of MDPI and/or the editor(s). MDPI and/or the editor(s) disclaim responsibility for any injury to people or property resulting from any ideas, methods, instructions or products referred to in the content. |
© 2026 by the authors. Licensee MDPI, Basel, Switzerland. This article is an open access article distributed under the terms and conditions of the Creative Commons Attribution (CC BY) license (http://creativecommons.org/licenses/by/4.0/).
Copyright: This open access article is published under a Creative Commons CC BY 4.0 license, which permit the free download, distribution, and reuse, provided that the author and preprint are cited in any reuse.


