Submitted:
17 July 2025
Posted:
21 July 2025
You are already at the latest version
Abstract
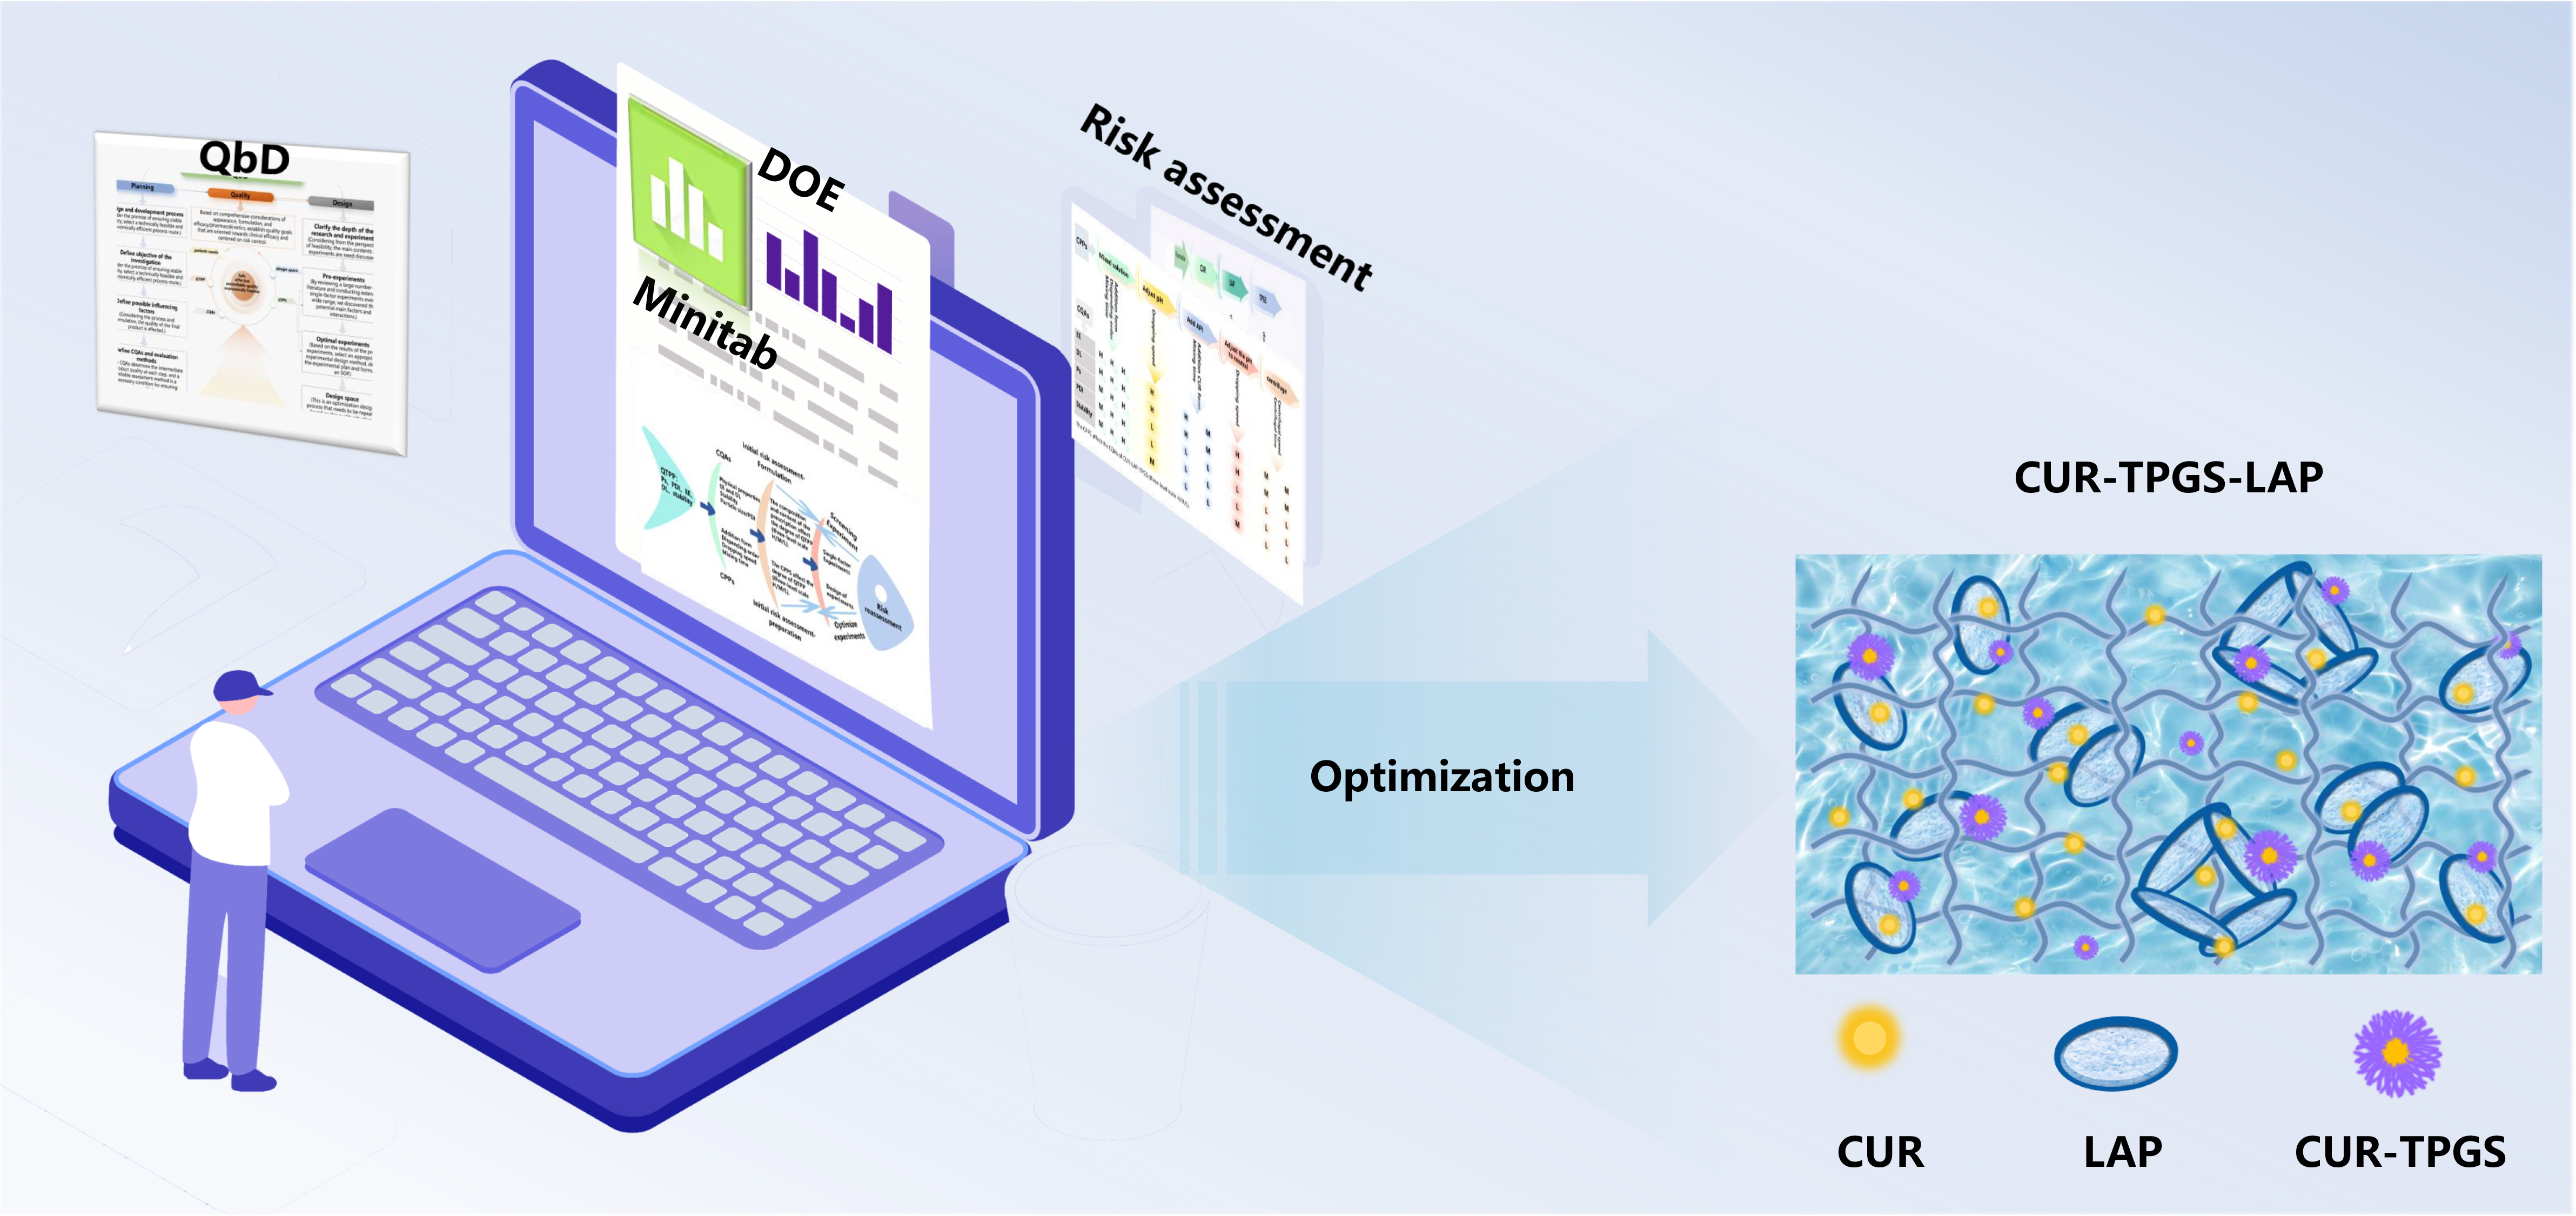
To achieve the desired therapeutic effect in vivo, nanogel administered via various routes must overcome multiple barriers, with stability being particularly crucial in the devel-opment of formulations. Developing stable nanogel requires a multi-parameter strategy that focuses on the critical quality attributes (CQAs) influencing stability. This study, grounded in the Quality by Design (QbD) concept and combined with Design of Ex-periments (DoE), developed nanogel of the inorganic material Laponite loaded with curcumin (CUR). By addressing the characteristics and stability challenges of Laponite nanogel, the research identified the CQAs and critical process parameters (CPPs). Through single-factor experiments and response surface methodology (BBD), a design space was established to influence particle size (Ps), drug loading (DL), encapsulation efficiency (EE), and formulation components. The optimal formulation (LAP:CUR:TPGS = 6:2:36.6 mg/10mL) was identified and validated through FTIR, DSC, TEM, drug release, and stability studies. The integration of QbD and DoE significantly reduced trial and error in the development of formulations, enhancing efficiency. Exploring this process contributes to a deeper understanding of the key factors for successful nanoparticle de-velopment and lays the foundation for future integration of AI technology to promote a "first-time-right" drug formulation development model. The graphical abstract of this study is shown in Graphical Abstract.
Keywords:
design of experiment
; quality-by-design
; laponite nanogel
; curcumin
; optimal formulation
; stability
1. Introduction
Nanotechnology addresses the limitations inherent in traditional drug delivery methods by enhancing the in vivo distribution of drugs, facilitating their transport across cellular barriers, and enabling targeted delivery to specific cells or even intracellular organelles [1]. Inorganic nanogel exhibit remarkable stability and demonstrate diverse physicochemical, mechanical, magnetic, and optical properties. Furthermore, they can be modified with various ligands to enhance their affinity for target site molecules, making them highly valuable in the fields of bioimaging and drug delivery [2]. Laponite (LAP), is a layered clay mineral distinguished by its microstructure, which comprises two-sided, disk-shaped particles exhibiting charged surfaces [3]. LAP is widely utilized in daily food chemicals, and hygiene products. As a pharmaceutical excipient, LAP exhibits antimicrobial properties, biocompatibility, and safety, along with characteristics such as adsorption, thickening, and thixotropy. Its disc-shaped clay nanostructure, characterized by a high degree of ionization and a large surface area, facilitates the embedding of biomolecules, rendering it suitable for constructing customizable pH-responsive drug delivery systems. For ionic drugs, the cation exchange capacity of LAP is a critical factor that influences drug encapsulation and enables controlled sustained release [4].
The preparation of drug-loaded nanogel necessitates stringent control over critical attributes, including size, polydispersity index (PDI), release rate, stability, and bioavailability, all of which are significantly influenced by the selection and dosage of excipients. Consequently, the screening of excipients and optimization of formulations are vital processes. The application of the Quality by Design (QbD) framework in this domain is of paramount importance, as it markedly enhances research and development efficiency, product quality, and the likelihood of successful industrialization through systematic experimental design and risk assessment [5]. This is particularly crucial in light of the continuous emergence of novel nanocarriers, which must adapt to the intricate physiological environment of the human body. Therefore, the implementation of comprehensive quality management based on QbD is essential. Our research group has successfully adapted the QbD methodology originally applied to liposomes for the development of LAP nanogel.
QbD is an advanced pharmaceutical development concept endorsed by the FDA [6]. Its core principle is to embed quality into product design and process development from the outset, rather than relying solely on final testing. In formulation development, QbD plays a pivotal role through several key steps. Firstly, QbD is goal-oriented, based on predefined Quality Target Product Profiles (QTPPs). After identifying Critical Quality Attributes (CQAs), risk management is achieved by determining Critical Material Attributes (CMAs) and Critical Process Parameters (CPPs) through risk assessment and experimentation. Subsequently, a design space is established, and a control strategy is formulated to ensure process robustness and product quality. Finally, continuous product and process improvement is implemented to manage the product lifecycle. QbD integrates risk assessment, Design of Experiments (DoE), and Process Analytical Technology, among other tools. Its aim is not to eliminate variability but to proactively understand and manage it, ensuring that the product consistently meets quality requirements within the predetermined range. This approach significantly enhances R&D efficiency, ensures product quality, reduces risks, and accelerates product transformation, establishing it as a key strategy in modern formulation development [7,8,9,10].
DoE serves as a fundamental tool for executing the QbD concept. It effectively investigates the intricate relationships within multivariate systems, such as multi-component mixtures like nanogel, utilizing systematic approaches including D-optimal mixture design, Box-Behnken design, central composite design, and Mixture designs [11,12,13,14]. In contrast to traditional one-factor-at-a-time experiments, DoE enables a comprehensive evaluation of the effects of excipients and process parameters with significantly fewer experimental runs, thereby expediting the identification of optimal formulations. Within the QbD framework, DoE is essential for scientifically determining CMAs and CPPs, establishing a robust design space, and ultimately facilitating a reliable quality control strategy [13].
Our research team has been dedicated to developing poorly soluble drugs, with a particular focus on curcumin nanogel, for several years. This study aims to prepare stable curcumin LAP nanogel with an average diameter of 100-200 nm by employing the principles of QbD in our experimental framework. This article applies QbD principles and utilizes Minitab software to illustrate the optimization process of polymer nanoparticle formulation. Furthermore, we implement the Box-Behnken design for optimization to achieve a more stable formulation. These findings are intended to provide valuable insights into the optimization of inorganic nanoparticle formulations for poorly soluble drugs.
2. Results and Discussion
2.1. Development of the QbD Knowledge Space
In the implementation of QbD, it is crucial to collect relevant information about the drug delivery system from both literature and experimental evidence, while also conducting a systematic evaluation. This process is critical for the successful development of QbD and the advancement of the experimental framework. Regardless of the type of drug delivery system employed, the formulation’s composition is fundamental to ensuring both the safety and quality of the drug. A comprehensive understanding of the properties of the raw materials and excipients that comprise the formulation is imperative, as is recognizing their impact on product quality, the preparation process, and the potential effects that the preparation process may exert on the properties of the raw materials and excipients. Additionally, it is important to consider product quality, the route of administration, and the interactions between the route of administration and the formulation. By systematically collecting this information, we can elucidate the entire process of QbD experimental design and identify the relevant key quality and control parameters, as illustrated in Figure 1.
2.2. Initial Identification of QTPP, CQA, and CPP Elements
In this study, we identified the QTPP of CUR-LAP-TPGS concerning nanoparticle size, drug loading, and product stability. Through a thorough literature review and preliminary experiments, we determined the CQAs that influence the formulation and selected the appropriate processes for nanoparticle preparation. To illustrate the determination process of the CQAs, we created a table (Table 1) outlining the rationale for our judgments. Furthermore, the preparation process significantly impacts the properties of the excipients and the overall quality of the product; thus, we developed a relationship diagram connecting the QTPP, CQAs, and CPPs, as shown in Figure 2. For nanogel to exert their therapeutic effects and enhance bioavailability, they must maintain adequate stability to preserve their original morphology, prevent drug settling during storage, and facilitate consistent release. Only by meeting these criteria can we ensure effective in vivo pharmacokinetics and bioavailability of the active substances.
2.3. Pre-Experiment Results and Risk Re-Assessment
Risk assessment is a crucial step within the QbD methodology. Building upon the initial risk assessment (Figure 3 and Figure 4), we conducted pre-experiments to evaluate both the process and formulation, which allowed us to roughly determine the range of quantities for both. Based on the outcomes of these pre-experiments, we re-assessed the risks associated with the process and formulation, as illustrated in Supplementary Material Figures and Table 2. Table 2 demonstrates that the pre-experiments yielded a robust preparation process and established a general design space for the formulation. In this study, we identified the pre-experiment process as the final method and utilized it for further optimization of the formulation.
During the process parameter research stage, we conducted a preliminary study that involved comparing cases with and without the addition of components, as well as different forms of addition, to investigate the effects of the three formulation components on Ps, PDI, DL and EE. The results presented in Table 2 indicate that, when the stirring time, dripping sequence, and pH are held constant, the inclusion of CUR in solid powder form significantly reduces the nanoparticle size. This reduction may occur because, during the preparation of liquid formulations for poorly soluble drugs, the relatively low solubility of the drugs necessitates an appropriate pH and a suitable surfactant concentration to facilitate drug dissolution. As the amount of solid powder increases, the number of TPGS micelles formed also rises, allowing for gradual loading into the inorganic component of the carrier, LAP, without increasing the particle size of the drug loading in LAP. Furthermore, the amount of drug micelles incorporated into the interlayer of LAP will also increase progressively with the dissolution of CUR solid powder, leading to a corresponding rise in the EE. This phenomenon can be elucidated by the role of surfactants; a higher surfactant concentration results in smaller particle sizes, as surfactants decrease the wetting angle of CUR in the aqueous phase of LAP, enabling the formation of smaller micelles that can penetrate the interlayer of LAP nanogel. The addition of TPGS significantly influences Ps, PDI, DL and EE. This impact is primarily due to TPGS being a common non-ionic surfactant, which enhances CUR solubility and facilitates its encapsulation within the layers of LAP. The incorporation of LAP in powder form also notably affects drug loading, encapsulation rate, PS, and PDI. When LAP is introduced into the system as a powder, it undergoes gradual swelling and dissolution, subsequently assembling into layered nanogel. During this slow assembly process, CUR progressively combines with TPGS to form micelles with enhanced solubility, which then gradually integrate into the layered nanogel formed by LAP assembly. Ultimately, this leads to the formation of uniformly sized and highly encapsulated nanogel. In comparison to a pre-assembled LAP nanoparticle solution, LAP solid powder demonstrates a greater capacity for assembling CUR’s TPGS micelles. The final determined process involves dissolving the specified amount of TPGS in 9 mL of distilled water, stirring until fully dissolved. Subsequently, LAP powder is added, and the mixture is stirred for 1 hour. Following this, 1 mL of NaOH solution (pH = 13) is incorporated, and the mixture is stirred thoroughly. CUR powder is then added, and stirring continues for an additional hour. The pH of the solution is adjusted to neutral using HCl (0.4M) solution, followed by stirring for 15 minutes. The mixture is then centrifuged at 4000 rpm for 10 minutes, and the supernatant is collected to obtain the final product.
To better predict the design space of the formulation, we conducted research on the three substances incorporated into the preparation. The results are illustrated in Supplementary Material. As the amount of CUR increases (Figure S1), the drug loading, encapsulation rate, and PDI of the formulation initially decrease before increasing, while the particle size progressively enlarges. This phenomenon can be attributed to the increasing distance between the layers of LAP as the CUR concentration rises, which enhances the drug loading capacity and encapsulation rate, subsequently leading to an increase in the particle size of the nanogel. Compared to the small-particle high-energy system, the particles formed in the large-particle system exhibit greater uniformity, resulting in a slight decrease in PDI. In contrast, as the LAP content increases (Figure S2), the drug loading and encapsulation rate of the formulation remain relatively stable, whereas the particle size significantly increases, and the PDI remains unchanged within a narrow range [15]. This stability occurs because, at a constant CUR amount, TPGS has already elevated the CUR concentration to the saturation solubility within the system. Consequently, LAP does not influence its dissolution characteristics, leading to minimal changes in drug loading and encapsulation rate. However, regarding particle size, LAP is primarily responsible for forming stable nanogel. Therefore, an excess of LAP may lead to re-assembly through electrostatic interactions, resulting in even larger nanogel. The drug loading and encapsulation rate of the formulation initially increase with rising TPGS content but subsequently decrease (Figure S3). The particle size and PDI do not exhibit significant changes with increased TPGS content. This can be explained by the fact that TPGS predominantly influences the dissolution of CUR, with a critical micelle concentration (CMC) of approximately 0.02% w/v, indicating a propensity for micelle formation [16]. However, the formation of nanogel by LAP primarily depends on the capacity of the lamellar structure. When TPGS is present in excess, it can also independently form blank micelles. The presence of these blank micelles may impact the amount of CUR-TPGS within the lamellar structure, thereby affecting the drug loading capacity and encapsulation rate of LAP. Based on the influences of CUR, LAP, and TPGS in the formulation, we established the ranges for the three factors in the DOE experiment according to the pre-experimental results: CUR: 2-10 mg; LAP: 2.5-10 mg; TPGS: 15-45 mg; 10 ml system.
2.4. Results of DoE
Based on the findings from the single-factor pre-experiment, we determined that the quantities of CUR and TPGS primarily influenced drug loading and encapsulation efficiency, while the amounts of LAP and TPGS predominantly affected Ps and PDI. Although each of the three factors has a principal influencing indicator, interactions among them also exist. Consequently, the BBD and RSM methodology was employed in this experiment to identify the optimal formulation, as illustrated in Table 3 and Table 4. The amounts of LAP, CUR, and TPGS were designated as the variables X1, X2, and X3, respectively. Each factor was evaluated at three levels, represented as -1, 0, and 1. The evaluation indicators included DL (Y1, mg/g), EE (Y2, %), Ps (Y3, nm), and PDI (Y4). The levels of each factor were fitted, and the response surface effects along with isoclines were represented using Minitab software to determine the optimal combination. We utilized Minitab to generate overlapping contour plots for the three factors against the three response values (as shown in Figure 5a–c), and subsequently navigated within these overlapping contour plots to select the optimal formulation.
Ultimately, we determined that higher values for DL and EE are preferable, while a smaller PDI is advantageous. Additionally, a Ps that is closest to 100 nm is considered optimal. We assigned the following weights to these four indicators: DL:EE:PS:PDI = 10:5:5:0.1. The optimal formulation identified consists of a 10 mL system containing 6 mg of LAP, 2 mg of CUR, and 36.6 mg of TPGS. A detailed analysis can be found in Figure 5d.
2.5. The Characterization Results of the Optimal Prescription
2.5.1. TEM
The optimal formulation of CUR-LAP-TPGS is clearly illustrated in the transmission electron microscopy (TEM) images (Figure 6a,b). Figure 6a depicts the morphology of a typical interwoven network of nanodisks. This structure primarily results from the octahedron-like configuration formed by the interaction between the positively charged edges and the negatively charged interlayer regions of LAP. The addition of CUR, which possesses a micellar structure, transforms the originally dense octahedral structure into a more porous, interwoven three-dimensional network. The unit size of this network structure is approximately 100 nm, which is smaller than the particle size measured by the Malvern particle size analyzer. This discrepancy is mainly attributed to the presence of nanoscale particles and hydrophilic groups on the surface, resulting in an increase in the hydrated particle size [17]. As shown in Figure 6b, distinct lattice fringes are observable in the monolayer structure of LAP; although the lattice resolution is limited, it is sufficient to demonstrate that the structural integrity of LAP is preserved.
2.5.2. FTIR
The functional groups and structural changes of CUR-TPGS-LAP were detected at the molecular level by FTIR. The FTIR spectra of CUR, LAP and CUR-TPGS-LAP nanogel are shown in Figure 6c. The FTIR spectrum of LAP shows that its characteristic vibration bands are a broad and strong absorption peak at about 3000-4000cm−1, mainly attributed to the -OH stretching vibration of interlayer adsorbed water molecules, and a peak at 1623cm−1 corresponding to the bending vibration of interlayer -OH. The strongest absorption peak at about 1010-1040 cm−1 is attributed to the antisymmetric stretching vibration of Si-O-Si, and the position and shape of this peak are very sensitive to the structure of the silicate framework (such as the order of tetrahedral sheets and interlayer interactions) in LAP [18]. The peak at 670 - 690 cm−1 is attributed to the symmetric bending vibration of Si-O-Si.
The most characteristic peaks of CUR’s structure is a strong peak at 1650-1620 cm−1, attributed to the vibration of conjugated enone systems (coupled with C=C and C=O), and a peak at 960 cm−1 attributed to the out-of-plane bending vibration of the trans alkene =C-H. The peaks at 1500 - 1600 in the spectrum indicate the presence of an aromatic ring in CUR. The peaks at 2950 - 2850 cm−1, 1430 - 1400 cm−1, and 1280 - 1260 cm−1 in the spectrum correspond to the vibration peaks of C-H, CH3, and Ar-O-C, jointly indicating the presence of a methoxy group in CUR [19].
In CUR-TPGS-LAP nanogel, TPGS shows a strong vibration of hydrophobic C-H stretching at 2926 cm−1. When curcumin is loaded, the 1512 cm−1 peak of LAP slightly shifts to 1530 cm−1, indicating electrostatic interaction and hydrogen bonding between them. The change in the Si-O-Si absorption peak of LAP at 1010 - 1040 cm−1 indicates that the order of tetrahedral sheets and interlayer interactions in the silicate framework have changed, indicating the successful assembly of CUR-TPGS in LAP.
2.5.3. DSC
As illustrated in Figure 6d, the most prominent characteristic of the DSC curve for CUR is a sharp endothermic peak, which corresponds to its melting point within the range of 175°C to 185°C [20]. LAP, a synthetic material, contains both structural water and interlayer water. The most significant feature of its DSC curve is the presence of one or more broad endothermic peaks, primarily occurring around 100°C, which correspond to the gradual removal of adsorbed water (interlayer water) and some structural water [21]. In CUR-TPGS-LAP nanogel, CUR molecules are either intercalated into the interlayer of LAP or adsorbed onto its surface, displacing some interlayer water molecules. This leads to a reduction in the amount of interlayer water in LAP, decreases the energy required for dehydration, and results in a diminished or even absent peak area. Once CUR is successfully incorporated into LAP, it becomes dispersed in an amorphous state within the interlayer, losing its crystallinity and exhibiting no melting behavior. The amorphous state of CUR indicates an enhancement in its solubility. On the DSC curve of CUR-TPGS-LAP, an exothermic decomposition peak of TPGS is observed around 300°C to 350°C, signifying the thermal decomposition/oxidation of TPGS. Notably, this exothermic peak is broadened, suggesting that TPGS is intercalated into the interlayer of LAP. This implies that CUR should be combined with TPGS prior to its insertion into the interlayer of LAP.
2.5.4. In Vitro Drug Release
As illustrated in Figure 6e, the CUR-TPGS solution exhibits rapid release within one hour, but its sustained-release effect is not pronounced. Conversely, the CUR-LAP solution demonstrates a slow release over a period of 12 hours. The CUR-TPGS-LAP solution, however, shows a rapid release within the first four hours, followed by a slower release from four to forty-eight hours, indicating a biphasic drug release characteristic. Initially, the free drugs adsorbed on the surface and interlayers of the LAP plate are preferentially released, succeeded by the CUR encapsulated within the micelles, which releases CUR at a relatively slower rate in the release environment. By integrating two distinct drug release modes—rapid release and sustained release—this approach transcends the limitations of traditional formulations, facilitating both rapid onset and prolonged maintenance. This strategy effectively addresses the time lag effect, aligns with physiological rhythms, and significantly enhances both efficacy and safety. Furthermore, it is applicable in complex and individualized drug delivery scenarios, such as tumor treatment, colon targeting, and ocular applications.
2.5.5. Stability
According to Figure 6f the Ps and PDI of CUR-TPGS-LAP nanogel did not exhibit significant changes over a 28-day period (P > 0.05). In CUR-TPGS-LAP nanogel, LAP effectively prevents the dissociation of CUR-TPGS through interlayer restrictions and maintains micelle stability via van der Waals forces. Furthermore, the potential of the double electric layer contributes to an increased repulsive energy barrier through electrostatic repulsion, thereby enhancing the anti-aggregation capability of CUR-TPGS-LAP nanogel. The Mg-OH and Si-OH groups at the edges of the LAP layer can form hydrogen bonds and ionic bonds (Mg2+ and -COO−) with the -COO− groups of TPGS, effectively covering high-energy active sites and passivating them, which reduces non-specific adsorption of micelles at the interface. Additionally, LAP’s ability to stabilize micelles presents significant potential for spatial and temporal controlled release, which is closely related to the biphasic release behavior exhibited by CUR-TPGS-LAP nanogel in vitro, as discussed in Section 2.5.4.
3. Conclusions
By employing QbD and DOE methodologies, the bioavailability challenges associated with poorly soluble drugs were effectively addressed, leading to a reduction in production risks. In the development of the CUR-TPGS-LAP nano-delivery system, quality targets were established, identifying Ps, DL, EE, and PDI as CQAs. The study revealed that the concentrations of CUR and TPGS significantly influenced DL and EE, while the concentration of LAP primarily affected PS and PDI; additionally, pH control emerged as the most critical factor in the process. By establishing the QTPP, identifying CQAs, assessing risks, conducting preliminary experiments to identify high-risk areas, and optimizing the formulation and process accordingly, we successfully produced LAP nanogel exhibiting optimal and stable performance.
Although the published work can provide support for the optimization process of some other poorly soluble nanogel, for certain new materials or newly combined materials, more research is still needed and different DoE methods should be used to obtain more representative data for the development of nanoparticle formulations. How to start from the design perspective, select the variables that have the greatest impact on the reaction as the CQAs for the target quality, and understand how they affect these CQAs is an important guarantee on the path to ensuring the safety and quality of drug development.
DoE combined with QbD holds significant importance in the development of poorly soluble drug nano-formulations: Firstly, it reduces trial and error through multivariate experimental design, significantly enhancing the efficiency of new formulation development; Secondly, based on mathematical models and statistical calculations, the design space provides a scientifically flexible control range for production processes, providing reliable guarantees for both pilot style and large-scale production; Finally, this development model ensures the precise attainment of product quality attributes, accelerating regulatory review and market entry. DoE combined with QbD will deeply integrate AI technology in the development of new formulations, forming a “digital design - intelligent optimization - experimental verification” closed loop, and combined with advanced process analytical technologies, will further promote the evolution of formulations towards a “one-time success” development model. In the future, the possible prospects of DoE combined with QbD’s research and development model in formulation development are:
In prescription development research, by combining the physical property database of raw materials and molecular simulation experiments, achieve intelligent matching of excipients, and shorten the screening period;
In process and prescription optimization, adopt reasonable experimental design, reduce the number of experiments, construct the design space, and combine mathematical models to ensure the construction of complex formulations;
In quality control during process scaling-up: combine advanced process analytical technologies (PAT) for dynamic control of CPPs;
In the process of drugs, regulation and market entry: combine the optimized models, design space and risk control data of QbD to ensure drug quality, accelerate review and reduce the risk of clinical failure.This section is not mandatory but can be added to the manuscript if the discussion is unusually long or complex.
4. Materials and Methods
4.1. Materials
Curcumin (CUR) was acquired from Meilun Biotechnology Co., Ltd. (Dalian, China). LAP was sourced from Nanjing Baiyike New Material Technology Co., Ltd. (Nanjing, China), while vitamin E polyethylene glycol succinate (TPGS) was obtained from McLean Biochemical Technology Co., Ltd. (Shanghai, China). Tween 80 was procured from Damao Chemical Reagent Factory Co., Ltd. (Tianjin, China). Additionally, sodium hydroxide, ethanol, potassium dihydrogen phosphate, and hydrochloric acid were also purchased from Damao Chemical Reagent Factory Co., Ltd. (Tianjin, China).
4.2. Methods
4.2.1. Process of the QbD Design
QbD approach to formulation closely mirrors the product development process involved in creating pharmaceutical preparations, emphasizing formulation-related factors and quality [22,23,24]. This process generally encompasses the determination of the product’s quality profile, the identification of critical quality attributes, the establishment of critical process parameters, preliminary risk assessment, pre-experimentation activities, experimental design, and risk re-evaluation. Figure 1 illustrates the specific process.
4.2.2. Determine Elements of the QTPP
The QTPP encompasses various aspects, including dosage form, mechanism of action, route of administration, specifications, stability, content, hazardous substances, dissolution, residual solvents, microorganisms, and packaging systems [25,26,27]. These elements constitute the foundational components of the QbD methodology. The QTPP serves as a forward-looking summary of the ideal quality characteristics of a pharmaceutical product, guiding the control of the final product’s quality by considering its safety and efficacy. This study primarily investigates the effects of process conditions and formulation composition on Ps, PDI, DL, EE, and the stability of the preparation. Related factors, CQAs, and QTPP were analyzed using the Ishikawa diagram presented in Figure 2.
4.2.3. Determine Elements of the CQAs
CQAs refer to the specific physical, chemical, biological, or pharmaceutical properties of finished materials. These attributes are typically derived from the QTPP and supplemented with prior knowledge [28,29]. CQAs are identified through risk assessment and are used to guide product and process development. When preparing nanocarriers using LAP, crucial indicators for assessing the success of nanoparticle preparation and their quality Ps, PDI, DL, EE, and the stability of nanogel [30,31]. These indicators are interrelated; for instance, Ps and PDI affect stability, while process parameters simultaneously influence Ps, PDI, DL, and EE. During the initial development phase, the CQAs and their target ranges should be determined through risk assessment based on prior knowledge, literature, or experimental design. In the current study, we have identified the CQAs, the details of which are presented in Table 1.
4.2.4. Determine Elements of the CPPs
In the development of nanogel, various process factors significantly impact the quality of the final product. Systematic investigation of the effects of formulation variables (such as carrier-to-drug ratio, solvent selection, and stabilizers) and process parameters (such as stirring speed, stirring time, and solvent addition rate) on these CQAs is essential for identifying a robust ‘design space’ [32,33]. In this experiment, we identified the CQAs and their corresponding CPPs, as illustrated in Figure 3. This section employs a three-level scale to characterize the risk relationships between parameters and to perform a preliminary risk assessment of CPPs in relation to CQAs, categorized as ‘High’ (H), ‘Medium’ (M), or ‘Low’ (L).
4.2.5. Risk Assessment of Formulation
The composition and proportions of the prescription may significantly influence the product itself. During the risk assessment process, it is essential to evaluate the interdependent relationships and impacts among the quality of each target prescription, CQAs, and CPPs through a comprehensive literature review and preliminary experiments. The objective of the risk assessment is to evaluate both the likelihood of events, particularly adverse events, and the severity of potential impacts based on causal relationships. In this study, we summarized the influence of formulation composition and CQAs based on pre-experimental findings, continuously assessing the risk factors using a three-level rating system (High/Medium/Low), as shown in Figure 4.
4.2.5.1. Design of Experiments (DoE)
Based on the results of the single-factor investigation (Supplementary Material), this study employed Box-Behnken Design (BBD) in conjunction with Response Surface Methodology (RSM) to optimize the formulation. Through the single-factor experiments, three key variables were identified: the amounts of LAP, CUR, and TPGS. Evaluation indices including DL (Y1, mg/g), EE (Y2, %), Ps (Y3, nm), and PDI (Y4) were established, with three levels set for each variable, coded as -1, 0, and 1. Subsequently, Minitab software was utilized to fit the levels of each factor and to generate response surface and contour plots, which facilitated the selection of the optimal formulation.
4.2.5.2. Characterization of the CUR -TPGS-LAP
4.2.5.2.1. Particle Size and Zeta Potential
The Ps and PDI of the samples were measured using a BT-Zeta100 analyzer (Dandong Best Technology Co., Ltd., Dandong, China), with each sample analyzed in triplicate. The BT-Zeta100 analyzer operates on the principle of dynamic light scattering to assess the particle size and polydispersity coefficient of nanoparticle samples. Following dilution, approximately 1 cm of the diluted sample is placed into the measurement pool for analysis.
4.2.5.2.2. TEM Measurements
TEM Measurements The size, structure, and morphology of LAP nanogel were characterized using transmission electron microscopy (TEM). In this study, JEM-2100F TEM measurements (JEOL Co., Ltd., Tokyo, Japan) were utilized to prepare TEM samples from an appropriate quantity of CUR-TPGS-LAP solution. The samples were carefully deposited onto a copper mesh with an ultrathin carbon support film, allowed to dry naturally, and subsequently examined for their morphology under an accelerated voltage of 200 kV.
4.2.5.2.3. FT-IR Spectroscopy Measurements
The infrared spectra of CUR, LAP, and CUR-TPGS-LAP powders were obtained using the potassium bromide tableting method with a Fourier transform infrared (FT-IR) spectrometer (Beijing Beifen Ruili Analytical Instrument Co., Ltd., Beijing, China). For sample preparation, 1 to 2 mg of the solid sample was ground in a mortar and combined with 100 to 200 mg of dry KBr, which was further ground until a homogeneous mixture was achieved. A suitable amount of this mixture was placed into a mold and pressed into thin slices. The infrared spectrum was scanned over a wavelength range of 500 to 4000 cm−1.
4.2.5.2.4. DSC Measurements
For the Differential Scanning Calorimetry (DSC) test, appropriate quantities of CUR, LAP, and CUR-TPGS-LAP powders were placed in an alumina crucible, with a blank alumina crucible used as the reference. The scanning was conducted over a temperature range of 50°C to 250°C, with a heating rate of 5°C/min.
4.2.5.2.5. In vitro drug release studies
A 1.25% (W/V) Tween 80 solution in PBS (pH 7.4) was utilized as the dissolution medium, maintained at a temperature of 35 ± 0.5°C with a rotation speed of 150 r/min for the investigation of the release curves. A total of 2 mL of CUR-TPGS-LAP solution, prepared according to the optimal formulation, alongside CUR-LAP and CUR-TPGS solutions of equivalent concentration, were pipetted into a pretreated dialysis bag (MW 20,000). The bag was securely tied with string and submerged in an Erlenmeyer flask containing 100 mL of the 1.25% (W/V) Tween 80 in PBS (pH 7.4) solution. The flask was agitated on a shaker, and samples were taken at 0.25, 0.5, 0.75, 1, 2, 3, 4, 5, 6, and 8 hours. Additionally, 5 mL samples were collected at 10, 12, 24, 36, 48, 60, and 72 hours, with the dissolution medium replenished to maintain consistent temperature and volume. The absorbance of each sample solution was measured to calculate the in vitro release of CUR-LAP, CUR-TPGS, and CUR-TPGS-LAP. The release curves for the three formulations were generated by plotting time (h) on the x-axis against the cumulative release percentage on the y-axis.
4.2.5.2.6. The stability of CUR -TPGS-LAP formulation
This study conducts a stability investigation on the optimally formulated CUR-TPGS-LAP solution, focusing on changes in particle size during storage at refrigeration temperature (4°C). Samples were collected at 3, 7, 14, and 28 days and compared to freshly prepared formulations to evaluate their stability.
4.2.6. Statistical Analysis
The data are presented as means ± standard deviation (SD) with a sample size of n = 3. Analyses were conducted using SPSS 26.0 statistical software (IBM, Armonk, New York, USA), and a One-way Analysis of Variance (ANOVA) was employed to determine the p-values. (***p < 0.001, **p < 0.01, *p < 0.05).
Supplementary Materials
The following supporting information can be downloaded at the website of this paper posted on Preprints.org. The following supporting information explores the impact of each component in the prescription on Ps, DL,EEr, and PDI., Figure S1: The influence of the quantities of CUR on the DL, Ps, EE and PDI, (mean ± S.D., n = 3); Figure S1: The influence of the quantities of LAP on the DL, Ps, EE and PDI, (mean ± S.D., n = 3); Figure S1: The influence of the quantities of TPGS on the DL, Ps, EE and PDI, (mean ± S.D., n = 3).
Author Contributions
Methodology, Jing Li. and Xiangfeng Kong.; validation, Mengqiu Lu.; formal analysis, Xiaochang Liu.; investigation, Hongxia Chen.; writing—review and editing and supervision, Lijie Wang. All authors have read and agreed to the published version of the manuscript.
Funding
This research was funded by the Natural Science Foundation of the Department of Education of Liaoning Province (LJKMZ20221780), Natural Science Foundation of Liaoning Province (2023-BSBA-298), and Shenyang Medical College Undergraduate Innovation Training Program (20239036 and 20249026). The APC was funded by LJKMZ20221780.
Acknowledgments
The authors have reviewed and edited the output and take full responsibility for the content of this publication.
Conflicts of Interest
The authors declare no conflicts of interest.
Abbreviations
The following abbreviations are used in this manuscript:
| QbD | Quality by Design |
| QTPP | Quality Target Product Profile |
| CQAs | Critical Quality Attributes |
| CPPs | Critical process parameters |
| DOE | Design of Experiments |
| CUR | Curcumin |
| TPGS | Vitamin E polyethylene glycol succinate |
| LAP | Laponite |
| DL | Drug Loading |
| Ps | Particle size |
| EE | Encapsulation effi-ciency |
| PDI | Polydispersity Index |
| TEM | Transmission electron microscopy |
| FTIR | Fourier Transform infrared spectroscopy |
| DSC | Differential Scanning Calorimetry |
References
- Miao, L.; Kang, Y.; Zhang, X. F. , Nanotechnology for the theranostic opportunity of breast cancer lung metastasis: recent advancements and future challenges. Front Bioeng Biotechnol 2024, 12, 1410017. [Google Scholar] [CrossRef]
- Unnikrishnan, G.; Joy, A.; Megha, M.; Kolanthai, E.; Senthilkumar, M. , Exploration of inorganic nanoparticles for revolutionary drug delivery applications: a critical review. Discov Nano 2023, 18(1), 157. [Google Scholar] [CrossRef]
- Wang, B.; Zhao, J.; Lu, W.; Ma, Y.; Wang, X.; An, X.; Fan, Z. , The preparation of lactoferrin/magnesium silicate lithium injectable hydrogel and application in promoting wound healing. Int J Biol Macromol 2022, 220, 1501–1511. [Google Scholar] [CrossRef]
- Kiaee, G.; Dimitrakakis, N.; Sharifzadeh, S.; Kim, H. J.; Avery, R. K.; Moghaddam, K. M.; Haghniaz, R.; Yalcintas, E. P.; Barros, N. R.; Karamikamkar, S.; Libanori, A.; Khademhosseini, A.; Khoshakhlagh, P. , Laponite-Based Nanomaterials for Drug Delivery. Adv Healthc Mater 2022, 11(7), e2102054. [Google Scholar] [CrossRef] [PubMed]
- Kaur, P.; Kriplani, P. , Optimizing Transdermal Drug Delivery with Novasome Nanocarriers: A Quality by Design (QbD) Framework. Curr Drug Deliv 2025. [Google Scholar] [CrossRef] [PubMed]
- Zagalo, D. M.; Sousa, J.; Simões, S. , Quality by design (QbD) approach in marketing authorization procedures of Non-Biological Complex Drugs: A critical evaluation. Eur J Pharm Biopharm 2022, 178, 1–24. [Google Scholar] [CrossRef] [PubMed]
- Kaur, P. ; Muskan; Kriplani, P., Quality by design for Niosome-Based nanocarriers to improve transdermal drug delivery from lab to industry. Int J Pharm, 1247. [Google Scholar]
- Correia, A. C.; Moreira, J. N.; Sousa Lobo, J. M.; Silva, A. C. , Design of experiment (DoE) as a quality by design (QbD) tool to optimise formulations of lipid nanoparticles for nose-to-brain drug delivery. Expert Opin Drug Deliv 2023, 20(12), 1731–1748. [Google Scholar] [CrossRef]
- Cs, J.; Haider, M.; Rawas-Qalaji, M.; Sanpui, P. , Curcumin-loaded zein nanoparticles: A quality by design approach for enhanced drug delivery and cytotoxicity against cancer cells. Colloids Surf B Biointerfaces 2025, 245, 114319. [Google Scholar] [CrossRef]
- Salamah, M.; Sipos, B.; Schelz, Z.; Zupkó, I.; Kiricsi, Á.; Szalenkó-Tőkés, Á.; Rovó, L.; Katona, G.; Balogh, G. T.; Csóka, I. , Development, in vitro and ex vivo characterization of lamotrigine-loaded bovine serum albumin nanoparticles using QbD approach. Drug Deliv 2025, 32(1), 2460693. [Google Scholar] [CrossRef]
- Bak, Y. W.; Woo, M. R.; Cho, H. J.; Kwon, T. K.; Im, H. T.; Cho, J. H.; Choi, H. G. , Advanced QbD-Based Process Optimization of Clopidogrel Tablets with Insights into Industrial Manufacturing Design. Pharmaceutics.
- Reddy, P. L.; Shanmugasundaram, S. , Optimizing Process Parameters for Controlled Drug Delivery: A Quality by Design (QbD) Approach in Naltrexone Microspheres. AAPS PharmSciTech 2024, 25(5), 105. [Google Scholar] [CrossRef]
- Rampado, R.; Peer, D. , Design of experiments in the optimization of nanoparticle-based drug delivery systems. J Control Release 2023, 358, 398–419. [Google Scholar] [CrossRef]
- Abdel Hamid, E. M.; Amer, A. M.; Mahmoud, A. K.; Mokbl, E. M.; Hassan, M. A.; Abdel-Monaim, M. O.; Amin, R. H.; Tharwat, K. M. , Box-Behnken design (BBD) for optimization and simulation of biolubricant production from biomass using aspen plus with techno-economic analysis. Sci Rep 2024, 14(1), 21769. [Google Scholar] [CrossRef]
- M, M.; G, C.; A, B.-S.; CI, S.-D.; C, V.-I.; R, S.-E.; R, d. M. B.; F, L.; I, P.; R, N.; S, R. , Thixotropic Hydrogels Based on Laponite® and Cucurbituril for Delivery of Lipophilic Drug Molecules. ChemPlusChem 2024, 89(1), e202300370. [Google Scholar]
- Z, Z.; S, T.; SS, F. , Vitamin E TPGS as a molecular biomaterial for drug delivery. Biomaterials 2012, 33(19), 4889–906. [Google Scholar]
- SJ, L.; YI, J.; HK, P.; DH, K.; JS, O.; SG, L.; HC, L. , Enzyme-responsive doxorubicin release from dendrimer nanoparticles for anticancer drug delivery. International journal of nanomedicine 2015, 10, 5489–503. [Google Scholar]
- S, M.; J, Z.; B, L.; X, L.; T, W.; X, H.; P, C.; H, W.; Y, S.; G, P.; L, B. , A 3D bioprinted nano-laponite hydrogel construct promotes osteogenesis by activating PI3K/AKT signaling pathway. Materials today. Bio 2022, 16, 100342. [Google Scholar]
- C, L.; F, J.; Z, X.; L, F.; Y, L.; S, W.; J, L.; XK, O. , Efficient Delivery of Curcumin by Alginate Oligosaccharide Coated Aminated Mesoporous Silica Nanoparticles and In Vitro Anticancer Activity against Colon Cancer Cells. Pharmaceutics.
- ME, O.; AM, A.; NK, B.; AH, H.; R, G.; G, S. , Curcumin and Silver Doping Enhance the Spinnability and Antibacterial Activity of Melt-Electrospun Polybutylene Succinate Fibers. Nanomaterials (Basel, Switzerland).
- Prado, J. R.; Vyazovkin, S. , Activation energies of water vaporization from the bulk and from laponite, montmorillonite, and chitosan powders. Thermochimica Acta.
- Haghighi, E.; Abolmaali, S. S.; Dehshahri, A.; Mousavi Shaegh, S. A.; Azarpira, N.; Tamaddon, A. M. , Navigating the intricate in-vivo journey of lipid nanoparticles tailored for the targeted delivery of RNA therapeutics: a quality-by-design approach. J Nanobiotechnology 2024, 22(1), 710. [Google Scholar] [CrossRef]
- Jeong, J. H.; Yoon, T. H.; Ryu, S. W.; Kim, M. G.; Kim, G. H.; Oh, Y. J.; Lee, S. J.; Kwak, N. W.; Bang, K. H.; Kim, K. S. , Quality by Design (QbD)-Based Development of a Self-Nanoemulsifying Drug Delivery System for the Ocular Delivery of Flurbiprofen. Pharmaceutics.
- Liu, G.; An, D.; Li, J.; Deng, S. , Zein-based nanoparticles: Preparation, characterization, and pharmaceutical application. Front Pharmacol 2023, 14, 1120251. [Google Scholar] [CrossRef] [PubMed]
- Bushi, E.; Malaj, L.; Di Martino, P.; Mataj, G.; Myftari, B. , Formulation of semi solid dosage forms for topical application utilizing quality by design (QbD) approach. Drug Dev Ind Pharm 2025, 51(7), 670–678. [Google Scholar] [CrossRef] [PubMed]
- Pielenhofer, J.; Meiser, S. L.; Gogoll, K.; Ciciliani, A. M.; Denny, M.; Klak, M.; Lang, B. M.; Staubach, P.; Grabbe, S.; Schild, H.; Radsak, M. P.; Spahn-Langguth, H.; Langguth, P. , Quality by Design (QbD) Approach for a Nanoparticulate Imiquimod Formulation as an Investigational Medicinal Product. Pharmaceutics.
- Koo, J.; Lim, C.; Oh, K. T. , Recent Advances in Intranasal Administration for Brain-Targeting Delivery: A Comprehensive Review of Lipid-Based Nanoparticles and Stimuli-Responsive Gel Formulations. Int J Nanomedicine 2024, 19, 1767–1807. [Google Scholar] [CrossRef] [PubMed]
- Gurumukhi, V. C.; Bari, S. B. , Development of ritonavir-loaded nanostructured lipid carriers employing quality by design (QbD) as a tool: characterizations, permeability, and bioavailability studies. Drug Deliv Transl Res 2022, 12(7), 1753–1773. [Google Scholar] [CrossRef]
- Dobó, D. G.; Németh, Z.; Sipos, B.; Cseh, M.; Pallagi, E.; Berkesi, D.; Kozma, G.; Kónya, Z.; Csóka, I. , Pharmaceutical Development and Design of Thermosensitive Liposomes Based on the QbD Approach. Molecules.
- Stealey, S. T.; Gaharwar, A. K.; Zustiak, S. P. , Laponite-Based Nanocomposite Hydrogels for Drug Delivery Applications. Pharmaceuticals (Basel).
- Pawar, N.; Peña-Figueroa, M.; Verde-Sesto, E.; Maestro, A.; Alvarez-Fernandez, A. , Exploring the Interaction of Lipid Bilayers with Curcumin-Laponite Nanoparticles: Implications for Drug Delivery and Therapeutic Applications. Small 2024, 20(52), e2406885. [Google Scholar] [CrossRef] [PubMed]
- Kumar, A.; Singh, A.; Flora, S. J. S.; Shukla, R. , Box-Behnken Design Optimized TPGS Coated Bovine Serum Albumin Nanoparticles Loaded with Anastrozole. Curr Drug Deliv 2021, 18(8), 1136–1147. [Google Scholar] [CrossRef] [PubMed]
- Tejashree, W.; Swetha, K. L.; Aniruddha, R.; Ranendra Narayan, S.; Gautam, S. , Quality by design assisted optimization of temozolomide loaded PEGylated lyotropic liquid crystals: Investigating various formulation and process variables along with in-vitro characterization. Journal of Molecular Liquids 2022. [Google Scholar]
Figure 1.
Summary of the general workflow used for the QbD of a DoE.
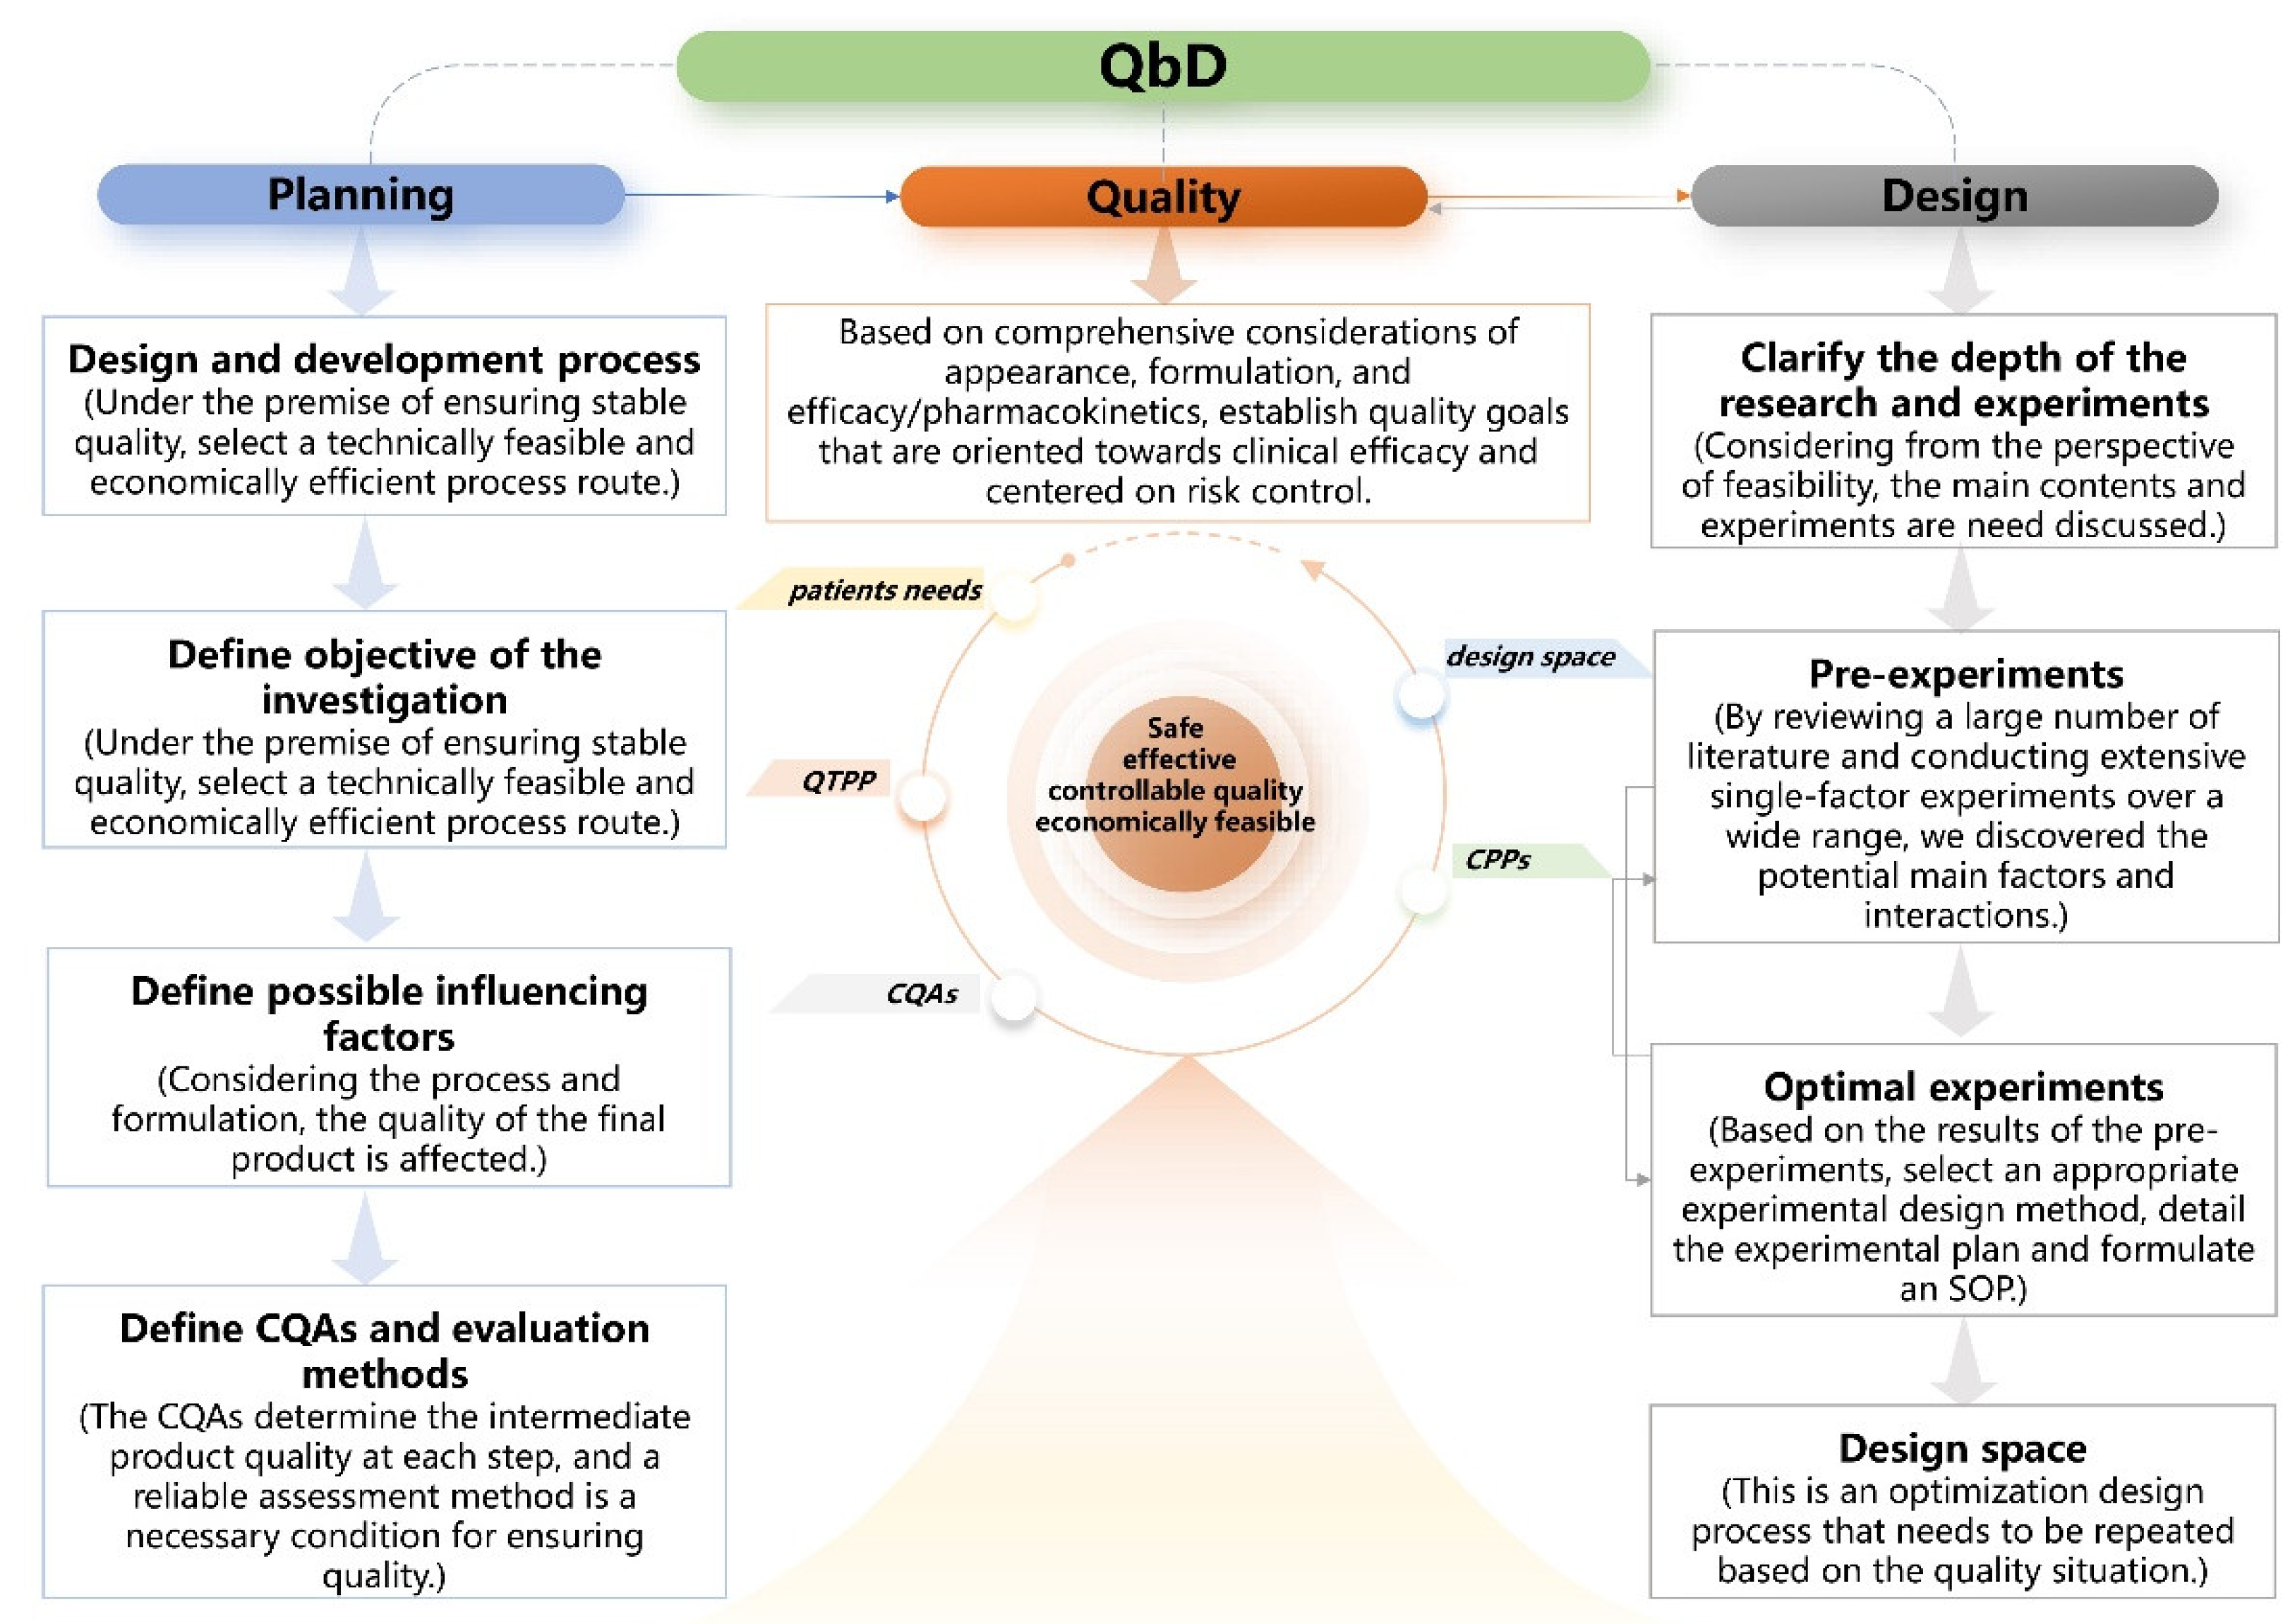
Figure 2.
Figure 2. Ishikawa diagram of the QTPP and the related factors.
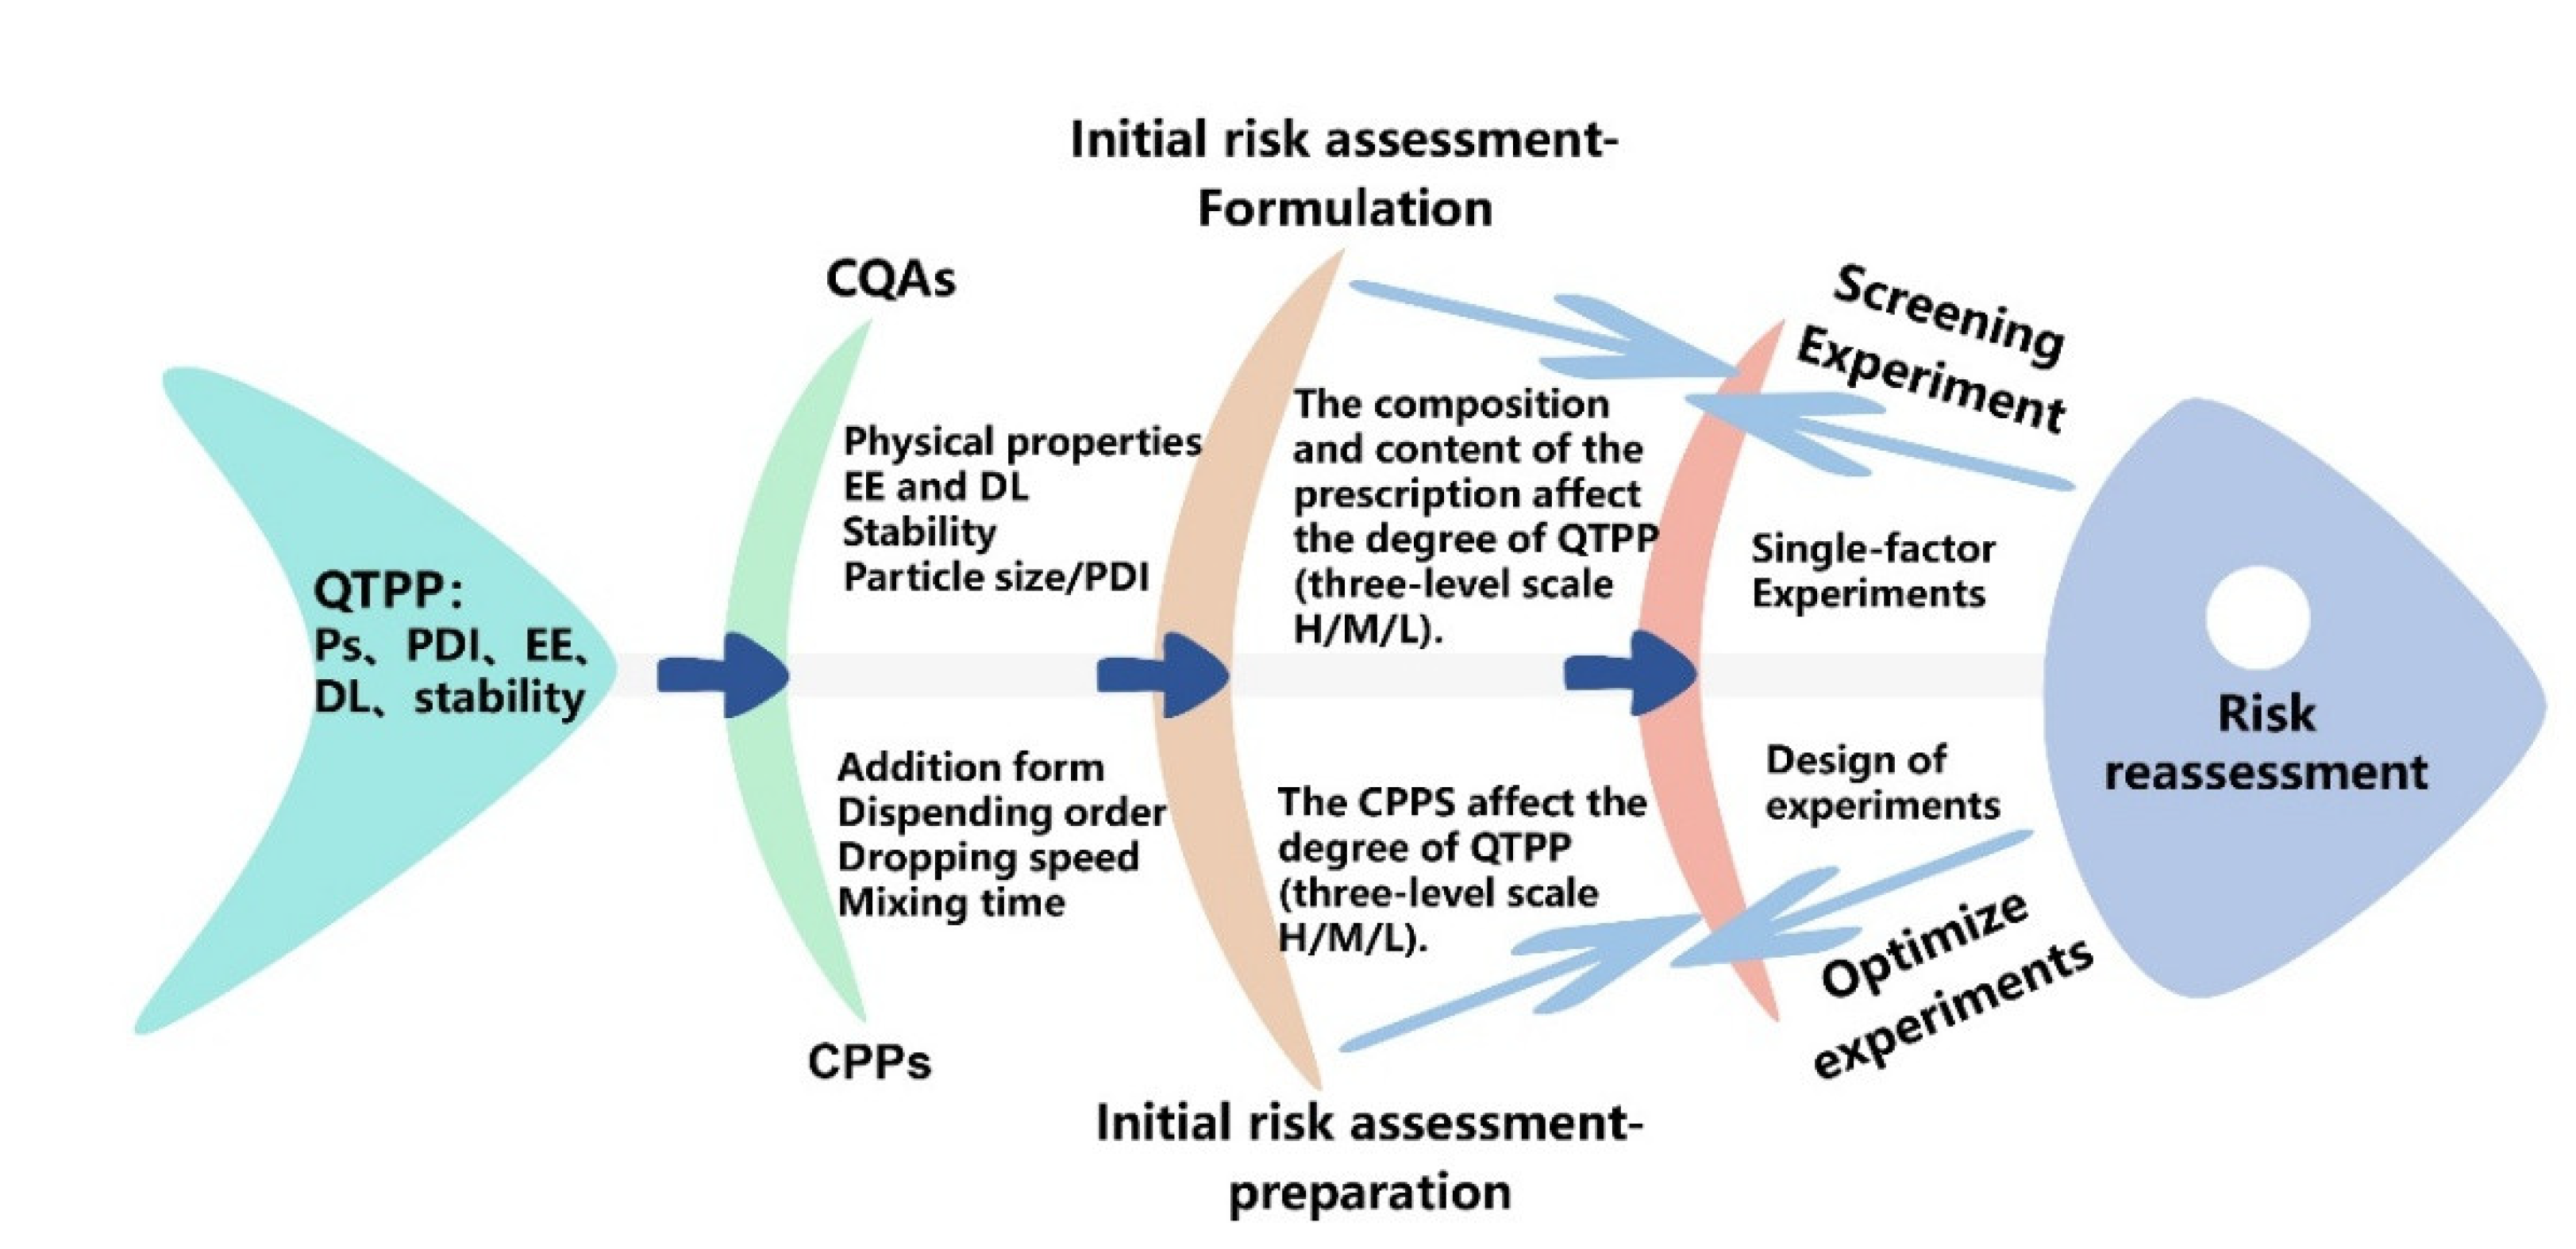
Figure 3.
Initial risk assessment of CPPs.
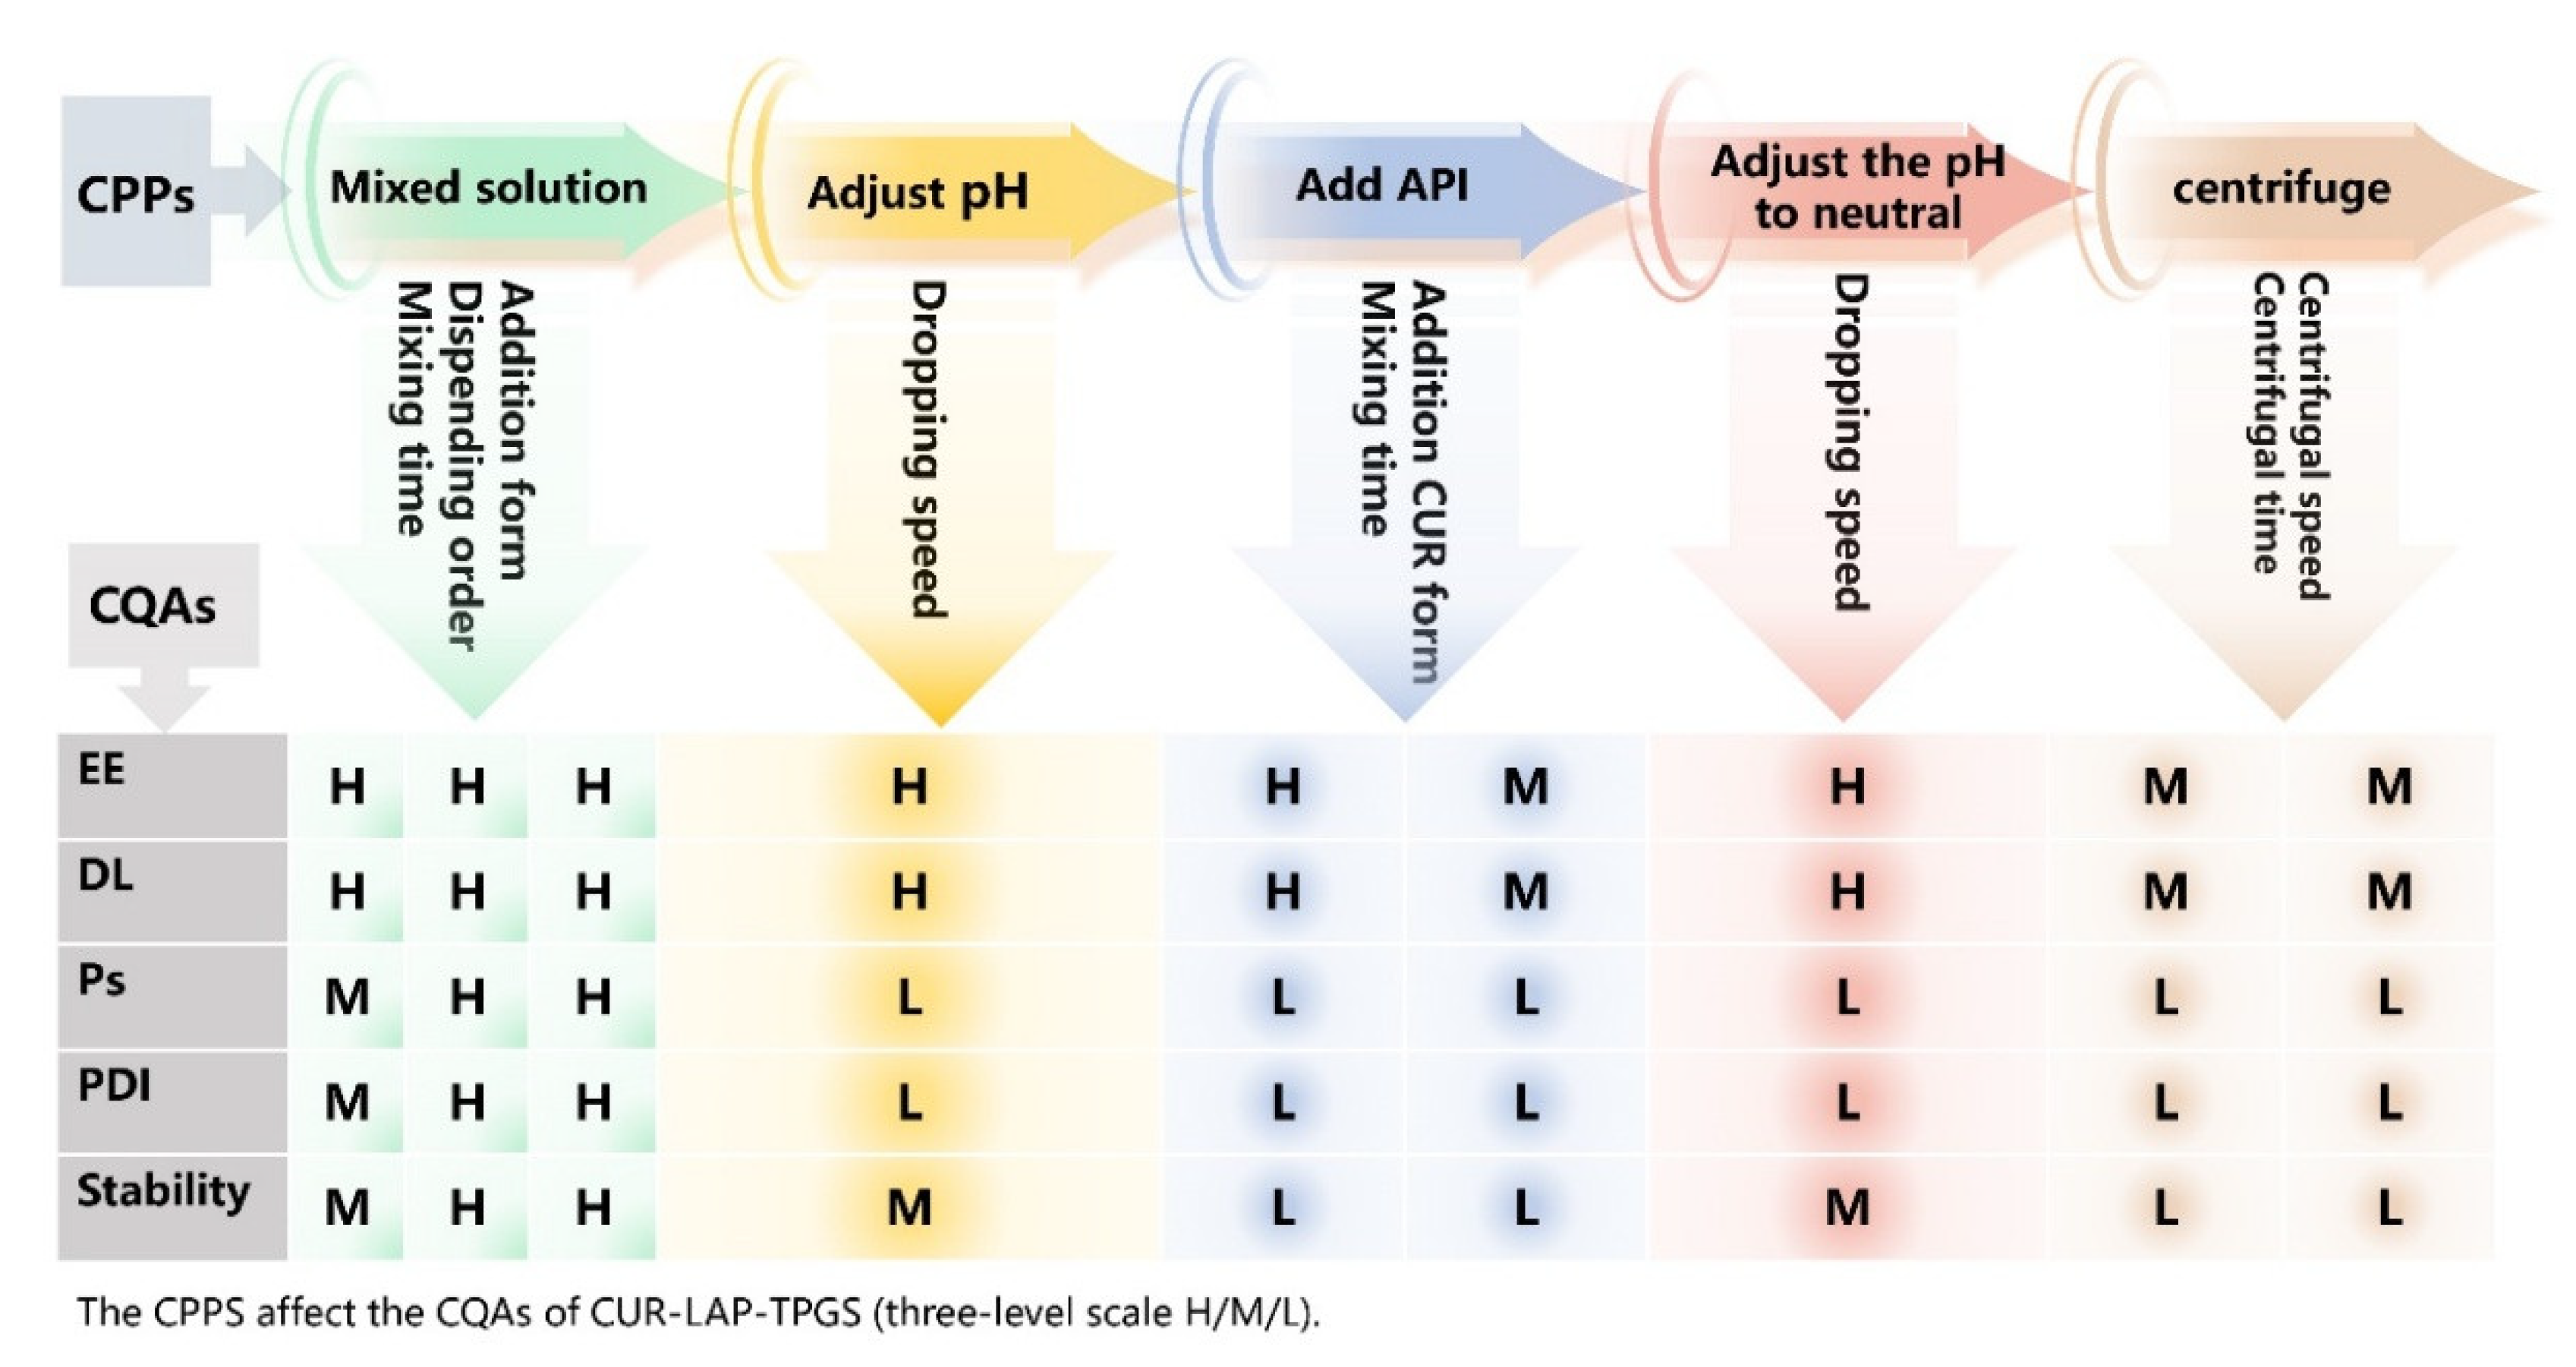
Figure 4.
Initial risk assessment of prescription.
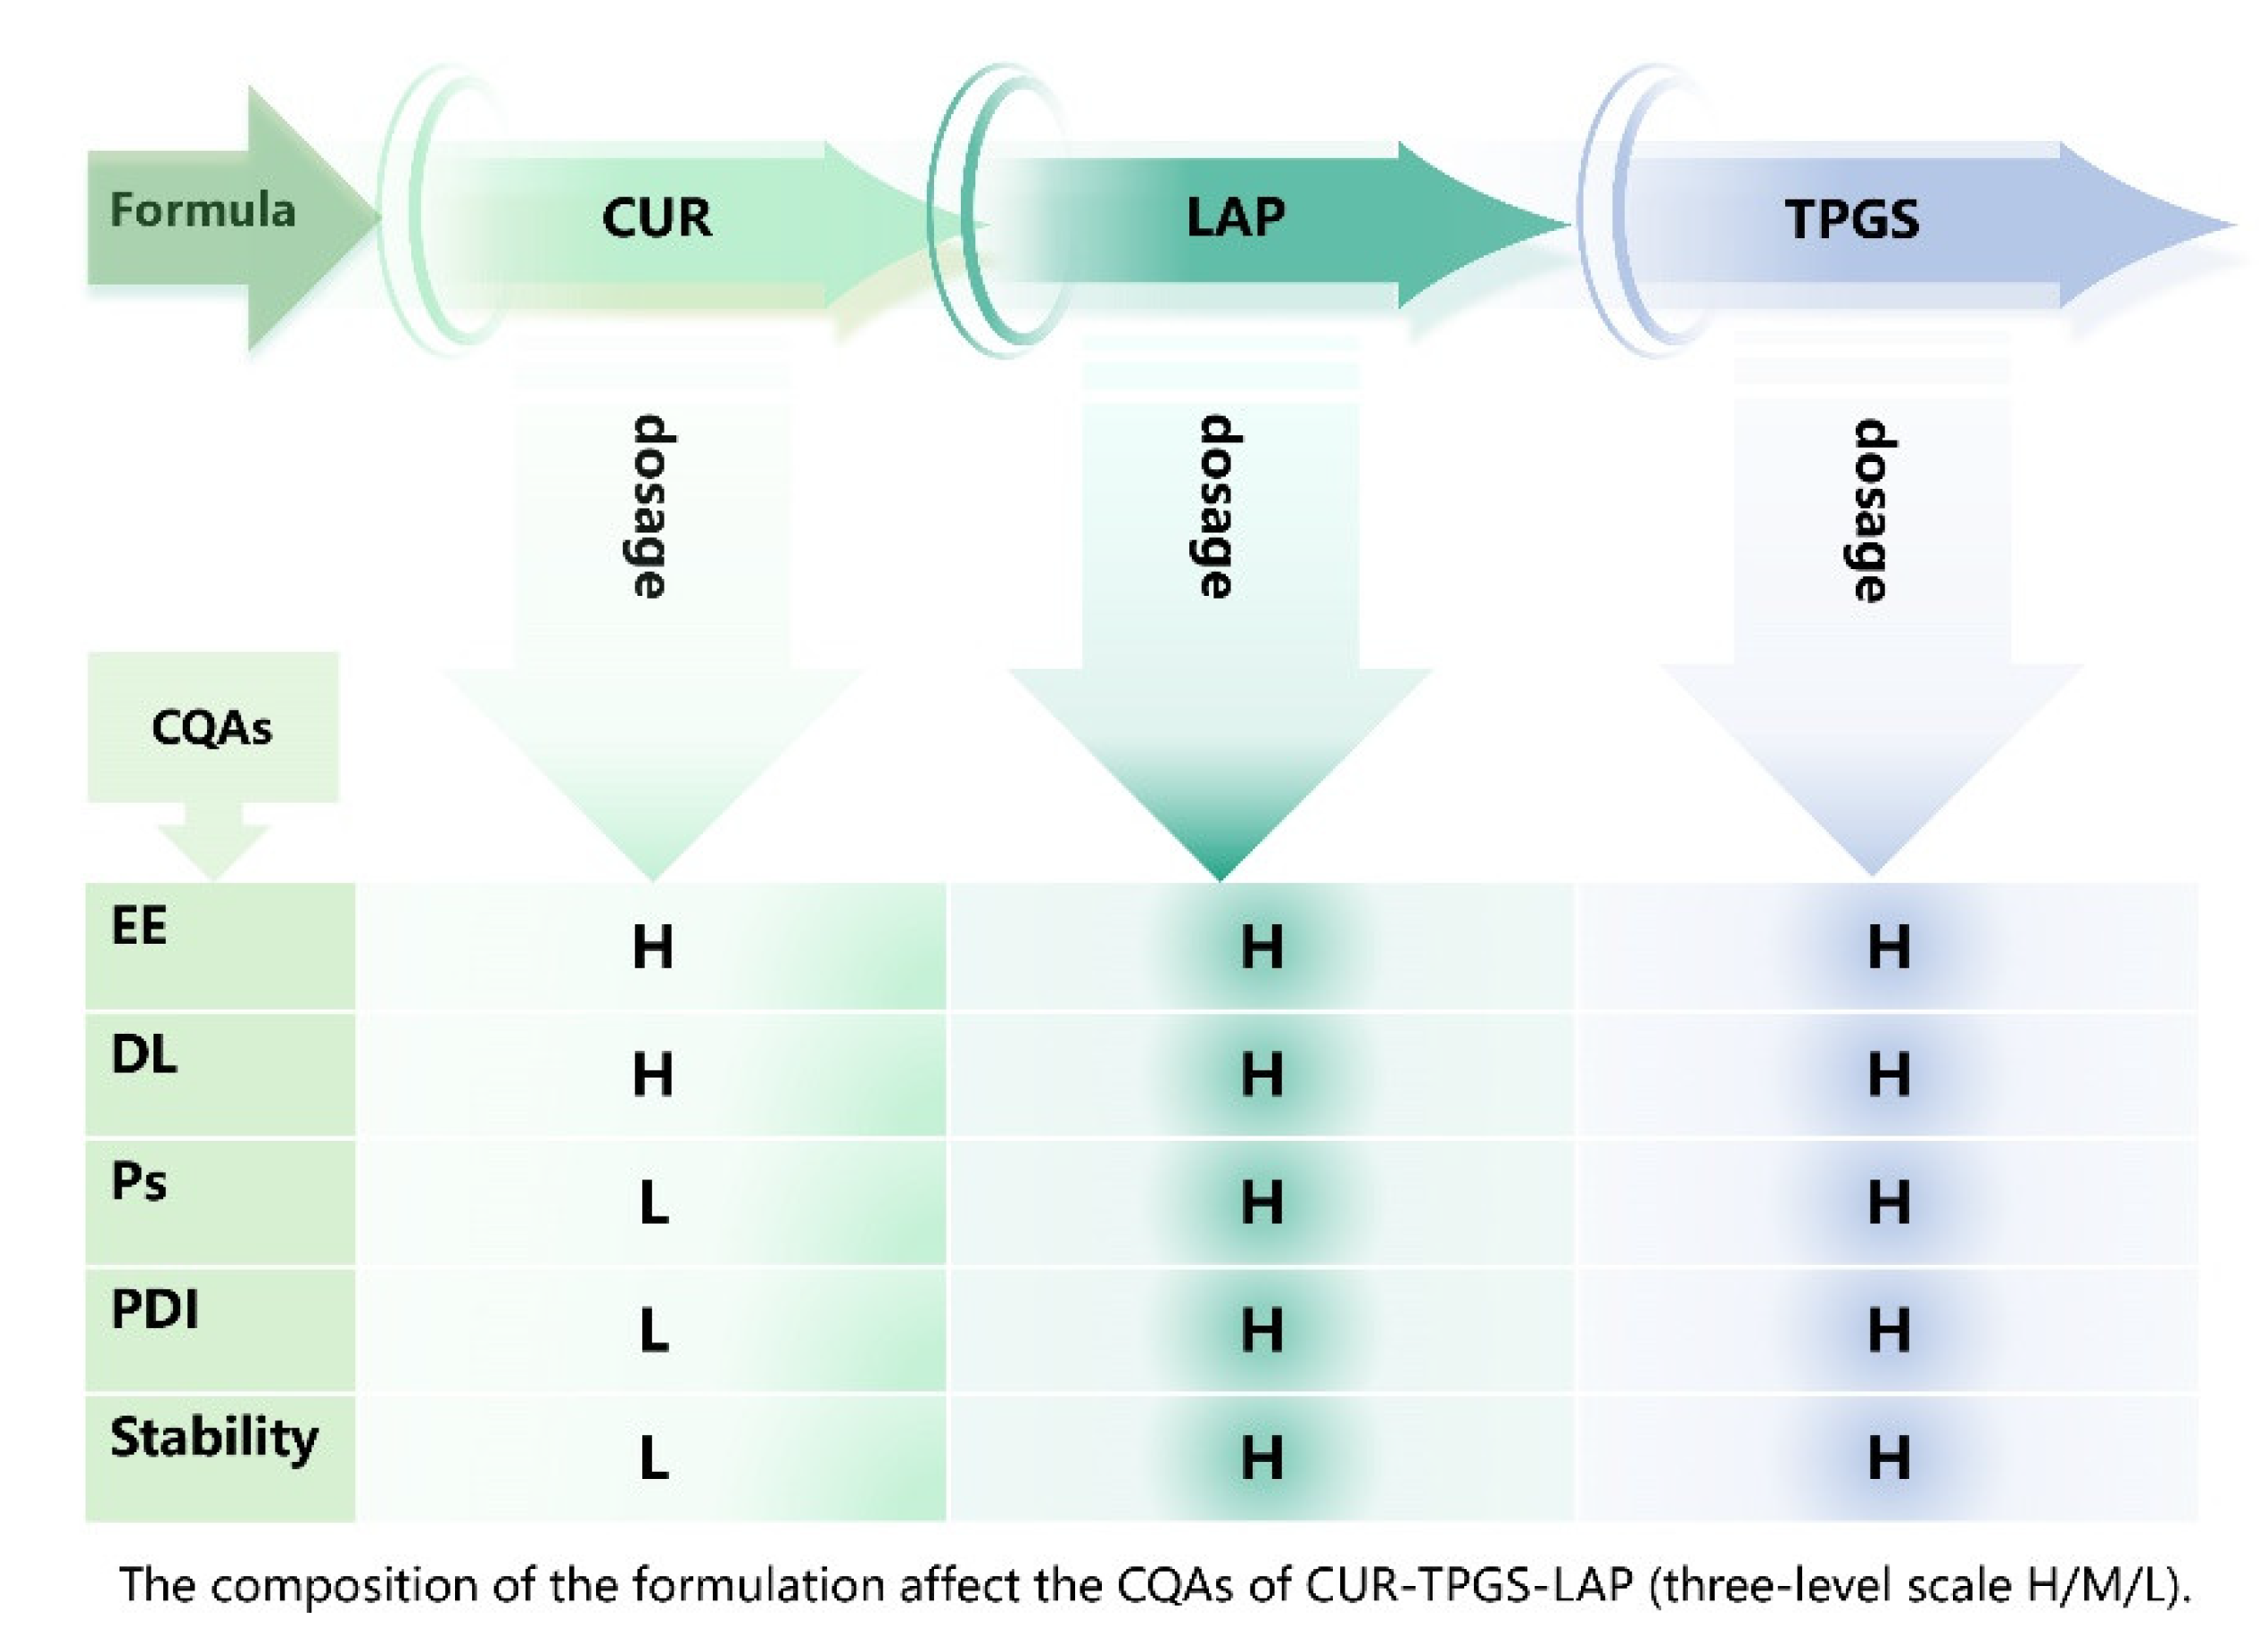
Figure 5.
The Overlapping contour plot of each response value and optimal prescription.
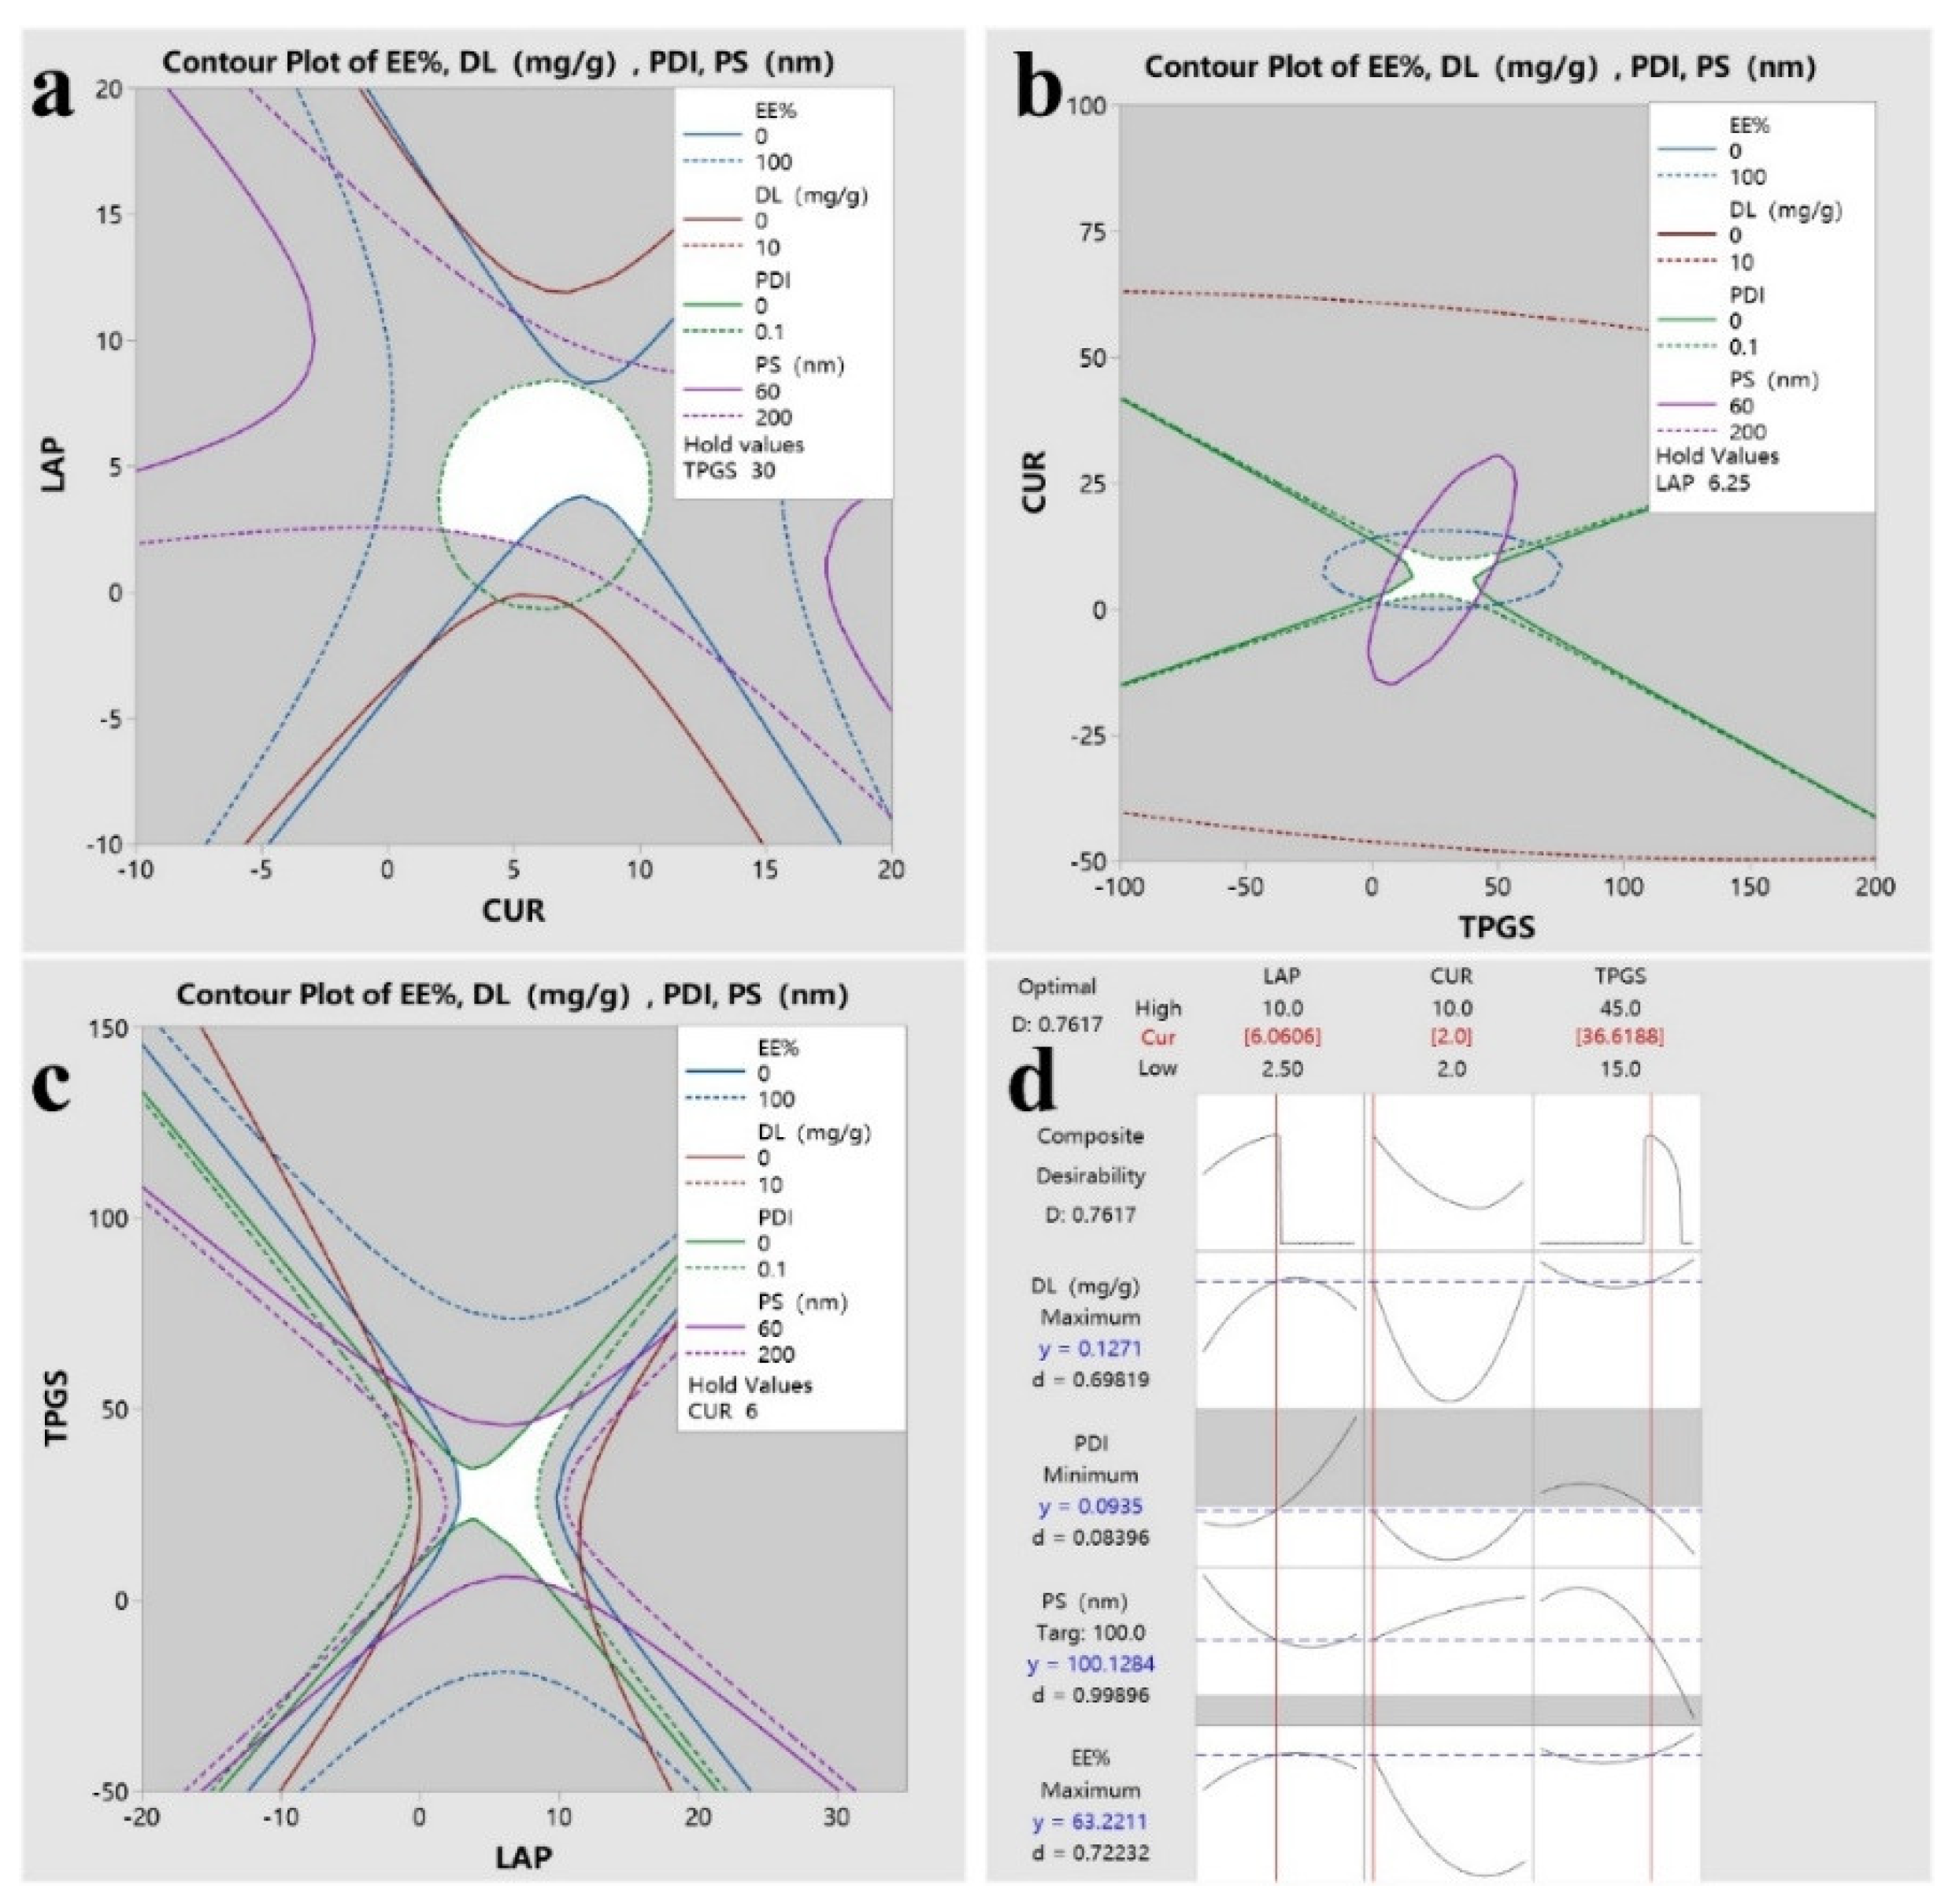
Figure 6.
The characterization of the optimal CUR-TPGS-LAP. (a) TEM image, and (b) High-resolution TEM images. (c) FTIR spectrum. (d) DSC curve. (e) In vitro drug release. (f) The changes in Ps and PDI after storage at 4°C for 3d, 7d, 14d, and 28d. (mean ± S.D., n = 3).
Figure 6.
The characterization of the optimal CUR-TPGS-LAP. (a) TEM image, and (b) High-resolution TEM images. (c) FTIR spectrum. (d) DSC curve. (e) In vitro drug release. (f) The changes in Ps and PDI after storage at 4°C for 3d, 7d, 14d, and 28d. (mean ± S.D., n = 3).
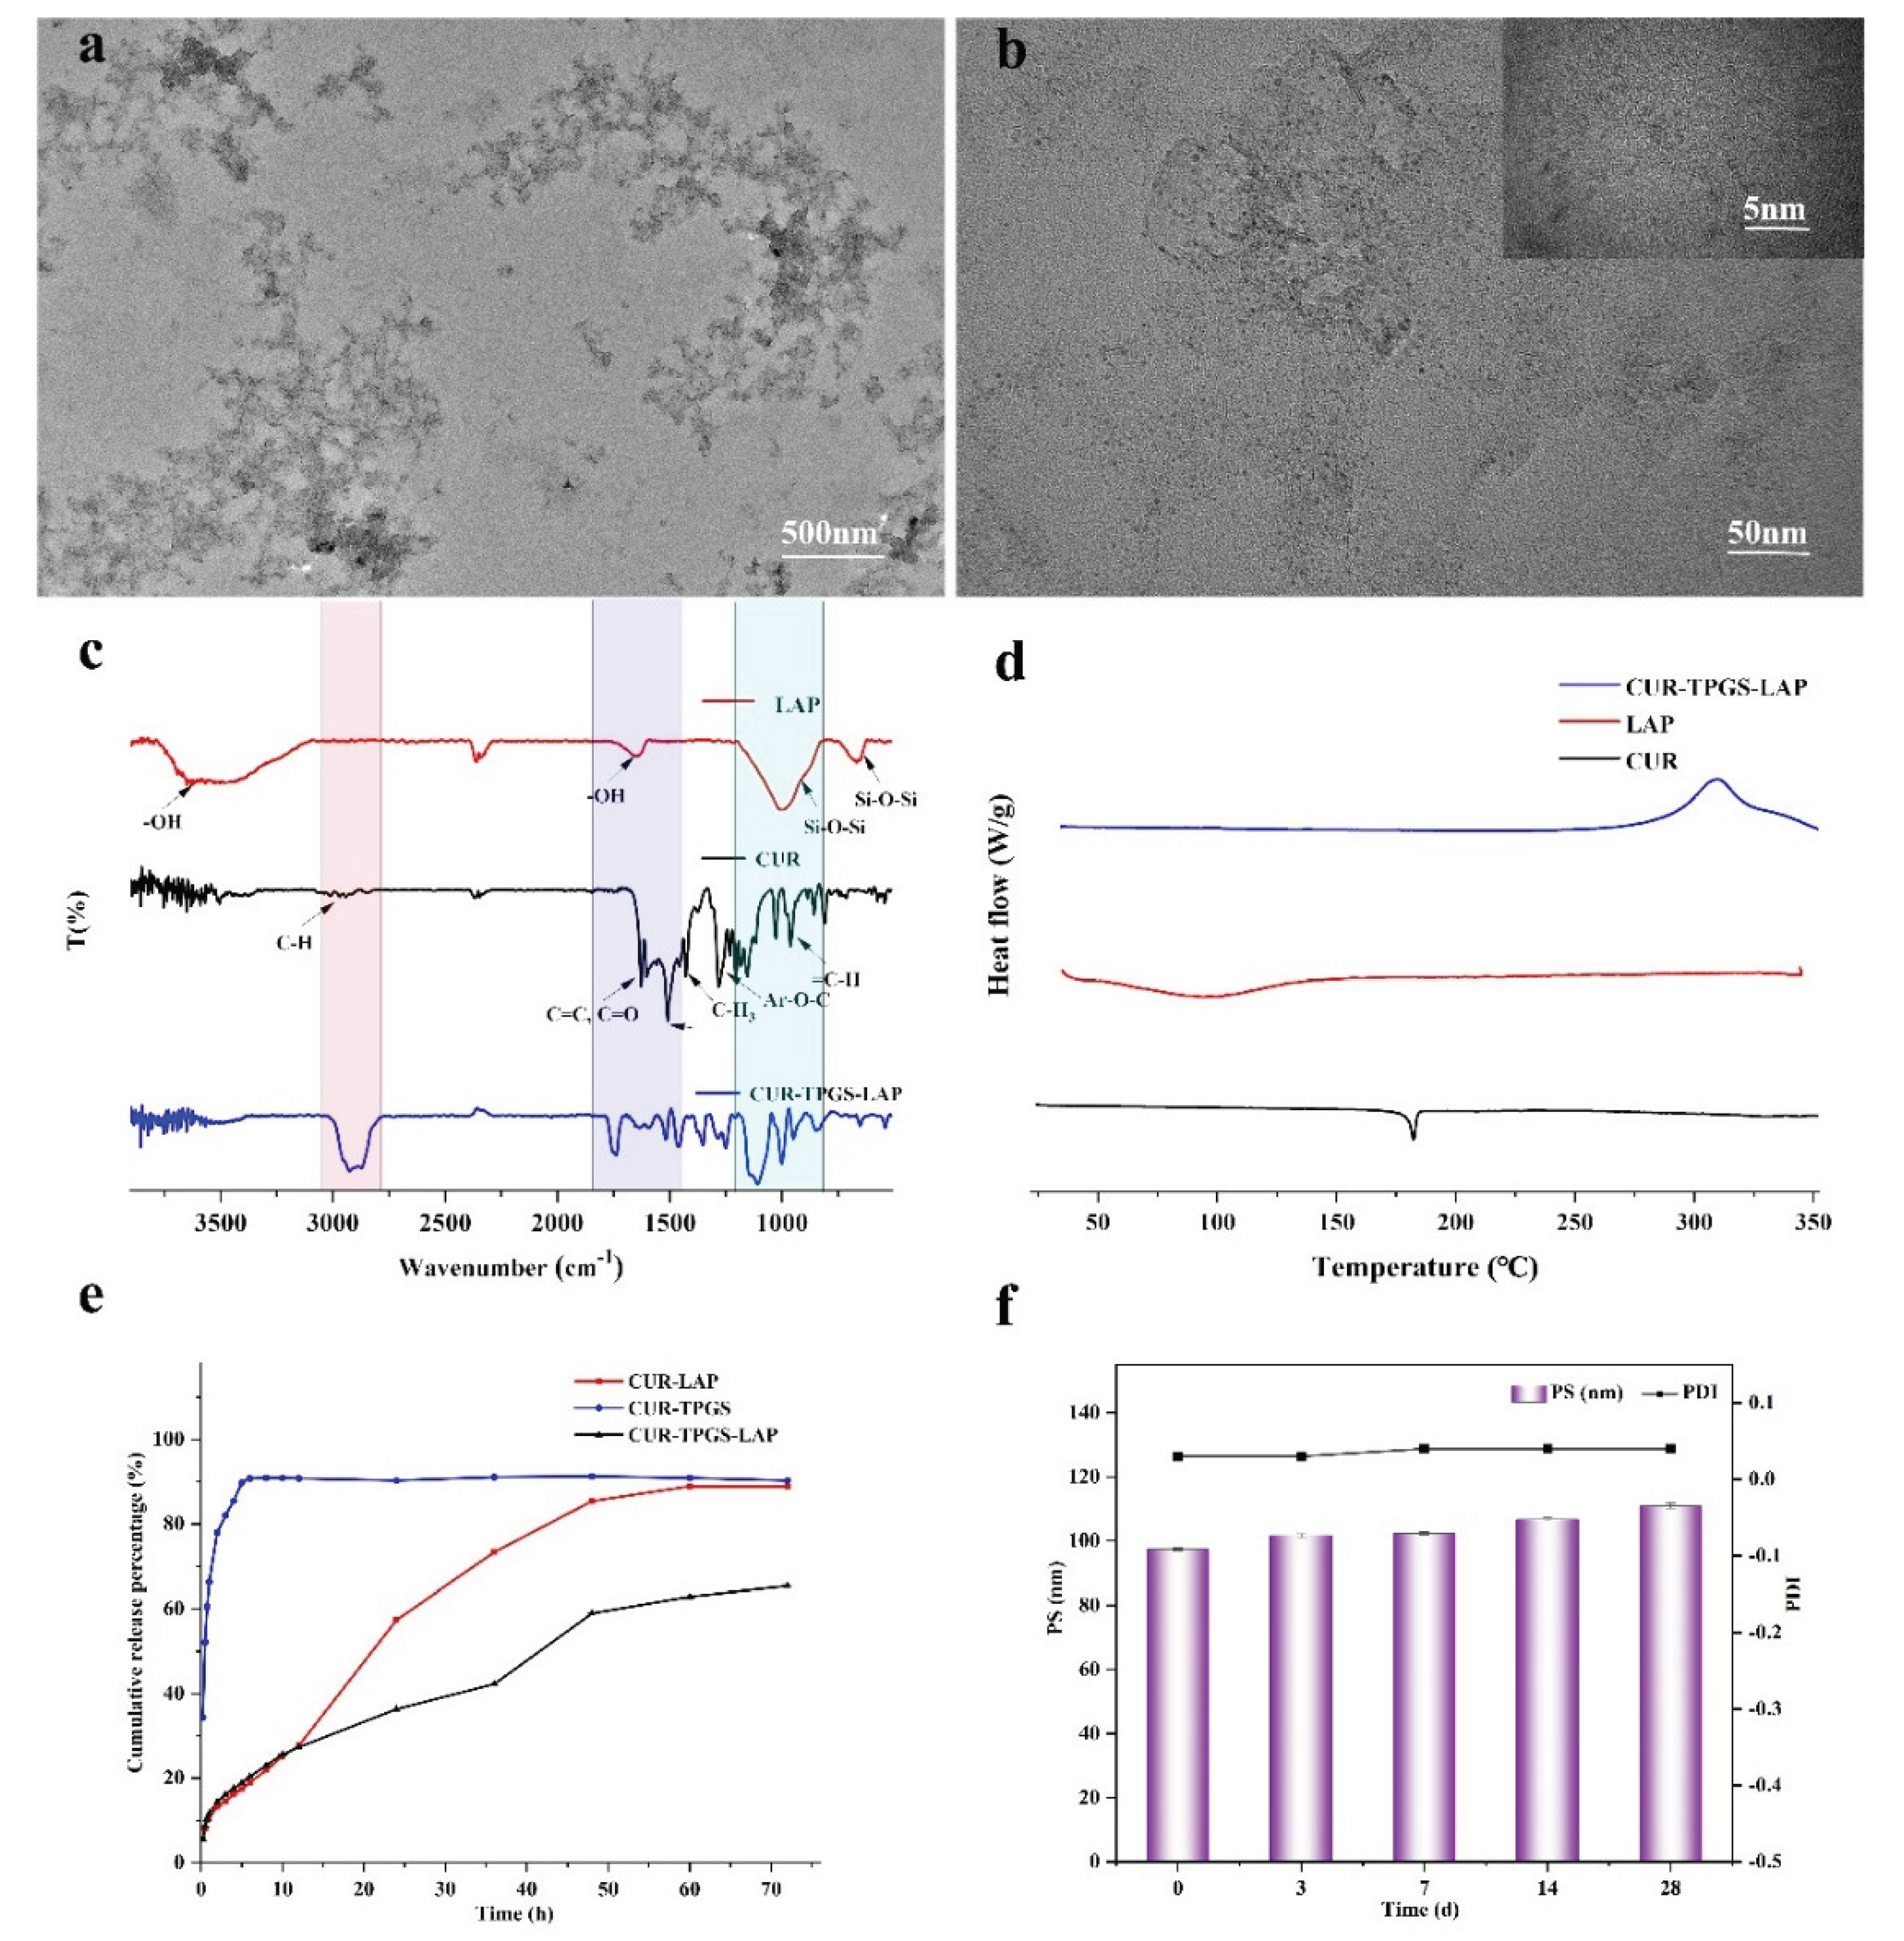

Table 1.
Confirm the CQAS.
| Quality attributes | Is it a critical quality attribute? | Justification |
| Physical properties | No | Physical properties such as color, odor and appearance are not CQA, as these factors have no direct relationship with the efficacy of the formulation. |
| Encapsulation efficiency (EE)/ Drug Loading (DL) |
Yes | A higher encapsulation rate and drug loading capacity are crucial for achieving the maximum drug release and regulating the drug treatment concentration. Therefore, they are regarded as CQA. |
| Partical size (Ps/ Partical size distribution index (PDI) | Yes | Nanoparticles can more effectively pass through biological membranes within the appropriate nanoscale range, thereby improving solubility and absorption properties and enhancing the bioavailability of drugs. Therefore, they are regarded as CQA. |
| Stability | Yes | The stability of nanoparticles has a significant impact on the release of drugs and their efficacy. Therefore, it is regarded as a CQA |
Table 2.
Examine the situation of the addition of excipients and API in the process.
| Ingredient | state | DL(mg/g) | EE(%) | Ps (nm) | PDI |
| CUR | solution | 0.01±0.00 | 12.87±0.04 | 2670.00±1565.22 | 0.45±0.06 |
| powder | 0.01±0.00 | 14.99±0.11 | 1220.33±319.28 | 0.40±0.05 | |
| TPGS | - | 0.004±0.00 | 15.03±0.04 | 339.67±11.73 | 0.35±0.10 |
| + | 0.01±0.00 | 22.83±0.04 | 204.00±6.16 | 0.26±0.02 | |
| LAP | solution | 0.01±0.00 | 16.96±0.07 | 138.33±1.25 | 0.21±0.01 |
| powder | 0.02±0.00 | 29.85±0.14 | 118.67±0.94 | 0.12±0.01 |
Table 3.
The level of factors in the prescription.
| Factors(mg) | Levels | ||
| -1 | 0 | 1 | |
| X1 | 2.5 | 6.25 | 10 |
| X2 | 2 | 6 | 10 |
| X3 | 15 | 30 | 45 |
Table 4.
Box-Behnken Design Experiment.
| Run Order | factors | ||||||
| A | B | C | Y1 | Y2 | Y3 | Y4 | |
| 1 | 0 | 1 | 1 | 0.14 | 13.57 | 128.0 | 0.041 |
| 2 | -1 | -1 | 0 | 0.06 | 30.75 | 223.0 | 0.023 |
| 3 | 1 | 0 | -1 | 0.03 | 4.23 | 206.0 | 0.059 |
| 4 | -1 | 0 | 1 | 0.06 | 10.58 | 48.4 | 0.032 |
| 5 | 0 | -1 | 1 | 0.17 | 85.90 | 46.6 | 0.028 |
| 6 | 1 | -1 | 0 | 0.09 | 44.37 | 121.0 | 0.336 |
| 7 | 0 | 0 | 0 | 0.06 | 9.97 | 169.0 | 0.035 |
| 8 | 0 | 0 | 0 | 0.06 | 9.92 | 141.0 | 0.043 |
| 9 | 0 | -1 | -1 | 0.15 | 75.56 | 107.0 | 0.151 |
| 10 | 1 | 0 | 1 | 0.05 | 8.88 | 103.0 | 0.045 |
| 11 | 0 | 0 | 0 | 0.06 | 9.92 | 143.0 | 0.025 |
| 12 | -1 | 0 | -1 | 0.05 | 8.94 | 167.0 | 0.037 |
| 13 | 0 | 1 | -1 | 0.05 | 5.16 | 76.5 | 0.03 |
| 14 | 1 | 1 | 0 | 0.10 | 9.83 | 202.0 | 0.318 |
| 15 | -1 | 1 | 0 | 0.12 | 11.47 | 172.0 | 0.034 |
Disclaimer/Publisher’s Note: The statements, opinions and data contained in all publications are solely those of the individual author(s) and contributor(s) and not of MDPI and/or the editor(s). MDPI and/or the editor(s) disclaim responsibility for any injury to people or property resulting from any ideas, methods, instructions or products referred to in the content. |
© 2025 by the authors. Licensee MDPI, Basel, Switzerland. This article is an open access article distributed under the terms and conditions of the Creative Commons Attribution (CC BY) license (http://creativecommons.org/licenses/by/4.0/).
Copyright: This open access article is published under a Creative Commons CC BY 4.0 license, which permit the free download, distribution, and reuse, provided that the author and preprint are cited in any reuse.


