
Submitted:
12 January 2026
Posted:
13 January 2026
You are already at the latest version
Abstract
Energy efficiency retrofits are central to climate policy, yet their implications for indoor environmental quality (IEQ) and occupant health remain underexplored. This study investigates IEQ outcomes following staged retrofits in Irish social housing, where achieving Building Energy Rating (BER) targets is the primary performance metric. Four dwellings, three retrofitted and one control, were monitored over six weeks during the heating sea-son. Built in the 1980s, these homes represent the typical social and private housing stock of that era. Continuous measurements of carbon dioxide, temperature, relative humidity, and thermal performance were complemented by analyses of vapour pressure excess and ventilation rates. While all retrofitted homes achieved BER improvement targets, persistent IEQ challenges were identified. Elevated pollutant concentrations and increased condensation/mould risk occurred in the presence of inadequate ventilation. Thermal anomalies and cold bridging were associated with cavity wall insulation, whereas external wall insulation provided more stable surface temperatures and reduced moisture-related risks. These results underscore the complex interplay between retrofit measures, occupancy patterns, and ventilation performance. The study highlights the need for retrofit strategies that integrate energy efficiency with occupant health objectives. At scale, retrofit pro-grammes risk embedding systemic vulnerabilities unless ventilation and moisture control are prioritised, with implications that extend to health, wellbeing, and long-term building resilience.
Keywords:
social housing
; dwelling retrofit
; condensation
; ventilation
; indoor environmental quality
1. Introduction
Ireland’s Climate Action Plan (CAP) 2025 [1] is positioned as a pivotal policy instrument in the national drive to enhance energy efficiency. It reflects a broader European agenda aimed at reducing energy consumption in the building sector, which currently accounts for approximately 40% of total energy use. Meeting these targets demands an immediate reduction in fossil fuel consumption and a rapid improvement in building energy performance across the entire built environment stock. From a social housing perspective, the Republic of Ireland’s local authorities (municipalities) collectively own approximately 143,000 units [2], with plans to retrofit 36,500 of these dwellings over the current decade [3]. Supporting this effort, the current Energy Efficiency Retrofit Programme (EERP) (commenced in 2013 but revised in 2021), is designed as a ten-year initiative to align with our CAP goals. The current phase of the programme incorporates previously applied singular retrofit measures, reflecting both the incremental nature of energy upgrades historically undertaken by local authorities and the strategic leveraging of previous investments to align with the current funding framework.
This approach is similar to other jurisdictions [4,5,6,7], aligning with the Energy Efficiency Directive [8] principle of ‘energy efficiency first’ as a central pillar of retrofit policy. However, it is imperative that retrofit measures aimed at reducing regulated energy use do not compromise the integrity or quality of the indoor environment. Ensuring that interventions improve conditions within dwellings is essential to safeguarding occupant health and wellbeing. This exploratory study investigates the impact of Building Energy Rating (BER)/cost-optimal focussed retrofit measures currently applied to local authority housing. As the chosen retrofit measures have historically yielded variable outcomes, this study evaluates ventilation performance, moisture load and vapour pressure excess, and the thermal performance of external walls. The research focuses on the operational outcomes of these strategies and contributes to a broader research agenda that draws on post-retrofit data to explore whether the uniform application of retrofit strategies across a heterogeneous housing stock may result in unintended consequences for both buildings and their occupants. This exploratory work may highlight the necessity for larger-scale investigations to validate observed patterns and strengthen the evidence base for future policy and practice.
Literature Review
The European Performance of Buildings Directive (EPBD) requires EU member states to establish minimum energy performance standards for buildings and building elements, based on cost-optimal methodologies [9]. In Ireland, this process is implemented using the Dwelling Energy Assessment Procedure (DEAP), the official calculation method and software for assessing building energy performance in accordance with EPBD guidelines [10]. The cost-optimal analysis evaluates a range of energy-efficient measures and renewable technologies, factoring in capital, operational, maintenance, and carbon costs. Regulation 244/2012 [11] further supports the EPBD by stipulating that national minimum energy performance requirements must not fall more than 15% below the cost-optimal benchmark. In an Irish context, a BER of B2 is considered the benchmark for excellent energy performance and home comfort [12] relating to a primary energy performance of less than 125 kWh/m2/yr. This is the minimum energy performance requirement that should be achieved in so far as this is technically, functionally and economically feasible. For the majority of existing dwellings, the energy performance requirement is within 15% of the cost optimal primary energy level as required by the cost optimal guidance [13]. The BER is calculated according to the energy performance of the house and its associated CO2 emissions, accounting for regulated energy use under specific standard conditions, considering dwelling typology, year of construction, orientation, overall and room specific dimensions, insulation levels, ventilation characteristics, lighting and space/water heating systems. Energy performance is expressed via (a) primary energy use per unit floor area per year (kWh/m2/yr) represented on an A to G scale and (b) associated CO2 emissions (kgCO2/m2/yr) [14].
From a social housing perspective, the EERP was introduced in 2013 to support the upgrade of local authority owned social homes in need of insulation and energy improvements. Phase 1 focused on cavity wall and attic insulation, while Phase 2 expanded to include broader fabric and heating upgrades. These phases concluded in 2020 and have since been replaced by a more comprehensive approach. The current scheme includes eligible measures such as attic and cavity wall insulation, external wall insulation, window and door replacements, heat pump installations, and related ancillary works. It also permits the inclusion of mechanical ventilation once a post-works air permeability of less than 5 m3/hr.m2 is achieved and independent ventilation validation is demonstrated [15]. Annual funding is allocated based on performance against previous targets and local authority forecasts, and may be reallocated between local authorities to ensure national retrofit targets are met [2,15,16,17]. Grants are conditioned by a funding ceiling, with maximum available allocations ranging from €42,350 for mid-terrace homes and apartment units to €48,850 for end-of-terrace, semi-detached, and detached homes [15]. Local authorities are encouraged to select a balanced mix of properties across BER ratings to ensure that high-cost retrofits are offset by lower-cost interventions, enabling targets to be met within the allocated budget. This approach facilitates the achievement of retrofit targets within the constraints of allocated budgets as sub-optimal property selection may result in cost overruns, necessitating additional financial contributions from local authority resources. Only properties that achieve a post-retrofit BER of B2 or its cost-optimal equivalent are eligible for inclusion in the annual programme. Works that are ineligible, overdesigned, or exceed the necessary performance threshold will not receive financial support [2,15,16,17].
The revised EERP programme (2021-to date) marks a notable shift from shallow intervention to a staged approach aimed at achieving deeper retrofit status over time. The EERP retrofit model is structured to accommodate evolving BER requirements through a phased, incremental upgrade strategy. Viability is underpinned by several factors including the affordability of retrofit measures, the historical tendency of local authorities to implement energy improvements in stages and the strategic alignment of previous investments within the structure of annual funding frameworks. The relevance of this approach has been further reinforced by the recast Energy Performance of Buildings Directive (EPBD) 2018/844/EU, which introduces the concept of a building renovation passport under Article 19a [8].
While the current EERP aligns with prevailing regulatory and fiscal frameworks, the prioritisation of BER targets as the principal metric of success may overlook critical dimensions of IEQ. Poor IEQ is strongly associated with adverse health outcomes, including respiratory diseases, allergies, asthma, and severe illnesses such as lung cancer. However, efforts to improve energy efficiency and thermal comfort through increased airtightness and insulation have been shown to inadvertently elevate indoor pollutant and moisture concentrations [18]. Previous research has highlighted how a narrow focus on the reduction of regulated energy use and associated CO2 emissions can result in unintended consequences associated with retrofit interventions, including increased condensation and mould risk due to enhanced insulation and airtightness [19,20,21], elevated levels of some indoor pollutants [22,23,24,25] and the occurrence of overheating [18,26,27]. These issues often result from and are exacerbated by inadequate ventilation and reduced air exchange rates post-retrofit, highlighting the need for integrated strategies that balance the requirement for energy efficiency with the proper design, installation and ongoing maintenance of effective ventilation systems [22,28,29,30,31].
Sub-optimal internal conditions are further exacerbated by documented evidence of systemic non-compliance in the installation of retrofit insulation systems. Post-retrofit evaluations have revealed pervasive deficiencies in cavity wall and external wall insulation, with 63% of surveyed dwellings in Northern Ireland failing to conform to established industry standards [32]. In addition, incorrect installation practices are estimated to affect approximately six million properties across the UK [33]. Such failures not only undermine energy performance objectives but also exacerbate risks of moisture ingress, thermal bridging, and compromised ventilation; factors that further intensify IEQ concerns and highlight systemic gaps in quality assurance and regulatory oversight.
Considering the evolving regulatory landscape and funding structures underpinning the EERP retrofit strategy, the adoption of a staged approach represents a pragmatic response to technical, economic, and policy imperatives. However, as local authorities increasingly pursue BER and cost-optimal targets as primary indicators of retrofit success, it is essential to critically evaluate the broader implications of such interventions on the indoor environment. The presence of unintended consequences underscore the need to ensure that retrofit strategies designed to enhance energy performance do not inadvertently compromise IEQ. Equally critical is the correct and sequential implementation of staged retrofit measures to avoid cascading cause/effect relationships that can lead to fabric failures or energy performance gaps [34,35]. As BER/cost-optimal focused retrofit strategies continue to be implemented, and given prior evidence of unintended consequences, post-retrofit performance monitoring is essential to verify operational efficacy and to identify emergent systemic or occupant-related risks [36,37,38]. By conducting a detailed analysis of post-retrofit performance data, this preliminary study seeks to advance a comprehensive understanding of how current social housing retrofit strategy impacts dwelling performance and the quality of the indoor environment while recognising occupant health and wellbeing outcomes as emergent consequential effects.
2. Materials and Methods
This study employed a comparative post-retrofit monitoring approach over a six-week period during the heating season (December to January) to assess the IEQ of local authority (municipality) owned dwellings retrofitted under Ireland’s EERP. The research focused on four dwellings: three retrofitted to achieve a minimum BER of B2, and one control dwelling with no retrofit interventions. Each of the monitored dwellings were built between 1980 and 1989, a decade during which Ireland’s local authorities built 47,874 social homes, alongside the construction of 185,508 private dwellings [39], representing c. 11% of current housing stock [40] when there was limited or no requirement for thermal insulation [41,42]. Within this same period, the local authority responsible for the four study dwellings added 4,464 homes (including four apartments) to its own social housing register. Each monitored dwelling represents a typical example of the semi-detached or terraced typologies constructed during this era, characterised by uninsulated concrete ground floors, masonry cavity-wall construction, and pitched cold-roof assemblies. The dwellings are comparable in both size and internal configuration, with floor areas of 82.08 m² (TUD001), 80.56 m² (TUD002), 81.37 m² (TUD003), and 81.40 m² (TUD004) in line with the permissible social housing floor area standards in effect at the time (30m2-125m2) [43]. Each layout consists of a ground floor with a hallway, kitchen, and living room, and a first floor comprising a hallway, two bedrooms and one bathroom.
Local authority construction of social housing declined sharply during the 1990’s and is now provided via approved housing bodies and private developers [44,45]. Consequently, pre-1990 dwellings constitute most of the current local-authority housing stock in Ireland. Therefore, while the present dataset is limited in scale, the monitored dwellings are reflective of the broader thermal and construction characteristics of the national social housing stock. Furthermore, the staged retrofit measures applied in TUD001, TUD002, and TUD003 align with the standard national retrofit strategy adopted for dwellings of this type since 2013 [3]. Phase 1 and/or Phase 2 of the EERP (2013–2020) provided funding targeted at the less intrusive cavity wall/attic insulation and heating upgrade measures and retrofit over 75,000 local authority owned social homes at a total spend of €183 million [46]. Notably, retrofit measures applied under both phases of the EERP prioritise achieving specified BER targets through standardised, repeatable and cost-optimal interventions rather than maximising overall building-performance outcomes. This study aims to evaluate the potential for unintended consequences arising from this unidirectional approach and identify areas requiring further investigation. Although occupancy levels varied among the monitored dwellings, the ventilation rate analysis incorporated adjustments for occupancy loading to facilitate robust and meaningful comparative interpretation of the results.
2.1. Dwelling Typology
This study focused on dwellings retrofitted under the EERP to achieve a minimum BER of B2. Under this scheme each property underwent an individual pre-retrofit assessment to determine the specific measures required to meet this performance threshold. Table 1 presents the retrofit measures applied across the sample. Several measures were already in place prior to the commencement of the current EERP phase, reflecting the incremental nature of energy upgrades historically undertaken by local authorities.
Table 2 presents the projected reductions in regulated energy use (space heating, water heating, ventilation and lighting) resulting from the retrofit interventions applied to each dwelling. All retrofitted properties achieved a post-works BER of B1, in accordance with programme requirements stipulating a minimum improvement of 100 kWh in primary energy value [3]. The table also includes the results of post-retrofit airtightness testing conducted as part of this study. While new windows and doors were installed in the three retrofitted dwellings, the level and variance in results suggest that overall airtightness may have received less emphasis, despite its critical role in overall building performance.
2.2. Devices
Environmental data were collected using Airthings Wave Plus data loggers, which offer an accuracy of ±30 ppm or ±3% of the measured value within the calibrated range. This level of accuracy is maintained under ambient conditions of 15–35 °C and 0–85% relative humidity, following a minimum calibration period of seven days [47]. To ensure the integrity of measurements, sensors were installed outside the breathing zone to avoid localised concentrations from occupant exhalation. Placement was also optimised to minimise direct influence from ventilation sources such as windows and doors. Participants were not informed of the measurement capabilities of the devices to reduce behavioural bias. Data acquisition was conducted wirelessly at five-minute intervals, continuously over a 24-hour cycle in two locations per dwelling (kitchen and master bedroom). During the monitored period, Omega 8 Channel Handheld Thermocouple Thermometer data loggers were utilised to monitor and log the internal surface temperature of external walls. To facilitate placement, a FLIR E6 Pro thermal camera [48] was used to capture thermographic images for the identification of thermal bridging and insulation anomalies within the building envelope.
2.3. Ventilation Performance
Ventilation performance was assessed using two methods, each tailored to the room type and occupancy conditions. For bedrooms, data collected between 12:00am and 06:00am was considered, while for kitchens, the analysis focused on the period post 12:00am each night.
The bedroom timeframe was selected based on post hoc analysis of the CO₂ data, which indicated that these intervals most consistently corresponded with room occupancy across the monitored dwellings. As the number and physical activity of the occupants and therefore the CO2 generation rate over the monitored period is known, the steady state method [49] was employed to estimate the air exchange rate per hour. The calculation is based on the following equation
where n = number of persons in the space; GP = average CO2 generation rate per person (L·min−1·person−1); V = volume of the room or space (m3); CS = steady-state indoor CO2 concentration (ppm); and CR = CO2 concentration in outdoor air (ppm). The average age and average activity level of occupants are used to calculate GP [50,51] whilst ambient CO2 levels are set at 414 ppm [52].
AS = 6×10⁴ nGP/[V(CS –CR)]
For the kitchen areas, ventilation rates are calculated using the existing CO2 as a tracer gas. Analysis of the CO2 data across the monitored period post 12:00 am allows the identification of the peak CO2 level, after which the levels consistently fall in zero occupancy conditions. The rate of CO2 concentration decay (which is directly dependent on the operable capacity of the ventilation strategy) allows calculation of the ventilation rate. A single air change is defined as the point at which 63% of airborne contaminants are replaced with outdoor air [53,54,55,56]. Consequently, the ventilation rate can be calculated by measuring the time required to achieve a 63% reduction in excess CO₂ from its peak level. The following equation [53] is used to calculate the ventilation rate based on observed peak CO2 concentrations:
where t1 = initial time when indoor CO2 is at peak level, t2 = time (min) when excess CO2 is reduced by 63%. Indoor CO2 at peak level (CS) is the sum of ambient CO2 (CR) and excess CO2 (CE) generated by the room occupants. CO2 measurement starts at peak level, therefore t1 is always 0. The time that is needed to remove 63% CE (t2) is the time point where the indoor CO2 level is C63%E = CS – 63% CE where CE = CS – CR. Ambient CO2 levels are set at 414 ppm [52]
ACHT63% = 60/(t2-t1), with t1=0
2.4. Internal Temperature and Relative Humidity
Internal temperature and Relative Humidity (RH) were continuously monitored to evaluate the IEQ of each dwelling. These parameters were selected due to their critical role in maintaining comfort, considering ventilation effectiveness, and preventing moisture-related risks such as condensation and mould growth. The collected data enabled analysis of thermal stability and internal moisture load, supporting the calculation of Vapour Pressure Excess (VPX) under standardised and modelled external conditions. RH data is used to evaluate the performance of ventilation systems in relation to occupancy-driven moisture generation, highlighting the synergistic relationship that exists between ventilation strategies and indoor environmental outcomes.
2.5. Moisture Load and Vapour Pressure Excess
Excess vapour pressure arises when the internal vapour pressure within a building exceeds that of the external environment, establishing a gradient that drives moisture migration toward or through the building envelope. This movement occurs as water vapour naturally diffuses from regions of higher vapour pressure to lower, seeking equilibrium. If the building envelope is not adequately designed to manage vapour diffusion, this differential can result in condensation, moisture accumulation, and long-term material degradation [57]. From a design perspective, it is essential to ensure that during the coldest month, the average RH at internal surfaces does not exceed 80%, which is widely recognised as the threshold for mould growth [58]. Maintaining humidity below this limit is critical for preserving indoor air quality and preventing biological contamination.
Ridley et al. (2007) demonstrated a linear relationship between external temperature and VPX, leading to the definition of Standardised Vapour Pressure Excess (SVPX), a reference condition where outdoor temperature is set at 5 °C and RH at 80%, facilitating comparative analysis across different building scenarios and climates. SVPX is calculated using the Tetens equation [60], the monitored internal and standardised external data:
where Tin = indoor temperature in °C, RHin = indoor relative humidity in %, Tout = outdoor temperature in °C, RHout = outdoor relative humidity in % and VPX = vapour pressure excess in pascals (Pa).
2.6. Thermal Performance and Surface Temperature Analysis
Internal surface temperatures of external walls were monitored to identify thermal anomalies and potential thermal bridging, which are indicative of insulation deficiencies and heat loss pathways. Comparative analysis was undertaken to evaluate the thermal performance of the utilised insulation strategies in maintaining stable internal surface temperatures. Particular attention is paid to identifying cold spots and temperature depressions that may signal incomplete insulation fill, material settlement, or workmanship issues with thermal irregularities cross-referenced with RH and SVPX data to assess the risk of surface condensation and mould growth.
2.7. Limitations
While the sample size (4n) restricts the statistical generalisability of the findings, it does not diminish their technical relevance. The study was designed to explore the performance of retrofit strategies in depth rather than breadth, and the insights gained are grounded in well-established principles of building physics. As such, the observed relationships between ventilation rates, thermal performance, and moisture dynamics reflect repeatable physical phenomena that are likely to manifest similarly in comparable contexts. Efforts were made to minimise behavioural bias, such as withholding device capabilities from participants, however occupant behaviour remains a variable that could influence outcomes, particularly in relation to ventilation and moisture generation. Additionally, the study was conducted during the heating season, and while this period is critical for assessing condensation risk and thermal comfort, it does not capture seasonal variations that may affect IEQ. The study employed high-accuracy sensors and standardised placement protocols, however spatial variability within rooms and temporal fluctuations may still influence measurements. CO₂ concentrations, for example, can vary based on micro-zones of occupancy and airflow, and surface temperature readings may not fully capture thermal anomalies across entire wall sections. While the limited sample size constrains generalisability, the repeatability of the findings is reinforced using building physics-based methods. Techniques such as the steady-state and decay methods for ventilation assessment, vapour pressure excess calculations, and thermographic analysis are grounded in physical laws and standardised procedures. Ventilation rate analysis incorporated adjustments for occupancy loading to enable robust comparative interpretation. These methods are replicable across different dwellings and contexts and provide a robust framework for future studies and policy evaluation. Furthermore, the variable use cases examined reflect patterns commonly observed in the wider dwelling stock [61].
3. Results and Discussion
3.1. Indoor Environment
Figure 1 presents the recorded CO₂ concentrations over the monitoring period. Data from TUD001, representing a household of two adults and two children, indicates a significant ventilation deficiency. Only 8% of kitchen readings and 2% of bedroom readings fall below 700 ppm, a threshold commonly associated with adequate ventilation. Notably, 73% of kitchen and 54% of bedroom measurements lie within the 1000–2000 ppm range, with an additional 36% of bedroom readings exceeding 2000 ppm. The bedroom in TUD001 is occupied by two adults, and the kitchen is potentially at times used by all four household members, which may partially account for the elevated CO₂ levels particularly when considering the additional infiltration associated with the dwellings sub-optimal airtightness (8.32 m³/hr/m² @ 50 Pa ). Although occupancy represents a critical variable that warrants consideration [62], CO₂ concentrations exceeding 1,000 ppm reflect reduced dilution capacity, thereby intensifying the accumulation of contaminants originating from both occupant-related and non-occupant sources [63].
In contrast, TUD002, occupied by a single elderly resident, demonstrates ventilation performance strongly influenced by occupancy. The consistently low CO₂ concentrations (with 99% of kitchen and 82% of bedroom measurements below 700 ppm, and all remaining values under 1,000 ppm) suggest a combination of effective ventilation and minimal occupant-generated emissions. This outcome underscores the significant role of occupancy in determining indoor air quality. Similarly, TUD003, which is also singly occupied, exhibits comparable performance, with 91% of kitchen measurements below 1,000 ppm and the remainder below 1,500 ppm. These findings collectively highlight that, while airtightness and ventilation systems are critical, occupancy remains a dominant factor influencing internal CO₂ levels.
The control property, TUD004, was not retrofitted at the time of monitoring. Despite being occupied by one adult and three children, all recorded CO₂ measurements remained below 1,500 ppm. While higher occupancy would typically result in increased CO₂ generation, this effect may have been mitigated by elevated uncontrolled infiltration, likely due to its relatively weak airtightness (9.46 m³/hr/m² @ 50 Pa ). Notably, TUD001 and TUD004 exhibit broadly similar airtightness values (8.32 and 9.46 m³/hr/m² @ 50 Pa), yet their ventilation outcomes differ significantly. This discrepancy can be attributed to both ventilation strategy and infiltration dynamics. TUD001, being retrofitted, relies on a demand controlled ventilation system designed for airtight envelopes. If this system underperforms or becomes imbalanced, CO₂ will accumulate during periods of high occupancy along with other occupant and non-occupant generated pollutants that depend on effective ventilation for dilution. In contrast, TUD004 may experience greater uncontrolled infiltration due to its non-retrofitted state and leakage characteristics. Even with similar airtightness metrics, the distribution and nature of leakage paths can influence air exchange [64], enabling more effective dilution of indoor air in TUD004. TUD001’s envelope may have limited uncontrolled infiltration compared to TUD004, where leakage is likely more dispersed and effective for dilution, as retrofit-driven sealing typically results in tighter and more uniform building envelopes which substantially reduces natural air exchange and consequently increases the need for well-designed and effective mechanical ventilation systems to maintain IEQ [65].
3.2. Ventilation Performance
TUD001 employs a constant-pressure, demand-controlled mechanical ventilation system capable of delivering a maximum airflow of 100 m³/h at 100 Pa. The system is activated through two primary mechanisms: (a) variations in indoor humidity levels within habitable and wet rooms, which trigger humidity-sensitive air inlets, and (b) presence detection via passive infrared sensors in wet rooms, bathrooms, utility spaces, and kitchens, which activate the extract units. Humidity-sensitive air inlets, equipped with insect filters, are installed in all habitable rooms. These inlets contain a polyamide strip that expands in response to increased humidity, thereby opening one or more shutters to regulate the inflow of external air. The degree of shutter opening is proportional to the relative humidity (40% humidity results in 40% shutter opening, 50% humidity results in 50% opening) allowing for dynamic adjustment of air intake. Likewise, a humidity-controlled strip and/or presence detector allow shutters within air extract units to open in wet rooms/bathrooms/utility and kitchens, resulting in the removal of stale moist air from these zones. The resulting negative pressure is balanced by the inflow of fresh air through the habitable room inlets, maintaining indoor air quality and pressure equilibrium.
In contrast, TUD002, TUD003, and TUD004 utilise a natural ventilation strategy. These dwellings rely on the passive movement of external air through purpose-designed openings, such as windows and vents. The air-change rate in these units is influenced by external environmental factors, including temperature (stack effect) and wind speed, as well as occupant behaviour, such as window operation. Additionally, all dwellings are subject to infiltration via uncontrolled air leakage through unintended gaps in the building envelope. While infiltration may enhance pollutant dilution, it simultaneously undermines energy efficiency by increasing regulated energy use. Ventilation strategies, whether natural or mechanically driven, depend on the building fabric being appropriately airtight, requiring a good practice standard of 5m³/hr/m² @ 50 Pa [66].
Figure 2 details the Air Exchange Rate (AER) during the defined time windows. The median AER in the kitchen areas assessed via the decay method during zero occupancy conditions varies from 0.20 – 0.40 h-1, which is lower than other studies (albeit A-rated BER retrofits) in an Irish context [22,29]. The results from dwelling TUD001 are of particular interest, as it is equipped with a demand-controlled ventilation system. However, previous research has highlighted that the presence of mechanical ventilation alone does not ensure adequate AER, due to factors such as user interaction and system deficiencies [67,68]. It is assumed that occupant behaviours (such as window opening) that may positively affect the air exchange rate during daytime hours are not engaged during the post 12:00am (night-time) assessed period. Consequently, the median AER observed during this timeframe is considered to reflect the inherent performance capacity of the employed ventilation strategies, independent of occupant intervention.
The median AER in the bedrooms assessed via the steady state method range from 0.25 h-1 (TUD001) to 0.64, 0.79 and 0.78 h-1 (TUD002, TUD003, TUD004, respectively). Whilst TUD001 is again low, the remaining dwellings align with or exceed rates achieved in the previously mentioned studies [22,29]. The superior performance of passive ventilation systems within this sample raises concerns, given that demand-controlled ventilation is intended to operate independently of natural driving forces and their variability [69], but highlights the previously identified and critical need for ongoing maintenance of ventilation systems [23].
3.3. Indoor Temperatures
Figure 3 illustrates the range of indoor temperatures recorded across the dataset during the monitoring period. The comfort associated with retrofit interventions in dwellings TUD001, TUD002, and TUD003 are readily observable when compared to TUD004. Each retrofit dwelling is equipped with a heat pump system connected to a permanent live power supply and regulated via room thermostats. Consequently, the heat pumps are technically capable of continuous operation; however, in practice, their activation is governed by thermostat signals, which initiate or terminate operation based on set indoor temperature thresholds. This control strategy not only enhances energy efficiency (albeit based on achieving required airtightness levels) but also contributes to maintaining occupant comfort within acceptable limits. The observed temperature profiles underscore the pivotal influence of retrofit interventions in regulating indoor environmental conditions. In contrast, TUD004, which lacks these enhancements, exhibits greater temperature variability, leading to increased energy consumption during times of operation and potentially, reduced occupant comfort.
3.4. Relative Humidity
Figure 4 presents the recorded RH profiles recorded across the monitored dwellings, revealing substantial variability primarily driven by differences in air AER and occupancy levels. Dwellings TUD001 and TUD004, each housing four occupants, exhibit consistently higher humidity levels compared to TUD002 and TUD003, which are occupied by single elderly residents. This disparity underscores the influence of internal moisture generation, which scales with occupancy. None of the dwellings are equipped with dedicated clothes-drying facilities, aside from outdoor washing lines located in rear gardens. Consequently, moisture generated from daily activities, such as cooking, cleaning, showering, clothes washing and human respiration, accumulates within the indoor environment. This effect is amplified in higher-occupancy dwellings, where the cumulative moisture load is substantially greater, contributing to elevated RH levels.
The demonstrated interaction between occupancy-driven moisture generation and ventilation effectiveness is critical. In dwellings with lower AER or sub-optimal ventilation control, excess humidity may persist, increasing the risk of condensation, mould growth, and occupant discomfort. Conversely, dwellings with adequate ventilation are better equipped to dilute and remove moisture, maintaining healthier indoor conditions. These findings highlight the necessity of tailoring ventilation strategies to occupancy profiles, ensuring not only improved IEQ, but also energy-efficient operation.
3.5. Vapour Pressure Excess
It is accepted that as external temperatures fall, VPX will rise as ventilation rates fall [58]. Building on this relationship, Ridley et al. (2007), through an analysis of 1,604 dwellings, proposed a classification system based on VPX values. According to their findings, a VPX of up to 300 Pa is indicative of a dry indoor environment, values between 300–550 Pa represent average condition, and VPX levels exceeding 550 Pa are characteristic of a wet internal environment, with increased risk of condensation and mould growth as the excess pressure attempts to equalise across rooms and external barriers.
Figure 5 illustrates the internal excess moisture load across the monitored dwellings, calculated using monitored internal data and under standardised external conditions of 5 °C and 80% RH. The indoor environment in TUD001 is notably moisture-laden, a condition attributed to reduced ventilation rates and prevailing wintertime external conditions. In contrast, TUD002 and TUD003 consistently fall within dry and average moisture zones under these reference conditions, once again indicative of the slightly increased ventilation performance and the reduced occupant density. Interestingly, TUD004 demonstrates relatively favourable performance despite its occupant density and absence of retrofit measures. This performance is noteworthy given the expected moisture generation associated with multiple occupants. The outcome can be attributed to the previously mentioned ventilation strategy and infiltration dynamics leading to elevated uncontrolled infiltration, which facilitates moisture dilution and prevents excessive vapour pressure accumulation. While this infiltration-driven ventilation may appear beneficial in mitigating condensation risk, it is inherently energy-inefficient and highly variable, depending on wind speed and temperature gradients. Consequently, reliance on uncontrolled air leakage as a moisture management mechanism is unsustainable in the context of energy performance targets and climate resilience. Future retrofit strategies must therefore balance airtightness improvements with robust, demand-responsive ventilation systems to maintain vapour pressure within safe thresholds, ensuring both IEQ and compliance with energy efficiency objectives.
Although the precise dwelling locations remain confidential to preserve anonymity, the regional external conditions during December and January typically range from –2.7 °C to 7 °C, with an average relative humidity of approximately 83%. These prevailing winter conditions impose a significant moisture load on building envelopes and ventilation systems, complicating efforts to maintain IEQ. As external temperatures fall, relative humidity typically rises, reducing the potential for passive drying and increasing the likelihood of condensation in inadequately ventilated spaces.
To further investigate this relationship, the dataset was analysed under two additional external scenarios: 2.5 °C at 85% RH and 0 °C at 90% RH. Figure 6 and Figure 7 illustrate the corresponding rise in internal moisture load across the dwellings under these conditions, assuming no change in internal temperature, humidity, or occupancy levels. These results underscore the sensitivity of indoor moisture dynamics to external climatic variations, particularly in dwellings with limited ventilation capacity. Consequently, retrofit strategies and ventilation design must account for climatic variability, ensuring adequate air exchange and moisture control to prevent mould growth and protect occupant health.
3.6. Internal Surface Temperature
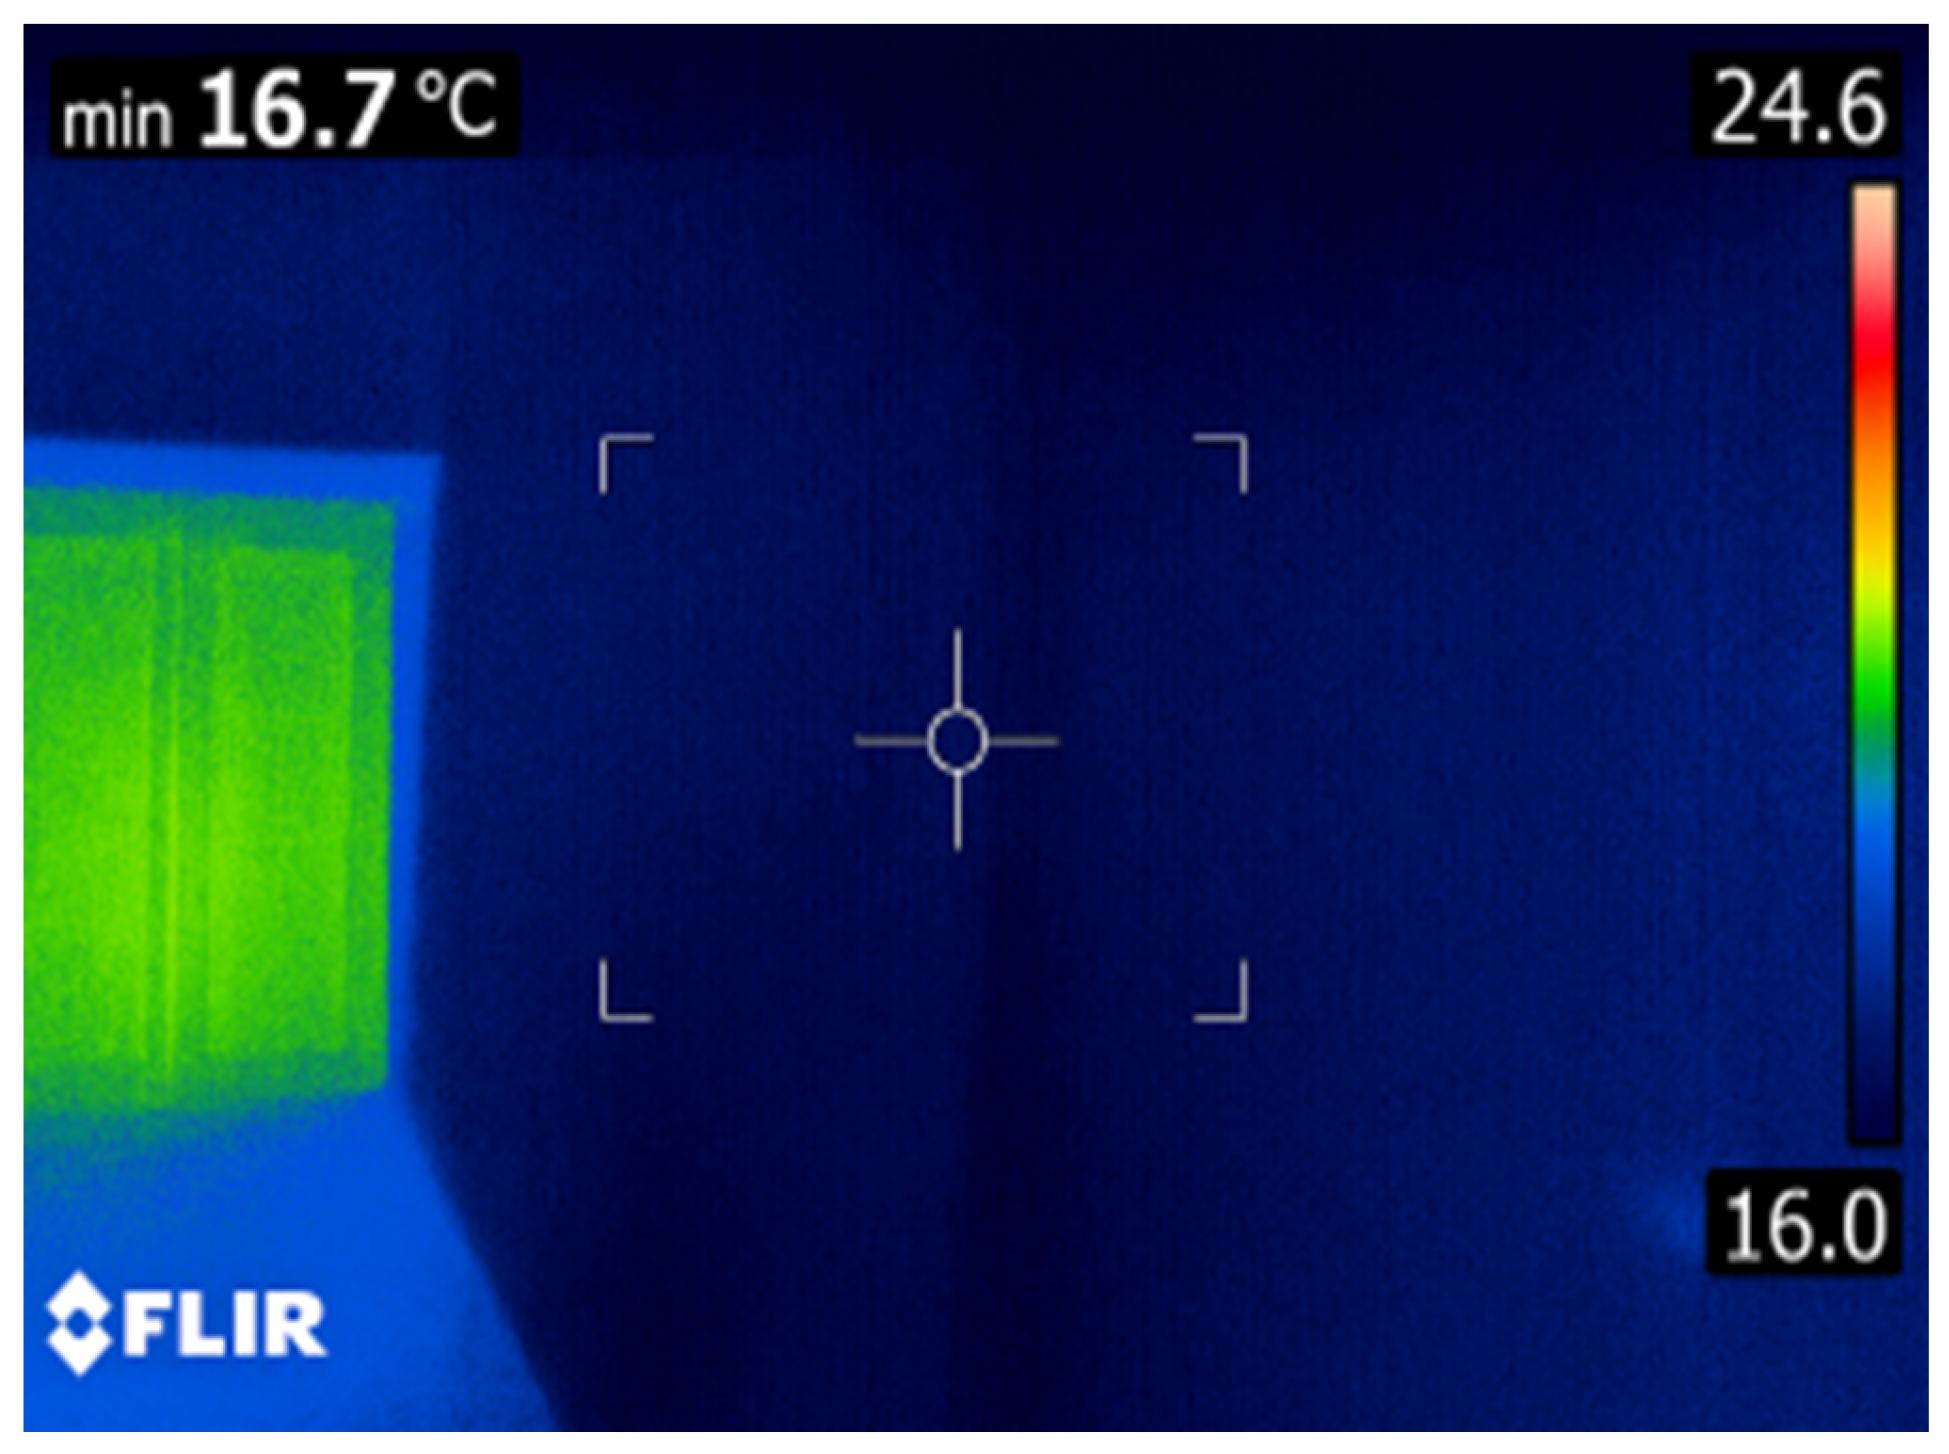
The thermal images in Images 1 and 2 illustrate the temperature distribution across the external facade of the un-retrofitted TUD004. The absence of thermal insulation in the external walls along with the infiltration of cooler external air results in consistently low surface temperatures, indicative of significant heat loss. Notably, Image 2 highlights localised thermal anomalies on the right-hand side, corresponding to the gas boiler and its flue, which exhibit elevated temperatures due to concentrated heat emission. These observations align with the measured surface temperature data recorded over the monitoring period, as illustrated in Figure 8. The persistently low external surface temperatures contribute to a reduced thermal gradient across the dwellings external wall sections, ultimately lowering the internal surface temperature. This condition increases the risk of surface condensation, particularly under elevated indoor RH levels, and may have implications for occupant comfort and health and building fabric integrity.
Image 1.
Cold External Wall Surface – TUD004 Kitchen.
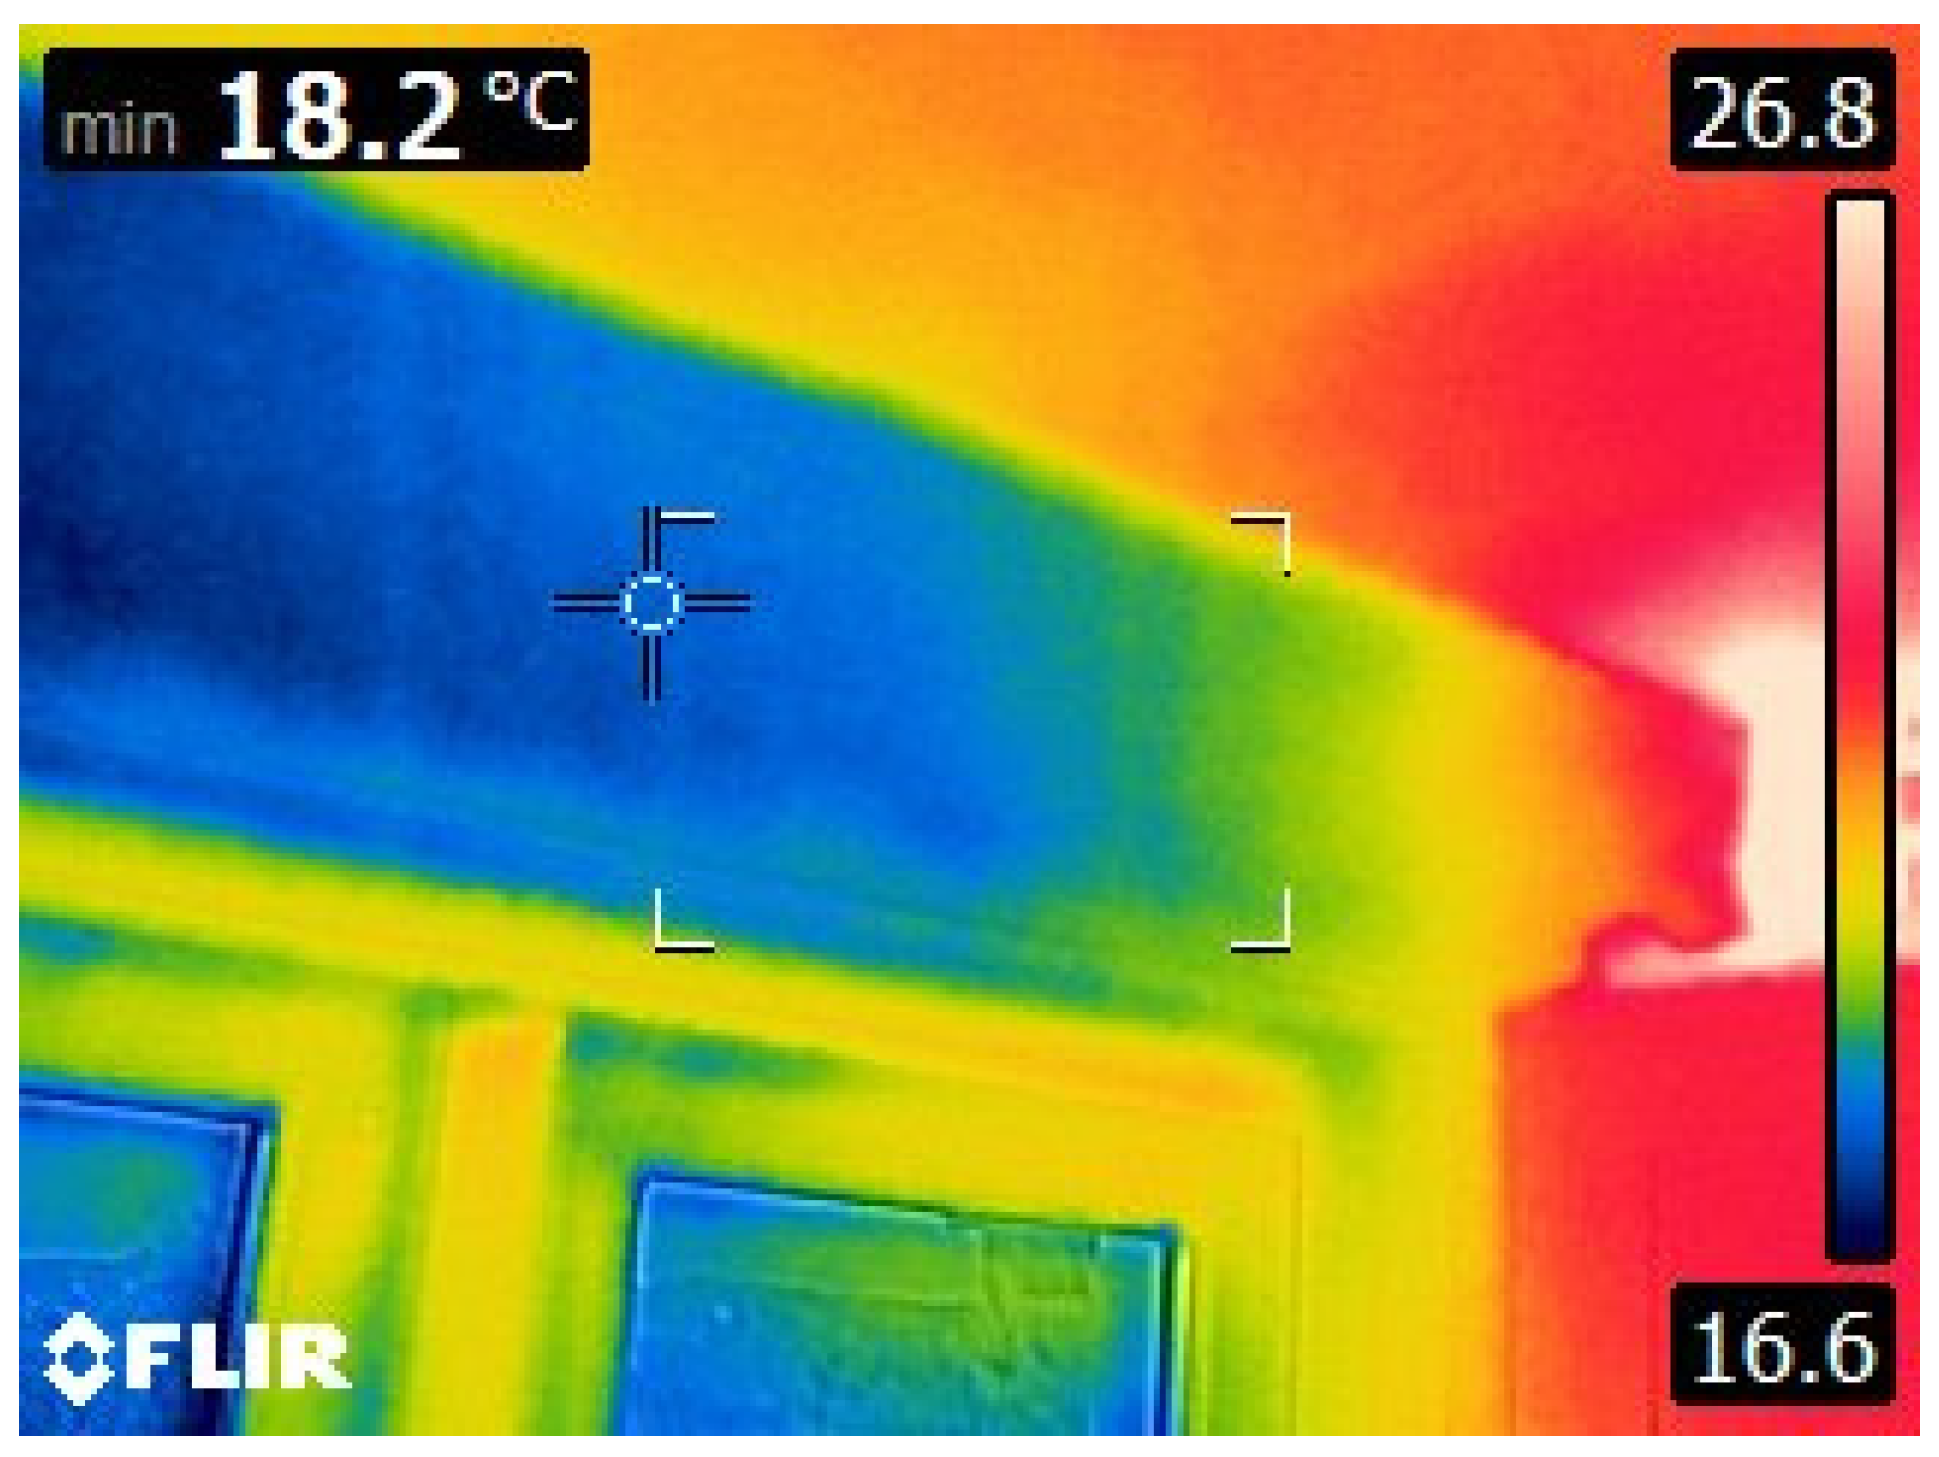
Image 2.
Cold External Wall Surface – TUD004 Bedroom.
Previous investigations into retrofit cavity wall insulation have identified substantial performance issues that challenge the assumed efficacy of these interventions [32,33]. Voids and gaps, frequently resulting from poor workmanship and physical obstructions within the cavity, have been shown to inhibit complete insulation fill, thereby undermining thermal continuity [70]. Thermographic analysis has proven instrumental in corroborating these deficiencies, revealing cold spots, uninsulated zones, and instances of thermal bridging, each of which contributes to elevated heat loss and increased risk of condensation within the building envelope [71]. These findings are further substantiated by internal surface temperature data for dwellings TUD001 (full-fill mineral wool) and TUD002 (full-fill cavity bead), as presented in Figure 9 and Figure 10. The temperature profiles of these retrofitted dwellings exhibit localised depressions in surface temperature that are comparable to those observed in the un-retrofitted control dwelling TUD004. This alignment with prior research suggests that despite the application of full-fill insulation systems, areas of the walls remain thermally vulnerable, likely due to incomplete fill or post-installation settlement. Consequently, these areas are subject to the same thermal inefficiencies and moisture-related risks typically associated with uninsulated cavity walls.
In contrast to the variable thermal performance observed in cavity-insulated dwellings, the externally insulated dwelling TUD003 demonstrates a notably stable internal surface temperature profile. This stability underscores the efficacy of correctly applied external insulation systems in mitigating thermal irregularities. By encapsulating the building envelope within a continuous insulating layer, such systems effectively eliminate thermal bridges and cold spots, thereby substantially reducing the risk of interstitial and internal surface condensation.
Figure 11.
TUD 003 – Internal Wall Surface Temperature.
These findings suggest that surface condensation remains a persistent challenge, particularly in retrofit scenarios where insulation strategies fail to positively alter the hygrothermal dynamics of the building envelope. Empirical and simulation-based studies have consistently demonstrated that when indoor relative humidity exceeds 80%, the risk of condensation on cooler internal surfaces increases significantly [72]. This threshold is widely recognised in building science as a critical point for the onset of mould growth and material degradation [58]. Furthermore, it has previously been demonstrated in an Irish social housing context [73] that 80% relative humidity or more is a critical factor for mould growth, especially in poorly ventilated or thermally bridged areas, both factors demonstrated to exist in the dwellings under review. Figure 12 illustrates the relationship between recorded room-level RH and the recorded internal surface temperatures across all datasets, highlighting the increase in RH that occurs when localised cool zones are present. The analysis demonstrates that as surface temperatures decline, particularly at thermal bridges, RH can exceed the critical 80% threshold, resulting in initial condensation and subsequent mould formation. This highlights the susceptibility of hygrothermal performance to material discontinuities and construction detailing within the building envelope.
The comparative data align with previous research and highlight the inherent limitations of cavity insulation retrofits in delivering consistent thermal performance, particularly in existing buildings with complex or obstructed cavity structures. In contrast, external insulation systems, by virtue of their continuous placement around the building envelope, provide a more robust solution for reducing heat loss and mitigating internal surface condensation risk. Where cavity insulation is considered, the potential for thermal bridging and incomplete fill must be rigorously assessed, as these conditions can create localised cool zones that elevate moisture-related risks. Conversely, external insulation systems maintain stable surface temperatures, reducing condensation risk while improving occupant comfort and energy efficiency. By ensuring uniform thermal performance, these systems minimise localised heat loss and enhance overall envelope integrity. These findings reinforce the importance of comprehensive insulation strategies in retrofit programs, where external insulation can deliver superior hygrothermal resilience compared to partial or cavity-based approaches and aligns with best practice aimed at preventing surface mould growth by design [74]. This supports a strategic reorientation of local authority retrofit policy and practice, advocating for the prioritisation of external insulation in cases where cavity integrity cannot be confidently assessed or assured. Such a shift would improve indoor thermal conditions, reduce energy demand, and mitigate moisture-related risks, ultimately enhancing the quality and durability of the internal environment.
4. Conclusions
This study undertook a critical evaluation of IEQ outcomes resulting from retrofit interventions in local authority-owned dwellings (one control and three variables) under Ireland’s EERP, using detailed post-retrofit monitoring. The selected dwelling typologies are broadly representative of the wider local authority housing stock and reflect the prevailing approach to retrofitting social housing. While all retrofitted properties exceeded the targeted BER, findings indicate that improvements in energy efficiency do not consistently translate into enhanced indoor environmental conditions. Furthermore, the substantial financial investment associated with retrofitting effectively locks in the resulting environmental performance for an extended period, raising concerns that today’s retrofitted dwellings may become the ‘hard-to-treat’ dwellings of the future. The analysis underscores the complexity of applying standardised retrofit strategies to a heterogeneous housing stock, where variations in occupancy, ventilation systems, building fabric, and external climatic conditions significantly influence outcomes. Notably, sub-optimal ventilation performance was observed resulting in elevated CO₂ levels despite appropriate occupancy conditions. This indicates a performance issue, suggesting that the current retrofit strategy does not deliver the intended synergy between measures and may struggle to accommodate the ventilation loads associated with and required for normal daily living.
Thermal performance data revealed further inconsistencies. Despite meeting installation standards, cavity wall insulation exhibited thermal anomalies and cold bridging, issues likely inherent to the installation method. In contrast, the externally insulated dwelling maintained stable internal surface temperatures, reinforcing the effectiveness of continuous external insulation in mitigating thermal bridging risks. Furthermore, a clear relationship emerged between occupancy-driven moisture generation and ventilation effectiveness. Elevated RH and VPX were recorded in dwellings with greater occupancy and sub-optimal ventilation, increasing the risk of condensation and mould growth. These findings underscore the need for retrofit strategies that holistically integrate ventilation system selection and insulation measures, tailored to dwelling typology and occupancy patterns. To address these challenges, it is proposed that ventilation systems incorporate multi-pollutant sensors and a modulating boost function to increase air inflow during periods of occupation or elevated moisture/pollutant levels. Furthermore, ventilation should be prioritised as an initial measure within a staged retrofit process to ensure consistent IEQ throughout the retrofit cycle.
This study highlights significant implications for large-scale retrofit initiatives at both national (aligned with 2030 targets) and international levels (in accordance with EU directives). Strategies that focus exclusively on energy reduction risk generating unintended consequences. Moreover, the continued deployment or reinforcement of measures associated with well-documented adverse outcomes remains a concern. Although the sample size is modest, the representative nature of the dwellings and retrofit interventions examined underscores the need for further, more comprehensive investigation.
The findings suggest potential adverse risks to both building fabric and to occupant health and wellbeing if these patterns are generalisable, alongside significant economic implications, including household and state investment, healthcare costs, and productivity losses. Regulatory considerations are equally pressing, as national and international standards must be grounded in robust empirical evidence. Currently, research of this nature remains limited. To ensure retrofit strategies deliver comprehensive benefits, further investigation at scale is essential. This work advocates for a strategic reorientation of staged retrofit policy, moving beyond BER compliance toward evidence-based, occupant-centred design. Policymakers and practitioners should reject uniform solutions in favour of nuanced, data-driven approaches that secure both energy efficiency and health co-benefits.
Author Contributions
Conceptualization, SH; methodology, SH; software, SH; validation, SH.; formal analysis, SH; investigation, SH; resources, SH; data curation, SH; writing—original draft preparation, SH; writing—review and editing, SH & MM; visualization, SH; supervision, MM. All authors have read and agreed to the published version of the manuscript.
Funding
This research received no external funding.
Data Availability Statement
Data is unavailable due to privacy restrictions.
Acknowledgments
During the preparation of this manuscript, the author(s) used Microsoft Copilot for the purposes of creating Figure 12. The authors have reviewed and edited the output and take full responsibility for the content of this publication.
Conflicts of Interest
The authors declare no conflicts of interest.
Ethical Approval: Ethical approval has been received for this study.
Abbreviations
The following abbreviations are used in this manuscript:
| IEQ | Indoor Environmental Quality |
| BER | Building Energy Rating |
| CAP | Climate Action Plan |
| EERP | Energy Efficiency Retrofit Programme |
| EPBD | Energy Performance of Buildings Directive |
| DEAP | Dwelling Energy Assessment Procedure |
| CO2 | Carbon Dioxide |
| RH | Relative Humidity |
| VPX | Vapour Pressure Excess |
| SVPX | Standardised Vapour Pressure Excess |
References
- Department of the Environment; Climate Change and Communications. Climate Action Plan 2025. 2025. Available online: https://assets.gov.ie/static/documents/c491032e/DECC_Climate_Action_Plan_2025_Main_Report_-_Final_Web.pdf.
- Department of Housing; Local Government and Heritage. Energy Efficiency/Retrofitting Programme 2022. 2022. [Google Scholar]
- Department of the Environment; Climate and Communications. National Retrofit Plan. 2022. Available online: https://www.gov.ie/en/publication/5052a-national-retrofit-plan/.
- Straub, A.; Meijer, F.M. Sustainable Retrofit of Dutch Social Housing: The Role and Future of Multi-Year Programs and Strategic Partnerships. Buildings 2025, 15. [Google Scholar] [CrossRef]
- UK Government. Social Housing Decarbonisation Fund. 2021. Available online: https://assets.publishing.service.gov.uk/media/66f1753e7aeb85342827ac09/shdf-wave-1-competition-guidance-withdrawn.pdf.
- UK Government. Social Housing Decarbonisation Fund Wave 2.1. 2022. Available online: https://assets.publishing.service.gov.uk/media/6703ed813b919067bb482d53/shdf-wave-2-1-competition-guidance-notes.pdf.
- UK Government. Warm Homes: Social Housing Fund Wave 3. 2024. Available online: https://assets.publishing.service.gov.uk/media/690b29f19456634d9795fde6/WHSHF-wave-3-scheme-guidance.pdf.
- European Commission. Energy Performance of Buildings Directive. 2024. Available online: https://energy.ec.europa.eu/topics/energy-efficiency/energy-efficient-buildings/energy-performance-buildings-directive_en.
- European Union. DIRECTIVE (EU) 2023/1791 OF THE EUROPEAN PARLIAMENT AND OF THE COUNCIL. 2023. Available online: https://eur-lex.europa.eu/legal-content/EN/TXT/PDF/?uri=CELEX:32023L1791.
- Sustainable Energy Authority Of Ireland. Domestic Energy Assessment Procedure (DEAP) Version 4.2.6. 2023. Available online: https://www.seai.ie/sites/default/files/publications/DEAP_Manual.pdf (accessed on 30 November 2023).
- European Commission. Commission Delegated Regulation (EU) No 244/2012, 2012.
- Sustainable Energy Authority Of Ireland. B2 Rated Home. 2021. Available online: https://www.gov.ie/en/department-of-housing-local-government-and-heritage/press-releases/retrofitting-programme-for-social-housing-announced/.
- Department of Housing; Local Government and Heritage. Report on the Development of Cost Optimal Calculations and Gap Analysis for Buildings in Ireland under Directive 2010/31/EU on the Energy Performance of Buildings (RECAST) Section 1-Residential Buildings. 2020. [Google Scholar]
- Sustainable Energy Authority Of Ireland. Building Energy Rating (BER) information. 2024. Available online: https://www.seai.ie/ber.
- Department of Housing; Local Government and Heritage. Energy Efficiency Retrofitting Programme 2025. 2025. [Google Scholar]
- Department of Housing; Local Government and Heritage. Energy Efficiency/Retrofitting Programme 2023. 2023. [Google Scholar]
- Department of Housing; Local Government and Heritage. Energy Efficiency/Retrofitting Programme 2024. 2024. [Google Scholar]
- Hashemi, A; Dungrani, M. Indoor Environmental Quality and Health Implications of Building Retrofit and Occupant Behaviour in Social Housing. Sustainability 2025, 17, 264. [Google Scholar] [CrossRef]
- Roberts, B.M.; Rossi, V.; Gorse, C.; Li, M.; Lomas, K. Airtightness retrofit and construction practices, unintended consequences, and ventilation practices: Gathering evidence to improve airtightness in the UK housing stock. Loughborough University. Oct 2025. Available online: https://repository.lboro.ac.uk/articles/report/Airtightness_retrofit_and_construction_practices_unintended_consequences_and_ventilation_practices_Gathering_evidence_to_improve_airtightness_in_the_UK_housing_stock/30259027/1 (accessed on 24 October 2025).
- Shrubsole, C.; Macmillan, A.; Davies, M.; MayN. 100 Unintended consequences of policies to improve the energy efficiency of the UK housing stock. Indoor and Built Environment 2014, 23, 340–352. [Google Scholar] [CrossRef]
- Singh, U. Condensation risk analysis: A practical approach. Journal of Building Survey, Appraisal & Valuation 2025, 13, 229–245. [Google Scholar] [CrossRef]
- Broderick, Á.; Byrne, M.; Armstrong, S.; Sheahan, J.; Coggins, A.M. A pre and post evaluation of indoor air quality, ventilation, and thermal comfort in retrofitted co-operative social housing. Building and Environment 2017, 122, 126–133. [Google Scholar] [CrossRef]
- Coggins, A.M.; Hogan, V.; Mishra, A.K.; Norton, D.; Foster, D.; Wemken, N.; et al. Energy retrofits: Factors affecting a just transition to better indoor air quality. Indoor Environments 2024, 1, 100058. [Google Scholar] [CrossRef]
- Collignan, B.; Le Ponner, E.; Mandin, C. Relationships between indoor radon concentrations, thermal retrofit and dwelling characteristics. J Environ Radioact. 2016, 165, 124–130. [Google Scholar] [CrossRef]
- Hassan, H.; Mishra, A.K.; Cowie, H.; Coggins, M. Estimating the health impact of exposure to indoor PM2.5 concentrations in Irish deep energy retrofitted residential dwellings – ARDEN. 14 Oct 2024. Available online: https://www.aivc.org/resource/estimating-health-impact-exposure-indoor-pm25-concentrations-irish-deep-energy-retrofitted (accessed on 23 October 2025).
- Mulville, M.; Harrington, S.; Li, C.; Raushan, K.; Essien-Thompson, E.; Ahern, C. Dwelling overheating in risk in cool climates: Assessing the risk in the context of retrofit and climate change in Ireland. Indoor Environments 2025, 2, 100072. [Google Scholar] [CrossRef]
- Zahiri, S.; Gupta, R. Examining the Risk of Summertime Overheating in UK Social Housing Dwellings Retrofitted with Heat Pumps. Atmosphere 2023, 14, 1617. [Google Scholar] [CrossRef]
- Coggins, A.M.; Wemken, N.; Mishra, A.K.; Sharkey, M.; Horgan, L.; Cowie, H.; et al. Indoor air quality, thermal comfort and ventilation in deep energy retrofitted Irish dwellings. Building and Environment 2022, 219, 109236. [Google Scholar] [CrossRef]
- Hassan, H.; Mishra, A.K.; Wemken, N.; O’Dea, P.; Cowie, H.; McIntyre, B.; et al. Deep energy renovations’ impact on indoor air quality and thermal comfort of residential dwellings in Ireland – ARDEN project. Building and Environment 2024, 259, 111637. [Google Scholar] [CrossRef]
- Kraus, M. Airtightness as Key Factor of Sick Building Syndrome (SBS). undefined. 2016. Available online: https://www.semanticscholar.org/paper/Airtightness-as-Key-Factor-of-Sick-Building-(SBS)-Kraus/8b7e5337f027468a47bea63ad123b21bc4714834 (accessed on 1 July 2022).
- Yang, S.; Pernot, J.G.; Jörin, C.H.; Niculita-Hirzel, H.; Perret, V.; Licina, D. Energy, indoor air quality, occupant behavior, self-reported symptoms and satisfaction in energy-efficient dwellings in Switzerland. Building and Environment 2020, 171, 106618. [Google Scholar] [CrossRef]
- Northern Ireland Housing Executive. Cavity Wall Insulation Research Project 2019. 2019. Available online: https://www.nihe.gov.uk/getattachment/31d4c909-e53b-4f5d-a9dc-7aca7d8510bb/2019-Cavity-Wall-Insulation-Research-report.pdf.
- Home Owners Alliance. UK homeowners facing cavity wall insulation failures. 2025. Available online: https://hoa.org.uk/news/cavity-wall-insulation-failures/.
- McElroy, D.J.; Rosenow, J. Policy implications for the performance gap of low-carbon building technologies. Building Research & Information 2019, 47, 611–623. [Google Scholar]
- Topouzi, M.; Fawcett, T.; Killip, G.; Owen, A. Deep retrofit approaches: managing risks to minimise the energy performance gap. 2019, 10. [Google Scholar]
- Alabid, J.; Bennadji, A.; Seddiki, M. A review on the energy retrofit policies and improvements of the UK existing buildings, challenges and benefits. Renewable and Sustainable Energy Reviews 2022, 159, 112161. [Google Scholar] [CrossRef]
- Duffy, B.; Wise, F. Retrofit advice services in England - Research projects in CABER | UWE Bristol. 2025. Available online: https://www.uwe.ac.uk/research/centres-and-groups/caber/research-projects/retrofit-advice-services-in-england (accessed on 17 December 2025).
- Gupta, R.; Howard, A. Pre- and Post-retrofit Performance Evaluation of a UK 1950s Block of Flats. In Proceedings of the 5th International Conference on Building Energy and Environment; Wang, LL, Ge, H, Zhai, ZJ, Qi, D, Ouf, M, Sun, C, et al., Eds.; Springer Nature: Singapore, 2023; pp. 633–642. [Google Scholar]
- The Housing Agency. Housing Historical Data. 2021. Available online: https://www.housingagency.ie/data-hub/housing-historical-data-0.
- Central Statistics Office. Housing Stock and Vacancy Rate. 2022. Available online: https://data.cso.ie/.
- Irish Tabula National Advisory Group. Building Typology Brochure Ireland. 2014. Available online: https://episcope.eu/fileadmin/tabula/public/docs/brochure/IE_TABULA_TypologyBrochure_EnergyAction.pdf.
- Li, C.; Raushan, K.; Essien-Thompson, E.; Ahern, C. Next Generation Reference Dwellings to Inform National Dwelling Stock Energy Model for Ireland. 2025. Available online: https://papers.ssrn.com/sol3/papers.cfm?abstract_id=5418333.
- Office of the Attorney General. S.I. No. 296/1980 - Housing Regulations, 1980. 1980. Available online: https://www.irishstatutebook.ie/eli/1980/si/296/made/en/print.
- Department of the Environment; Community and Local Government. Housing Policy Statement. 2011. [Google Scholar]
- Department of Housing; Local Government and Heritage. Delivering Homes, Building Communities 2025-2030. 2025. Available online: https://www.gov.ie/en/department-of-housing-local-government-and-heritage/campaigns/delivering-homes-building-communities-2025-2030-an-action-plan-on-housing-supply-and-targeting-homelessness/.
- Department of Housing; Local Government and Heritage. Energy Efficiency Retrofitting Programme - Expenditure & Output. 2025. Available online: https://www.gov.ie/en/department-of-housing-local-government-and-heritage/publications/energy-efficiency-retrofitting-programme-expenditure-output/.
- Airthings. Airthings Wave Plus Data sheet. 2022. Available online: https://manualmachine.com/airthings/waveplus/7638638-data-sheet/ (accessed on 31 August 2022).
- TeledyneFLIR. FLIR Ex PRO-SERIES. 2025. Available online: https://www.flir.com/products/e6-pro/.
- American Society for Testing and Materials. ASTM D6245-18: Standard Guide for Using Indoor Carbon Dioxide Concentrations to Evaluate Indoor Air Quality and Ventilation; 2018.
- Wu, Y.; Li, Y.; Gao, S.; Liu, S.; Yin, H.; Zhai, Y. Carbon dioxide generation rates for children and adolescents. Building and Environment 2023, 237, 110310. [Google Scholar] [CrossRef]
- Yan, Y.; Lan, L.; Kang, M.; Zhang, H.; Fan, X.; Wyon, D.P.; et al. Emission rate of carbon dioxide by older adults while sleeping. Building and Environment 2023, 236, 110299. [Google Scholar] [CrossRef]
- Environmental Protection Agency. EPA Climate Ireland | Atmosphere. 2020. Available online: https://www.climateireland.ie/impact-on-ireland/climate-status-report-for-ireland-2020/atmosphere/ (accessed on 12 December 2024).
- Huang Marzouk, T.; Cirligeanu, R.; Malmstrom, H.; Eliav, E.; Ren, Y.F. Ventilation Assessment by Carbon Dioxide Levels in Dental Treatment Rooms. J Dent Res. 2021, 100, 810–816. [Google Scholar] [CrossRef]
- Jimenez, J.L. How to quantify the ventilation rate of an indoor space using a cheap CO2 monitor. Medium. 2020. Available online: https://medium.com/@jjose_19945/how-to-quantify-the-ventilation-rate-of-an-indoor-space-using-a-cheap-co2-monitor-4d8b6d4dab44 (accessed on 7 January 2022).
- Fernstrom, A.; Goldblatt, M. Aerobiology and Its Role in the Transmission of Infectious Diseases. Journal of Pathogens 2013, 2013, e493960. [Google Scholar] [CrossRef]
- Nardell, E.; Keegan, J.; Cheney, S.; Etkind, S. Airborne Infection - Theoretical Limits of Protection Achievable by Building Ventilation. Am Rev Respir Dis. 1991, 144, 302–306. [Google Scholar] [CrossRef]
- Shuai, Y.; Altamirano-Medina, H. Vapour pressure excess as indicator of mould growth. 2020. [Google Scholar]
- British Standards Institution. Management of moisture in buildings. In Code of practice; Definitive, 2021. [Google Scholar]
- Ridley, I.; Davies, M.; Hong, S.H.; Oreszczyn, T. Vapour pressure excess in living rooms and bedrooms of English dwellings: Analysis of the Warm Front dataset. 2007. [Google Scholar]
- Monteith, J.L.; Unsworth, M.H. (Eds.) Principles of Environmental Physics. In Principles of Environmental Physics (Fourth Edition); Academic Press: Boston, 2013; p. p. i. Available online: https://www.sciencedirect.com/science/article/pii/B9780123869104000184 (accessed on 21 August 2025).
- Central Statistics Office. Households, Families and Childcare. 2022. Available online: https://www.cso.ie/en/statistics/population/censusofpopulation2022/censusofpopulation2022profile3-householdsfamiliesandchildcare/.
- Persily, A.; Polidoro, B.J. Indoor carbon dioxide metric analysis tool. Gaithersburg, MD: National Institute of Standards and Technology (U.S.); 2022 Mar. p. NIST TN 2213. Report No.: NIST TN 2213. Available online: https://nvlpubs.nist.gov/nistpubs/TechnicalNotes/NIST.TN.2213.pdf (accessed on 7 January 2026).
- ASHRAE. ASHRAE Position Document on Indoor Carbon Dioxide. ASHRAE. 2022. Available online: https://www.ashrae.org/file%20library/about/position%20documents/pd_indoorcarbondioxide_2022.pdf.
- Sherman, M.H.; Turner, W.J.N. Infiltration as Ventilation: Weather Induced Dilution. 2011. Available online: https://www.osti.gov/servlets/purl/1173153.
- Nabinger, S.; Persily, A.; Dols, W.S. Impacts of Airtightening Retrofits on Ventilation Rates and Energy Consumption in a Manufactured Home. 2010. Available online: https://nvlpubs.nist.gov/nistpubs/TechnicalNotes/NIST.TN.1673.pdf.
- CIBSE. TESTING BUILDINGS FOR AIR LEAKAGE. S.l. CHARTERED INST OF BUILDI. 2022. [Google Scholar]
- Jonge, K.D.; Janssens, A.; Laverge, J. Performance assessment of demand controlled ventilation controls concerning indoor VOC exposure based on a dynamic VOC emission model. E3S Web of Conferences, 2019. [Google Scholar]
- Sloan Brittain, O.; Wood, H.; Kumar, P. Prioritising indoor air quality in building design can mitigate future airborne viral outbreaks. Cities & Health 2021, 5, S162–5. [Google Scholar]
- CIBSE. CIBSE Guide B2: Ventilation and Ductwork. CIBSE 2016. [Google Scholar]
- Fletcher, D.M. Deterioration of retrofit insulation performance (DRIP): Phase 1. 2024. [Google Scholar]
- Byrne, A.; Byrne, G.; O’Donnell, G.; Robinson, A. Case studies of cavity and external wall insulation retrofitted under the Irish Home Energy Saving Scheme: Technical analysis and occupant perspectives. Energy and Buildings 2016, 130, 420–433. [Google Scholar] [CrossRef]
- Little, J. The Causes of Surface Condensation and Mould, and the Responsibility of Relevant Parties to Alleviate Them. 2021. [Google Scholar]
- Buckle, R. Cothabháil Tithí ochta, Seirbhí sí Tithí ochta agus Cónaithe, Oifigí na Cathrach; An Ché Adhmaid, Baile Átha Cliath 8, 2019. [Google Scholar]
- Air Infiltration and Ventilation Centre. Emerging Risks of Indoor Mould: Assessment Methods, In-Situ Measurements & Predictive Modelling. AIVC. 2025. Available online: https://www.aivc.org/news/webinar-emerging-risks-indoor-mould-recordings-now-available?utm_medium=email&utm_content=ovY9SFwrKLDQNaWMmDhegRTbK_e1xJz_-hDR8ZZLi4KMrQMrswDMtccq6fQBTJvw.
Figure 1.
CO2 Data – per room per dwelling.
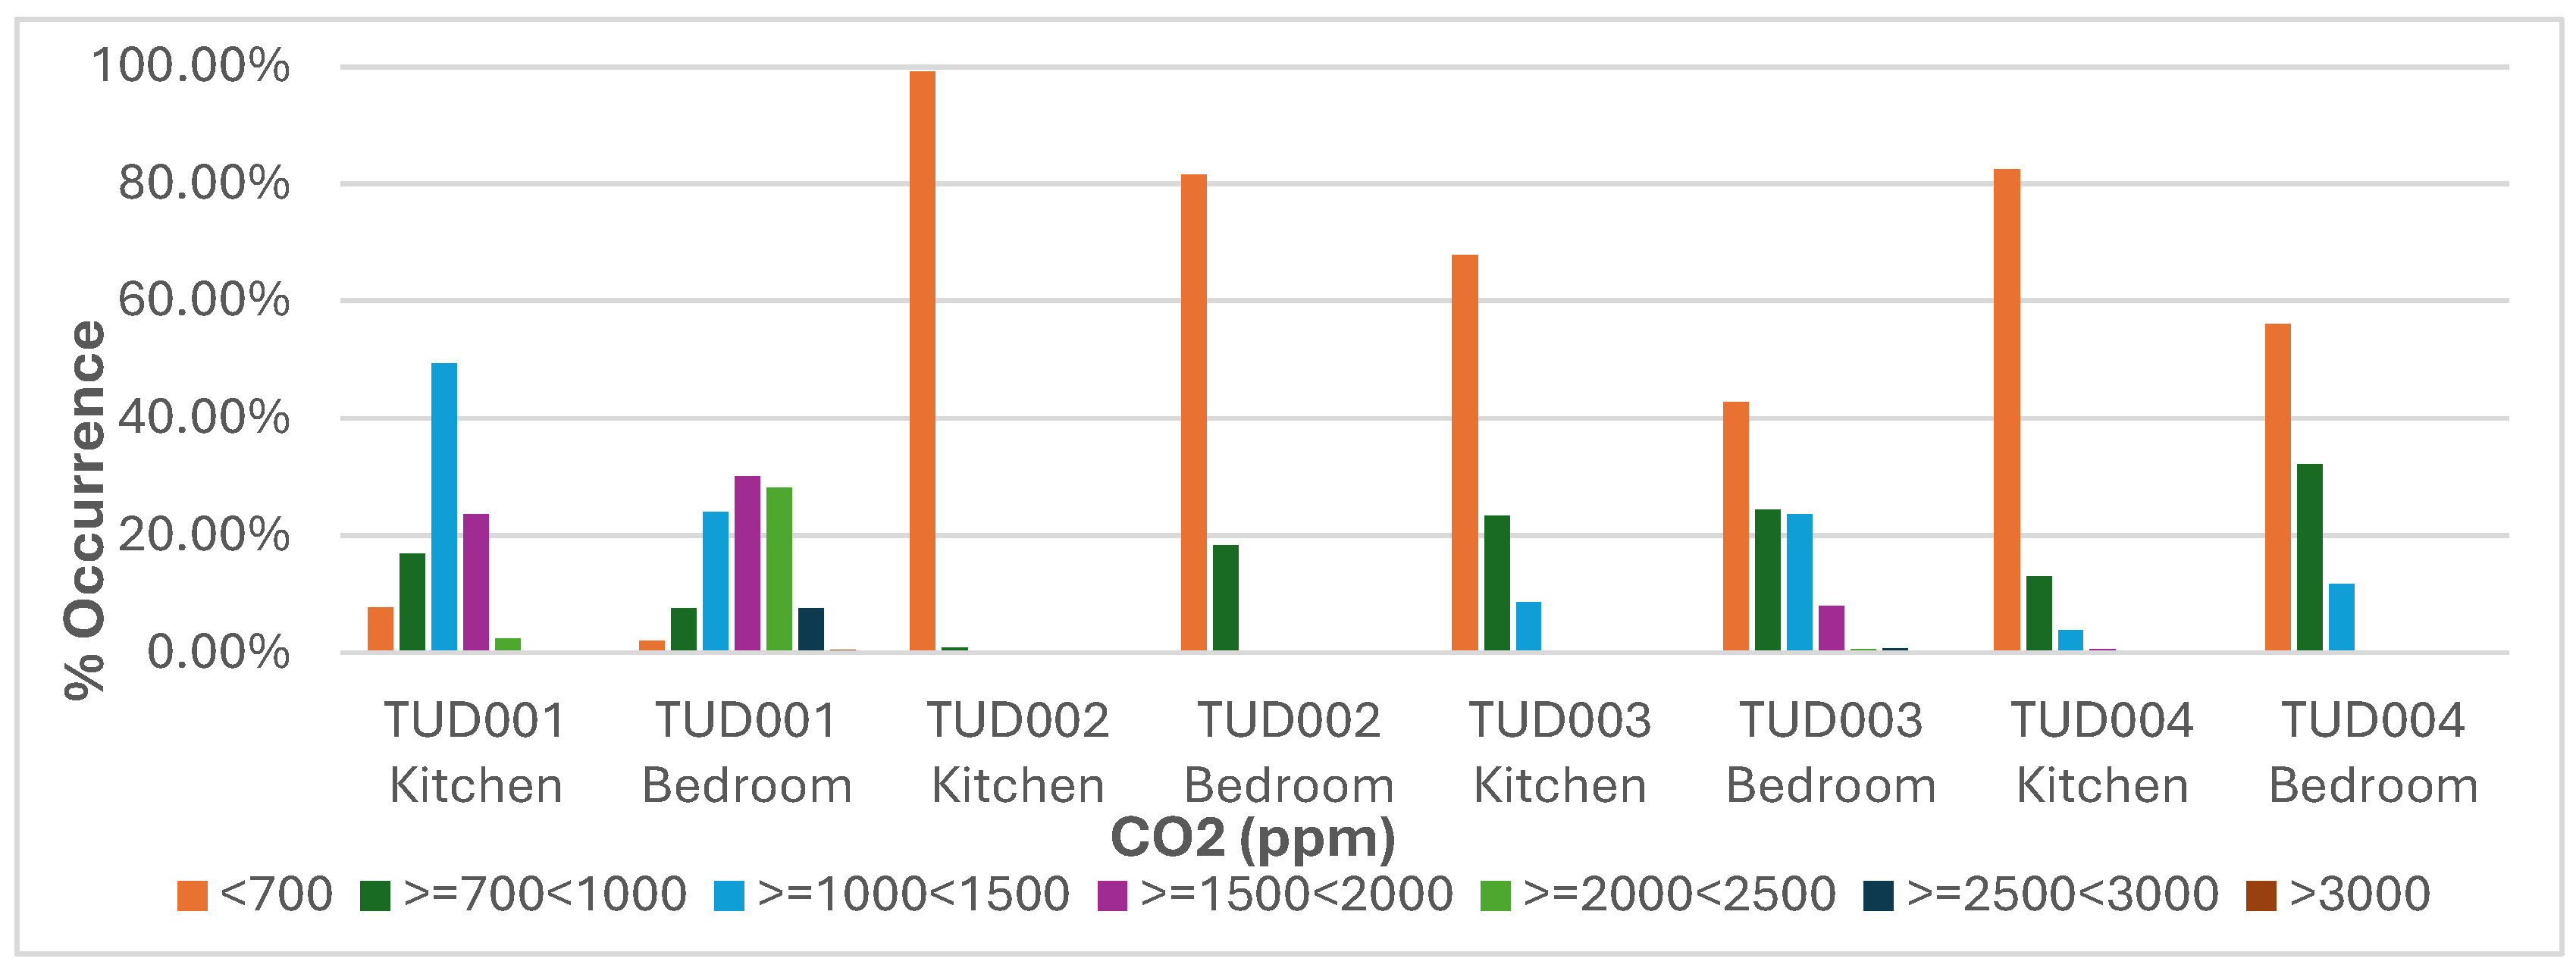
Figure 2.
Air Exchange Rate per hour + median value per dataset.
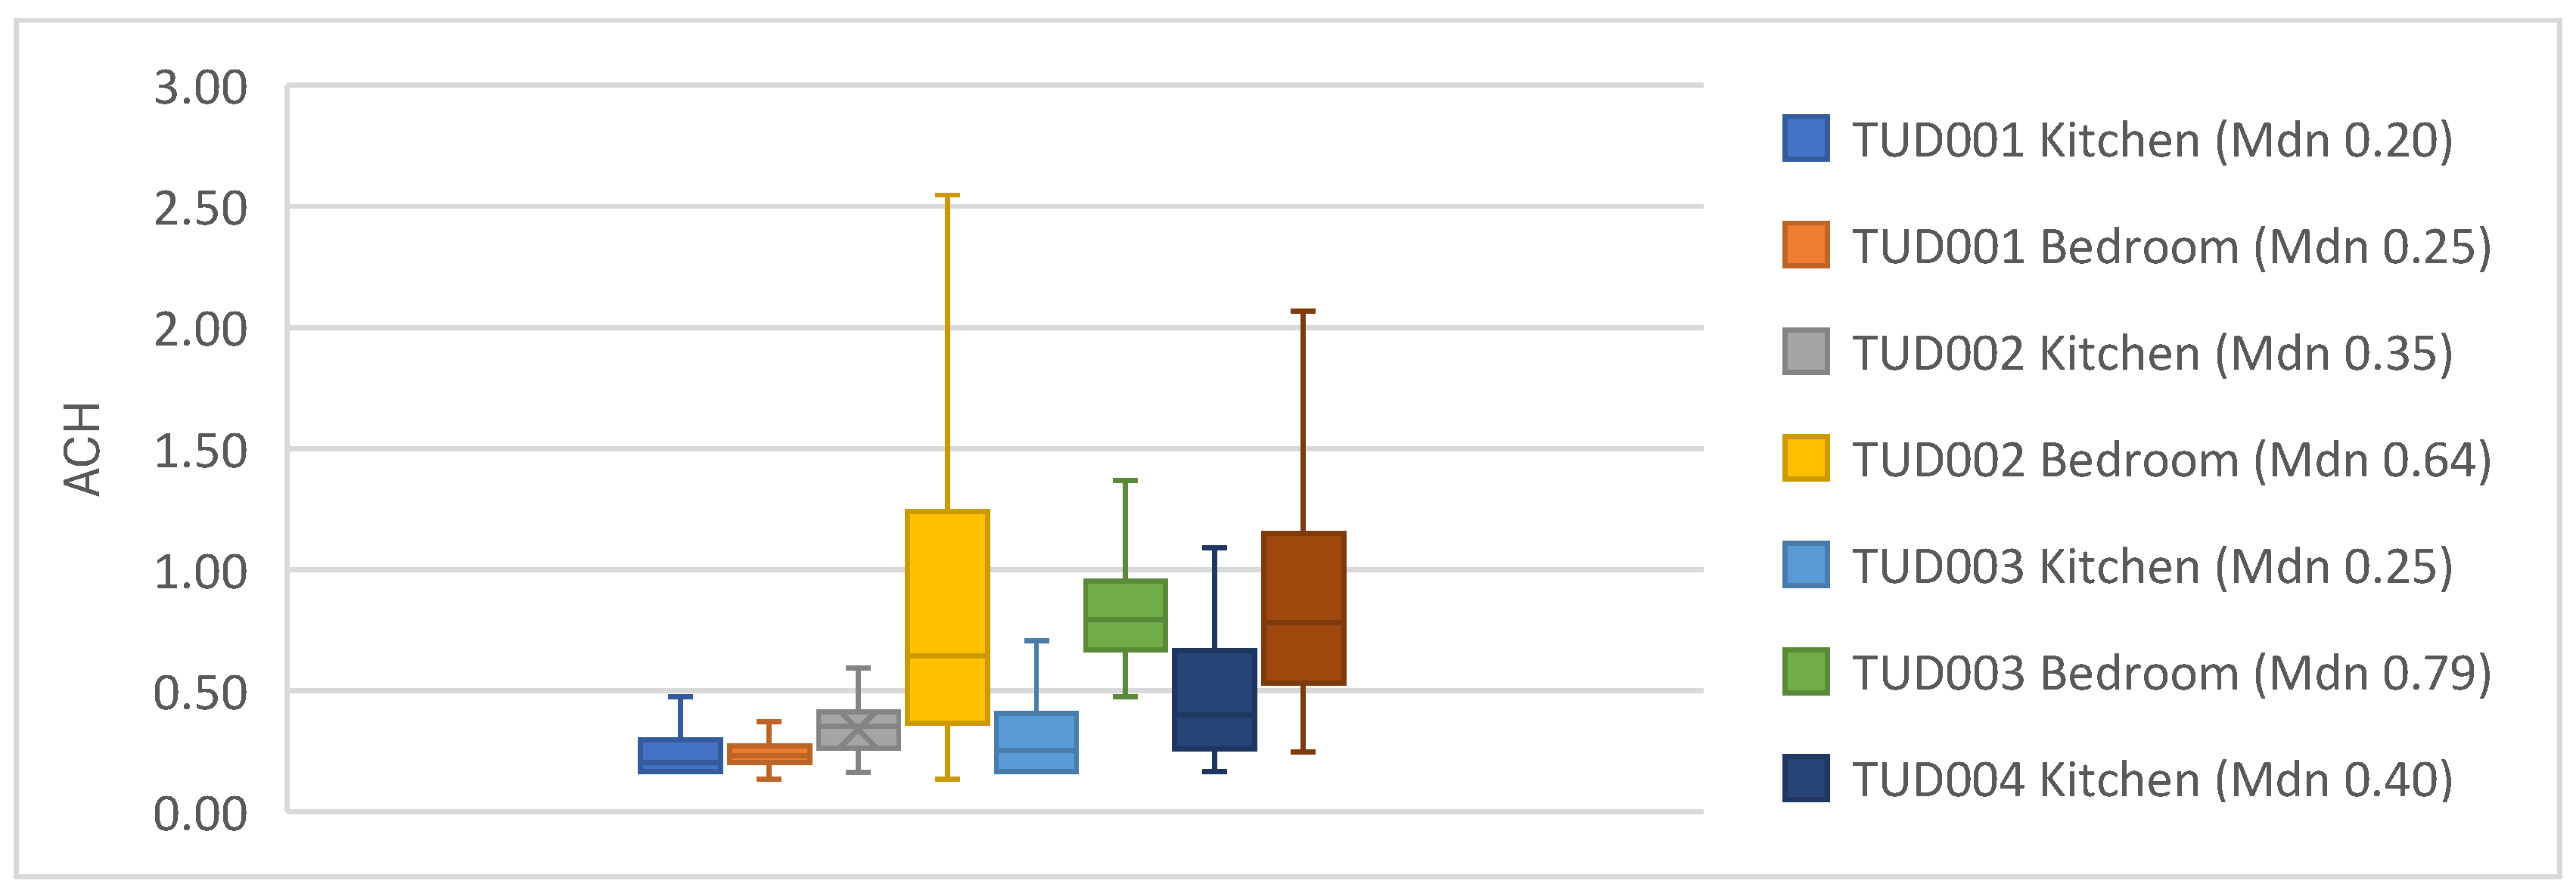
Figure 3.
Temperature Data – per room per dwelling.
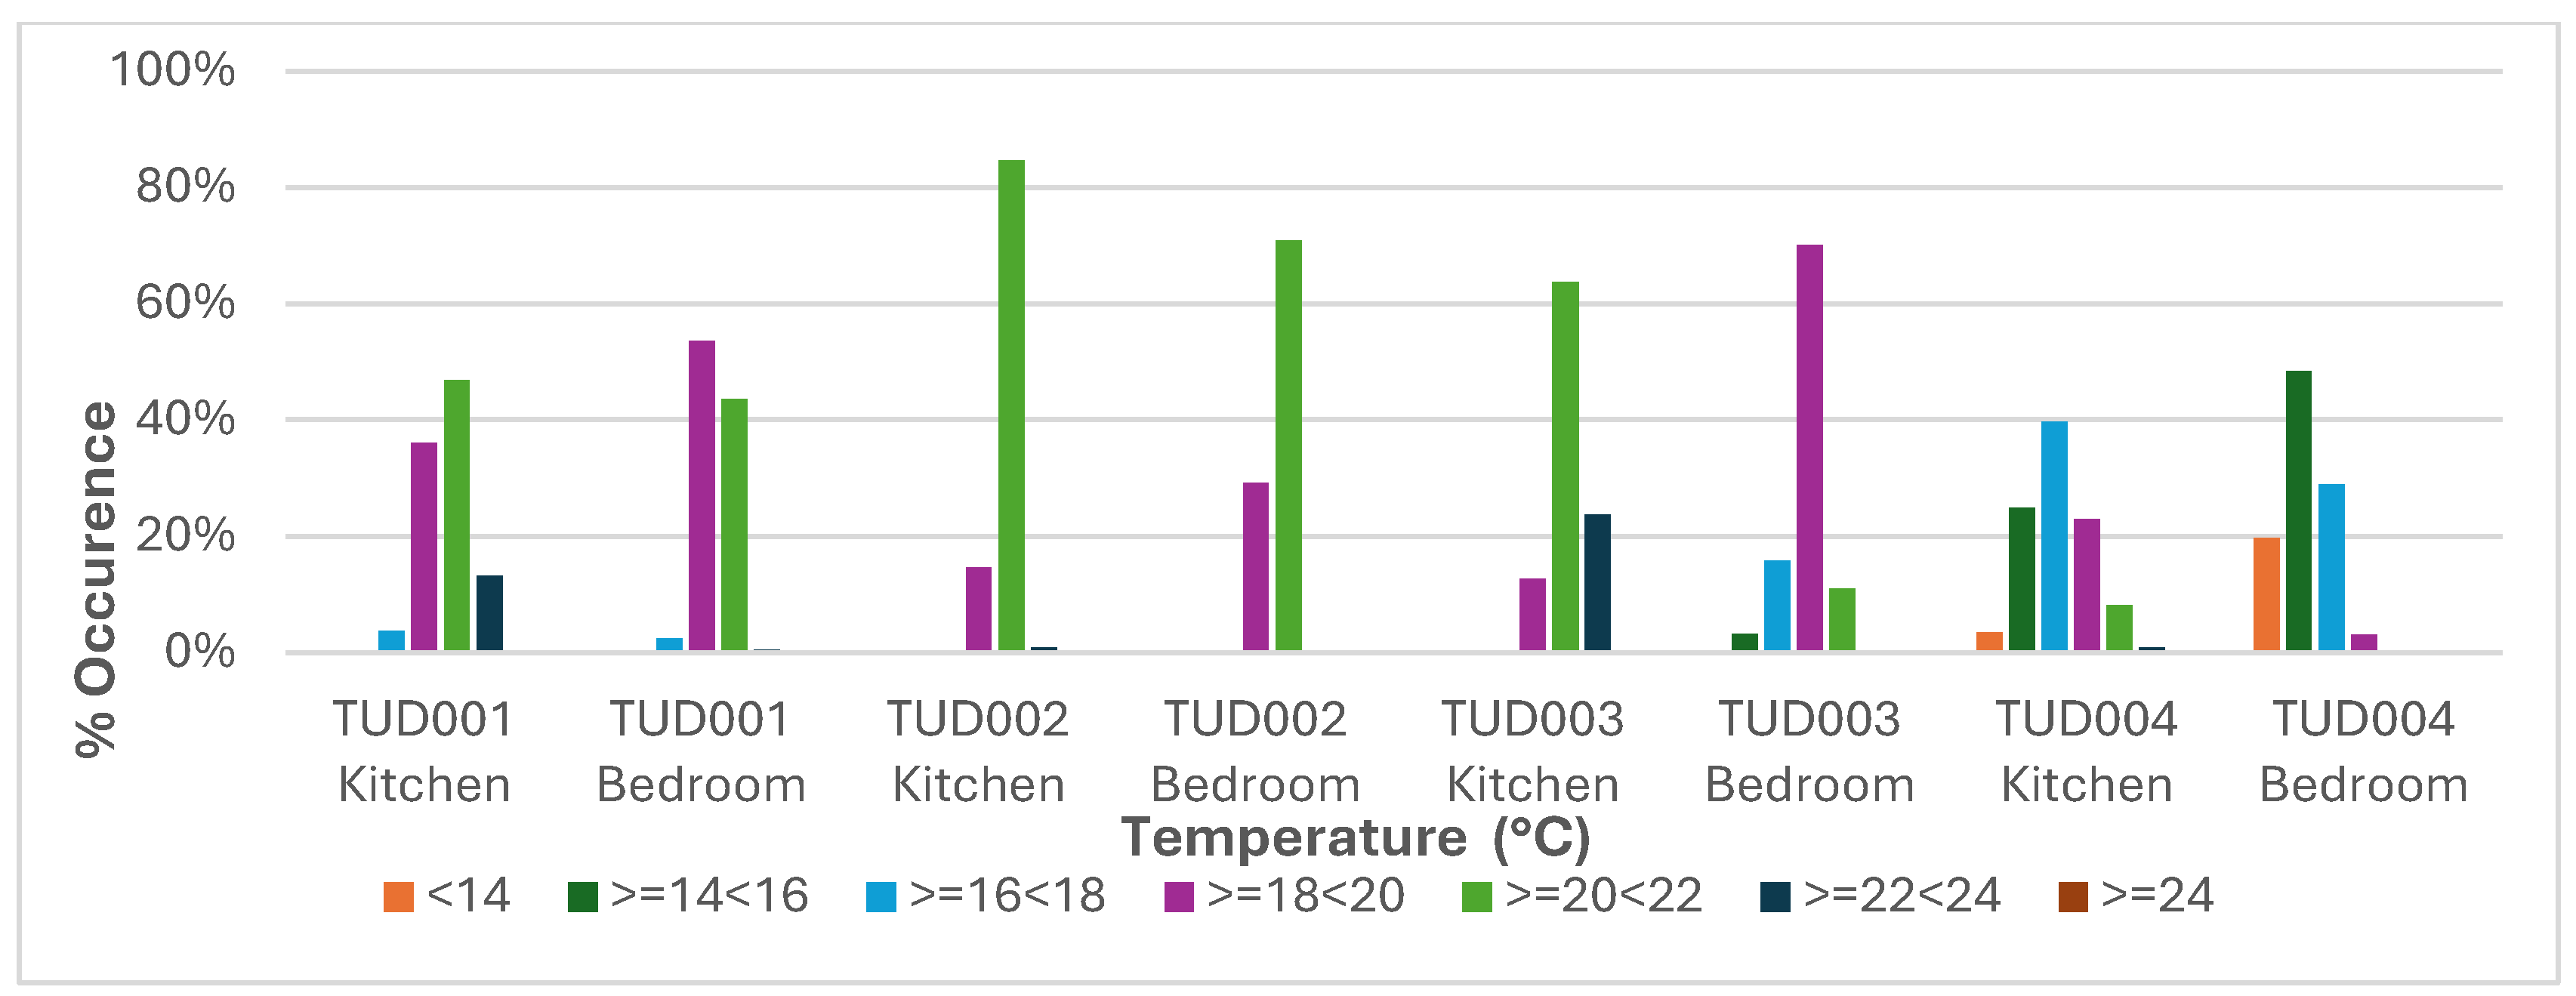
Figure 4.
Relative Humidity Data – per room per dwelling.
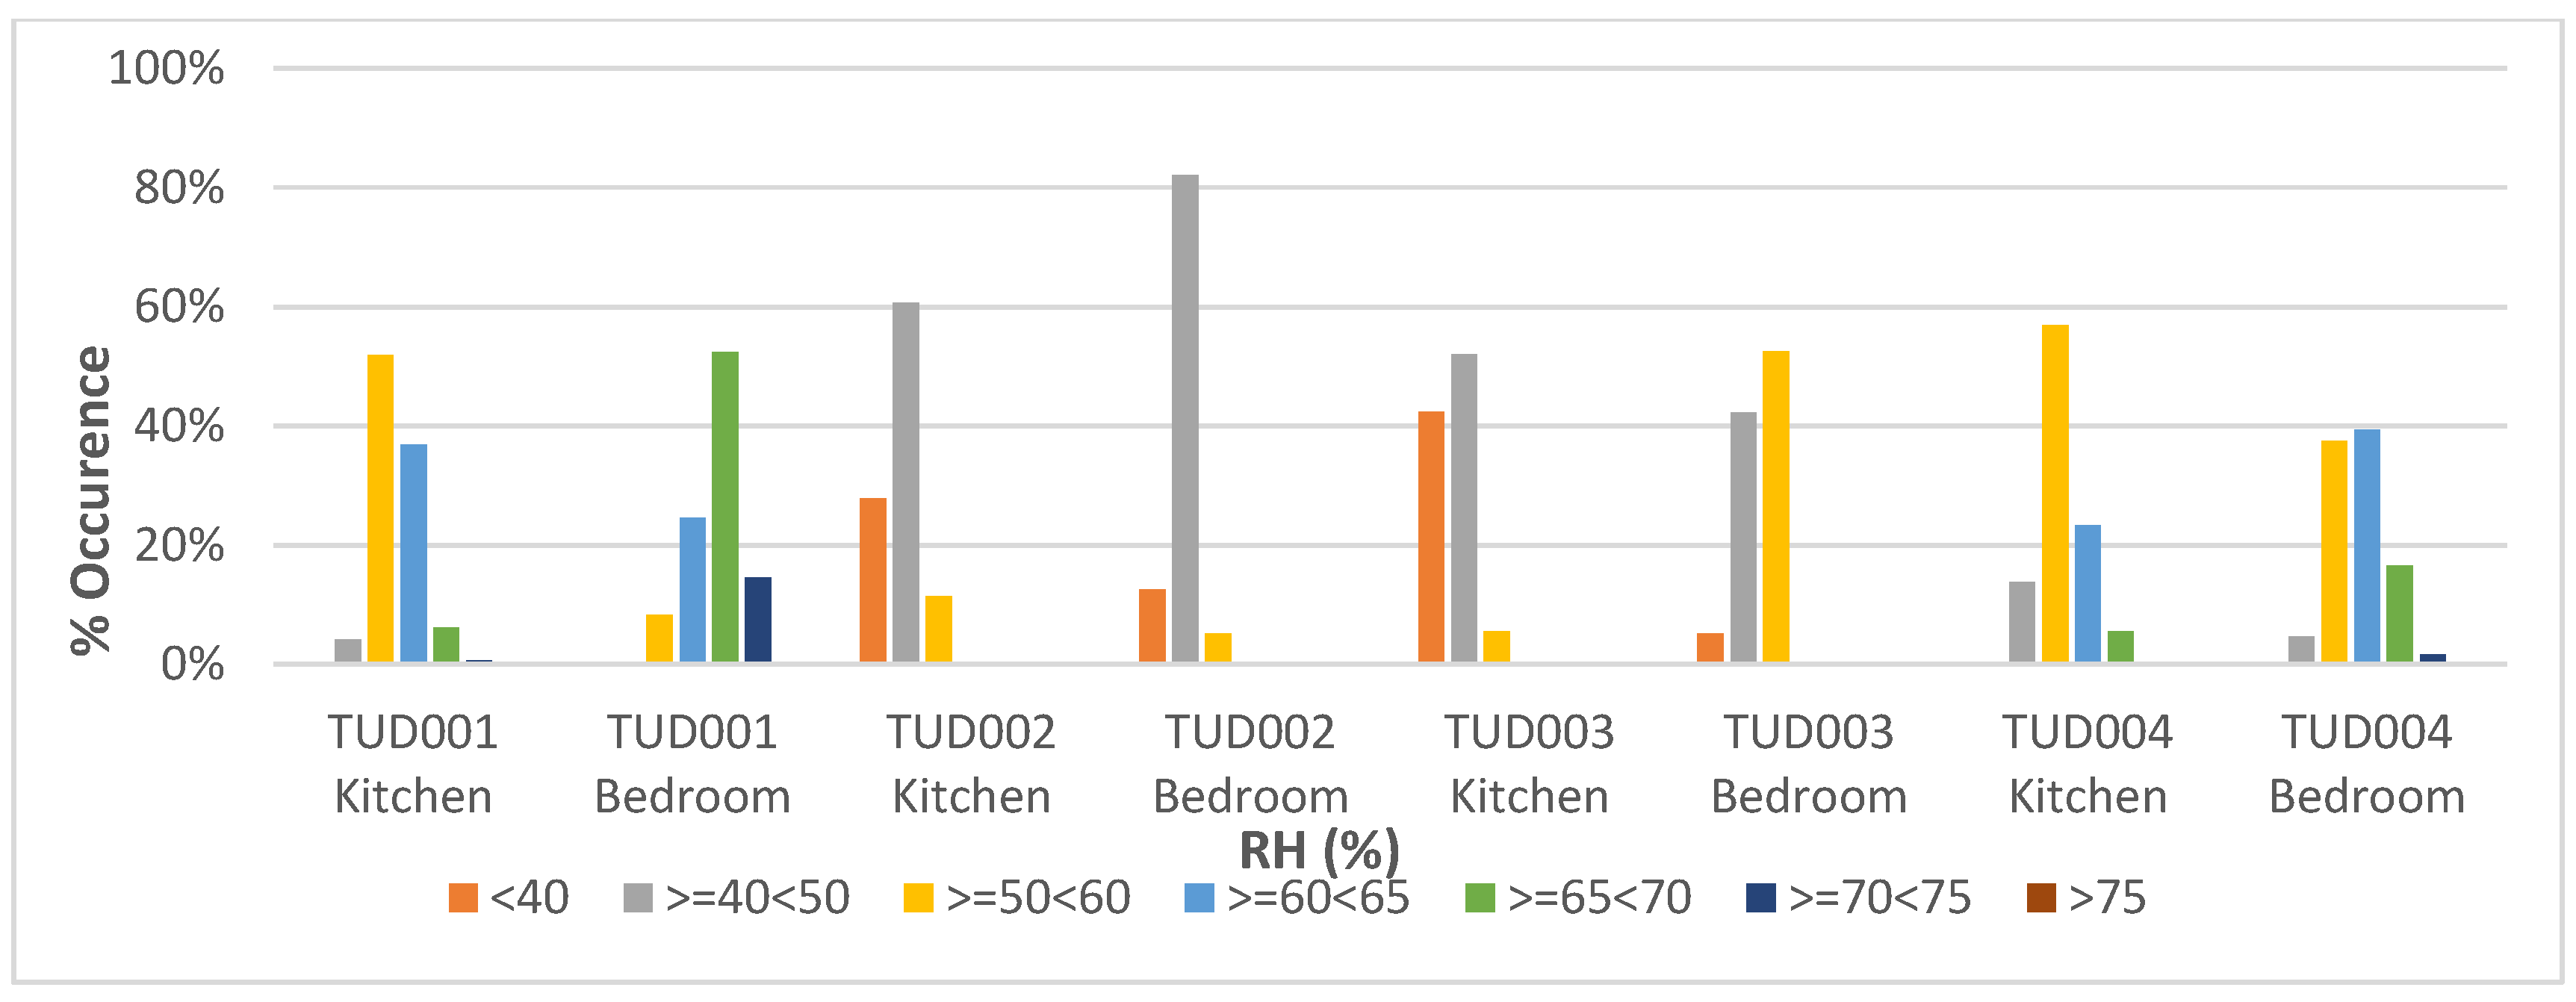
Figure 5.
SVPX @ 80% RH + 5 °C (External Conditions).
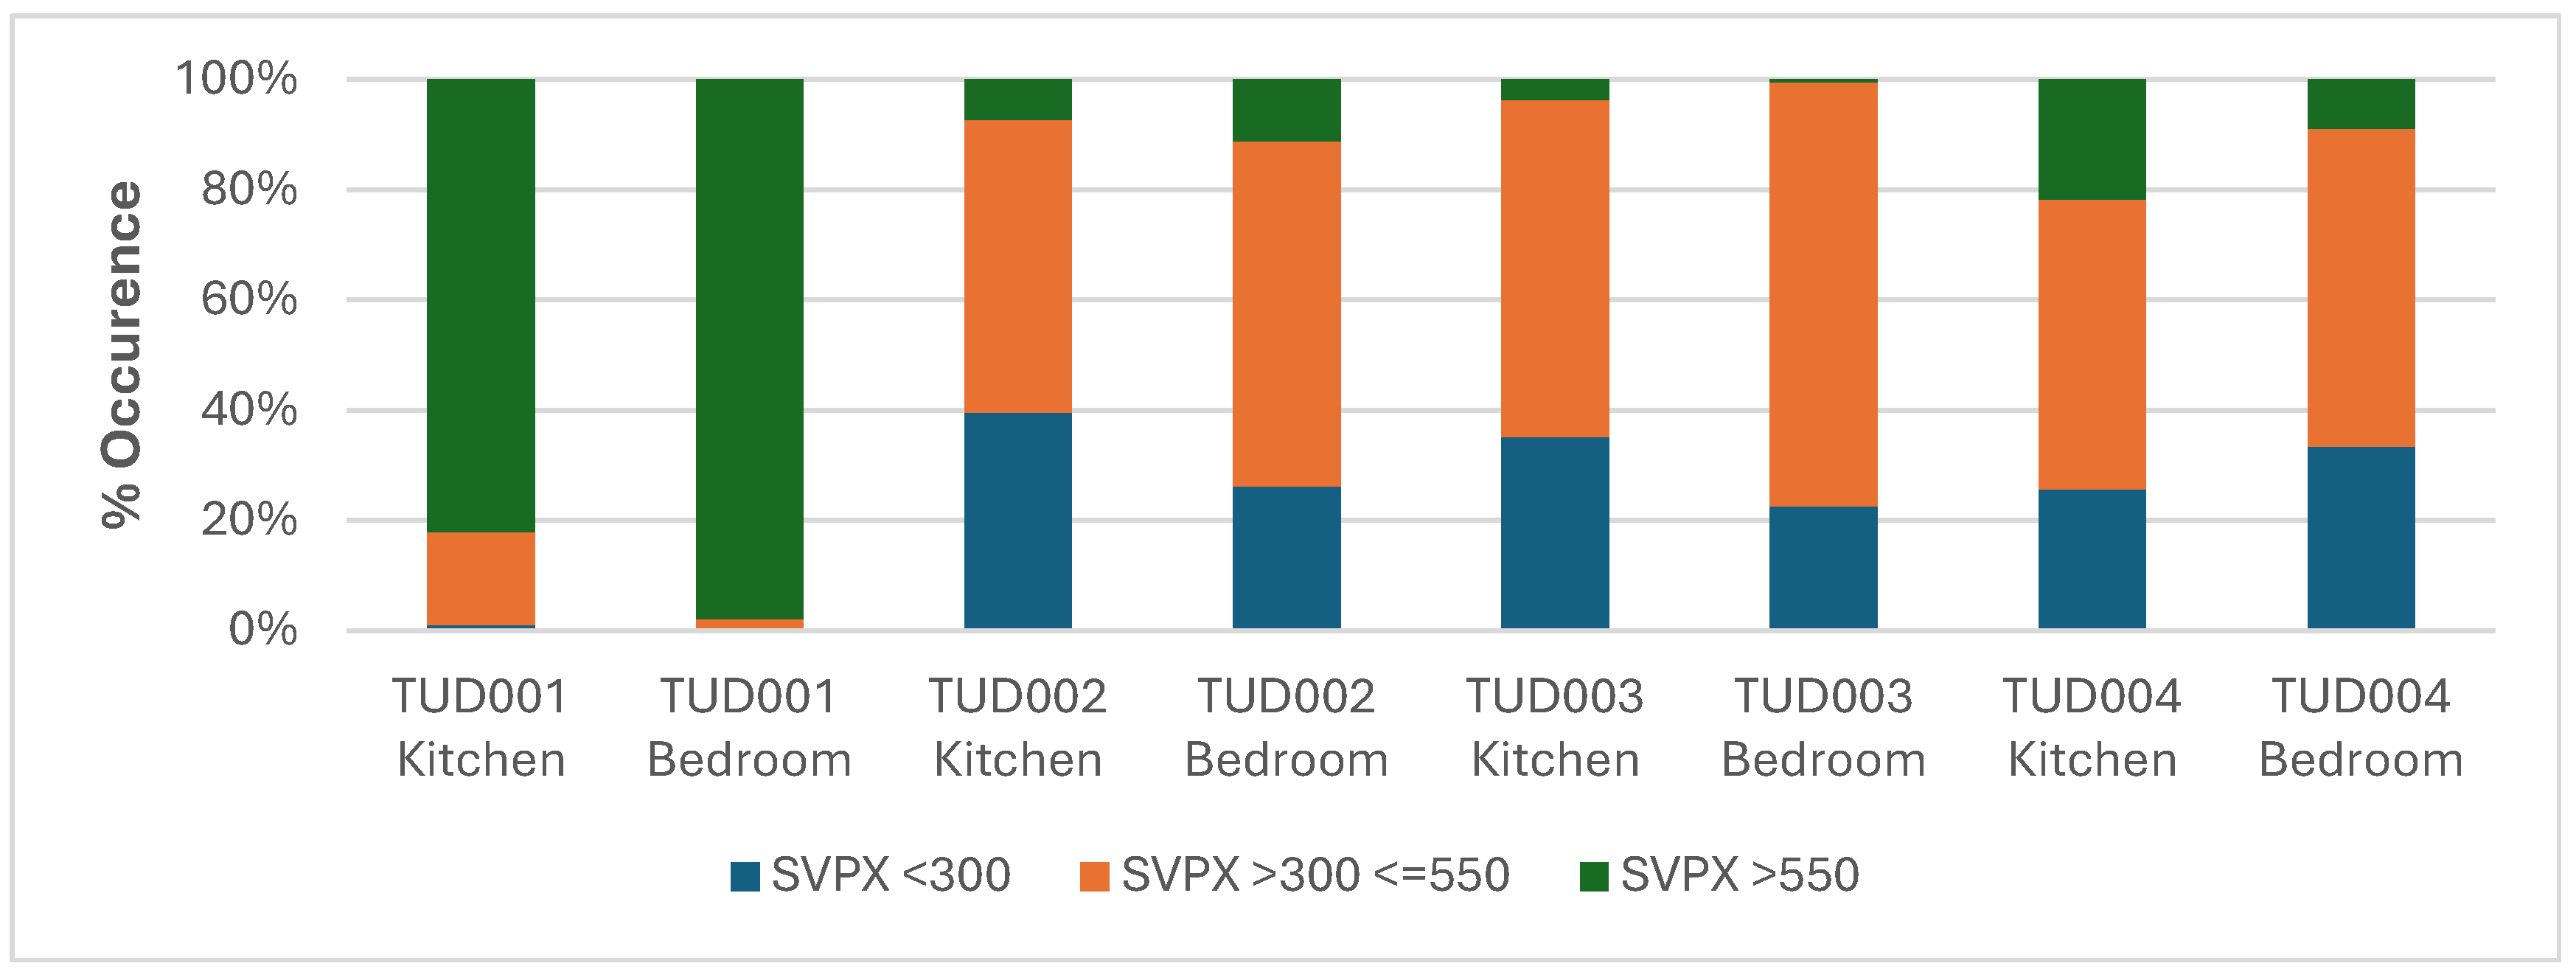
Figure 6.
SVPX @ 85% RH + 2.5 °C (External Conditions).
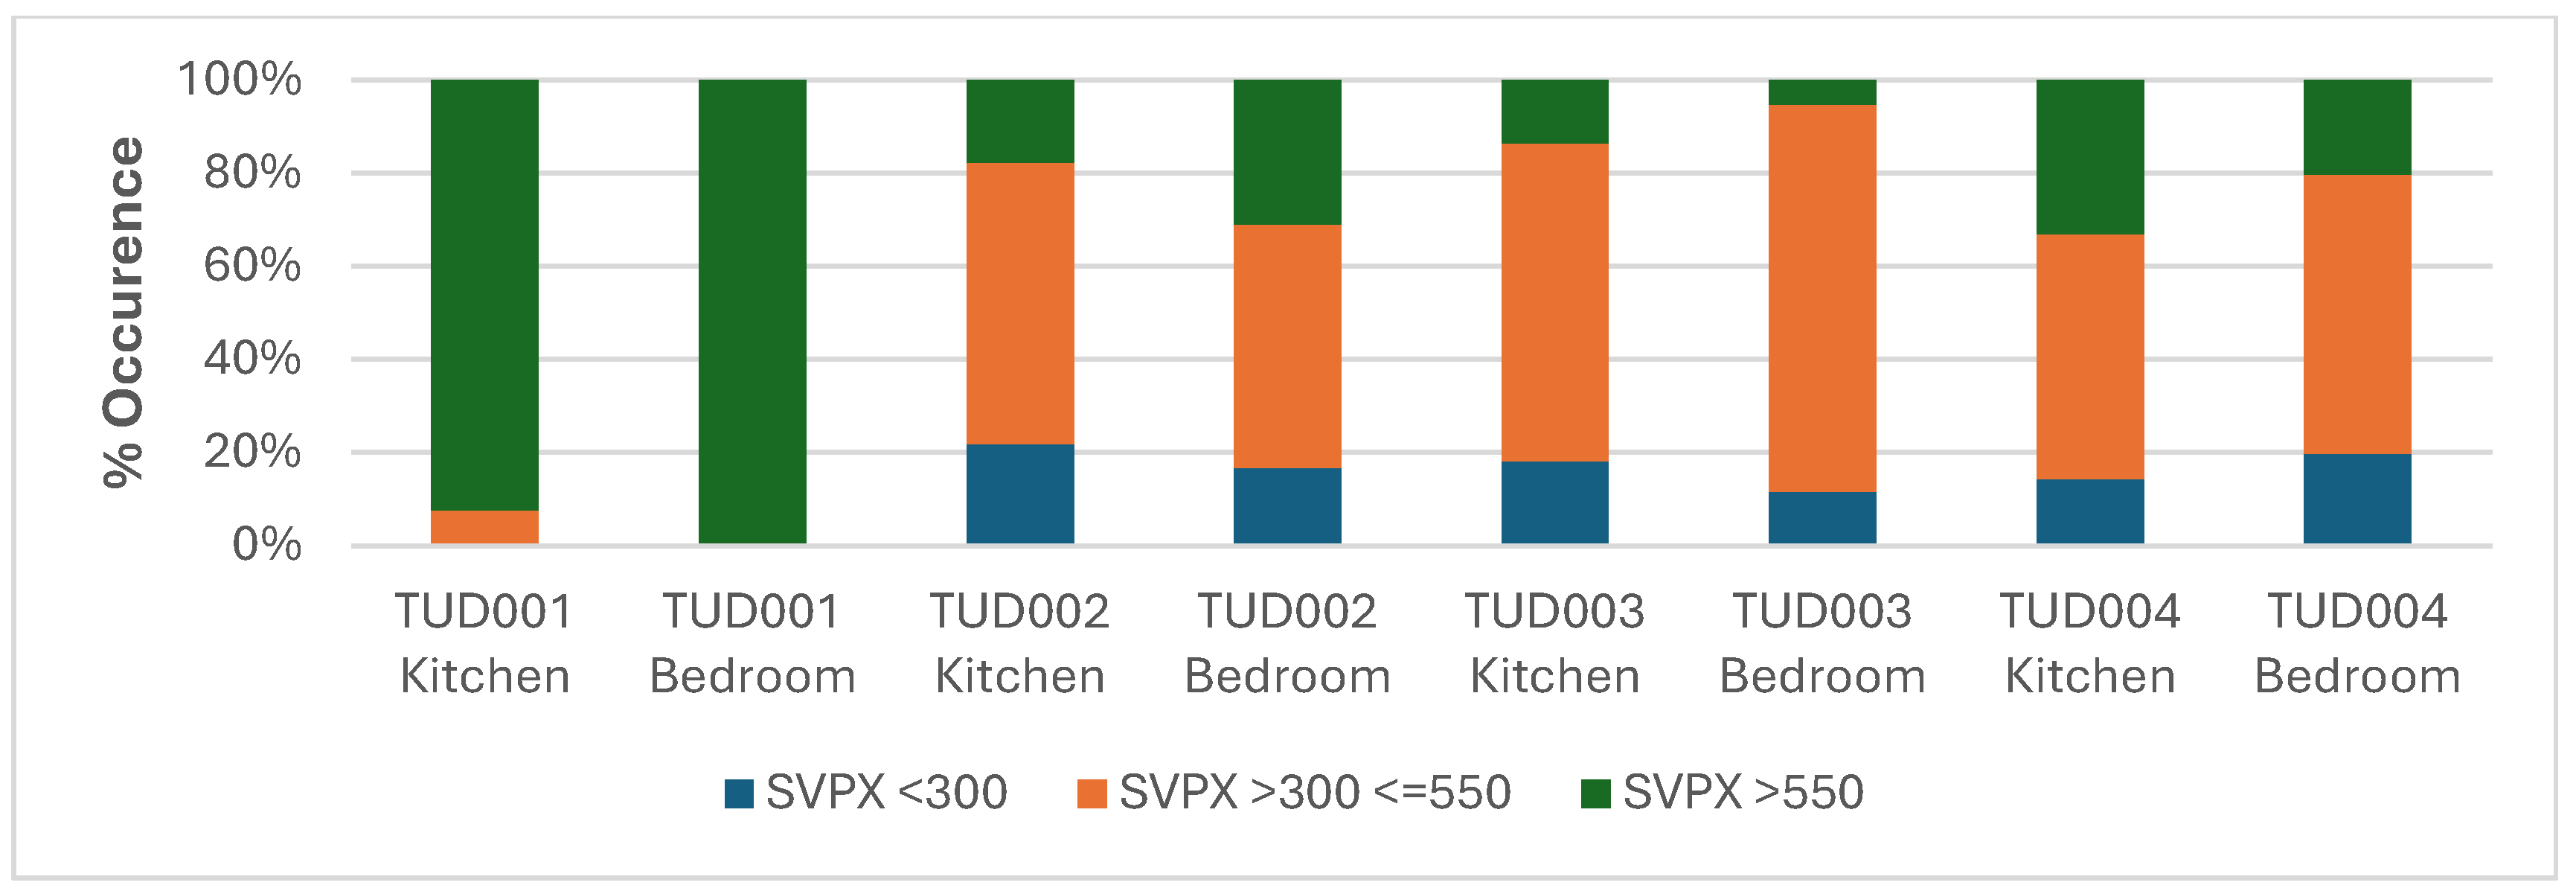
Figure 7.
SVPX @ 90% RH + 0 °C (External Conditions).
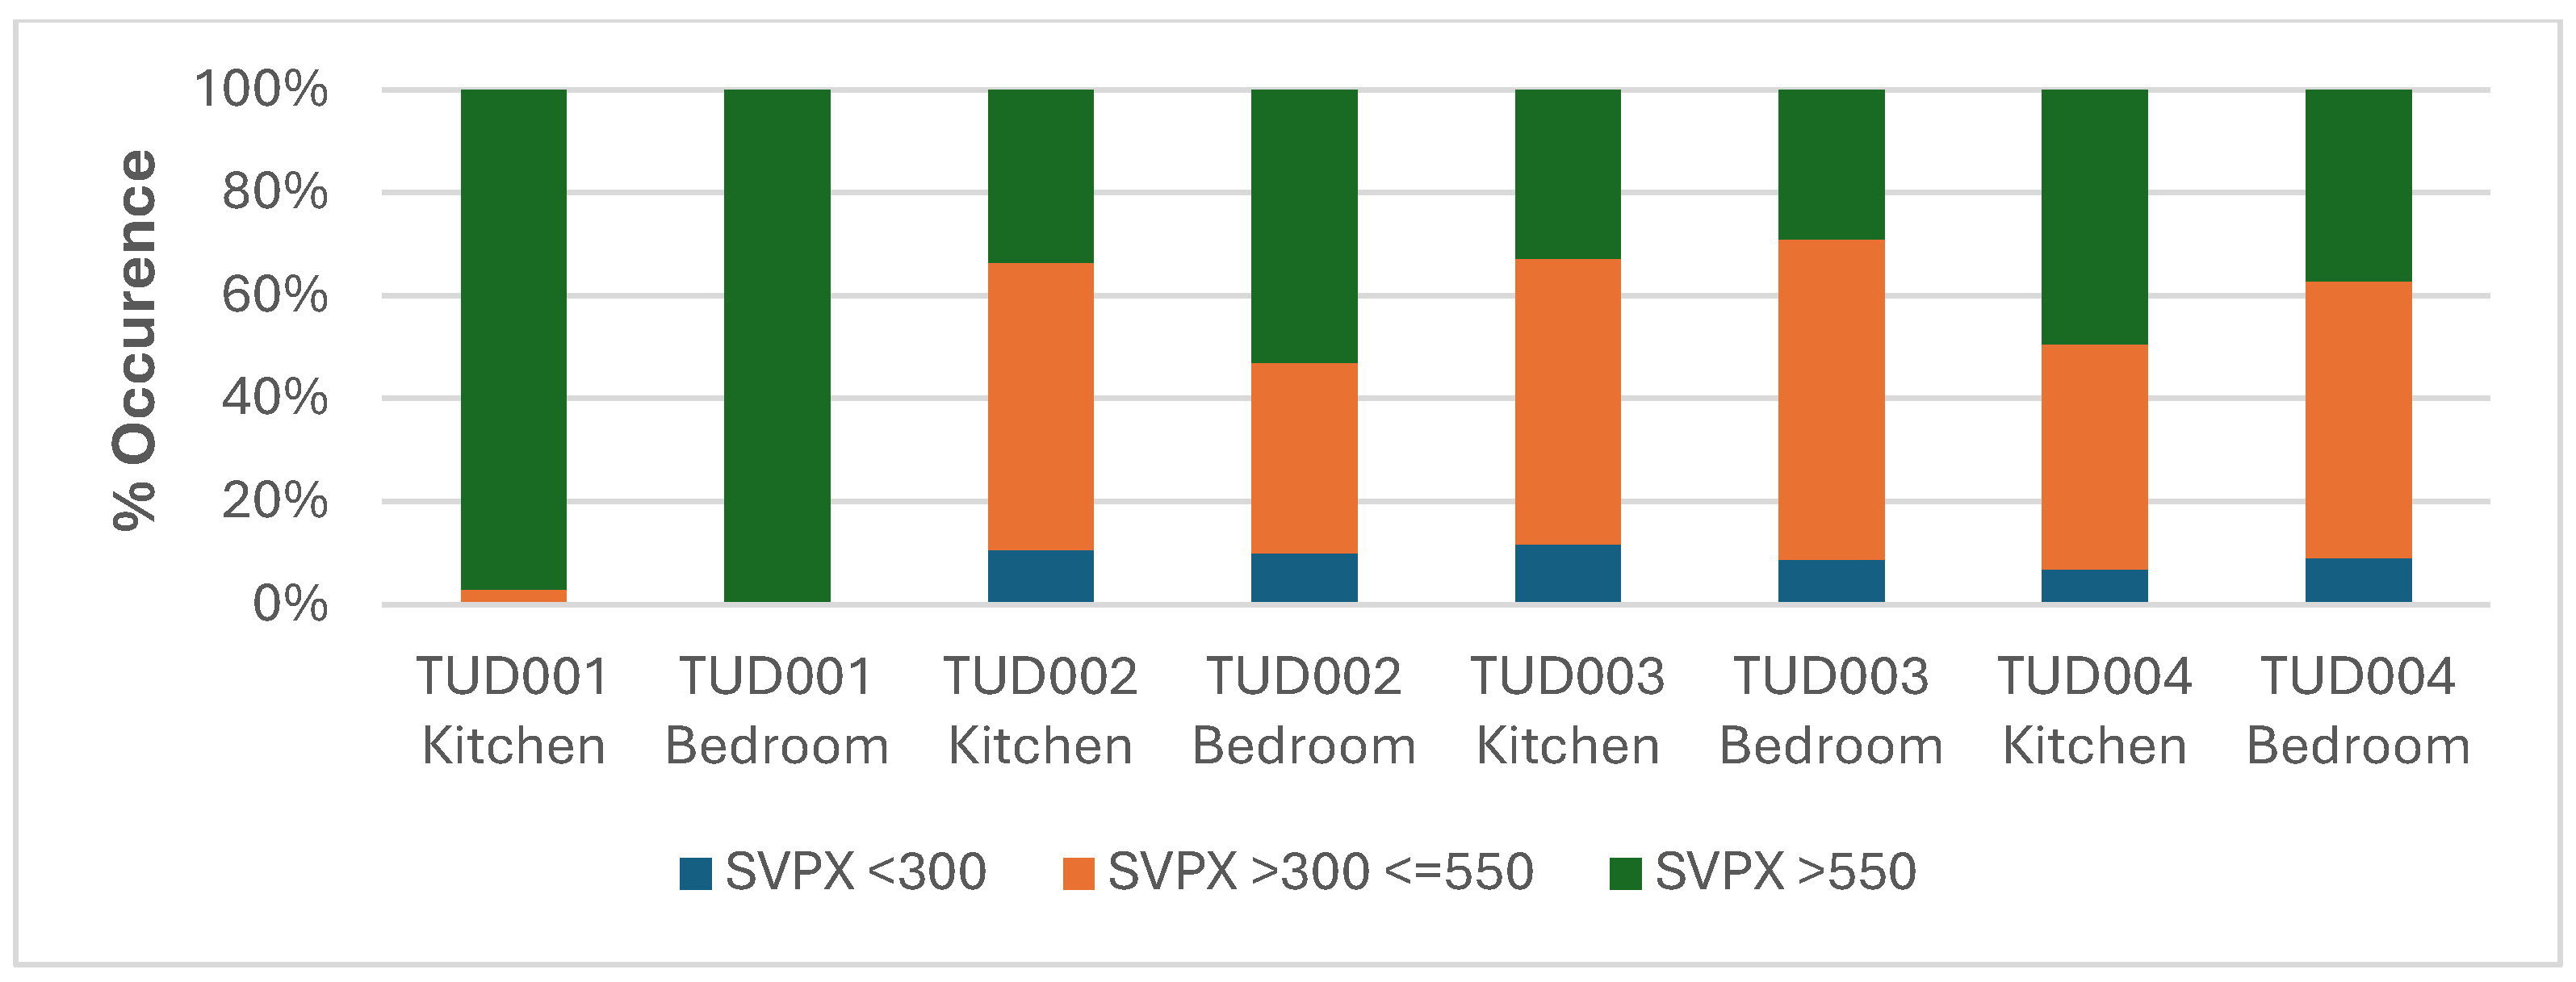
Figure 8.
TUD 004 – Internal Wall Surface Temperature.
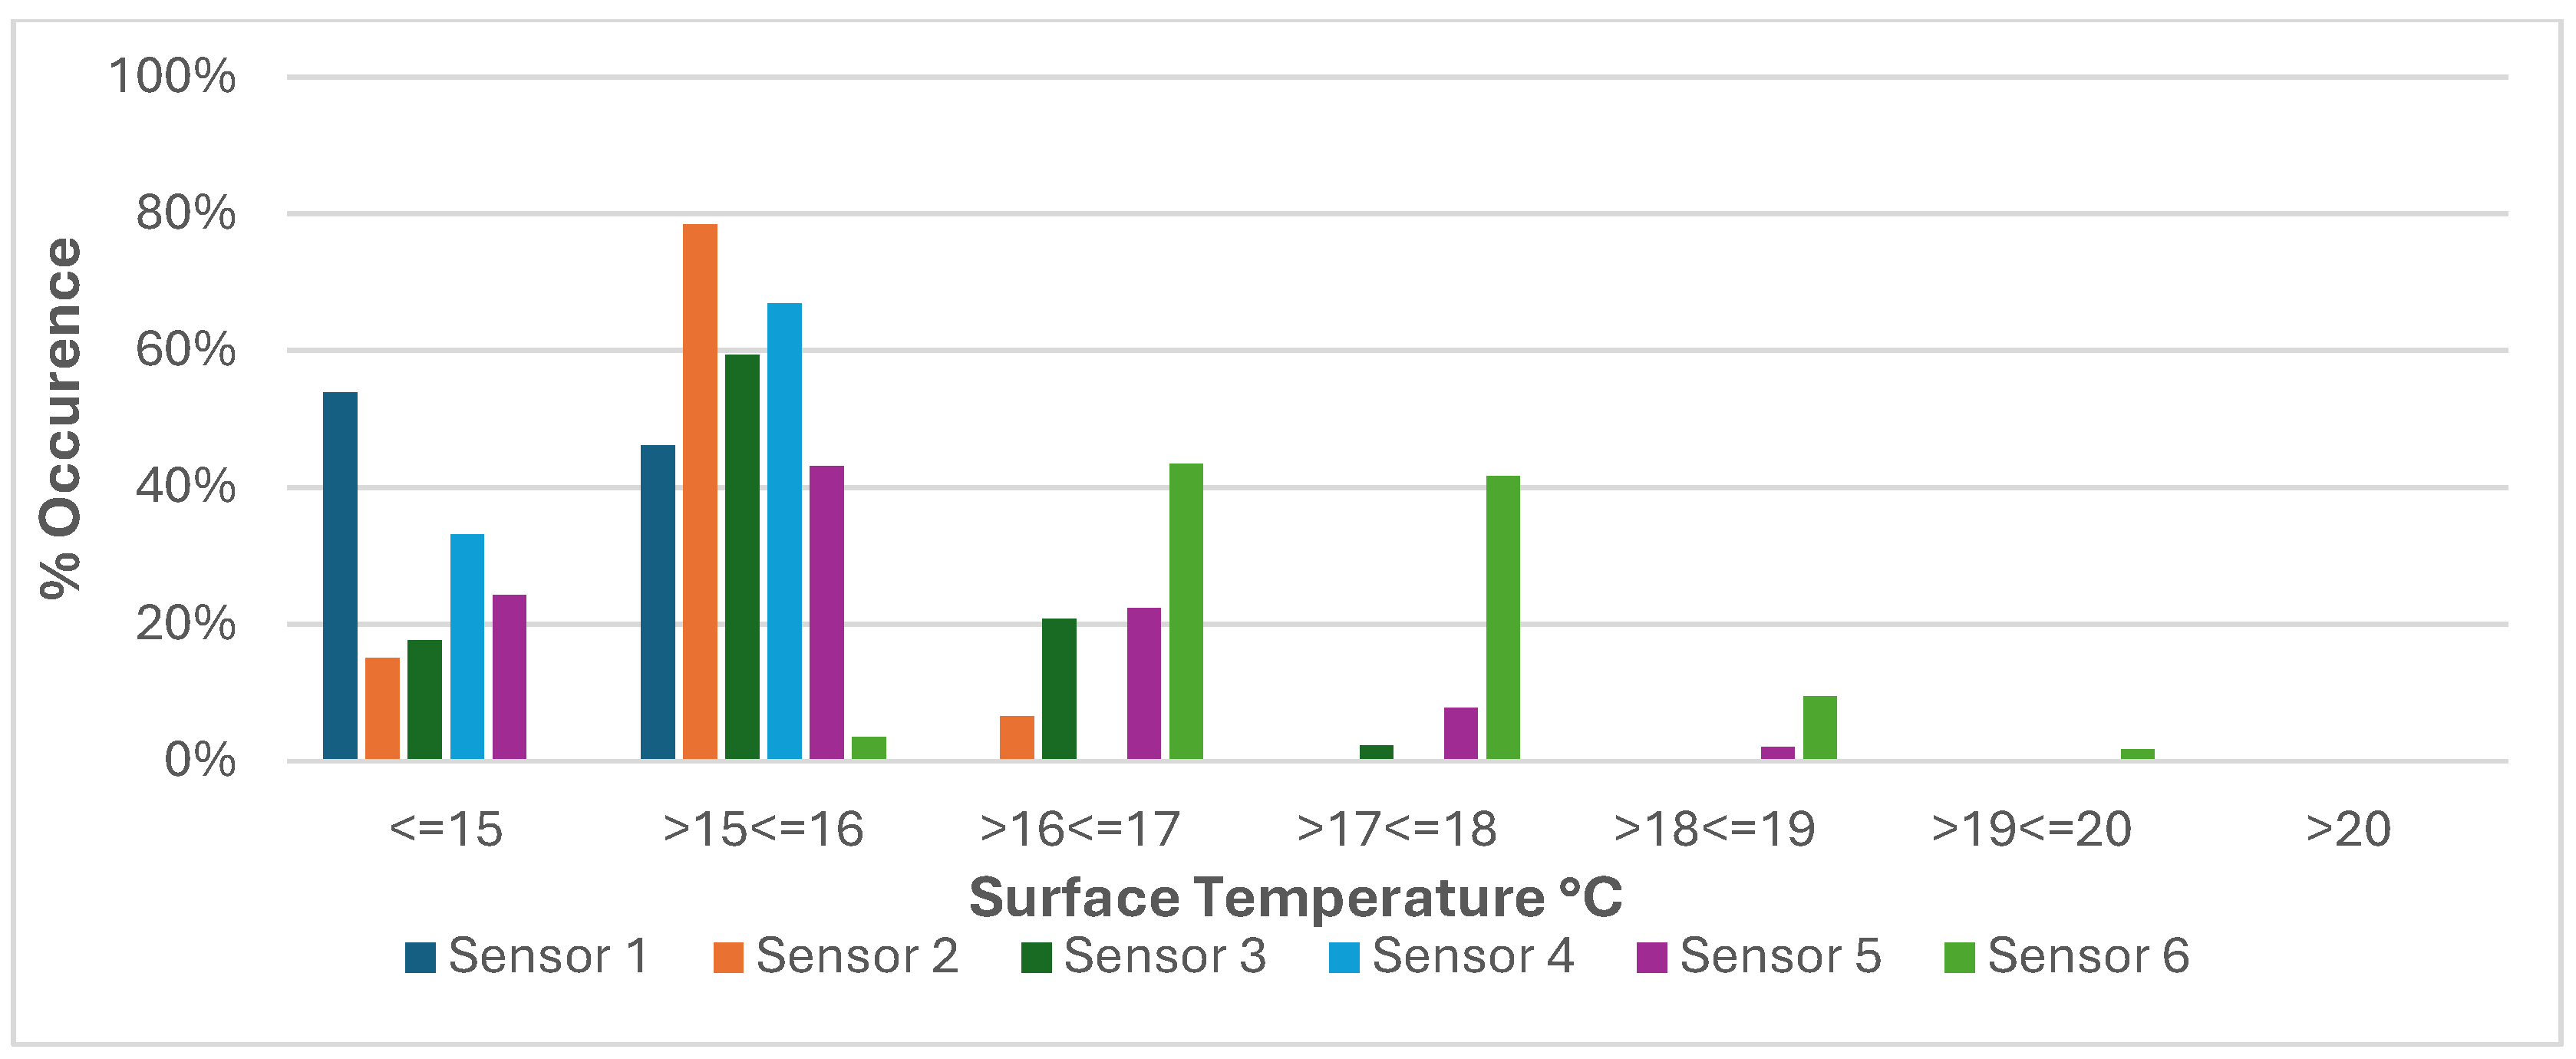
Figure 9.
TUD 001 – Internal Wall Surface Temperature.
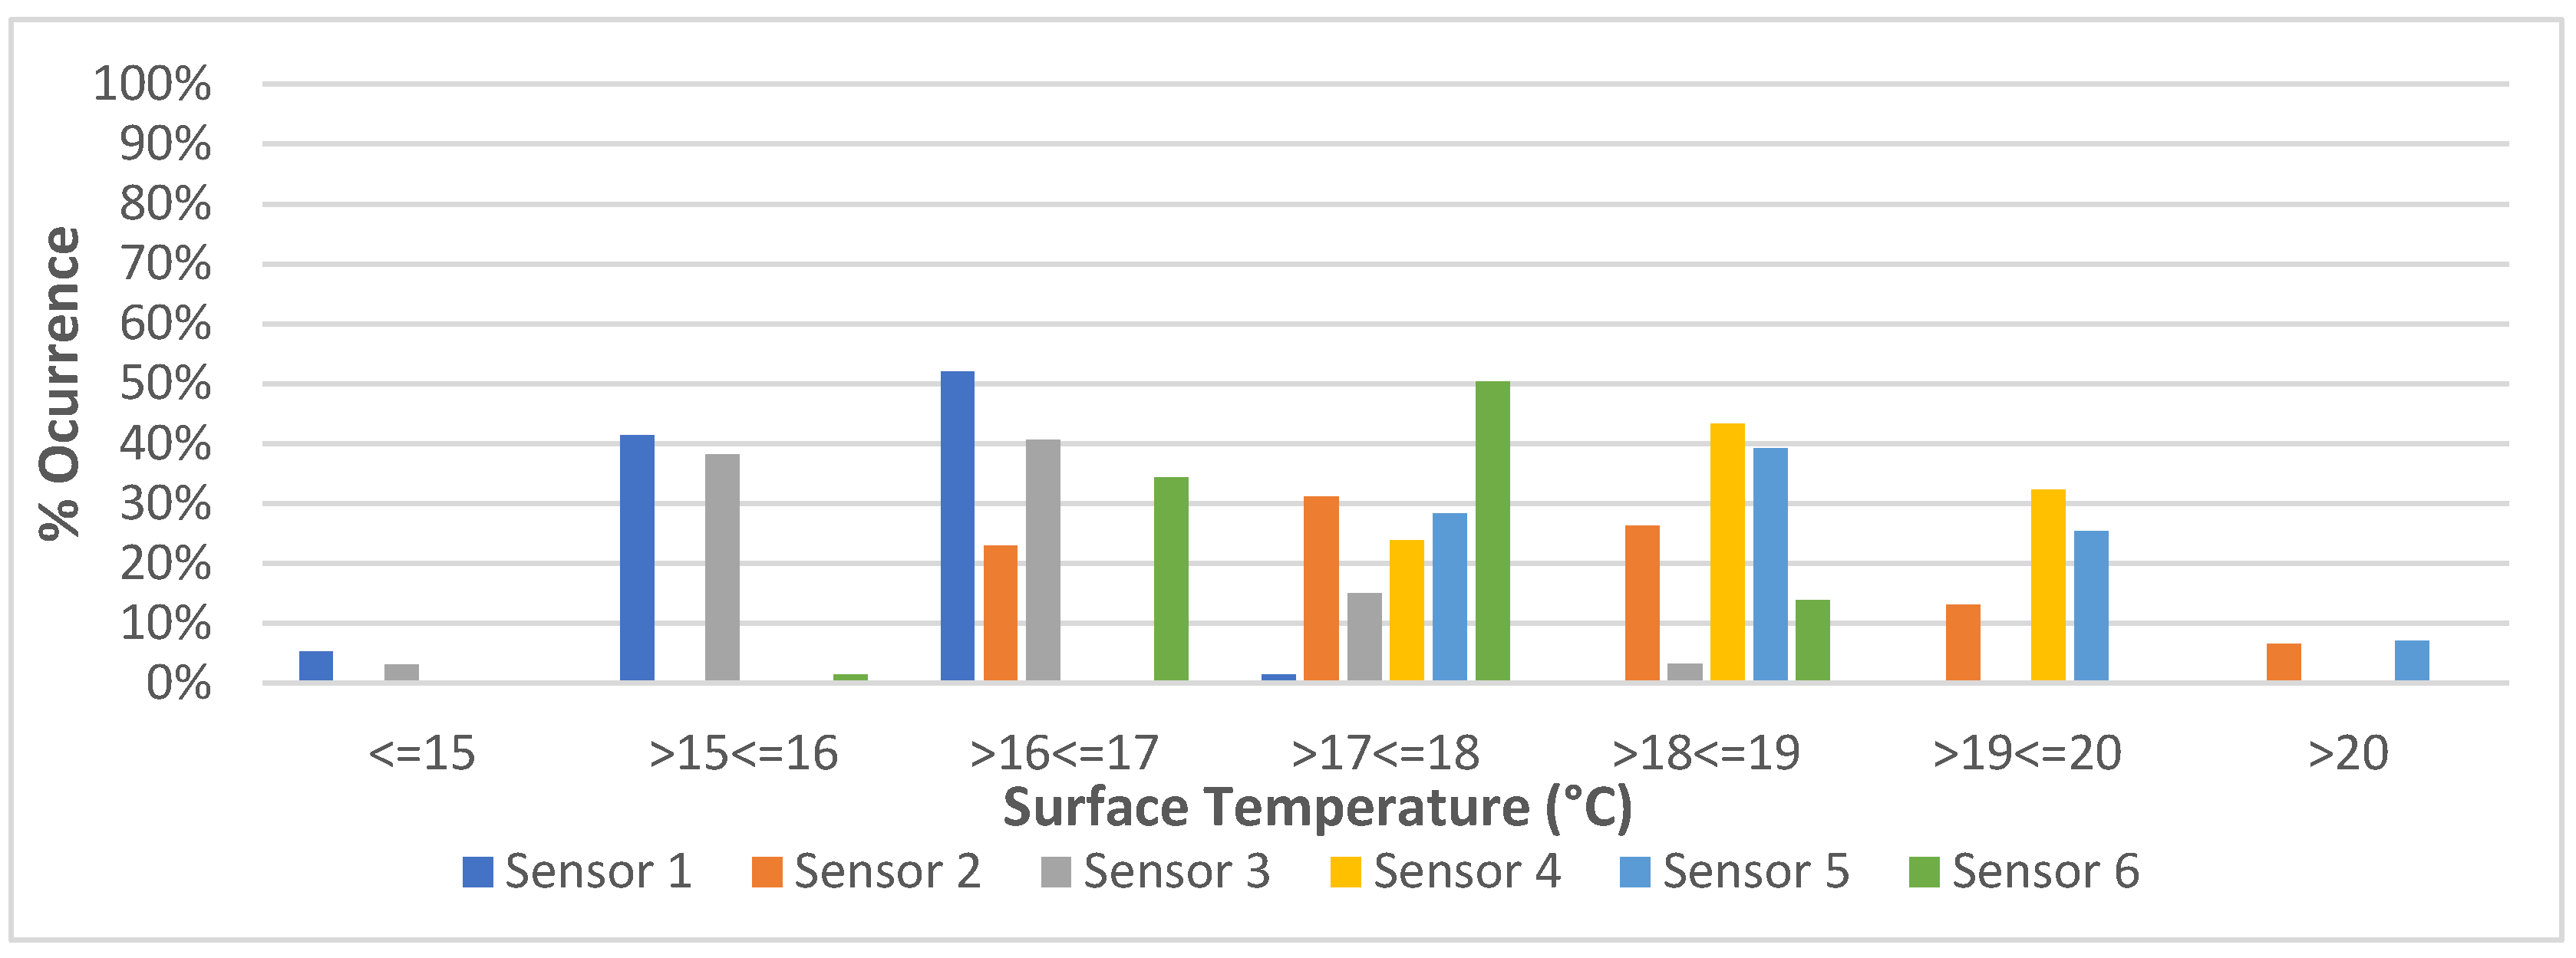
Figure 10.
TUD 002 – Internal Wall Surface Temperature.
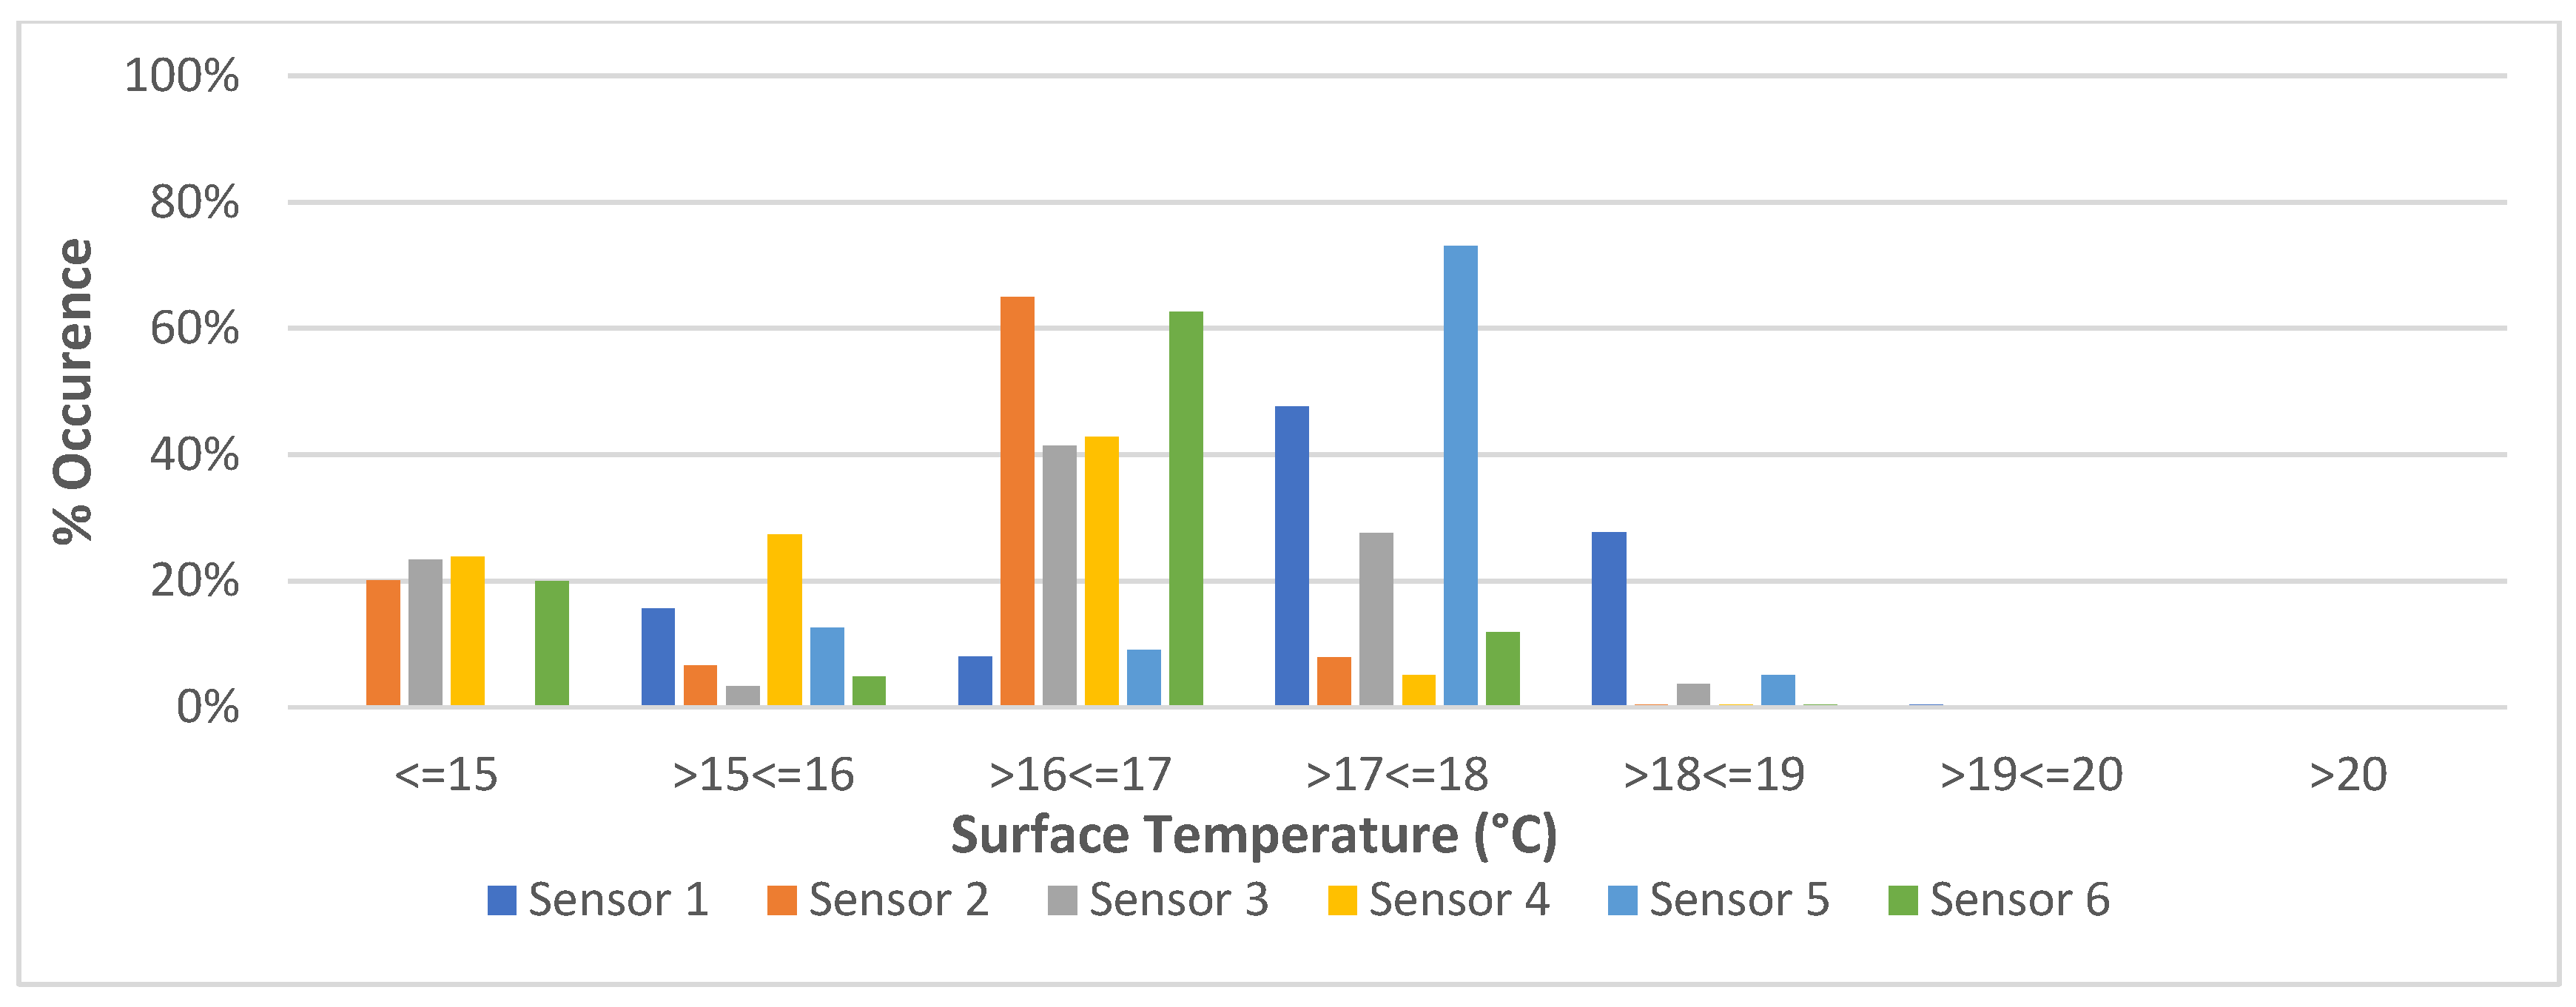
Figure 12.
RH variation @ recorded temperatures across all datasets.
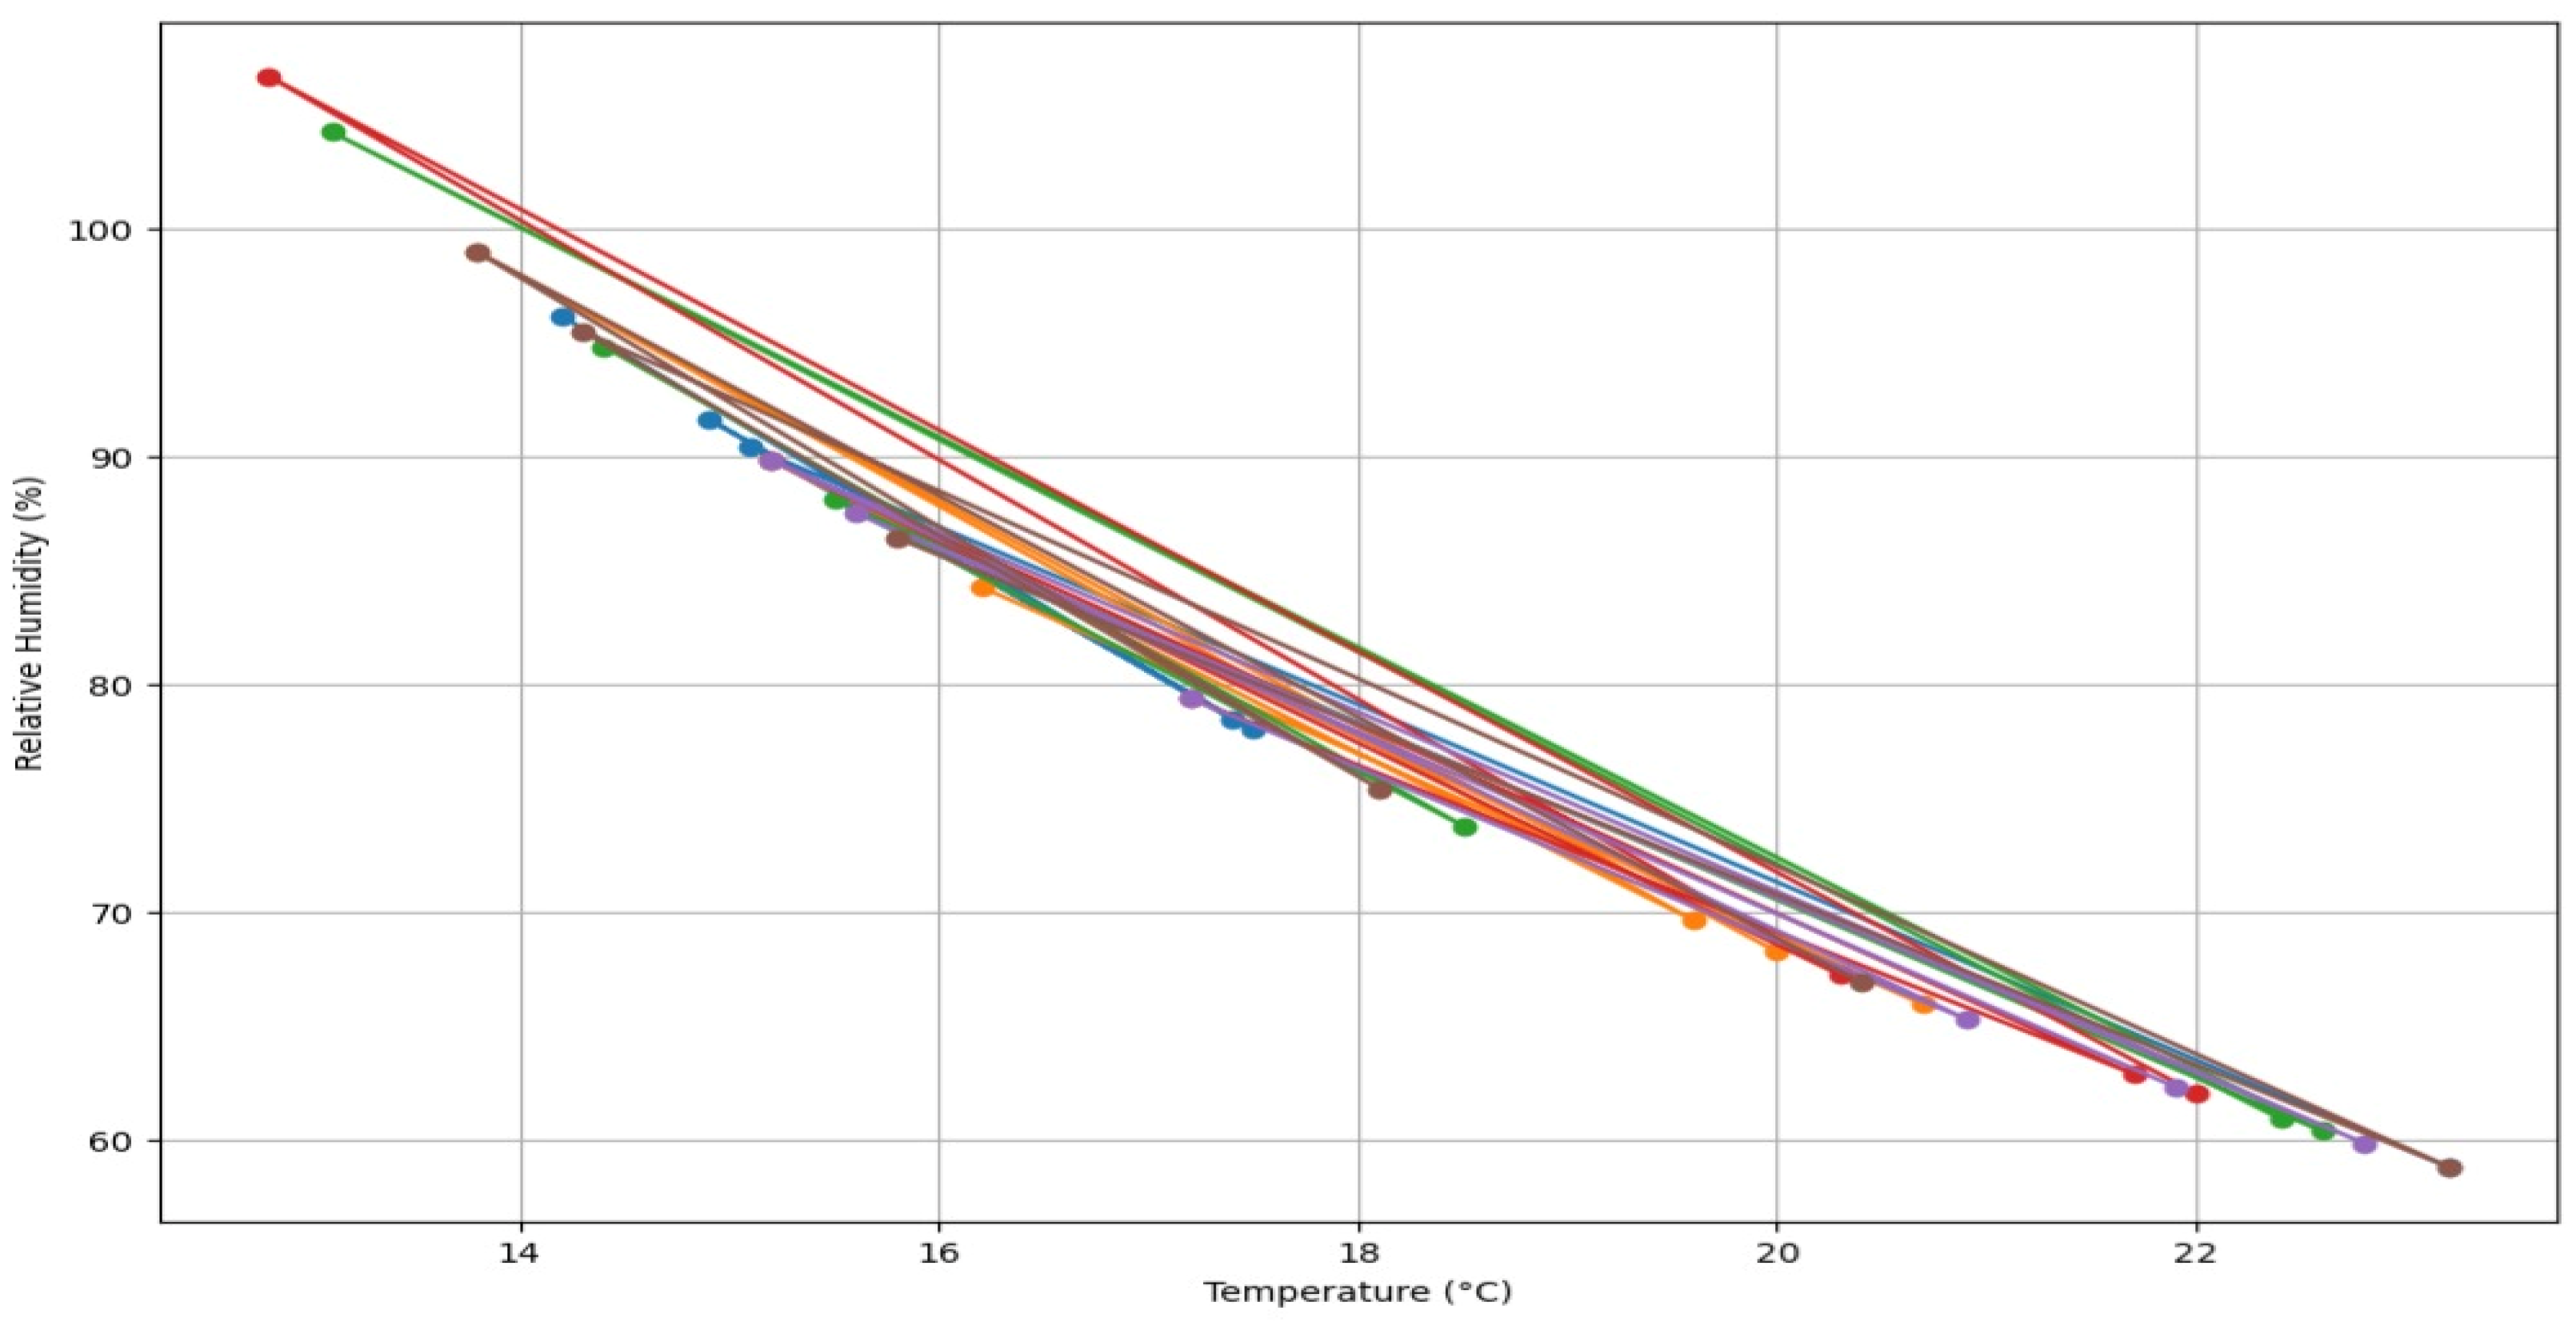

Table 1.
Participant Dwellings - Retrofit Measures.
| ID | Type of external windows and doors n = new measure e = existing measure dg = double glazed |
Type of external wall insulation used IWI - Internal wall insulation FFCB - Full fill cavity bead FFMW - Full fill mineral wool EWI - External wall insulation N – None e – existing measure |
Attic level insulation Y/N e = existing |
Floor insulation Y/N |
Demand Controlled Ventilation (DCV) Passive Vent (P) n = new measure e = existing measure |
Heat Pump (HP) or Gas Boiler (GB) n = new measure e = existing measure |
| TUD 001 | uPVC - n - dg | FFMW - e | Y - e | N | DCV - n | HP - n |
| TUD 002 | uPVC - n - dg | FFCB - e | Y - e | N | Passive - e | HP - n |
| TUD 003 | uPVC - n - dg | EWI - n | Y - e | N | Passive - e | HP - n |
| TUD 004 | uPVC - e - dg | N | Y - e | N | Passive - e | GB - e |
Table 2.
Participant Dwellings - Listed Improvements.
| ID | pre-retrofit BER | post-retrofit BER | pre-retrofit energy use - kWh/m2/yr | post-retrofit predicted energy use - kWh/m2/yr | pre-retrofit airtightness test result - m3/hr/m2 @ 50Pa |
post-retrofit airtightness test result - m3/hr/m2 @ 50 Pa |
Occupancy | |
| TUD 001 | C2 | B1 | 188.81 | 79.68 | n/a | 8.32 | 2 adults 2 children | |
| TUD 002 | D1 | B1 | 252.12 | 83.92 | n/a | 6.83 | 1 adult | |
| TUD 003 | C3 | B1 | 212.80 | 75.61 | n/a | 12.16 | 1 adult | |
| TUD 004 | D1 | n/a | 226.87 | n/a | 9.46 | n/a | 1 adult 3 children |
Disclaimer/Publisher’s Note: The statements, opinions and data contained in all publications are solely those of the individual author(s) and contributor(s) and not of MDPI and/or the editor(s). MDPI and/or the editor(s) disclaim responsibility for any injury to people or property resulting from any ideas, methods, instructions or products referred to in the content. |
© 2026 by the authors. Licensee MDPI, Basel, Switzerland. This article is an open access article distributed under the terms and conditions of the Creative Commons Attribution (CC BY) license (http://creativecommons.org/licenses/by/4.0/).
Copyright: This open access article is published under a Creative Commons CC BY 4.0 license, which permit the free download, distribution, and reuse, provided that the author and preprint are cited in any reuse.


