
Submitted:
07 January 2026
Posted:
08 January 2026
You are already at the latest version
Abstract
The development and deployment of robust technical solutions for sustainability improvement have become increasingly critical in response to growing environmental and social pressures, while maintaining economic viability, particularly in industrial systems that require multi-stage technology implementation. Identifying such solutions requires the systematic treatment of significant uncertainties that affect sustainability-related decision making. Among these, epistemic uncertainty, arising from incomplete or imperfect knowledge, is inherently subjective and, in principle, reducible. Fuzzy set theory provides an effective and well-established framework for representing and managing epistemic uncertainty in sustainability analysis. In this work, a fuzzy decision-making framework is proposed to support multi-stage technology development and deployment for dynamic sustainability performance improvement in industrial systems. The framework integrates comprehensive sustainability assessment with fuzzy representations of epistemic uncertainty to enable consistent comparison of alternative strategies at each implementation stage. It identifies the most appropriate strategy at each stage while ensuring alignment with long-term sustainability objectives. The proposed approach functions as a decision-support tool for guiding adaptive, stage-wise technology deployment under uncertainty. A case study of a nickel electroplating system is presented to demonstrate the applicability and effectiveness of the methodology.
Keywords:
sustainability
; fuzzy decision making
; technical solution identification and deployment
1. Introduction
The sustainable development of industrial systems has become an increasingly important area of study due to the need to counter growing environmental concerns while also evaluating and improving the economic and social impacts of industrial production. Focusing on sustainability improvement allows companies to gain significant competitive advantages, lower effects on the environment, and help address the concerns of people connected to and affected by production. In this regard, many sustainability decision-making procedures make use of the Triple Bottom Line (TBL) approach, balancing the economic, environmental, and social dimensions of sustainability to identify technologies or pathways for industrial sustainability improvement.
Liu and Huang (2012) implemented sustainability evaluations and technology assessment under data uncertainty using goal setting and systematic elimination for decision-making procedures. They also developed an interval-parameter-programming-based approach to address data uncertainty in sustainability assessments (2013). Al-Sharrah et al. (2010) incorporated sustainability indicators into a mixed integer linear programming model for sustainability and applied these models to the petrochemical industry. Begic and Afgan (2004) proposed a multi-criterion decision-making model and used it to evaluate various options for an energy power system. Cai and Lai (2021) used emergy theory for aggregating different categories of sustainability evaluation and incorporating benchmarking for ranking mechanical manufacturing systems.
Taken together, these studies indicate that TBL-based sustainability decision-making integrates multiple techniques and decision-making models to support viable outcomes. However, many of them often focus on sustainability improvement through the lens of a single overarching decision. In contrast, industrial sustainable development is a complex and long-term process, with the need for multiple decisions over periods of time. Moradi-Aliabadi and Huang (2016a) proposed the idea of multistage sustainability assessment and developed a mathematical framework for optimizing sustainability improvement across multiple steps, or stages. The use of optimization, however, while effective at producing results, causes the solution identification procedure to become a black box operation where the mathematical methods used to constrict the solution space lack scientific insight. And since that study is one of the only studies in the area of multistage sustainability assessment, there is a clear need for a methodology which can systematically eliminate possible improvement pathways in a scientifically informative manner.
The formulation of such a scientifically informative methodology requires addressing large amounts of uncertainty. One type of uncertainty is called epistemic uncertainty, which is subjective, and comes from lack of knowledge or information. In the context of decision-making, dealing with this type of uncertainty is often already complex. When coupled with the need for incorporating human intelligence in the decision-making process, complexity only increases. For this reason, fuzzy mathematics-based methodologies have been proposed for robust sustainability assessment and technology evaluation.
Liew et al. (2014) used fuzzy optimization to evaluate the sustainability of production pathways for biodiesel. Ren et al. (2013) introduced a multi-actor multicriteria fuzzy decision-making methodology and ranked four technologies for hydrogen production based on sustainability performance. Khishtandar et al. (2017) developed a multicriteria sustainability decision-making methodology incorporating hesitant fuzzy linguistic term sets to reflect decision-maker preferences. Calabrese et al. (2018) used the ISO 2600 framework for determining sustainability indicators and fuzzy AHP to rank different technologies for a hydraulic systems manufacturer. Sitorus and Brito-Parada (2020) extended the Shannan entropy method for multi-criterion decision-making by adding triangular fuzzy numbers to deal with uncertainty. They then applied this methodology to the sustainability evaluation of renewable energy technology alternatives. And Piluso et al. (2010) created fuzzy inference rules to evaluate the sustainability of industrial facilities and compare sustainability improvement plans.
The use of fuzzy logic in sustainability assessment and technology evaluation allows a decision-maker to take arbitrary language, define the language using fuzzy sets, and carry out complex decision-making using the defined fuzzy sets. When combined with a systematic procedure, fuzzy mathematics has a unique ability to achieve meaningful results while incorporating subjectiveness into mathematical systems, allowing for a scientifically informative decision-making procedure. However, one of the main concerns that must be addressed in all fuzzy decision-making methods is the fact that not all data sets need to be defined using fuzzy logic.
In this study, propose a vector-based sustainability assessment method is used to evaluate the sustainability of a manufacturing facility and a fuzzy decision-making method is introduced to derive strategies (or control actions in this context) for multi-stage sustainability improvement. The methodology separates the data sets into subjective and objective categories and defines membership functions based off subjective preferences and objective historical precedence, eliminating the unnecessary fuzzification of non-fuzzy data. It also uses the ideas of dynamic sustainability (Huang, 2022) to create an iterative method which reevaluates the sustainability improvement trajectory after each stage using the data gathered after implementing the derived strategy for goal achievement. The resulting methodology is both wholistic and robust, directly incorporating stakeholder preferences and historical data while also allowing for flexibility and adjustments in cases where realized results may differ from theoretical calculations. Ultimately, this combination effectively addresses the major concerns with sustainability assessment application in industry.
The rest of this paper will consist of four parts: (1) the proposed multistage sustainability assessment methodology, (2) a step-by-step procedure to clearly explain how it is implemented, (3) a case study on a nickel electroplating facility to prove efficacy, and (4) a discussion on important decisions that need to be made within the methodology itself.
2. Multistage Sustainability Assessment
Consider a multistage sustainability improvement system M that is composed of N stages, where each stage represents a single time step. The result is a discretized system, where the sustainability only increases within each stage. Thus, determining the exiting sustainability of any stage would require determining the effects of any control actions implemented within that stage and the exiting sustainability of the previous stage. And, because sustainability only increases within each stage, the exiting sustainability of the previous stage must be equal to the entering sustainability of the stage under consideration, resulting in the following formulation:
where is the sustainability performance exiting stage k, is the sustainability performance entering stage k, and is the identified control action (i.e., the strategy derived for performance improvement) for stage k.
To evaluate the sustainability of a system at any stage, a TBL-based approach is used. The following set of formulas, which have been shown to be successful in previous studies (e.g., Liu and Huang 2012, 2013; Moradi-Aliabadi and Huang 2016a, b; Siddiqui et al. 2024), were adopted in this study for sustainability assessment.
where E(k), V(k), and L(k) are, respectively, the categorized economic, environmental, social sustainability in stage k; Ej, Vj, and Ll are individual economic, environmental, and social indicators, respectively; are the weighing factors associated with the corresponding economic, environmental, and social sustainability indicator; NE, NV, and NL are the number of selected economic, environmental, and social indicators; are the categorical weighing factors for economic, environmental, and social sustainability; and is the overall sustainability in stage k.
To use the formulas above, each indicator value needs to be normalized based on benchmarking from similar-sized manufacturing facilities to allow for aggregation. This is accomplished using the following equations:
or
where is the normalized indicator value, is the non-normalized indicator value, and are, respectively, the maximum and minimum indicator values. When a higher value translates to better performance, Eq. 5 is used, and when the opposite is true, Eq. 6 is used.
3. Fuzzy Decision-Making
The goal of the fuzzy decision-making methodology within each stage is to determine the best control action (i.e., the strategy for performance improvement) for implementation given the objective sustainability goals, which are based on data and stakeholder preference, the subjective sustainability goals, which are set by stakeholders, and the system constraints, which are inherent to the system itself.
3.1. Problem Formulation
For any multistage sustainability improvement trajectory to be a viable option for implementation, it must satisfy the needs of the system’s sustainability improvement objectives and do so in a manner that gives stable growth. To find the optimal multistage trajectory, an aggregated fuzzy satisfaction and stability score from a set of possible trajectories would need to be maximized. To this end, the following optimization is used to express the overarching decision-making system in this methodology:
and
where is the final fuzzy evaluation of the multistage trajectory, is the fuzzy evaluation of the control action set, is the fuzzy evaluation of the stability of the control action set, and the symbol, *, is an aggregator. The aggregator used here is any operator when appropriate, i.e., the minimum operator (the most conservative) or the maximum operator (the least conservative).
3.2. Hierarchical Decision-Making
The need for evaluating fuzzy satisfaction and stability of the derived decisions in the above formulation can be addressed using a two-layer methodology with N-stages and a multistage coordination. Each stage makes individual decisions for control strategy implementation using fuzzy satisfaction, and the multistage coordination evaluates the stability of the stage-based decisions and determines the optimal trajectory. This two-layer hierarchical methodology can be seen in Figure 1.
Stage-based fuzzy satisfaction. The stage-based analysis layer of the proposed hierarchical methodology allows decision-makers in each stage to evaluate a set of possible control actions to improve the sustainability of the system. Each control action can be divided into objective indicators, subjective indicators, and system constraints, where, for each constraint and indicator, a set of fuzzy membership functions can be identified denoting satisfactory performance. Each set of fuzzy membership functions contains two levels: level one is for the case where there is a limit on satisfaction; a certain point where higher indicator performance stops being satisfactory; and level two is for the case where higher improvement always denotes higher satisfaction. An example set of fuzzy membership functions is shown in Figure 2, the mathematical expressions of which are as follows:
where is the fuzzy evaluation, and a, b, c, and d represent different levels of satisfaction determined by stakeholders. The above examples are trapezoidal fuzzy membership functions; however, other type of fuzzy membership function can be used for this analysis.
The use of fuzzy membership functions for determining satisfaction allows for control strategies to be ranked and more informative decisions to be made as opposed to systems where a single cutoff number is given for performance evaluation. In fact, allowing stakeholders to choose a satisfaction level further adds to this informative method of decision-making, accommodating different types of indicators such as those whose satisfaction does not just increase as the performance gets higher.
The methodology for finding the fuzzy satisfaction of the control strategy in each stage is as follows. First, decision-makers and stakeholders will have to choose a level of satisfaction for each indicator, then the relevant equations, following the examples of Eqs. 10 and 11, should be used to evaluate fuzzy satisfaction. Once these satisfactions are determined, the results of can be aggregated together using the following equations:
where is the overall objective fuzzy evaluation, is the fuzzy evaluation of objective indicator i, is the number of objective indicators, is the overall subjective fuzzy evaluation, is the fuzzy evaluation of subjective indicator i, is the number of subjective indicators, is the overall fuzzy evaluation of the system constraints, is the fuzzy evaluation of system constraint i, is the number of constraints, and is the fuzzy evaluation of the control action in stage k.
Note that choosing the best performing control action in each stage does not guarantee the highest satisfaction across the multistage analysis. Thus, it is recommended that, rather than simply choosing the best control action for each stage, a few possibilities are chosen. Also, due to the temporal nature of the analysis, control actions for subsequent stages must be independently derived. Thus, if multiple candidate control actions are chosen in one stage, then each will be considered a separate possibility, leading to multiple candidate trajectories for implementation across the multistage analysis.
Multistage coordination. The goal of the multistage coordination layer is to evaluate the stability of each candidate trajectory and find the optimal choice. Incorporating stability into the decision-making procedure enables systematic analysis of sustainability improvement trajectories by evaluating how changes in individual indicators influence overall performance. This approach helps ensure that the selected optimal trajectory is cost-effective, avoiding scenarios in which substantial financial investments yield only marginal sustainability gains. To study stability, the change in indicator performance between all stages needs to be determined and evaluated using fuzzy membership functions similar to the function shown in Eq. 11. Here, only the fuzzy membership functions denoting level two type stability are included. This is because stability should only improve with higher sustainability performance. Also, since stability is specifically related to sustainability improvement, system constraints are not considered in its evaluation. Once each indicator effected by the control action is given a stability score, the stability scores can be aggregated using the aggregator of choice. Note that, this aggregation is carried out across the multistage trajectory. The following set of equations reflect this process:
where is the change in objective sustainability from stage k-1 to stage k, is the change in subjective sustainability from stage k-1 to stage k, is the fuzzy evaluation of the change in objective sustainability from stage k-1 to stage k, is the fuzzy evaluation of the change in subjective sustainability from stage k-1 to stage k, is the overall fuzzy evaluation of the sustainability improvement from stage k-1 to stage k, and is the overall fuzzy satisfaction of the sustainability improvement of the whole N stages.
Before using the overarching optimization shown in Eqs. 8 and 9, the final fuzzy satisfaction needs to be evaluated for each trajectory. Thus, the following expression is used to aggregate the fuzzy evaluations of each control action within a trajectory to give one final fuzzy satisfaction score:
where is the overall fuzzy evaluation of the whole N stages (WN).
Using the final stability and fuzzy satisfaction scores of each trajectory, the overarching optimization shown in Eqs. 8 and 9 should be used. The first stage of the resulting optimal trajectory can then be implemented in the system.
Dynamic sustainability. The implementation of long-term planning can lead to discrepancies in predicted outcomes compared to what is realized. This is especially true as more stages are added to the multistage assessment. It is for this reason that an iterative implementation approach is proposed. This approach can be used to counter uncertainty in real time; where a multistage trajectory is proposed, and then the first stage is implemented. Then, the realized sustainability performance is used to create another multistage trajectory to reach the same goal, and the first stage of that trajectory is implemented. This process is repeated until the final sustainability goal is met. Using a system like this allows for real time adjustments which can counter and adapt to uncertainties and discrepancies related to implementation. A graphical representation of this can be seen in Figure 3.
3.3. Optimal Multistage Trajectory Identification Procedure
The equations presented in the formulations above can be integrated into a step-by-step procedure for identifying the optimal control strategy set. This procedure is general and applicable to technical solution identification and process improvement over time. A concise overview of the procedure is presented in Figure 4
Step 1. Define a system scope to be investigated.
Step 2. Select sustainability indicators for each category of the triple bottom line, determine the weighing factors associated with individual indicators, and evaluate the economic, environmental, and social sustainability performance of the system using Eqs. 2 to 7.
Step 3. Analyze the sustainability results to determine if the system performance is satisfactory. If it is satisfactory, go to Step 10; otherwise identify major weaknesses and control actions that can address them.
Step 4. Differentiate between objective and subjective sustainability indicators and determine values pertaining to satisfaction to create fuzzy membership functions like those shown in using Eqs. 10 to 11. Also, determine the minimum multistage goal, such that if the analysis cannot reach this goal, then it will be redone.
Step 5. Evaluate each control action for an individual stage, starting from stage 1, using the preset fuzzy membership functions. This includes identifying the operator to be used throughout the analysis. Using the evaluation results from Eqs. 12 to 15, determine all the candidate control actions of that individual stage. If no control actions are identified, then return to Step 4; else continue.
Step 6. For each candidate control action in an individual stage, remove the identified control action from the set of candidate control actions for the next stage and determine new fuzzy membership functions for each indicator and system constraint. Repeat step 5 for the succeeding stage. Continue this until the minimum multistage goal has been achieved for each candidate trajectory. If the minimum multistage goal cannot be achieved using the available control actions, then return to Step 4.
Step 7. Determine the fuzzy satisfaction and stability of each multistage solution using Eqs. 16 to 20.
Step 8. Use the overarching optimization in Eqs. 8 and 9 to determine the final optimal multistage trajectory.
Step 9. Implement the first step into the system. If the minimum goal is not reached after the first stage, return to Step 2.
Step 10. Generate a report of a complete set of control strategies for different stages, with sustainability performance analysis.
4. Case Study
The technical solution identification procedure presented above was applied to a nickel electroplating facility to show the efficacy of the methodology. The data for this facility is provided in the supplementary information.
4.1. Sustainability Assessment and Technology Identification
A total of 11 indicators were chosen for this study, four economic indicators, four environmental indicators, and three social indicators. Using Eqs. 2 to 5, the sustainability performances for the economic, environmental, and social categories were evaluated to be 0.489, 0.535, and 0.288, respectively. Social sustainability was the clear underperformer. The economic and environmental sustainability performances were also relatively low. Thus, any control strategy, which can improve either of these three categories, is a viable option for implementation and needs to be evaluated further. In terms of specific indicator based analysis, Human Health burden, with a performance of 0, Hazardous waste production, with a performance of 0, and Work Related Re-Education, with a performance of 0.149, were the lowest performing indicators, showing that the facility has problems with toxic chemical use and may need to focus on the implementation of different chemistries or finding methods to lowering the use of chemicals in production.
Based on the above-mentioned weaknesses, as well as the overall weaknesses in the facility, the following five technologies were identified for sustainability improvement. Technology 1 (T1) – A zero chemical discharge technology which reduces drag out by adding a new flow rinsing tank and recycling chemicals (Huang, 2006). Technology 2 (T2) – A new plating system proposing the replacement of boric acid from a watts bath to citric acid (Takuma et al., 2018). Technology 3 (T3) – A cyclic hoist scheduling technology used to lower environmental effects of electroplating (Xu and Huang, 2004). Technology 4 (T4) – A water reuse technology which recycles wastewater while maintaining rinse water quality (Huang, 2002). And technology 5 (T5) – A novel barrel design which significantly reduces drag out from rinsing tanks (Altmayer et al., 2002). The data for each of these technologies along with the original sustainability performance of the facility is provided in Table 1.
4.2. Optimal Multistage Trajectory Determination
Among the 11 indicators used in this study, 8 were identified as objective and 3 were identified as subjective. The values pertaining to the fuzzy satisfaction and stability membership functions for each indicator can be found in Table 2. Alongside the sustainability indicators, two system constraints were included in the assessment: the budget of the facility and timeframe of use. Both of these system constraints and their fuzzy membership functions can also be found in Table 2. The minimum multistage goal of the analysis was chosen to be 0.700, 0.700, and 0.600, for economic, environmental, social, and overall sustainability, respectively.
First Iteration. The fuzzy and stability membership functions were applied to the stage-based analysis in the multistage sustainability assessment, where, in the first stage, the top three performing tech sets were determined to be Tech Sets 6, 9, and 23. Since none of these tech sets met the minimum multistage goal, a second temporal stage was evaluated. In the second stage, each of the Tech Sets from Stage 1 produced three sustainability improvement trajectories, resulting in nine total candidate multistage trajectories. Out of the nine, eight met the sustainability goals of the facility and one required a third stage in which one further tech set was identified for implementation.
Using the stability membership functions, it was found that three of the nine sustainability improvement trajectories had stability scores of 0. The remaining six trajectories showed all had relatively similar stability performances. The highest performing stability was trajectory 5, or the implementation of Tech Set 6 in Stage 1 and Tech Set 15 in Stage 2. The sustainability performances of each candidate multistage trajectory, along with their fuzzy satisfaction and stability scores, are shown in Table 3.
Second Iteration. To simulate the implementation of the results in a real facility, it was assumed that after implementing stage 1 of the optimal multistage trajectory, or Tech Set 6, the realized sustainability of the facility would reach 0.568, 0.788, and 0.577, for economic, environmental and social sustainability, respectively. This is different to the expected sustainability scores calculated in the first iteration of the methodology which were 0.618, 0.860, and 0.631.
Using the assumed realized results as the new starting point of the multistage analysis, five candidate trajectories were determined, two which had one stage and three of which had two stages. After the stability analysis, the optimal multistage trajectory for the second iteration was determined to be a single stage with the implementation of Tech Set 15. Implementing this Tech Set caused the facility to meet the minimum multistage goal. A final sustainability performance of 0.796, 0.927, and 0.652 was calculated for the facility. Figure 5 and Table 4 show the realized effects on the categorical sustainability scores of the facility after implementing the results of this study. Note that the fuzzy satisfaction and stability scores of the trajectories in this study are generally quite low. This is due to the use of the minimum operator, which is meant to find the lowest performance of each stage of each trajectory such that when the optimization is carried out the trajectory that is chosen has the highest minimum performance. This is not reflective of the actual satisfaction and stability of the tech sets as a whole, but rather it is simply for the purposes of decision-making. If another operator was used in this study, these numbers would not be this low.
4.3. Analysis on Production Improvement
The effects of the optimal multistage trajectory identified in this study are broad and include each facet of the triple bottom line. Implementing these results on the facility being studied led to a more efficient process, more profit, less negative effects from waste generation, and much more. Some specific examples of sustainability improvement within the facility are highlighted below.
Fresh Water Usage. Electroplating facilities use large amounts of fresh water for rinsing and cleaning parts before depositing the finishing layer. Lowering the amount of freshwater usage can have far-reaching effects on production, including saving money that would otherwise be used to purchase freshwater, lowering the production of wastewater in the facility, and lowering costs related to wastewater treatment. Before implementing the optimal multistage trajectory, the facility used 950,000 gallons of water per year. After implementing Tech Set 6 in Stage 1, freshwater usage was lowered by more than 171,000 gallons per year, and after implementing Tech Set 15 in Stage 2, freshwater usage was further decreased by about 440,000 gallons. In total, after 5 years of implementation, around 1.65 million gallons of freshwater were saved. A comparison between the freshwater usage of the optimal multistage trajectory and the original facility can be seen in Figure 6(a).
Hazardous waste. Electroplating facilities are known to produce large amounts of hazardous waste. In fact, the elevated levels of hazardous waste production in the electroplating sector have pushed the US EPA to pass many regulations pertaining to waste exiting electroplating facilities. In the facility being studied, before implementing the optimal multistage trajectory, hazardous waste was produced at a rate equal to the worst performance from the electroplating facilities chosen for benchmarking. After implementing the trajectory, this performance improved significantly with a reduction of more than 184,000 lb of hazardous waste over the 5 year period. This translates to an average of 36,800 lb of hazardous waste saved per year, or a 70 percent reduction. Figure 6(b) visualizes the effect on hazardous waste production within the facility by showing the data of the facility before and after the implementation of the optimal multistage trajectory.
Electricity Usage. The main purpose of an electroplating facility is to use electricity to deposit a finishing layer on to a part, whether this is to boost performance, durability, or to simply make the final product more aesthetically pleasing. To do this, a significant amount of electricity is needed in production and lowering this electricity usage can save the facility a lot of money. Before the implementation of the optimal multistage trajectory, the facility being studied used 190,000 kWh per year of electricity. Using a cost of 8 cents per kWh, this amounts to $15,200 spent on electricity per year. After implementing the optimal multistage trajectory, the total amount saved on electricity over a total of 5 years was a little more than $9,500, or, on average, around $2,000 per year. A visual summary of this improvement can be seen in Figure 6(c).
Profitability.Many industrial decision-makers focus heavily on profitability as a measure of strength for control actions. To measure the effect on profitability in this study, the value added indicator was used. However, measuring value added, while good for measuring change in profit, is ineffective at measuring profitability relative to overall sustainability performance. Thus, the value added indicator was normalized based overall sustainability performance, giving additional insight into how improving sustainability over the course of the multistage affects the profitability of the facility as a whole. In stage 1, the improvement of profitability per unit sustainability was 0.12 and in stage 2 it was 0.54. Profitability improvement in stage 1 was low compared to sustainability improvement; however, it still showed positive change. Tech Set 6, which was implemented in stage 1, clearly focused more on improving environmental and social sustainability performance while not causing detrimental effects to the economics of the facility. Tech Set 15, on the other hand, improved profitability by almost half as much as overall sustainability. When looking at the actual money involved, over the course of 5 years, the facility gained approximately $160,000 in added profit. The breakdown of profit per year can be seen in Figure 7.
5. Discussion
The proposed evaluation methodology is a comprehensive and systematic decision-making design which considers large amounts of uncertainty. However, the fuzzy evaluation of the multistage optimal control set is meant to be interpreted as a decision-making tool, not as a detailed evaluation of the performance of technology. For this purpose, the minimum operator, which uses the lowest performing indicator as the evaluation of control actions, was chosen. The idea being that maximizing the lowest possible satisfaction should result in the best control action for implementation. For detailed analysis on the application of control strategies beyond simply decision-making, sustainability evaluations should be used. Hence why, in the analysis, alongside fuzzy membership functions denoting satisfaction, there is a minimum multistage sustainability goal such that if that goal is not met, the analysis cannot be concluded. And if no control action can meet this goal, then the goal either needs to be changed or new control actions need to be identified. In this sense, fuzzy mathematics and fuzzy logic have been used here as a tool for decision-making and not for any deeper understanding of sustainability or aggregation. In this regard, there are two major factors that need to be considered when making fuzzy membership functions due to their effects on the assessment: the lack of standardization and membership function type.
Lack of standardization is a feature of fuzzy mathematics. Among fuzzy mathematicians, the opinions regarding constraints from one professional are not considered any better than the opinions of another professional. Thus, it is expected that different decision-makers will have differing opinions regarding the determination of fuzzy membership functions. This makes the determination of membership functions for the assessment a somewhat arbitrary process built solely on the expertise and preference of those carrying out the assessment. This is also the case when choosing membership function type. There are many different types of fuzzy membership functions, ranging from trapezoidal to triangular to gaussian. It is ultimately the choice of decision-makers, which will determine which membership functions will be used in the assessment. However, even with this level of variability, the proposed methodology is designed in such a manner that the resulting solution will be the optimal multistage trajectory for whatever choices are made.
6. Concluding Remarks
Multistage sustainability assessment has been proposed in previous studies as an effective method for applying sustainability decision-making to long-term planning in industrial settings. However, the lack of a systematic and scientifically informative method for determining optimal control actions is evident in the field. To address this deficiency, a fuzzy decision-making methodology for dynamic sustainability was proposed. This methodology makes use of an iterative system which re-evaluates the sustainability improvement trajectory after the implementation of each step and fuzzy membership functions which incorporate both human intelligence and data, allowing for decision-makers to use stakeholder input and historical data to determine the optimal control actions for implementation and then adjust and redo the assessment after implementing the results.
The application of this proposed methodology to a nickel electroplating facility showed that the optimal multistage trajectory lowered freshwater usage within the facility by a total of 1.65 million gallons over the course of 5 years, lowered hazardous waste by an average of 36,800 lb per year, saved $2,000 per year on electricity costs, and added $160,000 in profit. All of this was achieved alongside other improvements to areas such as community complaints and increases in profit margins, showing that the methodology proposed in this study is effective at solution identification while also being scientifically informative. Future work in this area will include the implementation and development of multistage sustainability methodologies for different types of stages such as spatial stages within production facilities and different scales within the system being studied.
Author Contributions
Y-H contributed to conceptualization; Y-H and A-S provided methodology; A-S collected data; A-S carried out calculations; Y-H and A-S performed writing, review and editing; Y-H performed overall project supervision and funding acquisition; All authors have read and agreed to the published version of the manuscript.
Ethical Approval
In this specific research project, it does not apply since it is not considered that there are ethical conflicts.
Consent to Participate
All authors consent to participate in the research project.
Consent for Publication
All authors consent to publish the article in question.
Data Availability
All data used is presented in the manuscript or appendix.
Acknowledgments
This work is supported in part by U.S. National Science Foundation (Award No. 2031385) and American Electroplaters and Surface Finishers Foundation (Award No. R-121).
Conflicts of Interest
The authors declare no conflict of interest.
References
- Al-Sharrah, G; Elkamel, A; Almanssoor, A. Sustainability indicators for decision-making and optimisation in the process industry: The case of the petrochemical industry. Chem. Eng. Sci. 2010, 65, 1452–1461. [Google Scholar] [CrossRef]
- Altmayer, F; Zak, J; Wasag, K; Cavanaugh, B. The Effect of Barrel Design on Drag-out. Plating & Surf. Finish. 2002, 89, 32–37. [Google Scholar]
- Begic, F; Afgan, NH. Sustainability assessment tool for the decision making in selection of energy system—Bosnian case. Energy 2007, 32, 1979–1985. [Google Scholar] [CrossRef]
- Cai, W; Lai, KH. Sustainability assessment of mechanical manufacturing systems in the industrial sector. Renew. Sust. Energ. Rev. 2021, 135, 110169. [Google Scholar] [CrossRef]
- Calabrese, A; Costa, R; Levialdi, N; Menichini, T. Integrating sustainability into strategic decision-making: A fuzzy AHP method for the selection of relevant sustainability issues. Technol Forecast Soc Change 2018, 139, 155–168. [Google Scholar] [CrossRef]
- Huang, Y. Toward dynamic sustainability assessment in the digital age. Clean Techn Environ Policy 2022, 24, 2655–2657. [Google Scholar] [CrossRef]
- Huang, Y. Demonstration of a chemical-metal zero discharge technology in electroplating processes: report on data analysis and system design. In Michigan Department of Environmental Quality; 2006. [Google Scholar]
- Huang, YL; Lou, HH; Gong, JP; Edgar, TF. Fuzzy Model Predictive Control. IEEE Trans. Fuzzy Syst. 2000, 8(6), 665–678. [Google Scholar] [CrossRef]
- Huang, Y. Novel source wastewater reduction in electroplating plants. In Michigan Department of Environmental Quality; 2002. [Google Scholar]
- Khishtandar, S; Zandieh, M; Dorri, B. A multi criteria decision making framework for sustainability assessment of bioenergy production technologies with hesitant fuzzy linguistic term sets: The case of Iran. Renew. Sust. Energ. Rev. 2017, 77, 1130–1145. [Google Scholar] [CrossRef]
- Liu, Z; Huang, Y. Technology evaluation and decision making for sustainability enhancement of industrial systems under uncertainty. AIChE 2012, 58(6), 1841–1852. [Google Scholar] [CrossRef]
- Liu, Z; Huang, Y. Sustainable distributed biodiesel manufacturing under uncertainty: An interval-parameter-programming-based approach. Chem. Eng. Sci. 2013, 93, 429–444. [Google Scholar] [CrossRef]
- Liew, W.H.; Hassim, M.H.; Ng, D.K.S. Sustainability assessment for biodiesel production via fuzzy optimisation during research and development (R&D) stage. Clean Techn Environ Policy 2014, 16, 1431–1444. [Google Scholar]
- Moradi-Aliabadi, M.; Huang, Y. Multistage Optimization for Chemical Process Sustainability Enhancement under Uncertainty. ACS Sustain. Chem. Eng. 2016, 4, 6133−6143. [Google Scholar] [CrossRef]
- Moradi-Aliabadi, M.; Huang, Y. Vector-Based Sustainability Analytics: A Methodological Study on System Transition toward Sustainability. Ind. Eng. Chem. Res. 2016, 55, 3239−3252. [Google Scholar]
- NCMS (National Center for Manufacturing Sciences). No. 0076RE00; Benchmarking metal finishing. Ann Arbor, MI, 2000.
- Piluso, C; Huang, J; Liu, Z; Huang, Y. Sustainability Assessment of Industrial Systems under Uncertainty: A Fuzzy Logic Based Approach to Short-Term to Midterm Predictions. Ind. Eng. Chem. Res. 2010, 49, 8633–8643. [Google Scholar] [CrossRef]
- Ren, J; Fedele, A; Mason, M; Manzardo, A; Scipioni, A. Fuzzy multi-actor multi-criteria decision making for sustainability assessment of biomass-based technologies for hydrogen production. Int. J. Hydrog. Energy 2013, 38, 9111–9120. [Google Scholar] [CrossRef]
- Siddiqui, A; Potoff, R; Huang, Y. Sustainability metrics and technical solution derivation for performance improvement of electroplating facilities. Clean Technol. Environ. Policy 2024, 26, 1825–1842. [Google Scholar] [CrossRef]
- Sitorus, F; Brito-Parada, PR. A multiple criteria decision making method to weight the sustainability criteria of renewable energy technologies under uncertainty. Renew. Sust. Energ. Rev. 2020, 127, 109891. [Google Scholar] [CrossRef]
- Takuma, Y; Sugimori, H; Ando, E; Mizumoto, K; Tahara, K. Comparison of the environmental impact of the conventional nickel electroplating and the new nickel electroplating. Int J Life Cycle Assess 2018, 23, 1609–1623. [Google Scholar] [CrossRef]
- Xu, Q; Huang, Y. Graph-assisted cyclic hoist scheduling for environmentally benign electroplating. Ind. Eng. Chem. Res. 2004, 43, 8307–8316. [Google Scholar] [CrossRef]
Figure 1.
Multistage sustainability assessment design with stage-based evaluation layers and multistage coordination.
Figure 1.
Multistage sustainability assessment design with stage-based evaluation layers and multistage coordination.
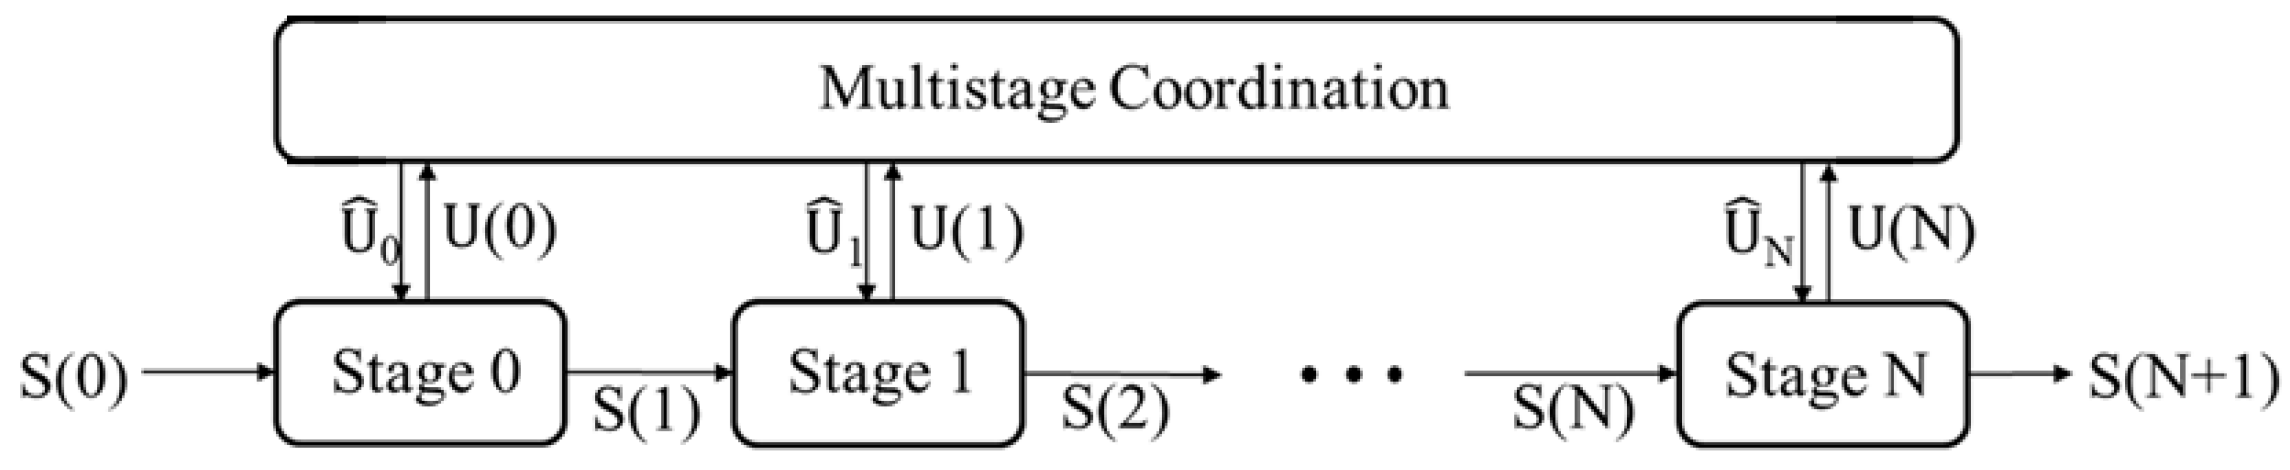
Figure 2.
General trapezoidal fuzzy membership functions for fuzzy satisfaction and stability.
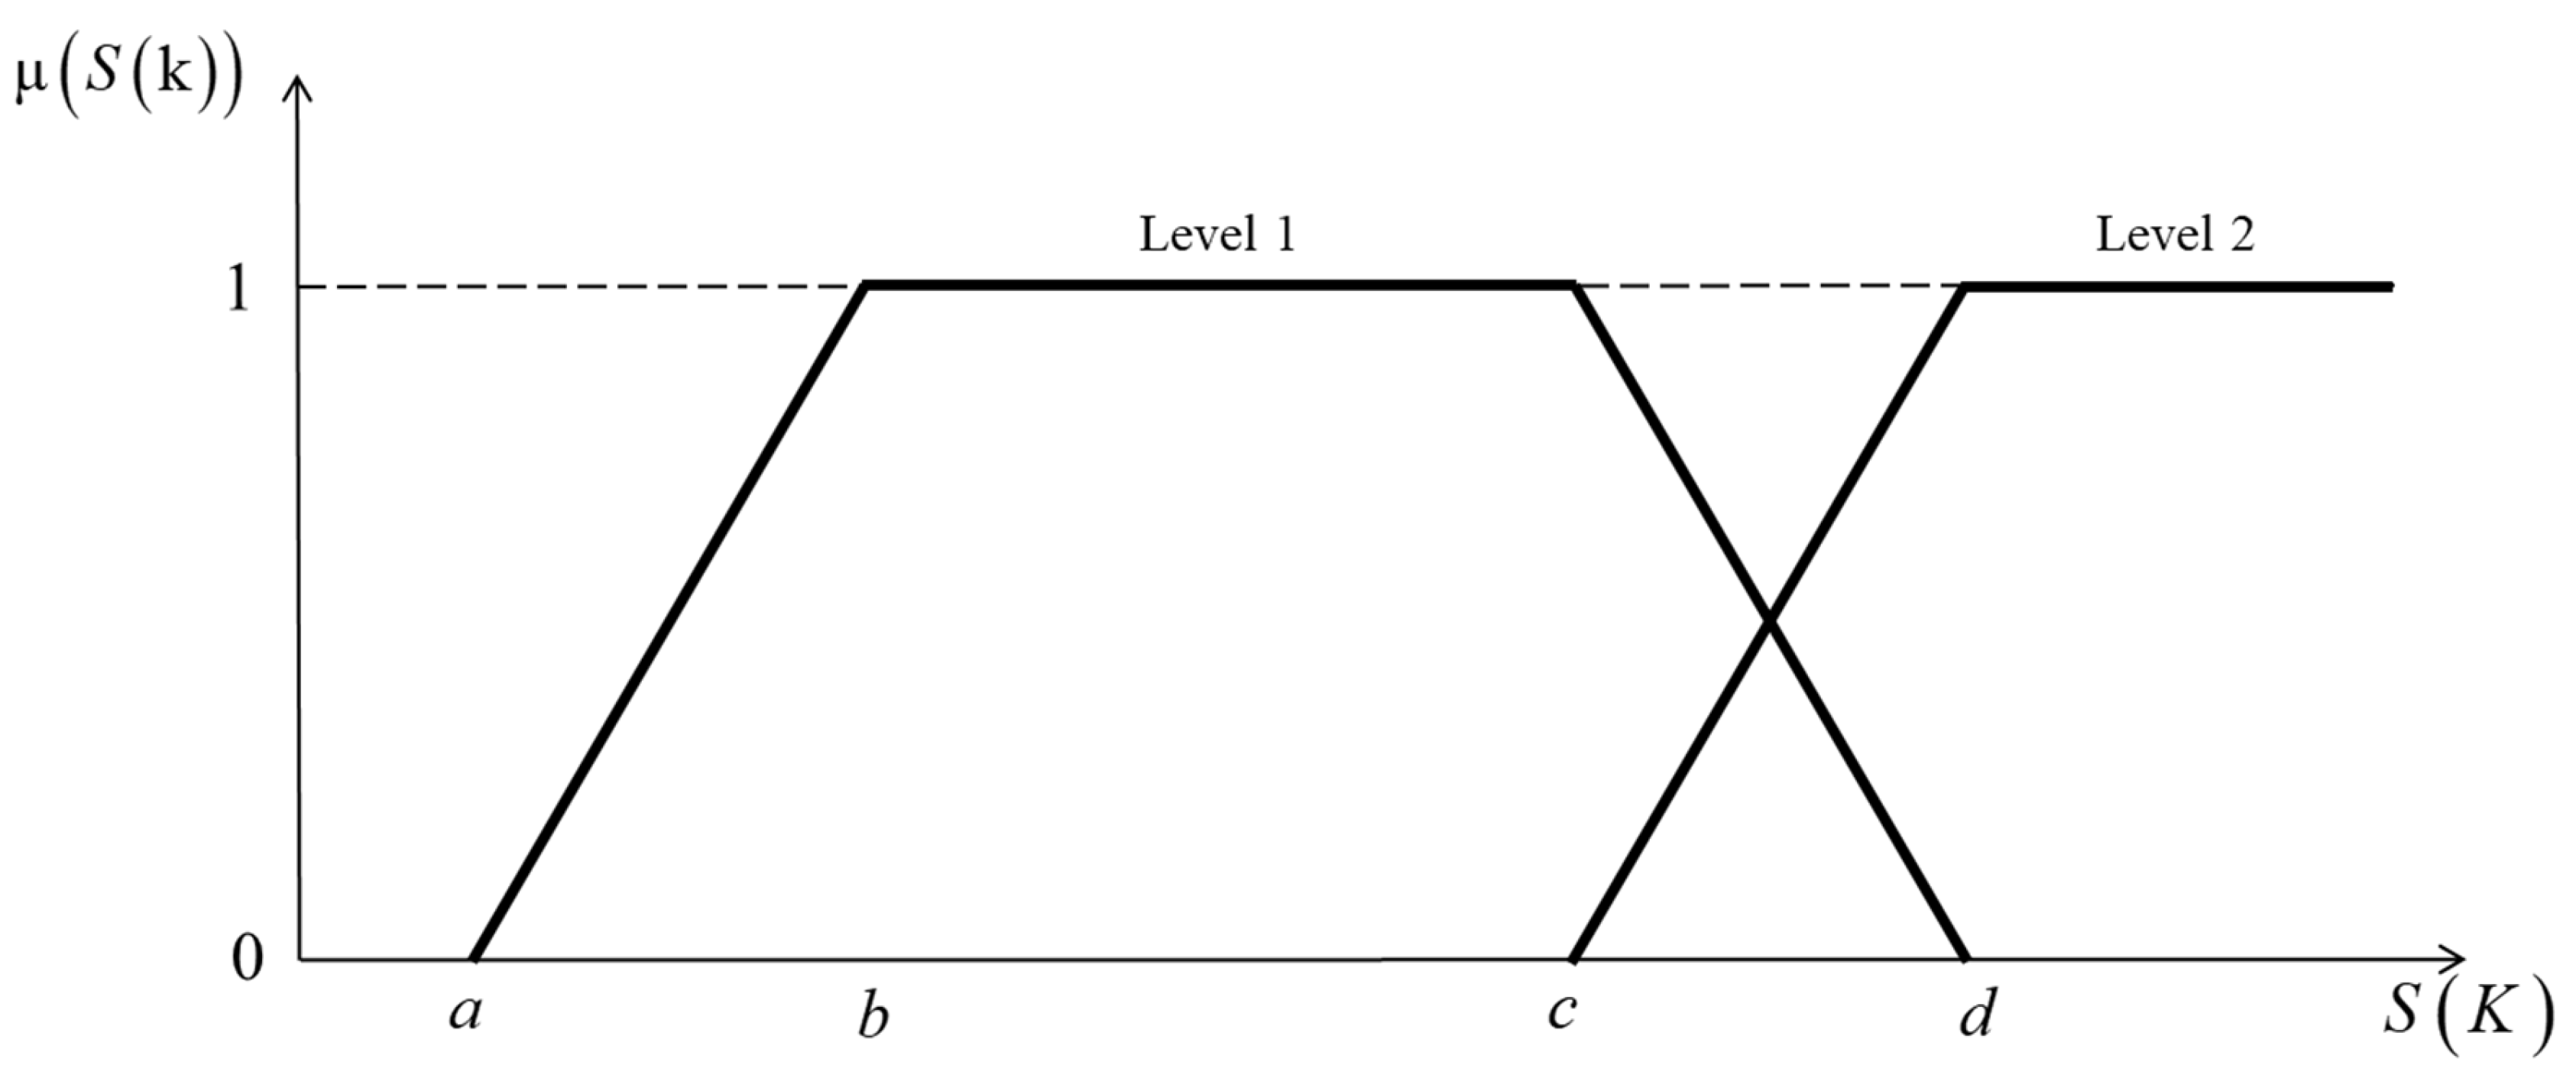
Figure 3.
Illustration of an iterative method for dynamic sustainability with identified optimal trajectories and real-world implementation in stages.
Figure 3.
Illustration of an iterative method for dynamic sustainability with identified optimal trajectories and real-world implementation in stages.
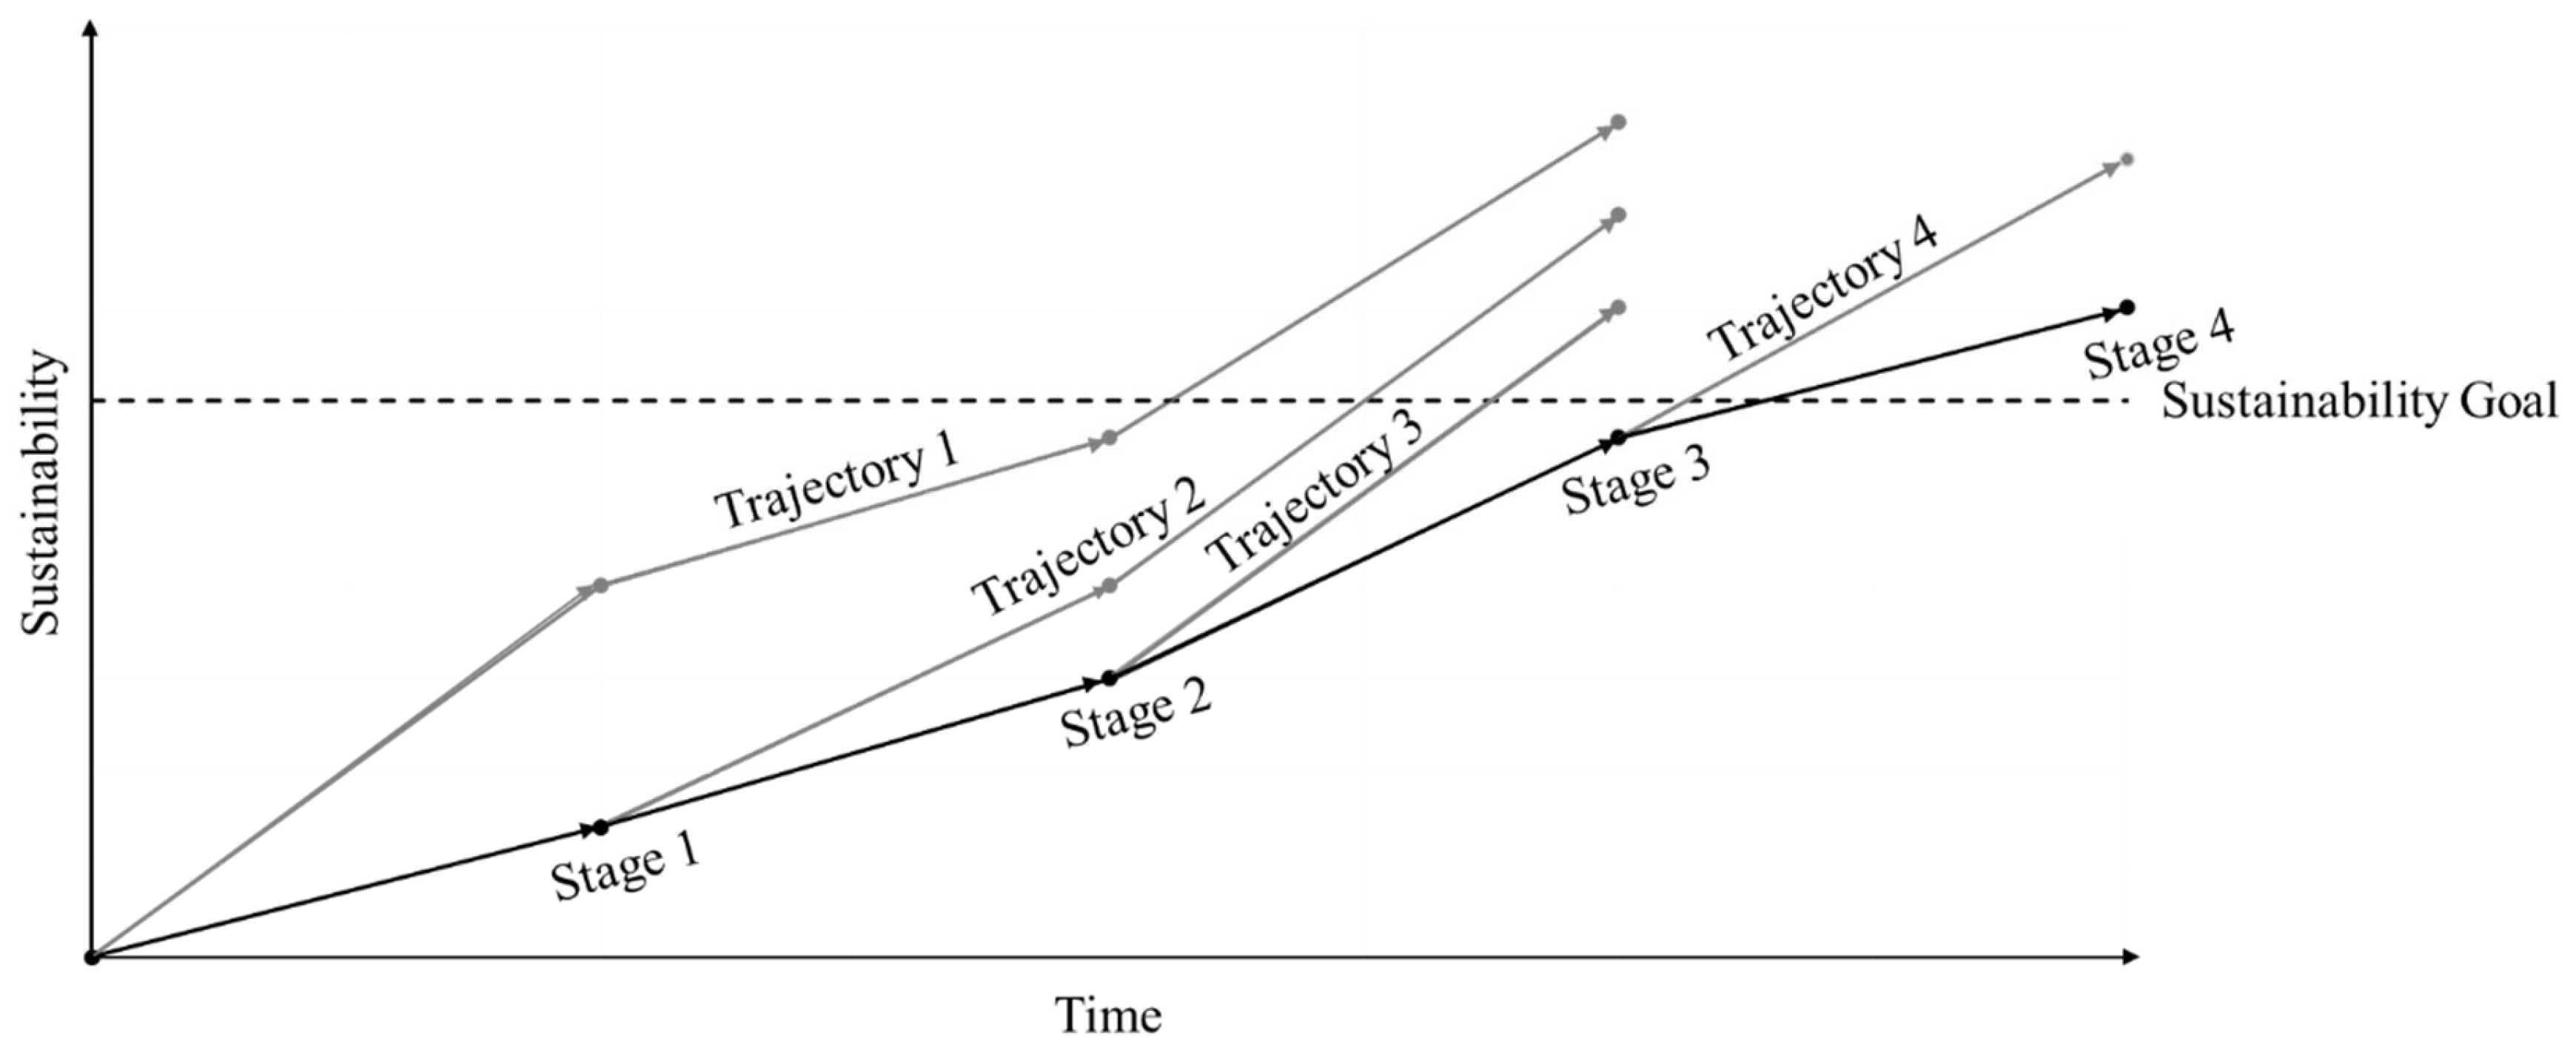
Figure 4.
Step-by-step procedure for MPC-inspired fuzzy decision-making of multistage industrial systems.
Figure 4.
Step-by-step procedure for MPC-inspired fuzzy decision-making of multistage industrial systems.
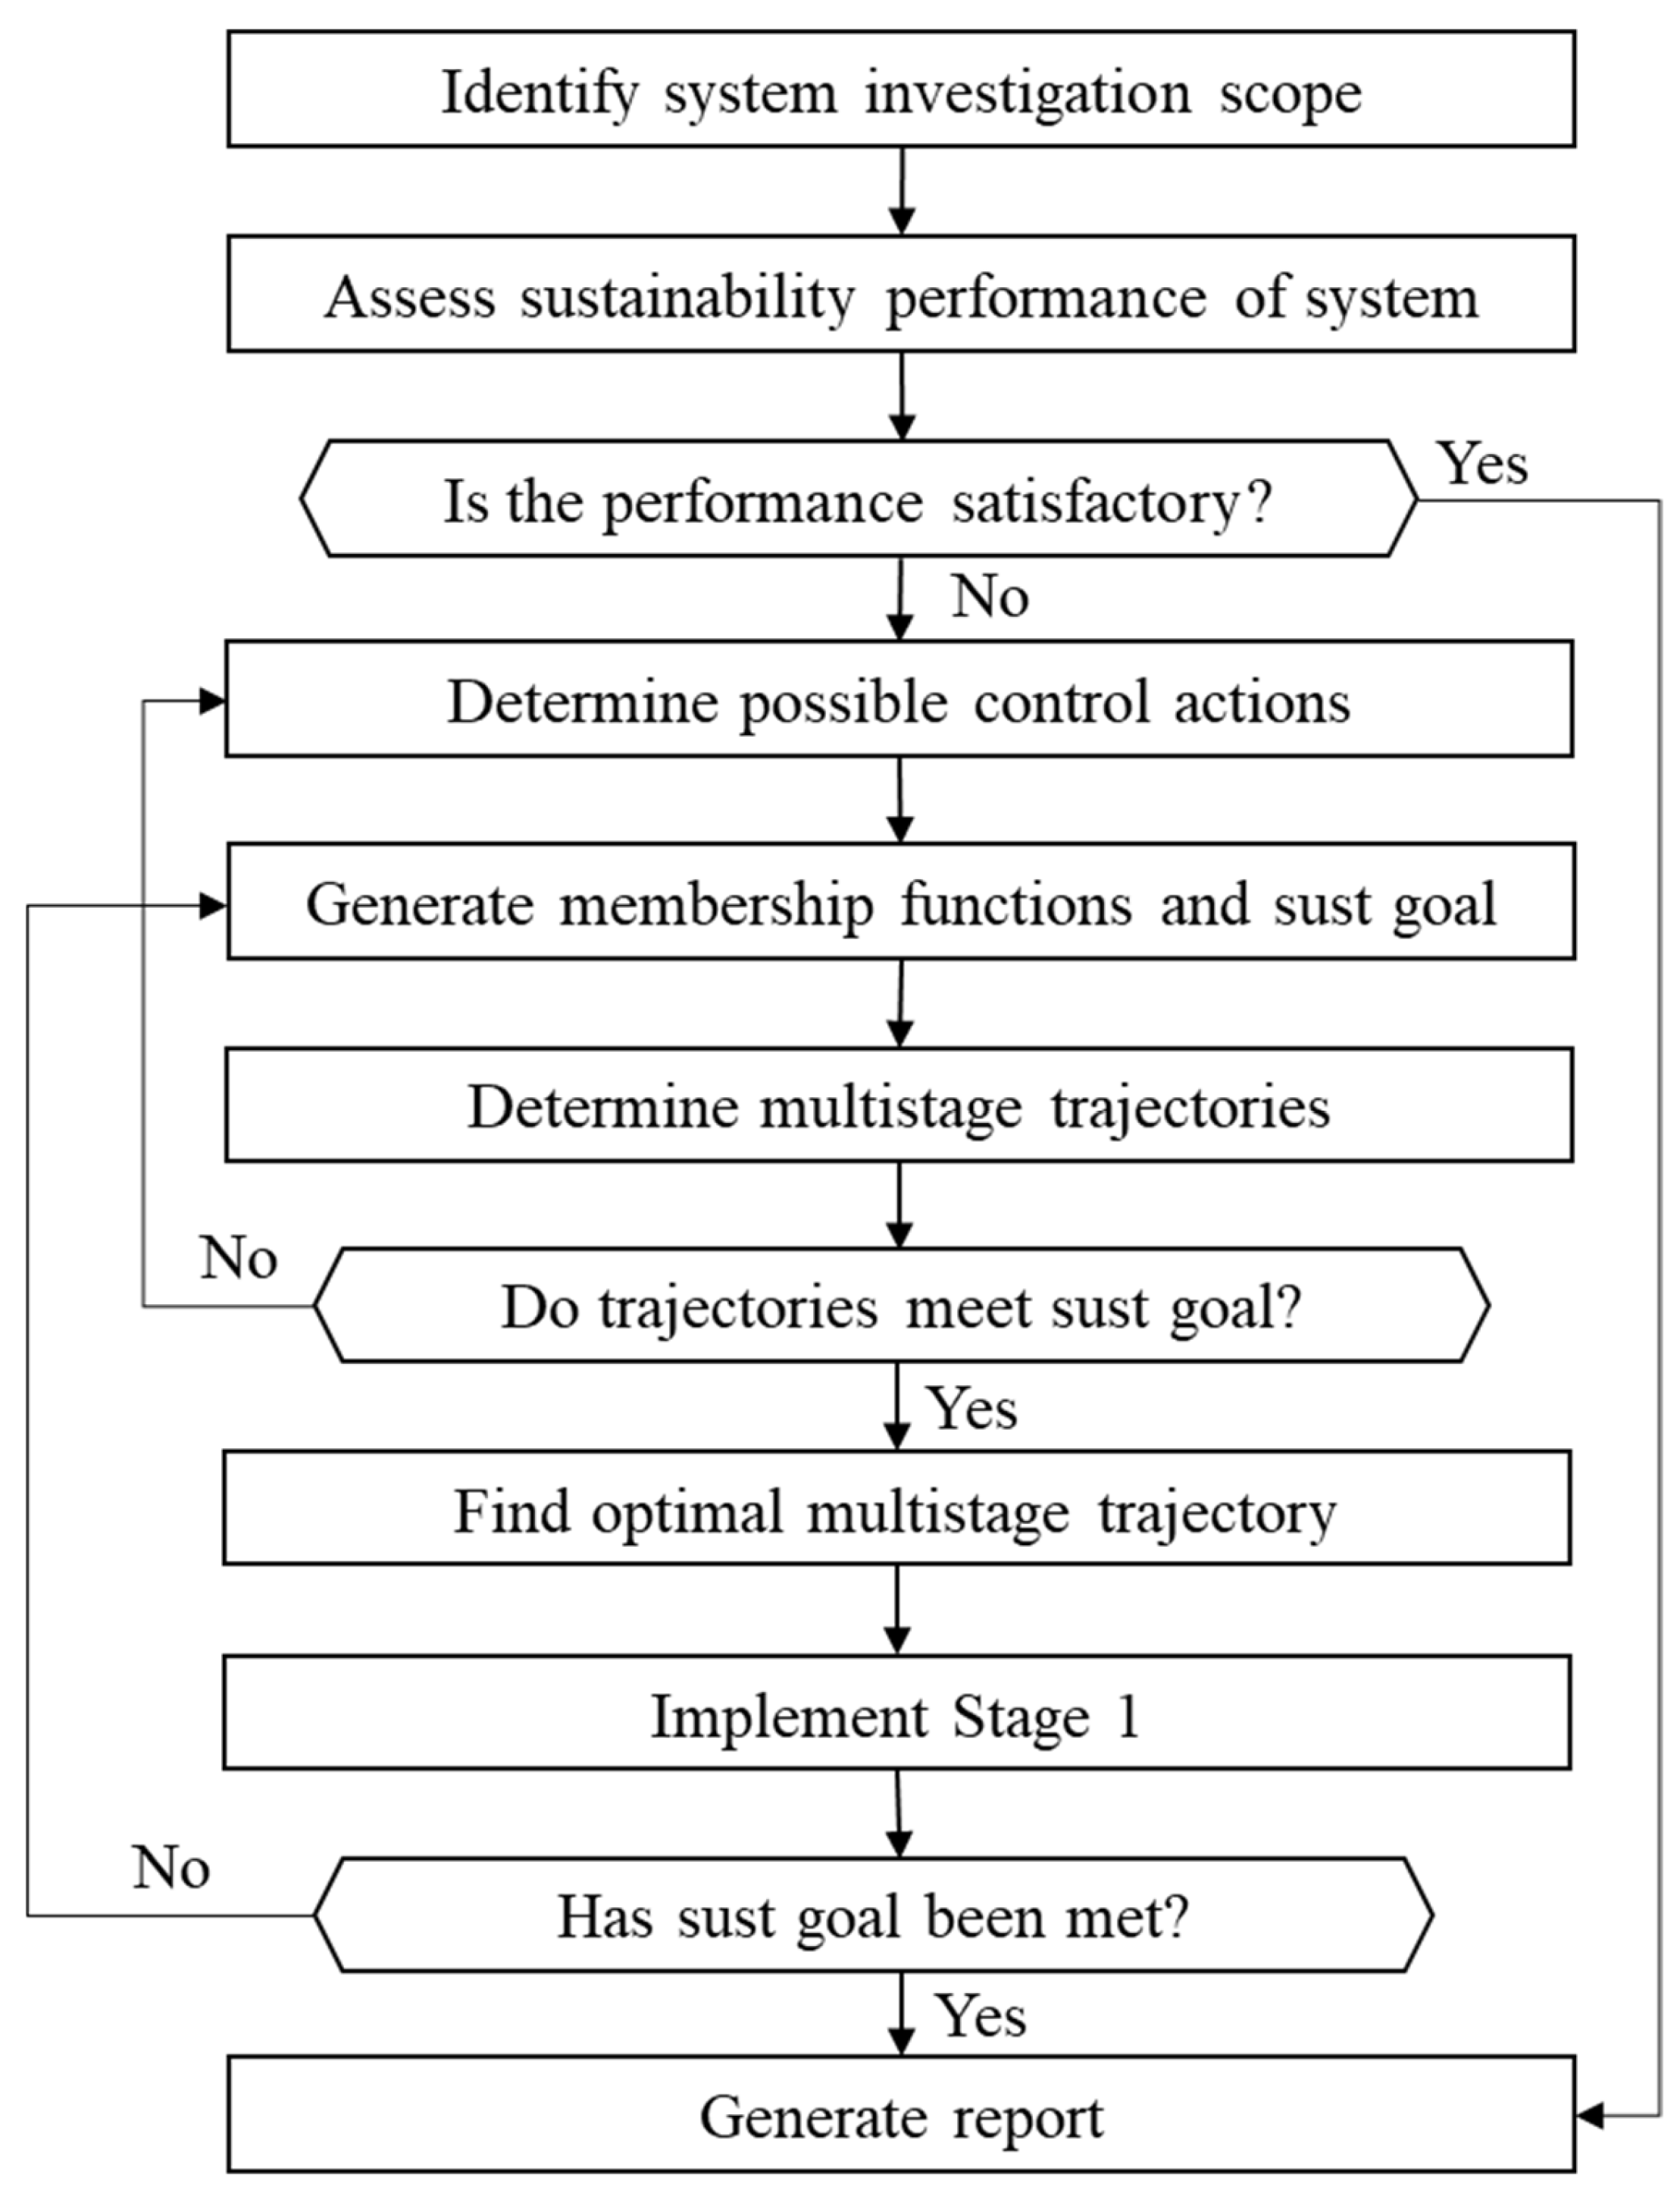
Figure 5.
Categorical sustainability performance improvement after implementation of the optimal multistage trajectory.
Figure 5.
Categorical sustainability performance improvement after implementation of the optimal multistage trajectory.
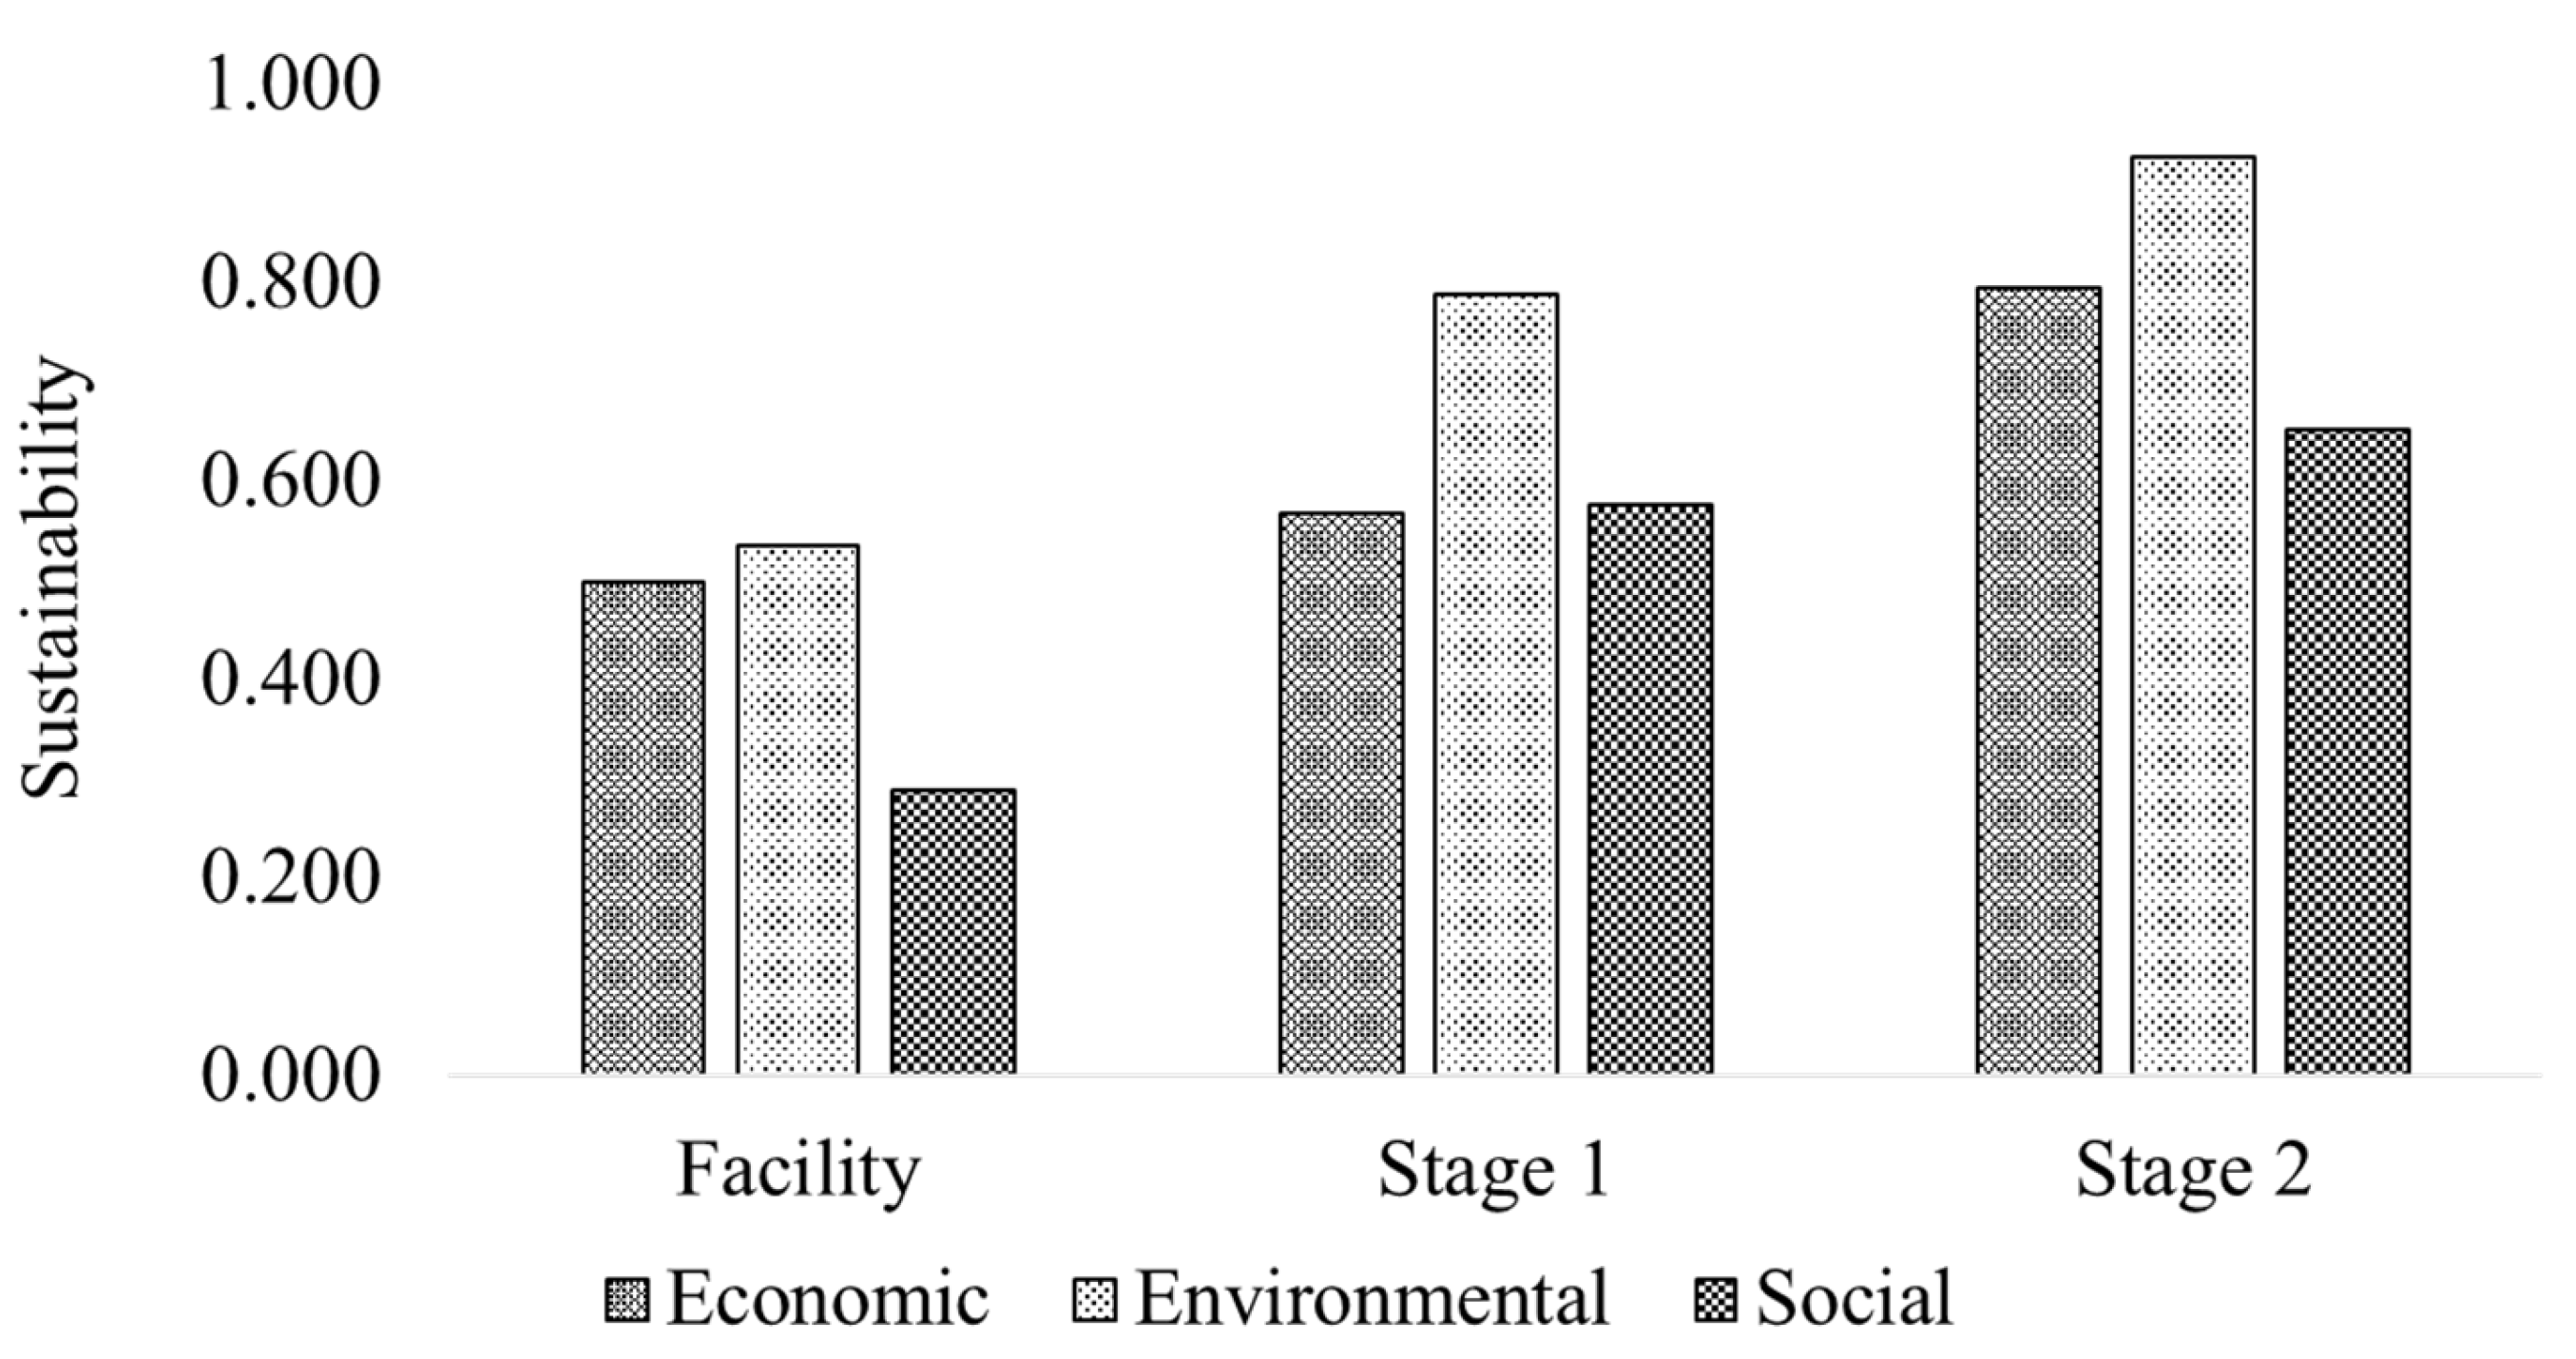
Figure 6.
Comparison between the facility with and without implementation of the optimal multistage trajectory for (a) freshwater usage, (b) hazardous waste production, and (d) electricity usage.
Figure 6.
Comparison between the facility with and without implementation of the optimal multistage trajectory for (a) freshwater usage, (b) hazardous waste production, and (d) electricity usage.
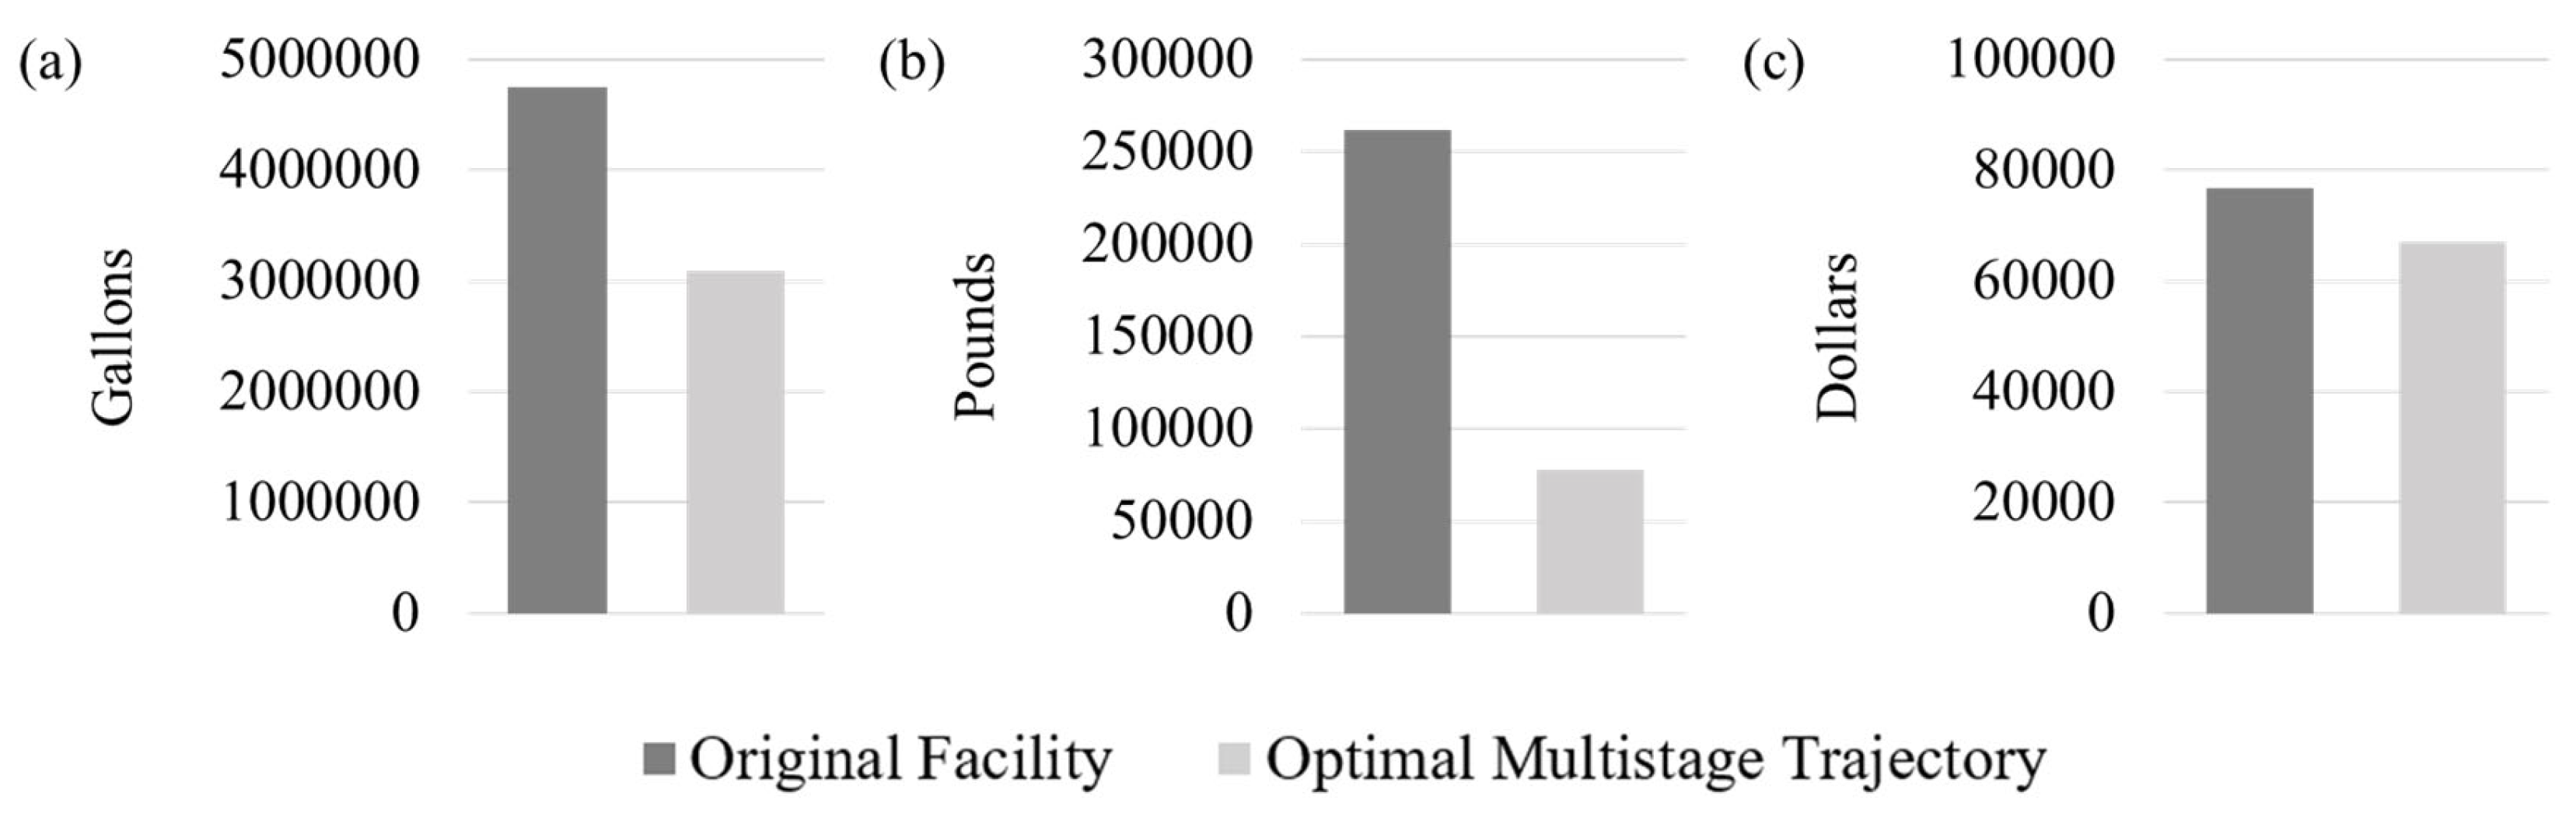
Figure 7.
Five-year profit comparison between the original facility and he facility after implementing the optimal multistage trajectory.
Figure 7.
Five-year profit comparison between the original facility and he facility after implementing the optimal multistage trajectory.
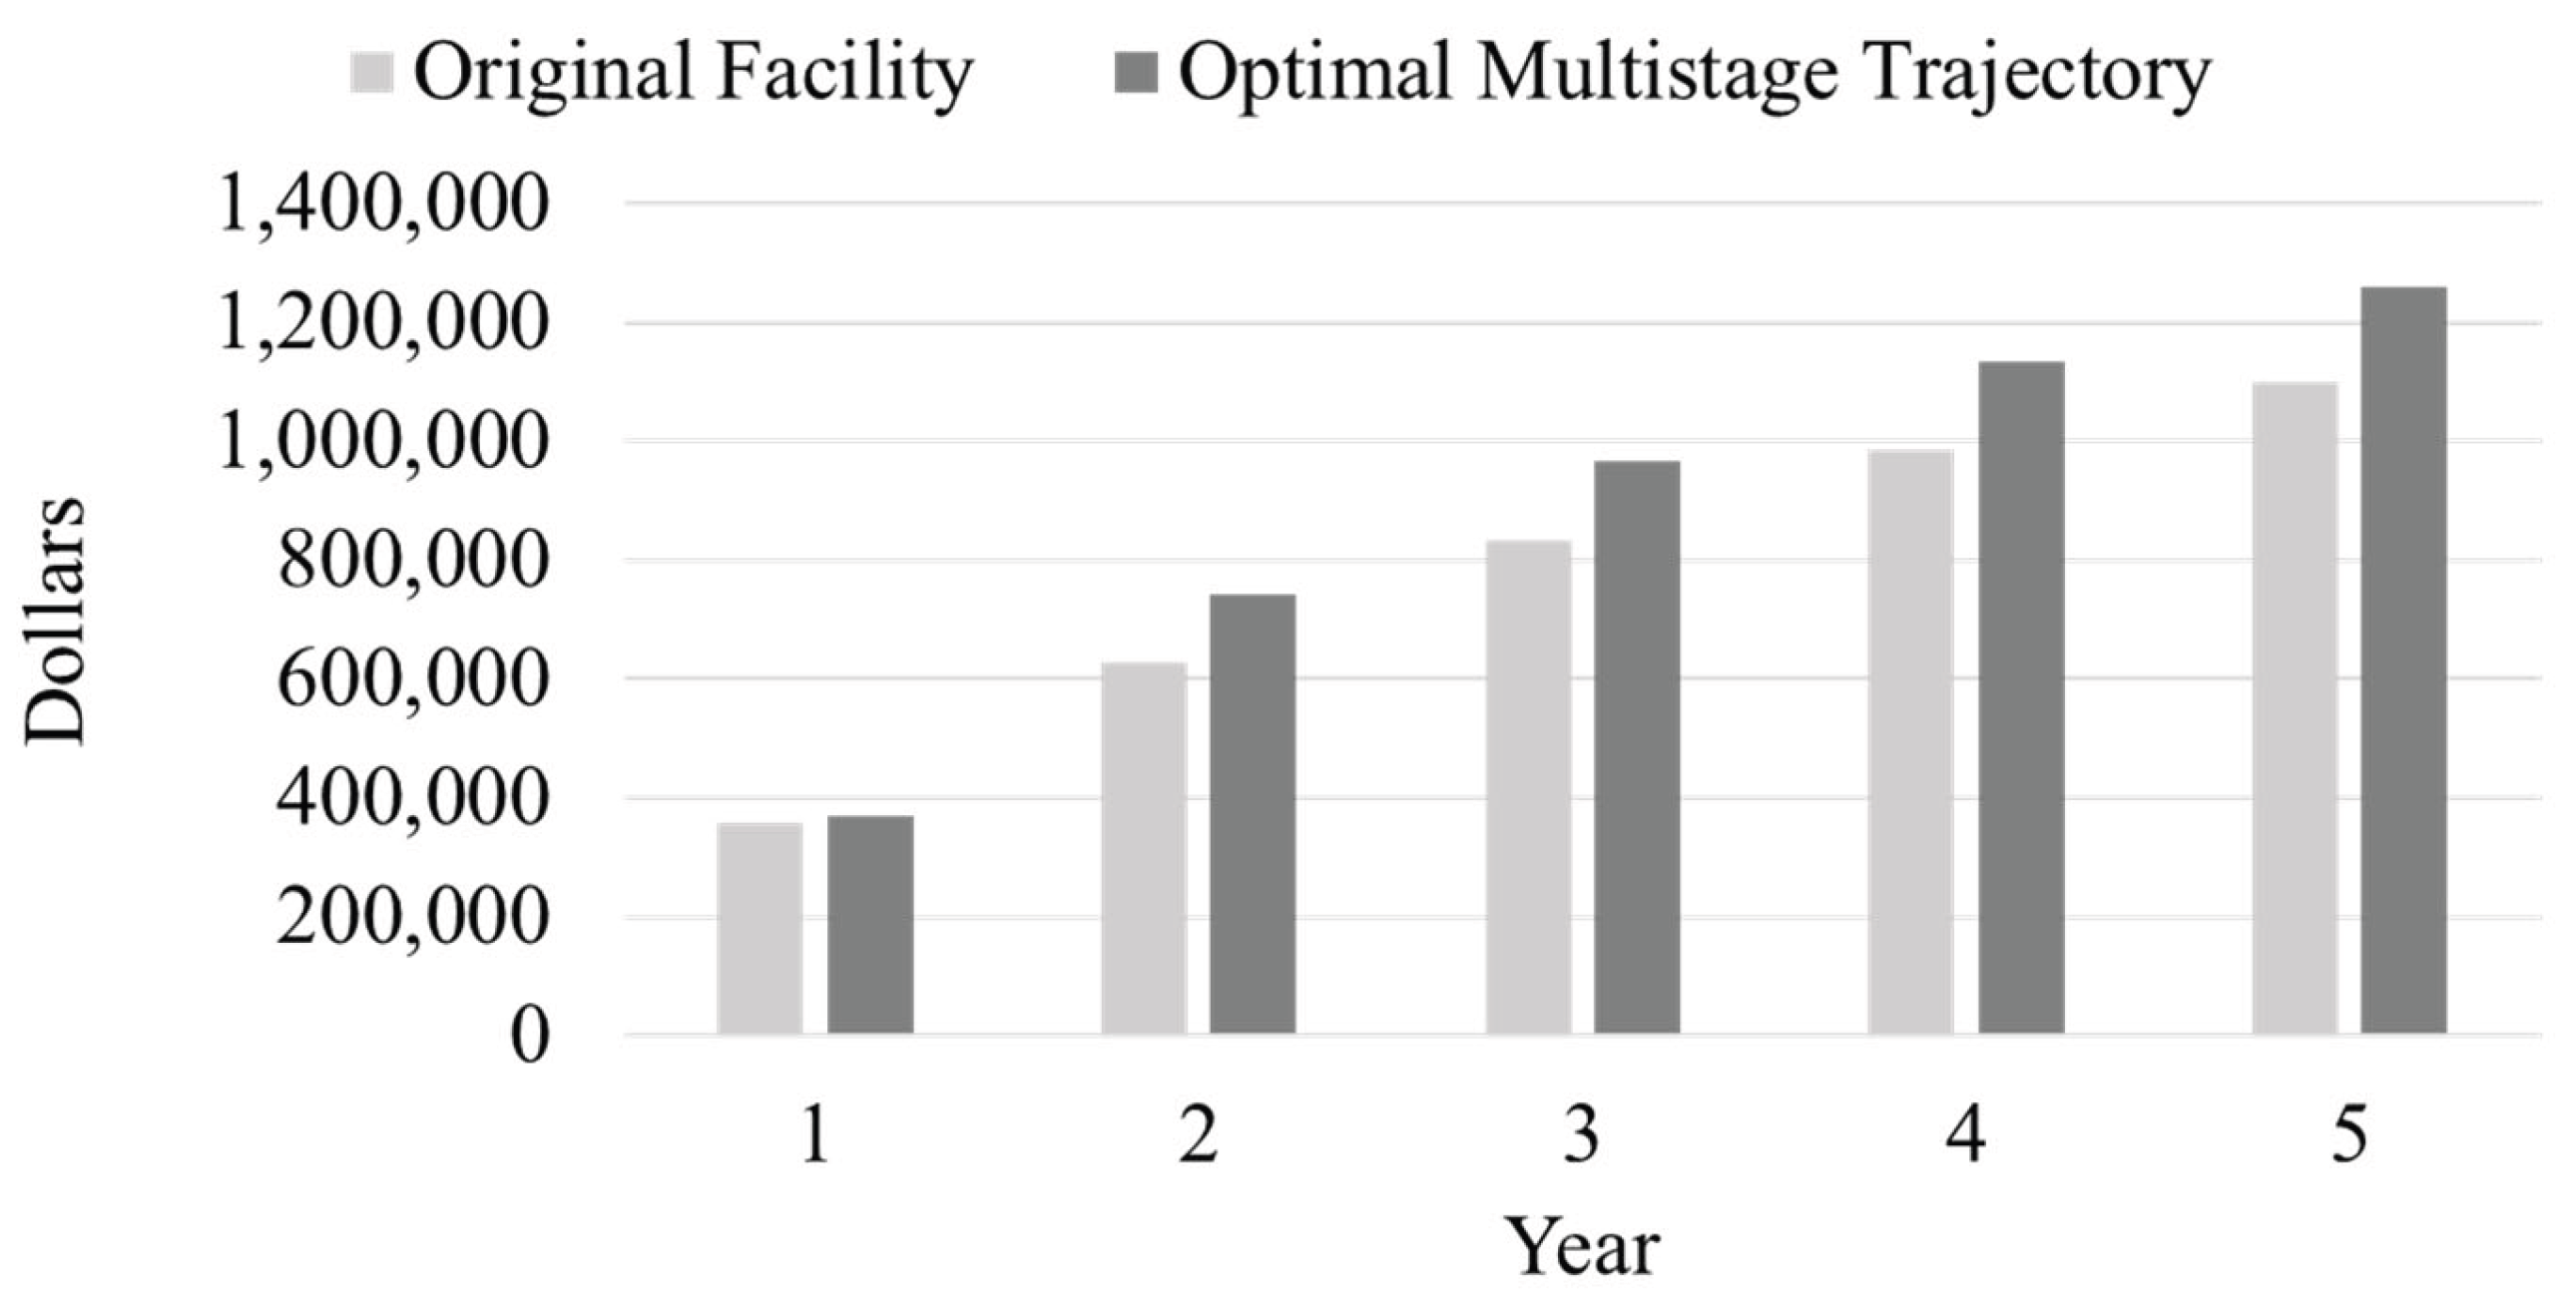

Table 1.
Sustainability Performance and Technology Data for Nickle Electroplating Facility.
| Indicator | Symbol | Facility | Overall | ∆T1 | ∆T2 | ∆T3 | ∆T4 | ∆T5 |
| Value added ($/y) | E1 | 0.645 | 0.420 | 0.020 | 0.008 | 0.029 | 0.063 | 0.017 |
| Net profit margin (%/$) | E2 | 0.250 | 0.130 | 0.026 | 0.225 | 0.284 | 0.219 | |
| Return on average capital employed (%/y) | E3 | 0.627 | 0.075 | 0.074 | 0.073 | 0.075 | 0.072 | |
| Investment on new technology ($/y) | E4 | 0.468 | 0.084 | 0.064 | 0.078 | 0.125 | 0.058 | |
| Fresh Water Use in Production per Value Added (gal/$) | V1 | 0.754 | 0.336 | 0.104 | 0.075 | 0.052 | 0.154 | 0.000 |
| Wastewater generated in production per value added (lb/s) | V2 | 0.576 | 0.141 | 0.134 | 0.072 | 0.210 | 0.256 | |
| Hazardous waste generated per value added (lb/$) | V3 | 0.000 | 0.609 | 0.057 | 0.000 | 0.000 | 0.208 | |
| Electricity usage per value added (kWh/$) | V4 | 0.811 | 0.016 | 0.166 | -0.045 | 0.000 | 0.000 | |
| Work related re-education and/or training (%) | L1 | 0.149 | 0.333 | 0.064 | 0.149 | 0.213 | 0.000 | 0.000 |
| Number of complaints from local community ( /y) | L2 | 0.717 | 0.000 | 0.024 | 0.000 | 0.000 | 0.055 | |
| Human health burden per Value Added (/$) | L3 | 0.000 | 0.591 | 0.200 | 0.000 | 0.000 | 0.172 | |
| Cost ($) | C | - | - | 2900 | 2200 | 2700 | 4292 | 2000 |
| Timeframe of use (months) | T | - | - | 14.5 | 11 | 13.5 | 21.5 | 10 |
Table 2.
Membership Functions and Sustainability Goal for Analysis.
| Category | Symbol | Indicator Type | Chosen Satisfaction | Minimum Sustainability Goal | Satisfaction Membership Functions | Stability Membership Functions | ||||
| A | B | C | D | A | B | |||||
| Economic (E) | E1 | Objective | Complete | 0.7 | 0.530 | 0.580 | 0.630 | 0.800 | 0.000 | 0.100 |
| E2 | Objective | Complete | 0.100 | 0.150 | 0.200 | 0.400 | 0.000 | 0.100 | ||
| E3 | Objective | Complete | 0.350 | 0.450 | 0.600 | 0.750 | 0.000 | 0.100 | ||
| E4 | Subjective | Complete | 0.250 | 0.300 | 0.400 | 0.600 | 0.000 | 0.100 | ||
| Environmental (V) | V1 | Objective | Complete | 0.7 | 0.400 | 0.500 | 0.700 | 0.900 | 0.000 | 0.100 |
| V2 | Objective | Complete | 0.250 | 0.500 | 0.550 | 0.700 | 0.000 | 0.100 | ||
| V3 | Objective | Complete | 0.000 | 0.050 | 0.200 | 0.400 | 0.000 | 0.100 | ||
| V4 | Objective | Complete | 0.500 | 0.550 | 0.800 | 0.900 | 0.000 | 0.100 | ||
| Social (L) | L1 | Subjective | Complete | 0.6 | 0.000 | 0.050 | 0.130 | 0.300 | 0.000 | 0.100 |
| L2 | Subjective | Complete | 0.300 | 0.400 | 0.700 | 0.800 | 0.000 | 0.100 | ||
| L3 | Objective | Complete | 0.000 | 0.050 | 0.100 | 0.300 | 0.000 | 0.100 | ||
| Cost | C | - | Moderate | - | 0 | 2500 | 5000 | 7500 | - | - |
| Timeframe of use | T | - | Moderate | - | 5 | 10 | 40 | 50 | - | - |
Table 3.
Candidate Multistage Trajectories of the First Iteration.
| Trajectory | Stages | Tech Sets | Satisfaction | Stability |
| 1 | 2 | {T1T5},{T2T3} | 0.307 | 0.158 |
| 2 | 2 | {T1T5},{T4} | 0.307 | 0.158 |
| 3 | 2 | {T1T5},{T3} | 0.307 | 0.000 |
| 4 | 2 | {T1T2},{T3T5} | 0.255 | 0.000 |
| 5 | 2 | {T1T2},{T4T5} | 0.255 | 0.236 |
| 6 | 2 | {T1T2},{T3} | 0.255 | 0.000 |
| 7 | 2 | {T2T3T5},{T1} | 0.240 | 0.158 |
| 8 | 3 | {T2T3T5},{T4},{T1} | 0.240 | 0.158 |
| 9 | 2 | {T2T3T5},{T1T4} | 0.123 | 0.158 |
Table 4.
Stage-based Sustainability Performance of the Optimal Multistage Trajectory.
| Stage | Tech Set Implemented | Sustainability Performance | ||
| Economic | Environmental | Social | ||
| 0 | - | 0.498 | 0.535 | 0.288 |
| 1 | {T1T2} | 0.568 | 0.788 | 0.577 |
| 2 | {T2T4} | 0.796 | 0.927 | 0.652 |
Disclaimer/Publisher’s Note: The statements, opinions and data contained in all publications are solely those of the individual author(s) and contributor(s) and not of MDPI and/or the editor(s). MDPI and/or the editor(s) disclaim responsibility for any injury to people or property resulting from any ideas, methods, instructions or products referred to in the content. |
© 2026 by the authors. Licensee MDPI, Basel, Switzerland. This article is an open access article distributed under the terms and conditions of the Creative Commons Attribution (CC BY) license.
Copyright: This open access article is published under a Creative Commons CC BY 4.0 license, which permit the free download, distribution, and reuse, provided that the author and preprint are cited in any reuse.


