
Submitted:
23 December 2024
Posted:
24 December 2024
You are already at the latest version
Abstract
The sustainability evaluation of engineering processes and structures is a multifaceted challenge, requiring the integration of diverse and often conflicting criteria. A comprehensive Sustainability Index (SI) has been developed to address this complexity, utilizing Multi-Criteria Decision-Making (MCDM), to provide balanced and effective solutions. The SI incorporates key metrics across performance, environmental impact, economic factors, social dimensions, and circular economy principles. Selecting the most appropriate MCDM tool for problems involving multiple criteria is a pivotal challenge in holistic sustainability assessments. Among the numerous methods documented in the literature, the Weighted Sum Method, Technique for Order of Preference by Similarity to Ideal Solution (TOPSIS), modified TOPSIS, COPRAS and VIKOR are frequently employed for ranking alternatives. The calculation of SI is based on the normalized data, with the selection of both the MCDM tool and the normalization method playing a crucial role in determining the robustness and reliability of the results. This study investigates the impact of various MCDM tools on the decision-making process and examines how prominent normalization methods, including min-max normalization, vector normalization, z-score normalization, robust normalization and sum normalization, affect the final outcomes. Using a dataset from the aviation sector, a typical aircraft component serves as a case study for a holistic sustainability assessment. A detailed sensitivity analysis investigates the influence of MCDM tools, normalization methods, and weight variations on the holistic SI. This study highlights the importance of selecting appropriate MCDM tools and normalization methods to enhance the interpretability, robustness, reliability, and consistency of sustainability assessments in engineering applications.
Keywords:
Sustainability evaluation
; Sustainability Index (SI)
; Multi-Criteria Decision-Making (MCDM)
; Normalization methods
; Sensitivity analysis
; Aviation sector
; Holistic sustainability assessment
; Decision-making process
; Robustness and reliability
; Consistency of sustainability assessments
1. Introduction
Multi-Criteria Decision-Making (MCDM) methods have a wide range of applications across various fields. There are numerous MCDM techniques, including the Weighted Sum Model (WSM), TOPSIS (Technique for Order Preference by Similarity to Ideal Solution), ELECTRE (ELimination and ChoiceExpressingREality), PROMETHEE (Preference Ranking Optimization METHod for. Enrichment Evaluation), VIKOR (VIseKriterijumska Optimizacija I Kompromisno Resenje) COPRAS (Complex Proportional Assessment), AHP (Analytic Hierarchy Process), and Goal Programming (GP), among others. Additionally, many hybrid models have been developed to address specific decision-making challenges. A common application area of MCDM is the sustainability assessment, which spans multiple industries and sectors, providing a structured approach to evaluate and optimize decisions based on sustainability objectives [1]. Given their versatility, MCDM methods have been widely employed and compared in the context of sustainability assessment, showcasing their strengths and limitations in various case studies and applications. For example, a thorough literature review on the application of MCDM methods in sustainable engineering was conducted in [2]. It highlights that selecting an appropriate MCDM method is itself a multi-criteria problem, as each method has its own strengths and limitations. The choice of method largely depends on the preferences of decision-makers and analysts, with no single method universally superior to others. The review also concludes that there has been a significant increase in the application of MCDM models across engineering disciplines over the past decade, with the AHP method being the most applied one , followed closely by TOPSIS. In [3], a hybrid MCDM model combining TOPSIS, DEMATEL (Decision-Making Trial and Evaluation Laboratory), ANP, and GRA (Grey Relational Analysis) is proposed as a tool for selecting green and sustainable materials. Similarly, [4] emphasizes the use of MCDM in the transportation sector, highlighting the critical role of stakeholder involvement in the decision-making process. Meanwhile, [5] advocates for the application of MCDM to deliver sustainable products to consumers. Additionally, [6] applies MCDM to assess the sustainability of electricity production technologies, incorporating methods such as MOORA and TOPSIS. Finally, [7] provides a comprehensive review of MCDM methods for sustainable renewable energy development, analysing a wide range of models, including SAW, AHP, MAUT, ELECTRE, PROMETHEE, and others, to identify optimal solutions.
In the aviation sector, MCDM methods are widely used for sustainability assessments, particularly in areas such as aircraft evaluation, airport, and airline operations. The author in [8] identifies 280 articles applying MCDM methods for sustainability assessments, involving over 60 different techniques. This study highlights a lack of clarity in many cases, as no reasons are provided for why a particular MCDM method was chosen over others. Instead, justifications typically focus on why the selected MCDM interpretation method was suitable for the study, often citing capabilities such as ranking or scoring a set of alternatives based on multiple criteria—functions that almost all MCDM methods can achieve. In a comprehensive review of over 160 papers on MCDM in the aviation industry [9], many studies focus on assessing sustainability criteria at the aircraft, airport, and airline levels, with AHP and TOPSIS being the most widely used methods. Another study [10] highlights that MCDM is an appropriate tool for sustainability assessment in aviation, especially when compared to other decision support systems such as deep learning and neural networks.
At the aircraft level, a hybrid MCDM approach is proposed in [11] for aircraft selection based on sustainability-related aspects. Another study [12], has used SWARA (Step-Wise Weight Assessment Ratio Analysis) is utilised for weighting and COPRAS for aggregation, focusing on sustainability criteria in aircraft selection. A comparison of AHP and ESM (Elimination Et Choice Translating Reality) in [13] also results in the same rankings, with sensitivity analysis also applied on the involved weights. Additionally, [14] compares a novel MCDM method with the WSM and the WPM (Weighted Product Method) to select an aircraft using a fuzzy weighting approach, leading to consistent conclusions. Additionally, in [15] MCDM methods were applied to assess and compare aircraft in terms of sustainability, incorporating AHP for weighting and WSM and TOPSIS for aggregation, which resulted in consistent outcomes
At the airport level, [16] uses a hybrid MCDM approach incorporating DEMATEL, DANP (DEMATEL-based ANP), and VIKOR to assess sustainability performance in international airports. Similarly, [17] proposes MCDM for selecting a new airport, comparing methods like SAW, TOPSIS, and AHP, all yielding consistent results. The importance of sensitivity analysis to assess robustness is also emphasized in this study.
Additionally, [18] proposes a hybrid MCDM method for selecting sustainable aviation fuels in supply chain management. This method is compared with others, including SAW and TOPSIS, showing consistent rankings across all methods, with sensitivity analysis applied to both input data and weights. Similarly, in [19], MCDM is used to assess the sustainability of alternative aviation fuels, incorporating and comparing methods such as SAW, TOPSIS, and GRA. The study concludes that all methods provide consistent rankings, with slight deviations observed only in the SAW method. Finally, [20] highlights the importance of stakeholder weighting in decision-making by proposing the Best-Worst Method, a technique that accounts for the relative importance of various stakeholders in the decision-making process.
The effect of normalization techniques in the context of MCDM methods has been also extensively studied in the literature. The choice of normalization technique can significantly impact the final ranking of alternatives and the selection of the best option. As noted by Chatterjee and Chakraborty [21], the normalization method employed in a MCDM approach plays a crucial role in determining the outcome of the decision-making process. Moreover, a comprehensive analysis of various normalization techniques for MCDM methods such as SAW, TOPSIS, and COPRAS was provided in [22], highlighting the pros and cons of each method. The authors suggest that sum-based linear normalization and vector normalization methods are among the most preferred normalization techniques, although the final choice depends on the specific structure of the problem being analysed. In the context of ship design, [23] investigates the effect of normalization (sum-based and vector normalization) methods on MCDM techniques such as WSM, WPM, TOPSIS, and ELECTRE. The results indicate consistency in the outcomes based on correlation analysis. In a study on web services [24], the impact of normalization on the VIKOR method was assessed using techniques such as linear sum, linear max, min-max, and vector normalization. The findings revealed that different normalization methods resulted in distinct outcomes, emphasizing the importance of selecting the appropriate technique for the given context. Additionally, [25] examined normalization techniques like max, min-max, and vector normalization in conjunction with the SAW aggregation method, leading to different rankings for each technique. Similarly, [26] assessed various normalization methods for the TOPSIS, highlighting the challenge of identifying the most suitable normalization technique for each problem. In [27], different normalization techniques for the SAW method are evaluated, concluding that min-max normalization is the most appropriate compared to other methods, although the study could not offer concrete recommendations for practical applications. In [28], the authors assessed ten different normalization techniques for the PSI method, noting that each technique led to different results, though some could be correlated. The challenges of selecting the optimal normalization technique were also discussed in [29], where the authors pointed out that varying rankings can result from different techniques, complicating the decision process. Different normalization methods were compared in [30] in the presence of outliers, showing that each method yielded distinct results depending on the normalization approach. On the other hand, [31] assessed five normalization techniques in conjunction with the MARCOS aggregation method, finding relatively consistent results for all normalization methods. In the robotics sector, [32] compared different normalization techniques for the Weighted Aggregated Sum Product Assessment (WASPAS), alongside other MCDM methods, favouring min-max normalization for its effectiveness. In a study focused on time and complexity criteria, [33] examined various normalization techniques for the TOPSIS method. Lastly, in the aviation sector, three normalization techniques—min-max, sum, and z-score normalization—using the WSM method were assessed in [34]. The study found consistent rankings for both the min-max and z-score methods. In another study for aircraft selection problems [35], different normalization techniques were applied to the weighted sum aggregation method, with results showing that vector, linear sum, and linear max normalization produced similar outcomes, while min-max normalization led to different results.
The findings regarding both the MCDM methods and the selected normalization techniques underscore the importance of carefully choosing the appropriate method based on the specific characteristics of the problem. Different techniques can yield varying results, which highlights the need for a tailored approach in decision-making. The choice of normalization method can significantly influence the final rankings and the selection of the best alternative, depending on the structure and requirements of the problem at hand. Recognizing this impact, it becomes essential to systematically investigate how different normalization methods and decision-making tools perform in practical applications.
The aim of the present work is to explore and evaluate the effectiveness of various MCDM tools and normalization methods in sustainability assessments of engineering processes and structures, focusing on an aircraft component design with multiple variations. Data collected from an aircraft structural component, investigated in a previous study of the authors [36] is utilized to implement a Sustainability Index (SI), firstly introduced in [37], integrating key metrics across multiple sustainability-related dimensions, involving mechanical performance, environmental impact (emissions), economic factors (costs), social dimensions (social impact metrics), and circular economy principles (focusing on the recyclability of the materials), for a large set of aircraft component configurations. This research investigates how different MCDM methods, such as the WSM, TOPSIS, modified TOPSIS, VIKOR, and COPRAS, as well as various normalization techniques (min-max, median, vector, z-score, and sum normalization), affect the robustness, reliability and the interpretation of the final outcomes. The findings aim to enhance the decision-making process in engineering applications, with a particular focus on sustainability in aircraft design.
2. Dataset – Exploited Use Case for Sustainability Evaluation
To assess and compare the robustness and sensitivity of various MCDM methods and normalization techniques on the evaluation of the SI on aviation sector, a comprehensive dataset from study [36] has been utilized. This dataset is specifically centred on the design and evaluation of alternative configurations of a commonly used aircraft component: a hat-stiffened panel. This type of panel is a critical structural element in aerospace applications and is composed of two primary components—the skin and the stringer. A typical profile and geometry of a hat-stiffened panel are illustrated in Figure 1 [38]. Five distinct material combinations were analysed, as detailed in Table 1. The dataset includes 4487 distinct design alternatives, with variations in both the material properties and the geometrical features of the panel. Each configuration was systematically evaluated across multiple dimensions of sustainability: mechanical performance, environmental impact, economic cost, social impact, and circularity performance. These dimensions are quantified and aggregated into a sustainability metric, unique for each alternative, using a framework described in [36]. In the latter study, the aggregated SI has been calculated using a weighted sum approach, with each metric being normalized using min-max normalization. Therefore, this dataset has been utilized as a representative example of an aircraft component design procedure, providing a foundation for assessing the effects of different MCDM methods and normalization techniques within a decision support process. This is particularly valuable in scenarios where multiple, and often conflicting, aspects of sustainability—such as mechanical performance, environmental impact, economic costs, social considerations, and circularity—must be balanced.
3. Methodology
For the aforementioned dataset, a holistic SI was evaluated with respect to five pillars: performance, environment, cost, circularity and society, based on five (5) MCDM and five (5) normalization methods. Three different weighting scenarios were considered, one with equal weights on each pillar, one where the environment and performance were prioritized and one where cost and performance were prioritized. A Pearson correlation analysis was conducted for the five MCDM methods to verify the relationship between the alternative’s rankings, indicating a strong positive correlation among them. Moreover, a sensitivity analysis was conducted to test the robustness of the studied methods. Specifically, the data was perturbed by a zero-mean Gaussian error, with the standard deviation being a percentage of the standard deviations of the initial variables. Based on 1,000 simulated perturbed samples, the mean and standard deviation of the final rankings were computed and compared. The most robust method with respect to small departures from the initial data, as well as the most sensitive to high perturbations, was selected for further investigation, considering the normalization method and its effect on the holistic SI evaluation.
3.1. MCDM Methods Considered
The impact of various MCDM methods was assessed using the approaches outlined below. These methods are recognized as some of the most widely utilized and popular techniques in the literature, due to their effectiveness in handling complex decision problems where multiple conflicting criteria must be considered. By applying these methods, the study aimed to evaluate how different decision-making frameworks can influence the sustainability assessment of alternative design configurations.
3.1.1. Weighted Sum Method (WSM)
The WSM or alternatively, Simple Additive Weighting (SAW) method is a widely used MCDM method in practice, since it is an easy-to-implement and interpret method. The WSM was introduced by Fishburn [39] providing a scoring model based on the weighted average principle. It assigns weights to each objective and then takes the weighted sum of them, converting multiple objectives into an aggregated scalar objective function. The weights are usually determined by the Analytical Hierarchy Process (AHP) method [40,41,42].
More specifically, let be the performance of the alternative Ai against the attribute Cj, i =1, …. I and j=1, …,J, the normalised rating and the weight of the Cj attribute, with . The normalized data is utilized since the data should be in a common scale. Then, the overall score for the alternative Ai is equal to
The attribute with the highest WSM score is the best alternative.
One disadvantage of this method is that it can lead to compromises between the pillars; high performance in one criterion can compensate for low performance in another.
3.1.2. Technique for Order Preference by Similarity to an Ideal Solution (TOPSIS).
TOPSIS was initially proposed by Hwang & Yoon [43] as a compromising model, based on the distance principle. TOPSIS proposed as an optimal solution the one that has the shortest distance from the positive ideal solution and the longest distance from the negative ideal solution. The most used distance in TOPSIS evaluation is the Euclidean distance. However, other distances, such as Manhattan and Tchebichev [44] and others [45] can be used to calculate TOPSIS.
Let , i =1, …. I and j=1, …,J, the weighted and normalized rating and respectively. Then the overall score for the alternative is
Finally, alternatives are ranked with respect to values. A higher score value indicates a better alternative performance.
A main limitation of TOPSIS is the rank reversal phenomenon where by adding or removing an alternative solution, the initial ranking of the alternatives changes. Several modifications for addressing this problem have been proposed in the literature, e.g. [46,47]. TOPSIS with Manhattan distance does not appear to suffer from the rank reversal phenomenon [44] as it inherits this property from WSM, with both methods exhibiting similar behaviour when this distance metric is used. Additionally, in this method, the interpretation of the weights is not straightforward, as the distances from the positive and negative ideal solutions are weighted by the square of the initial weights (2). For this reason, modified TOPSIS has been proposed.
3.1.3. Modified TOPSIS
The main difference between the modified TOPSIS and the original TOPSIS is that, in the modified version, the ideal solution is identified first, and then the weighted Euclidean distance is calculated [48]. Thus, the overall score for the alternative Ai is
The difference between the two methods is that in TOPSIS, is used, contrary to modified TOPSIS where is used while calculating the distances from the positive and the negative ideal solutions. This helps maintain a proportional and more balanced impact of each attribute on the final decision, avoiding the exaggerated influence of higher-weighted attributes seen in the traditional TOPSIS method. Yet, The TOPSIS and the modified TOPSIS methods result in the same ranking when equal attribute weights are used.
3.1.4. VIKOR
VIKOR (VIseKriterijumska Optimizacija I Kompromisno Resenje, that means: Multicriteria Optimization and Compromise Solution) has been proposed by Opricovic [49,50,51]. Unlike TOPSIS, which prioritizes solutions closest to the positive ideal solution and farthest from the negative ideal, VIKOR focuses on a compromise solution by minimizing the distance to both ideal solutions. This approach appeals to risk-takers, potentially leading to more innovative or bold decisions.
Let be the best and the worst values for each criterion
Step 1: Compute and
and
Step 2: Compute where , , , and a weighting reference, where 0 ≤ ≤ 1.
Step 3: Rank alternatives, sorted by the values S, R, Q in ascending order and produce three ranking lists.
S, R, Q ranking lists will propose the compromise solution or a set of compromise solutions. If the attribute A’ has the best score with respect to Q list, it could be considered as the best solution if it satisfies the following conditions
C1: Q(A’’) – Q(A’) ≥ (m-1)-1
where A’’ is the attributed with second-best score in Q list and m is the number of attributes and
C2: A’ has also the best score with respect to S and/or R list. If the above conditions are not satisfied, a compromise solution set results.
3.1.5. COPRAS
COPRAS (Complex Proportional Assessment) method was introduced by Zavadskas and Kaklauskas [52] and it can be described as follows:
Step 1. Normalize the initial rating Let be the normalized rating.
Step 2. Weight the normalized rating by proper weight
Step 3. Calculate the where: Ri the summation of the attributes that need to be minimized and Pi the summation of the attributes that need to be maximized
Alternatives are ranked based on values. A higher score value on U indicates a better alternative performance.
A main limitation of COPRAS is that it is less robust than other MCDM methods, even in the case of small data changes [53]. This lack of robustness means that even minor variations in the input data, such as slight changes in the values of criteria or the performance of alternatives, can lead to significant fluctuations in the final rankings or outcomes.
3.2. Normalization Methods
Normalization is a crucial step in any decision-making problem as it transforms heterogeneous data into data on a common scale. Data normalization involves scaling the attribute values to make them lie numerically in the same scale and thus have the same importance on the final index. There exist numerous normalization methods in the literature [54], but in the current work, the following five widely used techniques were considered and compared (Table 2).
Let x be the initial value, and x′ represent the normalized value. The , , , , , correspond to the minimum, the maximum, the mean, the median, the standard deviation and the interquartile range value of the criterion respectively.
4. Results
4.1. MCDM Impact Results
In Table 3, the first 10 ordered configurations are presented obtained from the five different MCDM methods. The numbers correspond to the configuration IDs as described in [36]. The first column indicates the material combinations, as shown in Table 1. Moreover, three different scenarios have been considered: equal weighting among the five pillars of sustainability, prioritization of costs and performance, and prioritization of environment and performance. Colouring has been applied to help identify the similar configurations obtained across the five different MCDM methods. To improve clarity, the configuration colours derived from the WSM method are highlighted in the rankings of the other MCDM methods.
In the equal weighting scenario, most of the top-ranked design configurations consistently appear across all five MCDM methods, although their positions within the rankings varied. This suggests a strong consensus among the different MCDM methods, indicating that these top configurations are consistently deemed optimal or high-performing, regardless of the specific method used. More specifically, TOPSIS and modified TOPSIS yielded identical results, as mathematically proved, and their final rankings closely aligned with those of VIKOR. SWM and COPRAS produced similar ranking orders. When greater weight was assigned to cost and performance metrics compared to the others, modified TOPSIS and VIKOR exhibited nearly identical performance, though the rankings of other configurations differed. Finally, when greater weight was assigned to performance and environmental factors, the top ten ranked attributes were identical in COPRAS and VIKOR, although their exact positions differed. These two methods differed by only two attributes compared to the corresponding list from SWM.
To verify the similarity of the entire ordered lists resulting from the five different aggregation methods, a Pearson correlation analysis was conducted, considering the three different weighting schemes. The Pearson correlation coefficient describes the strength and the direction of a linear relationship between two variables, with values ranging from -1 to 1. A value of 1 indicates perfect positive correlation (all data points align in a straight line with a positive slope), and a value of -1 indicates perfect negative correlation (all data points align in a straight line with a negative slope). The correlation analysis results (Table 4) indicate a strong positive correlation between the alternative rankings, meaning that all methods demonstrated equivalent rankings.
To test the sensitivity of the five MCDM methods to small variations in the initial data, 1000 perturbed samples were generated. The initial values were perturbed by a Gaussian error with zero mean and a standard deviation equal to 1% and 10% of the standard deviation of the initial data. The simulated samples were then normalized and ordered. Figure 2a-f present the boxplots of the first five ordered attributes with respect to SWM for each of the considered MCDM method.
For the scenario with equal weights, both VICOR and COPRAS exhibited higher variability, even with small perturbations (1%) in the initial data, which is undesirable in this specific context. Conversely, the WSM demonstrated minimal variation in response to small perturbations, indicating stability in the resulting order. TOPSIS and modified TOPSIS were relatively stable under small data perturbations, although they were slightly more sensitive than WSM. As the perturbation of the initial data increased (to 10%), the variation in WSM also increased, which is a desirable characteristic in this scenario. TOPSIS and modified TOPSIS showed high sensitivity to larger perturbations, although they were less sensitive than WSM. Finally, COPRAS and VIKOR exhibited extreme sensitivity to the ranking order under large data variations.
When greater weights were assigned to cost and performance metrics, the Weighted Sum Model (WSM) exhibited low sensitivity to small data variations but higher sensitivity to significant data variations. This behavior was also observed in TOPSIS, Modified TOPSIS, and VIKOR. In contrast, COPRAS displayed very high sensitivity to both small and large data variations.
In the scenario where greater weights were assigned to environmental and performance metrics, WSM again demonstrated low sensitivity to small data variations and high sensitivity to significant data variations. However, the other methods showed sensitivity to both small and large data variations, with VIKOR and COPRAS being particularly sensitive to substantial data changes.
In conclusion, SWM appears to be a more suitable method compared to the others, as its ranking order exhibits minimal sensitivity to small data perturbations, while it becomes more sensitive to larger data variations. This characteristic is particularly desirable in the context of sustainability assessment, where stability in the ranking of attributes is essential when dealing with slight variations in the initial data. However, the ability to reflect greater sensitivity with larger perturbations allows SWM to capture more significant shifts in the data, ensuring that it can account for more pronounced changes in underlying trends.
4.2. Normalization Impact Results
Following the analysis on the impact of the MCDM methods, the effect of normalization methods on WSM performance was assessed. For this analysis, the most robust MCDM method from the previous step, i.e., the SWM method, was considered, and the impact of different normalization methods on this method was evaluated. In Table 5, the first ten design configurations are presented for the SWM method across five normalization techniques and three weighting scenarios: equal weighting, performance and cost prioritized, and environment and performance prioritized. For all weighting scenarios, the rankings were very similar across all studied normalization methods, with the L1 and L2 norms yielding nearly identical results.
This consistent ranking is further confirmed by the correlation analysis (Table 6), where all correlation coefficients are very close to one, indicating a high degree of similarity between the rankings for the different normalization methods. This is also the case for all the studied weighting scenarios.
To test the sensitivity of the five normalization methods to variability in the initial data, a simulation similar to that conducted for the MCDM methods was performed. The simulated data were ordered, and the boxplots of the first five ordered attributes with respect to Min-Max normalization method are depicted in Figures 3a-f, for each normalization method
In the equal weight’s scenario, the L1 norm and L2 norm normalization methods appear to be sensitive to both small and large data perturbations. The ranking using min-max normalization seems to be insensitive to small data perturbations (1%) but shows sensitivity to larger data perturbations (10%). Z-score and median normalization methods demonstrate moderate sensitivity to both small and large data perturbations.
In the scenario where greater weight was assigned to both cost and performance metrics, all normalization methods exhibit moderate sensitivity to both small and large data perturbations. However, min-max appears to be more sensitive to large data perturbations compared to the other methods, which is a desirable outcome.
Finally, in the scenario where greater weights was assigned to both environment and performance, min-max normalization appears to be less sensitive to small data perturbations compared to the other methods. Additionally, Z-score and median methods seem to have low sensitivity to small data perturbations. For larger data perturbations, the ranking using min-max becomes more sensitive compared to the other methods, while L1 norm and L2 norm show high sensitivity to both small and large data perturbations.
Based on the analysis above, min-max normalization emerges as the preferred method in several scenarios due to its balanced sensitivity to variations in the data. This normalization technique is particularly advantageous because it exhibits stability when dealing with small data perturbations, while also being sufficiently responsive to larger shifts in the data. In the context of sustainability assessment, where accurate ranking and sensitivity to changes are crucial, min-max emerges as the most robust and reliable choice due to its ability to manage a range of data fluctuations. Its capacity to maintain consistent and reliable rankings under varying conditions ensures that it can provide meaningful insights, even when faced with uncertainties or variability in the input data. This adaptability is essential for ensuring the integrity and accuracy of sustainability assessments over time.
5. Conclusions and Future Perspectives
This study investigates the impact of various MCDM tools on the decision-making process and examines how prominent normalization methods affect the final outcomes in the context of sustainability assessment, specifically during the design of aircraft structures. Using a dataset from the aviation sector, a typical aircraft component was selected as a case study for a holistic sustainability assessment. A detailed sensitivity analysis was conducted to explore the influence of MCDM tools, normalization methods, and weight variations on the holistic SI.
The results indicate that the ranking obtained from the considered MCDM methods was consistent, as demonstrated by the correlation analysis. This finding suggests that the choice of MCDM tool does not significantly affect the ranking in this context. However, the sensitivity analysis of the impact of data variation under different weighting scenarios revealed that the WSM is more sensitive to small data variations, while exhibiting desirable sensitivity to larger data variations. This characteristic is advantageous in sustainability assessment, as it aligns with the need for robust responses to significant changes in the dataset.
When considering normalization methods, the analysis focused on five widely used techniques. The effect of normalization on the WSM was assessed, with the ranking results showing consistency, as validated by the correlation analysis. Notably, the min-max normalization method demonstrated smaller sensitivity to small data variations and greater sensitivity to larger data variations. This property makes it a particularly robust choice for this context. Additionally, the bounded nature of results using min-max normalization (e.g., within the range 0-1) enhances interpretability, transparency, and comprehensibility.
Overall, the weighted sum model using min max method is justified for calculating the Sustainability Index in the conceptual design phase due to its ability to provide a simple, transparent, and flexible framework for decision-making under uncertainty. The weighted sum model's clarity, and ability to provide a first-order approximation of sustainability make it a practical tool for conceptual design. Future research should address potential drawbacks of the weighted sum model, particularly its compensatory nature, where strong performance in one criterion can offset poor performance in another. Introducing minimum thresholds for critical criteria could help ensure that design alternatives failing to meet essential sustainability requirements are excluded from consideration.
Acknowledgments
The research conducted in this paper has been funded by European Union’s Horizon 2020, its research and innovation program, under grant agreement No 101058089, project EuReComp (European recycling and circularity in large composite components).
References
- G. P. Bhole. MultiCriteria Decision Making (MCDM) Methods and its applications. Int J Res Appl Sci Eng Technol 2018, 6, 899–915. [Google Scholar] [CrossRef]
- E. Harirchian, K. Jadhav, K. Mohammad, S. E. A. Hosseini, and T. Lahmer. A Comparative Study of MCDM Methods Integrated with Rapid Visual Seismic Vulnerability Assessment of Existing RC Structures. Applied Sciences 2020, 10, 6411. [Google Scholar] [CrossRef]
- H. Zhang, Y. Peng, G. Tian, D. Wang, and P. Xie. Green material selection for sustainability: A hybrid MCDM approach. PLoS One 2017, 12, e0177578. [Google Scholar] [CrossRef]
- J. Żak, Y. J. Żak, Y. Hadas, and R. Rossi, Eds.. Advanced Concepts, Methodologies and Technologies for Transportation and Logistics. vol. 2018. [Google Scholar] [CrossRef]
- R. Santos, J. C. O. Matias, and A. Abreu. A Decision-Making Tool to Provide Sustainable Solutions to a Consumer. IFIP Adv Inf Commun Technol 2020, 577, 63–78. [Google Scholar] [CrossRef]
- D. Streimikiene, T. Balezentis, I. Krisciukaitien, and A. Balezentis. Prioritizing sustainable electricity production technologies: MCDM approach. Renewable and Sustainable Energy Reviews 2012, 16, 3302–3311. [Google Scholar] [CrossRef]
- Kumar, *!!! REPLACE !!!*; et al. . A review of multi criteria decision making (MCDM) towards sustainable renewable energy development. Renewable and Sustainable Energy Reviews 2017, 69, 596–609. [Google Scholar] [CrossRef]
- Lindfors. Assessing sustainability with multi-criteria methods: A methodologically focused literature review. Environmental and Sustainability Indicators 2021, 12, 100149. [Google Scholar] [CrossRef]
- S. Dožić. Multi-criteria decision making methods: Application in the aviation industry. J Air Transp Manag 2019, 79, 101683. [Google Scholar] [CrossRef]
- E. R. Elhmoud and A. A. Kutty. Sustainability Assessment in Aviation Industry: A Mini- Review on the Tools, Models and Methods of Assessment. 2020, Accessed: Dec. 08, 2024. [Online]. Available: http://qspace.qu.edu. 1057.
- K. Kiracı and E. Akan. Aircraft selection by applying AHP and TOPSIS in interval type-2 fuzzy sets. J Air Transp Manag 2020, 89, 101924. [Google Scholar] [CrossRef]
- Bağcı and, M. Kartal. A combined multi criteria model for aircraft selection problem in airlines. J Air Transp Manag 2024, 116, 102566. [Google Scholar] [CrossRef]
- S. Dožić and M. Kalić. Comparison of Two MCDM Methodologies in Aircraft Type Selection Problem. Transportation Research Procedia 2015, 10, 910–919. [Google Scholar] [CrossRef]
- Ardil. Commercial Aircraft Selection Decision Support Model Using Fuzzy Combinative Multiple Criteria Decision Making Analysis. Journal of Sustainable Manufacturing in Transportation, 2023; 2. [CrossRef]
- N. Markatos and S. G. Pantelakis. Implementation of a Holistic MCDM-Based Approach to Assess and Compare Aircraft, under the Prism of Sustainable Aviation. Aerospace 2023, 10, 240. [Google Scholar] [CrossRef]
- M. T. Lu, C. C. Hsu, J. J. H. Liou, and H. W. Lo. A hybrid MCDM and sustainability-balanced scorecard model to establish sustainable performance evaluation for international airports. J Air Transp Manag 2018, 71, 9–19. [Google Scholar] [CrossRef]
- M. Janic and A. Reggiani. An Application of the Multiple Criteria Decision Making (MCDM) Analysis to the Selection of a New Hub Airport. European Journal of Transport and Infrastructure Research. [CrossRef]
- N. Chai and W. Zhou. A novel hybrid MCDM approach for selecting sustainable alternative aviation fuels in supply chain management. Fuel 2022, 327, 125180. [Google Scholar] [CrossRef]
- L. Chen and J. Ren. Multi-attribute sustainability evaluation of alternative aviation fuels based on fuzzy ANP and fuzzy grey relational analysis. J Air Transp Manag 2018, 68, 176–186. [Google Scholar] [CrossRef]
- J. Singh, S. Rana, A. B. Abdul Hamid, and P. Gupta. Who should hold the baton of aviation sustainability? Social Responsibility Journal 2023, 19, 1161–1177. [Google Scholar] [CrossRef]
- P. Chatterjee and S. Chakraborty. Flexible manufacturing system selection using preference ranking methods: A comparative study. International Journal of Industrial Engineering Computations 2014, 5, 315–338. [Google Scholar] [CrossRef]
- Aytekin. Comparative Analysis of the Normalization Techniques in the Context of MCDM Problems. Decision Making: Applications in Management and Engineering 2021, 4, 1–25. [Google Scholar] [CrossRef]
- H. Jafaryeganeh, M. Ventura, and C. Guedes Soares. Effect of normalization techniques in multi-criteria decision making methods for the design of ship internal layout from a Pareto optimal set. Structural and Multidisciplinary Optimization 2020, 62, 1849–1863. [Google Scholar] [CrossRef]
- S. T. Mhlanga and M. Lall. Influence of Normalization Techniques on Multi-criteria Decision-making Methods. J Phys Conf Ser 2022, 2224, 012076. [Google Scholar] [CrossRef]
- N. Vafaei, R. A. Ribeiro, and L. M. Camarinha-Matos. Assessing Normalization Techniques for Simple Additive Weighting Method. Procedia Comput Sci 2022, 199, 1229–1236. [Google Scholar] [CrossRef]
- Kacprzak. A new similarity measure for rankings obtained in MCDM problems using different normalization techniques. Operations Research and Decisions 2024, 34, 47–64. [Google Scholar] [CrossRef]
- N. Kosareva, A. Krylovas, and E. K. Zavadskas. Statistical analysis of MCDM data normalization methods using Monte Carlo approach. The case of ternary estimates matrix. Econ Comput Econ Cybern Stud Res 2018, 52, 159–175. [Google Scholar] [CrossRef]
- D. T. Do, V. D. D. T. Do, V. D. Tran, V. D. Duong, and N.-T. Nguyen. Investigation of the Appropriate Data Normalization Method for Combination with Preference Selection Index Method in MCDM. Operational Research in Engineering Sciences: Theory and Applications, 2023; 1. [Google Scholar] [CrossRef]
- Z. Mukhametzyanov. Normalization of Multidimensional Data for Multi-Criteria Decision Making Problems. vol. 2023. [CrossRef]
- N. Vafaei, R. A. N. Vafaei, R. A. Ribeiro, and L. M. Camarinha-Matos. Comparison of Normalization Techniques on Data Sets With Outliers. https://services.igi-global.com/resolvedoi/resolve.aspx?doi=10.4018/IJDSST.286184, 1. [CrossRef]
- D. D. Trung. Development of data normalization methods for multi-criteria decision making: applying for MARCOS method. Manuf Rev (Les Ulis) 2022, 9, 22. [Google Scholar] [CrossRef]
- M. Upadhyay. Effect Of Normalization Techniques In Robot Selection Using Weighted Aggregated Sum Product Assessment. 2017.
- T. M. Lakshmi and V. P. Venkatesan. A Comparison Of Various Normalization In Techniques For Order Performance By Similarity To Ideal Solution (topsis). International Journal of Computing Algorithm, /: Dec. 2014, Accessed: Dec. 08, 2024. [Online]. Available: http, 2014; 08.
- D. N. Markatos, S. Malefaki, and S. G. Pantelakis. Sensitivity Analysis of a Hybrid MCDM Model for Sustainability Assessment—An Example from the Aviation Industry. Aerospace 2023, 10, 385. [Google Scholar] [CrossRef]
- C. Ardil. Aircraft Selection Using Multiple Criteria Decision Making Analysis Method with Different Data Normalization Techniques. International Journal of Industrial and Systems Engineering, /: Accessed: Dec. 08, 2024. [Online]. Available: https, 2019; 08.
- Angelos Filippatos, D. N. Markatos, Athina Theochari, Sonia Malefaki, Thomas Kalampoukas & S.G. Pantelakis ‘‘A proposal towards a step change from eco-driven to sustainability-driven design of aircraft components.” In: Proceedings of the ICAS 2024 Conference, Florence, Italy [Online] Available: https://www.researchgate. 3852. [Google Scholar]
- D. N. Markatos and S. G. Pantelakis. Assessment of the Impact of Material Selection on Aviation Sustainability, from a Circular Economy Perspective. Aerospace, 2022; 2. [CrossRef]
- Filippatos, *!!! REPLACE !!!*; et al. . Sustainability-Driven Design of Aircraft Composite Components. Aerospace, 2024; 1. [Google Scholar] [CrossRef]
- P. C. Fishburn. Letter to the Editor—Additive Utilities with Incomplete Product Sets: Application to Priorities and Assignments. 1967, 15, 537–542. [CrossRef]
- T. Saaty. The analytic hierarchy process: Planning, priority setting, resource allocation: Thomas L. SAATY McGraw-Hill, New York, 1980, xiii. Eur J Oper Res 1980, 9, 97–98. [Google Scholar]
- T. L. Saaty. A scaling method for priorities in hierarchical structures. J Math Psychol 1977, 15, 234–281. [Google Scholar] [CrossRef]
- T. L. Saaty. How to make a decision: The analytic hierarchy process. Eur J Oper Res 1990, 48, 9–26. [Google Scholar] [CrossRef]
- C.-L. Hwang and K. Yoon. Multiple Attribute Decision Making. vol. 1981. [CrossRef]
- Ciardiello and, A. Genovese. A comparison between TOPSIS and SAW methods. Ann Oper Res 2023, 325, 967–994. [Google Scholar] [CrossRef]
- Akay and, M. Baduna Koçyiğit. Investigation of Flood Hazard Susceptibility Using Various Distance Measures in Technique for Order Preference by Similarity to Ideal Solution. Applied Sciences 2024, 14, 7023. [Google Scholar] [CrossRef]
- M. S. García-Cascales and M. T. Lamata. On rank reversal and TOPSIS method. Math Comput Model, 2012; 6. [CrossRef]
- H.-J. Shyur and H.-S. Shih. Resolving Rank Reversal in TOPSIS: A Comprehensive Analysis of Distance Metrics and Normalization Methods. Informatica, 2024; 4. [CrossRef]
- Deng, C. H. Yeh, and R. J. Willis. Inter-company comparison using modified TOPSIS with objective weights. Comput Oper Res, 2000; 10. [Google Scholar] [CrossRef]
- “Opricovic, S. (1998) Multicriteria Optimization of Civil Engineering Systems. PhD Thesis, Faculty of Civil Engineering, Belgrade, 302 p. - References - Scientific Research Publishing.” Accessed: Dec. 11, 2024. [Google Scholar]
- L. Duckstein and S. Opricovic. Multiobjective optimization in river basin development. Water Resour Res, 1980; 1. [CrossRef]
- S. Opricovic and G. H. Tzeng. Multicriteria Planning of Post-Earthquake Sustainable Reconstruction. Computer-Aided Civil and Infrastructure Engineering 2002, 17, 211–220. [Google Scholar] [CrossRef]
- E.K. Zavadskas, A. E.K. Zavadskas, A. Kaklauskas, & V. Šarka (1994). The new method of multicriteria complex proportional assessment of projects. “The new method of multicriteria complex proportional assessment of projects.
- L. Kraujalienė. Comparative analysis of multicriteria decision-making methods evaluating the efficiency of technology transfer. Business, Management and Economics Engineering, 2019; 1. [CrossRef]
- R. Krishnan. Past efforts in determining suitable normalization methods for multi-criteria decision-making: A short survey. Front Big Data 2022, 5, 990699. [Google Scholar] [CrossRef]
Figure 1.
Profile and geometry of a hat stiffened panel [38].
Figure 1.
Profile and geometry of a hat stiffened panel [38].
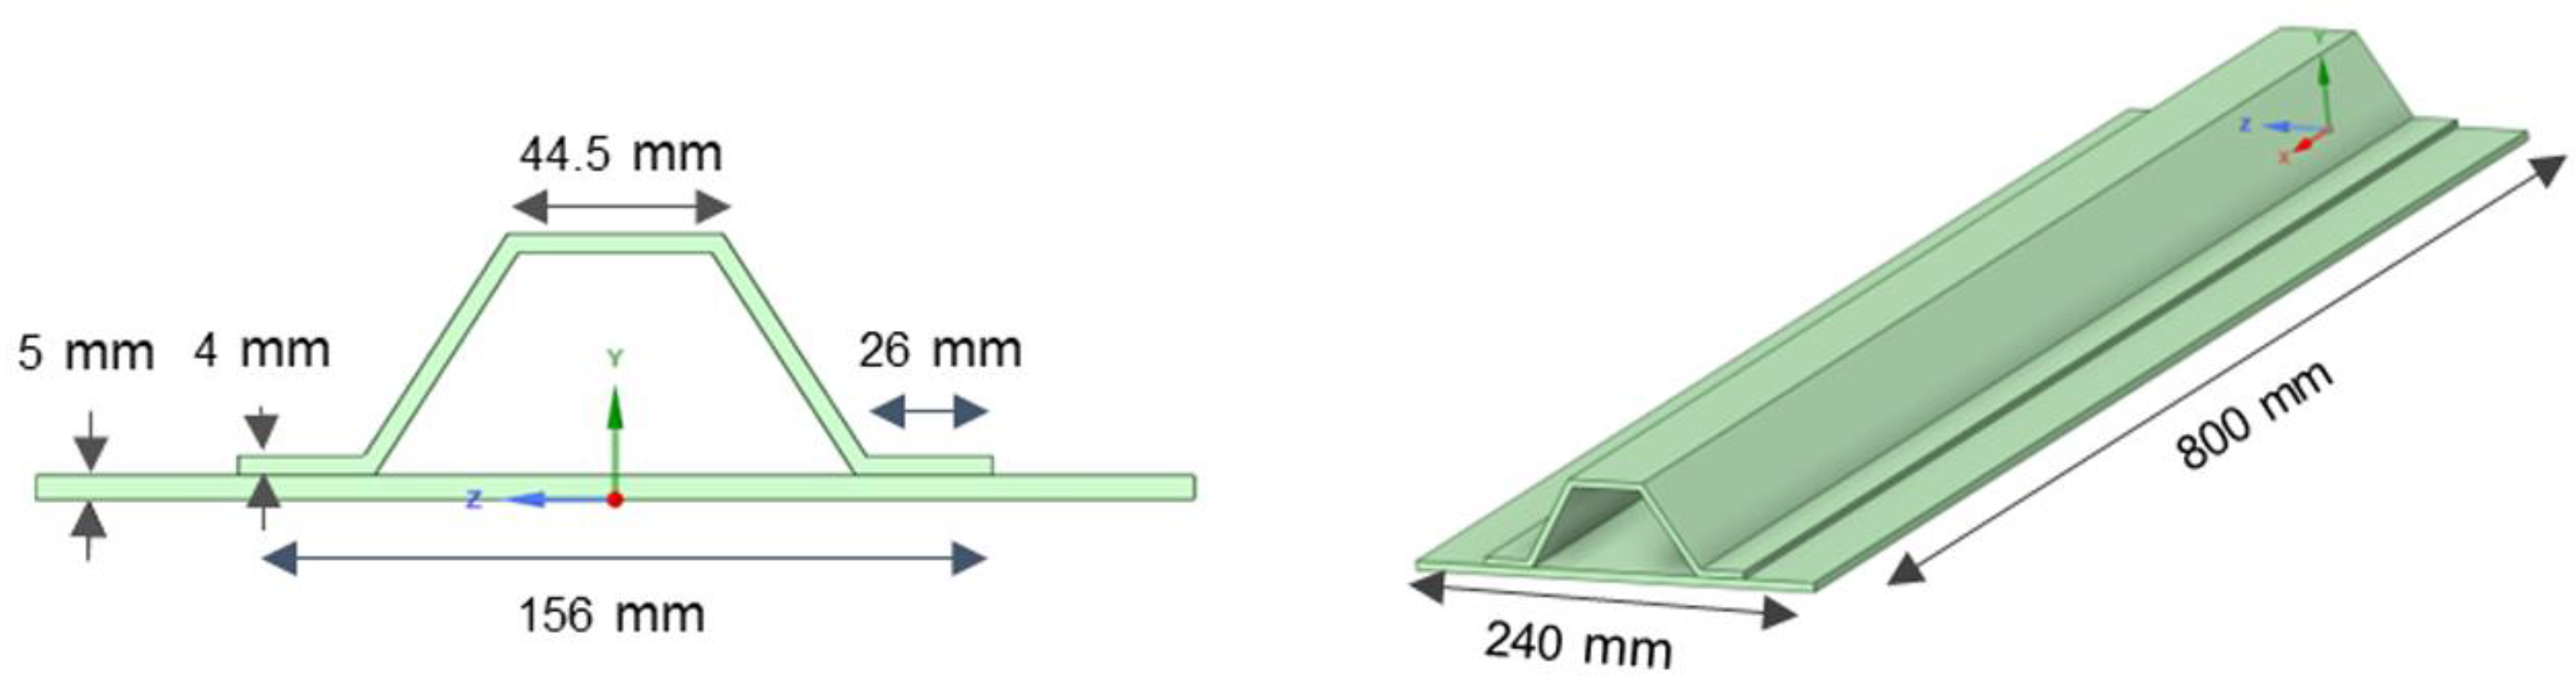
Figure 2.
a-f: Boxplots of the First Five Ordered Attributes Across MCDM Methods for Two Levels of Data Perturbation (1% and 10%), for the equal weights scenario (a, b), cost and performance prioritization scenario (c, d), and environment and performance prioritization scenario (e, f).
Figure 2.
a-f: Boxplots of the First Five Ordered Attributes Across MCDM Methods for Two Levels of Data Perturbation (1% and 10%), for the equal weights scenario (a, b), cost and performance prioritization scenario (c, d), and environment and performance prioritization scenario (e, f).
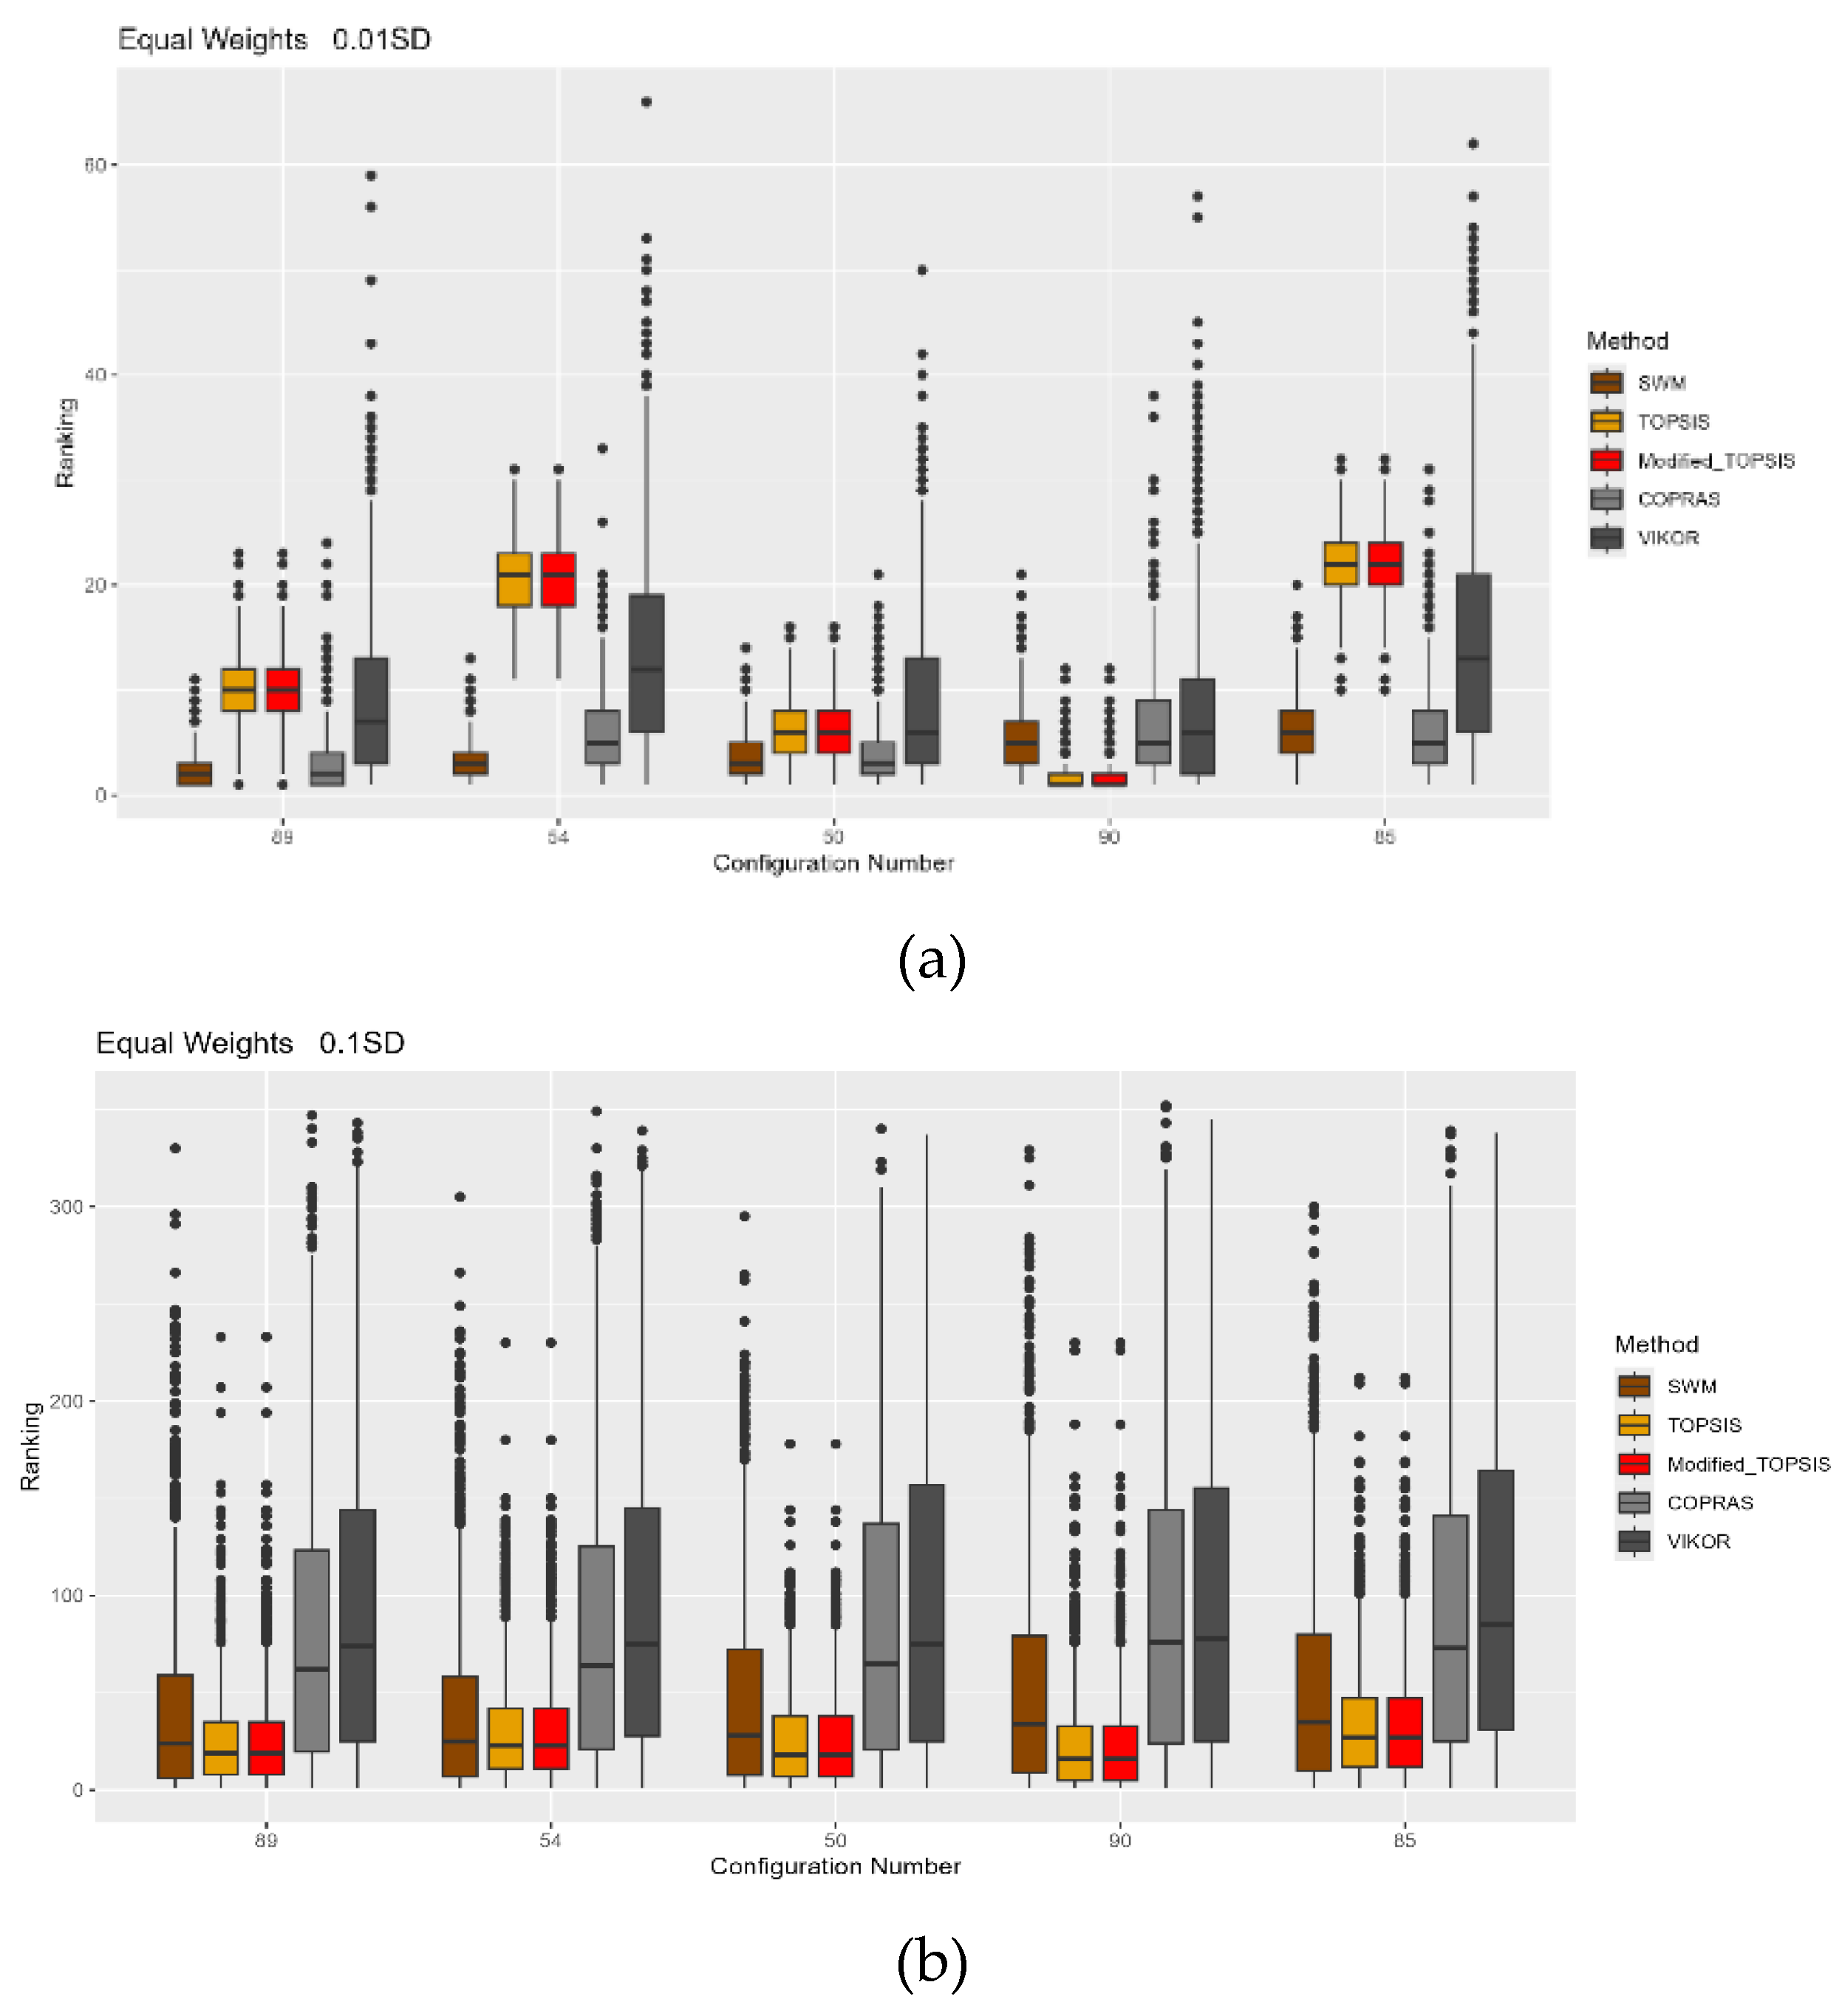
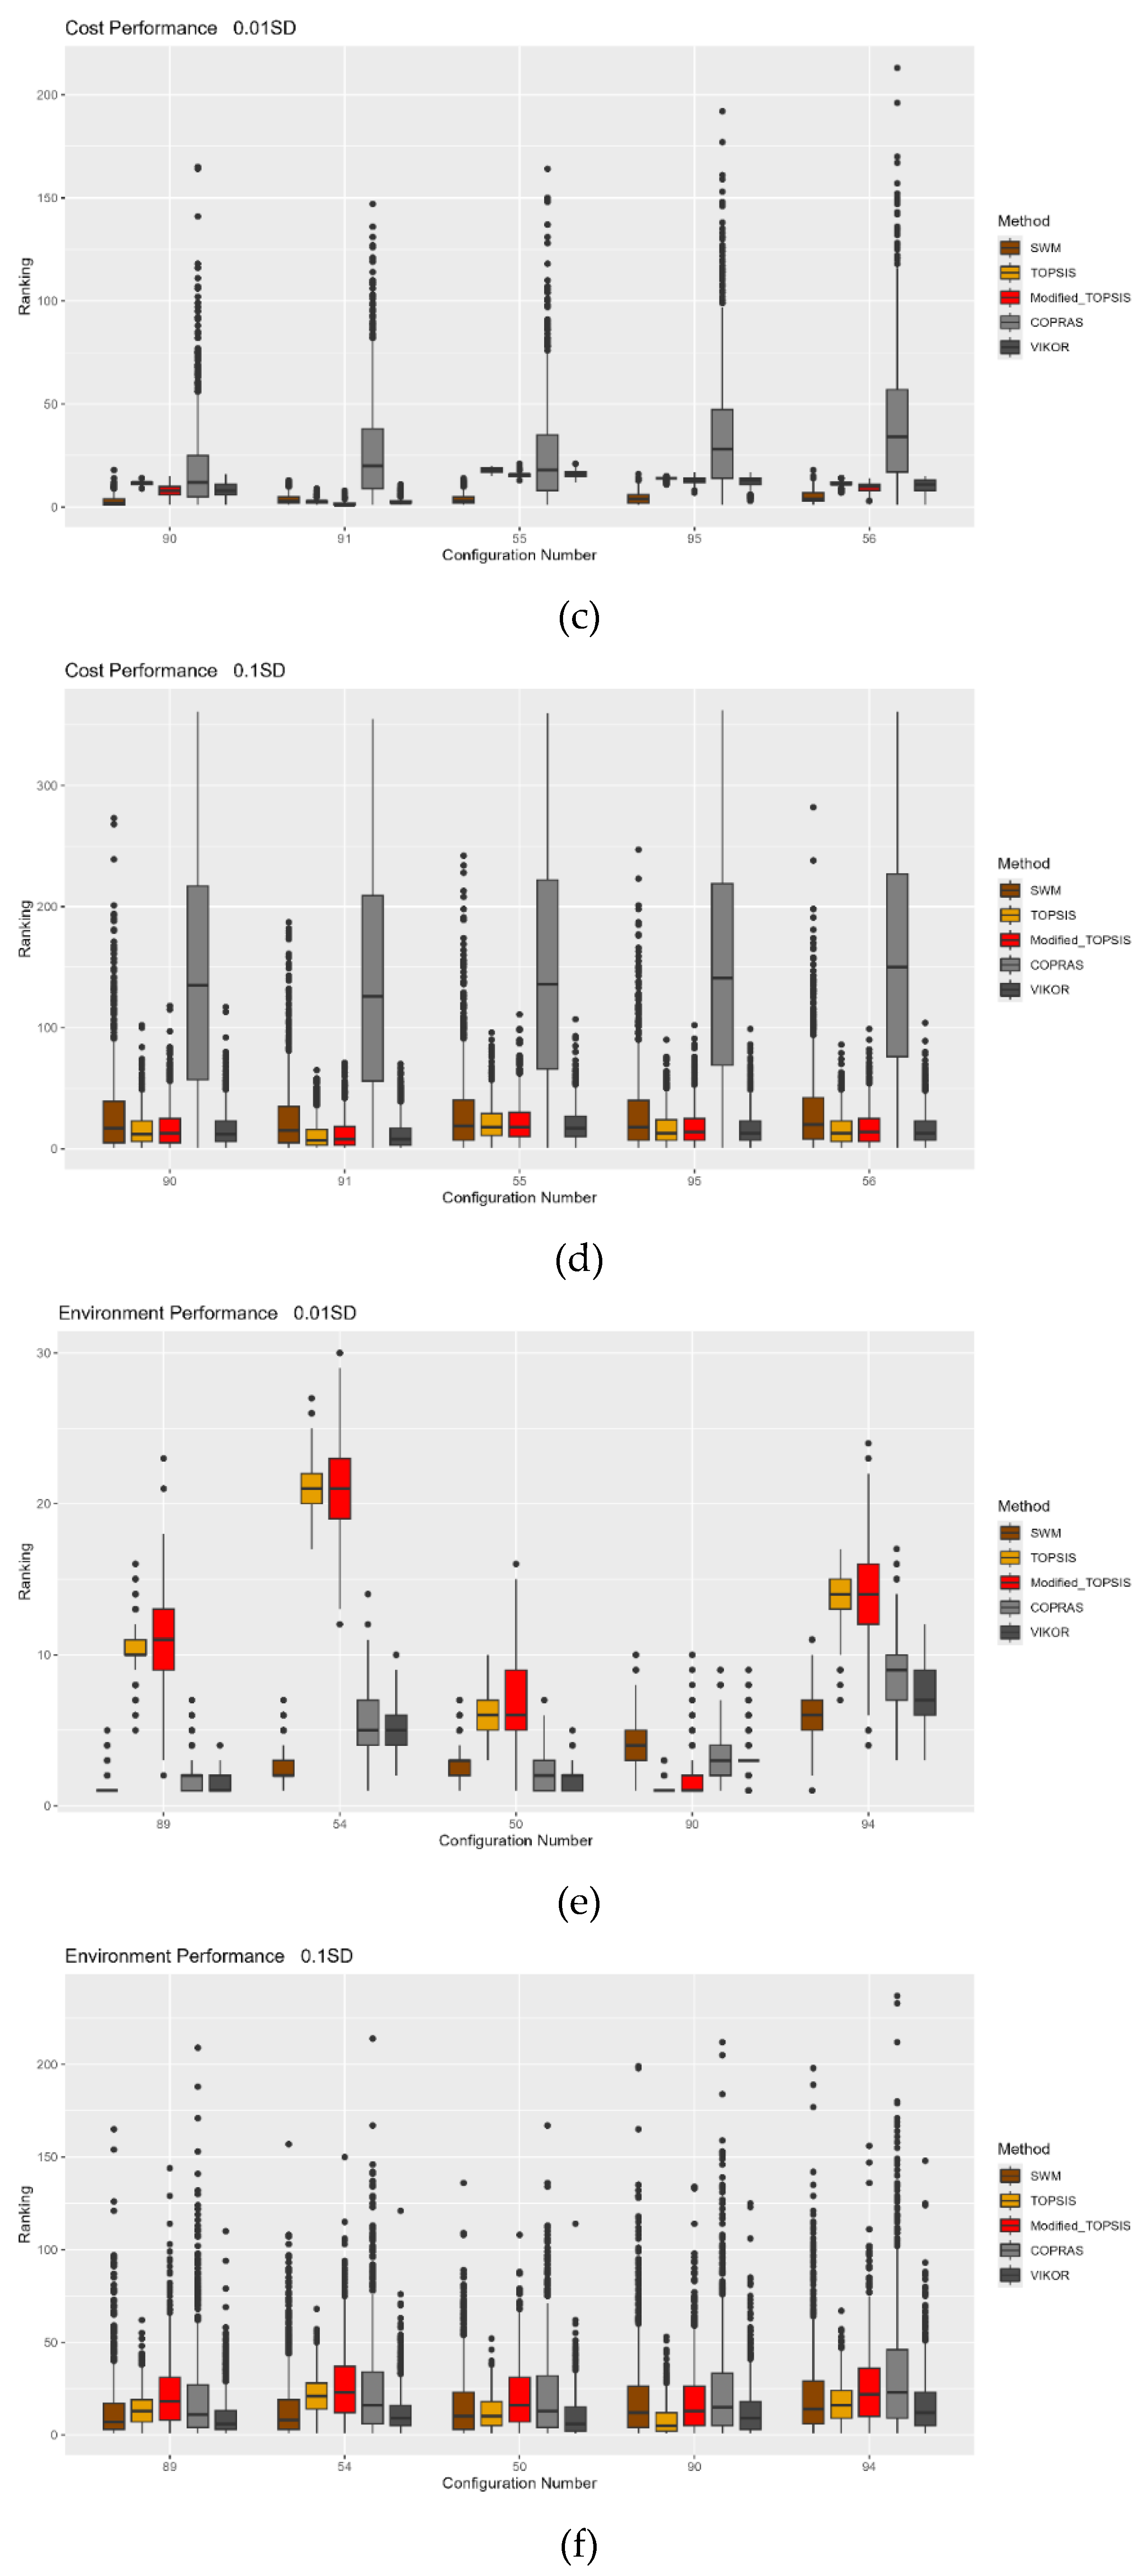
Figure 3.
f: Boxplots of the First Five Ordered Attributes Across Various Normalization Methods for Two Levels of Data Perturbation (1% and 10%), for the equal weights scenario (a, b), cost and performance prioritization scenario (c, d), and environment and performance prioritization scenario (e, f).
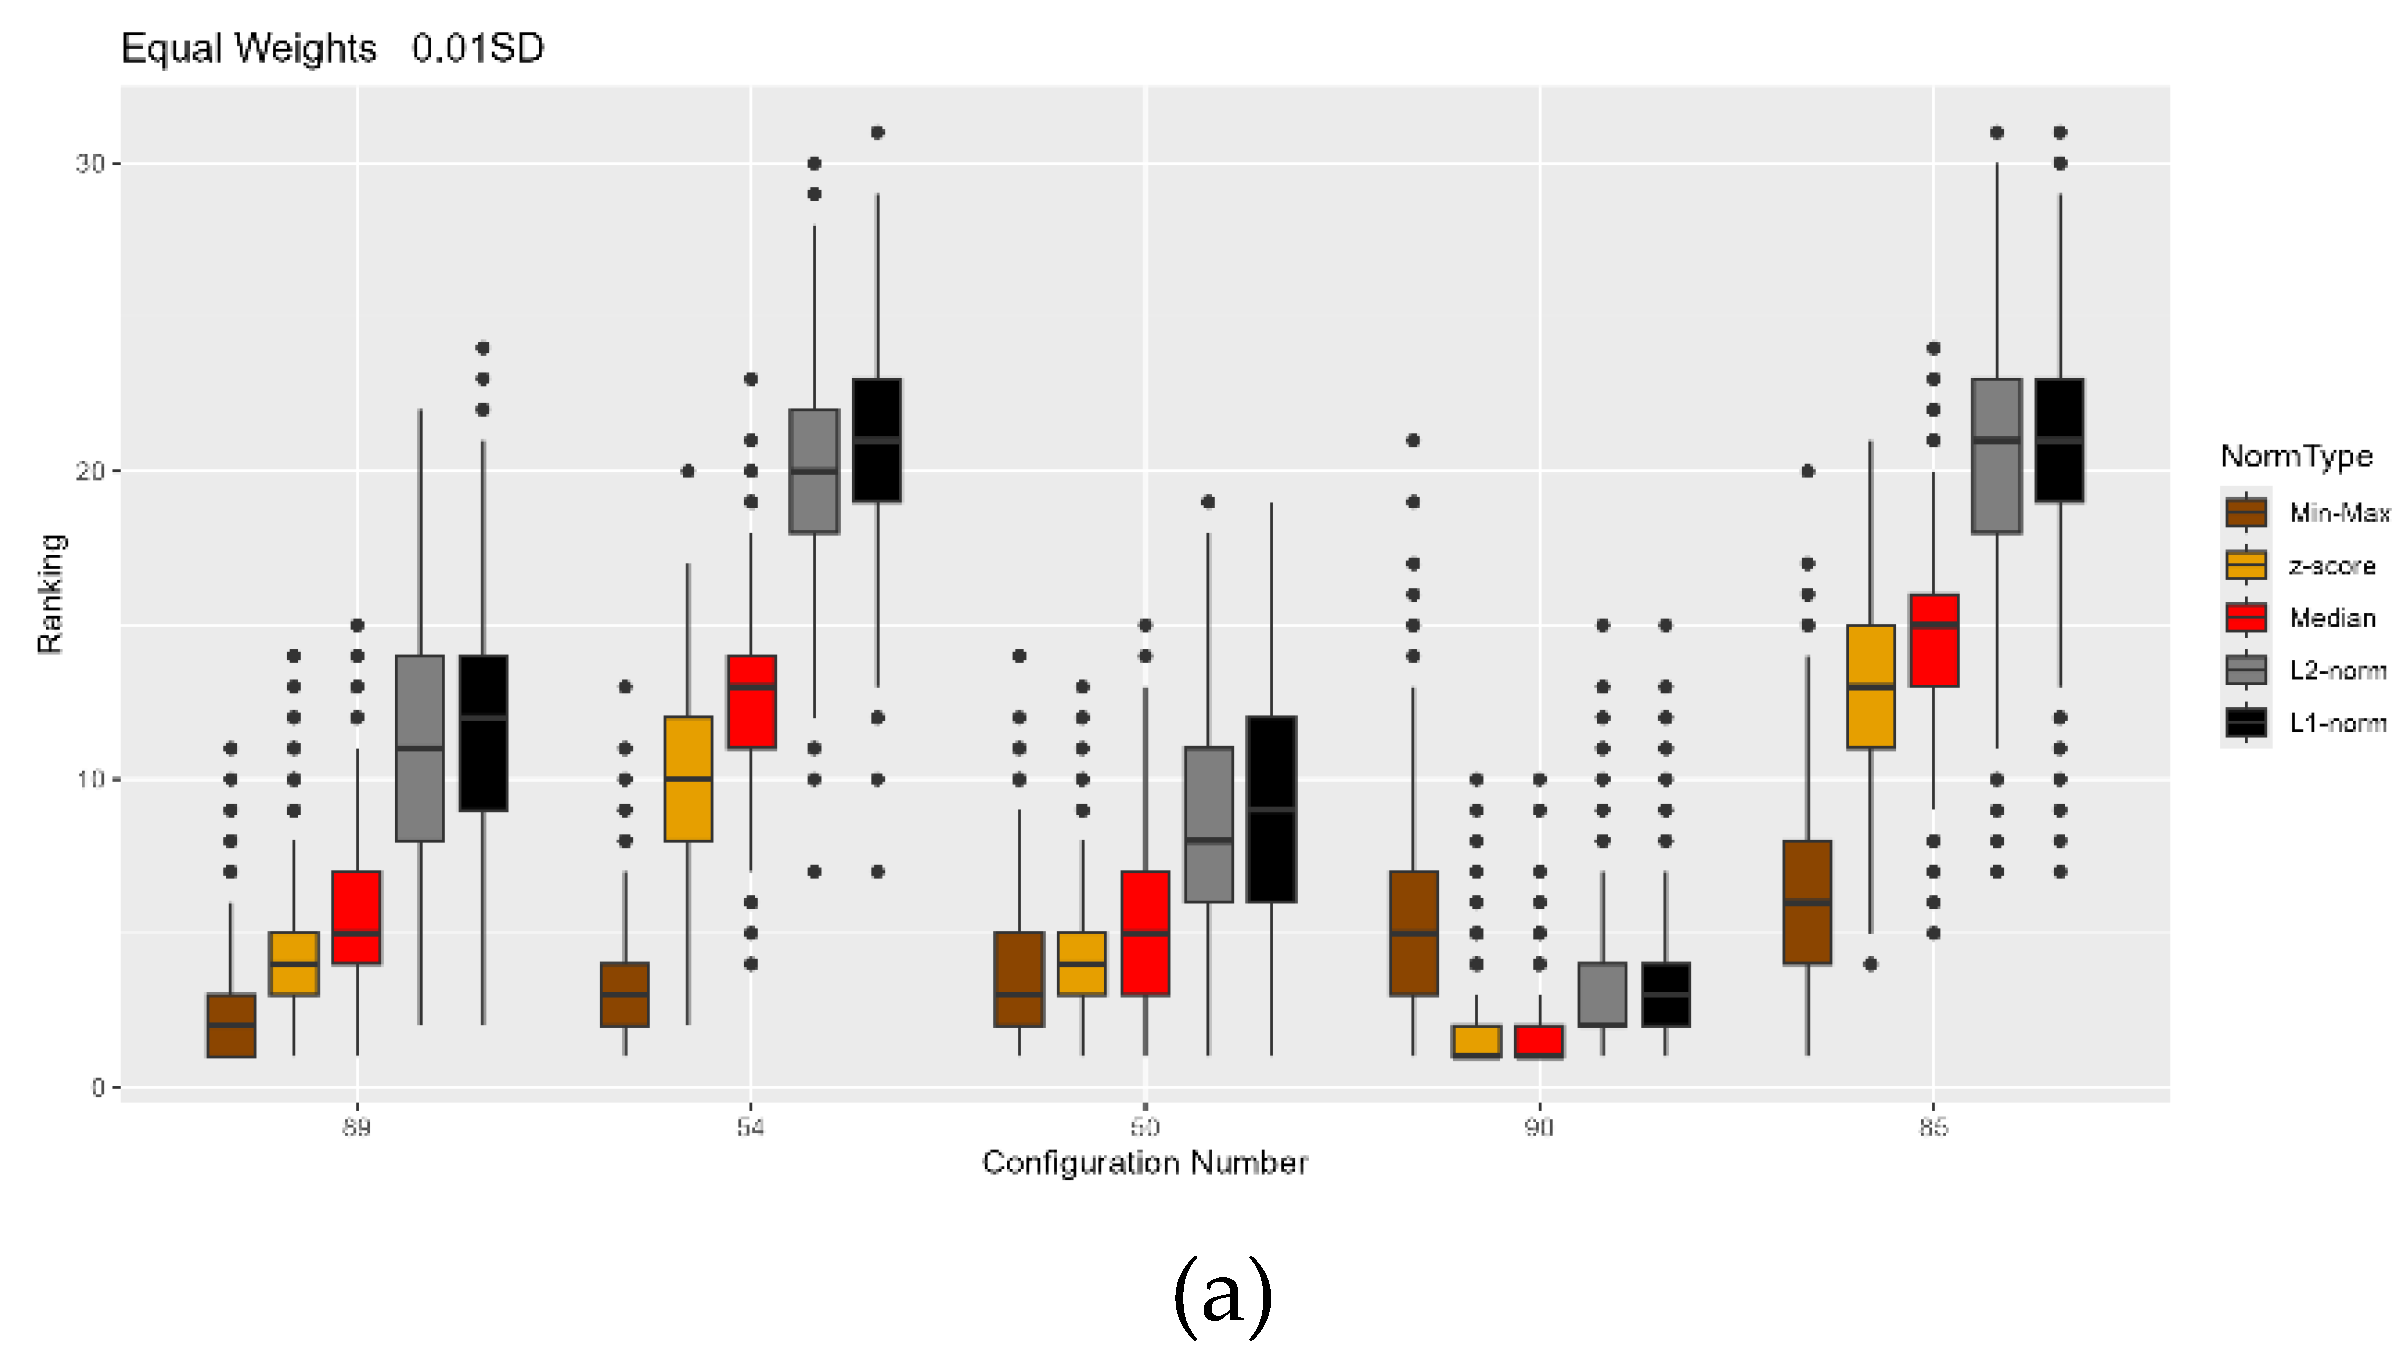
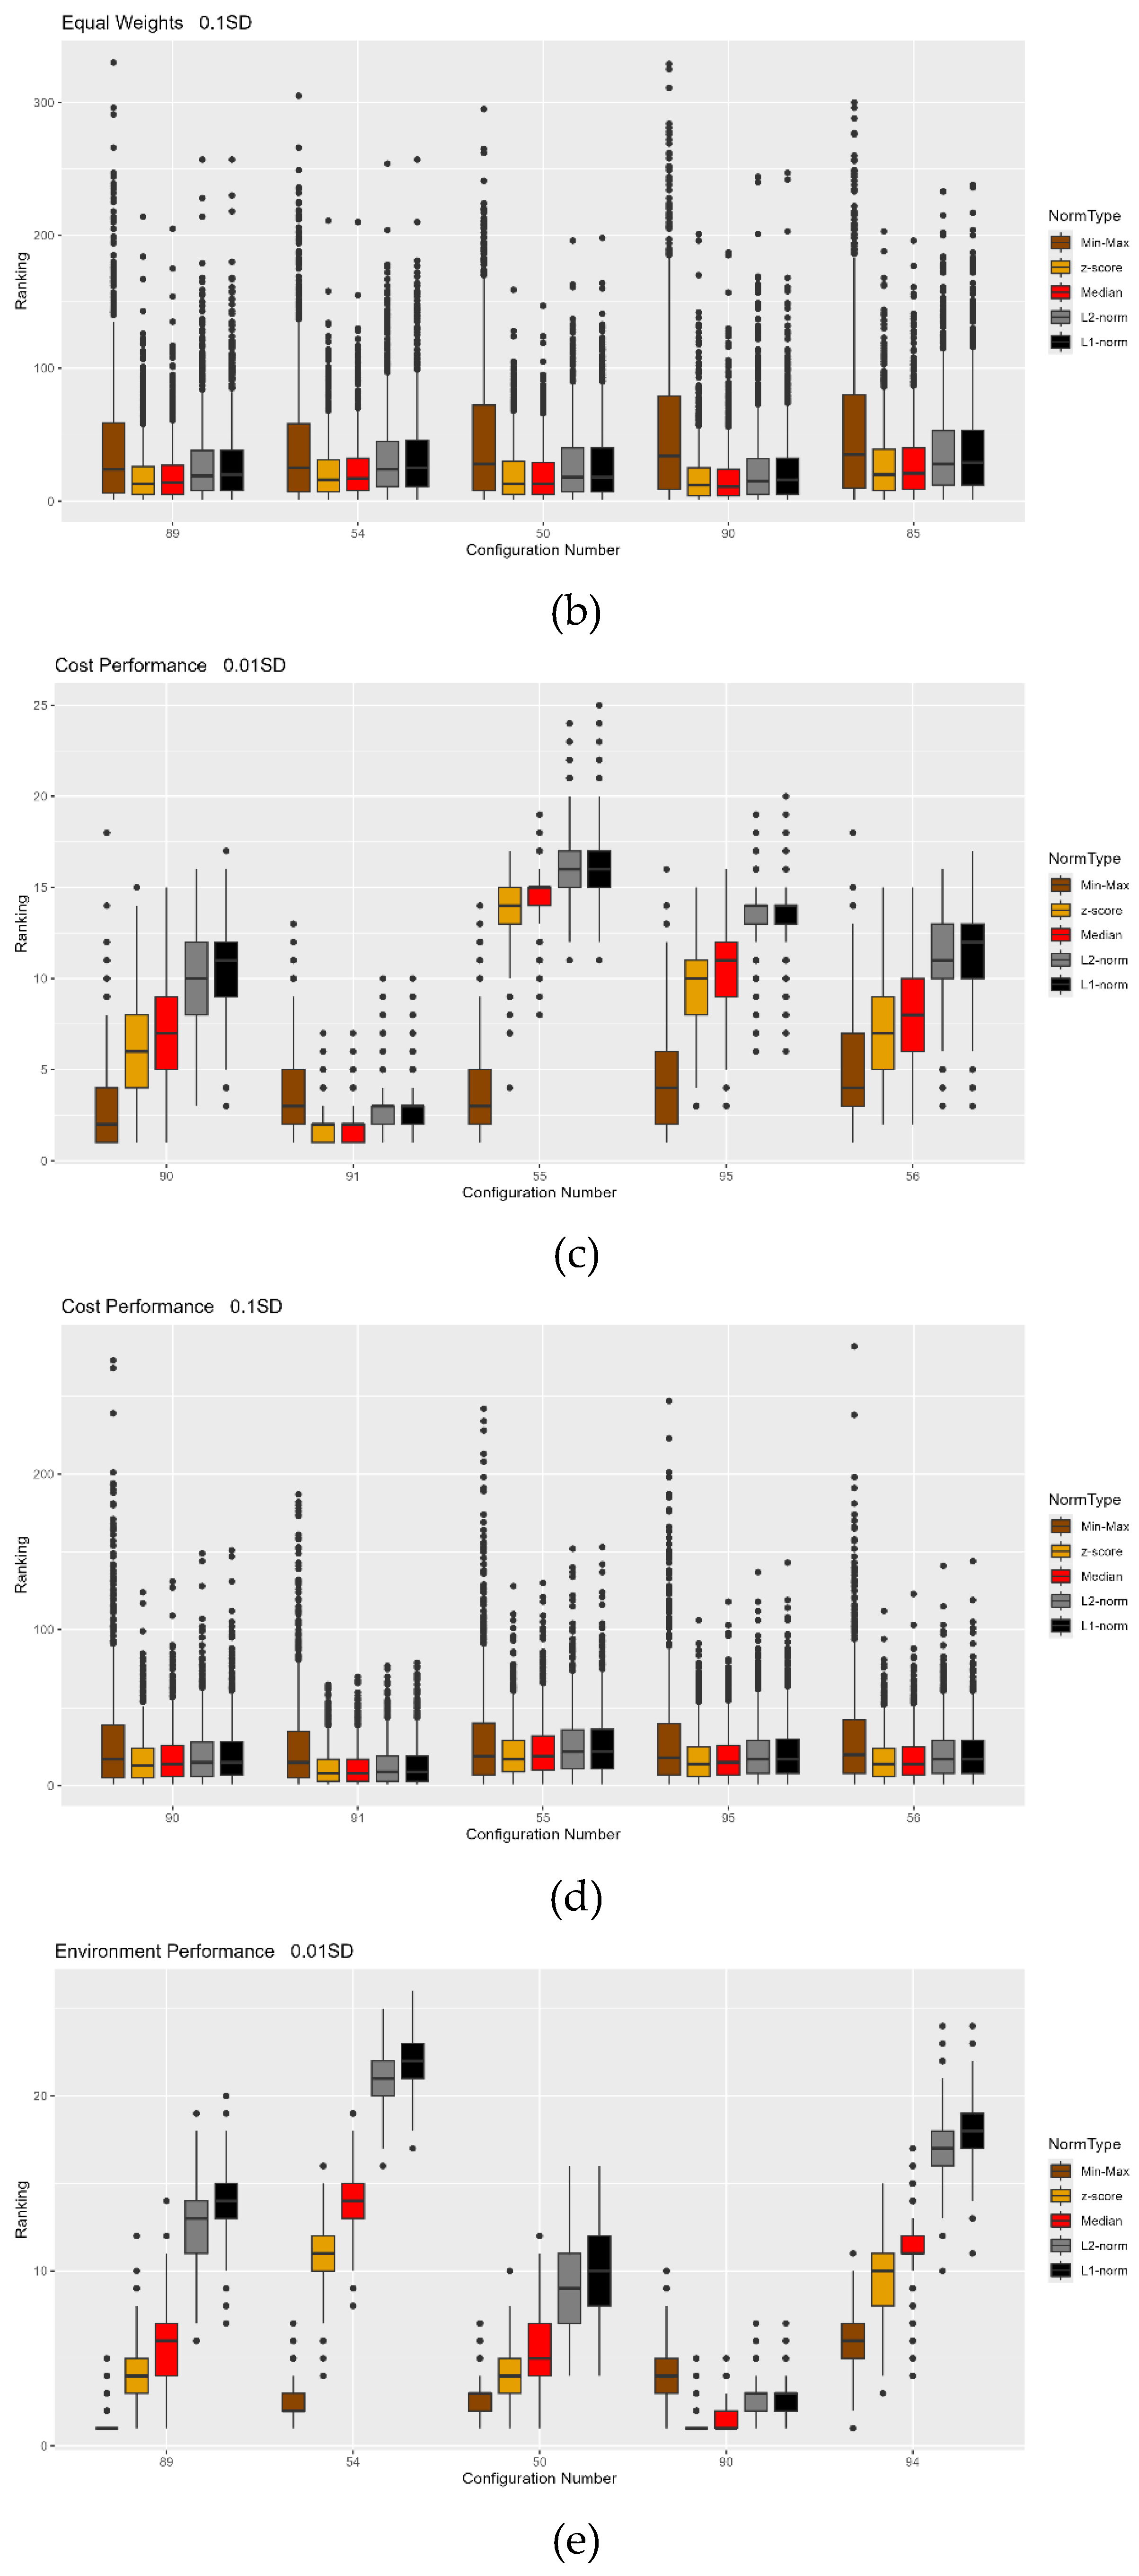
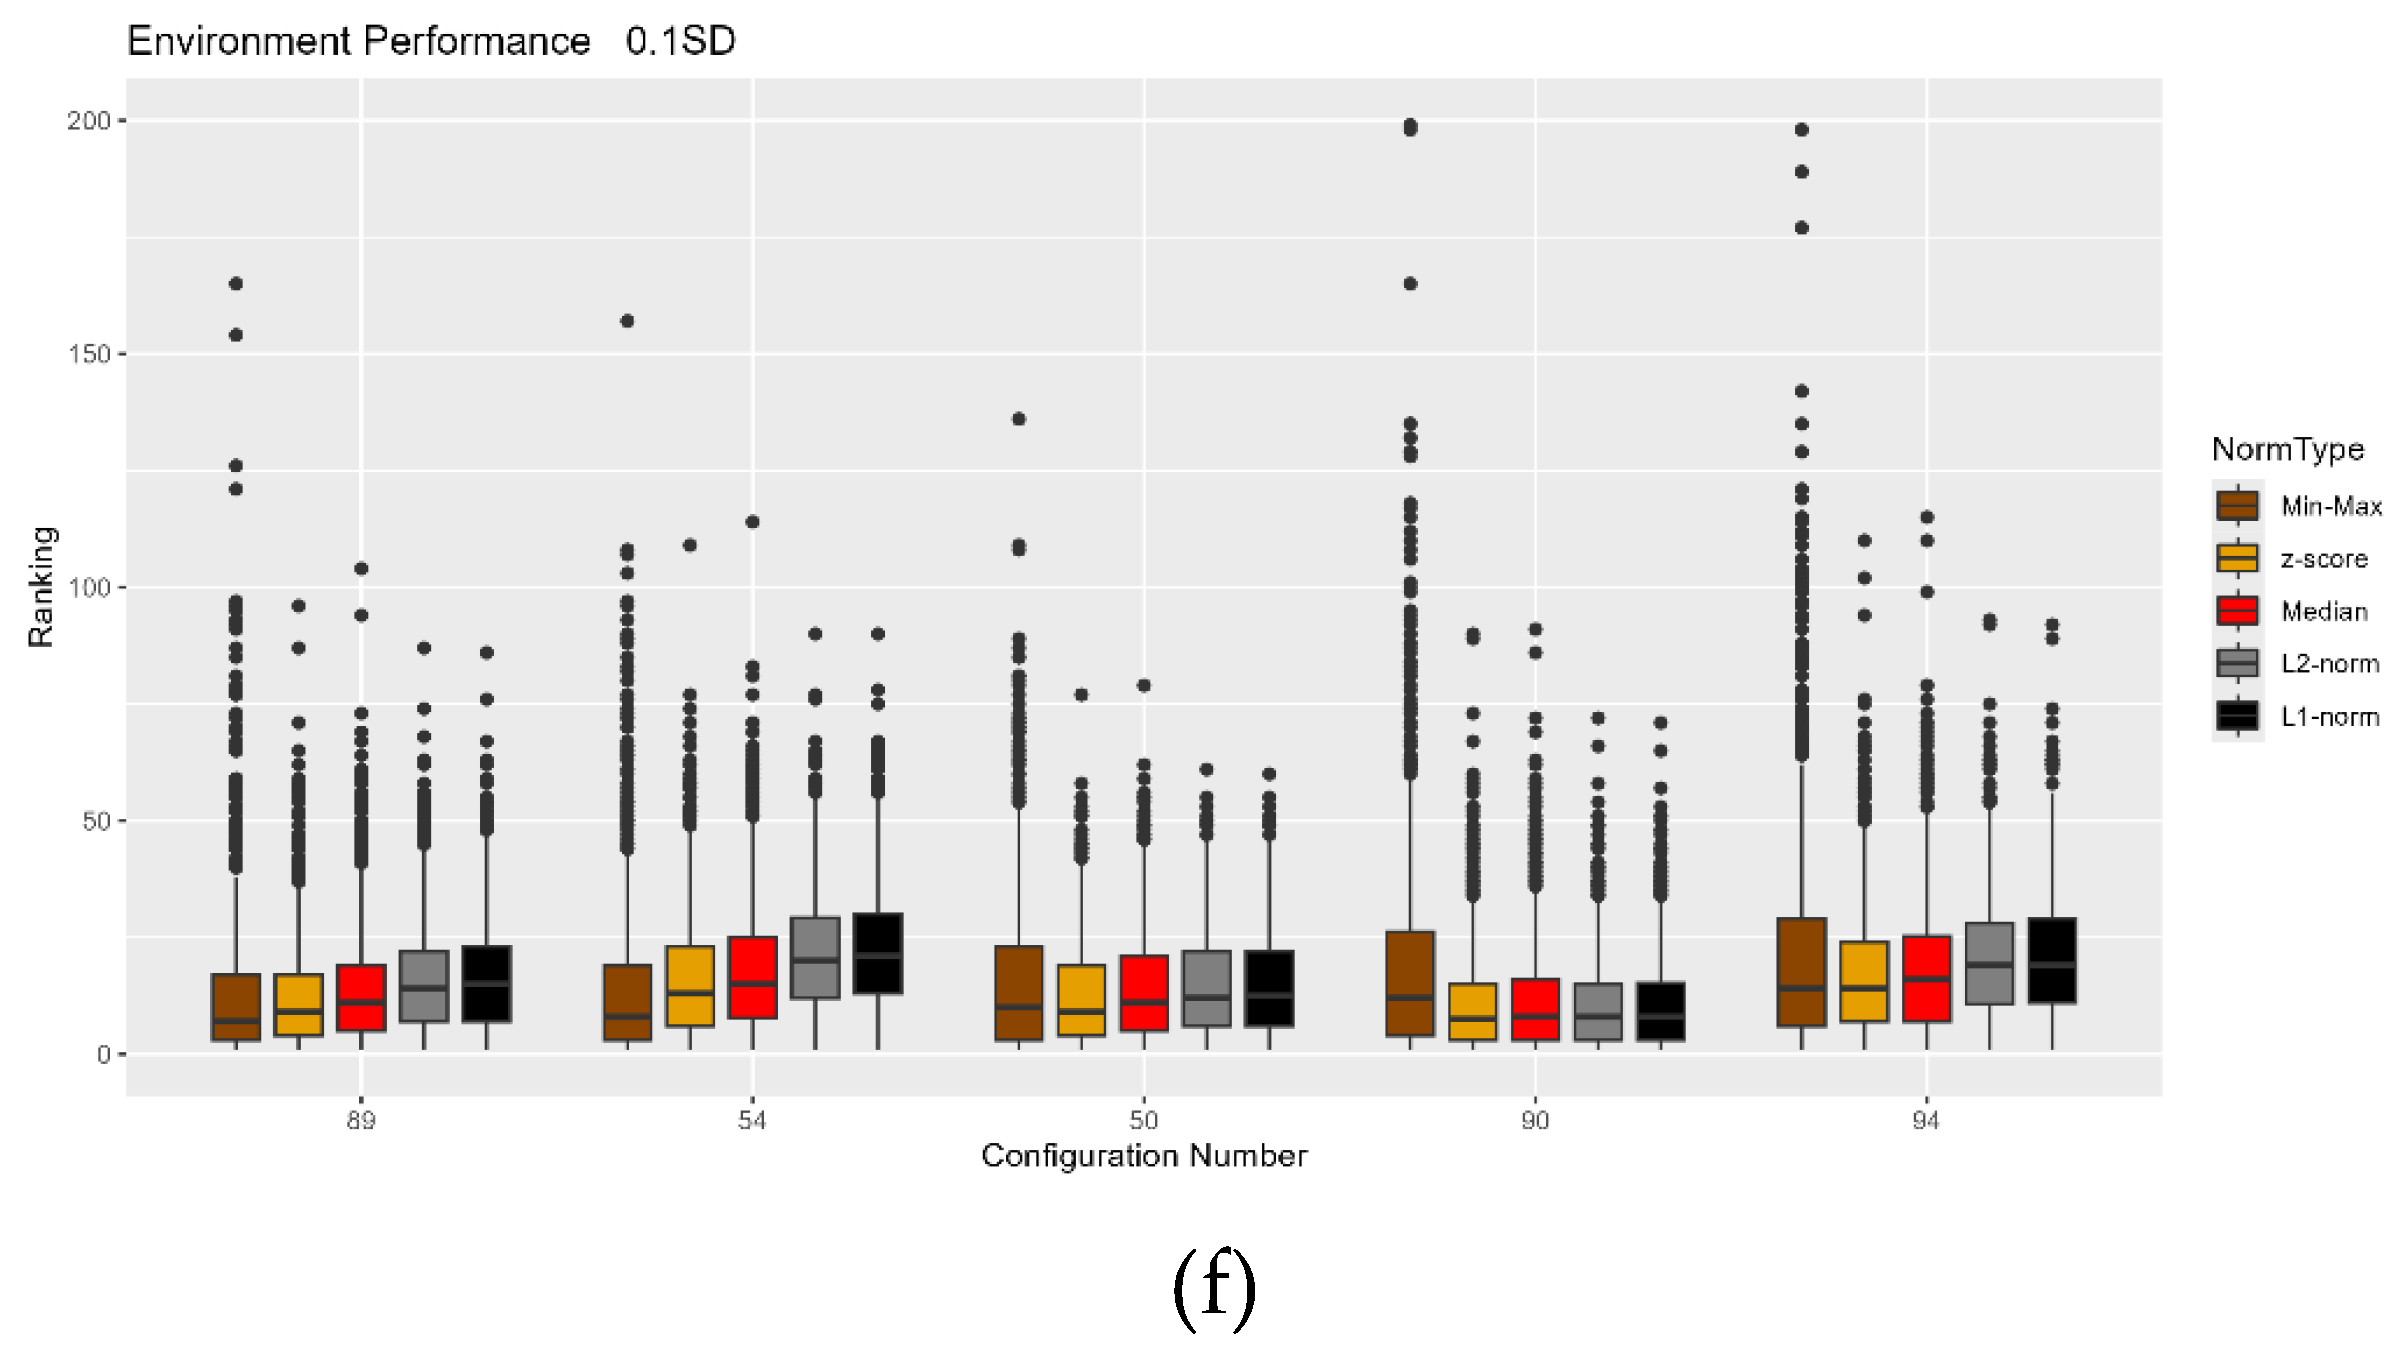

Table 1.
Component’s alternative configurations/material combinations.
| Component Configurations | ||
|---|---|---|
| No | Skin | Stringer |
| 1 | Aluminium 2024 T3 | Aluminium 2024 T3 |
| 2 | CFRP | Aluminium 2024 T3 |
| 3 | Aluminium 2024 T3 | CFRP |
| 4 | CFRP | CFRP |
| 5 | 17-4PH Stainless Steel | CFRP |
Table 2.
Normalization methods considered in the present study.
| Method | for the attribute that needs to be maximized | for the attribute that need to be minimized |
|---|---|---|
| Min -Max | ||
| Z -score | ||
| Robust scaling | ||
| L1 – norm | ||
| L2 – norm |
Table 3.
Ranking of Configurations Using Different MCDM Methods Across Various Sustainability Scenarios.
Table 3.
Ranking of Configurations Using Different MCDM Methods Across Various Sustainability Scenarios.
| Ranking No | Material Combination | SWM | TOPSIS | Modified TOPSIS | COPRAS | VIKOR |
|---|---|---|---|---|---|---|
| Equal Weighting | ||||||
| 1 | AL-AL | 89 | 90 | 90 | 89 | 90 |
| 2 | AL-AL | 54 | 51 | 51 | 50 | 50 |
| 3 | AL-AL | 50 | 91 | 91 | 85 | 91 |
| 4 | AL-AL | 90 | 52 | 52 | 90 | 89 |
| 5 | AL-AL | 85 | 50 | 50 | 54 | 51 |
| 6 | AL-AL | 94 | 55 | 55 | 46 | 55 |
| 7 | AL-AL | 55 | 95 | 95 | 51 | 52 |
| 8 | AL-AL | 123 | 56 | 56 | 123 | 92 |
| 9 | AL-AL | 51 | 92 | 92 | 94 | 54 |
| 10 | AL-AL | 128 | 89 | 89 | 55 | 85 |
| Prioritization to Performance and Costs Terms | ||||||
| Ranking No | Material Combination | SWM | TOPSIS | Mod. TOPSIS | COPRAS | VIKOR |
| 1 | AL-AL | 90 | 92 | 91 | 89 | 92 |
| 2 | AL-AL | 91 | 93 | 92 | 50 | 93 |
| 3 | AL-AL | 55 | 91 | 93 | 85 | 91 |
| 4 | AL-AL | 95 | 97 | 52 | 54 | 52 |
| 5 | AL-AL | 56 | 98 | 96 | 90 | 97 |
| 6 | AL-AL | 94 | 53 | 53 | 46 | 53 |
| 7 | AL-AL | 96 | 52 | 97 | 51 | 96 |
| 8 | AL-AL | 51 | 96 | 57 | 123 | 90 |
| 9 | AL-AL | 89 | 57 | 90 | 94 | 57 |
| 10 | AL-AL | 92 | 58 | 56 | 55 | 98 |
| Prioritization to Performance and Environment Terms | ||||||
| Ranking No | Material Combination | SWM | TOPSIS | Mod. TOPSIS | COPRAS | VIKOR |
| 1 | AL-AL | 89 | 90 | 90 | 89 | 89 |
| 2 | AL-AL | 54 | 51 | 91 | 50 | 50 |
| 3 | AL-AL | 50 | 91 | 51 | 90 | 90 |
| 4 | AL-AL | 90 | 52 | 52 | 85 | 54 |
| 5 | AL-AL | 94 | 50 | 50 | 51 | 85 |
| 6 | AL-AL | 85 | 55 | 55 | 54 | 51 |
| 7 | AL-AL | 55 | 95 | 95 | 91 | 94 |
| 8 | AL-AL | 123 | 56 | 56 | 55 | 55 |
| 9 | AL-AL | 51 | 92 | 92 | 94 | 86 |
| 10 | AL-AL | 128 | 89 | 89 | 86 | 91 |
Table 4.
Pearson’s Correlation Analysis results for the considered MCDM methods.
| Aggregation Method | SWM | TOPSIS | Modified TOPSIS | COPRAS | VIKOR | ||
|---|---|---|---|---|---|---|---|
| Equal Weights | |||||||
| SWM | 1 | 0.866 | 0.866 | 0.958 | 0.948 | ||
| TOPSIS | 0.866 | 1 | 1 | 0.943 | 0.869 | ||
| Modified TOPSIS | 0.866 | 1 | 1 | 0.943 | 0.869 | ||
| COPRAS | 0.958 | 0.943 | 0.943 | 1 | 0.976 | ||
| VIKOR | 0.948 | 0.869 | 0.869 | 0.976 | 1 | ||
| Prioritization to Performance and Environment Terms | |||||||
| SWM | 1 | 0.856 | 0.890 | 0.898 | 0.941 | ||
| TOPSIS | 0.856 | 1 | 0.932 | 0.912 | 0.886 | ||
| Modified TOPSIS | 0.890 | 0.932 | 1 | 0.976 | 0.853 | ||
| COPRAS | 0.898 | 0.912 | 0.976 | 1 | 0.854 | ||
| VIKOR | 0.941 | 0.886 | 0.853 | 0.854 | 1 | ||
| Prioritization to Performance and Costs Terms | |||||||
| SWM | 1 | 0.908 | 0.923 | 0.931 | 0.917 | ||
| TOPSIS | 0.908 | 1 | 0.999 | 0.826 | 0.987 | ||
| Modified TOPSIS | 0.923 | 0.999 | 1 | 0.843 | 0.988 | ||
| COPRAS | 0.931 | 0.826 | 0.843 | 1 | 0.809 | ||
| VIKOR | 0.917 | 0.987 | 0.988 | 0.809 | 1 | ||
Table 5.
Ranking of Configurations Using Different Normalization Methods for the WSM, Across Various Sustainability Scenarios.
Table 5.
Ranking of Configurations Using Different Normalization Methods for the WSM, Across Various Sustainability Scenarios.
| Ranking No | Material | Min - Max | z -score | Median | L2 - Norm | L1 - Norm |
|---|---|---|---|---|---|---|
| Equal Weighting | ||||||
| 1 | AL-AL | 89 | 90 | 90 | 91 | 91 |
| 2 | AL-AL | 54 | 91 | 91 | 90 | 90 |
| 3 | AL-AL | 50 | 50 | 51 | 92 | 92 |
| 4 | AL-AL | 90 | 89 | 50 | 51 | 51 |
| 5 | AL-AL | 85 | 51 | 89 | 52 | 52 |
| 6 | AL-AL | 94 | 55 | 55 | 50 | 93 |
| 7 | AL-AL | 55 | 95 | 92 | 56 | 56 |
| 8 | AL-AL | 123 | 56 | 95 | 93 | 50 |
| 9 | AL-AL | 51 | 94 | 56 | 95 | 96 |
| 10 | AL-AL | 128 | 92 | 52 | 96 | 95 |
| Prioritization to Performance and Costs Terms | ||||||
| 1 | AL-AL | 90 | 92 | 92 | 92 | 92 |
| 2 | AL-AL | 91 | 91 | 91 | 93 | 93 |
| 3 | AL-AL | 55 | 93 | 93 | 91 | 91 |
| 4 | AL-AL | 95 | 96 | 96 | 97 | 97 |
| 5 | AL-AL | 56 | 90 | 97 | 52 | 53 |
| 6 | AL-AL | 94 | 97 | 57 | 53 | 52 |
| 7 | AL-AL | 96 | 56 | 90 | 96 | 98 |
| 8 | AL-AL | 51 | 57 | 52 | 98 | 96 |
| 9 | AL-AL | 89 | 52 | 56 | 57 | 57 |
| 10 | AL-AL | 92 | 95 | 95 | 58 | 58 |
| Prioritization to Performance and Environment Terms | ||||||
| 1 | AL-AL | 89 | 90 | 90 | 91 | 91 |
| 2 | AL-AL | 54 | 91 | 91 | 92 | 92 |
| 3 | AL-AL | 50 | 51 | 51 | 90 | 90 |
| 4 | AL-AL | 90 | 50 | 50 | 51 | 51 |
| 5 | AL-AL | 94 | 89 | 89 | 52 | 52 |
| 6 | AL-AL | 85 | 55 | 92 | 93 | 93 |
| 7 | AL-AL | 55 | 95 | 55 | 56 | 56 |
| 8 | AL-AL | 123 | 56 | 95 | 50 | 96 |
| 9 | AL-AL | 51 | 92 | 56 | 96 | 95 |
| 10 | AL-AL | 128 | 94 | 52 | 95 | 50 |
Table 6.
Pearson’s Correlation Analysis results for the considered normalization methods methods – assuming equal weighting.
Table 6.
Pearson’s Correlation Analysis results for the considered normalization methods methods – assuming equal weighting.
| Normalization Method |
Min - Max | z-score | Median | L2 - Norm | L1 - Norm |
|---|---|---|---|---|---|
| Equal Weights | |||||
| Min - Max | 1 | 0.947 | 0.892 | 0.946 | 0.942 |
| z -score | 0.947 | 1 | 0.990 | 0.996 | 0.996 |
| Median | 0.892 | 0.990 | 1 | 0.983 | 0.984 |
| L2 - Norm | 0.946 | 0.996 | 0.983 | 1 | 1 |
| L1 - norm | 0.942 | 0.996 | 0.984 | 1 | 1 |
Disclaimer/Publisher’s Note: The statements, opinions and data contained in all publications are solely those of the individual author(s) and contributor(s) and not of MDPI and/or the editor(s). MDPI and/or the editor(s) disclaim responsibility for any injury to people or property resulting from any ideas, methods, instructions or products referred to in the content. |
© 2024 by the authors. Licensee MDPI, Basel, Switzerland. This article is an open access article distributed under the terms and conditions of the Creative Commons Attribution (CC BY) license (http://creativecommons.org/licenses/by/4.0/).
Copyright: This open access article is published under a Creative Commons CC BY 4.0 license, which permit the free download, distribution, and reuse, provided that the author and preprint are cited in any reuse.


