
Submitted:
06 January 2026
Posted:
07 January 2026
You are already at the latest version
Abstract
The corrosion behavior and passive-film stability of a β-TiZrNbTa (β-TZNT) alloy were thoroughly examined in artificial seawater (ASW), with a focus on the effects of pH, temperature, immersion time, fluoride ion concentration, and potential scan rate. In addi-tion to electrochemical methods such as open-circuit potential (OCP), potentiodynamic polarization (PDP), and electrochemical impedance spectroscopy (EIS), scanning elec-tron microscopy (SEM) and X-ray diffraction (XRD) were used for surface characteriza-tion. The establishment of a stable and efficient passive layer enriched with Zr-, Nb-, and Ta-oxides was responsible for the β-TZNT alloy's superior corrosion resistance in fluo-ride-free ASW when compared to commercially pure titanium. Reduced passive-film re-sistance resulted from corrosion kinetics being greatly accelerated by decreasing the pH and increasing the temperature. Due to the chemical dissolution of TiO₂ through soluble fluoride complexes, the presence of fluoride ions significantly reduced passivity and in-creased corrosion current densities by more than an order of magnitude. A bilayer pas-sive structure with a compact inner barrier layer and a porous outer layer was identified by EIS analysis. The integrity of this structure gradually decreased as the fluoride con-centration and acidity increased. Over time, passive film degradation predominated in fluoride-free seawater, whereas prolonged immersion encouraged partial re-passivation in fluoride-containing media. Overall, the findings highlight the potential and constraints of β-TZNT alloy for advanced marine and offshore applications by offering new mecha-nistic insights into the synergistic effects of fluoride ions and environmental parameters on corrosion performance.
Keywords:
passive-film
; Ti alloys
; electrochemical impedance spectroscopy
; fluoride ions
; electrode
; polarization
1. Introduction
Corrosion of marine metals remains one of the most significant problems in maritime environments, where harsh conditions such as high salinity, varying pH levels, and low dissolved oxygen accelerate material degradation [1]. Due to its exceptional strength, low density, superior corrosion resistance, and biocompatibility, titanium and its alloys are a promising material for various engineering applications, particularly in the shipbuilding, automotive, aerospace, and biomedical industries [2,3,4,5,6,7]. Their superior performance is primarily due to the spontaneous establishment of a thin, steady, and strongly protective TiO₂ passive film, which exhibits excellent durability in a wide range of aqueous environments [8,9,10,11]. When mechanically or chemically disrupted, this film rapidly re-forms through the reaction of dissolved Ti ions with oxygen, demonstrating a pronounced self-healing ability [7,12]. Consequently, Ti alloys typically withstand broad pH ranges and remain resistant in solutions containing chlorides, sulfates, nitrates, silicates, phosphates, and carbonates [8,9,10,11,13]. However, the protective passive coating can be severely damaged by the presence of fluoride ions (F-) in saltwater, even at low concentrations [13,14,15], leading to severe corrosion of the Ti substrate [16,17]. Among the principal anions in seawater is fluoride, at 1.3 mg/kg on average, which fluctuates substantially with water depth and condition. In recent decades, wastewater discharge into the sea has increased due to increased sand extraction activities. Paper mills and coastal mining operations also play a major role in this trend. Fluoride levels in marine environments have noticeably increased as a result of these combined sources. For example, one bay area near a mine had a dissolved fluorine value of roughly 16.68 mg/kg [18]. Furthermore, localized seawater acidification near metal/biofilm boundaries or cracks may speed up the process by which fluoride ions break down films [19,20,21]. These conditions pose significant concerns for Ti-based components used in seawater systems, including ship structures, desalination units, offshore platforms, and heat exchanger tubing [22,23,24].
Although several studies have examined the way titanium alloys corrode in environments that contain fluoride, most of these works have been carried out under biomedical conditions (such as artificial saliva). Studies on marine or saline environments, where the chemistry and corrosion mechanisms are very different, are far less common. Robin et al. [25] demonstrated that pH and fluoride concentration greatly impact the activation–passivation behavior of Ti-6Al-4V and Ti-23Ta in seawater. Nevertheless, despite these efforts, it is still unclear how the combined effects of pH and F⁻ concentration regulate the passive-film stability and corrosion mechanisms of titanium alloys in seawater. Furthermore, a promising β-TiZrNbTa (β-TZNT) has not yet been thoroughly assessed in saline environments with fluoride ions. Because Zr, Nb, and Ta are extremely biocompatible and corrosion-resistant β-stabilizers that greatly improve the mechanical strength and passive-film stability of titanium, the β-TZNT alloy is particularly interesting [26]. While Zr improves solid-solution strengthening and chloride resistance, Nb and Ta increase nobility and aid in the formation of protective mixed oxides (Nb₂O₂/Ta₂O₂) [27]. These characteristics make β-TZNT a viable option for demanding marine applications, but little is known about how it responds to corrosion in saline environments that contain fluoride.
Therefore, the purpose of this study is to elucidate the corrosion behavior, and underlying mechanisms of β-TZNT alloy in artificial seawater in relation to fluoride ions and pH. Potentiodynamic polarization (PDP), electrochemical impedance spectroscopy (EIS), and open-circuit potential (OCP) are employed to characterize the electrochemical response, while post-corrosion surface morphologies are examined to clarify degradation processes. Mixed-potential theory is further used to analyze the governing anodic and cathodic reactions associated with film passivation and re-passivation. The outcomes of this study contribute to a deeper understanding of passive-film stability in complex saline–fluoride environments and provide valuable insights for designing Ti-based materials with enhanced corrosion resistance for marine applications.
2. Materials and Methods
The β-TZNT's corrosion behavior in an artificial seawater (ASW) using an electrochemical study (The chemical constituents (wt. %) of the β-TZNT alloy are 52.19Ti, 25.43Zr, 10.45Nb, 7.09Ta, 0.39Al, 0.32V, 2.55C, 1.58N, and for Ti is 98.9Ti, 0.3Al, 0.68C, 0.12Si). The electrodes were prepared by employing epoxy cold glue to attach the alloy, leaving 1.0 cm2 of the electrode surface exposed to ASW. Fine sandpaper of different grades, from 500 to 800 and 1200, was used to polish them. Distilled water and acetone are used to clean the electrodes. After a minute of activation in 1.0 M HF, the electrodes are rinsed with double-distilled water to thoroughly clean. In every experiment, measurements were made using freshly made ASW at pH 6.5. Following ASTM D1141-98 [28]. Chemical composition of the ASW is (5.20 MgCl2, 24.53 NaCl, 1.16 CaCl2, 4.09 Na2SO4, 0.201 NaHCO3, 0.695 KCl, 0.101 KBr g/L). When necessary, HCl was used to change the pH of the ASW to 2.0, 3.0, 4.0, and 6.5. Furthermore, by varying the amount of NaF, various F- concentrations (0, 0.005, 0.0075, and 0.01 M) were obtained in ASW [15,29]. For potential measurement, a Pt wire was used as the counter electrode and Ag/AgCl as the reference electrode. The electrode specimens used as the working electrode in the electrochemical study were Ti and TZNT electrodes (provided by the Japan Coating Center Co., Ltd.). For the electrochemical investigation, a Potentiostat/Galvanostat/ZRA, a1000-Gamry device was used. Each electrochemical parameter was determined using the Echem Analyst (Version 6.11) software from Gamry Instruments. After 30 minutes of submersion in ASW, the EIS diagrams were produced over a frequency range of 100,000 Hz to 10.0 mHz and an amplitude of 5 mV peak-to-peak. The PDP curves were made with a scan rate of 5 mV s−1 within a potential range of − 0.8 to + 1.0 V. To determine the samples' corrosion resistance, electrochemical investigations were assessed using the approved test methods. To ensure reproducibility, each test was run three times. The sample surface morphology under test was examined using the JEOL JEM-1200EX II Electron Microscope, a form of scanning electron microscopy (SEM). CuKα radiation (λ = 1.54045 Å) was used in an X-ray diffraction examination (Pana-lytical Empyrean, the Netherlands) with an accelerating voltage of 40 kV and current of 35 mA.
3. Results and Discussion
3.1. Potentiodynamic Polarization (PDP) Curves
The PDP curves of TZNT alloy and Ti specimens, for comparison, in an ASW under identical circumstances at 25°C, are displayed in Figure 1. The potentials were measured from -0.80 V, where hydrogen evolution is dominant, to 1.0 V with a 5 mVs-1 scan rate. Each sample exhibits active-passive behaviour. Both the Ti and the TZNT alloy show a wide passive region that reaches +1.0 V, suggesting the development of a persistent coating of passive oxide and the lack of pitting corrosion. The absence of any detectable pitting over the entire potential range examined confirms that these materials maintain a stable passive film and possess high localized corrosion resistance in seawater. The corrosion behavior was detected using the Epass (potential of passivation), ipass (current of passivation), for TZNT alloy and Ti, respectively (Table 1). The electrochemical corrosion parameters listed in Table 1 were used to determine the polarization resistance (Rp) of TZNT alloy and Ti corrosion using Eq. (1) [30].
Rp = 1/Icorr [βc×βa/ 2.303 (βc+βa)] (1)
The parameters of electrochemistry tabulated in Table 1 demonstrate that the TZNT alloy has the lowest Epass and ipass, while that of Ti has the highest Epass and ipass.
The results reveal that in an ASW solution, Ti shows a larger Icorr and lower Rp, whereas TZNT alloy has a higher Rp and lower Icorr. This indicates that at 25°C, the TZNT alloy has the best corrosion resistance in ASW. The TZNT alloy's β-type microstructure, which promotes passive-film formation and moves the corrosion potential toward more noble (positive) values, is responsible for its corrosion resistance. The alloy's enhanced overall corrosion performance is probably a result of this β-phase stability [11] . It is evident from the earlier data that the presence of Ta, Nb, and Zr greatly boosted the corrosion resistance of the TZNT alloy, in contrast to titanium in ASW [31].
3.2. Electrochemical Impedance Spectroscopy (EIS)
Bode graphs are shown in Figure 2a. The Zmod (value of the impedance modulus) at the lower frequency of the TZNT alloy (39.81 kΩ cm2) is greater than that of the Ti (17.37 kΩ cm2), indicating an improved corrosion resistance of the protecting oxide film of the TZNT alloy in ASW. Additionally, the fact that TZNT alloy has a larger phase angle value (− 77.46◦) than titanium (− 70.09◦) suggests that TZNT alloy has a more protective passive film in ASW. Figure 2b displays the Nyquist plots of the titanium electrode and TZNT alloy following a half-hour immersion in an ASW at 25°C. Due to the dispersion of frequencies, all of the curves in Figure 2b are shown as depressed semicircles [32]. This result implies that the corrosion mechanisms in both samples are dominated by charge-transfer reactions rather than diffusion-controlled processes.
The EC depicted in Figure 3 was used to create a full data set match that functions for all specimens (Ti and TZNT alloy). We have looked at the impedance spectra obtained using several electrical circuit models. The electrolyte resistance (Rs), oxide film-electrolyte interface resistance and constant phase elements, respectively, (Rp and CPEp), and bulk titanium alloy resistance and constant phase elements (Rb and CPEb) comprise this EC. To achieve excellent comparability between the simulated and experimental data, the CPE (constant phase element) was utilized in the fitting procedure instead of pure capacitors. The CPE impedance was estimated using [33].
ZCPE=[C(jω)n]-1 (2)
where n is associated with an uneven current distribution because of the surface’s roughness or inhomogeneity, C is the capacitance, and ω is the angular frequency. The exponent values n1 and n2 are almost equal to 1.0. Table 2 reports the basic EC parameters (Rs, Rb, CPEb, Rp, and CPEp) for all specimens examined. For every specimen in ASW, the polarization resistance Rp was calculated as the sum of Rp + Rb on each impedance diagram in the Nyquist form [34]. Nyquist draws (Figure 2b) revealed that the Rp for the TZNT alloy soaked in ASW (50.81 kΩ cm2) is higher than that for the Ti (19.17 kΩ cm2), indicating an enhanced corrosion resistance of the protective oxide of the TZNT alloy in ASW.
3.3. OCP Measurements
Figure 4 illustrates the changes in the OCP of the TZNT alloy and Ti electrode in ASW at pH 6.5 and 25°C. Materials can be evaluated for nobility by comparing their OCP values [32,35] where superior corrosion resistance is typically indicated by a higher (more noble) open-circuit potential. The OCP rise in the positive direction at a particular time indicates that each sample is vulnerable to the formation of passive oxide layers. The TZNT alloy showed a more positive OCP (−0.070 V) than the Ti sample (- 0.288 V), demonstrating its superior corrosion resistance and higher passive state stability. The PDP results are consistent with the OCP steady-state potential, highlighting the order in which the samples’ long-term corrosion resistance declines. In this respect, the TZNT alloy performs better than Ti.
3.4. Effect of pH
3.4.1. PDP Curves
Figure 5 displays the PDP curves of the TZNT alloy at various pHs in ASW. The PDP curves for the various pH values demonstrated a well-known active–passive behavior. A drastic decrease in the corrosion resistance of the TZNT alloy specimen, or an increase in the rate of corrosion, is shown by the i/E curves being shifted towards a less noble potential with lowering pH. According to Table 3, the Icorr is 1.30 μA cm⁻² at pH 6.5, but it increases significantly at pH 4.0 (4.66 μA cm⁻²), pH 3.0 (8.89 μA cm⁻²), and pH 2.0 (41.4 μA cm⁻²), suggesting a progressively faster rate of corrosion (~ 31 times higher) under increasingly acidic conditions.
Furthermore, the passive current density (ipass) measured at 235 mV at pH 6.5, 4.0, 3.0, and 2.0 is comparatively stable, with values of 0.041, 0.080, 0.085, and 0.089 mA cm⁻², respectively, suggesting that the alloy maintains a protective passive film even as the environment gets more acidic. This shows that the passive oxide film dissolves quickly in acidic environments, but its rate of degradation is much slower close to neutral pH (6.5), indicating the strong dependence of oxide stability on the pH of the surrounding solution. Despite the limited passivity domain at pH 6.5, the oxide film is highly stable and effectively protects the alloy surface from seawater. The passivity domain is longer at lower pH values, but it has a penetrable, non-protective thin oxide layer that is unable to shield the alloy. This could be explained by the passive layers being harmed by the ASW’s chloride ions.
3.4.2. Electrochemical Impedance Spectroscopy (EIS)
EIS at Ecorr measurements were performed in ASW with varying pH levels (Figure 7a, b). According to the Bode plot (Figure 7a), the phase angle in seawater at pH 6.5 was approximately −77.43 ° between 0.5 and 2.5 Hz, spanning a broad frequency range. On the metal surface, a stable passive oxide layer had formed, which is the reason for this. As we go closer to the lower pH levels, or pH 4.0, 3.0, and 2.0, the phase angle’s height and width diminish, signifying a drop in the resistance of the surface layer and its impact on the impedance. The equivalent circuit shown in Figure 3 was applied to match the experiment’s outcomes. Rs represents the resistance of the ASW solution, and the resistance and capacitance of the passive barrier layer on the TZNT alloy’s surface are denoted by Rb and CPEb, respectively. The values of Rs, Rb, CPEb, and n according to the model’s fit are shown in Table 4. As the ASW solution gets more acidic (pH 6.5, 4.0, 3.0, and 2.0), the EIS results for the TZNT alloy show a progressive decrease in oxide-layer resistance. These results are consistent with those derived from the PDP data.
3.4.3. OCP Assessments
Figure 8 displays the OCP of the TZNT alloy with time at various pH levels in ASW. Compared with pH 4.0, 3.0, and 2.0, the OCP measured at pH 6.5 exhibits a more positive potential. The trends require some time to reach a steady condition. This might result from the development of a novel passivation film that slows down the rate of OCP change in ASW. A balanced state was reached when the potential stabilized and the protective (passive) layer disintegrated [36]. The OCP quickly increases to a higher positive potential at pH 6.5, suggesting that it might quickly re-passivate. The steady-state potential of the passive layer created at pH 6.5 and those formed at lower pH differ significantly, according to the acquired results. For instance, the steady-state potential is −0.070 V at pH 6.5, compared with −0.076 V, −0.085 V, and −0.104 V at pH 4.0, 3.0, and 2.0, respectively. This shift in the negative trend at lower pH was probably caused by the thinning of the passive film that followed the early dissolution of the local passivation layer on the TZNT alloy surface.
3.5. F- Ion Concentration’s Effect
3.5.1. PDP Curves
Due to its low polarizability and high electronegativity, the F- ion possesses a great affinity. The F-, which is easier to adsorb on the titanium alloy and has a smaller radius than Cl-, occupies the oxygen vacancies in the passive film as opposed to other halide ions. Because TiF62− and TiF63− complexes form at low pH, it particularly speeds up the cathodic and dissolving rates of TZNT alloys under the combined influence of F− and H+ [37]. This is believed to be caused by the intense dissolving of materials by the F− ions. Figure 9 displays the PDP curves of TZNT alloy at various concentrations of F- ions in ASW at pH 6.5. As fluoride ion concentration increases, both the corrosion current density (Icorr) and the corrosion potential (Ecorr) increase, which is obtained when the cathodic and anodic reaction rates are equal, advancing toward a more negative potential. The electrochemical parameters that were found are shown in Table 5. A propensity to create a passive film is indicated by the values of ipass, Epass, Icorr, and Ecorr; the lowest values imply straightforward and efficient passivation. The TZNT alloy specimen submerged in ASW with 0.01 M F- ions exhibits corrosion rates that are 36 times higher than those without F- ions. This indicates that the shielding oxide film has degraded in solutions with high F- ion concentrations and acidity [35,38]. Because fluoride ions can dissolve the passive TZNT layer entirely or partially into a porous material by creating a soluble compound of TiF6 2-, the concentration of fluoride ions increases, and the corrosion resistance of the TZNT alloy decreases. When F- ions are present, the chemical dissolution mechanisms of the protective compact passive film mainly match the chemical dissolution of TiO2.
3.5.2. Electrochemical Impedance Spectroscopy (EIS)
The TZNT alloy was submerged in ASW at pH 6.5 and with different fluoride ion concentrations for 30 minutes after undergoing EIS studies at open circuit potentials. In the absence of fluoride ions, bode plots exhibit significant capacitive behavior with phase angles of approximately 77.43°, and a linear slope of −1 in log |Z| as a function of log (f) in the low and middle-frequency range suggests a relatively stable and compact passive film on the TZNT surface [39,40]. The maximum phase angles in Bode plots (Figure 10a) decrease from approximately -77.43° to -73.4° as they move somewhat to the higher frequency area, and the Zmod sharply drops from 39.81 to 10 kΩ cm2 when the fluoride ion concentration increases from 0 to 0.01M, indicating the film’s declining corrosion resistance. According to L. V. Taveira et al. [41], the film in 1 M (NH4)2SO4 electrolytes containing 0.5 weight percent NH4F consists of an inner layer of TiO2 and an exterior layer of Ti(OH)4. They also clarified the formation of a porous structure. The presence of fluoride ions causes the oxide film to randomly disintegrate and decompose. Owing to the proof of the oxide film’s bi-layered structure on titanium surfaces, several researchers [40,42,43,44,45] adopted this framework to explain titanium’s film characteristics in corrosive liquids. These findings attribute the bi-layered structure of the oxide film formed on the TZNT surface to the overall passive-film behavior and the corresponding EIS responses. Throughout the various ASW conditions examined, the suggested model verifies the existence of an outer porous layer and an inner compact barrier layer. Nyquist plots (Figure 10b) show that the width of capacitive semicircles dramatically decreases as the number of F- ions increases, indicating a drop in corrosion resistance. Compared to pH 6.5/0.005M, pH 6.5/0.0075M, and pH 6.5/0.01M, the impedances of pH 6.5/0M fluoride ions are substantially higher. These results demonstrate that the alloy’s resistance to corrosion decreases as fluoride ion concentrations rise. The amplified effects of F− on TZNT alloy corrosion in ASW solutions are therefore quantitatively demonstrated by the EIS results. This result is in line with the results of the potentiodynamic polarization experiments. Excellent agreement with the measured spectra is shown by this bi-layer configuration, which reproduces experimental impedance data in both the active and passive regions (Figure 10a,b). The values of Rs, Rb, CPEb, Rp, and CPEp that resulted from fitting the experimental impedance data of the TZNT alloy in ASW with different fluoride ion concentrations are listed in Table 6 (Figure 10). When TZNT alloy exhibits remarkable corrosion resistance (high impedance values), such as at pH 6.5 and 0 M fluoride ions, it displays compact inner film resistance (Rb) and porous outer film resistance (Rp). This implies that Rb is significant, demonstrating that the passive film can remain compact and undamaged, serving as a corrosion barrier layer in ASW without fluoride ions. When fluoride ion concentrations are high (pH 6.5/0.01M), the small film’s relatively low resistance demonstrates that the TZNT alloy has no corrosion resistance. The porous outer (CPEp) and compact inner (CPEb) films’ capacitances rise as F-ion concentration rises, indicating that the dissolution is the reason for the two oxide films’ diminishing thickness. CPEb is higher than CPEp in the pH and fluoride ion concentration parameters ’nder investigation, indicating a compact and dense layer rather than a porous outer coating. It was revealed that the dissolution of TZNT alloy was caused by the presence of other metals [46] and HF and HF2− species in an acidic fluoride environment, rather than fluoride ions [47].
HF ⇌ H+ + F- (3)
HF−2 ⇌ HF + F− (4)
K1 = [ H+] [F−] ∕ [HF] = 1.30 × 10⁻³ mol L−1 (5)
K2 = [ HF] [F−] ∕ [HF-2] = 0.104 mol L−1 (6)
[Total F] = [F−] + [HF] +2[HF-2] (7)
3.5.3. OCP Measurements
Figure 12 shows the results of an analysis of the presence of different fluoride ion concentrations (0–0.01 M) at pH 6.5 and the change in the OCP values of the TZNT electrode with immersion time in ASW. The results show that the environment with and without F⁻ ions had significantly different OCP values. Over time, the corrosion potential increased to higher potential values due to film formation on the TZNT alloy surface before achieving steady-state potential values (after 1.0 h) at nearly −0.070, −0.197, −0.255, and −0.316 V, which correspond to 0, 0.005, 0.0075, and 0.01 M of F- ions, respectively. Every sample exhibits an increase in the OCP in the higher positive potential, culminating at a particular period, and indicating that they are all vulnerable to oxide (s) film formation (passivation).
3.6. Effect of Temperature
Oxygen diffusion quickens as the experimental medium’s temperature rises because the concentration of dissolved oxygen decreases and the diffusion coefficient and total mass-transfer coefficient rise in tandem. Consequently, the passivation film forms rapidly as the temperature rises. But when temperatures rise, other corrosive ions also spread more quickly. On the other hand, because of the high solubility and slow diffusion rate of oxygen and other particles, passivation film growth is slow but has good corrosion resistance at lower temperatures. The PDP curves of TZNT alloy in ASW at various solution temperatures (298–338 K) are shown in Figure 13. According to the results, the polarization curves shift in a more negative direction, and the Icorr significantly increases when the temperature rises from 298 K to 338 K. This suggests that the TZNT alloy dissolves more quickly at higher solution temperatures. The rise in Cl- ion adsorption on the passive layer may also be the cause of this [48] and an increase in the rates of diffusion and migration of reactants and products into and out of pits. Additionally, Table 8 data demonstrates that there is a movement in the Ecorr values to more negative values while the Icorr values are considerably increased. As a result, increasing the solution’s temperature has a greater effect on the corrosion rate, ipass, and Icorr. For instance, as Table 7 illustrates, raising the temperature from 298 to 338 K increased the corrosion rate of the TZNT by more than 27 times.
The apparent activation energy, or Ea, was calculated using equation (8) based on the Arrhenius plot’s slope (Figure 13 inset).
The data shows that log Icorr is dependent on T-1. The slope d log Icorr / d(T-1) is used to get an activation energy of 31.75 kJ mol-1. The enhanced solubility of the oxides at higher temperatures may account for the temperature’s stimulating effect on oxide production. Additionally, temperature accelerates the diffusing species’ rate of diffusion [49].
3.7. Potential Scan Rate’s Impact
Figure 14 illustrates the influence of potential scan rate ν (5.0 – 40 mVs−1) on PDP curves for a TZNT electrode in ASW at 25°C. Table 8 reports the electrochemical parameters icorr, Ecorr, βc, βa, ipass, and CR. The plot of ipass vs. ν ½ is a regular line (Figure 14 inset), indicating that the ipass grows significantly as ν increases. The equation for diffusion [50,51] goes as follows:
ipass=abn1/2CD1/2ν1/2 (9)
where D is the diffusion coefficient of the diffusing species, C is the concentration, n is the electron transmitted, and a and b are constants. This finding implies that the creation of Ti oxide passive layers is a diffusion-controlled process. Because of this, the rate of oxide layer dissolving may compete with the risk of oxide film development at higher sweep rates (dissolution-passivation process) [52]. The chemical breakdown of Ti oxide is expected as the time needed to form the Ti oxide layer reduces as ν increases. Additionally, it was recently demonstrated that the porosities of films made at different scan rates differ considerably [53]. The data also showed that while the values of icorr, CR, and ipass grow significantly as ν rises, the values of Ecorr move somewhat to more negative values.
3.8. Effect of Immersion Time
3.8.1. Potentiodynamic Polarization (PDP) Curves
The PDP of TZNT alloy in ASW at various immersion periods with and without 0.01 M fluoride ions at pH 6.5 with a 5 mVs-1 scan rate at 298 K are shown in Figure 15 (a, b). The TZNT alloy’s polarization curves for test immersion periods in ASW with and without 0.01 M fluoride ion concentrations showed both active and passive behavior. With fluoride ions, polarization curves are pushed toward more noble potential from 0.0 to 15 days (Figure 15a), suggesting an enhancement in TZNT alloy corrosion resistance. The polarization curves in Figure 15b change toward less noble potential from 0.0 days to 15 days without fluoride ions, suggesting that the TZNT alloy’s corrosion resistance declines. Table 9 lists the electrochemical characteristics (ipass and Epass) of the TZNT alloy exposed to the ASW both with and without 0.01 M fluoride. The statistics indicate a tendency to create passive film (easy and good passivation is indicated by minimum values). The values of Epass and ipass in ASW with 0.01 M fluoride at immersion times of 15 days are lower than those at immersion times of 0.0 days, as shown in Table 9. This suggests that the passive oxide layer on the TZNT alloy surface is more protective at immersion times of 15 days, while it dissolves quickly at these immersion times of 0.0 days. Additionally, it was noted that the TZNT alloy showed the highest ipass and Epass during the test period in ASW without 0.01 M fluoride when compared to their values in ASW with 0.01 M fluoride. These outcomes displayed the exceptional stability and protection of the oxide layer that was created on TZNT alloy by immersion in ASW without 0.01 M fluoride.
3.8.2. Electrochemical Impedance Spectroscopy (EIS)
The findings of impedance measurements in the form of Bode plots for the TZNT alloy at longer immersion times in the ASW in the presence and absence of 0.01 M fluoride ions are displayed in Figure 16a,b. An electrochemical equivalent circuit depicted in Figure 3 was utilized to examine the experimental data. According to the Bode plots (Figure 16a), the passive oxide layer is more protective at immersion times of 15 days (20.89 kΩ cm2, -73.62°) than it is at immersion times of 0.0 days (10.71 kΩ cm2, -74.67°), indicating that the passive oxide layer on the alloy surface dissolves quickly at these immersion times in ASW. The values of Zmod and phase angle in Bode plots (Figure 16b) at immersion times of 0.0 days were (39.81 kΩ cm2, -77.41°), suggesting that the passive oxide layer is more protective but less protective in comparison to the 15 days (14.45 kΩ cm2, -64.95°), showing that the passive oxide TZNT layer on the alloy surface dissolves quickly at these immersion times in ASW without 0.01 M fluoride ions. The results of impedance measurements in the form of Nyquist plots for the TZNT alloy at increasing immersion times in the ASW, with and without 0.01 M fluoride ions, are displayed in Figure 16c, d. Figure 3 depicts an electrochemical equivalent circuit used to assess the experimental data. Cyclical changes are depicted in the Nyquist graphs (Fig. 16c). In Nyquist plots (Figure 16d), the impedance dramatically rises at 15 days and falls at 0.0 days. These findings show that the corrosive attack of 0.01 M fluoride ions primarily affected the oxide film, which led to a reduction in the barrier layer impedance. These findings demonstrated that while no immersion in ASW enhances oxide film instability, the oxide layer generated on TZNT alloy by immersion in ASW with 0.01 M fluoride ions is extremely durable and protective. The findings of fitting experimental data to the suggested equivalent electric circuit depicted in Figure 3 are displayed in Table 10. The results displayed the exceptional stability and protection of the oxide layer that is created on a TZNT alloy by immersion in ASW with 0.01 M fluoride ions. The potentiodynamic polarization data and the EIS data concur well.

3.9. Surface Characterization
3.9.1. Surface Morphology
The SEM analysis (Figure 17a,b) showed full contrast in the surface state of the TZNT alloy after polarization in ASW without and with fluoride. In fluoride-free ASW, the alloy surface remained smooth and intact, showing only polishing marks and no signs of localized attack, confirming the stability of its passive film. On the other hand, the addition of 0.01 M F⁻ caused severe surface degradation, including deep grooves, dissolution patches, and a highly roughened morphology, indicating extensive breakdown of the passive layer. These results demonstrate that while TZNT maintains excellent corrosion resistance in normal seawater, fluoride ions significantly destabilize the protective oxide film, leading to aggressive localized corrosion.
3.9.2. X-ray Diffraction
To comprehend the microstructure and phase composition of the TZNT sample, an XRD structural analysis was conducted. The X-ray diffractograms for TZNT materials as received and following potentiodynamic polarization in ASW with and without F- ions are shown in Figure 18. A graph shows the relationship between the relative intensity (counts per second) and the diffraction angle (2θ). The (100), (002), (101), (102), (110), (103), and (104) planes are indexed to the peaks of the as-received TZNT alloy at 2θ values of 35.5, 38.75, 40.63, 53.44, 63.59, 71.07, and 77.6°, respectively. The hexagonal α-Ti is represented by these peaks. The (110) and (211) levels of the β-Ti phase are responsible for the two peaks that emerged at 2θ = 38.75 and 71.07°, respectively [27]. The most prevalent crystallographic orientation for the hexagonal Ti phase, according to the results, was the (101) plane. The XRD analysis showed no appreciable change in the passive film composition with or without F-ions (Figure 18). However, following the anodic potentiodynamic polarization in ASW, the primary peak's peak intensity (at 2θ = 40.63) of (α 101) increases. On the other hand, following the potentiodynamic polarization in ASW, this peak intensity diminishes in the presence of 0.01 M F- ions. This decrease in peak intensity could be explained by the quick partial disintegration of the passive layer that takes place during anodic polarization in the presence of F- ions. The drop in the XRD peak could be explained by the structure becoming more amorphous [54]. A reduction in crystallization, especially at the grain boundaries, might change a material's corrosion resistance [55].
4. Conclusions
Under a variety of environmental and electrochemical conditions, the β-TZNT alloy's corrosion behavior and passive-film properties in artificial seawater were thoroughly assessed. The following conclusions can be drawn:
- Superior baseline corrosion resistance: As demonstrated by lower corrosion current densities, higher polarization resistance, and more noble OCP values, the β-TZNT alloy demonstrated significantly greater corrosion resistance than commercially pure titanium in fluoride-free artificial seawater at near-neutral pH. The development of a stable passive film enriched with oxides based on Nb, Zr, and Ta is responsible for this improved performance.
- pH-dependent passive-film stability: The corrosion rate significantly increased, and the passive-film resistance decreased as the seawater environment became more acidic. Even at low pH, passivity was preserved, but the oxide layer's protective effectiveness significantly declined because of faster chemical dissolution.
- Detrimental role of fluoride ions: The integrity of the passive film was seriously jeopardized by fluoride ions, which led to notable decreases in impedance parameters and increases in corrosion current density. The main mechanism for passive-film breakdown was found to be the formation of soluble titanium-fluoride complexes and HF/HF₂⁻ species.
- Bilayer passive-film structure: The passive film on the β-TZNT alloy is made up of an outer porous layer and an inner compact barrier layer, according to EIS analysis. The resistance and thickness of both layers were decreased by increasing fluoride concentration, lowering pH, and raising temperatures, which eventually caused film destabilization.
- Effects of temperature, scan rate, and immersion time: With an apparent activation energy of about 31.75 kJ mol⁻¹, higher temperatures accelerated corrosion processes and decreased passive-film stability. Diffusion-controlled oxide growth was demonstrated by the dependence of passive current density on the square root of scan rate. In fluoride-containing media, prolonged immersion encouraged film stabilization; however, in fluoride-free seawater, it caused gradual degradation.
- Surface and structural confirmation: While XRD analysis revealed partial amorphization of the passive layer after fluoride-induced attack, SEM observations supported electrochemical findings, showing severe surface degradation in fluoride-containing environments.
- In conclusion, the β-TZNT alloy exhibits outstanding resistance to corrosion in typical seawater settings, but it is extremely vulnerable to fluoride-induced deterioration, especially in acidic and hot conditions. The safe application of β-TZNT alloys in marine, offshore, and desalination systems exposed to fluoride-contaminated seawater is made possible by these findings.
Author Contributions
Conceptualization, M.A.El., I.H.S. and M.A.M.I.; methodology, M.A.El and I.H.S..; validation, M.A.El., I.H.S. and M.A.M.I.; formal analysis, M.A.El., I.H.S. and M.A.M.I.; investigation, M.A.El., I.H.S. and M.A.M.I.; resources, M.A.El., and I.H.S.; writing—original draft preparation, M.A.El., and M.A.M.I..; writing—review and editing, M.A.El., I.H.S. and M.A.M.I.; visualization, M.A.El., supervision, M.A.M.I. All authors have read and agreed to the published version of the manuscript.”.
Funding
This research received no external funding.
Data Availability Statement
All data generated or analyzed during this study are included in this published article.
Acknowledgments
The Researchers would like to thank the Deanship of Graduate Studies and Scientific Research at Qassim University for financial support (QU-APC-2026).
Conflicts of Interest
The authors declare no conflicts of interest.
References
- Nahiduzzaman; Ji, X. Tribocorrosion of Titanium Alloys in Seawater: Recent Advances and Strategies. J. Bio- Tribo-Corrosion 2025, 12, 1–33. [Google Scholar] [CrossRef]
- Haile, F.; Adkins, J.; Corradi, M. A Review of the Use of Titanium for Reinforcement of Masonry Structures. Materials 2022, 15, 4561. [Google Scholar] [CrossRef]
- Vrsalović, L.; Gudić, S.; Talijančić, A.; Jakić, J.; Krolo, J.; Danaee, I. Corrosion Behavior of Ti and Ti6Al4V Alloy in Brackish Water, Seawater, and Seawater Bittern. Corros. Mater. Degrad. 2024, 5, 641–656. [Google Scholar] [CrossRef]
- Torbati-Sarraf, H.; Ding, L.; Khakpour, I.; Daviran, G.; Poursaee, A. Unraveling the Corrosion of the Ti–6Al–4V Orthopedic Alloy in Phosphate-Buffered Saline (PBS) Solution: Influence of Frequency and Potential. Corros. Mater. Degrad. 2024, 5, 276–288. [Google Scholar] [CrossRef]
- Gudić, S.; Vrsalović, L.; Kvrgić, D.; Nagode, A. Electrochemical Behaviour of Ti and Ti-6Al-4V Alloy in Phosphate Buffered Saline Solution. Materials 2021, 14, 7495. [Google Scholar] [CrossRef]
- Omar, I.M.A.; Elshamy, I.H.; Halim, S.A.; Ibrahim, M.A.M. Electrochemical and Computational Analyses of Thiocolchicoside as a New Corrosion Inhibitor for Biomedical Ti6Al4V Alloy in Saline Solution: DFT, NBO, and MD Approaches. Surfaces 2025, 8, 77. [Google Scholar] [CrossRef]
- Ibrahim, M.A.; Elshamy, I.H.; I Elshamy, M.; Elaraby, A. An experimental and computational investigation on the performance of cefotaxime in mitigating Ti6Al4V alloy corrosion. Corros. Eng. Sci. Technol. 2025. [Google Scholar] [CrossRef]
- Qiao, Y.; Xu, D.; Wang, S.; Ma, Y.; Chen, J.; Wang, Y.; Zhou, H. Effect of hydrogen charging on microstructural evolution and corrosion behavior of Ti-4Al-2V-1Mo-1Fe alloy. J. Mater. Sci. Technol. 2021, 60, 168–176. [Google Scholar] [CrossRef]
- Qin, T.; Lin, X.; Yu, J.; Wang, M.; Guo, P.; Li, J.; Zhang, Y.; Liu, J.; Zhang, S.; Huang, W. Performance of different microstructure on electrochemical behaviors of laser solid formed Ti–6Al–4V alloy in NaCl solution. Corros. Sci. 2021, 185. [Google Scholar] [CrossRef]
- Li, X.; Wang, L.; Fan, L.; Zhong, M.; Cheng, L.; Cui, Z. Understanding the effect of fluoride on corrosion behavior of pure titanium in different acids. Corros. Sci. 2021, 192. [Google Scholar] [CrossRef]
- Boraei, N.F.E. Electrochemical corrosion behavior of β-Ti alloy in a physiological saline solution and the impact of H2O2 and albumin. Journal of Solid State Electrochemistry 2024, 28(7), 2243–2256. [Google Scholar] [CrossRef]
- Ibrahim, M.A.; Pongkao, D.; Yoshimura, M. The electrochemical behavior and characterization of the anodic oxide film formed on titanium in NaOH solutions. J. Solid State Electrochem. 2001, 6, 341–350. [Google Scholar] [CrossRef]
- Wang, Z.; Hu, H.; Zheng, Y. Synergistic effects of fluoride and chloride on general corrosion behavior of AISI 316 stainless steel and pure titanium in H2SO4 solutions. Corros. Sci. 2018, 130, 203–217. [Google Scholar] [CrossRef]
- Zhang, H.; Man, C.; Dong, C.; Wang, L.; Li, W.; Kong, D.; Wang, L.; Wang, X. The corrosion behavior of Ti6Al4V fabricated by selective laser melting in the artificial saliva with different fluoride concentrations and pH values. Corros. Sci. 2021, 179. [Google Scholar] [CrossRef]
- Elshamy, I.H.; Ibrahim, M.A.M.; Rehim, S.S.A.; El Boraei, N.F. Electrochemical Characteristics of a Biomedical Ti70Zr20Nb7.5Ta2.5 Refractory High Entropy Alloy in an Artificial Saliva Solution. J. Bio- Tribo-Corrosion 2022, 9, 1–17. [Google Scholar] [CrossRef]
- Cui, Z.; Wang, L.; Zhong, M.; Ge, F.; Gao, H.; Man, C.; Liu, C.; Wang, X. Electrochemical Behavior and Surface Characteristics of Pure Titanium during Corrosion in Simulated Desulfurized Flue Gas Condensates. J. Electrochem. Soc. 2018, 165, C542–C561. [Google Scholar] [CrossRef]
- Ren, S.; Du, C.; Liu, Z.; Li, X.; Xiong, J.; Li, S. Effect of fluoride ions on corrosion behaviour of commercial pure titanium in artificial seawater environment. Appl. Surf. Sci. 2020, 506. [Google Scholar] [CrossRef]
- Wang, Z.; Hu, H.; Liu, C.; Zheng, Y. The effect of fluoride ions on the corrosion behavior of pure titanium in 0.05M sulfuric acid. Electrochimica Acta 2014, 135, 526–535. [Google Scholar] [CrossRef]
- Wilhelmsen, W.; Grande, A.P. The influence of hydrofluoric acid and fluoride ion on the corrosion and passive behaviour of titanium. Electrochimica Acta 1987, 32, 1469–1474. [Google Scholar] [CrossRef]
- Sutter, E.; Goetz-Grandmont, G. The behaviour of titanium in nitric-hydrofluoric acid solutions. Corros. Sci. 1990, 30, 461–476. [Google Scholar] [CrossRef]
- El Sayed, M.A.; Elshamy, I.H.; Ibrahim, M.A.M. Electrochemical Corrosion Behavior of Ti37Al Alloy in Simulated Artificial Seawater Environment and the Impact of Fluoride Ions and pH Values. J. Bio- Tribo-Corrosion 2024, 11, 1–20. [Google Scholar] [CrossRef]
- Thorhallsson, A.I.; Karlsdottir, S.N. Corrosion Behaviour of Titanium Alloy and Carbon Steel in a High-Temperature, Single and Mixed-Phase, Simulated Geothermal Environment Containing H2S, CO2 and HCl. Corros. Mater. Degrad. 2021, 2, 190–209. [Google Scholar] [CrossRef]
- Ibrahim, M.A.; El Rehim, S.A.; Hamza, M. Corrosion behavior of some austenitic stainless steels in chloride environments. Mater. Chem. Phys. 2009, 115, 80–85. [Google Scholar] [CrossRef]
- Shoesmith, D.; Noël, J.; Annamalai, V. 10-corrosion of titanium and its alloys. In Shreir’s corrosion; Elsevier: Oxford, 2010; pp. 2042–2052. [Google Scholar]
- Robin, A.; Meirelis, J.P. Influence of fluoride concentration and pH on corrosion behavior of titanium in artificial saliva. J. Appl. Electrochem. 2007, 37, 511–517. [Google Scholar] [CrossRef]
- Zhang, L.-C.; Chen, L.-Y.; Wang, L. Surface modification of titanium and titanium alloys: technologies, developments, and future interests. Advanced Engineering Materials 2020, 22(5), 1901258. [Google Scholar] [CrossRef]
- Vladescu, A.; Braic, V.; Balaceanu, M.; Braic, M.; Parau, A.C.; Ivanescu, S.; Fanara, C. Characterization of the Ti-10Nb-10Zr-5Ta Alloy for Biomedical Applications. Part 1: Microstructure, Mechanical Properties, and Corrosion Resistance. J. Mater. Eng. Perform. 2013, 22, 2389–2397. [Google Scholar] [CrossRef]
- Standard, A. D1141-98: Standard Practice for the Preparation of Substitute Ocean Water; ASTM International: West Conshohocken, 2013. [Google Scholar]
- Vitelaru, C. Corrosion behaviour of Ti6Al4V alloy in artificial saliva solution with fluoride content and low pH value: Korrosionsverhalten der Legierung Ti6Al4V in künstlicher Speichelflüssigkeit mit Fluoridanteilen und geringem pH-Wert. Materialwissenschaft und Werkstofftechnik 2014, 45(2), 91–98. [Google Scholar] [CrossRef]
- Dyer, C.K.; Leach, J.S.L. Reversible Optical Changes Within Anodic Oxide Films on Titanium and Niobium. J. Electrochem. Soc. 1978, 125, 23–29. [Google Scholar] [CrossRef]
- Hamdy, A.S.; El-Shenawy, E.; El-Bitar, T. Electrochemical Impedance Spectroscopy Study of the Corrosion Behavior of Some Niobium Bearing Stainless Steels in 3.5% NaCl. Int. J. Electrochem. Sci. 2006, 1, 171–180. [Google Scholar] [CrossRef]
- Mansfeld, F. The interaction of bacteria and metal surfaces. Electrochimica Acta 2007, 52, 7670–7680. [Google Scholar] [CrossRef]
- Robin, A.; Meirelis, J.P. EIS study of Ti–23Ta alloy in artificial saliva. Corros. Eng. Sci. Technol. 2009, 44, 352–357. [Google Scholar] [CrossRef]
- Lidia, B.; Nicoleta, S. Impact of hydrogen peroxide and albumin on the corrosion behavior of titanium alloy (Ti6Al4V) in saline solution. International Journal of Electrochemical Science 2021, 16(2), 210244. [Google Scholar] [CrossRef]
- Blackwood, D.; Peter, L.; Williams, D. Stability and open circuit breakdown of the passive oxide film on titanium. Electrochimica Acta 1988, 33, 1143–1149. [Google Scholar] [CrossRef]
- Yu, S.Y.; Scully, J.R. Corrosion and Passivity of Ti-13% Nb-13% Zr in Comparison to Other Biomedical Implant Alloys. Corrosion 1997, 53, 965–976. [Google Scholar] [CrossRef]
- Yang, J.; Song, Y.; Dong, K.; Han, E.-H. Research progress on the corrosion behavior of titanium alloys. Corros. Rev. 2022, 41, 5–20. [Google Scholar] [CrossRef]
- Mabilleau, G.; Bourdon, S.; Joly-Guillou, M.; Filmon, R.; Baslé, M.; Chappard, D. Influence of fluoride, hydrogen peroxide and lactic acid on the corrosion resistance of commercially pure titanium. Acta Biomater. 2006, 2, 121–129. [Google Scholar] [CrossRef]
- González, J.; Mirza-Rosca, J. Study of the corrosion behavior of titanium and some of its alloys for biomedical and dental implant applications. J. Electroanal. Chem. 1999, 471, 109–115. [Google Scholar] [CrossRef]
- de Assis, S.L.; Wolynec, S.; Costa, I. Corrosion characterization of titanium alloys by electrochemical techniques. Electrochimica Acta 2006, 51, 1815–1819. [Google Scholar] [CrossRef]
- Taveira, L. Initiation and growth of self-organized TiO2 nanotubes anodically formed in NH4F∕(NH4) 2SO4 electrolytes. Journal of the Electrochemical Society 2005, 152(10), p. B405. [Google Scholar] [CrossRef]
- Cheng, T.-P.; Lee, J.-T.; Tsai, W.-T. Passivation of titanium in molybdate-containing sulphuric acid solution. Electrochimica Acta 1991, 36, 2069–2076. [Google Scholar] [CrossRef]
- Robin, A.; Meirelis, J.P. Influence of fluoride concentration and pH on corrosion behavior of titanium in artificial saliva. J. Appl. Electrochem. 2007, 37, 511–517. [Google Scholar] [CrossRef]
- Lavos-Valereto, I.C.; Wolynec, S.; Ramires, I.; Guastaldi, A.C.; Costa, I. Electrochemical impedance spectroscopy characterization of passive film formed on implant Ti–6Al–7Nb alloy in Hank's solution. J. Mater. Sci. Mater. Med. 2004, 15, 55–59. [Google Scholar] [CrossRef] [PubMed]
- Pan, J.; Thierry, D.; Leygraf, C. Electrochemical impedance spectroscopy study of the passive oxide film on titanium for implant application. Electrochimica Acta 1996, 41, 1143–1153. [Google Scholar] [CrossRef]
- Cattarin, S.; Musiani, M.; Tribollet, B. Nb electrodissolution in acid fluoride medium: steady-state and impedance investigations. Journal of The Electrochemical Society 2002, 149(10), p. B457. [Google Scholar] [CrossRef]
- Frateur, I.; Cattarin, S.; Musiani, M.; Tribollet, B. Electrodissolution of Ti and p-Si in acidic fluoride media: formation ratio of oxide layers from electrochemical impedance spectroscopy. J. Electroanal. Chem. 2000, 482, 202–210. [Google Scholar] [CrossRef]
- Marcus, P. Modifications of Passive Films; CRC Press, 1994. [Google Scholar]
- El Rehim, S.S.A.; Hassan, H.H.; Ibrahim, M.A.M.; Amin, M.A. Electrochemical Behaviour of a Silver Electrode in NaOH Solutions. Monatshefte Fuer Chemie/chemical Mon. 1998, 129, 1103–1117. [Google Scholar] [CrossRef]
- Elshamy, I.H.; El Rehim, S.S.A.; Ibrahim, M.A.M.; El Boraei, N.F. The bifunctional role played by thiocyanate anions on the active dissolution and the passive film of titanium in hydrochloric acid. Corros. Eng. Sci. Technol. 2022, 57, 542–552. [Google Scholar] [CrossRef]
- El Boraei, N.F.; Ibrahim, M.A.M. Comparative study on the corrosion behaviour of Lord Razor Blade Steel (LRBS) in aqueous environments. J. Taibah Univ. Sci. 2020, 14, 423–436. [Google Scholar] [CrossRef]
- Barradas, R.G.; Belinko, K.; Ambrose, J. Electrochemical Behavior of the Lead Electrode in HCl and NaCl Aqueous Electrolytes. Can. J. Chem. 1975, 53, 389–406. [Google Scholar] [CrossRef]
- Brunetti, V.; Villullas, H.; Teijelo, M.L. Potentiodynamic growth of anodic silver chromate layers. Electrochimica Acta 1999, 44, 4693–4700. [Google Scholar] [CrossRef]
- El Boraei, N.F. The Effect of Annealing Temperature and Immersion Time on the Active–Passive Dissolution of Biomedical Ti70Zr20Nb7. 5Ta2. 5 Alloy in Ringer’s Solution. Journal of Bio-and Tribo-Corrosion 2023, 9(3), p. 62. [Google Scholar] [CrossRef]
- Bertrand, G.; Mahdjoub, H.; Meunier, C. A study of the corrosion behaviour and protective quality of sputtered chromium nitride coatings. Surf. Coatings Technol. 2000, 126, 199–209. [Google Scholar] [CrossRef]
Figure 1.
PDP curves of β-TZNT alloy and Ti electrode in ASW recorded with a scan rate of 5 mVs-1 at pH 6.5 and 25°C.
Figure 1.
PDP curves of β-TZNT alloy and Ti electrode in ASW recorded with a scan rate of 5 mVs-1 at pH 6.5 and 25°C.
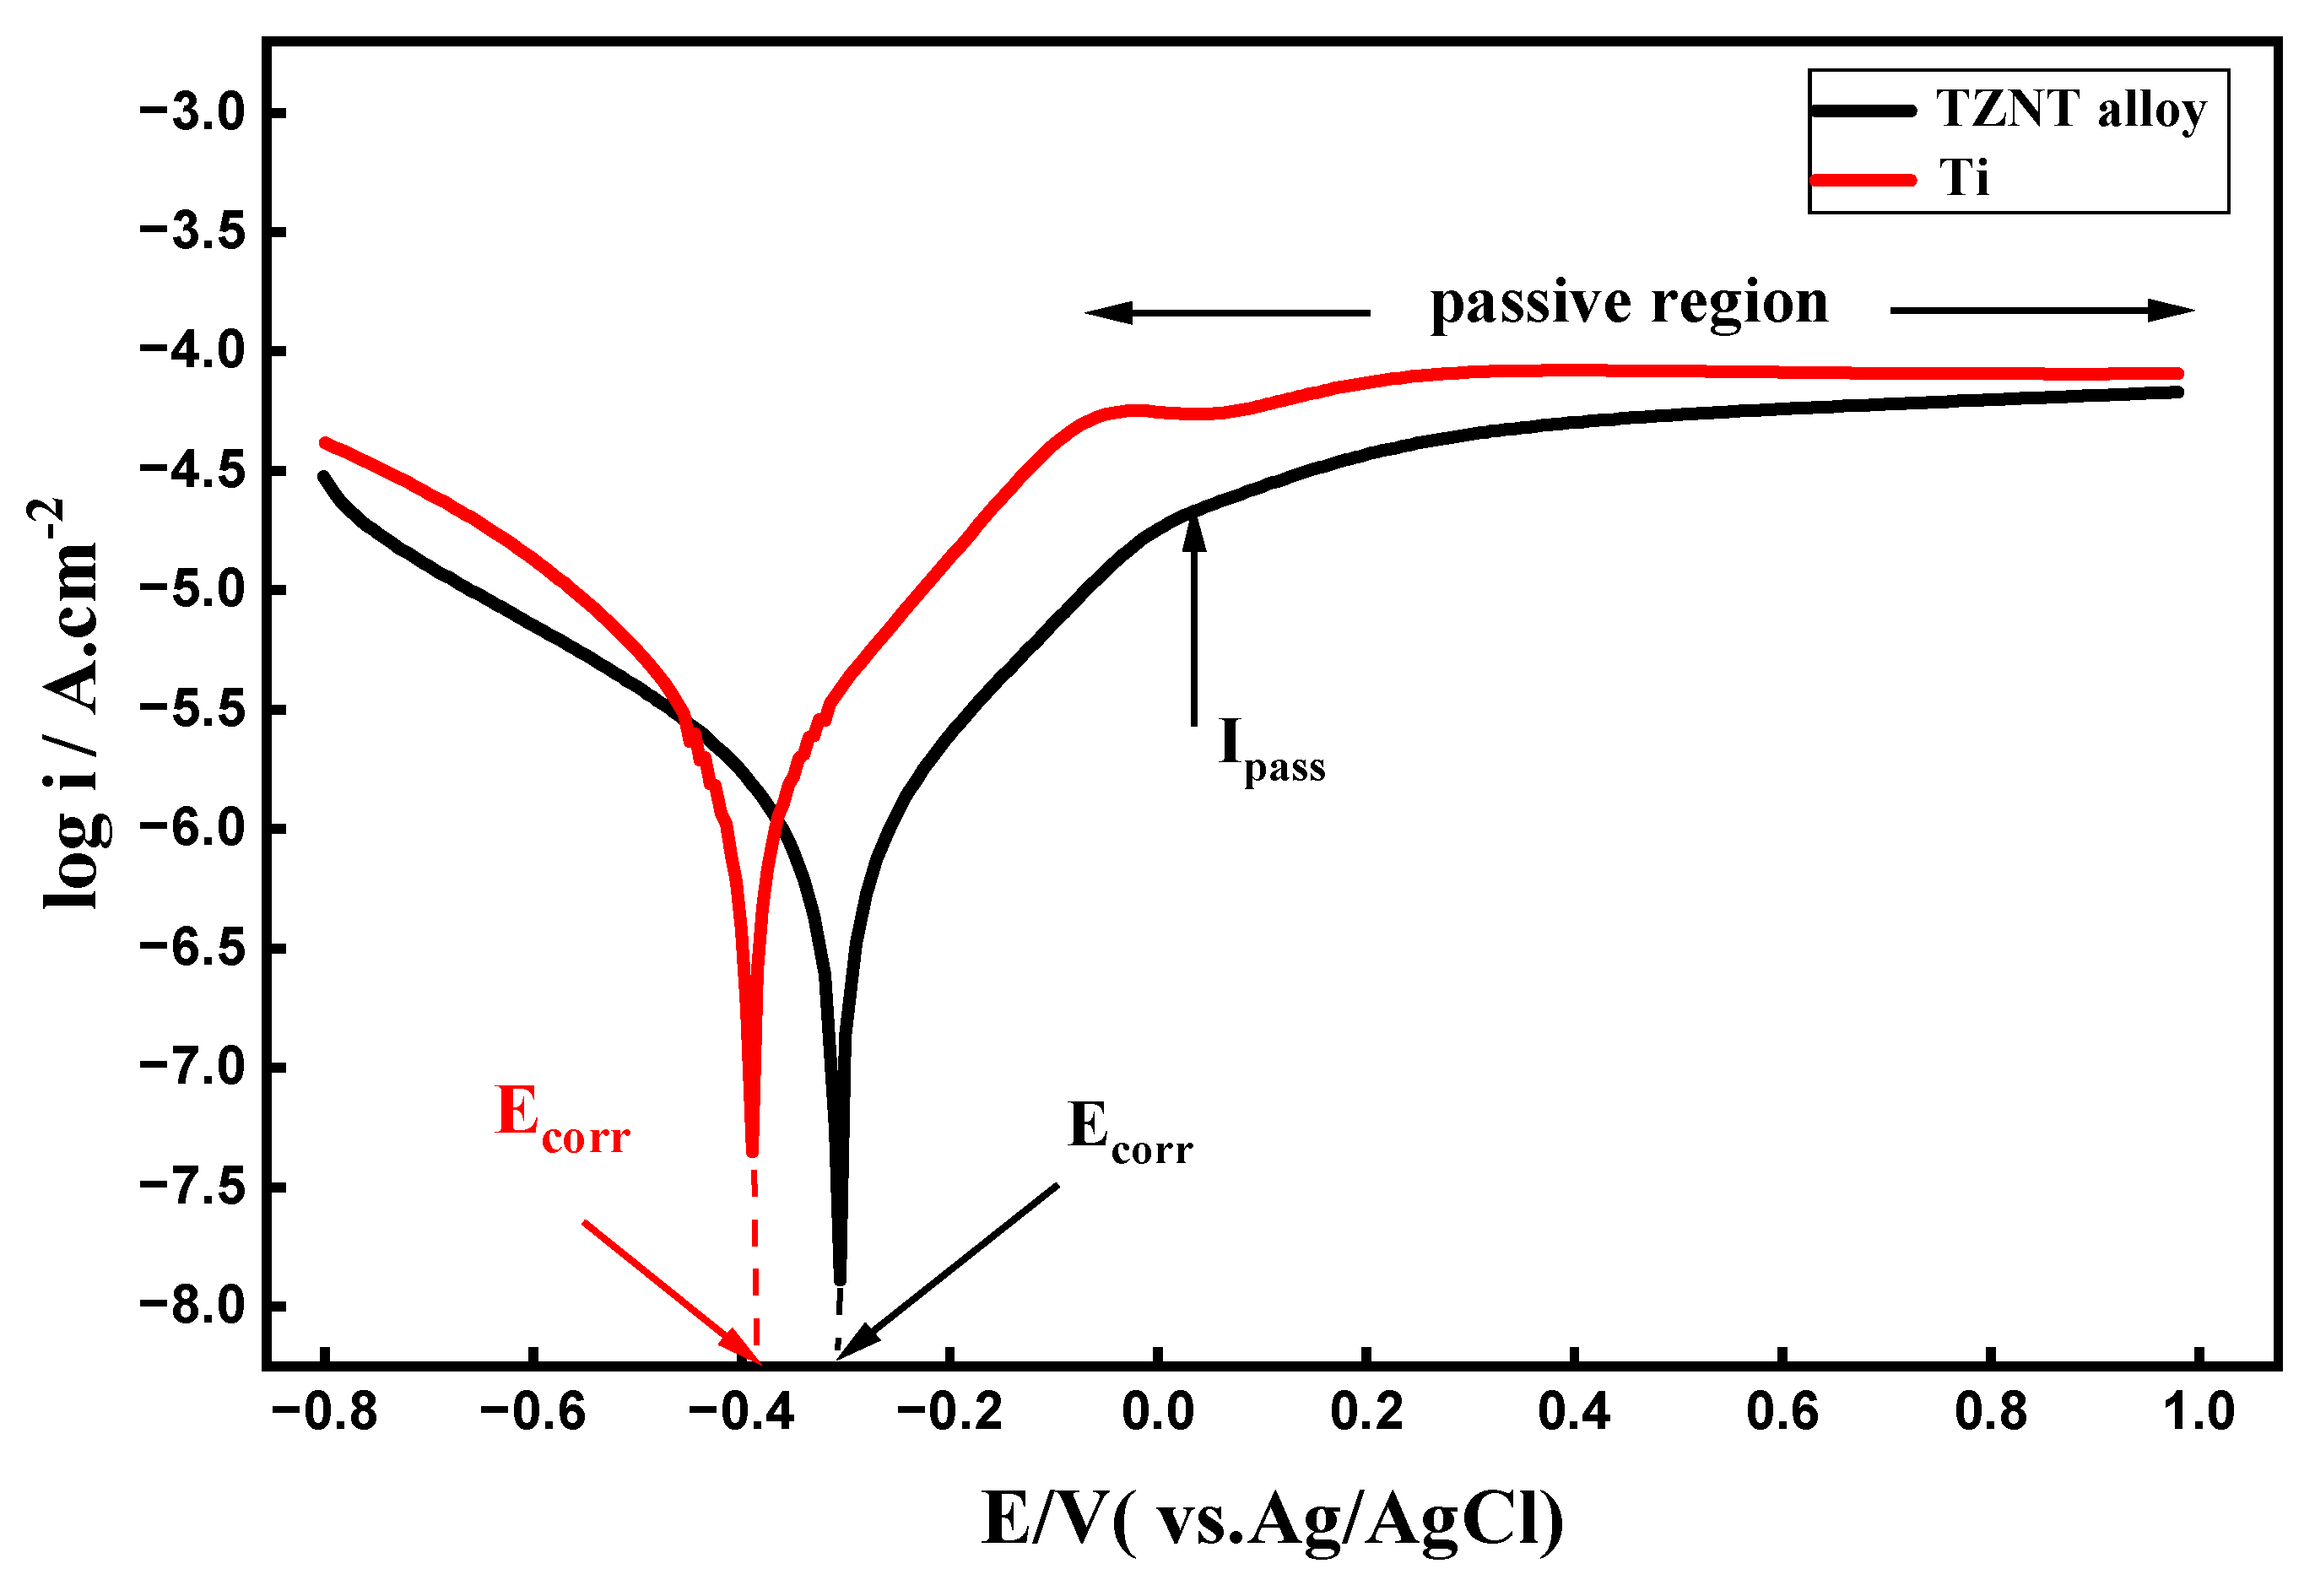
Figure 2.
(a) Bod plots and (b) Nyquist plots of EIS data of TZNT alloy and Ti in ASW at 25°C.
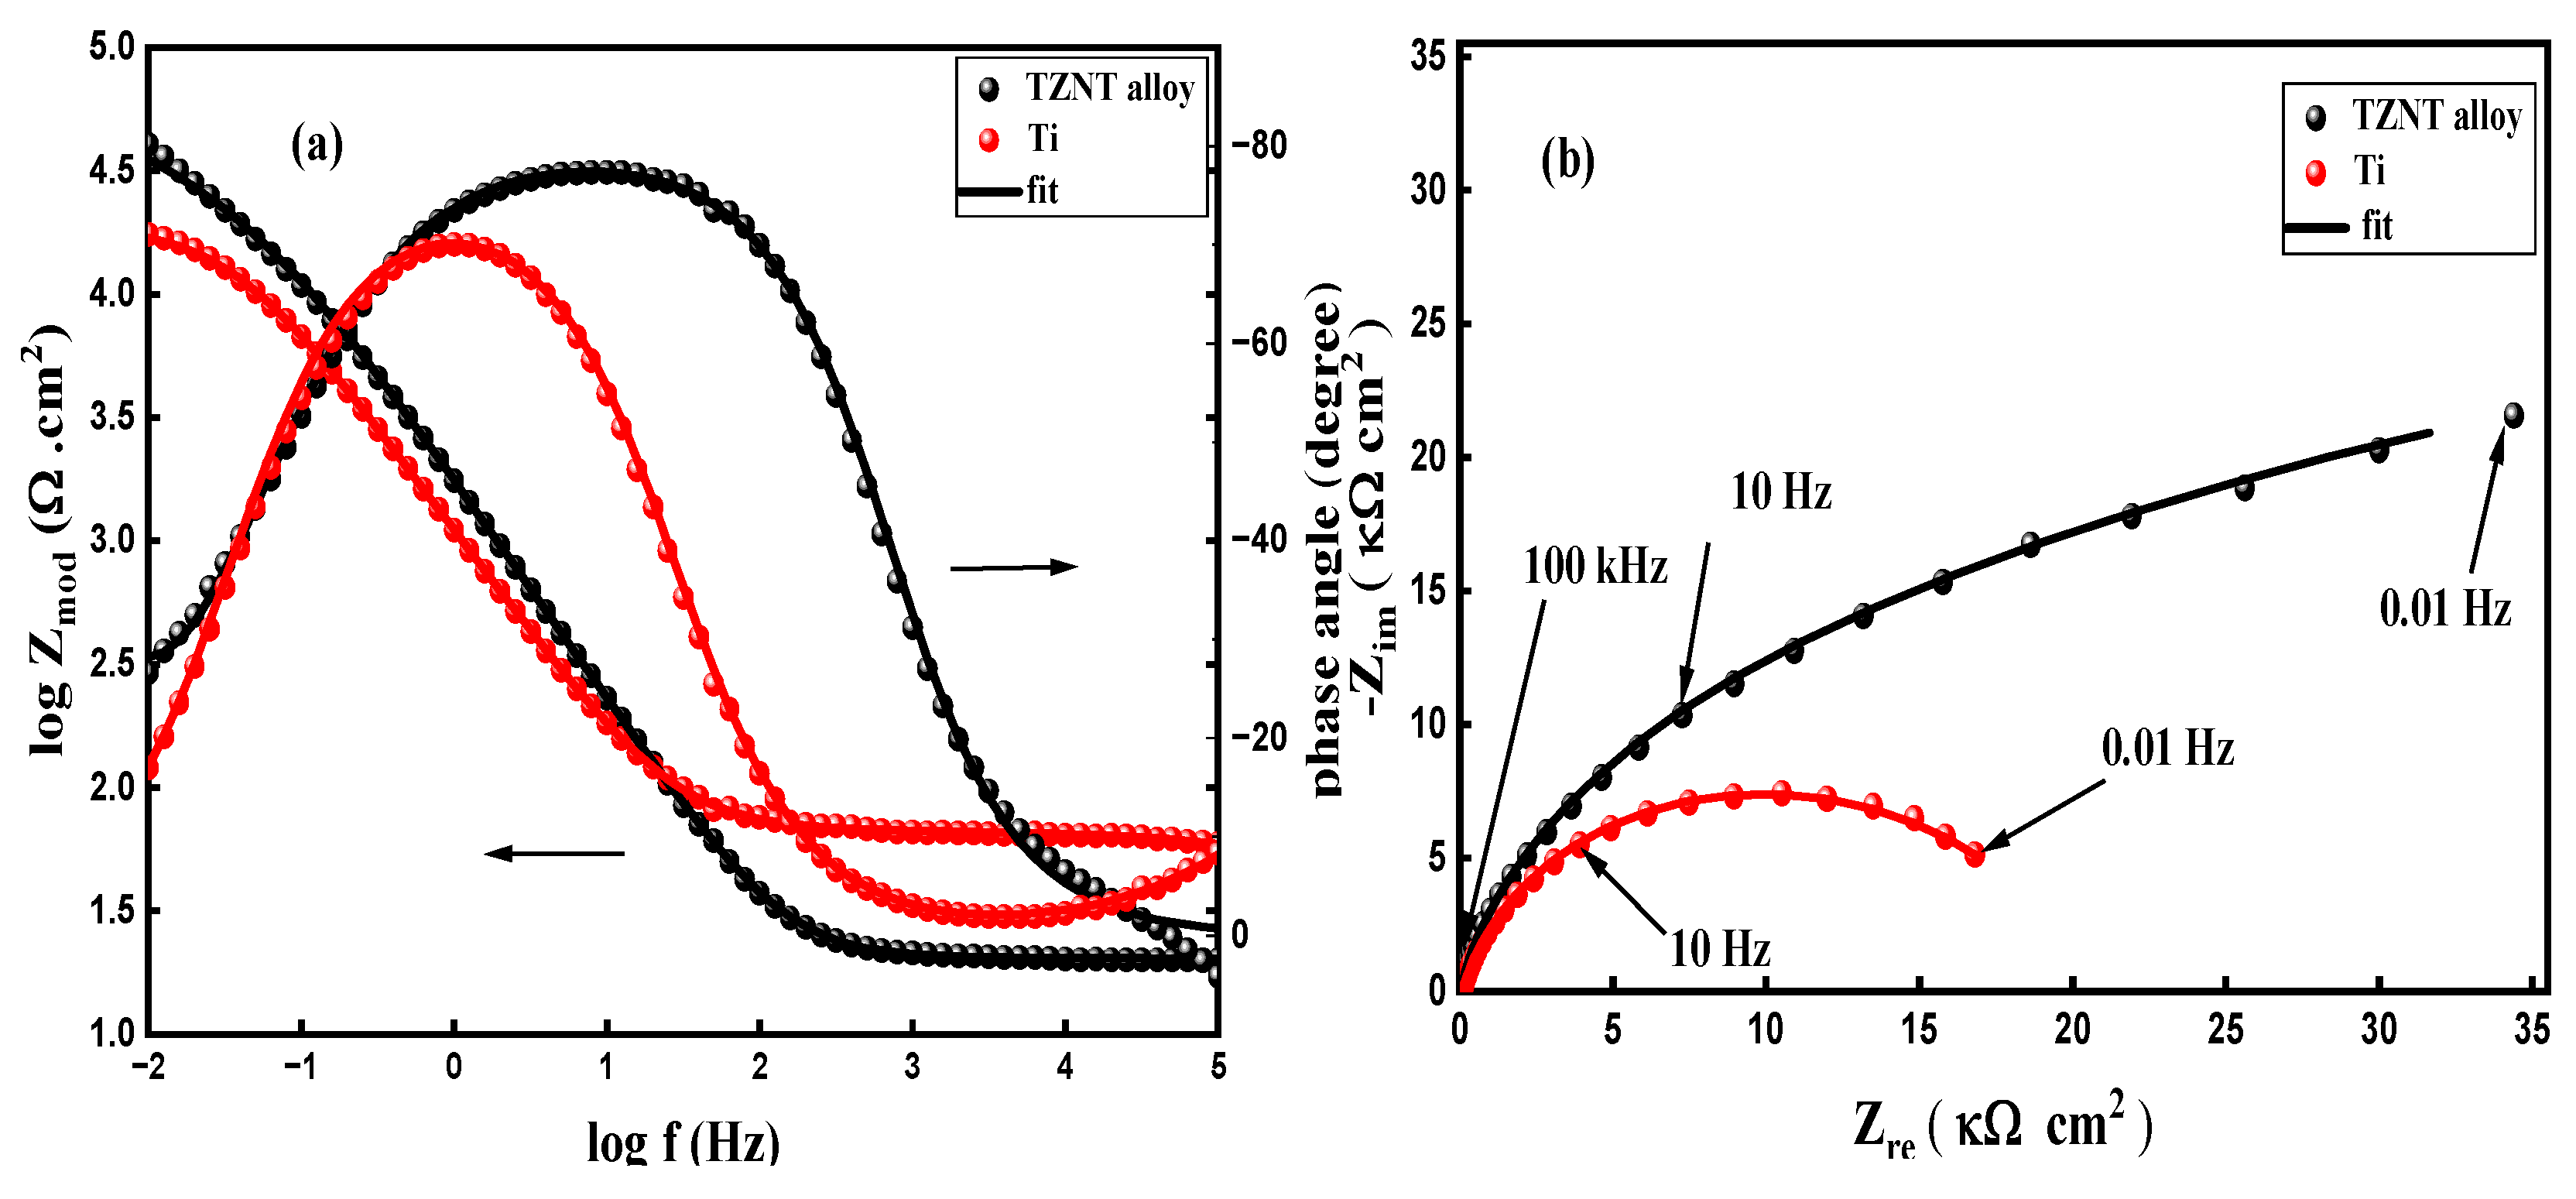
Figure 3.
The equivalent circuit (EC) used for EIS data fitting.
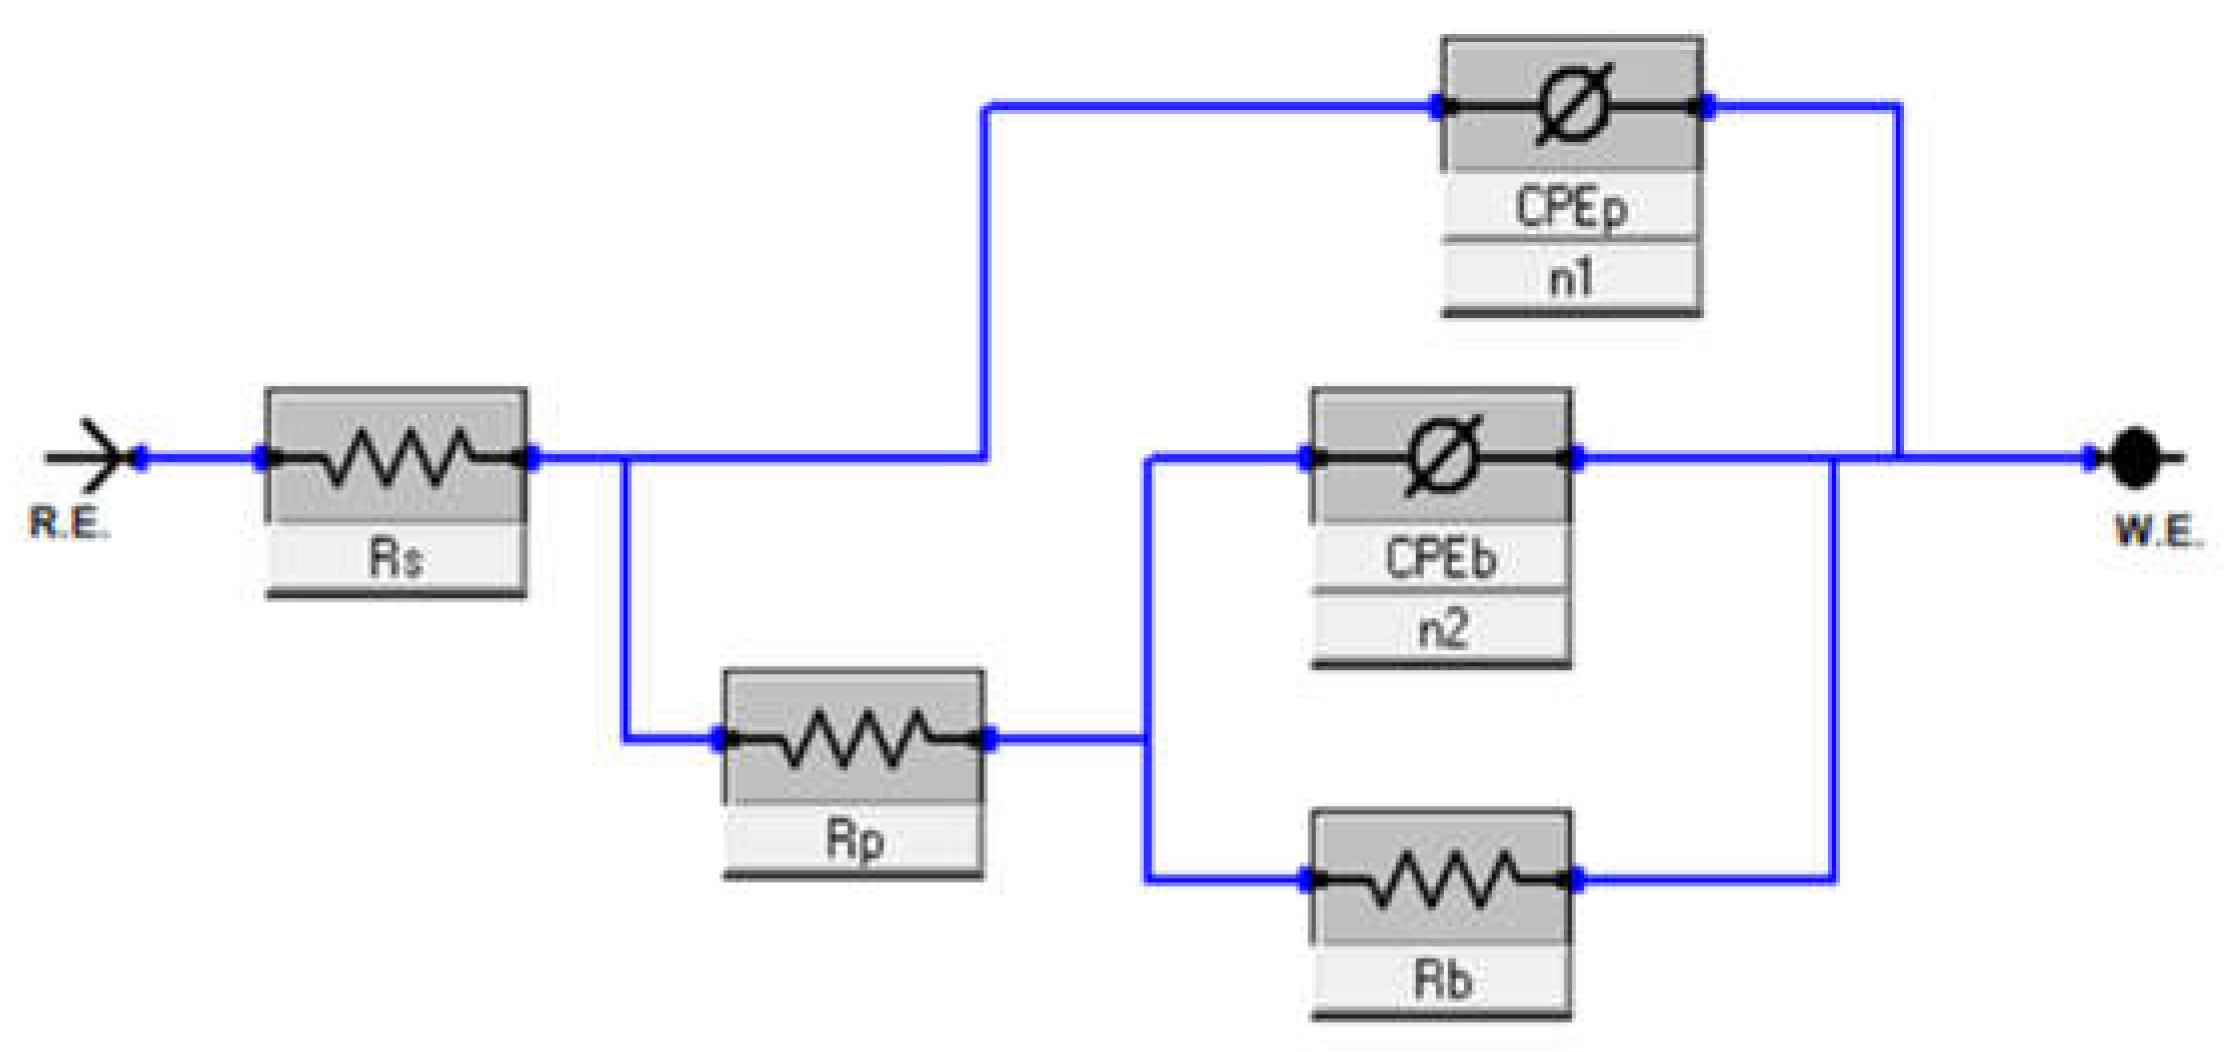
Figure 4.
Behavior of open-circuit potential as a function of time for Ti and TZNT alloy in ASW at pH 6.5 and 25°C.
Figure 4.
Behavior of open-circuit potential as a function of time for Ti and TZNT alloy in ASW at pH 6.5 and 25°C.
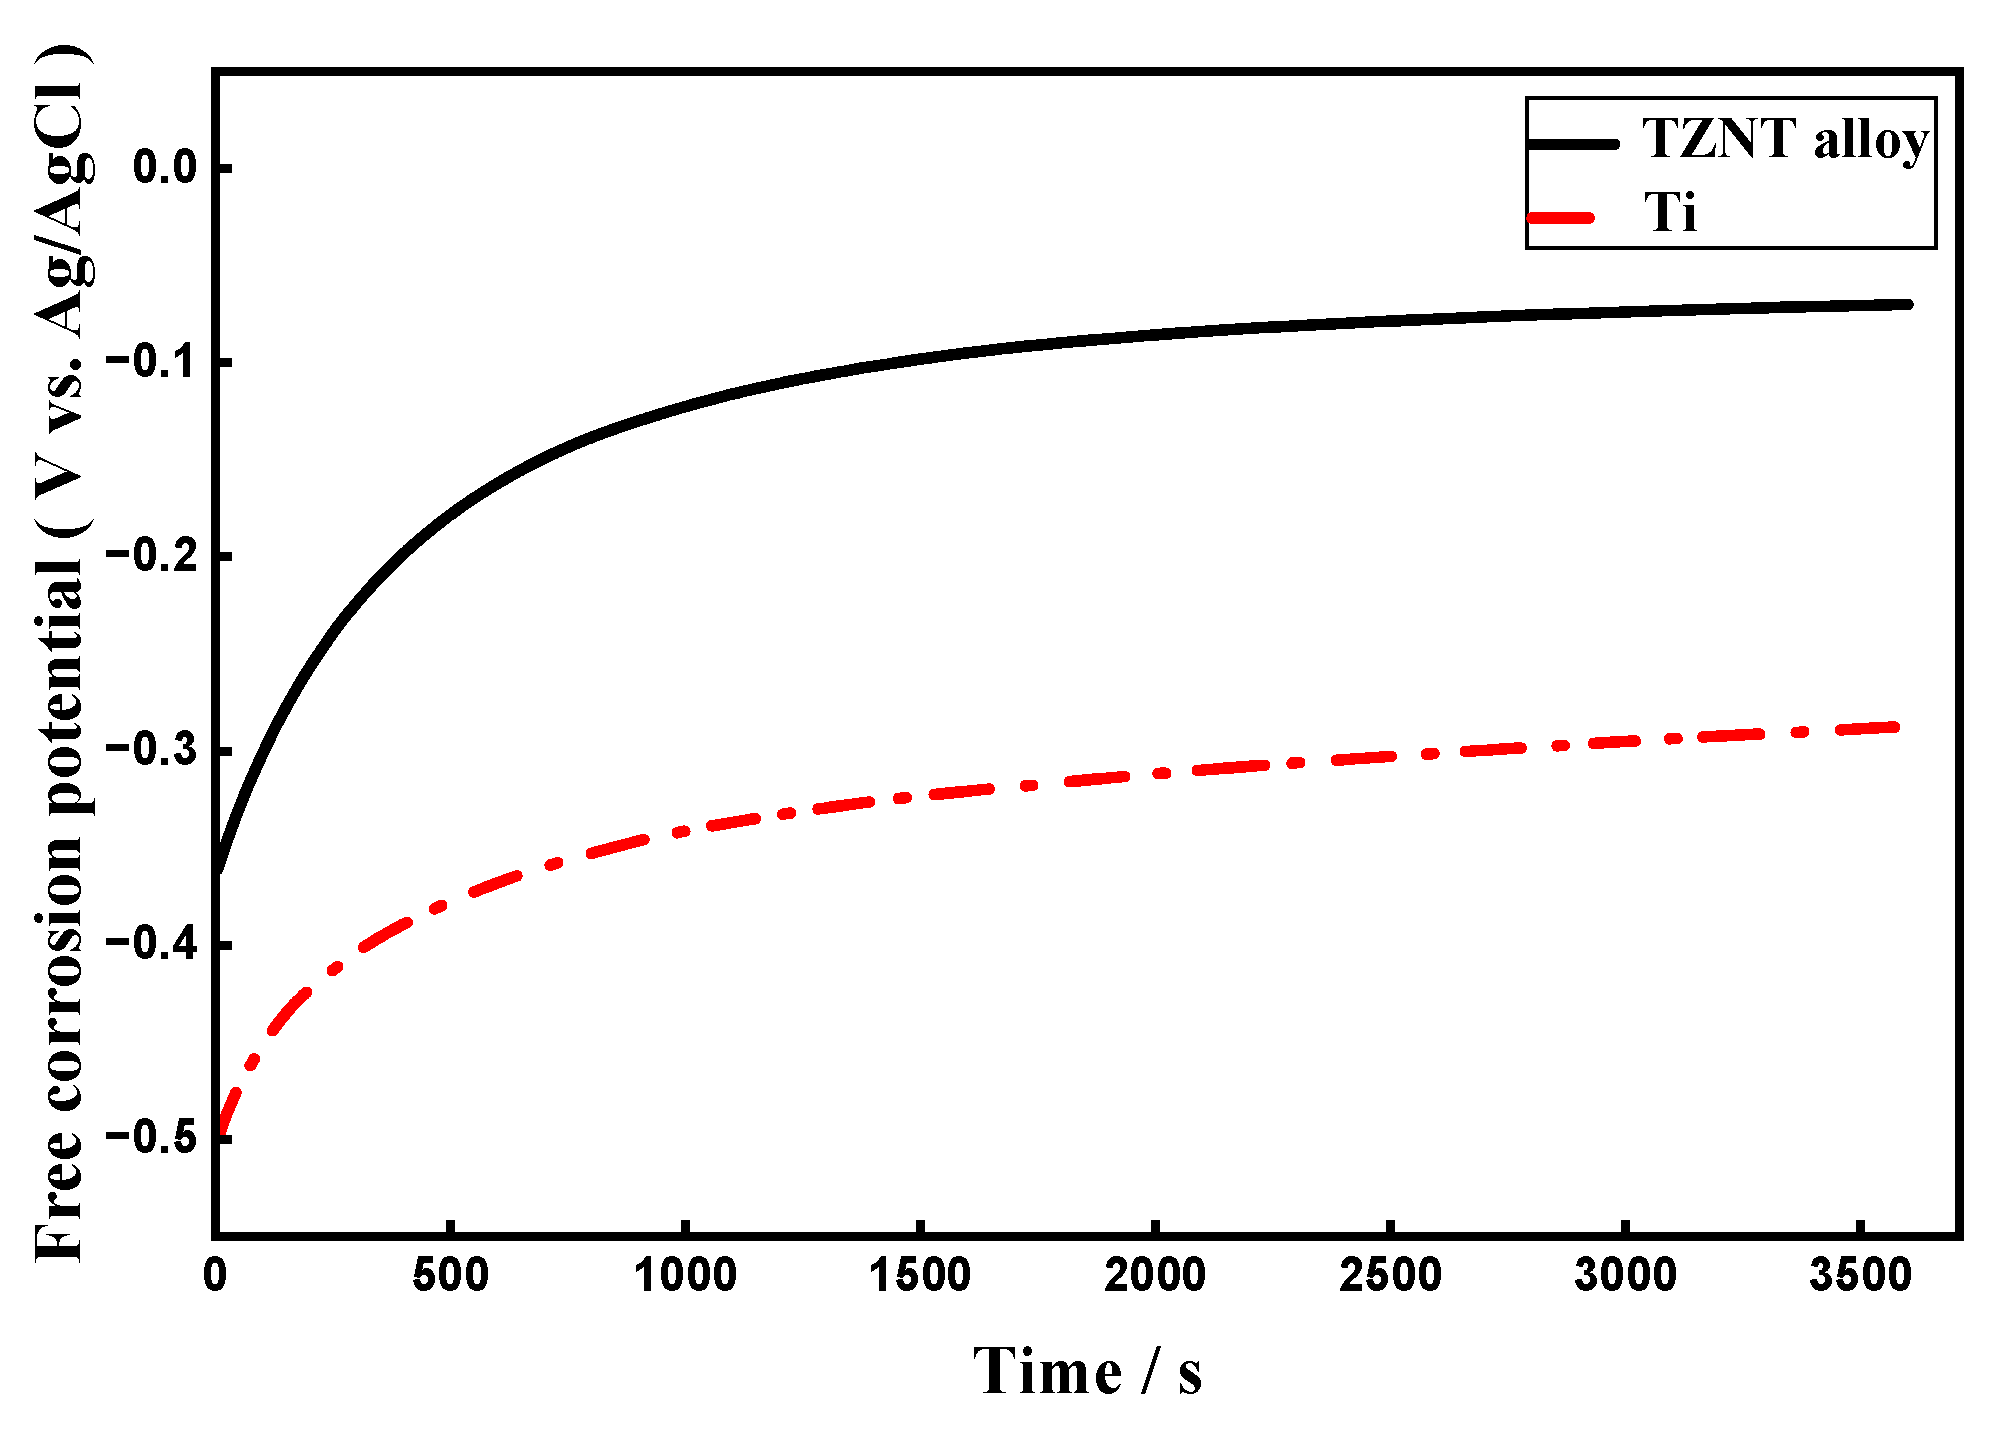
Figure 5.
PDP curves of TZNT alloy electrodes in ASW recorded with a scan rate of 5 mVs-1 at various pH values.
Figure 5.
PDP curves of TZNT alloy electrodes in ASW recorded with a scan rate of 5 mVs-1 at various pH values.
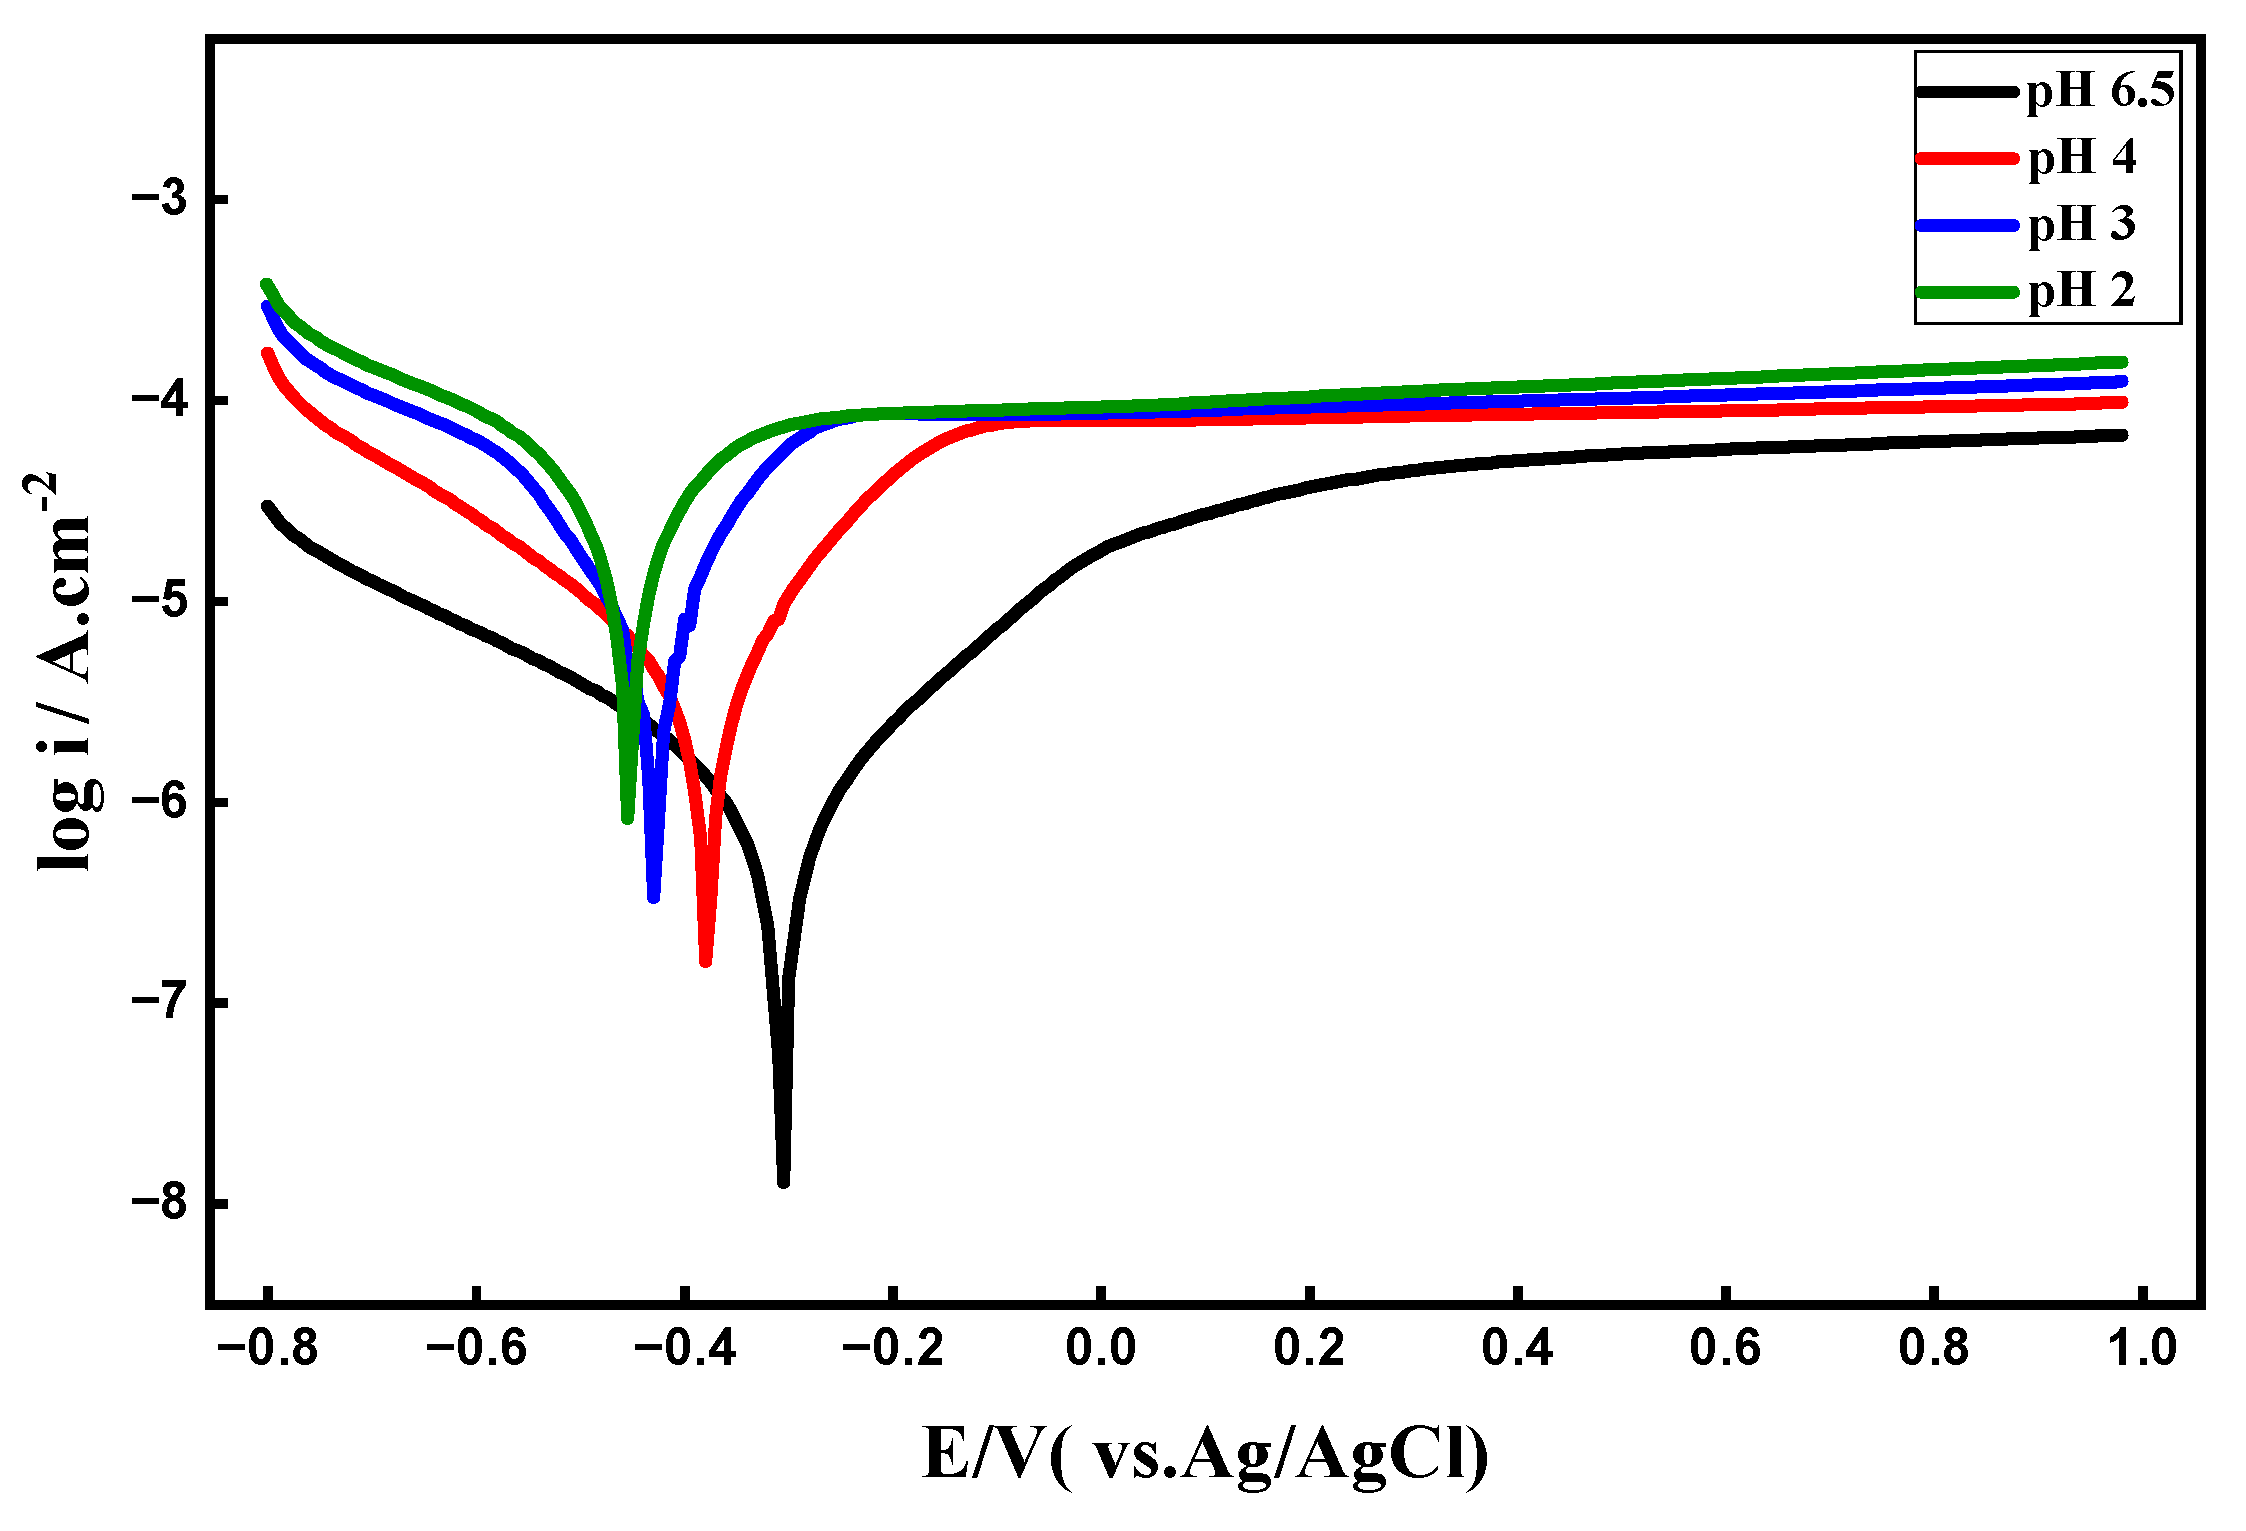
Figure 7.
(a) Bode plots and (b) Nyquist plots of EIS data of TZNT alloy in ASW with various pH values.
Figure 7.
(a) Bode plots and (b) Nyquist plots of EIS data of TZNT alloy in ASW with various pH values.
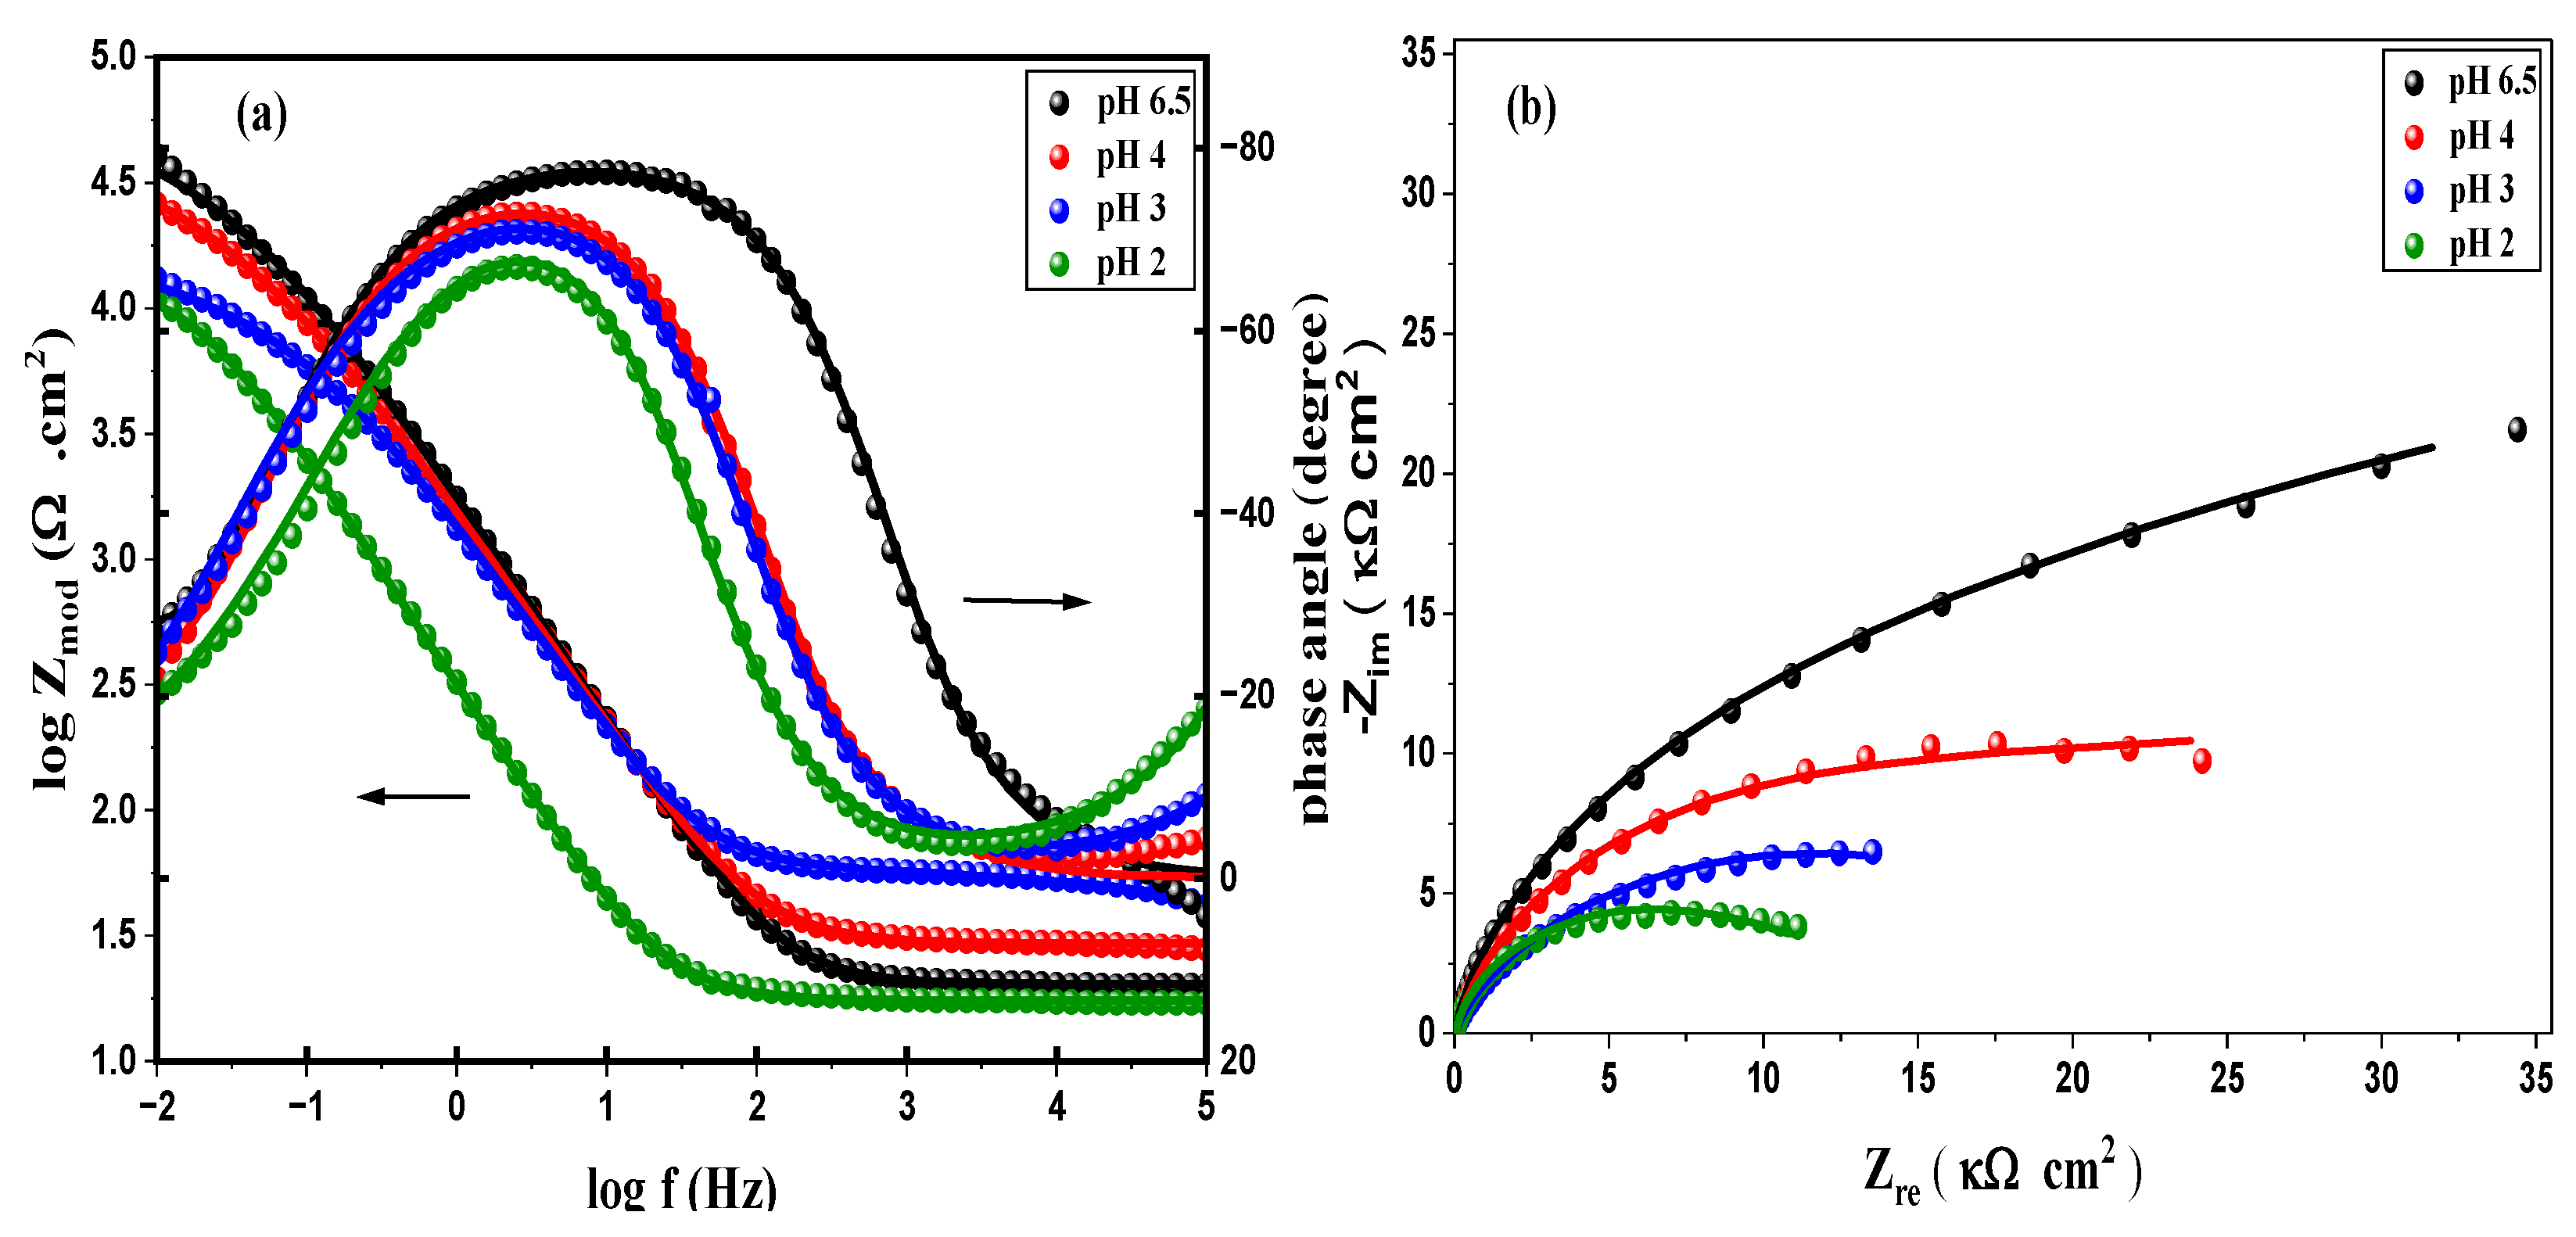
Figure 8.
OCP behavior as a function of time of TZNT alloy in ASW at various pH values.
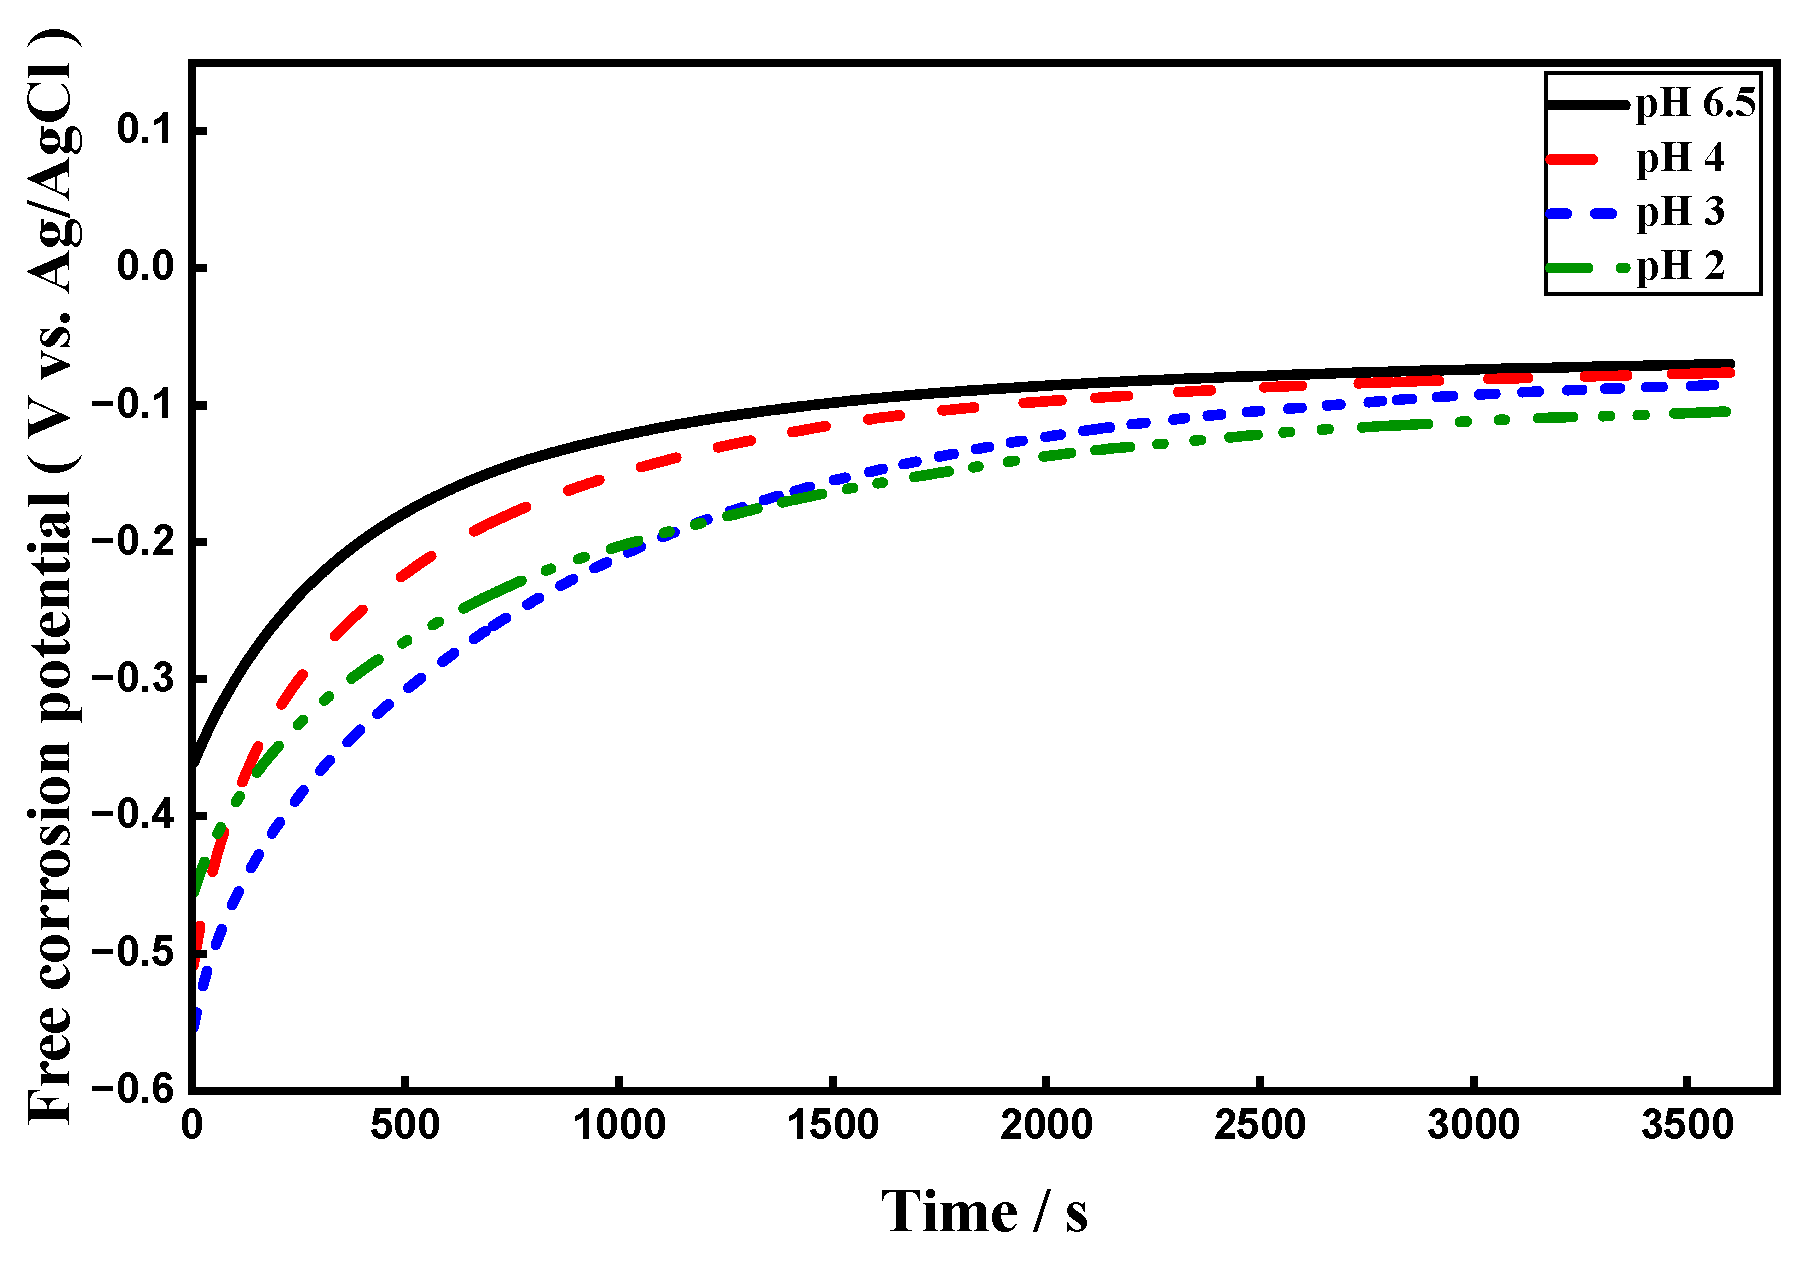
Figure 9.
PDP curves of TZNT alloy electrodes in ASW recorded with a scan rate of 5 mVs-1 with various concentrations of fluoride ions at pH 6.5.
Figure 9.
PDP curves of TZNT alloy electrodes in ASW recorded with a scan rate of 5 mVs-1 with various concentrations of fluoride ions at pH 6.5.
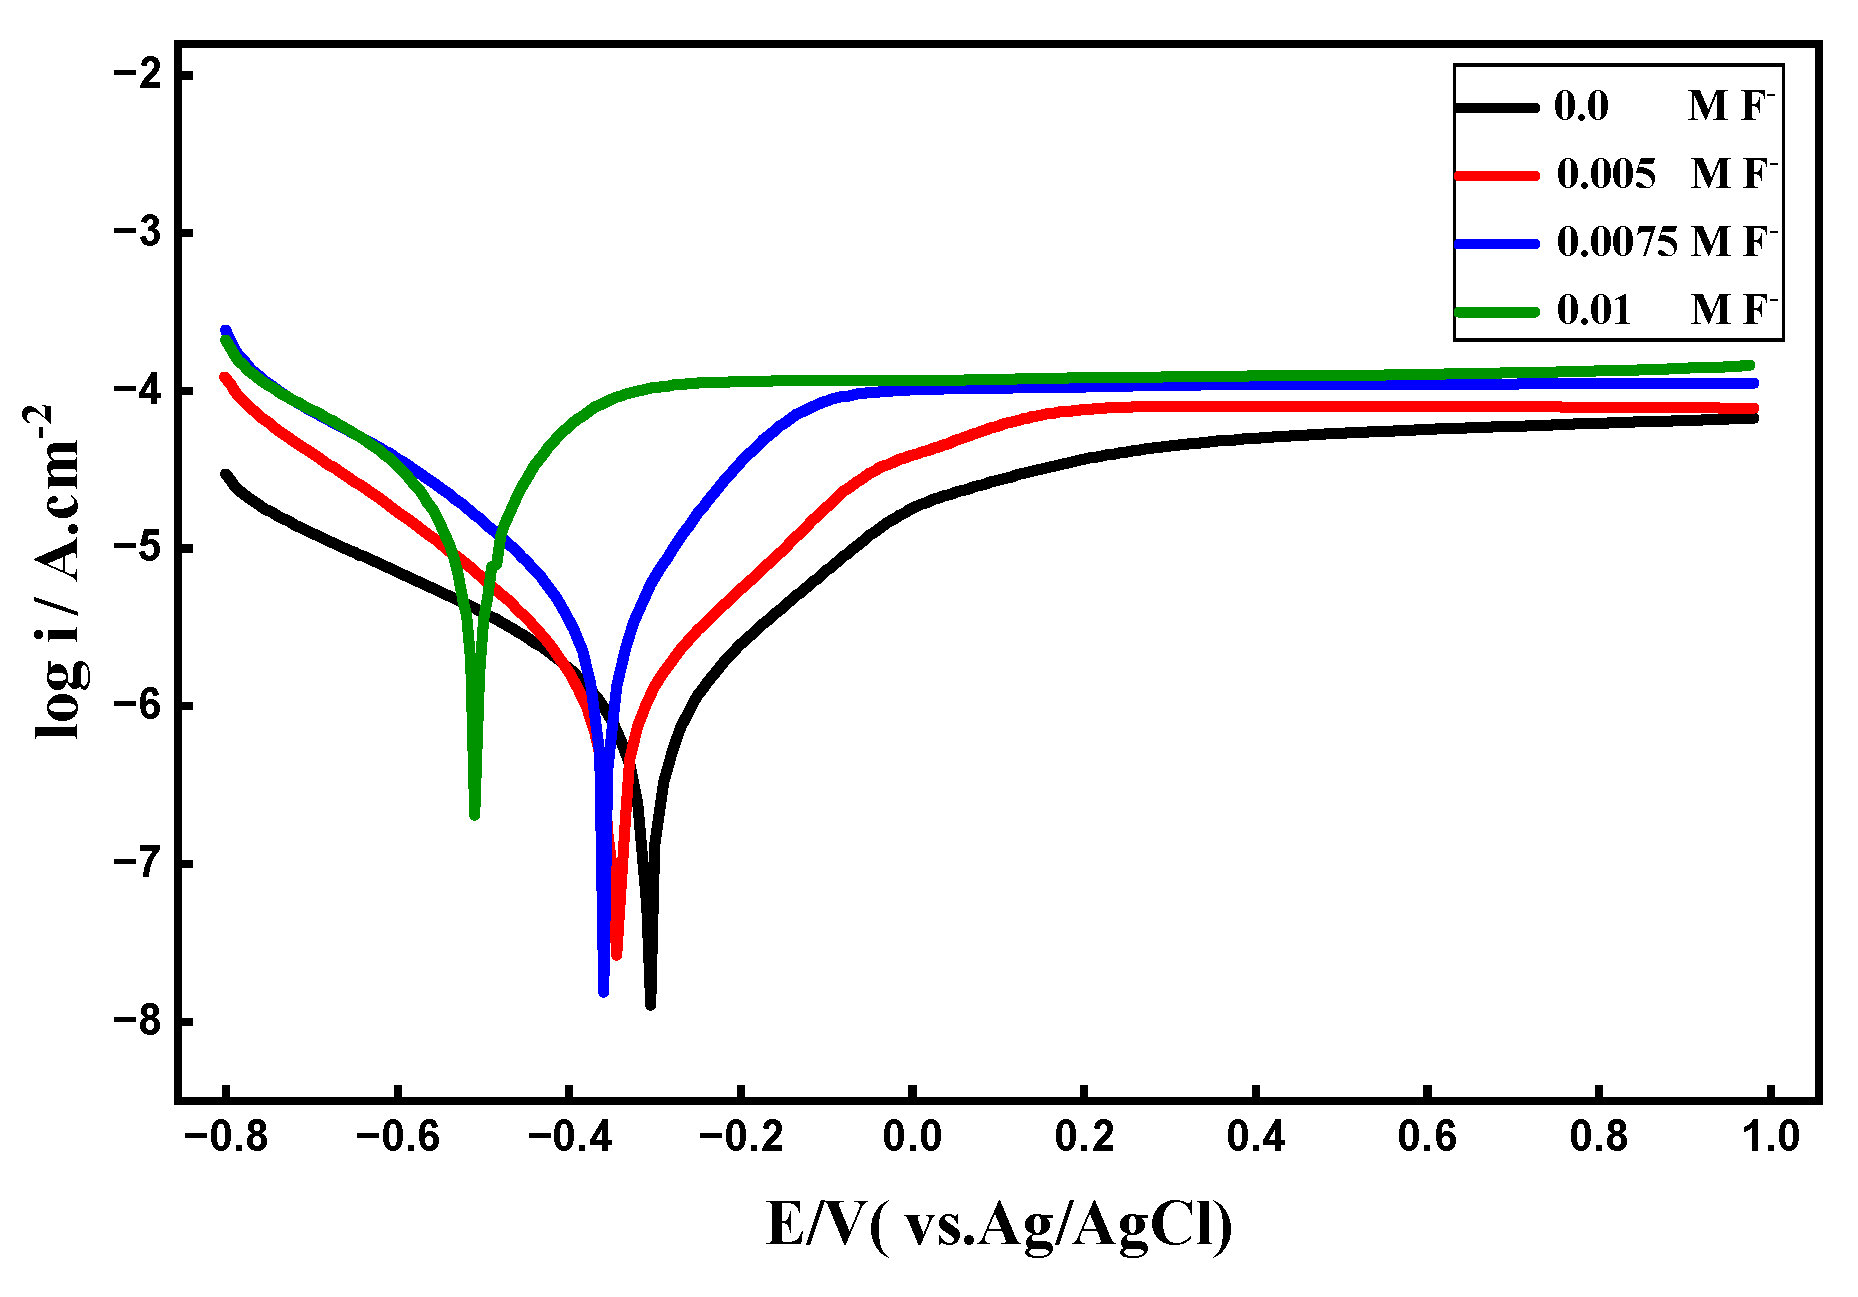
Figure 10.
(a) Bod plots and (b) Nyquist plots of EIS data of TZNT alloy in ASW with various concentrations of fluoride ions at pH 6.5.
Figure 10.
(a) Bod plots and (b) Nyquist plots of EIS data of TZNT alloy in ASW with various concentrations of fluoride ions at pH 6.5.
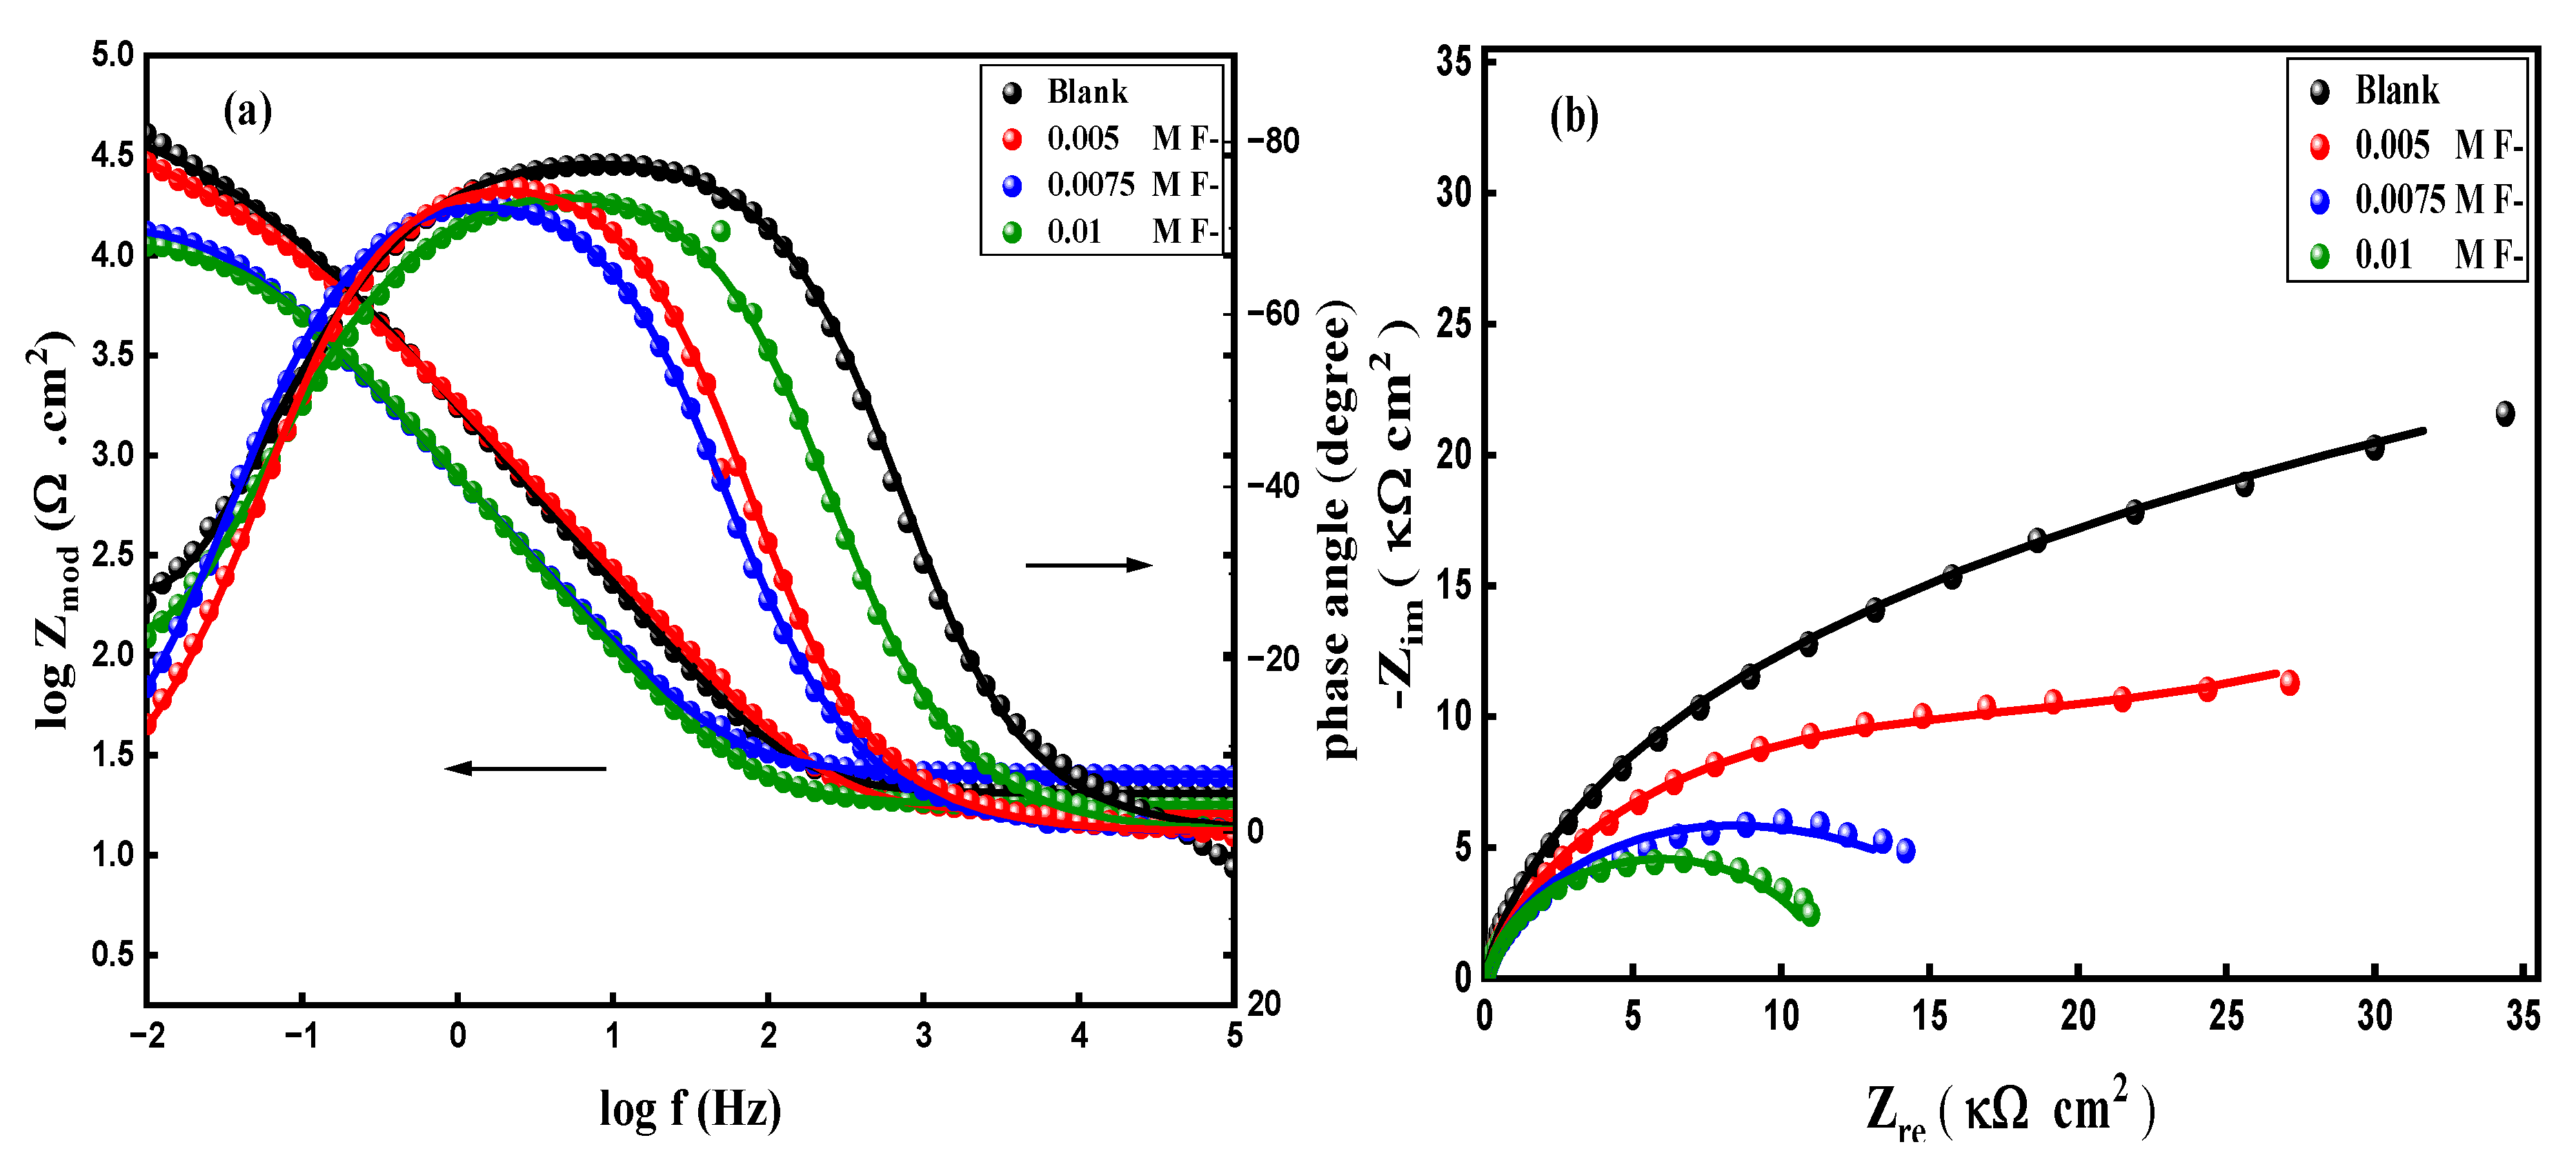
Figure 12.
OCP behavior as a function of TZNT alloy in ASW with various concentrations of fluoride ions at pH 6.5.
Figure 12.
OCP behavior as a function of TZNT alloy in ASW with various concentrations of fluoride ions at pH 6.5.
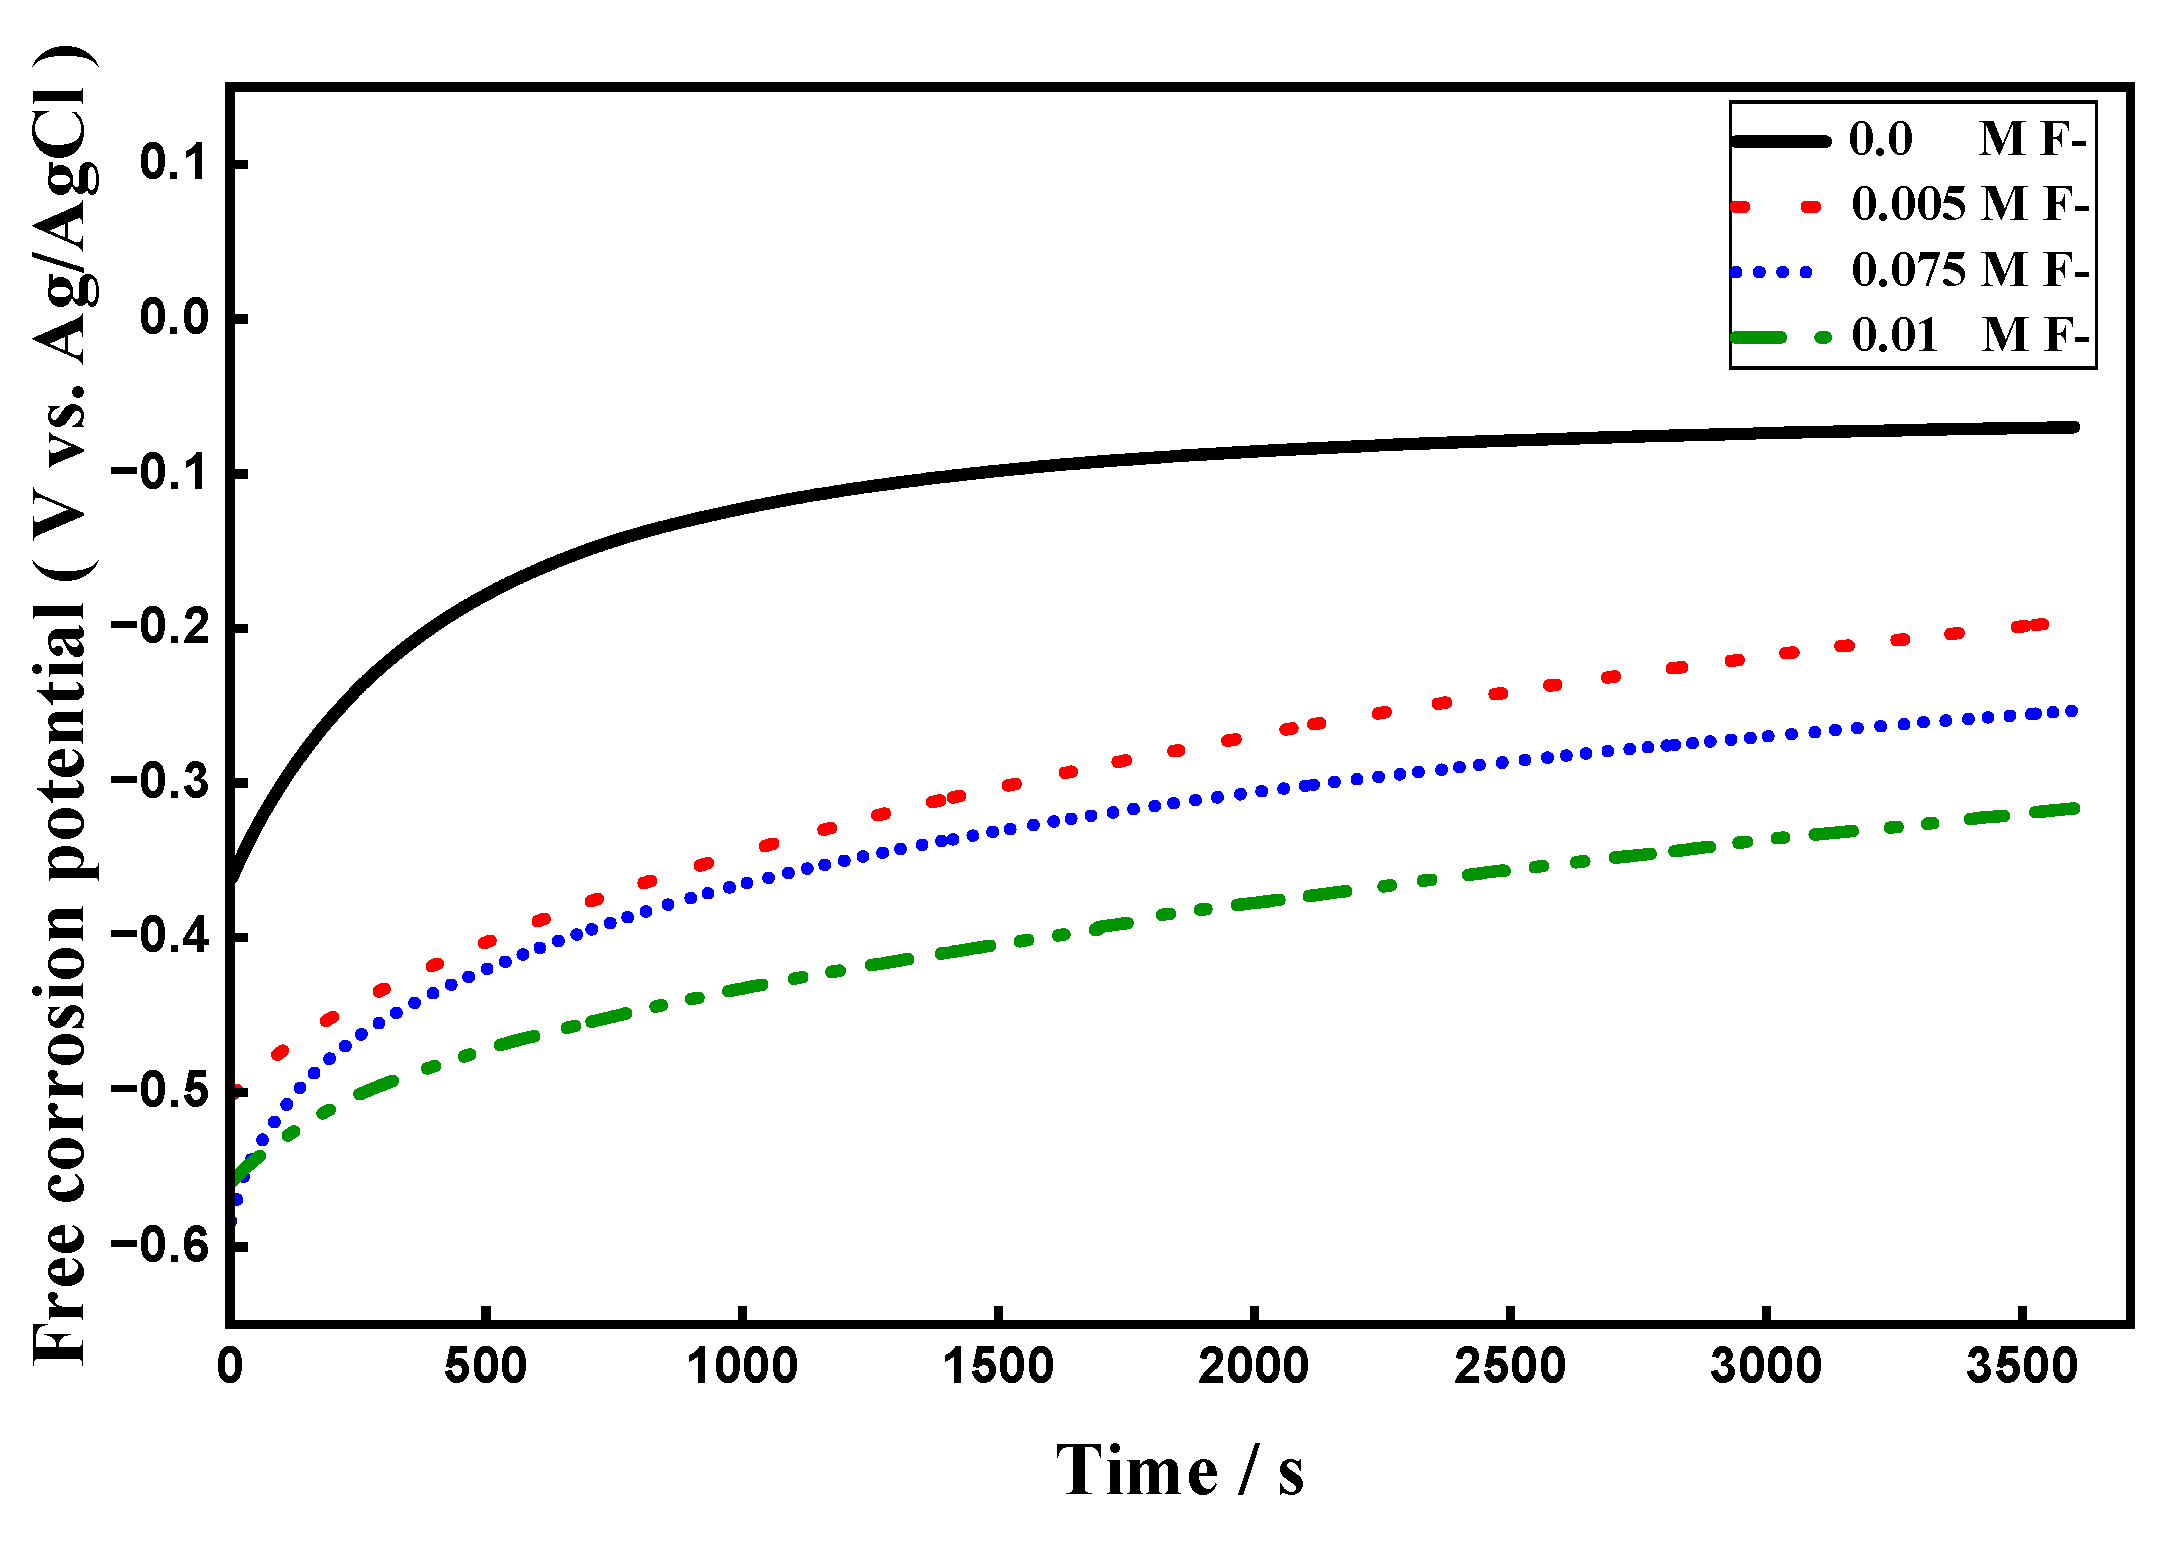
Figure 13.
PDP curves of TZNT alloy electrodes in ASW recorded with a scan rate of 5 mVs-1 at different solution temperatures, (inset) dependence of log Icorr on T−1 (K−1).
Figure 13.
PDP curves of TZNT alloy electrodes in ASW recorded with a scan rate of 5 mVs-1 at different solution temperatures, (inset) dependence of log Icorr on T−1 (K−1).
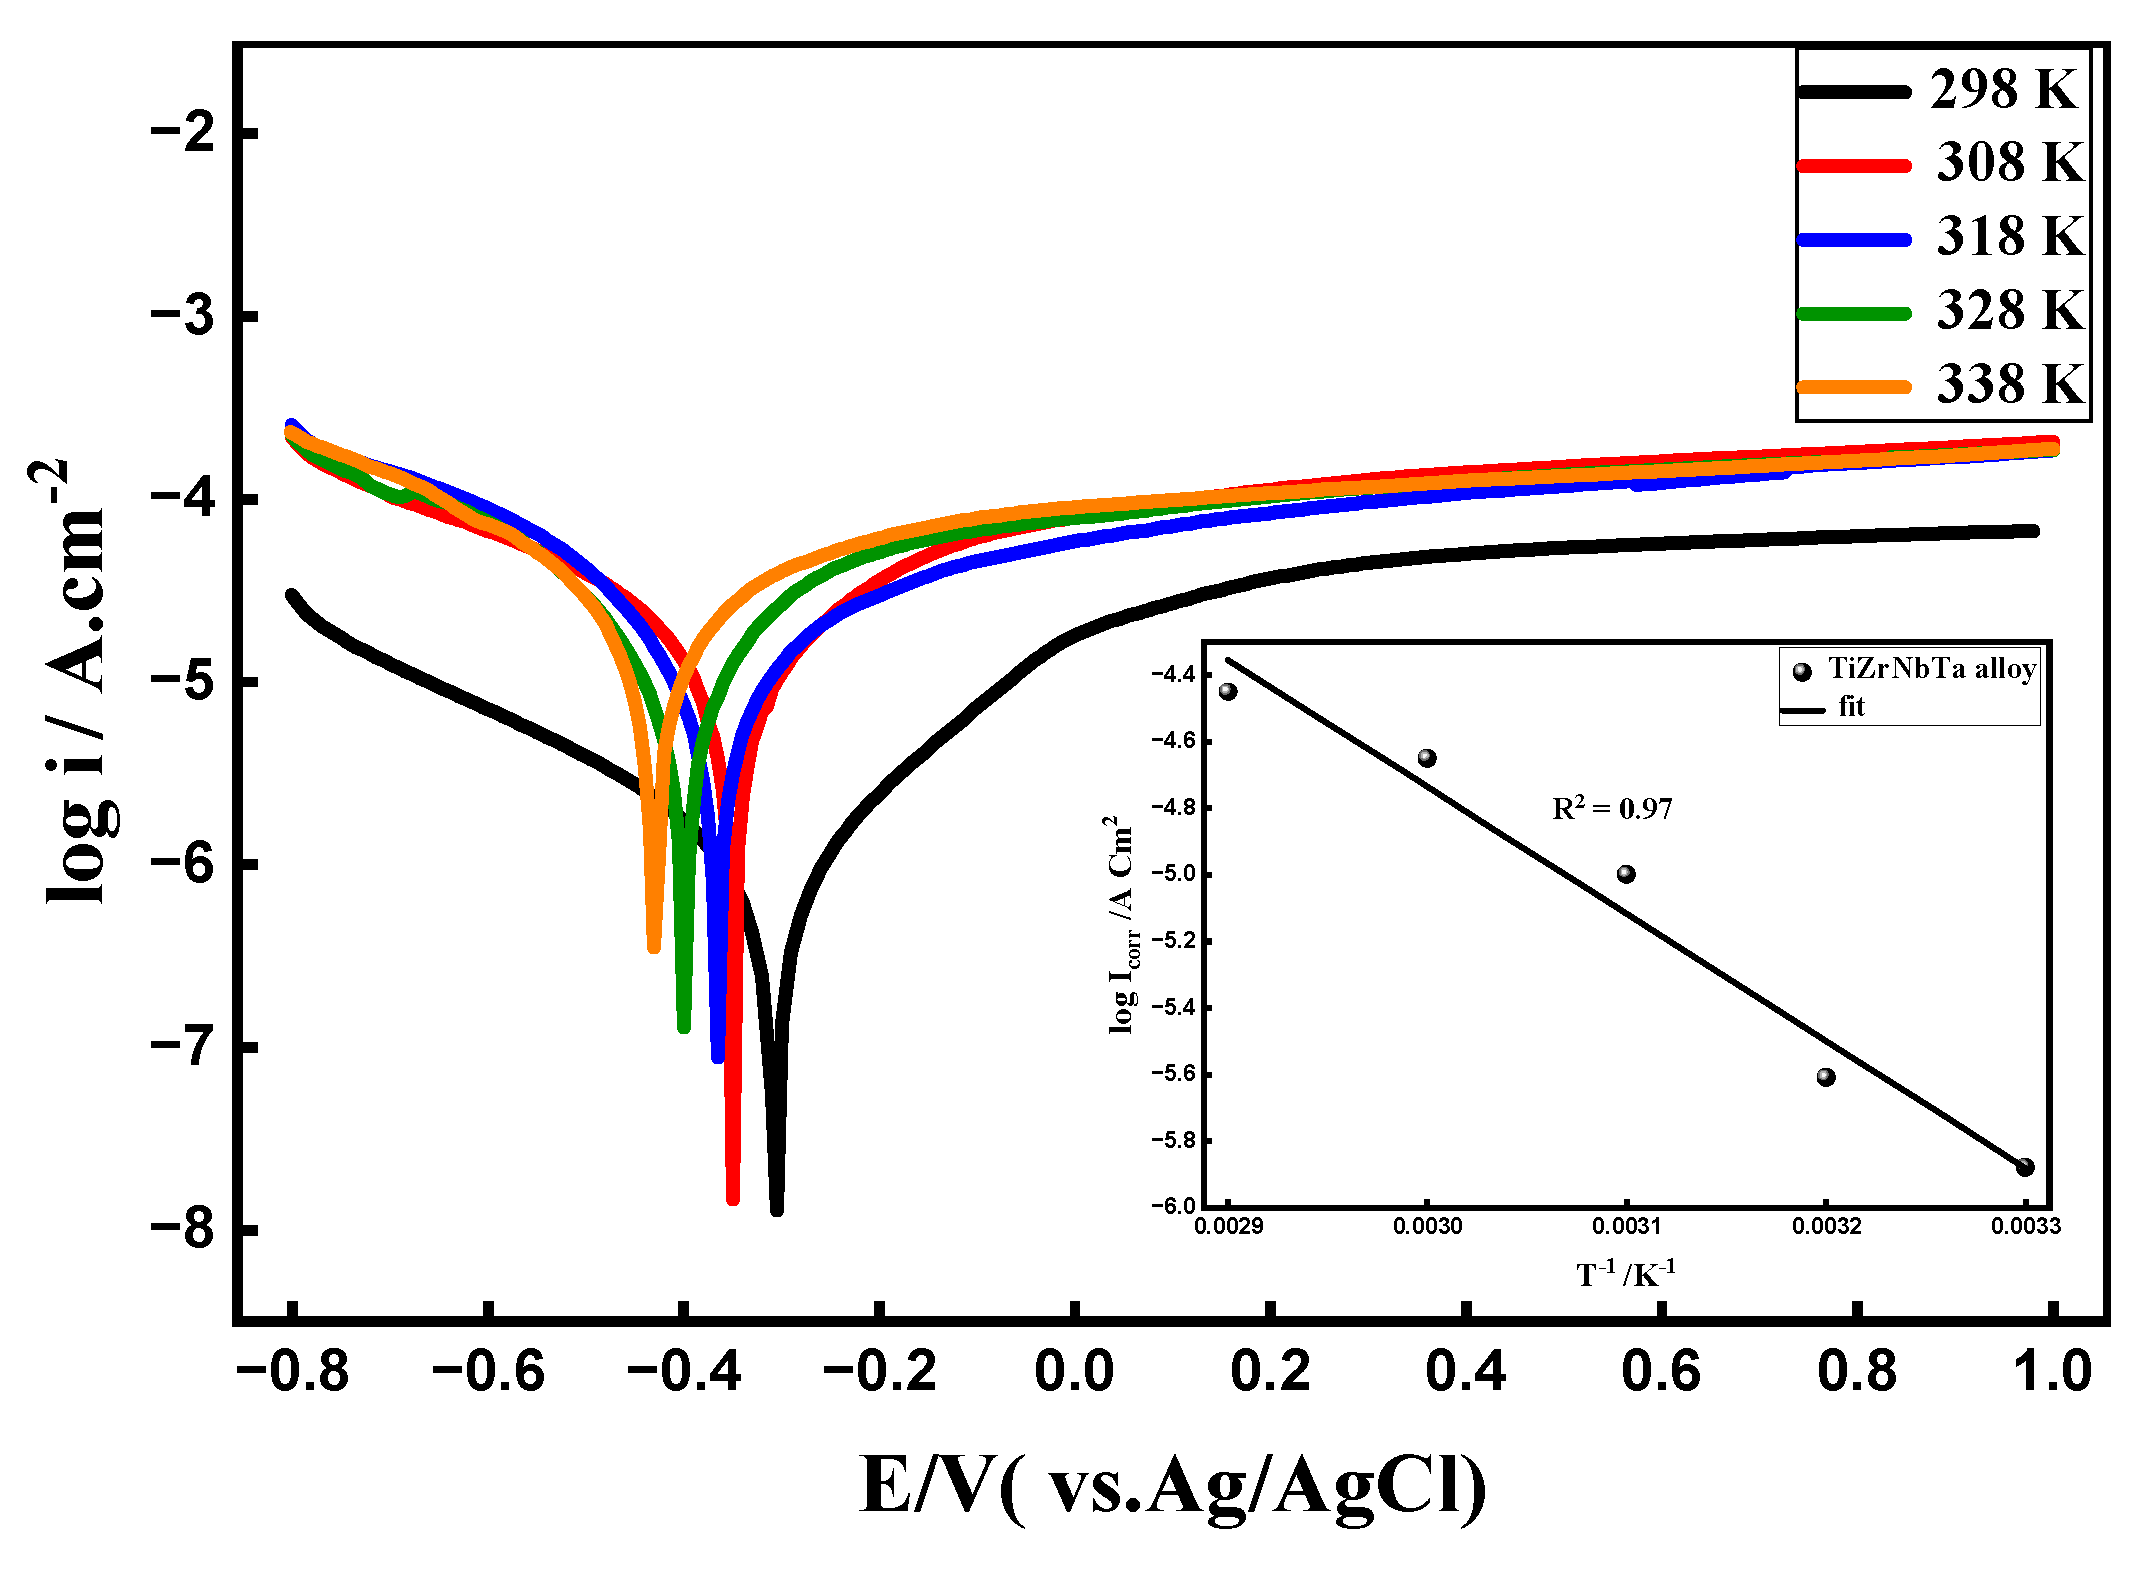
Figure 14.
PDP curves of TZNT alloy in ASW at different scan rates (5.0–40 mVs−1) at 25°C; (inset) dependence of the ipass on the ν1/2.
Figure 14.
PDP curves of TZNT alloy in ASW at different scan rates (5.0–40 mVs−1) at 25°C; (inset) dependence of the ipass on the ν1/2.
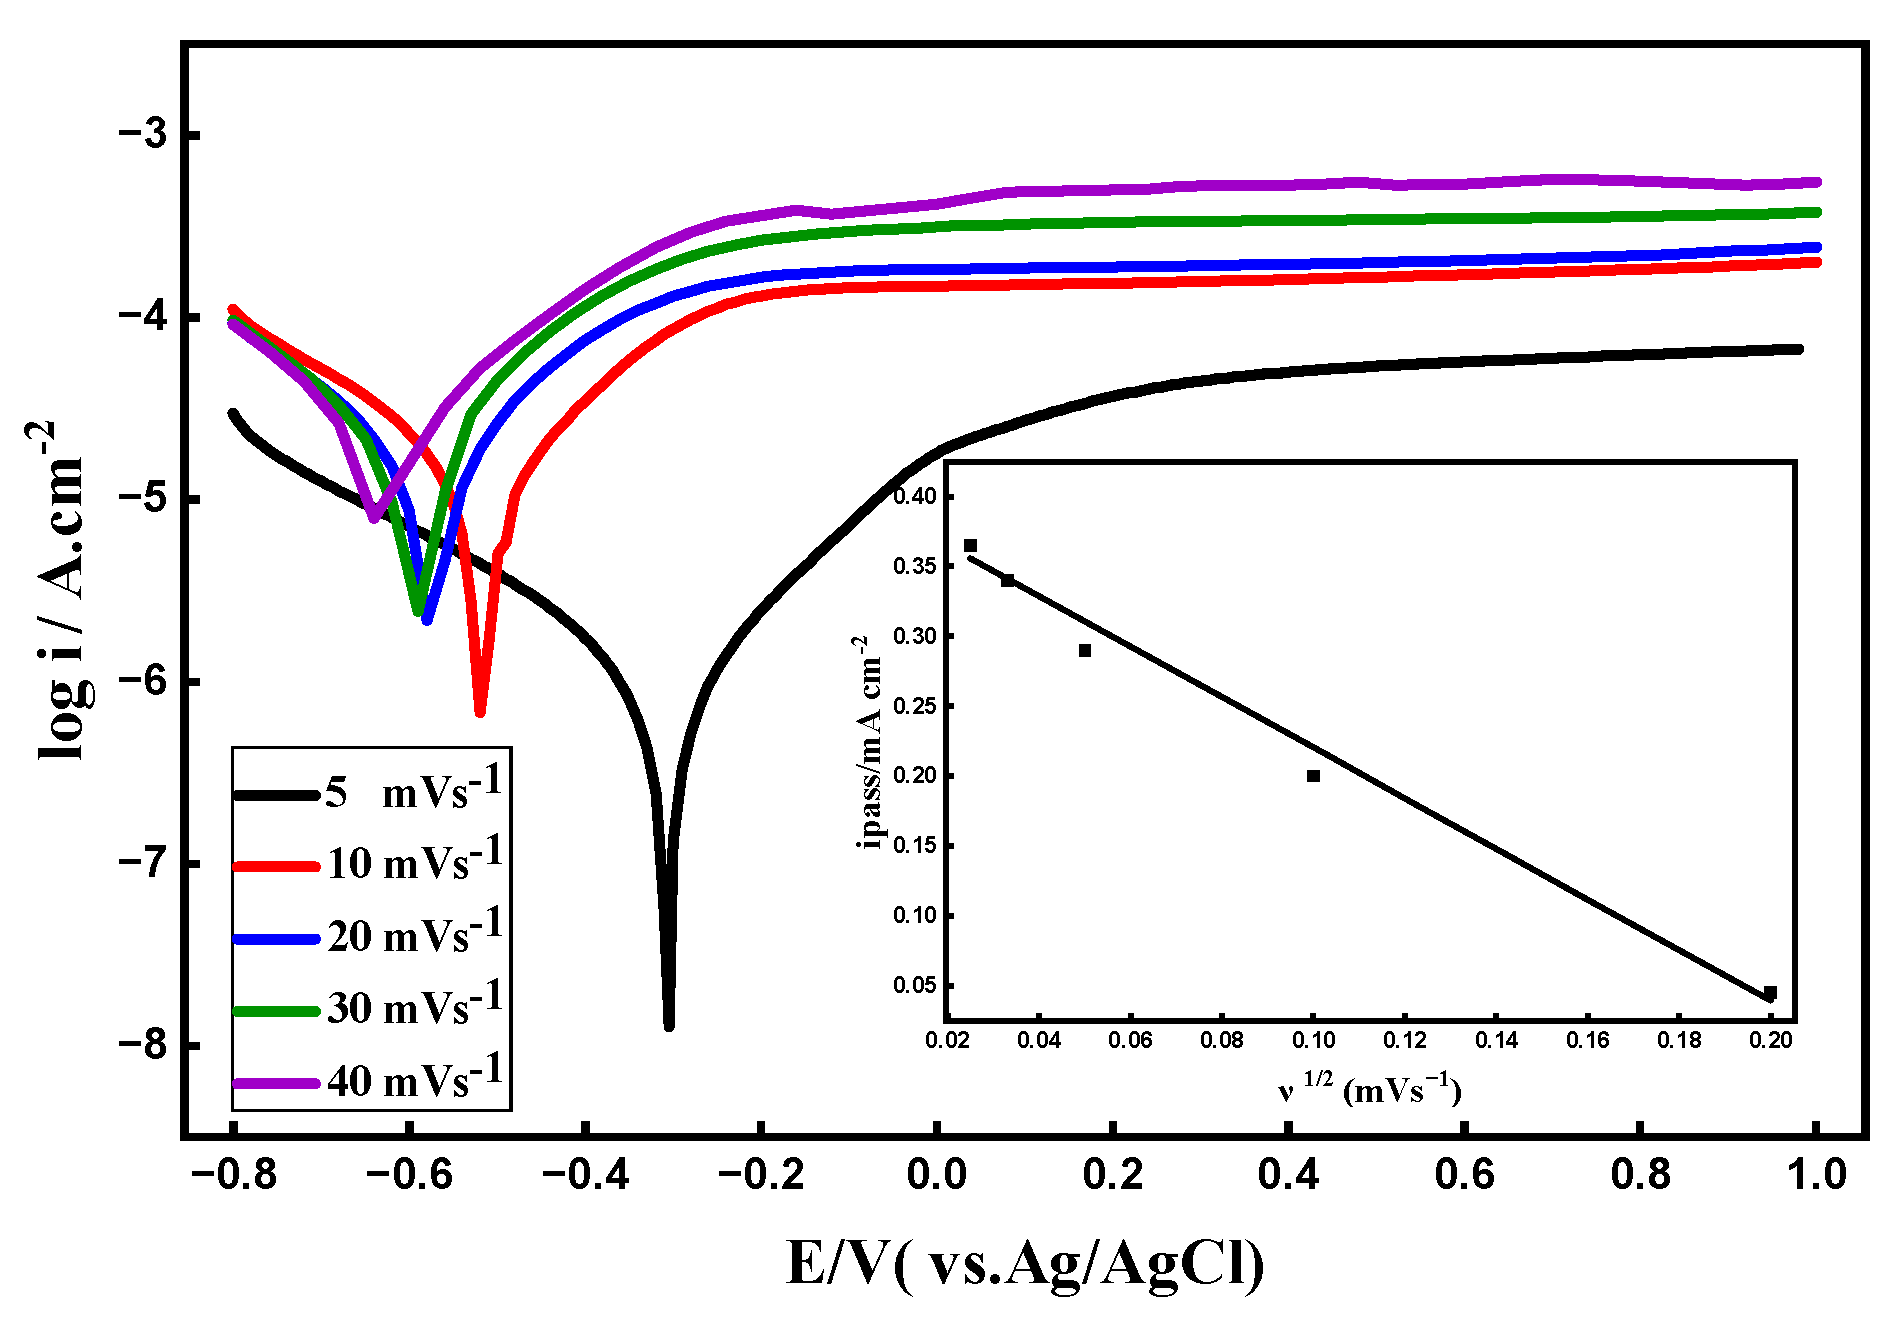
Figure 15.
PDP curves of TZNT alloy electrodes recorded with a scan rate of 5 mVs-1 after 15 days immersion in ASW with and without fluoride ions at pH 6.5.
Figure 15.
PDP curves of TZNT alloy electrodes recorded with a scan rate of 5 mVs-1 after 15 days immersion in ASW with and without fluoride ions at pH 6.5.
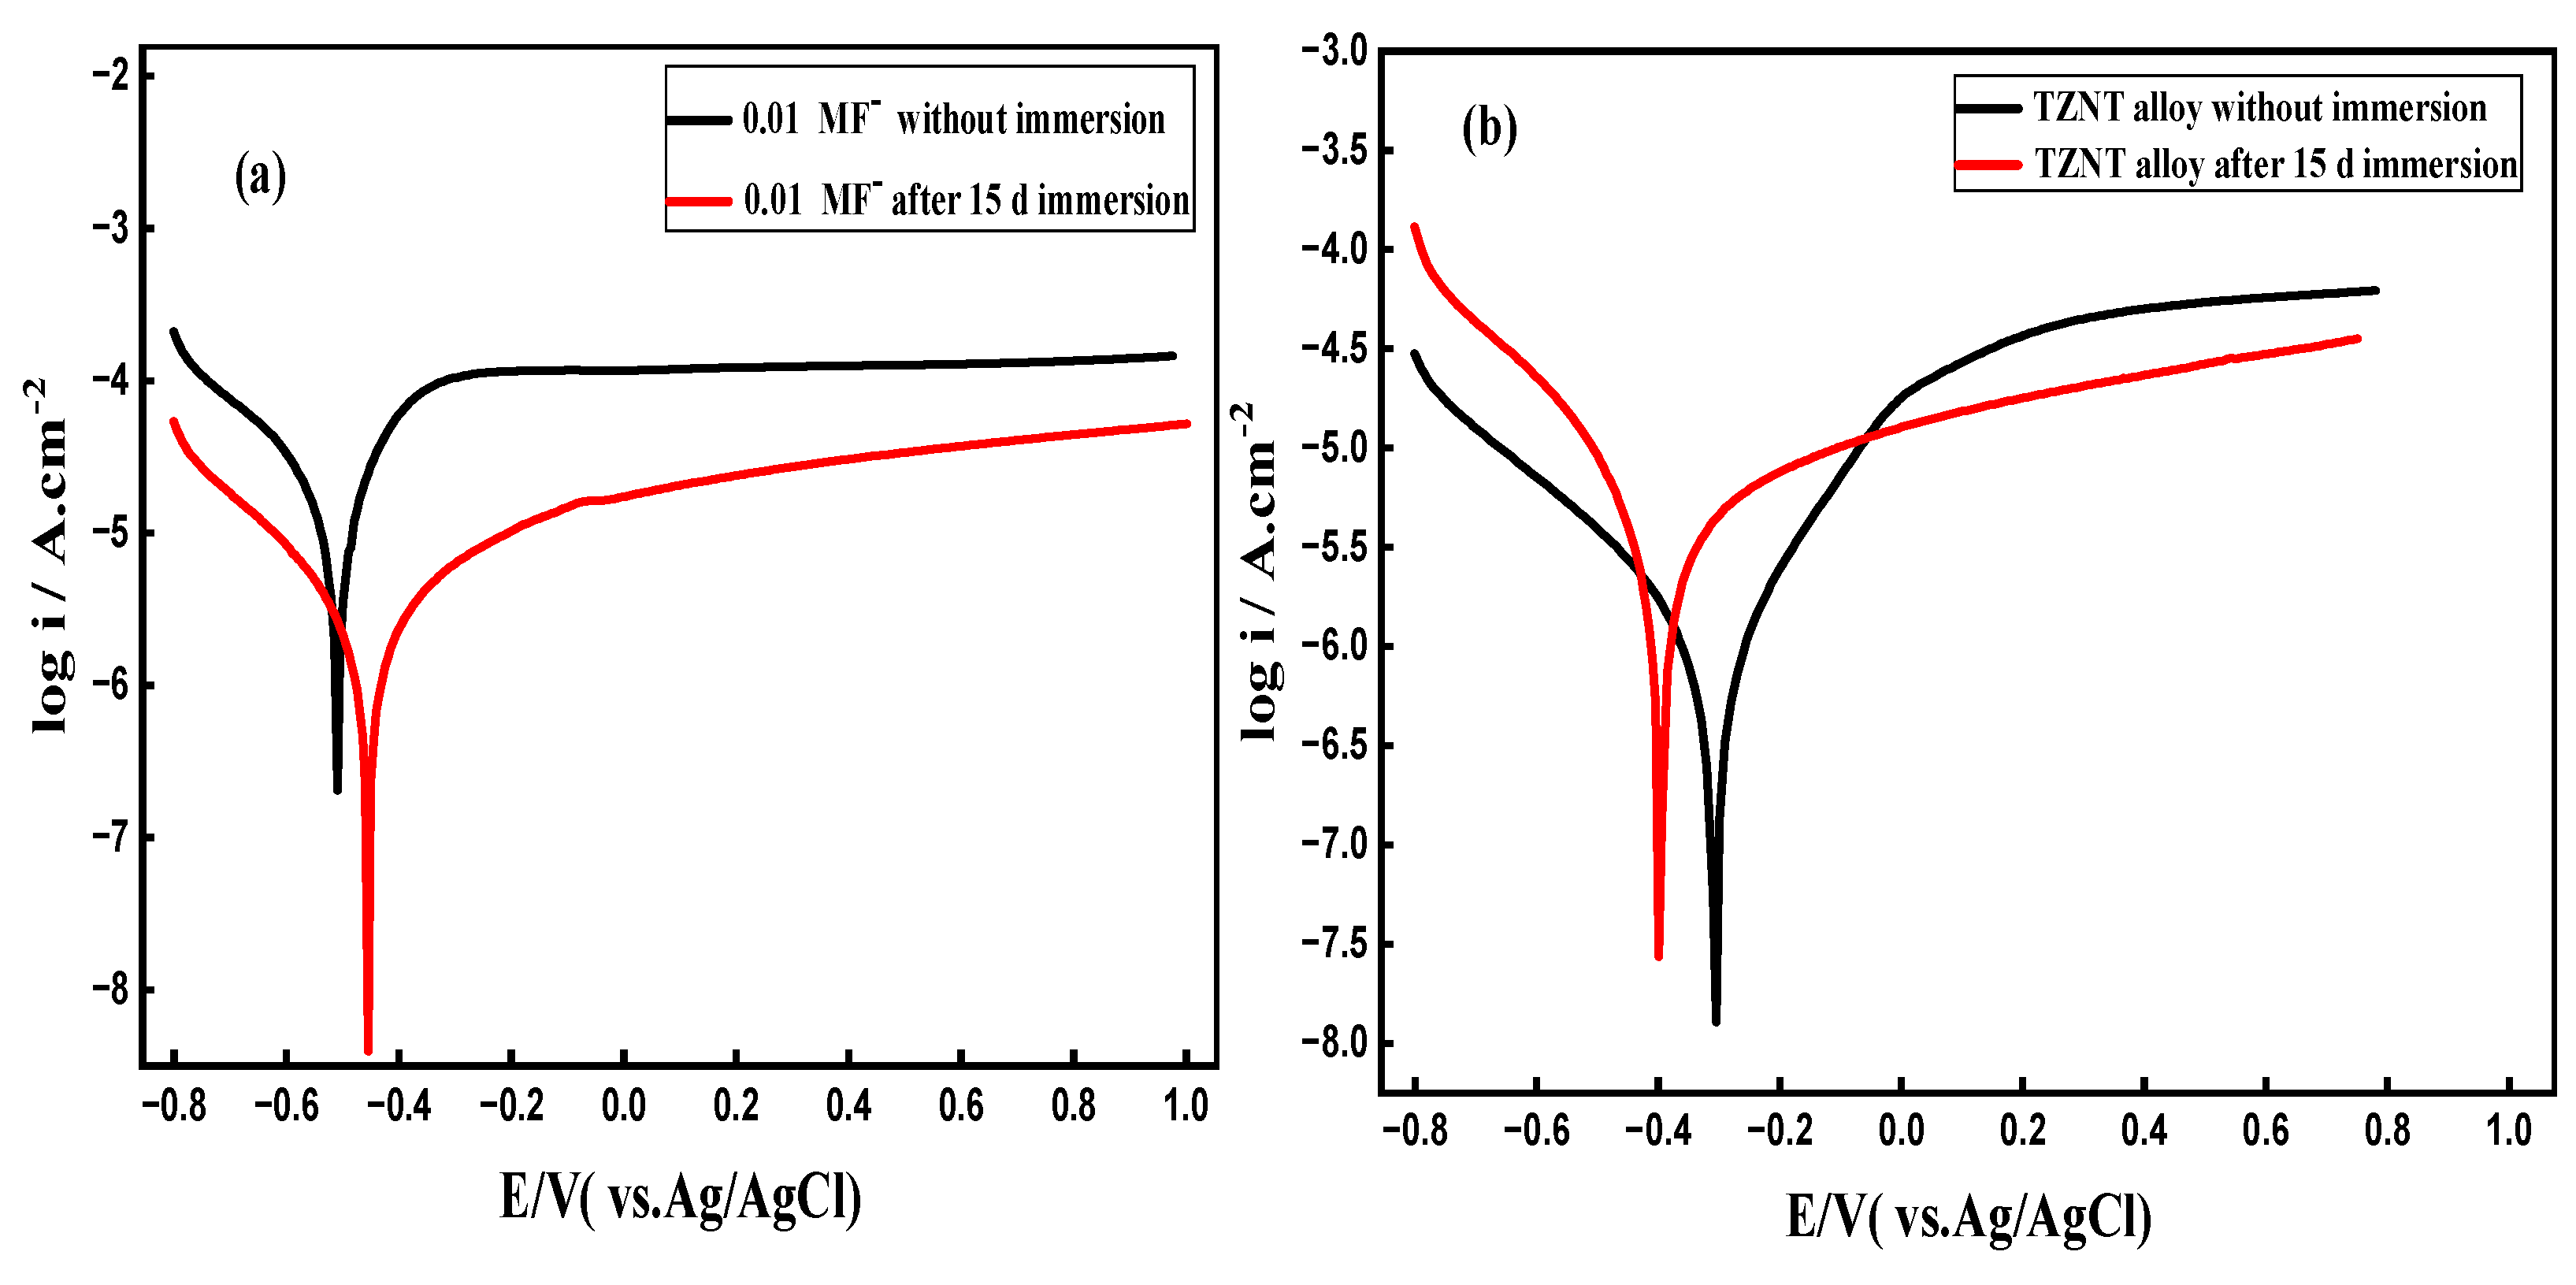
Figure 16.
(a,b) Bod plots and (c,d) Nyquist plots of EIS data of TZNT alloy after 15 days immersion in ASW with and without 0.01 M fluoride ions at pH 6.5.
Figure 16.
(a,b) Bod plots and (c,d) Nyquist plots of EIS data of TZNT alloy after 15 days immersion in ASW with and without 0.01 M fluoride ions at pH 6.5.
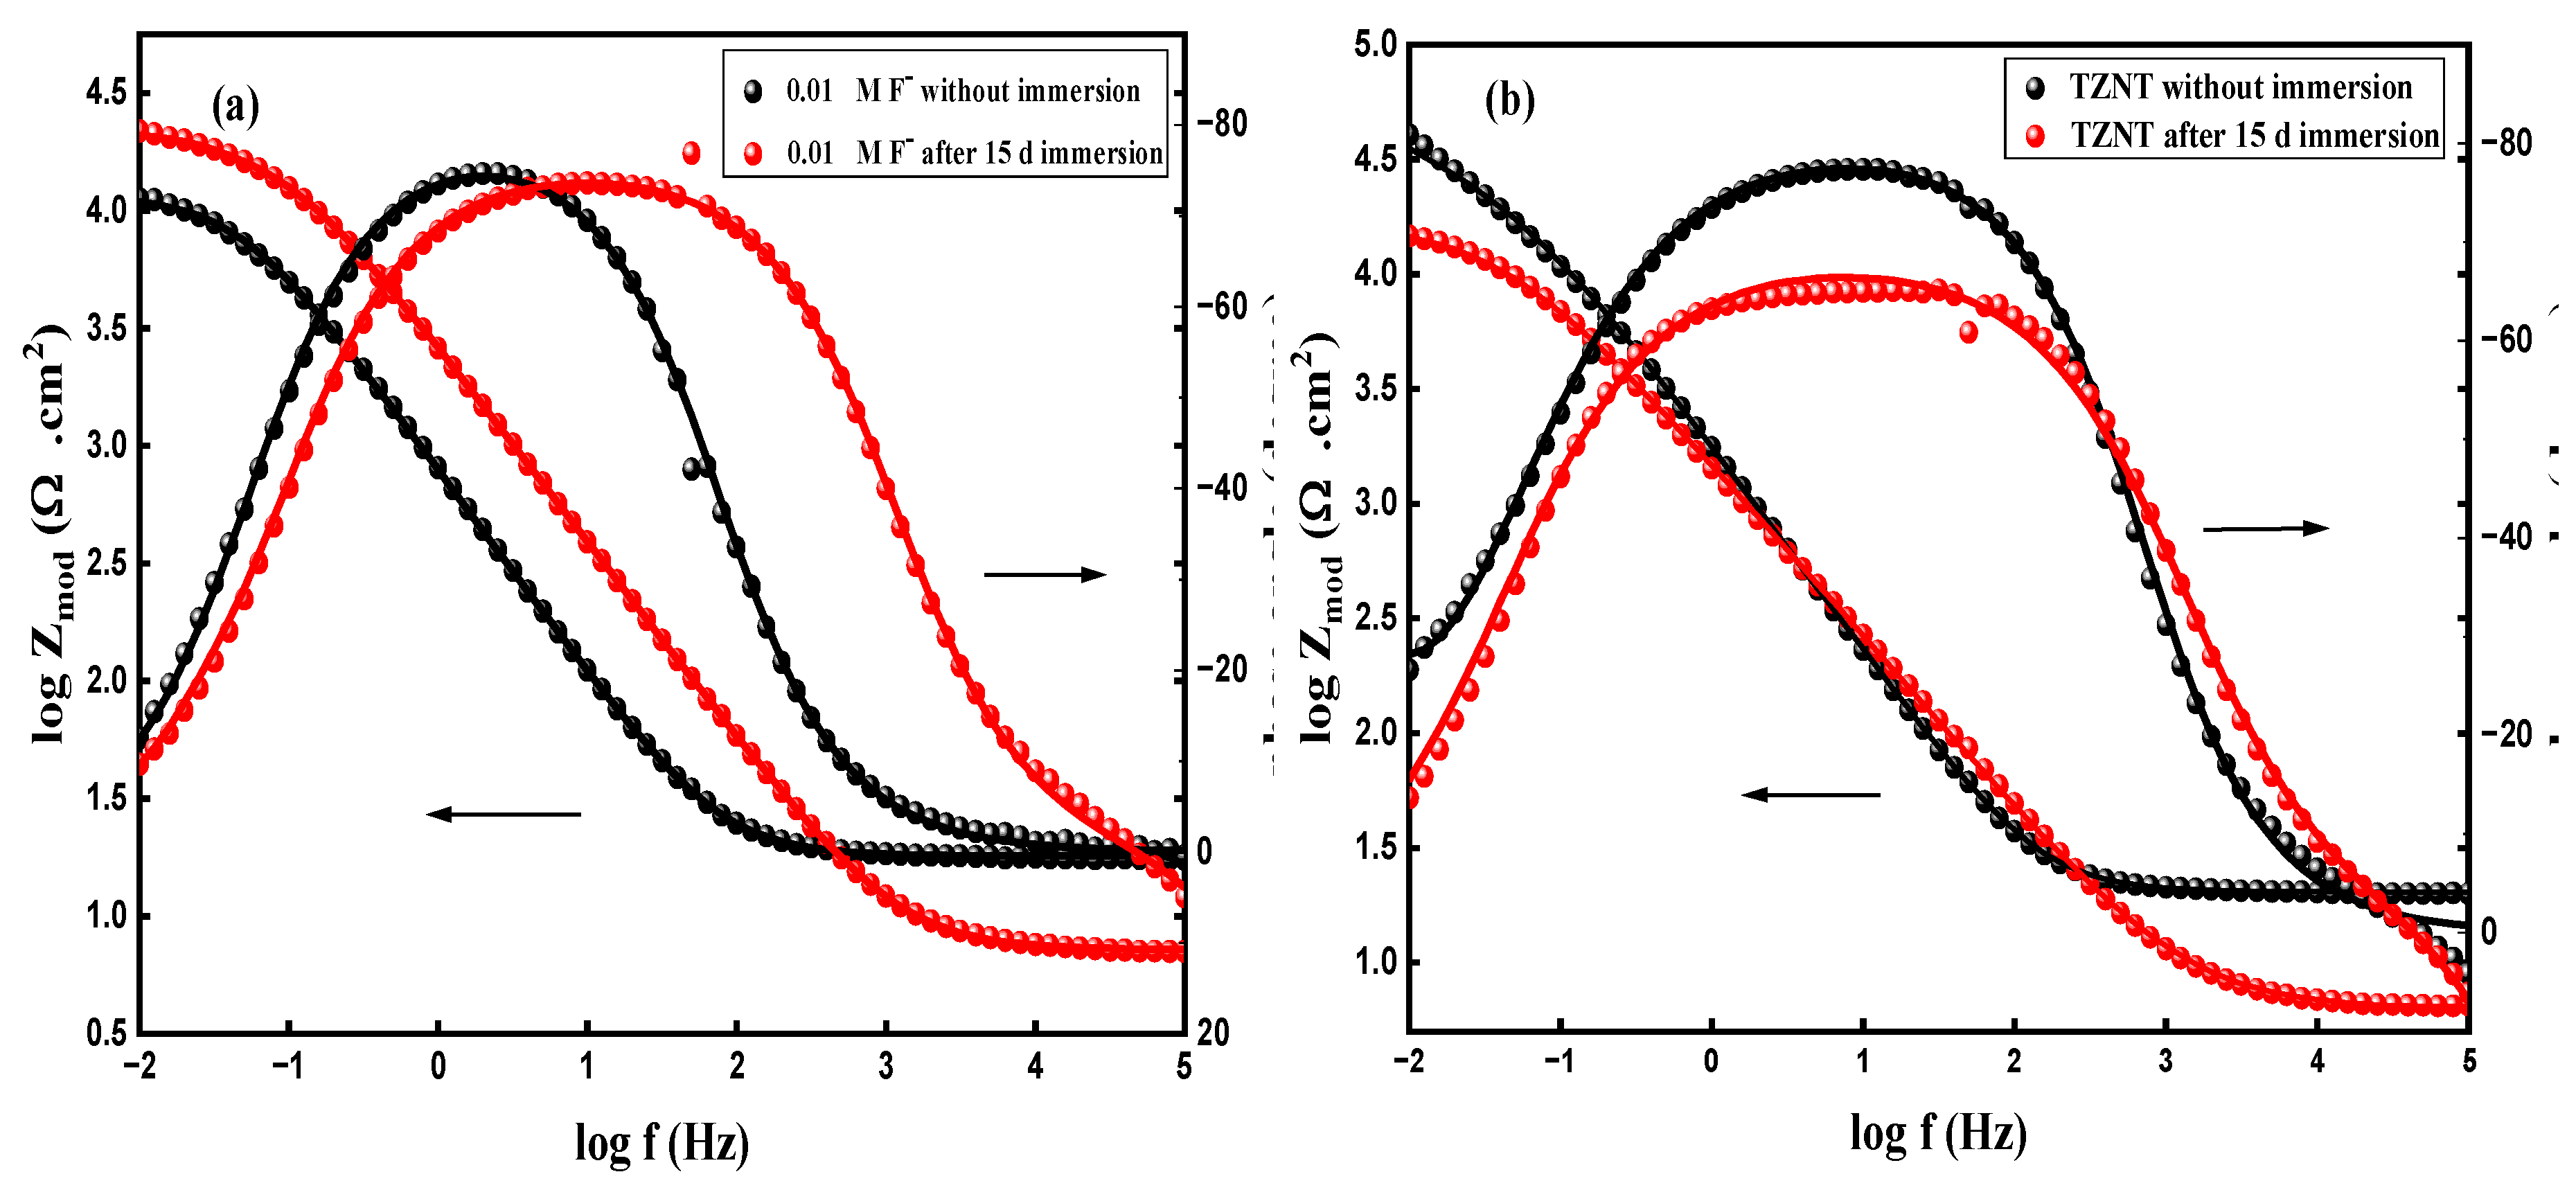
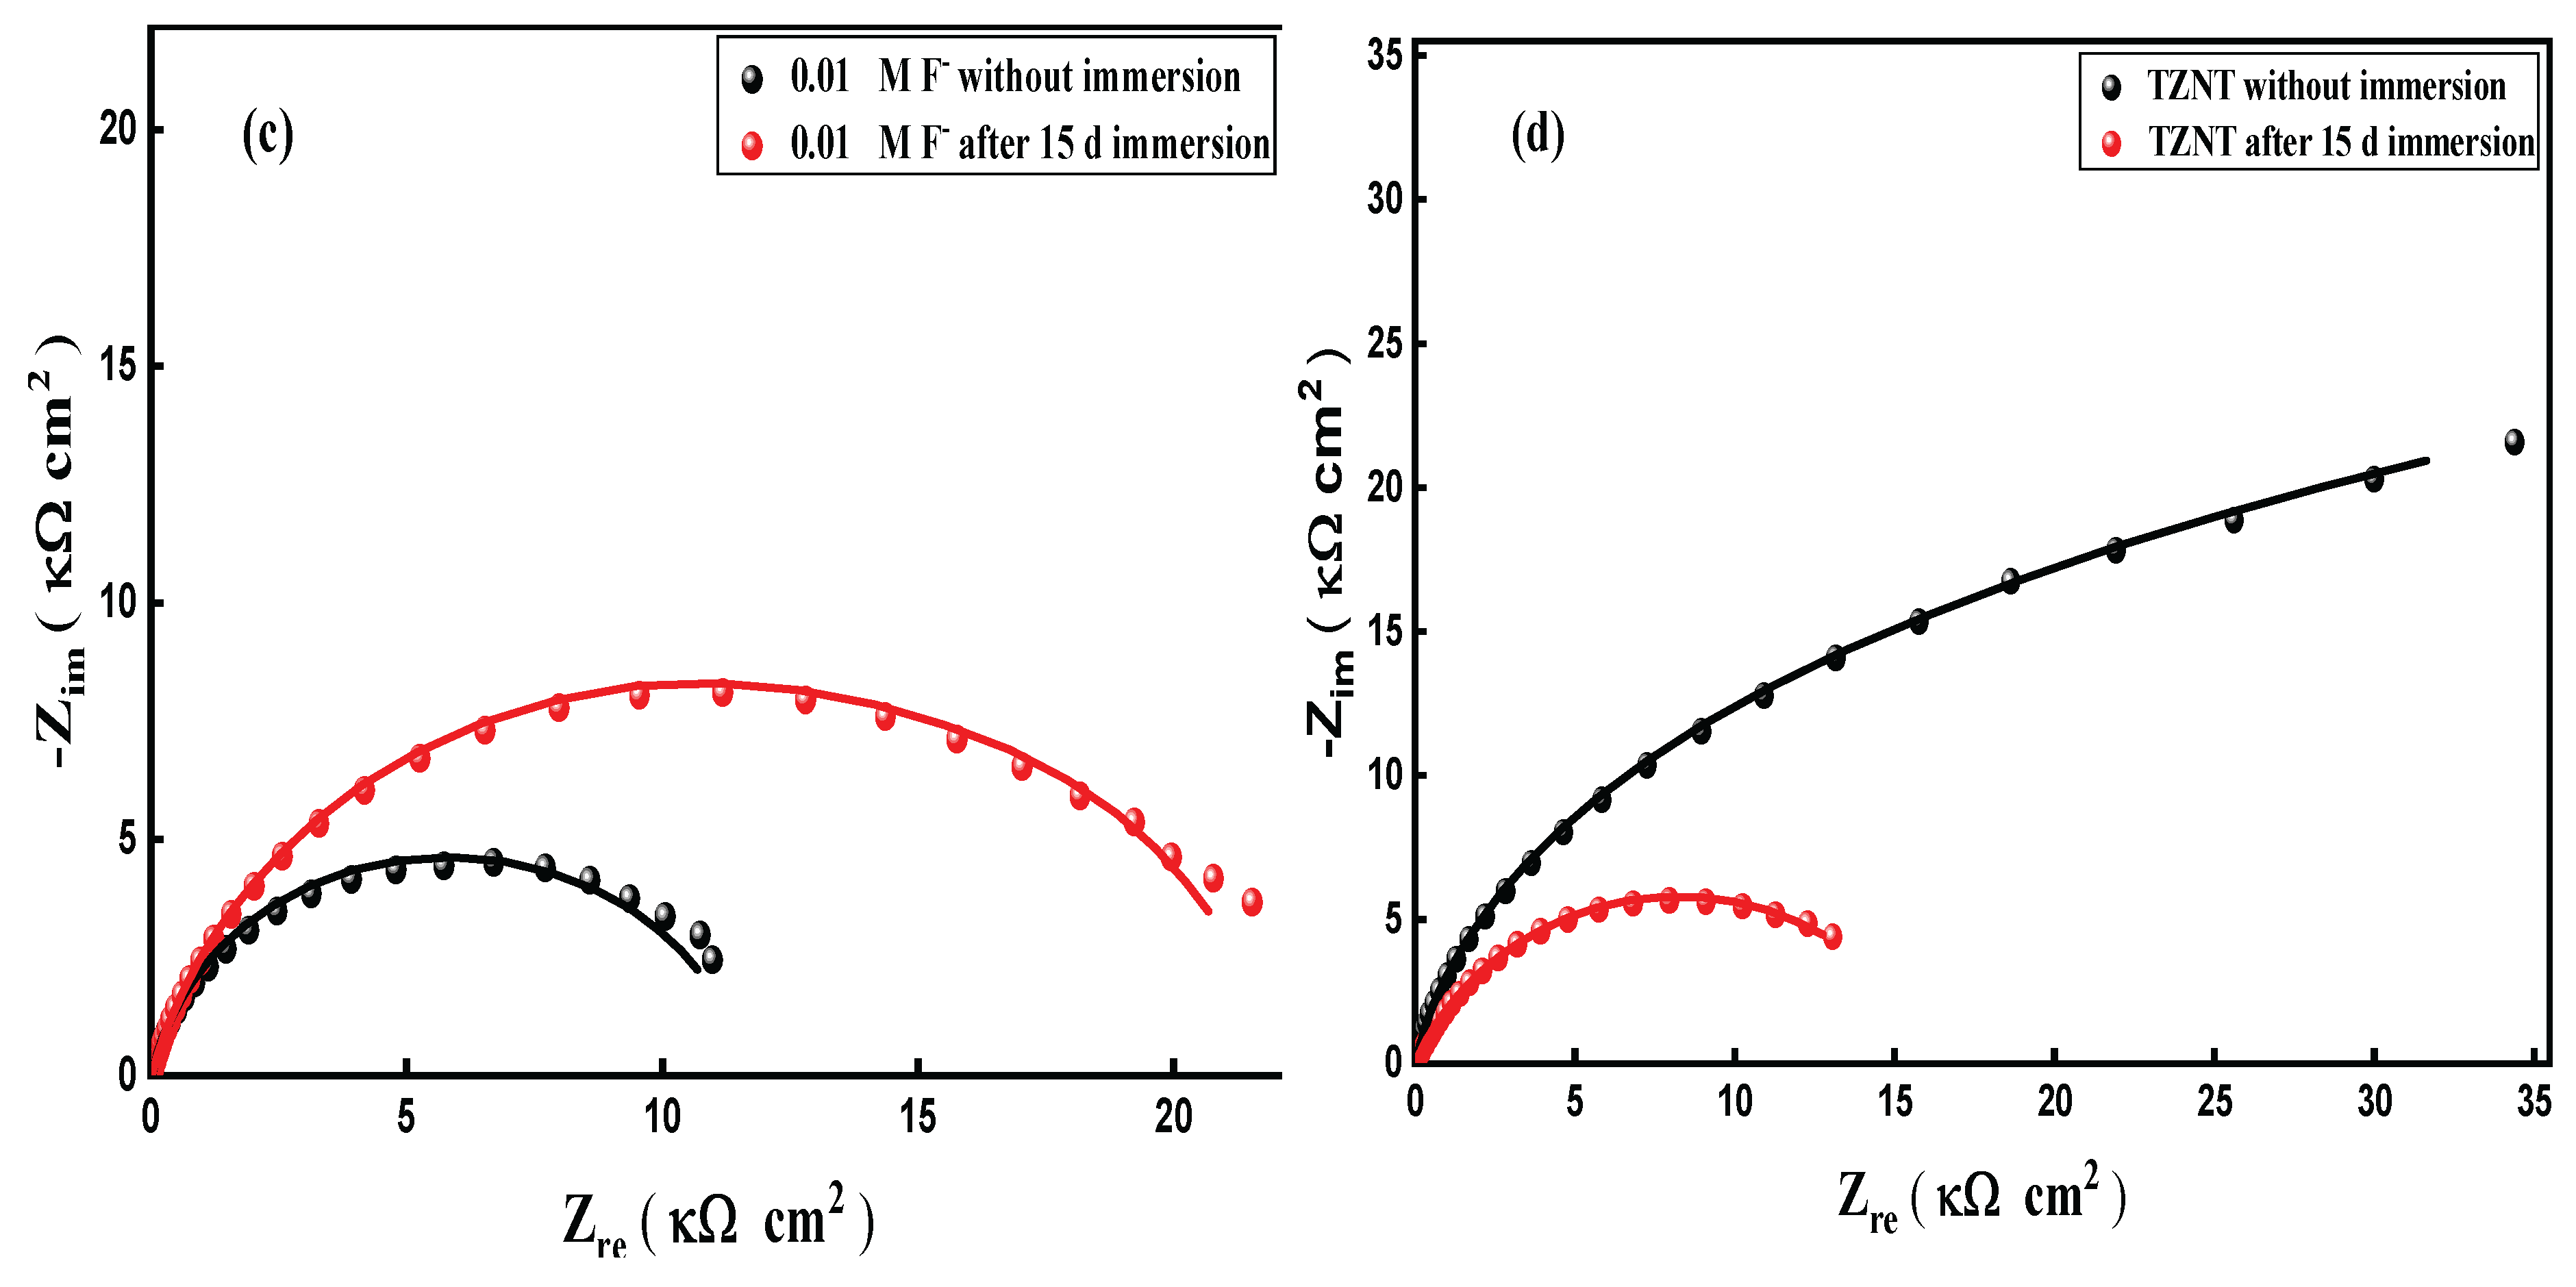
Figure 17.
Surface morphology of the TZNT alloy surface in ASW at pH 6.5 and 25°C following PDP without and with 0.01 M F.
Figure 17.
Surface morphology of the TZNT alloy surface in ASW at pH 6.5 and 25°C following PDP without and with 0.01 M F.
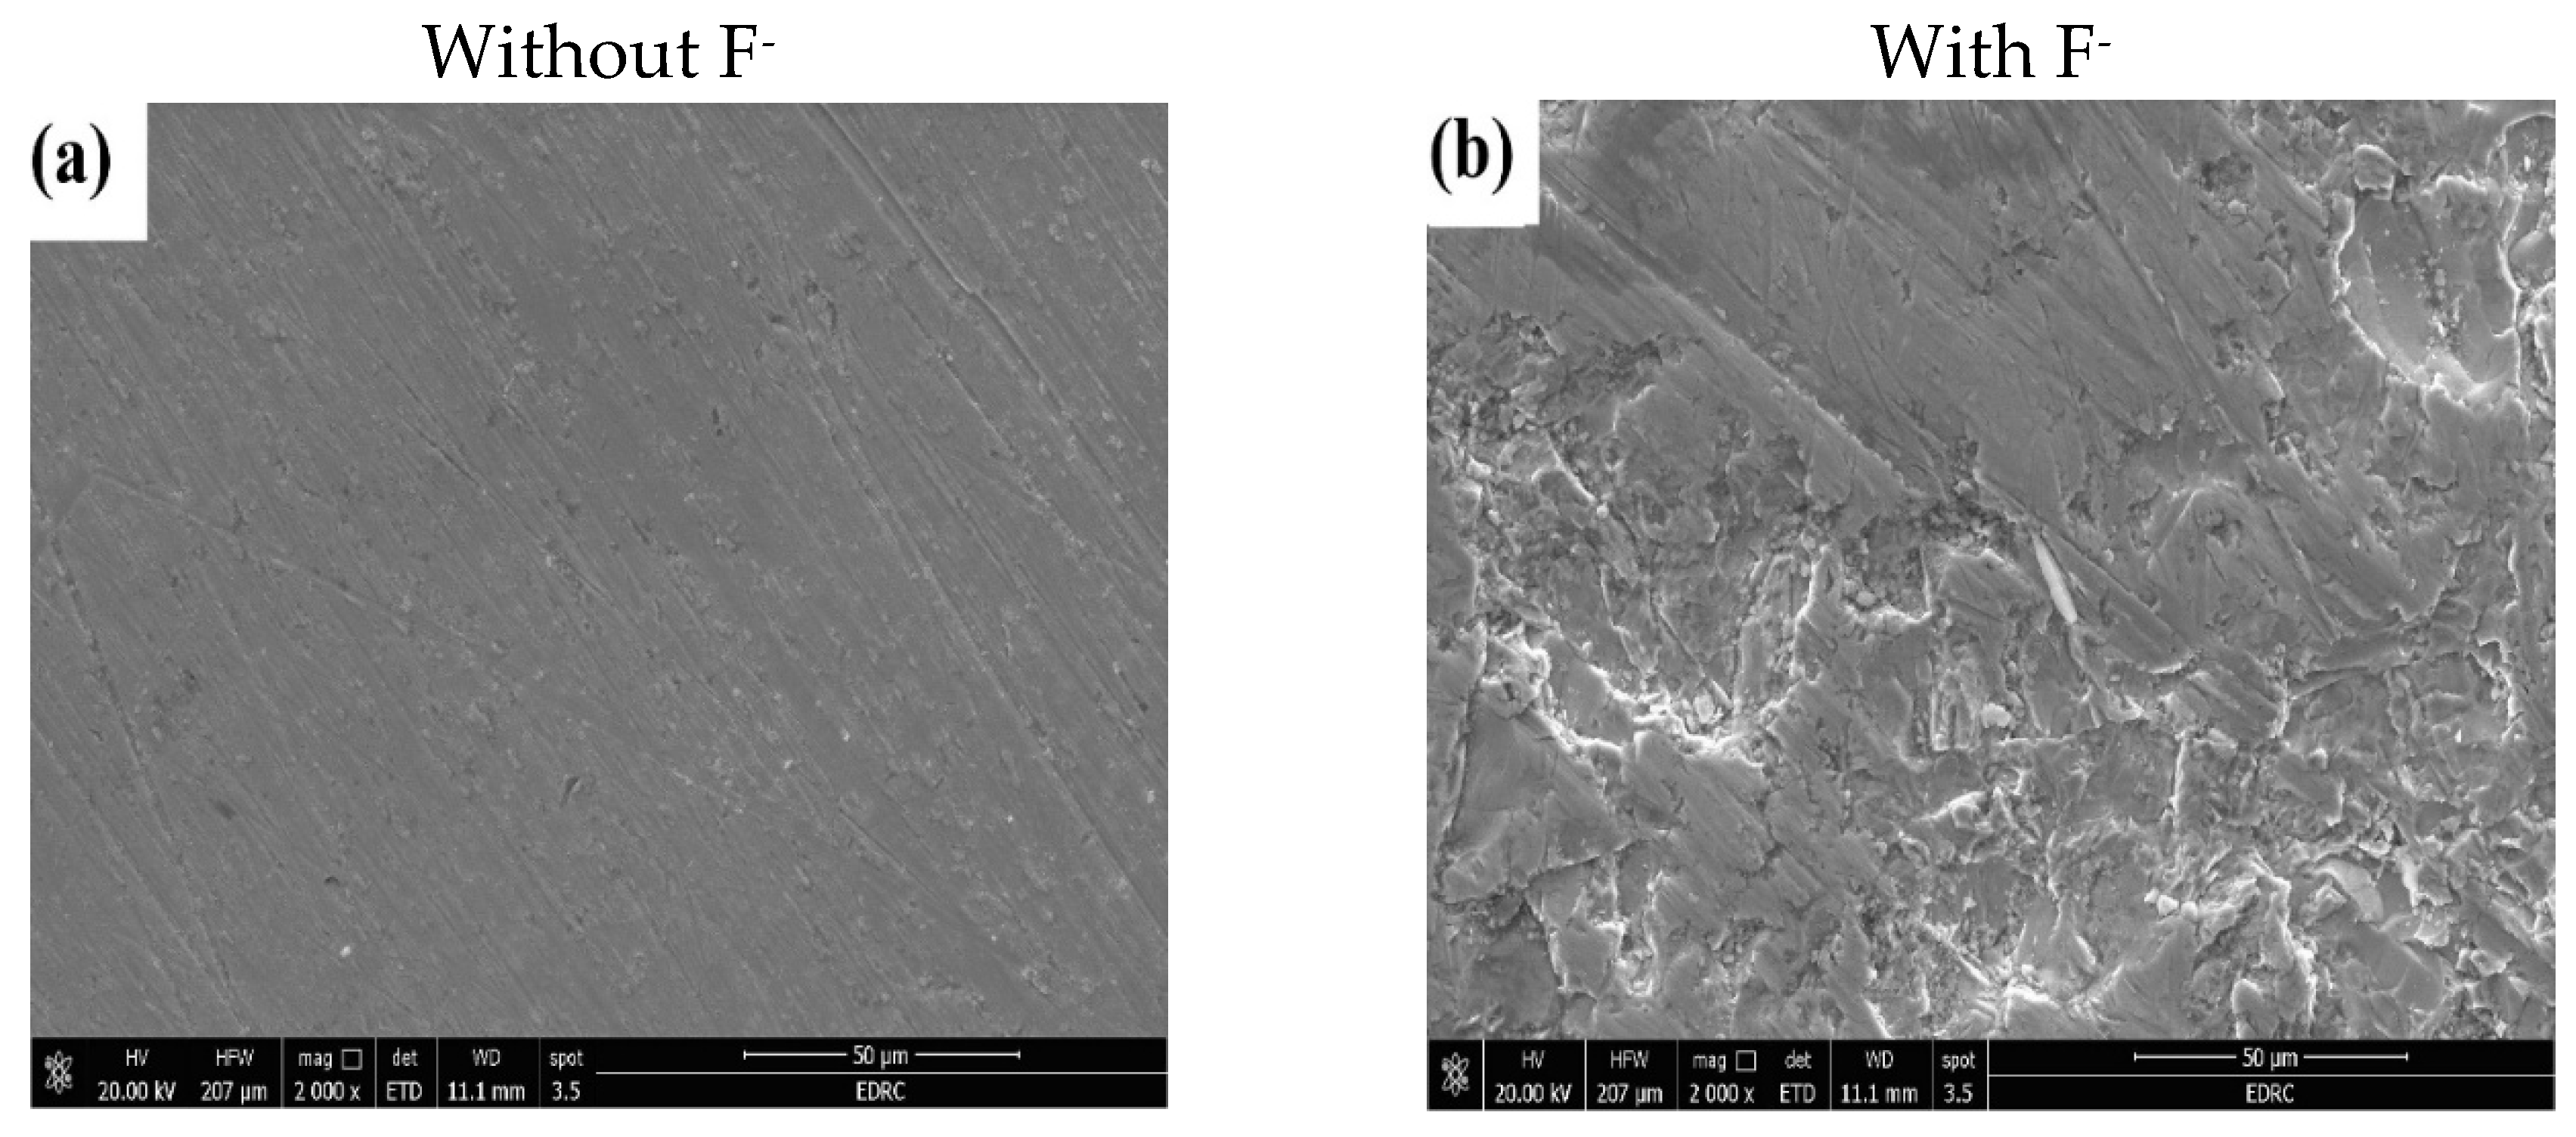
Figure 18.
XRD patterns for the as-received TZNT alloy and after potentiodynamic polarization in ASW in the absence and presence of F- ions.
Figure 18.
XRD patterns for the as-received TZNT alloy and after potentiodynamic polarization in ASW in the absence and presence of F- ions.
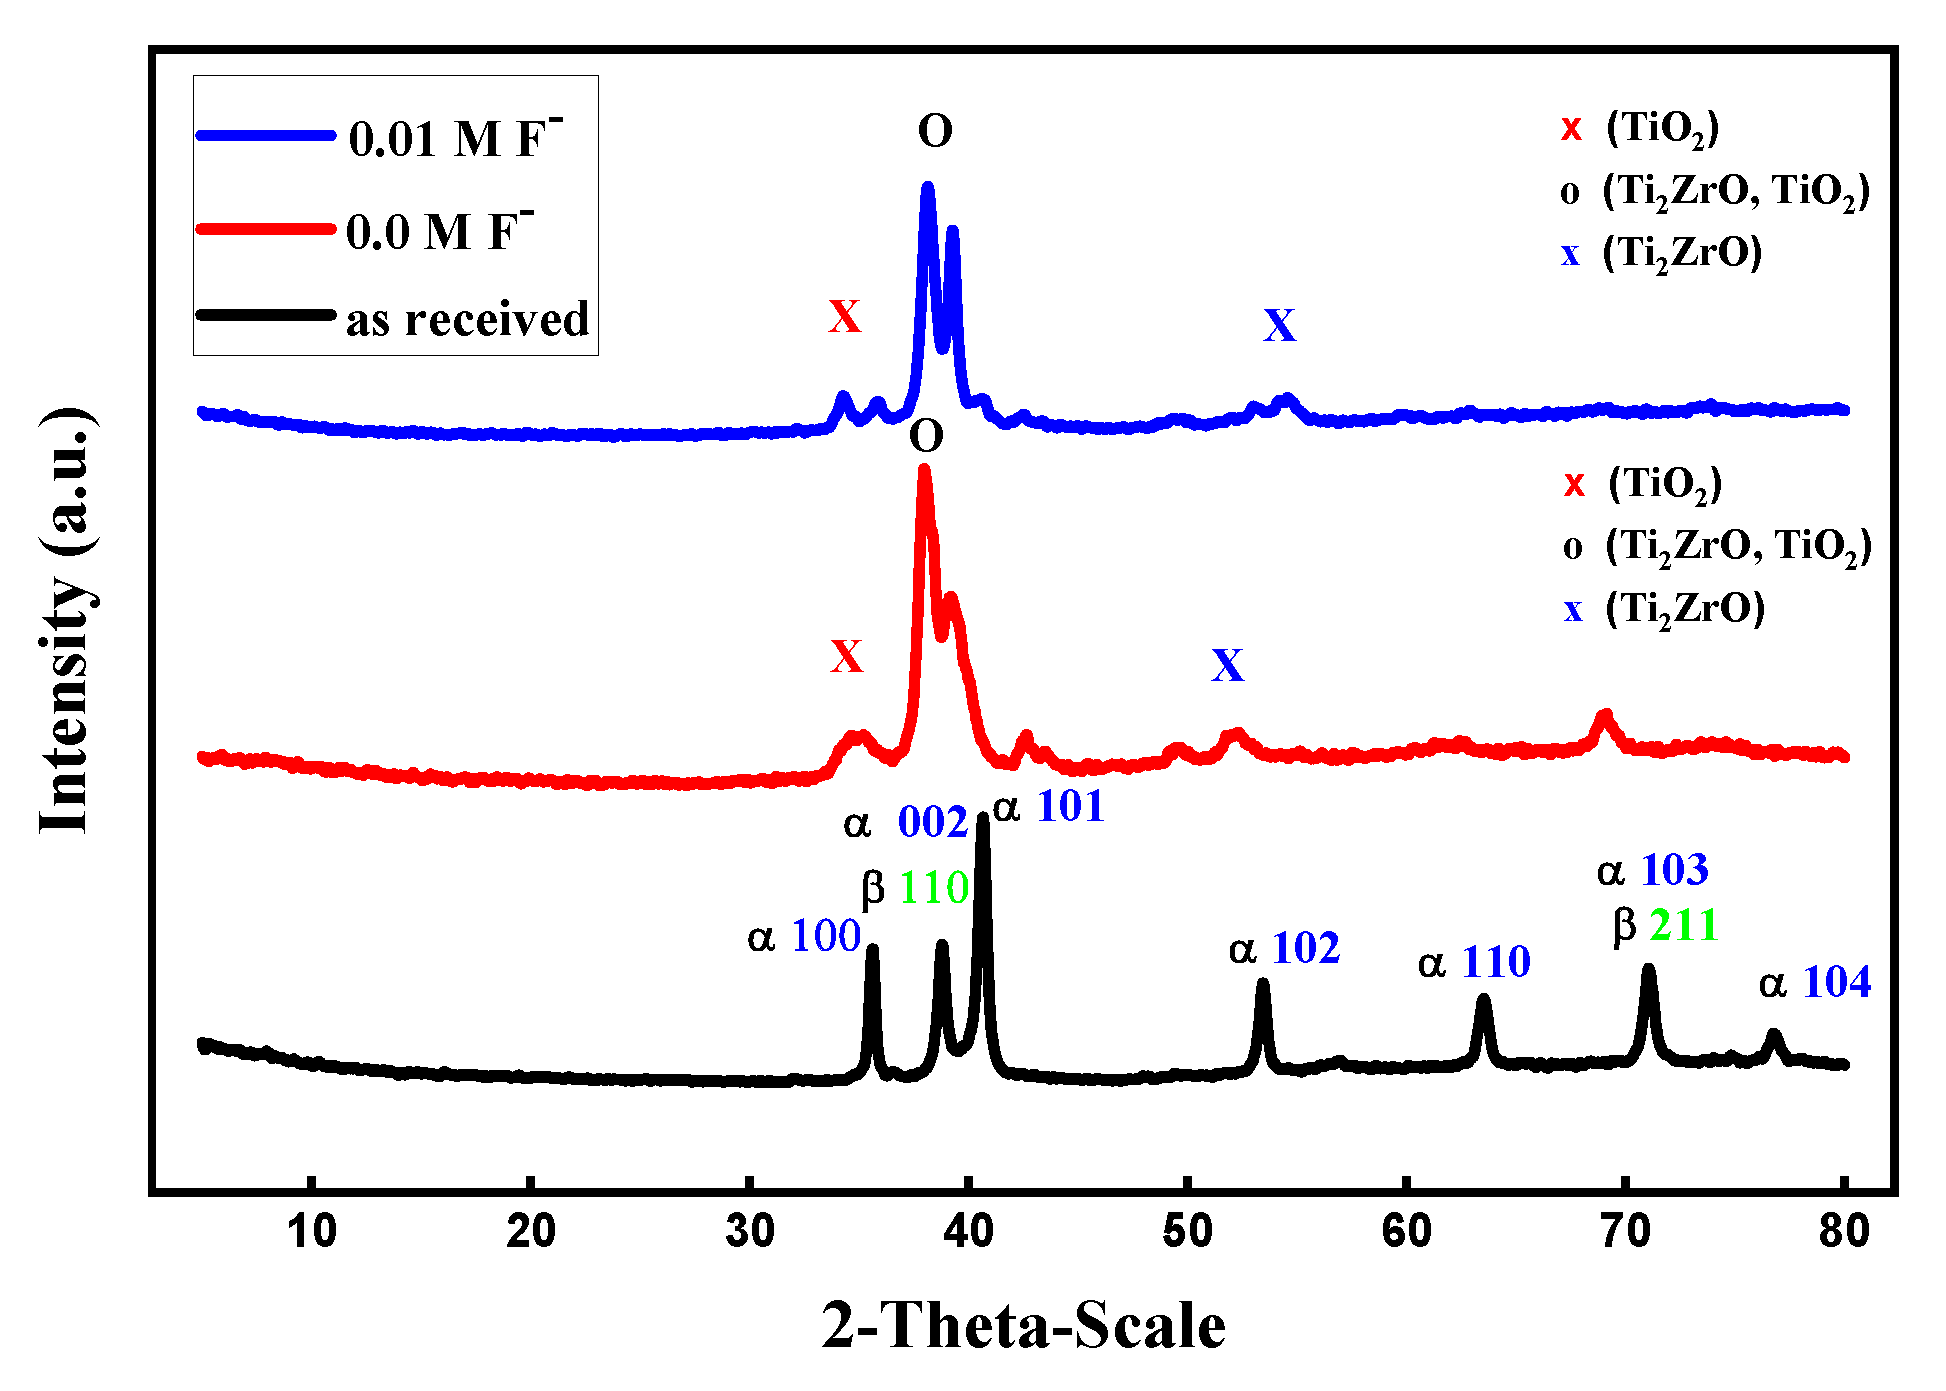

Table 1.
Tafel kinetic parameters obtained for a Ti and TZNT alloy in artificial seawater.
| Materials | ICorr A cm-2 |
-ECorr / V |
βa (V dec-1) |
βc (V dec-1) |
-Epass / V |
ipass mA cm-2 |
Corr Rate mpy |
Rp (k Ω cm2) |
|---|---|---|---|---|---|---|---|---|
| Ti |
6.26 x10⁻⁶ | 0.399 | 0.687 | 0.408 | 0.470 | 0.080 | 0.408 | 17.75 |
| TZNT alloy | 1.30 x10⁻⁶ | 0.306 | 0.274 | 0.368 | 0.235 | 0.041 | 0.168 | 52.47 |
Table 2.
EIS fitting parameters that were acquired for a Ti and TZNT alloy in ASW at pH 6.5 and 25°C.
Table 2.
EIS fitting parameters that were acquired for a Ti and TZNT alloy in ASW at pH 6.5 and 25°C.
| Materials | Rs (Ω cm2) |
Rb (kΩ cm2) |
CPEb (F cm2 HZ1-n1) |
n 1 |
Rp (Ω cm2) |
CPEp (F cm2 HZ1-n2) |
n 2 |
Rp (kΩ cm2) |
|---|---|---|---|---|---|---|---|---|
| Ti |
2.52 | 19.11 | 237.4x10⁻⁶ | 0.803 | 66.48 | 18.85x10⁻⁶ | 0.798 | 19.17 |
| TZNT alloy | 20.13 | 50.80 | 106.7x10⁻⁶ | 0..889 | 14.25 | 251.3x10⁻⁶ | 0.766 | 50.81 |
Table 3.
Tafel kinetic parameters obtained for a TZNT alloy in ASW with various pH values.
| pH | ICorr A cm-2 |
-ECorr / V |
βa (V dec-1) |
βc (V dec-1) |
-Epass / V |
ipass mA cm-2 |
Corr Rate Mpy |
|---|---|---|---|---|---|---|---|
| 6.5 | 1.30x10⁻⁶ | 0.306 | 0.274 | 0.368 | 0.235 | 0.041 | 0.168 |
| 4.0 | 4.66x10⁻⁶ | 0.378 | 0.175 | 0.296 | 0.0.34 | 0.080 | 0.600 |
| 3.0 | 8.89x10⁻⁶ | 0.429 | 0.143 | 0.204 | -0.179 | 0.085 | 1.145 |
| 2.0 | 4.14x10⁻⁵ | 0.454 | 0.345 | 0.312 | -0.129 | 0.089 | 5.334 |
Table 4.
Fitting parameters of EIS obtained for a TZNT alloy in ASW with various pH.
| pH | Rs (Ω cm2) |
Rb (kΩ cm2) |
CPEb (F cm2 HZ1-n1) |
n 1 |
Rp (Ω cm2) |
CPEp (F cm2 HZ1-n2) |
n 2 |
|---|---|---|---|---|---|---|---|
| 6.5 | 20.13 | 50.80 | 106.7x10⁻⁶ | 0..889 | 14.25 | 251.3x10⁻⁶ | 0.766 |
| 4.0 | 28.95 | 26.65 | 146.3x10⁻⁶ | 0.840 | 62.90 | 345.8x10⁻⁶ | 0.699 |
| 3.0 | 44.35 | 19.07 | 189.4x10⁻⁶ | 0.832 | 29.07 | 410.2x10⁻⁶ | 0.915 |
| 2.0 | 24.11 | 12.63 | 281.0x10⁻⁶ | 0.820 | 16.14 | 476.1x10⁻⁶ | 0.862 |
Table 5.
Tafel kinetic parameters obtained for a TZNT alloy in ASW with various concentrations of fluoride ions at pH 6.5.
Table 5.
Tafel kinetic parameters obtained for a TZNT alloy in ASW with various concentrations of fluoride ions at pH 6.5.
| F- / M | ICorr A cm-2 |
-ECorr / V |
βa (V dec-1) |
βc (V dec-1) |
Epass / V |
ipass mA cm-2 |
Corr Rate Mpy |
|---|---|---|---|---|---|---|---|
| 0.0 | 1.30 x10⁻⁶ | 0.306 | 0.274 | 0.368 | 0.235 | 0.041 | 0.168 |
| 0.005 | 2.59 x10⁻⁶ | 0.341 | 0.220 | 0.267 | 0.130 | 0.076 | 0.336 |
| 0.0075 | 3.59 x10⁻⁶ | 0.360 | 0.159 | 0.219 | 0.040 | 0.103 | 0.463 |
| 0.01 | 4.76 x10⁻⁵ | 0.557 | 0.279 | 0.582 | -0.239 | 0.142 | 6.129 |
Table 6.
Fitting parameters of EIS obtained for a TZNT alloy in ASW with various concentrations of fluoride ions at pH 6.5.
Table 6.
Fitting parameters of EIS obtained for a TZNT alloy in ASW with various concentrations of fluoride ions at pH 6.5.
| F- / M | Rs (Ω cm2) |
Rb (kΩ cm2) |
CPEb (F cm2 HZ1-n1) |
n 1 |
Rp (Ω cm2) |
CPEp (F cm2 HZ1-n2) |
n 2 |
|---|---|---|---|---|---|---|---|
| 0.0 | 20.13 | 50.80 | 106.7x10⁻⁶ | 0..889 | 14.25 | 251.3x10⁻⁶ | 0.766 |
| 0.005 | 15.76 | 27.50 | 178.3x10⁻⁶ | 0.768 | 59.12 | 389.1x10⁻⁶ | 0.836 |
| 0.0075 | 31.25 | 14.41 | 193.5x10⁻⁶ | 0.840 | 64.12 | 364.2x10⁻⁶ | 0.993 |
| 0.01 | 17.82 | 9.701 | 221.3x10⁻⁶ | 0.885 | 32.15 | 423.1x10⁻⁶ | 0.957 |
Table 7.
Tafel kinetic parameters obtained for a TZNT alloy in artificial seawater at different solution temperatures.
Table 7.
Tafel kinetic parameters obtained for a TZNT alloy in artificial seawater at different solution temperatures.
| Temperature/ K |
ICorr A cm-2 |
-ECorr / V |
βa (V dec-1) |
βc (V dec-1) |
Epass / V |
ipass mA cm-2 |
Corr Rate Mpy |
|---|---|---|---|---|---|---|---|
| 298 | 1.30x10⁻⁶ | 0.306 | 0.274 | 0.368 | 0.235 | 0.041 | 0.168 |
| 308 | 2.43x10⁻⁶ | 0.350 | 0.050 | 0.049 | 0.090 | 0.085 | 0.313 |
| 318 | 9.79x10⁻⁶ | 0.365 | 0.266 | 0.194 | 0.100 | 0.072 | 1.261 |
| 328 | 2.23x10⁻⁵ | 0.399 | 0.449 | 0.372 | 0.120 | 0.098 | 2.873 |
| 338 | 3.54x10⁻⁵ | 0.430 | 0.703 | 0.340 | 0.130 | 0.094 | 4.559 |
Table 8.
Tafel kinetic parameters obtained for a TZNT alloy in ASW at different scan rates.
| Scan Rate mVs-1 |
ICorr A cm-2 |
-ECorr / V |
βa (V dec-1) |
βc (V dec-1) |
Epass / V |
ipass mA cm-2 |
Corr Rate mpy |
|---|---|---|---|---|---|---|---|
| 5 | 1.30x10⁻⁶ | 0.306 | 0.274 | 0.368 | 0.235 | 0.045 | 0.168 |
| 10 | 1.85x10⁻⁵ | 0.517 | 0.314 | 0.343 | 0.130 | 0.200 | 2.379 |
| 20 | 3.28x10⁻⁵ | 0.574 | 0.391 | 0.532 | 0.140 | 0.290 | 4.231 |
| 30 | 5.41x10⁻⁵ | 0.596 | 0.759 | 0.594 | 0.130 | 0.340 | 6.969 |
| 40 | 7.76x10⁻⁵ | 0.623 | 0.636 | 0.915 | 0.130 | 0.365 | 10.00 |
Table 9.
Tafel kinetic parameters obtained for a TZNT alloy in ASW at pH 6.5 with and without F- after different immersion times.
Table 9.
Tafel kinetic parameters obtained for a TZNT alloy in ASW at pH 6.5 with and without F- after different immersion times.
| Immersion Time | ICorr A cm-2 |
-ECorr / V |
βa (V dec-1) |
βc (V dec-1) |
-Epass / V |
ipass mA cm-2 |
Corr Rate mpy |
|---|---|---|---|---|---|---|---|
| Without F- | |||||||
| 15 days |
3.72 x 10⁻⁶ | 0.399 | 0.591 | 0.199 | 0.450 | 0.013 | 0.478 |
| 0.0 | 1.30 x 10⁻⁶ | 0.306 | 0.274 | 0.368 | 0.235 | 0.041 | 0.168 |
| With F- | |||||||
| 15 days |
5.00x10⁻⁶ | 0.455 | 0.681 | 0.409 | 0.210 | 0.024 | 0.643 |
| 0.0 | 4.76x10⁻⁵ | 0.557 | 0.279 | 0.582 | -0.239 | 0.142 | 6.129 |
Table 10.
Fitting parameters of EIS obtained for a TZNT alloy in ASW at pH 6.5 with and without F- after different immersion times.
Table 10.
Fitting parameters of EIS obtained for a TZNT alloy in ASW at pH 6.5 with and without F- after different immersion times.
| Immersion Time | Rs (Ω cm2) |
Rb (kΩ cm2) |
CPEb (F cm2 HZ1-n1) |
n 1 |
Rp (Ω cm2) |
CPEp (F cm2 HZ1-n2) |
n 2 |
|---|---|---|---|---|---|---|---|
| Without F- | |||||||
| 15 days |
23.16 | 15.90 | 135.1x10⁻⁶ | 0.875 | 6.23 | 264.5x10⁻⁶ | 0.759 |
| 0.0 | 20.13 | 50.80 | 106.7x10⁻⁶ | 0..889 | 14.25 | 251.3x10⁻⁶ | 0.766 |
| With F- | |||||||
| 15 days |
37.22 | 20.62 | 83.21x10⁻⁶ | 0..895 | 35.23 | 278.4x10⁻⁶ | 0.722 |
| 0.0 | 17.82 | 9.701 | 221.3x10⁻⁶ | 0.885 | 32.15 | 423.1x10⁻⁶ | 0.957 |
Disclaimer/Publisher’s Note: The statements, opinions and data contained in all publications are solely those of the individual author(s) and contributor(s) and not of MDPI and/or the editor(s). MDPI and/or the editor(s) disclaim responsibility for any injury to people or property resulting from any ideas, methods, instructions or products referred to in the content. |
© 2026 by the authors. Licensee MDPI, Basel, Switzerland. This article is an open access article distributed under the terms and conditions of the Creative Commons Attribution (CC BY) license.
Copyright: This open access article is published under a Creative Commons CC BY 4.0 license, which permit the free download, distribution, and reuse, provided that the author and preprint are cited in any reuse.


