
Submitted:
25 July 2025
Posted:
28 July 2025
You are already at the latest version
Abstract
This work compares the corrosion behavior in artificial saliva of oxide thin films grown on pure titanium, via electrochemical oxidation (EO) in sulphate bath at 1V and thermal treatment (TT) at 450°C, for durations between 20 min and 4 h. Surface characterizations were performed through morphological and microstructural analysis using scanning electron microscopy, energy-dispersive X-ray spectroscopy and X-ray diffraction. Electrochemical behavior was conducted in Fusayama-Meyer solution (pH= 6.50 and T= 37°C) using linear polarization and electrochemical impedance spectroscopy, under varying pH and fluoride concentrations. The results demonstrated that a 3-hour duration treatment provided the optimal corrosion resistance for both EO and TT processes. Acidic and basic electrolytes both increased Icorr and decreased Rp, indicating degradation of the passive layer outside neutral conditions. Increasing fluoride concentrations significantly impaired the corrosion resistance. At 12,300 ppm F⁻, untreated Ti showed severe degradation, with the formation of a porous outer layer (Rf = 33 Ω.cm²) and a weakened inner barrier layer (Rct = 21 kΩ.cm²). In contrast, TT-treated surfaces remained highly protective with the highest resistances for both the outer and inner layers (Rf = 1610 KΩ.cm²; Rct = 1583 KΩ.cm²), significantly outperforming the EO film.
Keywords:
Corrosion in artificial saliva
; Fusayama-Meyer
; cp-Ti
; electrochemical oxide
; thermal oxidation
1. Introduction
In recent years, titanium (Ti) and its alloys have been widely used in orthopedics and dentistry as dental implants and brackets [1,2,3,4,5,6], due to their biocompatibility and favorable mechanical properties including high Young's modulus and minimal toxicity [7]. They also exhibit remarkable corrosion resistance in various environments, including the human body, primarily attributed to the formation of a thin passive film predominantly composed of amorphous titanium dioxide (TiO2) [8,9]. The protective efficacy of these passive layers is influenced by their characteristics, such as thickness and structure, as well as the microstructure of the underlying substrate, including grain size [3,10,11]. Consequently, it is imperative to investigate the stability of these oxide films in simulated biological fluids [12,13].
However, the oral environment presents complex and dynamic conditions that can challenge the integrity of the passive film on titanium surfaces. The increasing use of prophylactic dental products to prevent plaque and caries formation has introduced additional variables affecting implant corrosion [14]. Many of these products contain fluoride ions (F-) at varying concentrations, such as 200 ppm in mouth rinses, 1,000-1,500 ppm in toothpastes and 10,000-20,000 ppm in gels [6,15]. Several studies have evaluated the corrosion behavior of Ti and its alloys in media containing fluoride [16,17,18], albumin [19] and bacteria [20,21]. In general, the presence of those species accelerates the corrosion process of these materials. Other factors such as fluctuating pH levels and temperature variations can compromise the corrosion resistance of titanium [15,22]. For instance, acidic conditions and high fluoride concentrations have been shown to destabilize the passive film, leading to increased corrosion rates [23,24,25]. Moreover, the formation of hydrofluoric acid (HF) in low pH environments can further exacerbate the degradation of titanium surfaces [26]. Nakagawa et al. demonstrated a linear correlation between the pH threshold for titanium corrosion and the logarithm of fluoride concentration, indicating that lower pH levels require less fluoride to initiate corrosion [17]. Similarly, Lindholm-Sethson and Ardlin identified distinct corrosion behaviors—passive, nonpassive, and active based on varying fluoride concentrations and pH levels [27].
To enhance the bioactive properties and modify the physicochemical, mechanical, and electrical characteristics of titanium surfaces, various surface treatments have been employed [7,11]. A straightforward approach to create a barrier on the biomaterial surface is to form an oxide layer. Although Ti alloys naturally develop a tightly adherent protective oxide when exposed to air, this layer is not entirely stable. Under specific conditions, such as the presence of high chloride or fluoride concentrations, this oxide layer can be compromised, leading to localized corrosion. To improve corrosion resistance, a denser oxide layer can be developed through thermal oxidation [28,29,30] or anodic oxidation [31,32]. For example, a thermal oxidation at around 600 °C can produce a duplex rutile/anatase TiO₂ structure, that results in an enhancement of the corrosion resistance in acidic environments [33]. Additionally, electrochemical nano-engineering approaches, such as the fabrication of TiO₂ nanotubes, have shown promise in improving both corrosion resistance and bioactivity for dentistry [34] or orthopedics applications [35].
Despite these advancements, there remains a lack of comprehensive studies comparing the effectiveness of different surface treatments, such as thermal and electrochemical oxidation, in mitigating corrosion under varying fluoride concentrations and pH levels. Understanding the interplay between these factors is crucial for optimizing the performance and longevity of titanium-based dental implants. This study aims to investigate the impact of surface treatments, specifically thermal and electrochemical oxidation, on the corrosion behavior of titanium in artificial saliva environments with varying pH levels (ranging from 2.5 to 9) and fluoride concentrations (up to 12,300 ppm). Electrochemical techniques, including Linear Polarization (LP) and Electrochemical Impedance Spectroscopy (EIS), will be employed to assess the corrosion resistance of treated and untreated titanium samples. The findings will contribute to a better understanding of how surface modifications can enhance the durability of titanium dental implants in fluoride-rich and acidic oral conditions.
2. Materials and Methods
2.1. Preparation of the Samples
Pure titanium discs (1 cm2) (Mayitr, cp-Ti, ASTM B265, grade 2) were used as working electrodes. The discs were mechanically polished using SiC abrasive paper, progressing from grit 240 to 2500, followed by polishing with a 1 µm alumina suspension. The samples then underwent ultrasonic cleaning in pure ethanol for 5 minutes and finally dried using compressed air. These untreated samples are referred to as “B” (bare titanium).
Compact TiO2 layers were developed either by thermal treatment (TT) or by electrochemical oxidation (EO) with durations ranging from 20 minutes to 4 hours. For thermal treatment, the samples were annealed ex-situ in air at 450 °C using a standard furnace (Nabertherm 30/3000 °C) with a controlled heating rate of 5 °C/min. These samples are designated as “TT”. Starting for previous works made by our group [36], electrochemical oxidation was carried out in a 1 M sodium sulphate solution (Sigma- Aldrich Rectapur) using a conventional three-electrode electrochemical cell. The setup included a platinum foil counter electrode, an Ag/AgCl reference electrode (0.2 V vs NHE), and pure titanium discs as working electrodes. Oxidation was conducted at a constant potential of 1V vs. Ag/AgCl and the resulting samples are referred to as “EO”.
2.2. Structural and Morphological Analyses
The crystallographic structure of the samples was assessed using X-ray diffraction (XRD). Patterns were recorded using an X'Pert Philips MPD diffractometer, equipped with a PANAlytical X'Celerator detector, operating with CuKα radiation (λ=1.5406 °A). Measurements were conducted over a 2θ range of 20° to 80° at an operating voltage of 40 kV and a current of 30 mA.
The surface morphology and chemical composition of the selected coatings were examined using Scanning Electron Microscopes (SEM). A Philips XL 30 ESEM was employed for general imaging, while a ZEISS Gemini 500 70-04 provided high-magnification images when required. Both microscopes were equipped with an Energy Dispersive Spectroscopy (EDS) system for analysis.
2.3. Electrochemical Corrosion Study
Electrochemical corrosion studies were conducted in artificial saliva using a Biologic VSP-300 potentiostat. The electrochemical cell configuration was identical to that used for the EO treatment, with either bare or surface-treated titanium acting as the working electrode (exposed area: 1cm2). The electrolyte used was Fusayama-Meyer artificial saliva (F.M.S), which closely mimics the ionic composition of natural saliva. The formulation included: KCl (0.4g/L), NaCl (0.4g/L), CaCl2.2H2O (0.906g/L), NaH2PO4.2H2O (0.690g/L), Na2S.9H2O (0.005g/L) and urea (1g/L); all purchased from Sigma- Aldrich [37]. The temperature of the electrolyte was maintained at 37± 0.5°C using a thermostatic bath. The initial pH was 6.50. Given that the oral pH can vary between 2 and 11, hydrochloric acid or sodium hydroxide was added to adjust the pH to 2.50 or 9.00, respectively. To assess the effect of fluoride on the corrosion resistance, sodium fluoride was added at concentrations of 1,000, 1,500 and 12,300 ppm.
All samples were first immersed in the electrolyte for 1 hour prior to electrochemical testing to stabilize the open circuit potential (OCP). Electrochemical impedance spectroscopy (EIS) was then conducted over a frequency range from 100 KHz to 10 mHz using an AC perturbation of 10 mV (peak-to-peak) around the OCP. The impedance spectra were analyzed in terms of the real (Z’) and imaginary (Z”) components, as well as the total impedance (|Z|) and phase angle and represented on Nyquist plots.
The spectra were fitted on an equivalent electrical circuit model using ZSim 3.30d software for further analysis. Finally, potentiodynamic polarization curves were recorded by scanning the potential from -300 mV/OCP to 1V vs. reference electrode at a scan rate of 1.0 mV/s. Key electrochemical parameters, such as corrosion current density (Icorr), corrosion potential (Ecorr) and Tafel slopes (βa and βc), and were determined by Tafel extrapolation. The passivation current density (Ipass) was measured at 1V, while the polarization resistance (Rp) was determined by analyzing the polarization curve within ±10 mV of the open-circuit potential (EOCP), using the Stern-Geary equation [38]:
To ensure reproducibility, all electrochemical measurements were repeated three times. the curves obtained being almost superimposable, only one curve will be presented per experiment.
3. Results
3.1. Surface Morphology
Three-hour treatments were applied via annealing (TT) and electrochemical oxidation (EO) to produce bulk films. A blue color, visible to the naked eye, appeared on TT samples, while no color change was observed on the EO samples. The crystallinity of these samples was analyzed using X-ray diffraction (XRD), with Figure 1 displaying the diffraction patterns for the bare titanium substrate (Figure 1a), the EO-treated sample (Figure 1b) and the TT-treated sample (Figure 1c). The diffractograms are similar, displaying only the peaks corresponding to the titanium substrate (JCPDS 44-1294). However, a slight difference is observed in the TT sample, which shows a shoulder preceding the (002) plan (see the magnification insert in Figure 1). This feature may be attributed to the incorporation of oxygen atoms into the titanium structure, as oxygen is highly soluble in the titanium matrix up to an O / Ti molar ratio of 0.5%. An oxygen-enriched titanium phase can form when oxygen atoms occupy alternate layer of octahedral interstices, causing a significant expansion along with the c-axis, with only a minor modification in the a-axis [39]. The bulk layers produced by either EO or TT remain amorphous, or the crystalline phase is too limited to be detected by our instrumentation.
3.2. Morphological Analysis
SEM observations with a magnification of 55,000, were conducted on the bare titanium (B), TT and EO samples. The titanium surface (Figure 2a) is composed of faceted crystallites approximately 100 nm in size. TT and EO layers (Figure 2b,c respectively) are thin, dense and have nanoscale dimensions, The TT surface appears more homogeneous, while the EO surface exhibits cracks and holes, each around 100 nm or smaller. EDS analysis, performed on the whole surface shown in Figure 2 with an accelerating voltage of 10 kV, is summarised in Table 1. The presence of oxygen on the bare titanium indicates the formation of a thin native oxide layer. Both surface treatments led to an increased concentration of oxygen, indicating the thickening of the oxide film.
3.3. Electrochemical Measurements
3.3.1. Effect of pH on B
- Linear polarization curves
Figure 3 shows the voltammograms obtained for Ti after 1 hour immersion in artificial saliva at different pH levels (2.50, 6.50 and 9.00). All anodic curves exhibit a stable current within the potential range of 0.2 to 1V, indicating the passive state of the surface. The influence of the pH is evident; the corrosion potential and oxidation currents are lowest in the neutral medium (pH 6.5) and increase under both acidic and basic conditions. The electrochemical parameters derived from the curves are summarized in Table 2. The lowest Icorr and Ipass along with the highest Rp, were observed in the neutral medium, indicating optimal passivation. In contrast, deviations in pH significantly increase the corrosion rate of Ti, likely due to the accelerated degradation of the native TiO₂ layer at pH 2.50 and pH 9.00 [15].
- Electrochemical impedance spectroscopy measurements
EIS spectra are plotted in the form of Nyquist plots. A single equivalent electrical circuit (Randle's circuit), illustrated in Figure 4 (insert), was employed to model the system. This circuit includes a charge transfer resistance (Rct) in parallel with a constant phase element representing the double-layer capacitance (CPEdl), both in series with the electrolyte resistance (Rel). This model aligns with the one proposed by Valentim et al. [15] for pure titanium immersed in artificial saliva.
The fitting results are summarized in Table 3 and demonstrate a clear influence of pH on all parameters. The CPEdl was notably higher at acidic pH levels, indicating increased capacitance likely due to surface roughening or enhanced adsorption processes. The lowest Rct, indicative of the poorest corrosion resistance, was observed in the acidic medium, while the highest Rct, reflecting the most stable passive layer, was observed in the neutral condition (pH 6.6), which is consistent with the findings from the linear polarization measurements.
For the subsequent experiments, the pH was maintained at 6.50, representing the neutral conditions typically found in the oral environment.
3.3.2. Effect of Surface Treatments
- Linear polarization curves
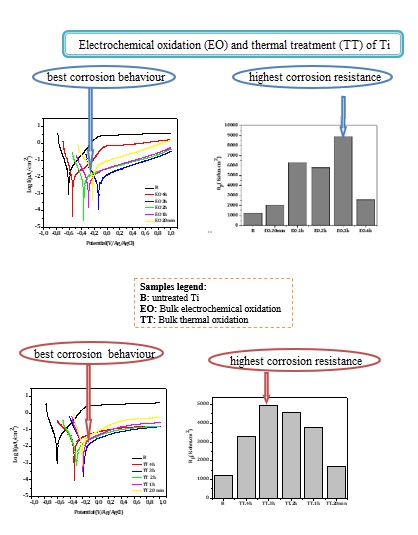
Potentiodynamic experiments were conducted on EO and TT in F.M.S for various durations, as shown in Figure 5a,b respectively. For comparison, the curve obtained from the bare substrate is also included in both figures. Across all treatment and durations, the treated surface exhibited higher corrosion potentials and lower oxidation currents compared to the bare substrate, indicating improved corrosion resistance.
Electrochemical parameters extracted from Figure 5a,b are summarized in Table 4 and Table 5 respectively. In both cases, the best corrosion resistance was observed after 3 hours of treatment, as indicated by the lower Icorr and Ipass values and the highest Rp.
It is likely that treatment durations exceeding 3 hours lead to a thickening of the passive oxide layer, which may introduce defects that exacerbate corrosion, thereby diminishing the protective effect.
The corrosion behavior obtained after a 3-hour duration treatment, determined through the values of icorr and Rp values, is quite the same taking into account the measurement uncertainties.
- Electrochemical impedance spectroscopy measurements
The Nyquist diagrams for EO and TT treated titanium surfaces at different oxidation durations are presented in Figure 6 and Figure 7, respectively. Each diagram displays a semi circular shape with varying diameters depending on the treatment duration. The same equivalent circuit, as previously described, was used to fit these diagrams. The fitting results for both EO and TT are summarized in Table 6 and Table 7.
In both cases, the charge transfer resistances (Rct) increased with the treatment duration, peaking at 3 hours before decreasing, which is consistent with the conclusions drawn from the linear polarization measurements. Simultaneously, the double layer capacitance (CPEdl) decreased with longer oxidation durations, while the exponent (n) remained approximately 0.9. This suggests the formation of a well-distributed, adherent passive titanium oxide film across the metal surface.
3.3.3. Effect of Fluoride Ions on the Bare Titanium Surface (B)
- Linear polarization curves
Figure 8 shows the linear polarization curves for the bare substrate in artificial saliva with increasing fluoride ions concentrations. The corresponding electrochemical parameters are summarized in Table 8. The initially stable passive state of titanium becomes increasingly compromised as fluoride concentration rises. At low fluoride levels, the oxidation currents remain relatively constant at high potentials, while at higher concentrations, current oscillations emerge, suggesting localized breakdown of the passive layer. Both Icorr and Ipass increase significantly, while Rp decreases indicating a marked deterioration in corrosion resistance. This behavior is likely due to the aggressive attack of fluoride ions, which are known to degrade the protective TiO2 film.
- EIS measurements
Nyquist plots obtained from impedance measurements in fluoride-containing artificial saliva are shown in Figure 9. As the fluoride concentration in the solution increases, the semicircle diameter decreases, indicating a loss in corrosion resistance. This is attributed to the formation of fluoride containing compounds (e.g., TiF₄, TiOF₂, Na₂TiF₆) that result in a porous surface structure [14,40,41].
At low fluoride concentrations, the system can be modeled using the standard Randle’s equivalent circuit (Figure 9, insert). However, at 12,300 ppm F-, a more complex model with two time constants is necessary (Figure 10), consistent with prior study proposed for Ti immersed in saline solution [42], in Ringer’s solution [43], and Hank's solution [16]. This model distinguishes between a compact inner barrier layer and a porous outer layer. The outer layer is described by a constant phase element (CPEf) and a resistance Rf, and the inner by the double layer capacitance CPEdl and the charge transfer resistance Rct, with all elements connected in series with the electrolyte resistance Rel. Due to structural heterogeneities within those two layers, constant phase elements (CPE) rather than simple capacitances (C) are used to simulate the non-ideal capacitive behavior. The results obtained in Table 9 indicate a decrease Rel F- concentration increases. At 12, 300 ppm, Rct remains significantly higher (21 kΩ.cm²) than Rf (33 Ω.cm²), indicating that the inner layer provides most of the corrosion resistance. The decreasing Rct trend with rising F- content is consistent with the polarization data.
3.3.4. Corrosion Behavior of EO and TT Samples in 12,300 ppm Fluoride-Containing Saliva
- Linear polarization curves
To evaluate the fluoride resistance of bulk titanium oxide films formed by electrochemical oxidation (EO.3h) and thermal treatment (and TT.3h), potentiodynamic tests were carried out in F.M.S containing 12,300 ppm (Figure 12). The untreated titanium (B) is also shown for reference. The corrosion potential shifts positively from B to EO to TT, while Icorr and Ipass decrease in the reverse order. As detailed in Table 10, the TT sample demonstrates the most effective passivation with its Rp value nearly 6 times higher than EO and 150 times greater than, confirming its superior corrosion resistance in aggressive fluoride environments.
- EIS measurements
Nyquist diagrams for B, EO and TT surfaces in 12,300 ppm are presented in Figure 13. All curves were fitted using the two-time constant model described previously, representing the porous outer layer and the compact inner barrier; the corresponding electrical parameters are summarized in Table 11. The diameter of the semicircles decreases progressively from TT to EO to B. This order reflects increasing resistance values in both porous (Rf) and barrier (Rct) layers, with TT exhibiting the most protective oxide structure results are in good agreement with the findings from the polarization experiments.
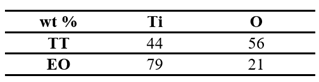
SEM images after corrosion experiments in concentrated fluoride solution are shown in Figure 14. While the B surface (cf. Figure 11b) shows extensive degradation, both EO surface (Figure 14a) and TT (Figure 14b) samples exhibit a uniform surface with minimal signs of corrosion. The EO sample exhibits minor defects (approximately 1 µm in diameter), likely linked to pre-existing cracks and pores initiated by the defects (cracks and holes) already present on the initial the surface (see Figure 2c). In contrast, the sample TT shows no visible damage. EDS analysis (Table 12) conducted on 10×10 µm² area at 10 KV, confirms a higher atomic oxygen content in the TT surface compared to EO, suggesting a denser or thicker oxide layer.
4. Conclusions
The corrosion behavior of titanium in simulated human saliva (Fusayama-Meyer type) was investigated, with a particular focus on the effects of surface treatments for several durations: electrochemical oxidation (EO) and thermal oxidation (TT), as well as environmental parameters such as pH and fluoride ion concentration.
Influence of pH: The study demonstrated that corrosion rates increase at both low and high pH levels, underscoring the importance of maintaining near-neutral pH in oral environments to preserve the integrity of titanium implants.
Effect of Treatment Duration: treatment durations, ranging from 20 minutes to 4 hours, were tested. The optimal duration for both electrochemical and thermal oxidations was found to be 3 hours, providing the best electrochemical properties. The TiO₂ layers formed during this period effectively passivated the titanium surface in neutral saliva (pH 6.50). However, EO films exhibited some nanoscale defects, such as pores and cracks, which could compromise long-term protection.
Influence of fluoride ions: electrochemical tests performed at fluoride concentrations of 1,000, 1,500 and 12,300 ppm revealed a strong correlation between fluoride contact and corrosion severity. Higher fluoride levels led to increase corrosion current density and decrease polarization resistance, indicating significant degradation of the passive layer. EIS results at 12,300 ppm F- suggested the formation of a dual layer structure composed of an inner barrier layer and an outer porous layer, which likely accounts for the extensive pitting observed by SEM.
Comparison of Surface Treatments: Both EO and TT surface modifications significantly enhanced the corrosion resistance of titanium in artificial saliva, even under aggressive fluoride concentrations. Notably, the TT treated samples provided superior performance, attributed to the formation of a more compact and defect-free layer compared to EO.
These findings highlight the potential of thermal oxidation as a simple and effective surface treatment to enhance the durability of titanium in the oral cavity, especially for dental implants and prostheses exposed to fluoride-containing products. Future studies should explore the long-term stability of these oxide films under cyclic loading and complex biological environments, as well as their interaction with biofilms and oral tissues.
Author Contributions
F.K.: Methodology, investigation, experimentation, data analysis, writing the original draft; M.F.: conceptualization, supervision and writing review; A.K.: methodology, validation; S.A.: methodology and validation; M.E.: conceptualization, supervision, writing review, editing. All authors have read and agreed to the published version of the manuscript.
Funding
The authors declare that no funding received for this work.
Abbreviations
The following abbreviations are used in this manuscript:
| Open circuit potential (OCP). |
| Electrochemical impedance spectroscopy (EIS) |
| Linear Polarization (LP) |
| X-ray diffraction (XRD) |
| Scanning Electron Microscopes (SEM) |
| Energy Dispersive Spectroscopy (EDS) |
| Corrosion current density (Icorr), |
| Corrosion potential (Ecorr) |
| Passivation current density (Ipass) |
| Thermal treated sample (TT) |
| Electrochemical oxidation sample (EO) |
| Fusayama-Meyer artificial saliva (F.M.S) |
References
- Rojo L., Gharibi B., McLister R., Meenan B.J., Deb S., Self-assembled monolayers of alendronate on Ti6Al4V alloy surfaces enhance osteogenesis in mesenchymal stem cells, Scientific Reports. 2016, Vol 6, pp 30548. [CrossRef]
- Truong V.K., Lapovok R., Estrin Y.S., Rundell S., Wang J.Y., Fluke C.J., Crawford R.J., Ivanova E.P., The influence of nano-scale surface roughness on bacterial adhesion to ultrafine-grained titanium, Biomaterials. 2010, Vol 31, pp 3674-3683. [CrossRef]
- Chelariu R., Bolat G., Izquierdo J., Mareci D., Gordin D.M., Gloriant T., Souto R.M., Metastable beta Ti-Nb-Mo alloys with improved corrosion resistance in saline solution, Electrochimica Acta. 2014, Vol 137, pp 280-289. [CrossRef]
- Lu J., Zhang Y., Huo W., Zhang W., Zhao Y., Zhang Y., Electrochemical corrosion characteristics and biocompatibility of nanostructured titanium for implants, Applied Surface Science. 2018, Vol 434, pp 63-72. [CrossRef]
- Park J-W., Kim Y-J., Park Ch.H, Lee D-H., Ko Y.G., Jang J-H., Lee Ch. S., Enhanced osteoblast response to an equal channel angular pressing-processed pure titanium substrate with microrough surface topography, Acta Biomaterialia. 2009, Vol 5, pp 3272-3280. [CrossRef]
- Robin A., Meirelis J.P., Influence of fluoride concentration and pH on corrosion behavior of Ti-6Al-4V and Ti-23Ta alloys in artificial saliva, Materials and Corrosion. 2007, Vol 58, pp 173-180. [CrossRef]
- Marino C.E.B., Mascaro L.H., EIS characterization of a Ti-dental implant in artificial saliva media: dissolution process of the oxide barrier, Journal of Electroanalytical Chemistry. 2004, Vol 568, pp 115-120. [CrossRef]
- Schiff N., Grosgogeat B., Lissac M., Dalard F., Influence of fluoride content and pH on the corrosion resistance of titanium and its alloys, Biomaterials. 2002, Vol 23, pp 1995-2002. [CrossRef]
- Mazare A., Totea G., Burnei C., Schmuki P., Demetrescu I., Ionita D., Corrosion, antibacterial activity and haemocompatibility of TiO2 nanotubes as a function of their annealing temperature, Corrosion Science. 2016, Vol 103, pp 215-222. [CrossRef]
- Li J., Li S.J., Hao Y.L., Huang H.H., Bai Y., Hao Y.Q., Guo Z., Xue J.Q., Yang R., Electrochemical and surface analyses of nanostructured Ti-24Nb-4Zr-8Sn alloys in simulated body solution, Acta Biomaterialia. 2014, Vol 10, pp 2866-2875. [CrossRef]
- Liu X., Chu P.K., Ding Ch., Surface modification of titanium, titanium alloys, and related materials for biomedical applications, Materials Science and Engineering: R : Reports. 2004, Vol 47, pp 49-121. [CrossRef]
- Marino C.E.B., Biaggio S.R., Rocha-Filho R.C., Bocchi N., Voltammetric stability of anodic films on the Ti6Al4V alloy in chloride medium, Electrochimica Acta. 2006, Vol 51, pp 6580-6583. [CrossRef]
- Alves V.A., Reis R.Q., Santos I.C.B., Souza D.G., Gonçalves T. de F., Pereira-da-Silva M.A., Rossi A., Da Silva L.A., In situ impedance spectroscopy study of the electrochemical corrosion of Ti and Ti–6Al–4V in simulated body fluid at 25 °C and 37°C, Corrosion Science. 2009, Vol 51, pp 2473-2482. [CrossRef]
- Mutlu I., Synthesis and characterization of Ti−Co alloy foam for biomedical applications, Trans. Nonferrous Met. Soc. China. 2016, Vol 26 , pp 126-137. [CrossRef]
- Valentim A.R.B., Mathew T.M., Assunção W.G., Yuan J. Ch-Ch, Wimmer M., Sukotjo C., Stability of cp-Ti and Ti-6Al-4V alloy for dental implants as a function of saliva pH- an electrochemical study, Clinical Oral Implants Research. 2012, Vol 23, pp 1055-1062. [CrossRef]
- Souza J.C.M., Barbosa L.S., Ariza E.A., Henriques M., Teughels W., Ponthiaux P., Celis J-P, Rocha L.A., How do titanium and Ti6Al4V corrode in fluoridated medium as found in the oral cavity? An in vitro study, Materials Science and Engineering C. 2015, Vol 47, pp 384-393. [CrossRef]
- Nakagawa M., Matsuya S., Shiraishi T., Ohta M., Effect of fluoride concentration and pH on corrosion behavior of titanium for dental use, J Dent Res. 1999, Vol 78, pp 1568-1572. [CrossRef]
- Janužis G., Milvydaitė G., Miškinytė M., Latakas D., Griškonis G., Fluoride Induced Corrosion Impact on Peri-Imlantitis: A Systemic Review. Annals of Dental Specialty, 2023, Vol 11, pp 87-92. [CrossRef]
- Huang H.H., Effect of fluoride and albumin concentration on the corrosion behavior of Ti-6Al-4V alloy, Biomaterials. 2003, 24, pp 275-282. [CrossRef]
- Laurent F., Grosgogeat B., Reclaru L., Dalard F., Lissac M., Comparison of corrosion behaviour in presence of oral bacteria, Biomaterials. 2001, Vol 22, pp 2273-2282. [CrossRef]
- Souza J.C.M., Henriques M., Oliveira R., Teughels W., Celis J-P., Rocha L.A., Do oral biofilms influence the wear and corrosion behavior of titanium? Biofouling. 2010, Vol 26, pp 471-478. [CrossRef]
- Murrell S., Marshall T., Moynihan P., Qian F., Wefel J., Comparison of in vitro erosion potentials between beverages available in the United Kingdom and the United States, Journal of Dentistry. 2010, Vol 38, pp 284-289. [CrossRef]
- Assis S.L., Wolynec S., Costa I., Corrosion characterization of titanium alloys by electrochemical techniques, Electrochimica Acta. 2006, Vol 51, pp 1815-1819. [CrossRef]
- Souza M.E., Lima L., Lima C.R.P., Zavaglia C.A.C., Freire C.M.A., Effects of pH on the electrochemical behaviour of titanium alloys for implant applications, J Mater Sci: Mater Med. 2009, Vol 20, pp 549-552. [CrossRef]
- Chen W. Q., Zhang S. M., Qiu J., Surface analysis and corrosion behavior of pure titanium under fluoride exposure. The Journal of Prosthetic Dentistry, 2020, Vol 124, pp 168-175. [CrossRef]
- Souza J. C., Apaza-Bedoya K., Benfatti C. A., Silva F.S., Henriques B., A comprehensive review on the corrosion pathways of titanium dental implants and their biological adverse effects. Metals, 2020, Vol 10, pp 1272. [CrossRef]
- Lindholm-Sethson B., Ardlin B. I., Effects of pH and fluoride concentration on the corrosion of titanium. Journal of Biomedical Materials Research Part A: An Official Journal of The Society for Biomaterials, The Japanese Society for Biomaterials, and The Australian Society for Biomaterials and the Korean Society for Biomaterials. 2008, Vol 86, pp 149-159. [CrossRef]
- Çomaklı O., Yazıcı M., Yetim T., Yetim A.F., Çelik A., The effect of calcination temperatures on structural and electrochemical properties of TiO2 film deposited on commercial pure titanium, Surf. Coat. Technol. 2016, Vol 285, pp 298-303. [CrossRef]
- Jamesh M., Kumar S., Narayanan T.S.N.S., Chu P.K., Effect of thermal oxidation on the corrosion resistance of Ti6Al4V alloy in hydrochloric and nitric acid medium: Effect of thermal oxidation on the corrosion resistance of Ti6Al4V alloy, Materials and Corrosion. 2013, Vol 64, pp 902-907. [CrossRef]
- Jayaraj J., Ranjith P.M., Ningshen S., Ramanathan S., Studies on Corrosion of Titanium and Air-Oxidized Titanium in Fluorinated Nitric Acid. Trans Indian Inst Met. 2019, Vol 72, pp 1917–1926. [CrossRef]
- Diamanti M.V., Curto B.D., Pedeferri M., Anodic oxidation of titanium: from technical aspects to biomedical applications, J. Appl. Biomater. Biomech. 2011, Vol 9, pp 55-69. [CrossRef]
- Doulache M., Trari M., Benchettara A., The oxidation of titanium thin films in phosphoric medium, Prot. Met. Phys. Chem. Surf. 2014, Vol 50, pp 200-208. [CrossRef]
- Minhas B., Dino S., Zuo Y., Qian H. and Zhao X., Improvement of Corrosion Resistance of TiO2 Layers in Strong Acidic Solutions by Anodizing and Thermal Oxidation Treatment, Materials, 2021, Vol 14, pp 1188. [CrossRef]
- Guo T., Scimeca J-C., Ivanovski S., Verron E. and Gulati K., Enhanced Corrosion Resistance and Local Therapy from Nano-Engineered Titanium Dental Implants, Pharmaceutics. 2023, Vol 15, pp 315-339. [CrossRef]
- Djendel A., Ait Ahmed N., Knauth P., Eyraud M., Improved corrosion and adhesion properties of titanium alloy for endoprostheses applications using a two-step anodization method, Surf. Coat. Tech. 2023, Vol 461, 129437. [CrossRef]
- Rossi S., Volgare L., Perrin-Pellegrino C., Chassigneux C., Dousset E., Eyraud M., Dual Electrochemical Treatments to Improve Properties of Ti6Al4V Alloy” Materials. 2020, Vol 13, 2479. [CrossRef]
- Matykina E., Arrabal R., Mingo B., Mohedano M., Pardo A., Merino M.C., In vitro corrosion performance of PEO coated Ti and Ti6Al4V used for dental and orthopaedic implants, Surface and Coating Technology. 2016, Vol 307, pp 1255-1264. [CrossRef]
- Stern M., Geary A., Electrochemical polarization I. A theoretical analysis of the shape of polarization curves, J. Electrochem. Soc. 1957, Vol 56, pp 104. [CrossRef]
- Ch-Ch. Ting, S-Y. Chen, D-M Liu, Preferential growth of thin rutile TiO2 films upon thermal oxidation of sputtered Ti films, Thin Solid Films. 402 (2002) 290-295. [CrossRef]
- Lin F.H., Hsu Y.S., Lin S-H, Chen T-M., The growth of hydroxyapatite on alkaline treated Ti−6Al−4V soaking in higher temperature with concentrated Ca2+/HPO4 2- simulated body fluid, Materials Chemistry and Physics. 2004, Vol 87, pp 24-30. [CrossRef]
- Fojt J., Joska L., Málek J., Corrosion behaviour of porous Ti−39Nb alloy for biomedical applications, Corrosion Science. 2013, Vol 71, pp 78-83. [CrossRef]
- Mareci D., Ungureanu G., Aelenei D.M., Mirza-Rosca J.C., Electrochemical characteristics of titanium based biomaterials in artificial saliva, Materials and Corrosion. 2007, Vol 58, pp 848-856. [CrossRef]
- González J.E.G., Mirza-Rosca J.C., Study of the corrosion behavior of titanium and some of its alloys for biomedical and dental implant applications, Journal of Electroanalytical Chemistry. 1999, Vol 471, pp 109-115. [CrossRef]
Figure 1.
X-ray diffraction (XRD) patterns of commercially pure titanium samples before and after surface treatment: (a) untreated titanium (B), (b) electrochemically oxidized titanium (EO) in a neutral electrolyte for 3 hours, and (c) thermally treated titanium (TT) in air at 450 °C for 3 hours.
Figure 1.
X-ray diffraction (XRD) patterns of commercially pure titanium samples before and after surface treatment: (a) untreated titanium (B), (b) electrochemically oxidized titanium (EO) in a neutral electrolyte for 3 hours, and (c) thermally treated titanium (TT) in air at 450 °C for 3 hours.
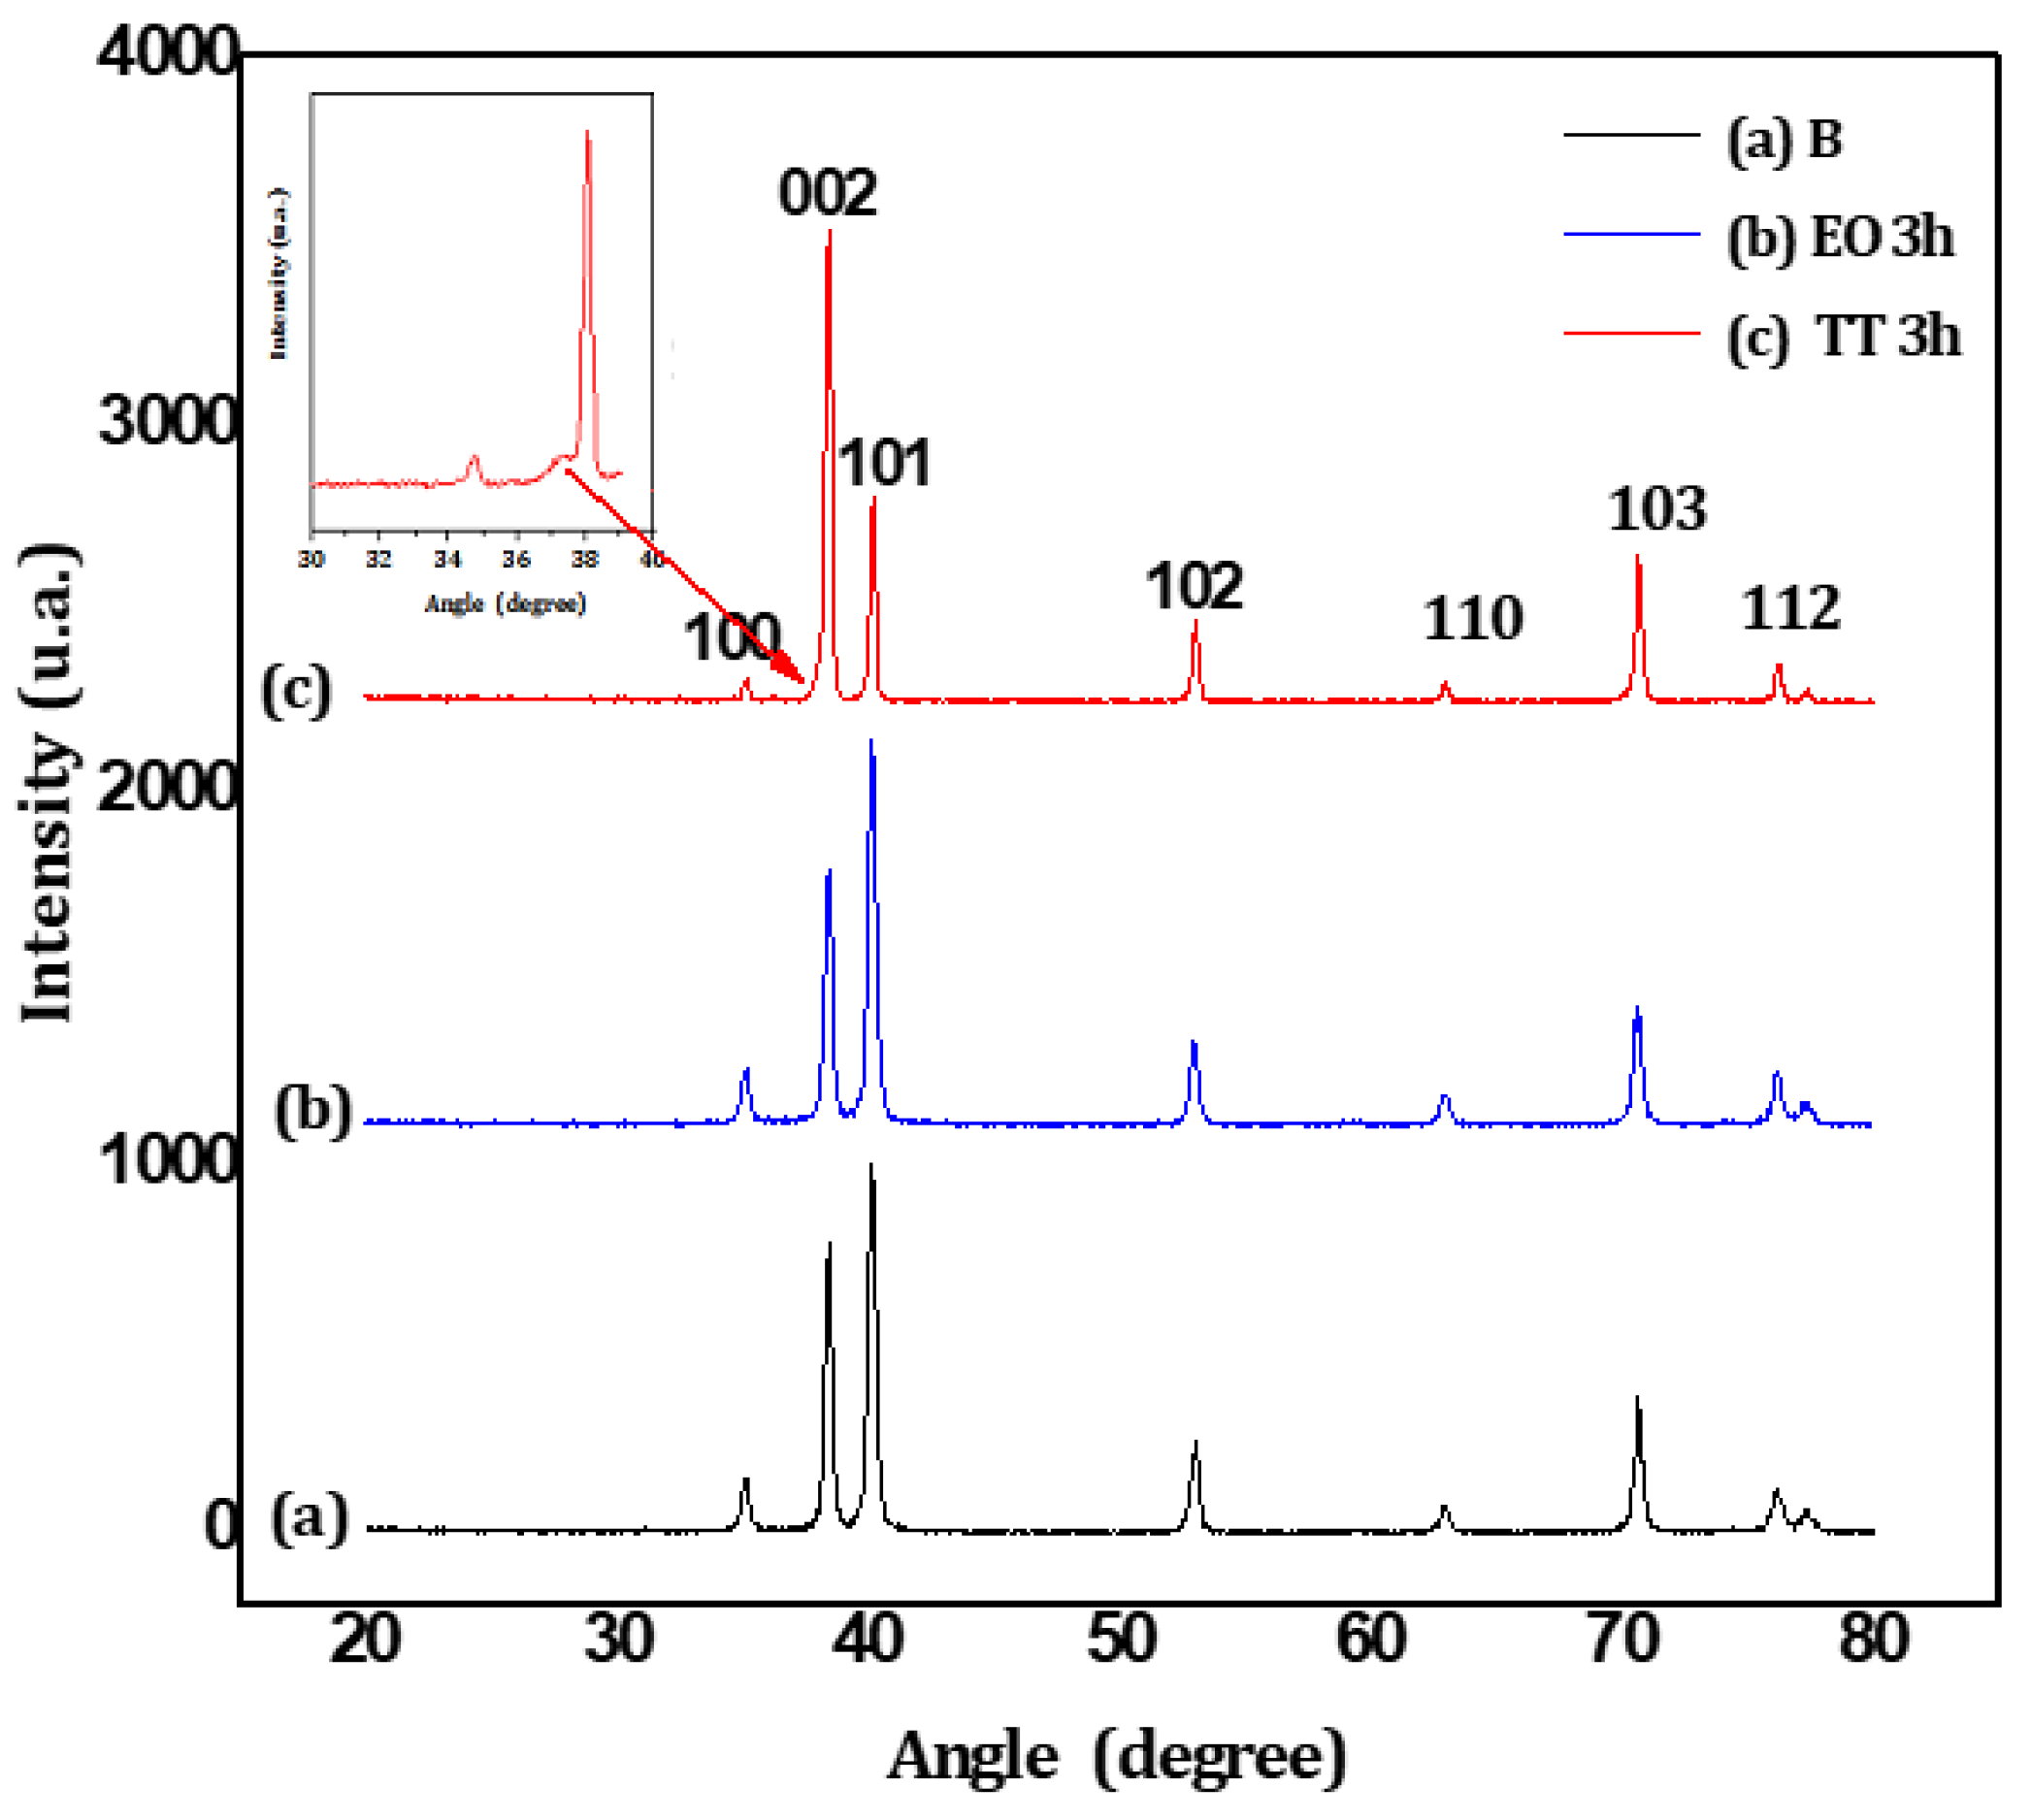
Figure 2.
Surface morphology observed by SEM for: (a) untreated titanium (B), (b) electrochemically oxidized (EO) sample treated for 3 hours in neutral electrolyte, and (c) thermally treated (TT) sample oxidized in air at 450 °C for 3 hours. All images were taken before corrosion testing.
Figure 2.
Surface morphology observed by SEM for: (a) untreated titanium (B), (b) electrochemically oxidized (EO) sample treated for 3 hours in neutral electrolyte, and (c) thermally treated (TT) sample oxidized in air at 450 °C for 3 hours. All images were taken before corrosion testing.
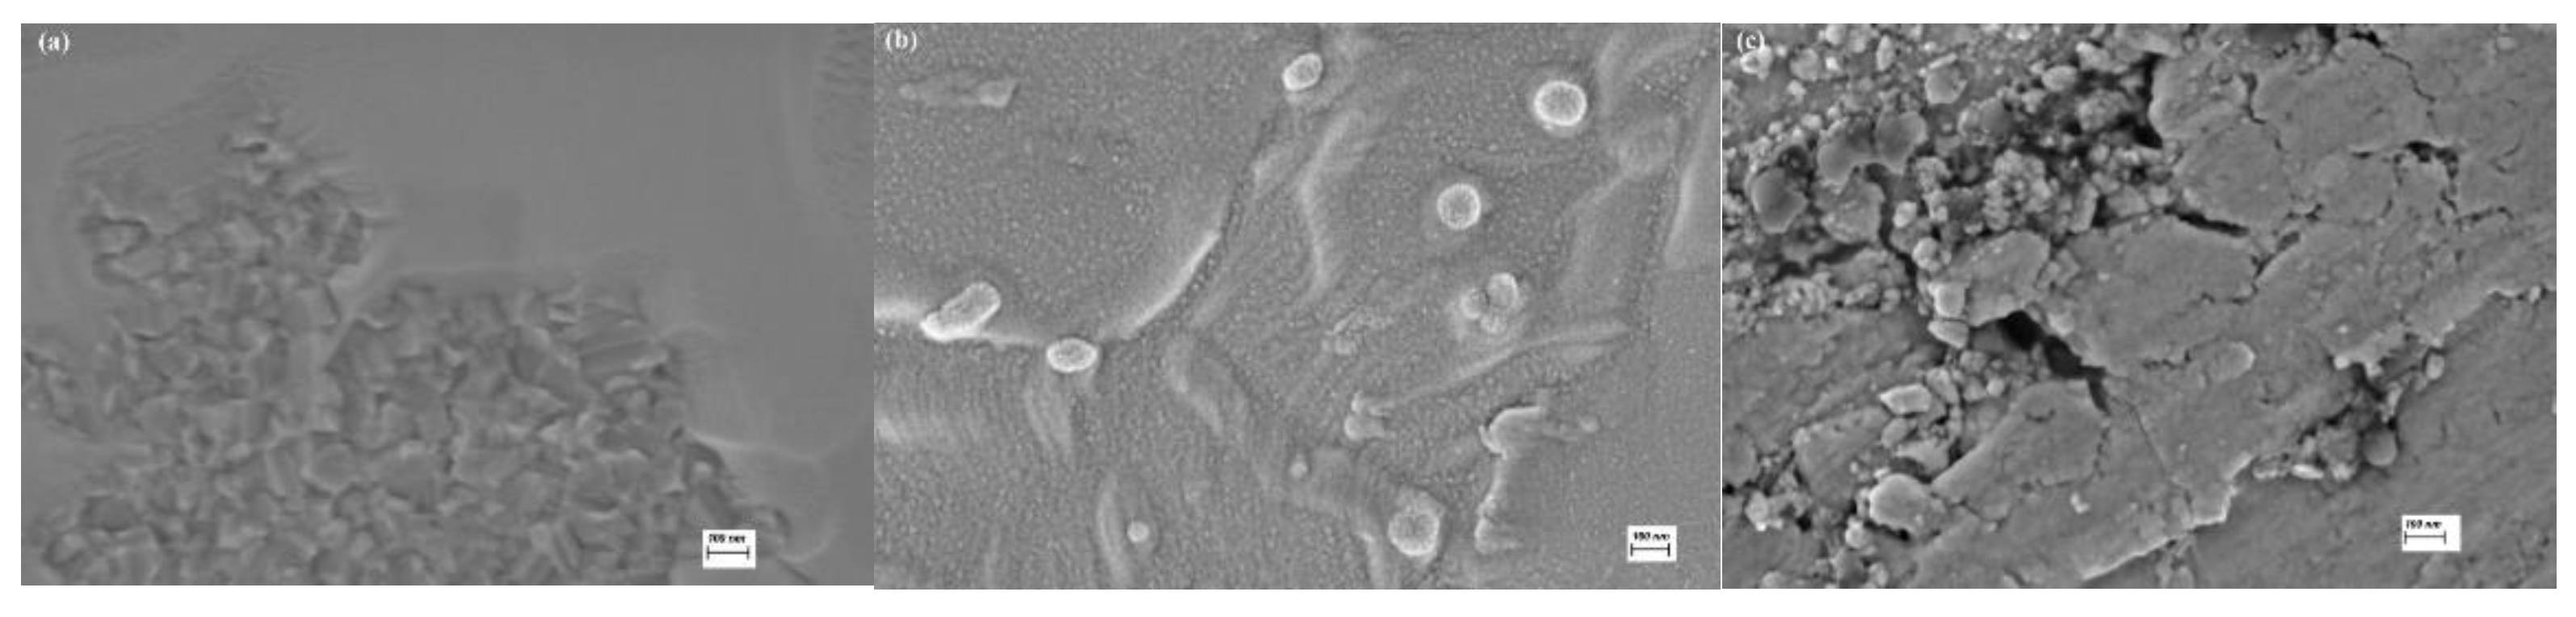
Figure 3.
Linear polarization curves of untreated titanium (B) immersed in Fusayama-Meyer artificial saliva (F.M.S) at different pH values (2.5, 6.5 and 9.0) at 37 °C.
Figure 3.
Linear polarization curves of untreated titanium (B) immersed in Fusayama-Meyer artificial saliva (F.M.S) at different pH values (2.5, 6.5 and 9.0) at 37 °C.
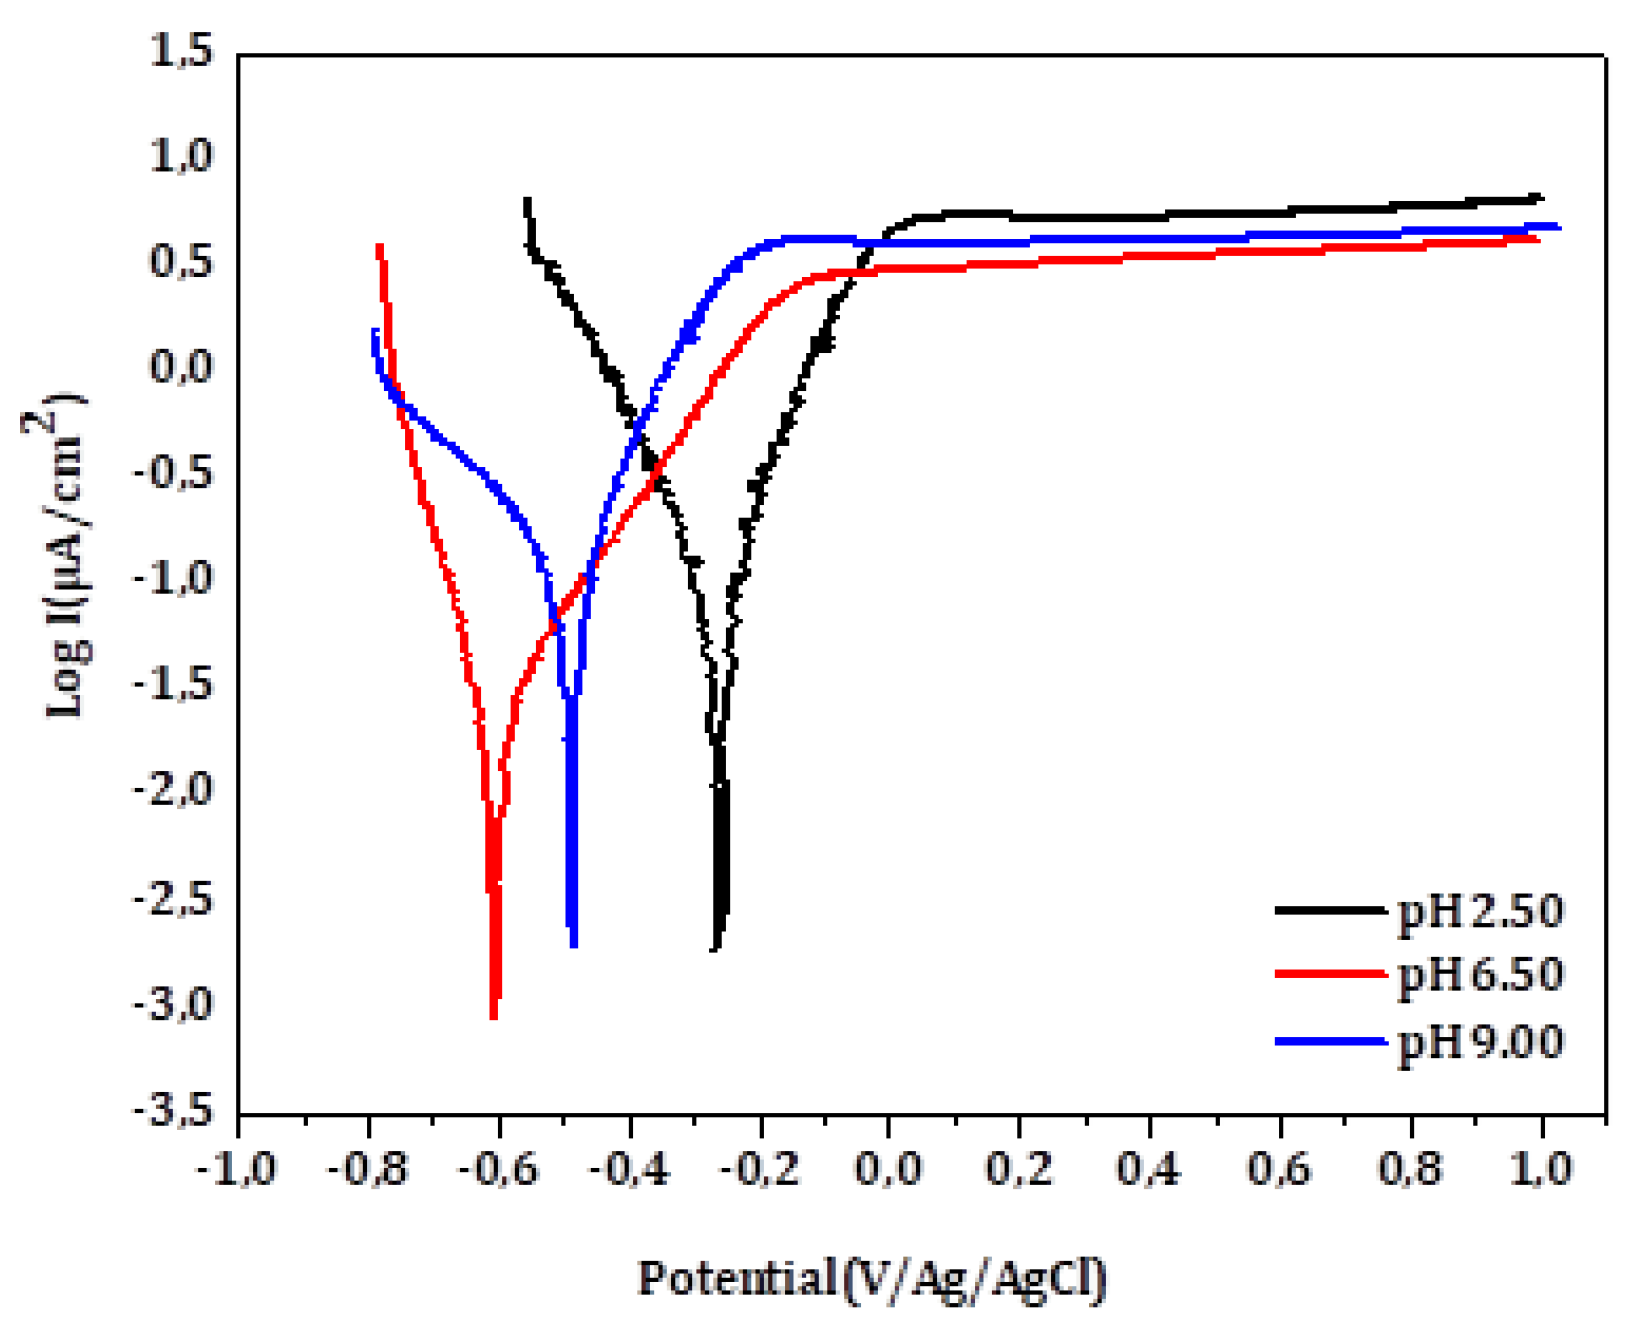
Figure 4.
Nyquist plots from EIS on untreated titanium (B) after 1 hour of immersion in artificial saliva at different pH values (2.5, 6.5 and 9.0) at 37 °C.
Figure 4.
Nyquist plots from EIS on untreated titanium (B) after 1 hour of immersion in artificial saliva at different pH values (2.5, 6.5 and 9.0) at 37 °C.
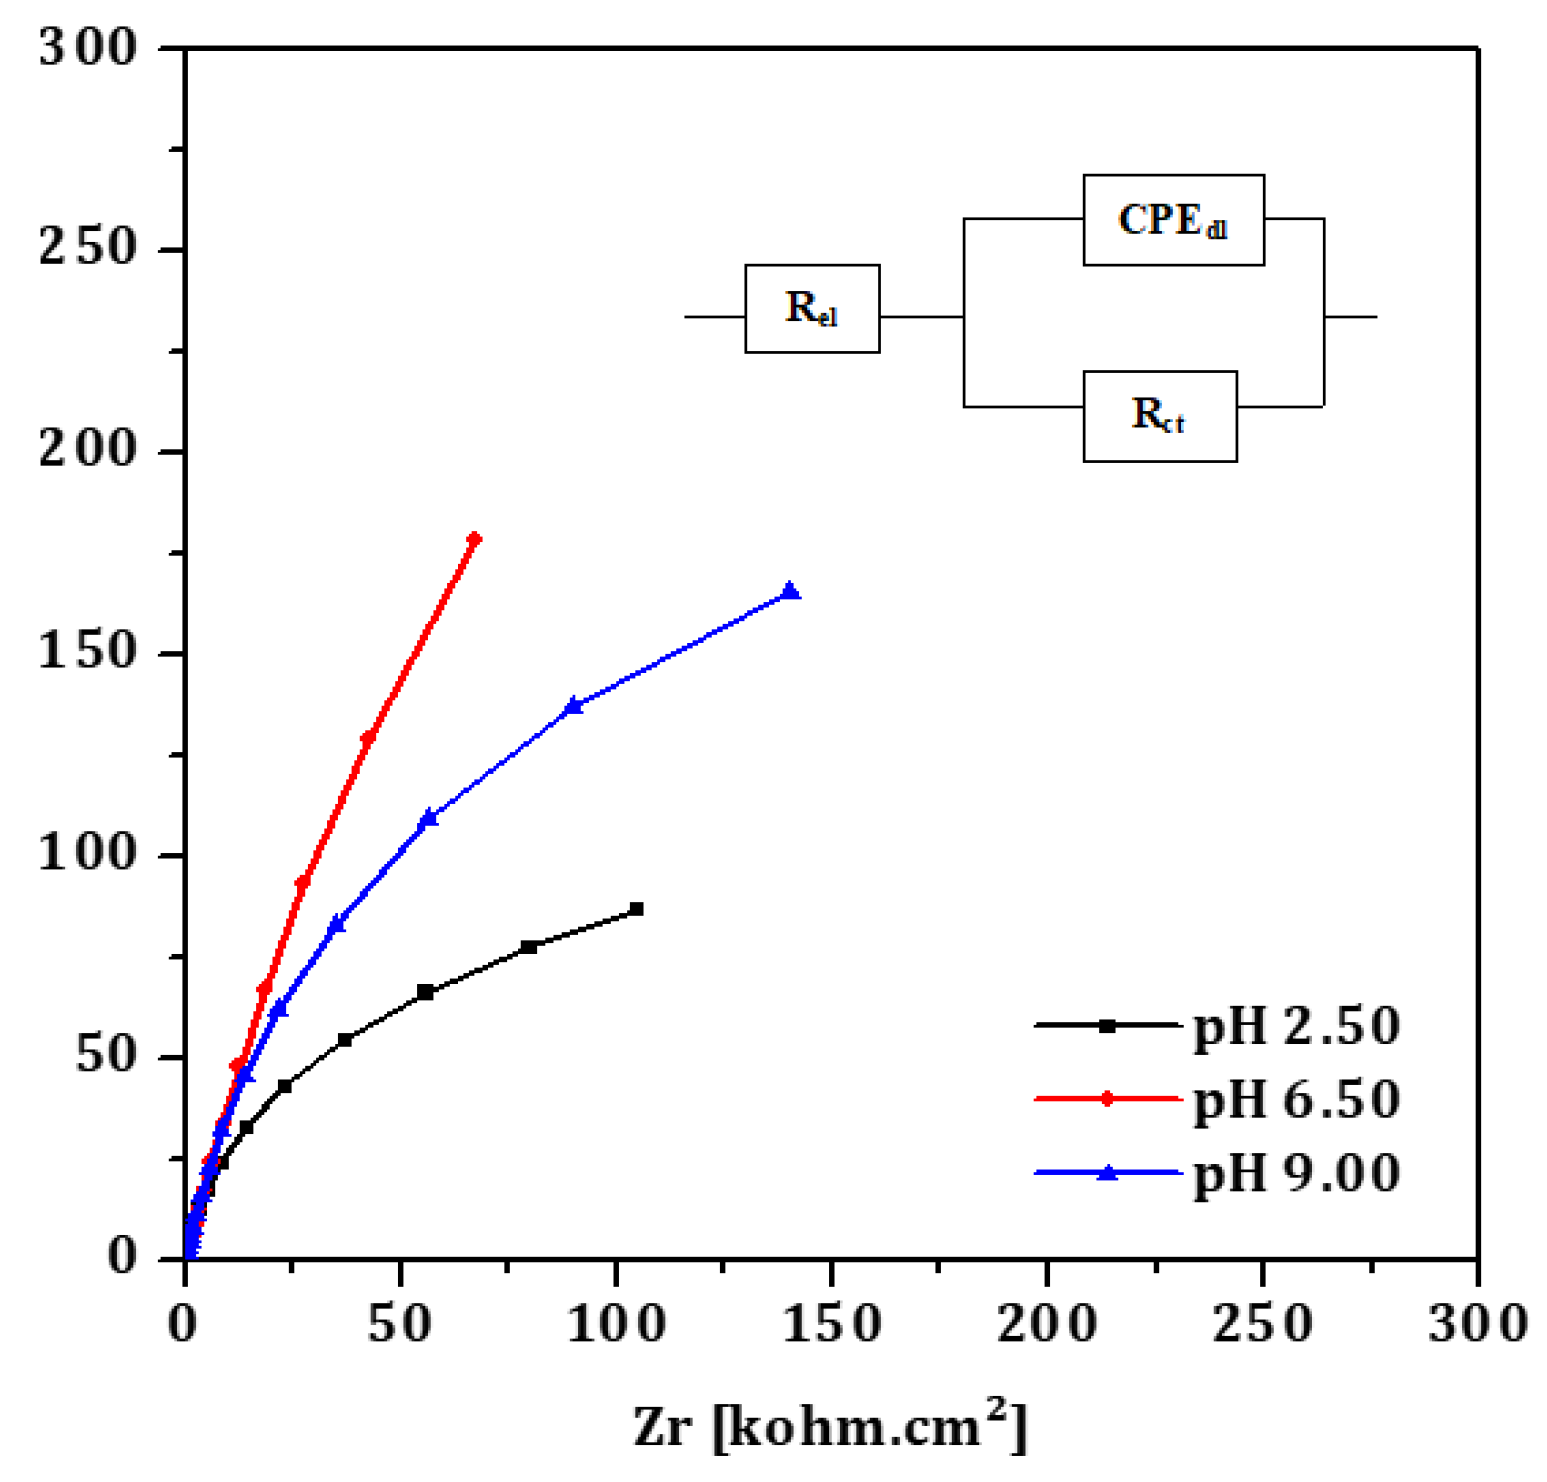
Figure 5.
Linear polarization curves for: (a) electrochemically oxidized (EO), and (b) thermally treated titanium (TT) as a function of treatment duration (20 min, 1 h, 2 h, and 4 h). Measurements conducted in Fusayama-Meyer saliva (pH=6.5) at 37 °C.
Figure 5.
Linear polarization curves for: (a) electrochemically oxidized (EO), and (b) thermally treated titanium (TT) as a function of treatment duration (20 min, 1 h, 2 h, and 4 h). Measurements conducted in Fusayama-Meyer saliva (pH=6.5) at 37 °C.
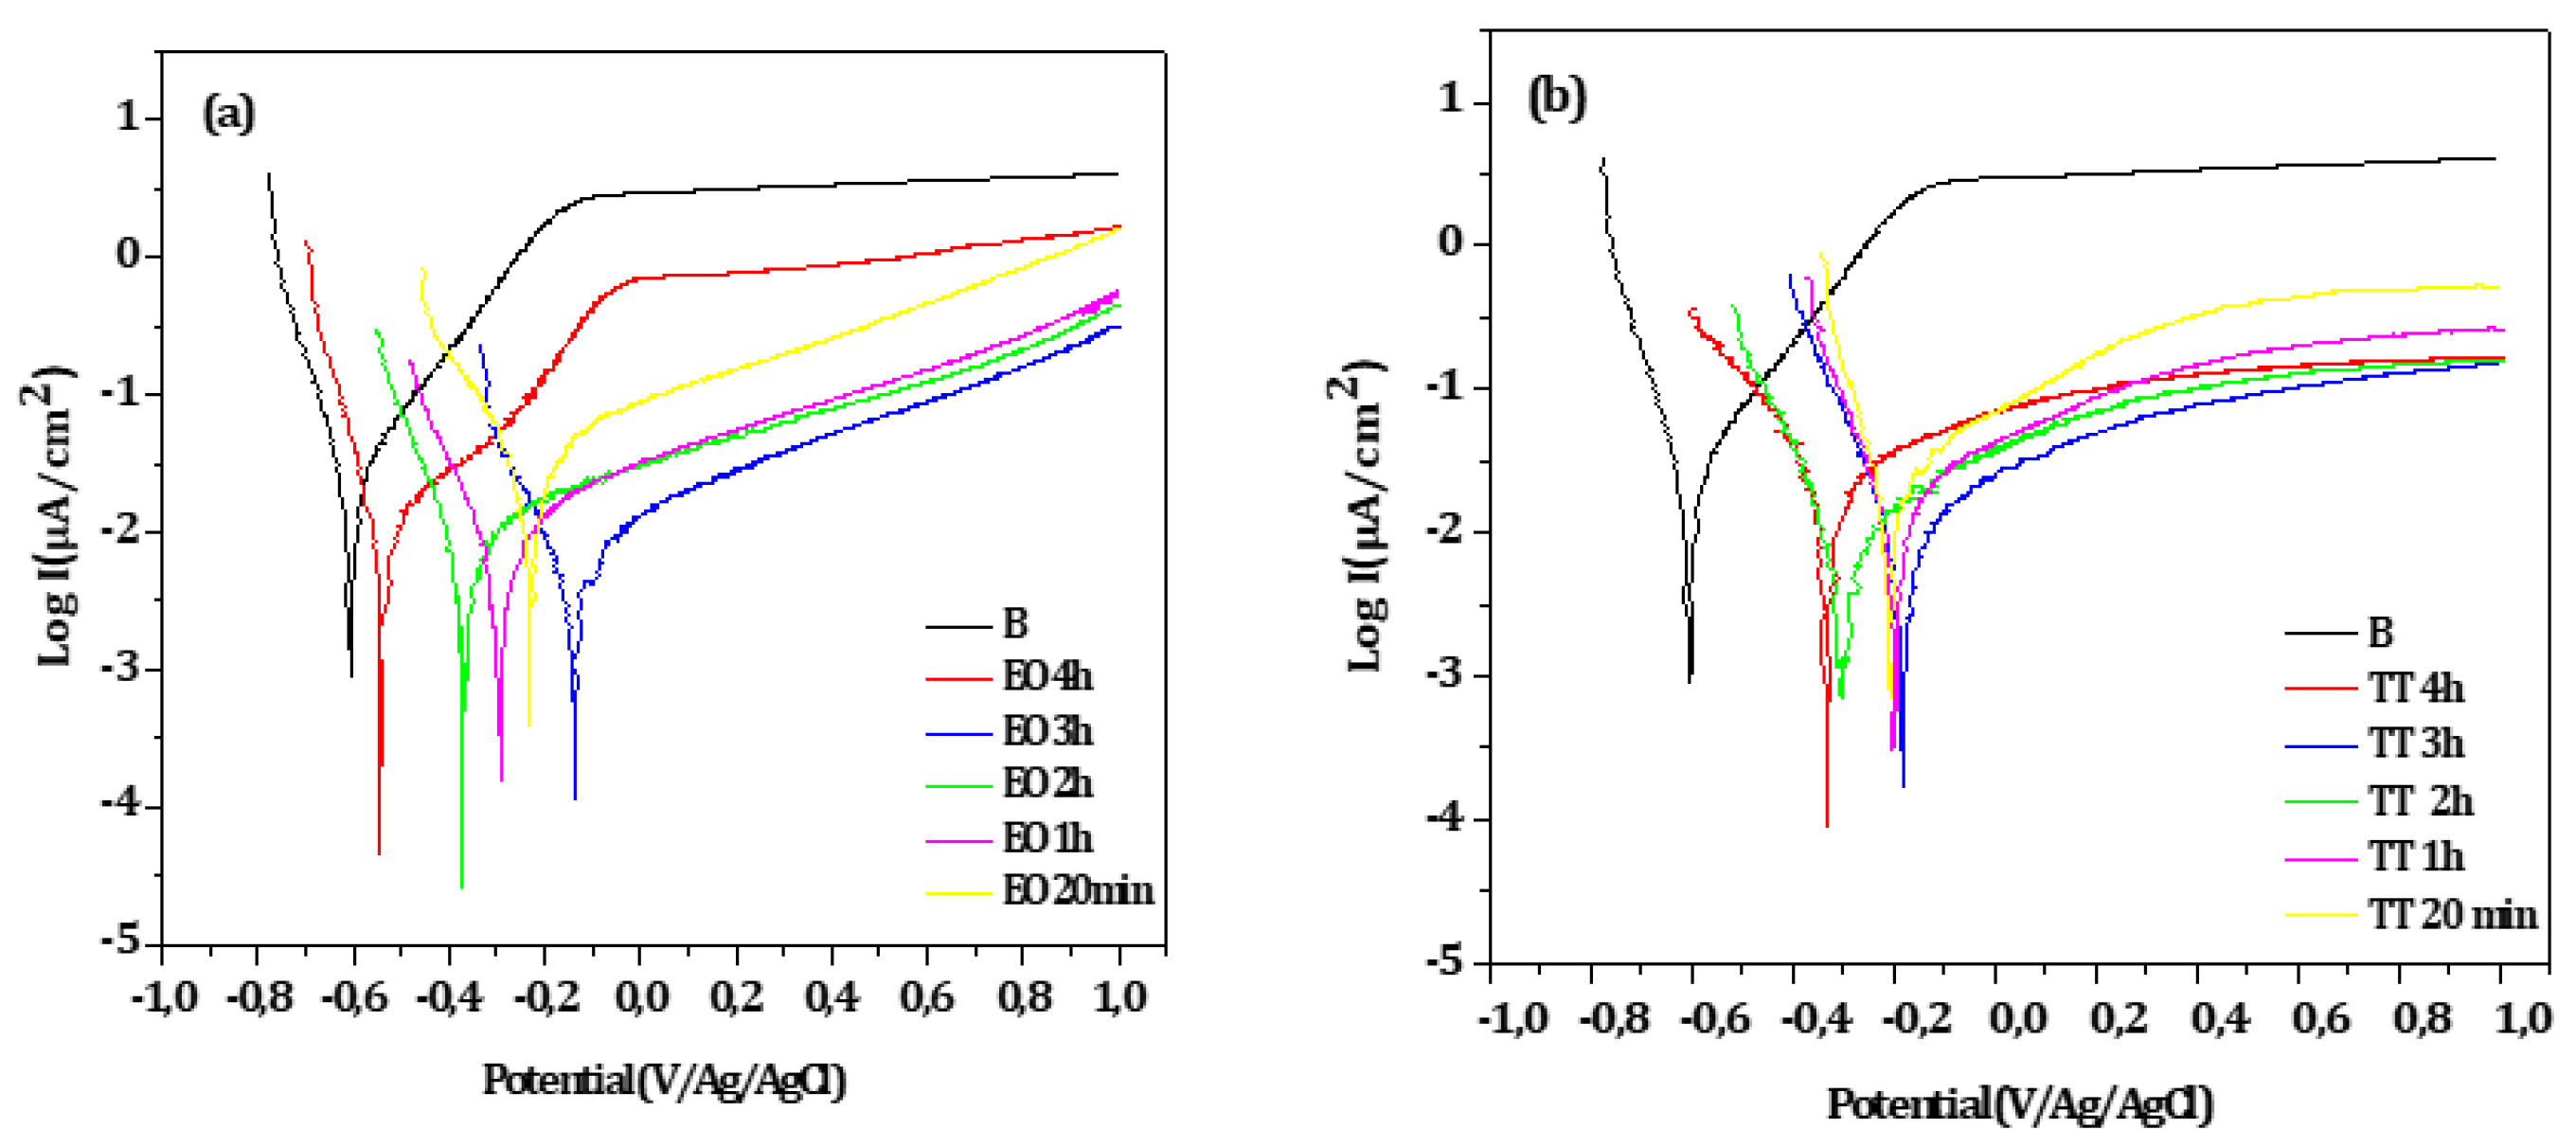
Figure 6.
Nyquist plots from EIS recorded on thermally treated titanium (TT) oxidized at 450 °C for different durations (20 min, 1 h, 2 h, and 4 h) in Fusayama-Meyer saliva (pH=6.5) at 37 °C.
Figure 6.
Nyquist plots from EIS recorded on thermally treated titanium (TT) oxidized at 450 °C for different durations (20 min, 1 h, 2 h, and 4 h) in Fusayama-Meyer saliva (pH=6.5) at 37 °C.
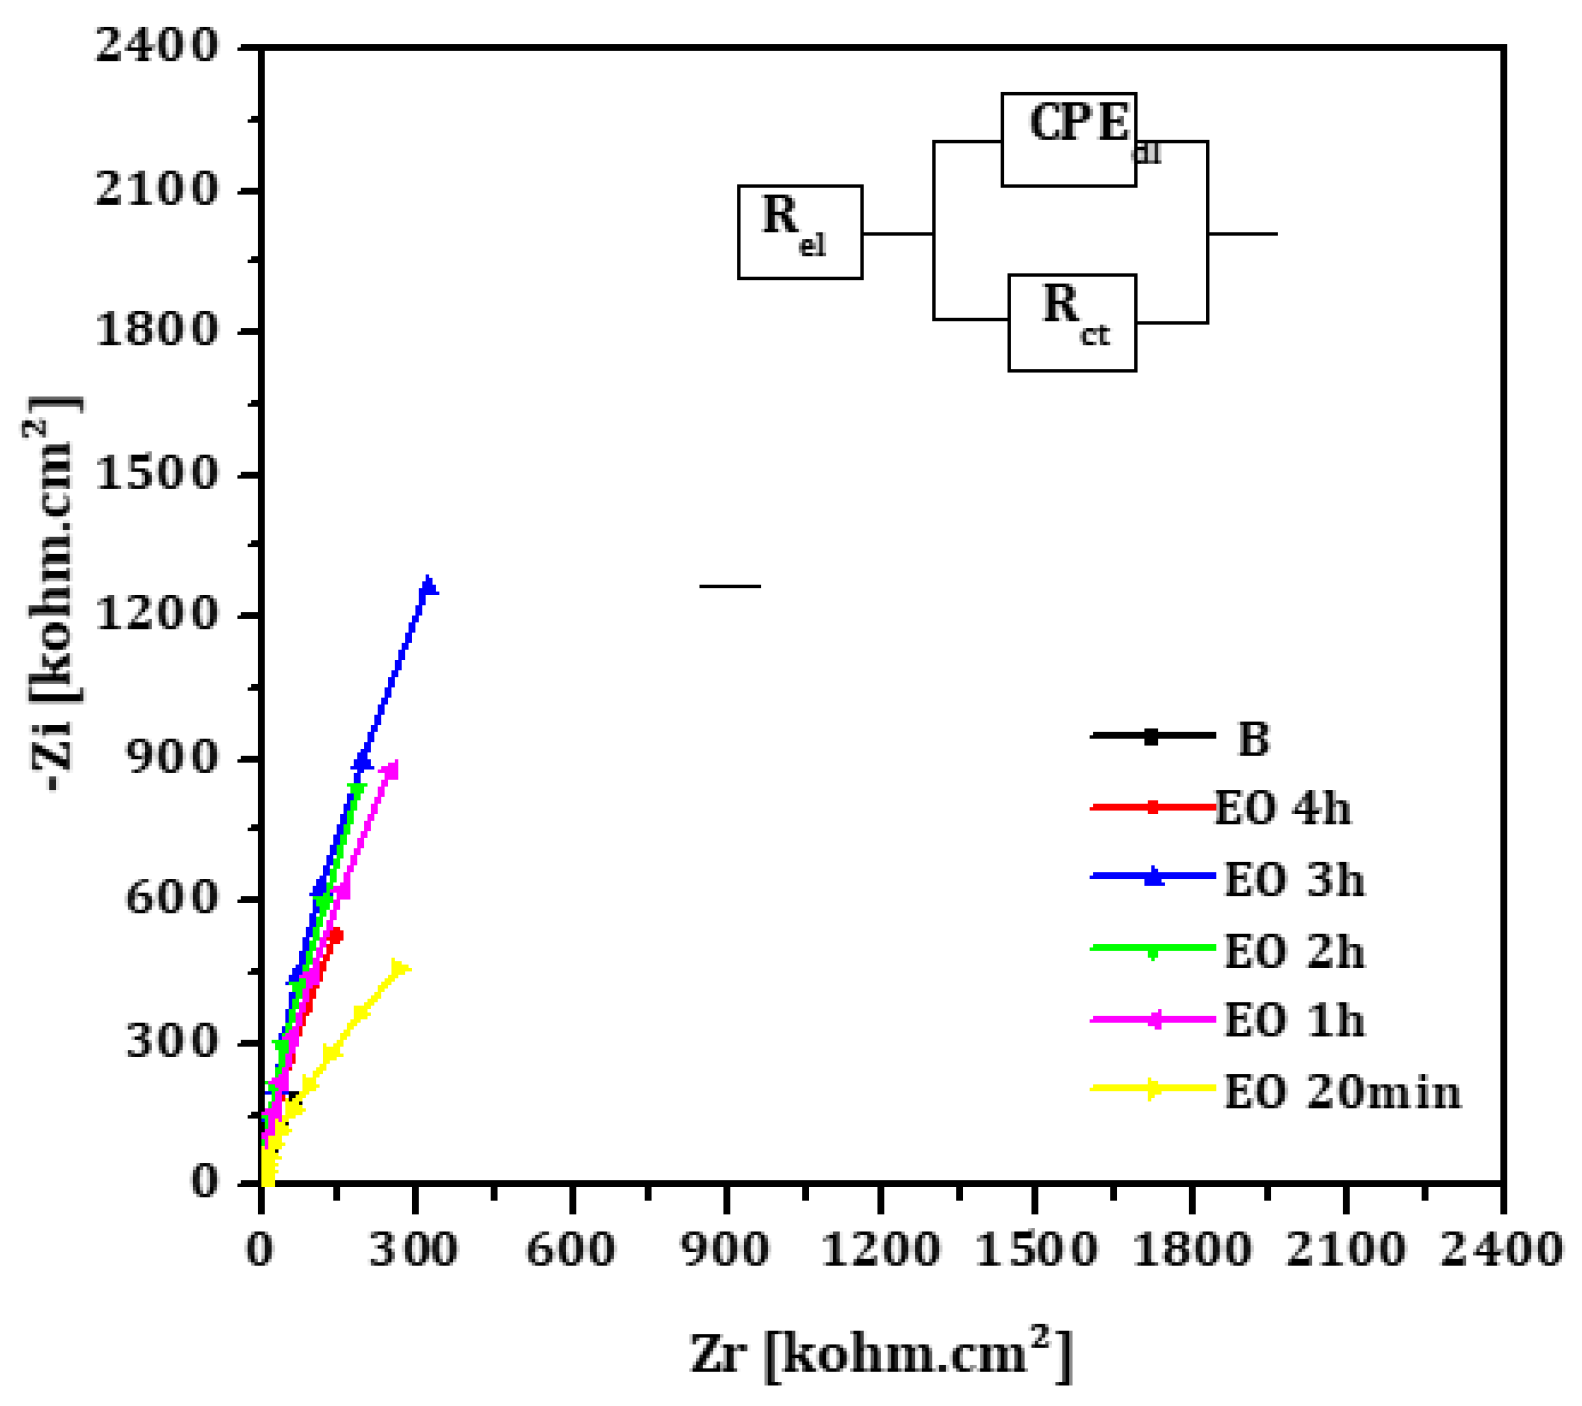
Figure 7.
Nyquist plots from EIS recorded on thermally treated titanium (TT) oxidized at 450 °C for different durations (20 min, 1 h, 2 h, and 4 h) in Fusayama-Meyer saliva (pH=6.5) at 37 °C.
Figure 7.
Nyquist plots from EIS recorded on thermally treated titanium (TT) oxidized at 450 °C for different durations (20 min, 1 h, 2 h, and 4 h) in Fusayama-Meyer saliva (pH=6.5) at 37 °C.
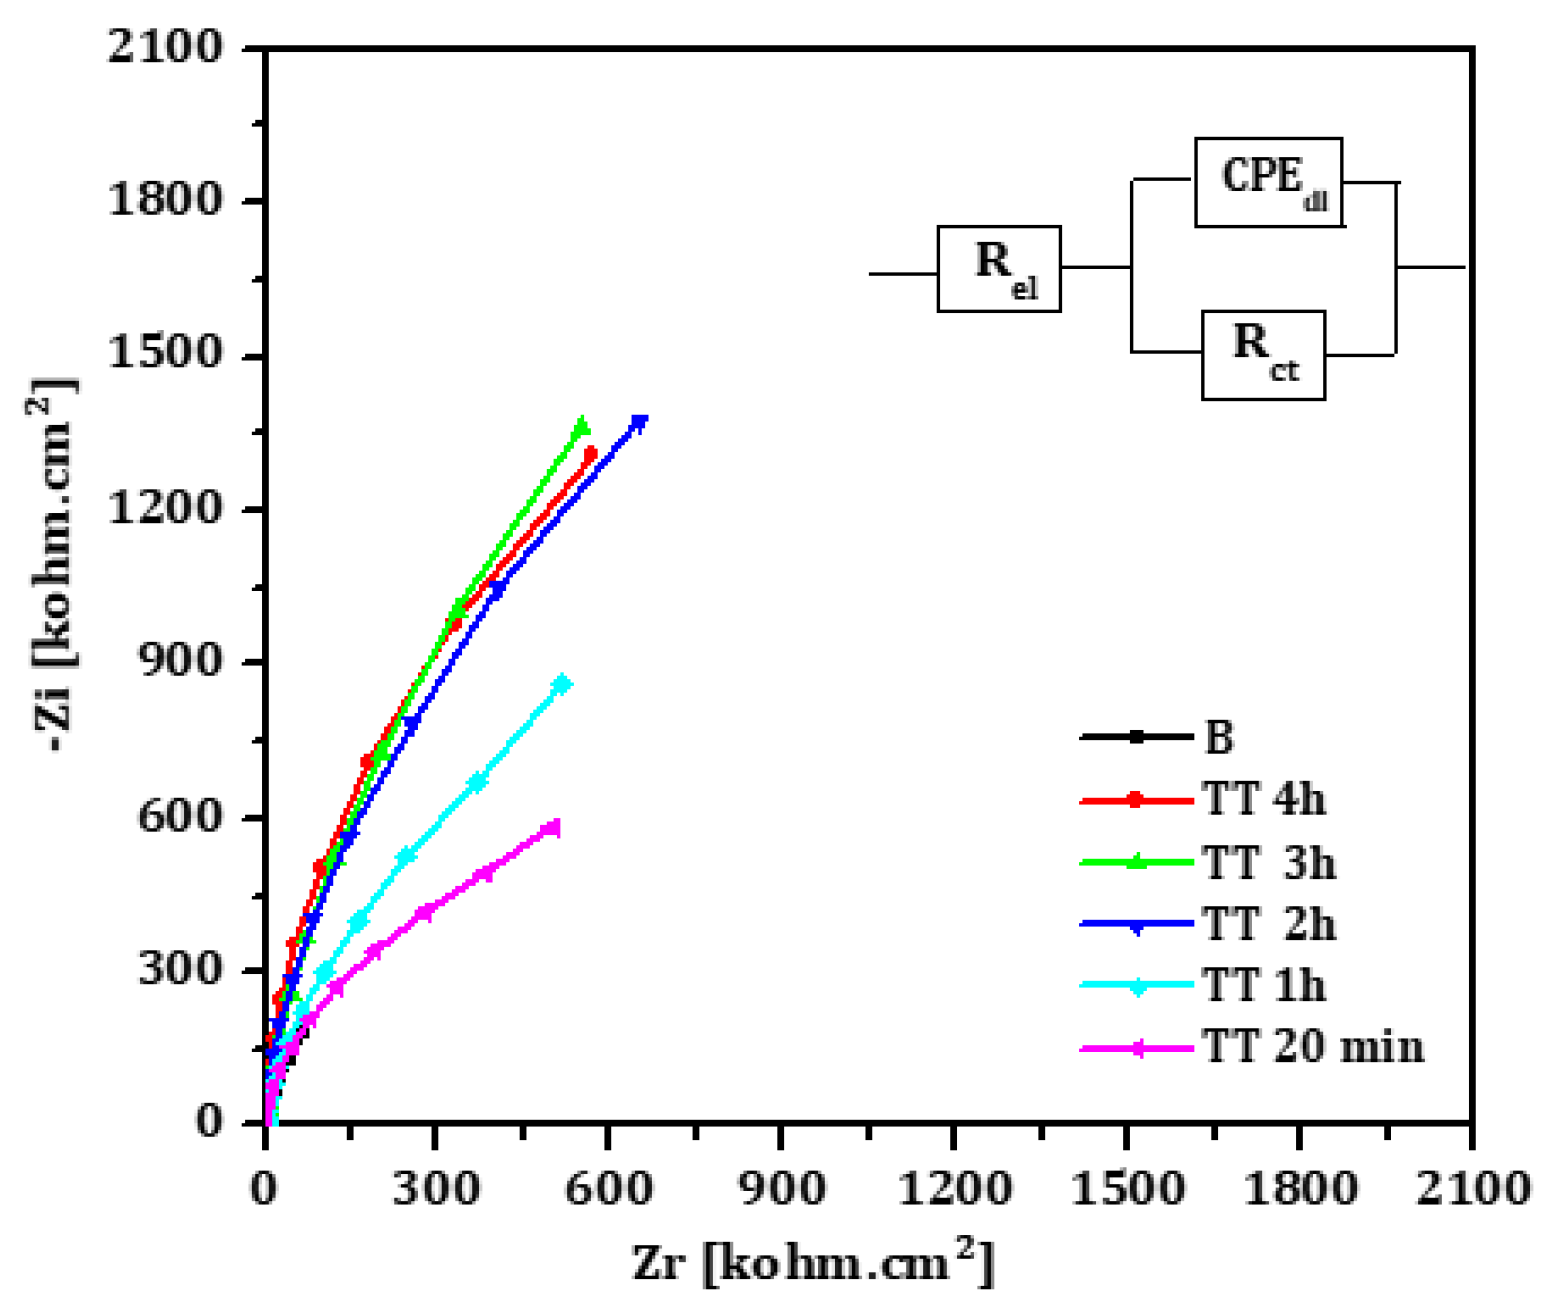
Figure 8.
Linear polarisation curves for untreated titanium (B) in Fusayama-Meyer saliva at 37 °C with various fluoride ions concentrations: 1,000 ppm, 5,000 ppm, and 12,300 ppm.
Figure 8.
Linear polarisation curves for untreated titanium (B) in Fusayama-Meyer saliva at 37 °C with various fluoride ions concentrations: 1,000 ppm, 5,000 ppm, and 12,300 ppm.
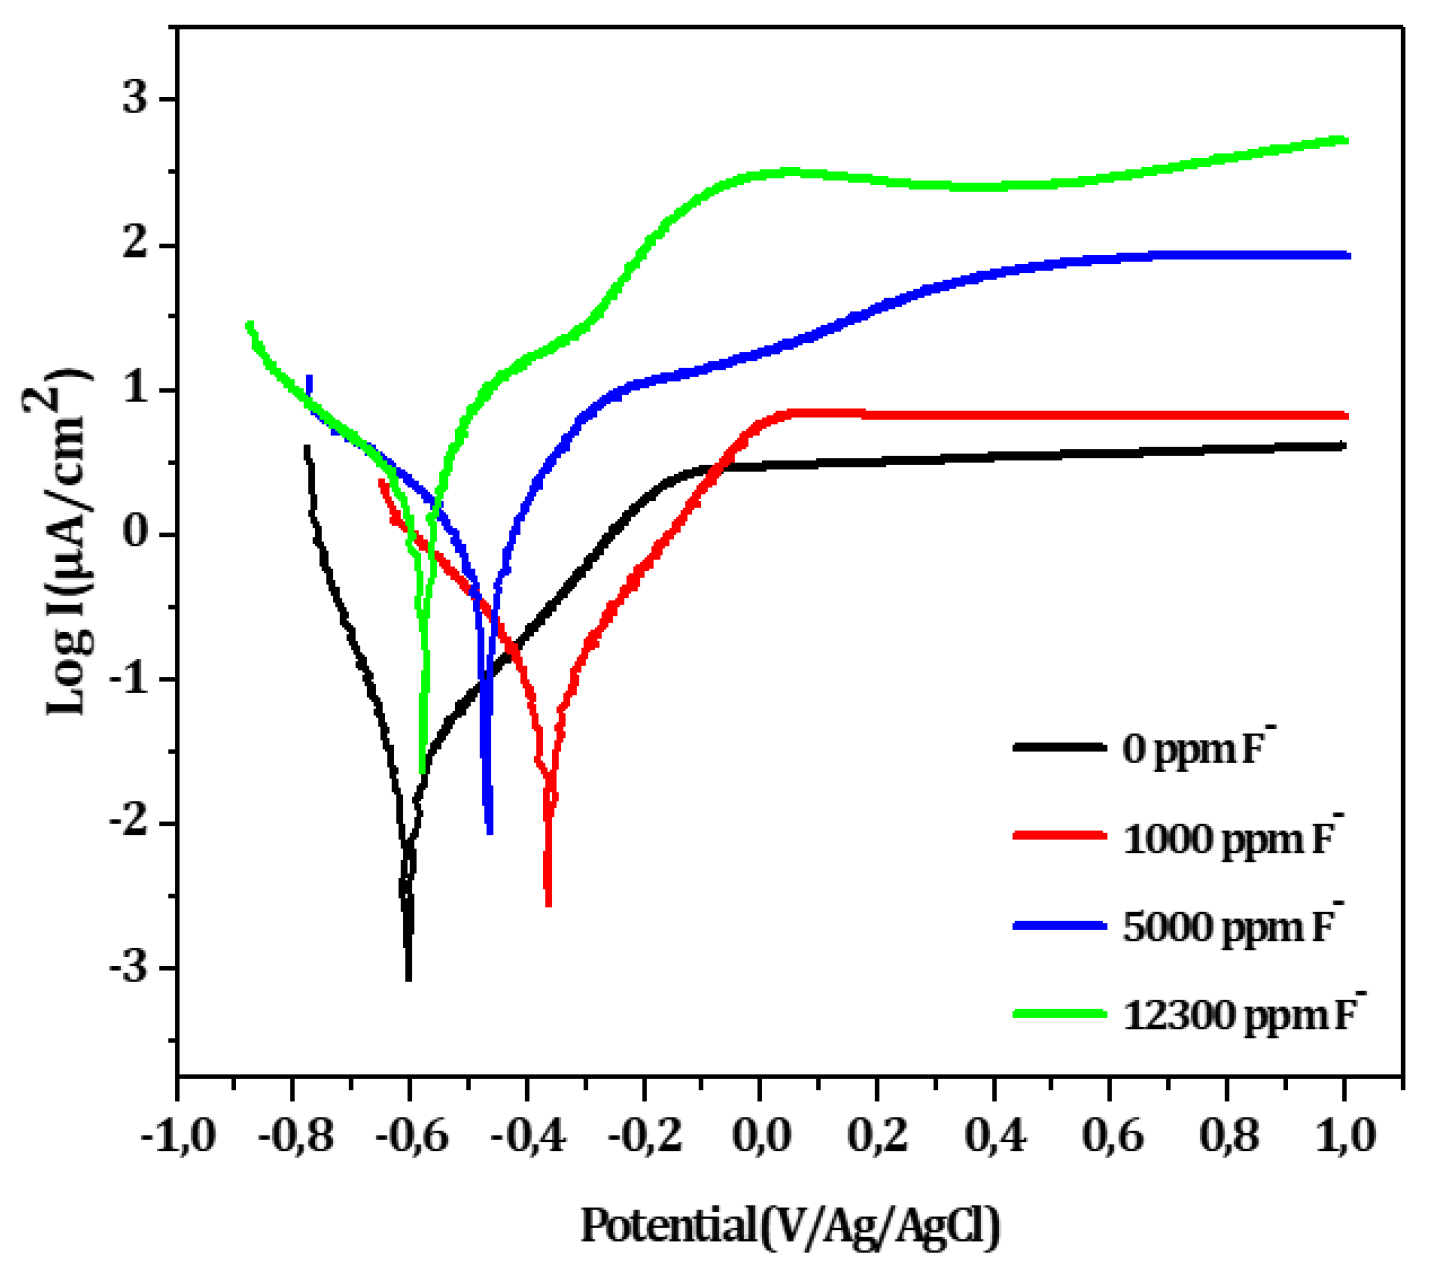
Figure 9.
Nyquist plots from EIS recorded on untreated titanium (B) after 1 hour of immersion in Fusayama-Meyer saliva with increasing fluoride concentrations (1,000, 5,000, and 12,300 ppm) at 37 °C.
Figure 9.
Nyquist plots from EIS recorded on untreated titanium (B) after 1 hour of immersion in Fusayama-Meyer saliva with increasing fluoride concentrations (1,000, 5,000, and 12,300 ppm) at 37 °C.
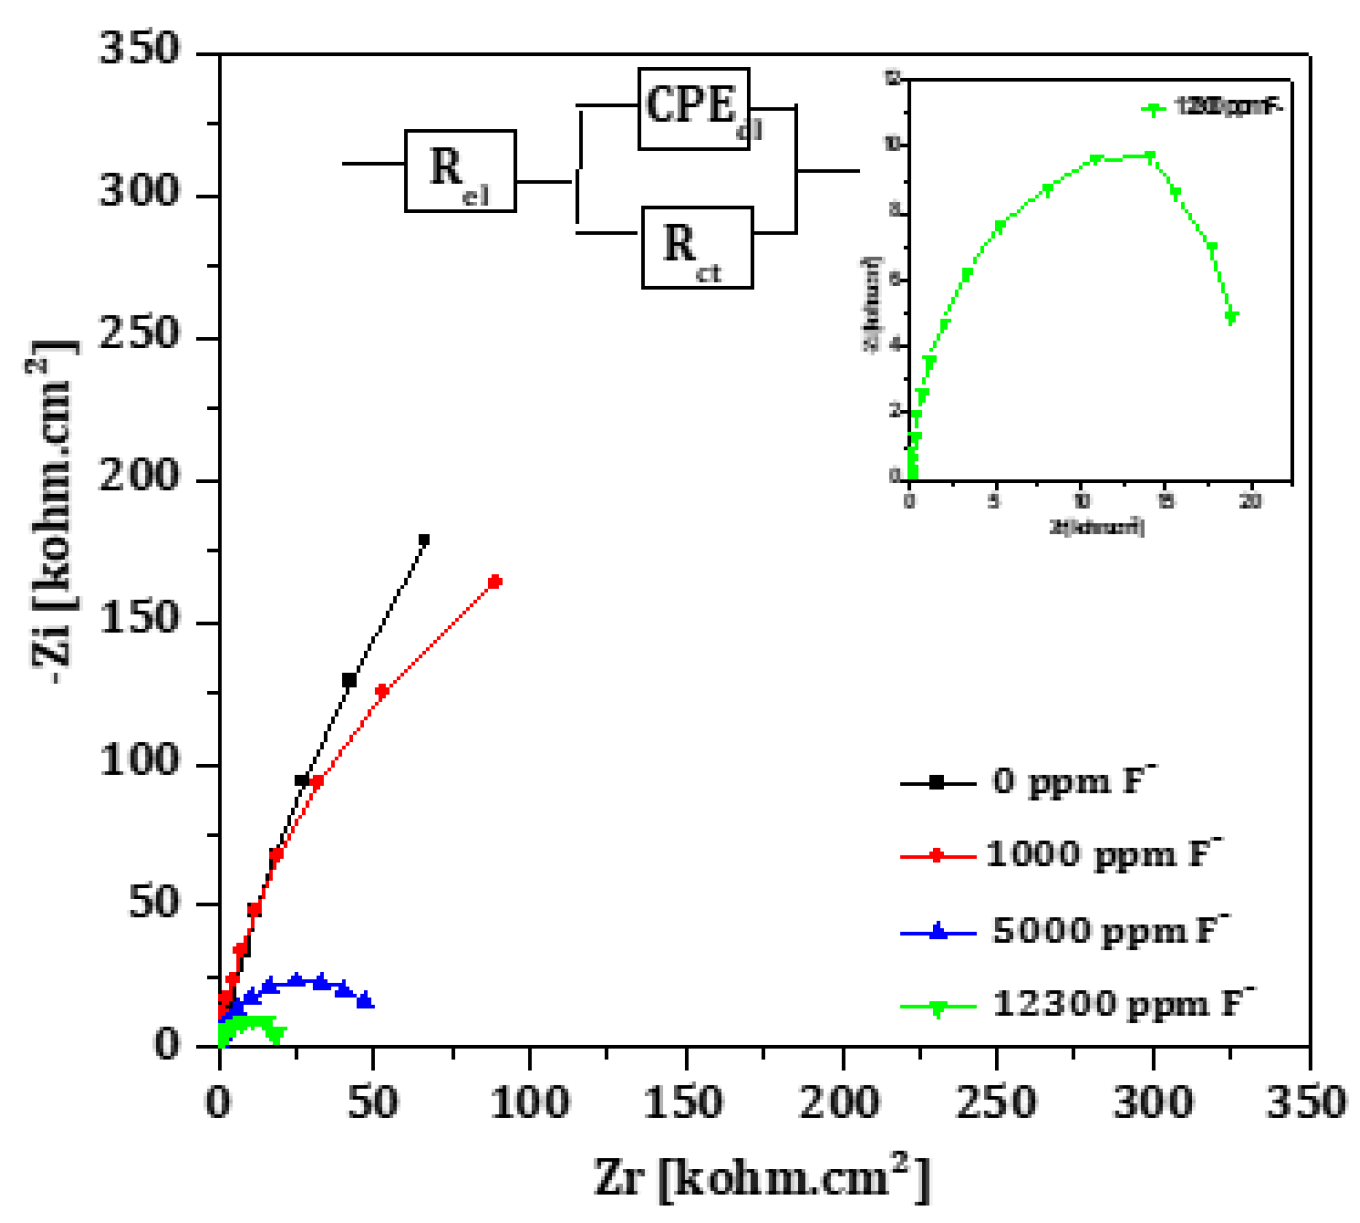
Figure 10.
Electrical equivalent circuits used for fitting EIS data: single-time constant Randle’s circuit (for low fluoride concentrations) and two-time constant model (for high fluoride concentration, 12,300 ppm), representing a porous outer layer and an inner barrier layer.
Figure 10.
Electrical equivalent circuits used for fitting EIS data: single-time constant Randle’s circuit (for low fluoride concentrations) and two-time constant model (for high fluoride concentration, 12,300 ppm), representing a porous outer layer and an inner barrier layer.
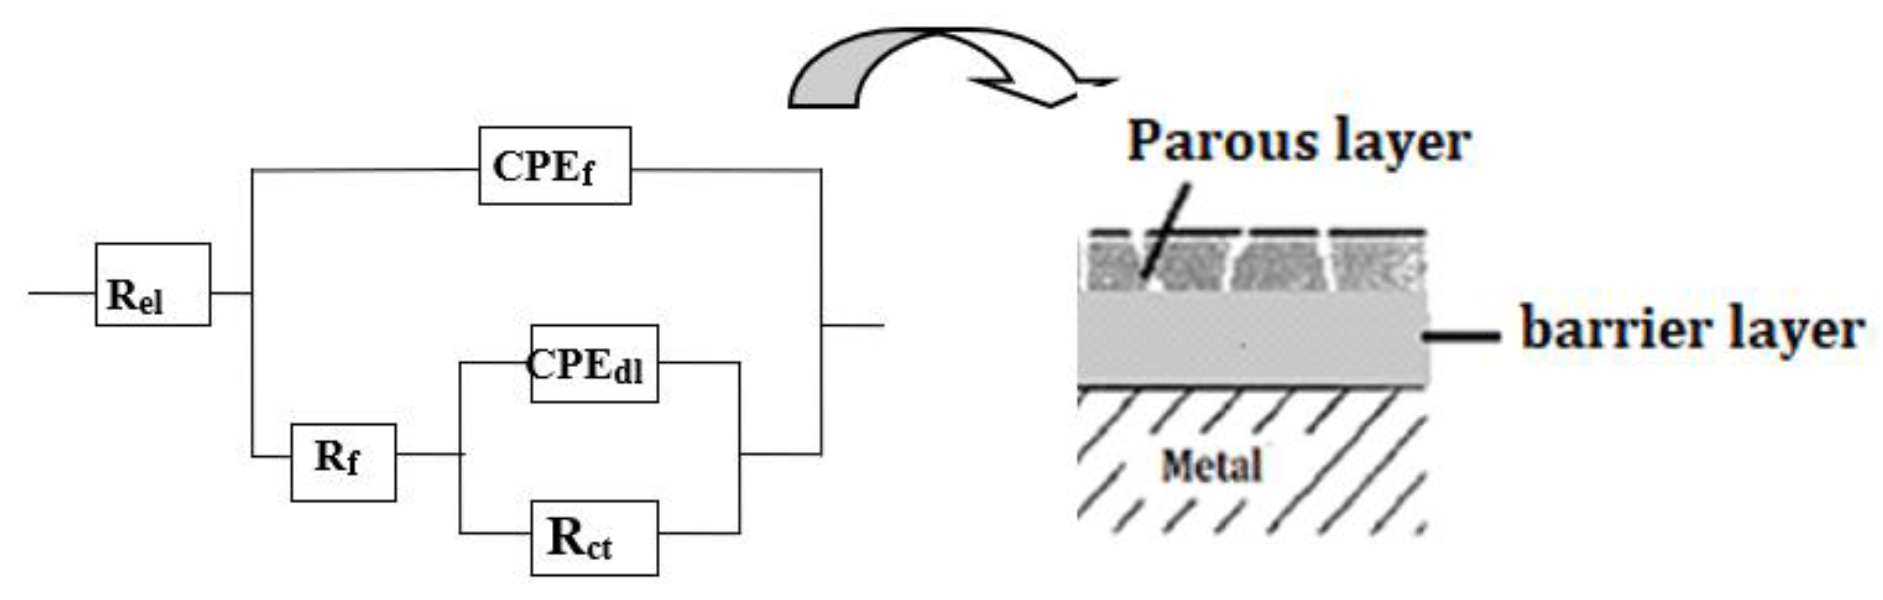
Figure 11.
SEM images of untreated titanium (B) after corrosion experiments in artificial saliva at 37°C containing (a) 1,000 ppm F⁻ and (b) 12,300 ppm F⁻ both at 37 °C. The surface shows increasing porosity and damage with higher fluoride concentration.
Figure 11.
SEM images of untreated titanium (B) after corrosion experiments in artificial saliva at 37°C containing (a) 1,000 ppm F⁻ and (b) 12,300 ppm F⁻ both at 37 °C. The surface shows increasing porosity and damage with higher fluoride concentration.
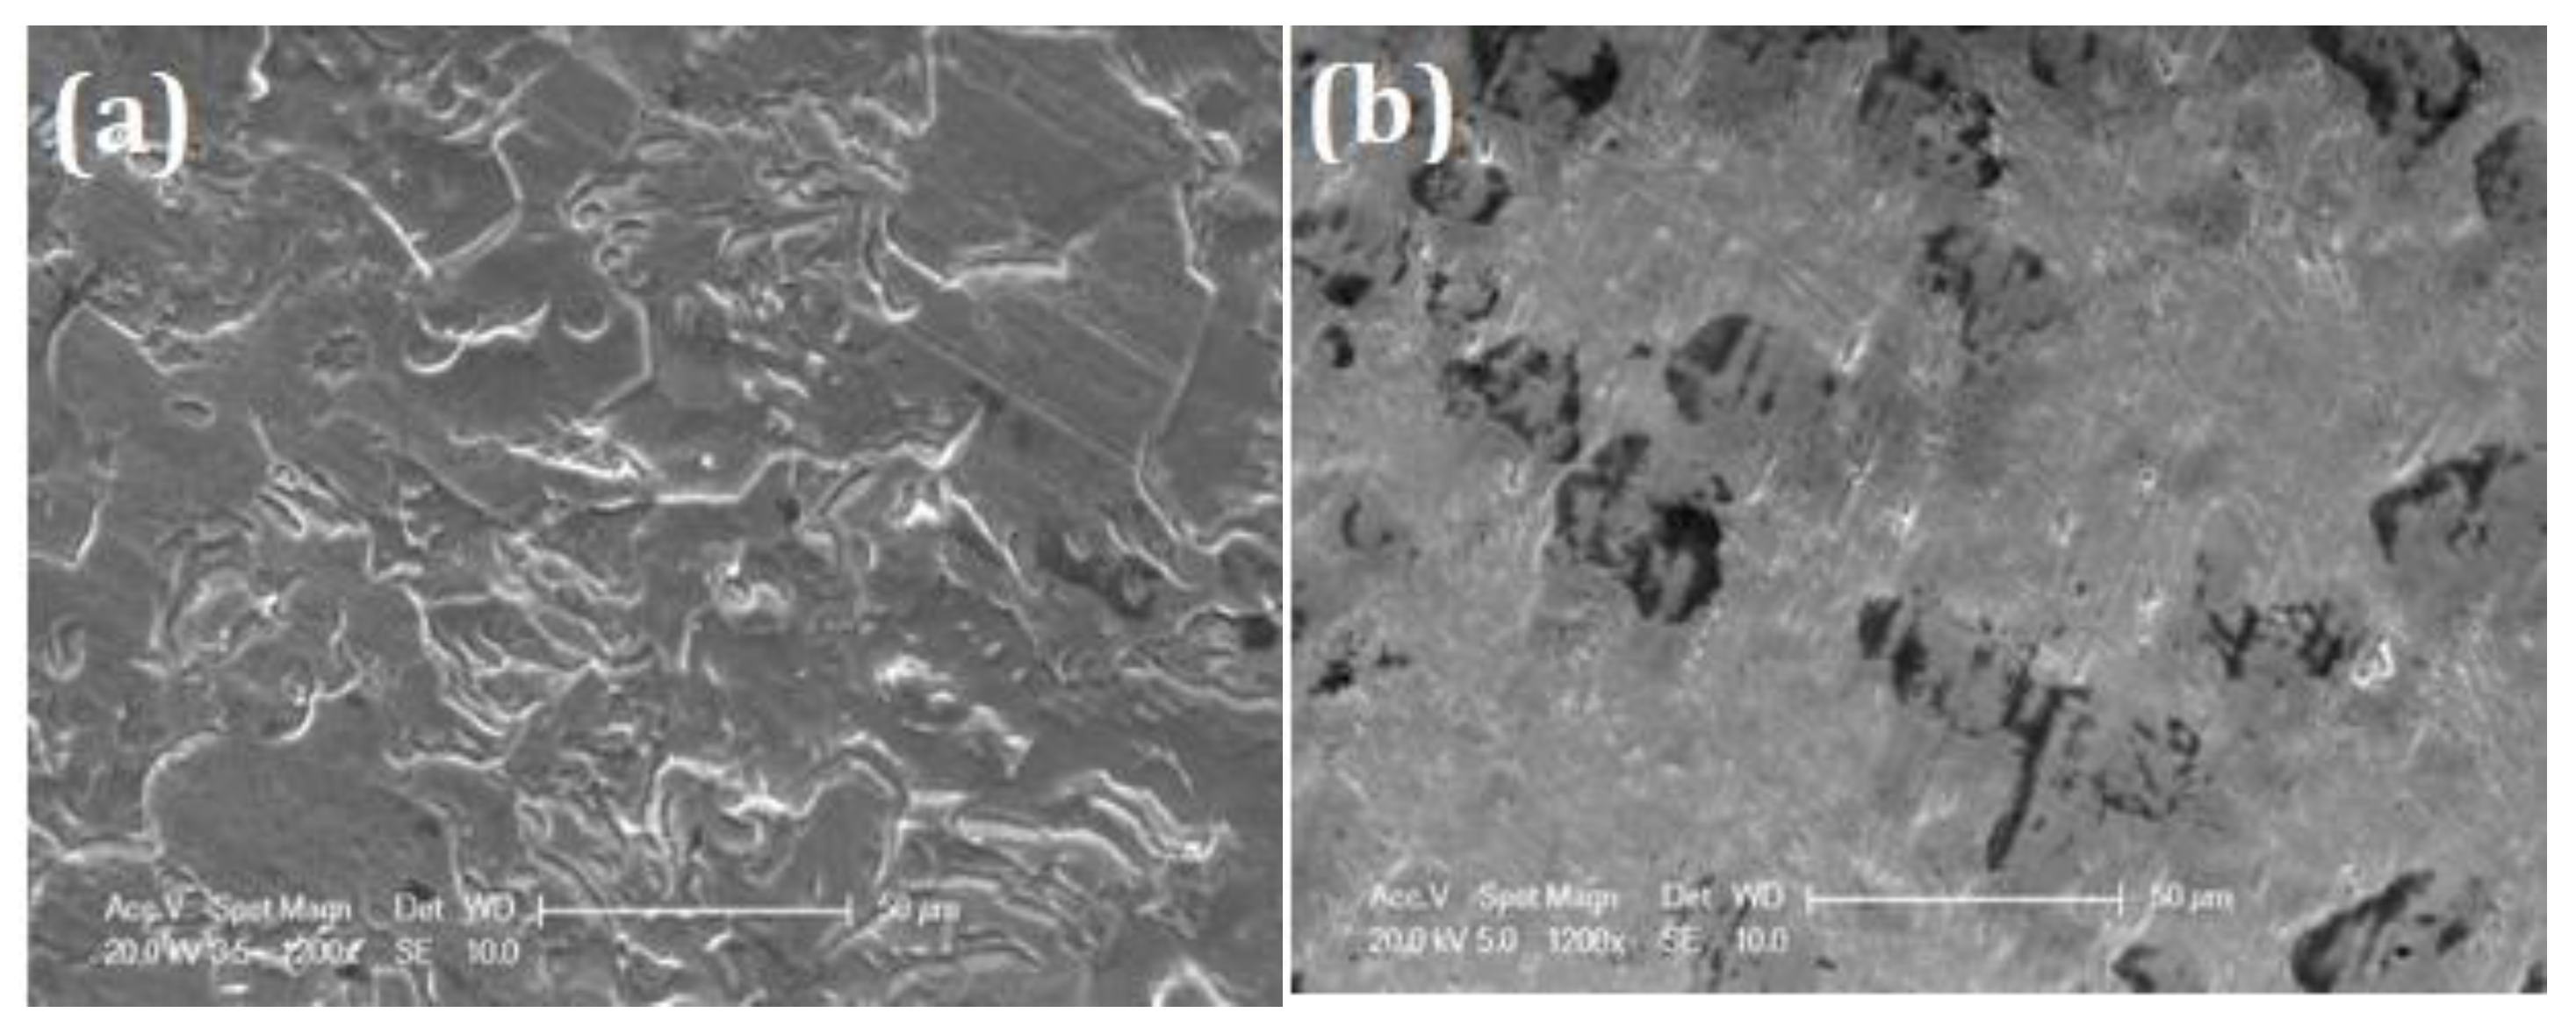
Figure 12.
Linear polarization curves for bare titanium (B), electrochemically oxidized (EO) and thermally treated (TT) samples treated for 3 hours, in F.M.S. with 12,300 ppm fluoride at 37 °C.
Figure 12.
Linear polarization curves for bare titanium (B), electrochemically oxidized (EO) and thermally treated (TT) samples treated for 3 hours, in F.M.S. with 12,300 ppm fluoride at 37 °C.
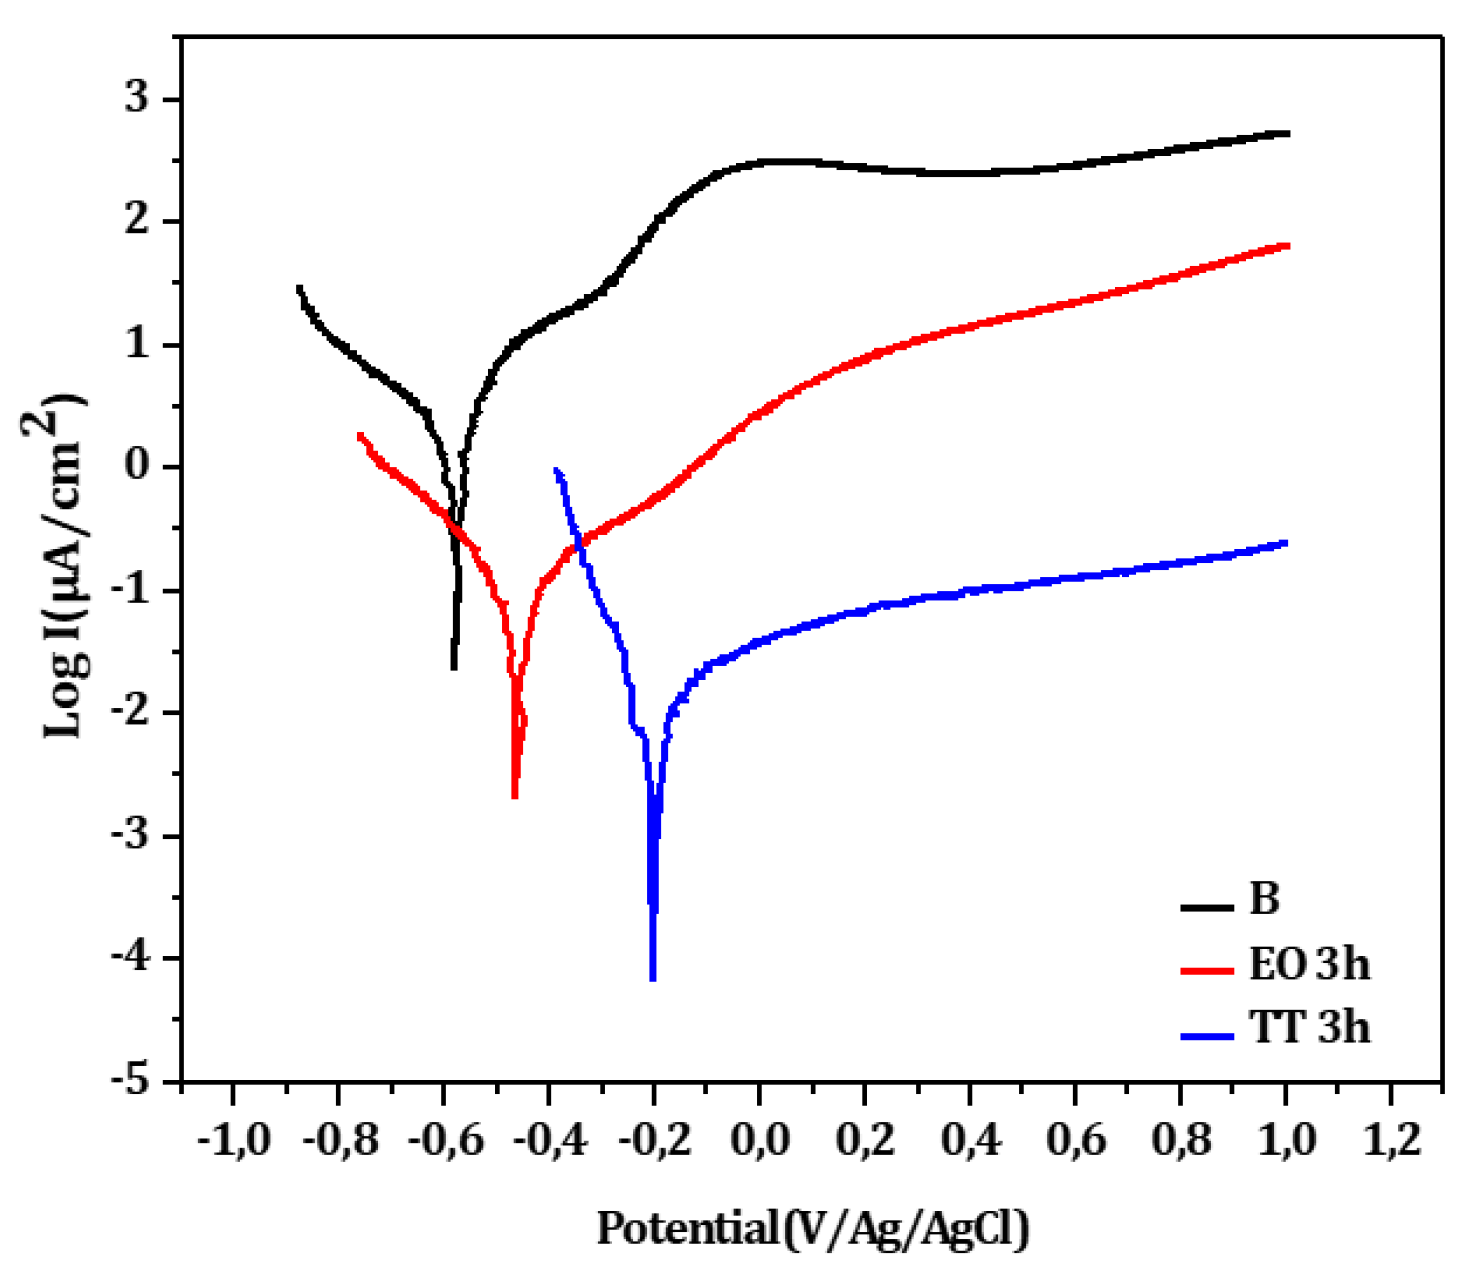
Figure 13.
Nyquist plots from EIS in F.M.S. with 12,300 ppm fluoride at 37 °C recorded on bare titanium (B), electrochemically oxidized (EO) and thermally treated (TT) samples, both treated for 3 h.
Figure 13.
Nyquist plots from EIS in F.M.S. with 12,300 ppm fluoride at 37 °C recorded on bare titanium (B), electrochemically oxidized (EO) and thermally treated (TT) samples, both treated for 3 h.
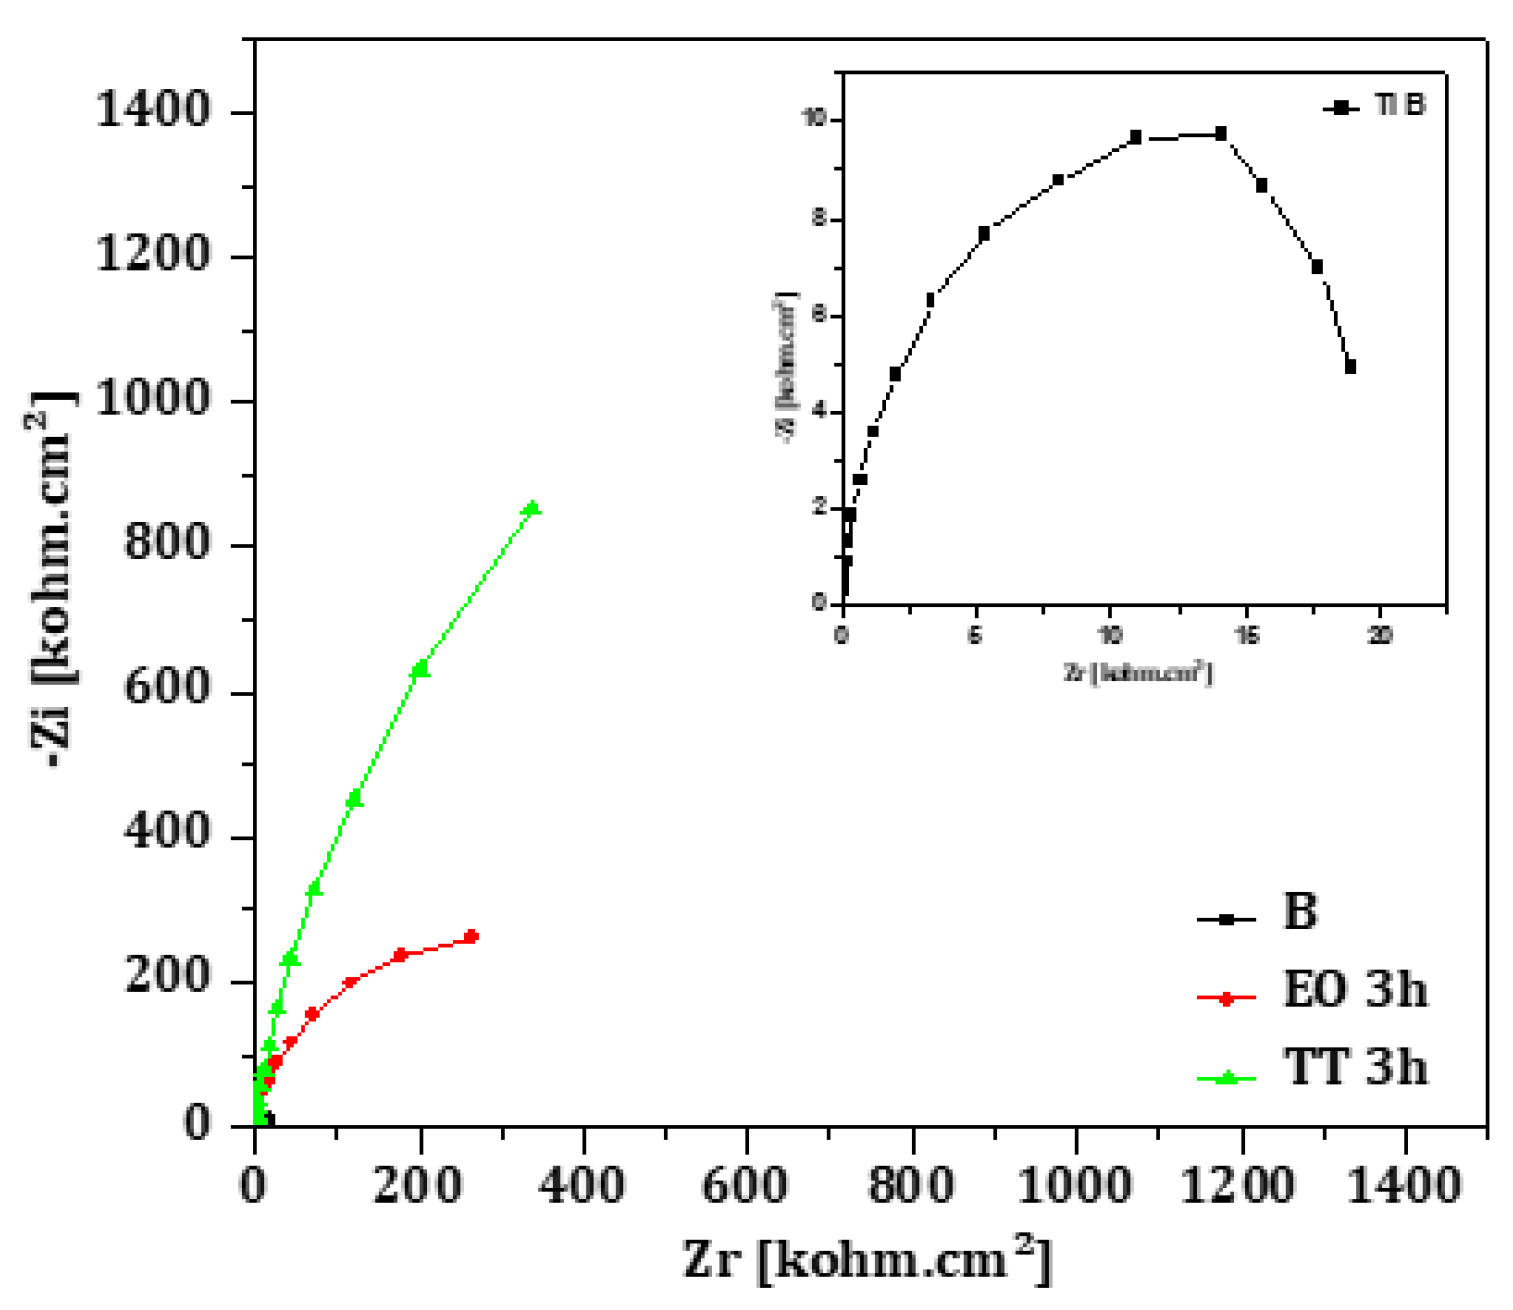
Figure 14.
SEM images after corrosion experiments in artificial saliva containing 12,300 ppm F- at 37°C on (a) electrochemically oxidized (EO) and (b) thermally treated (TT) titanium samples, both treated for 3 hours. The TT sample exhibits minimal damage compared to EO.
Figure 14.
SEM images after corrosion experiments in artificial saliva containing 12,300 ppm F- at 37°C on (a) electrochemically oxidized (EO) and (b) thermally treated (TT) titanium samples, both treated for 3 hours. The TT sample exhibits minimal damage compared to EO.
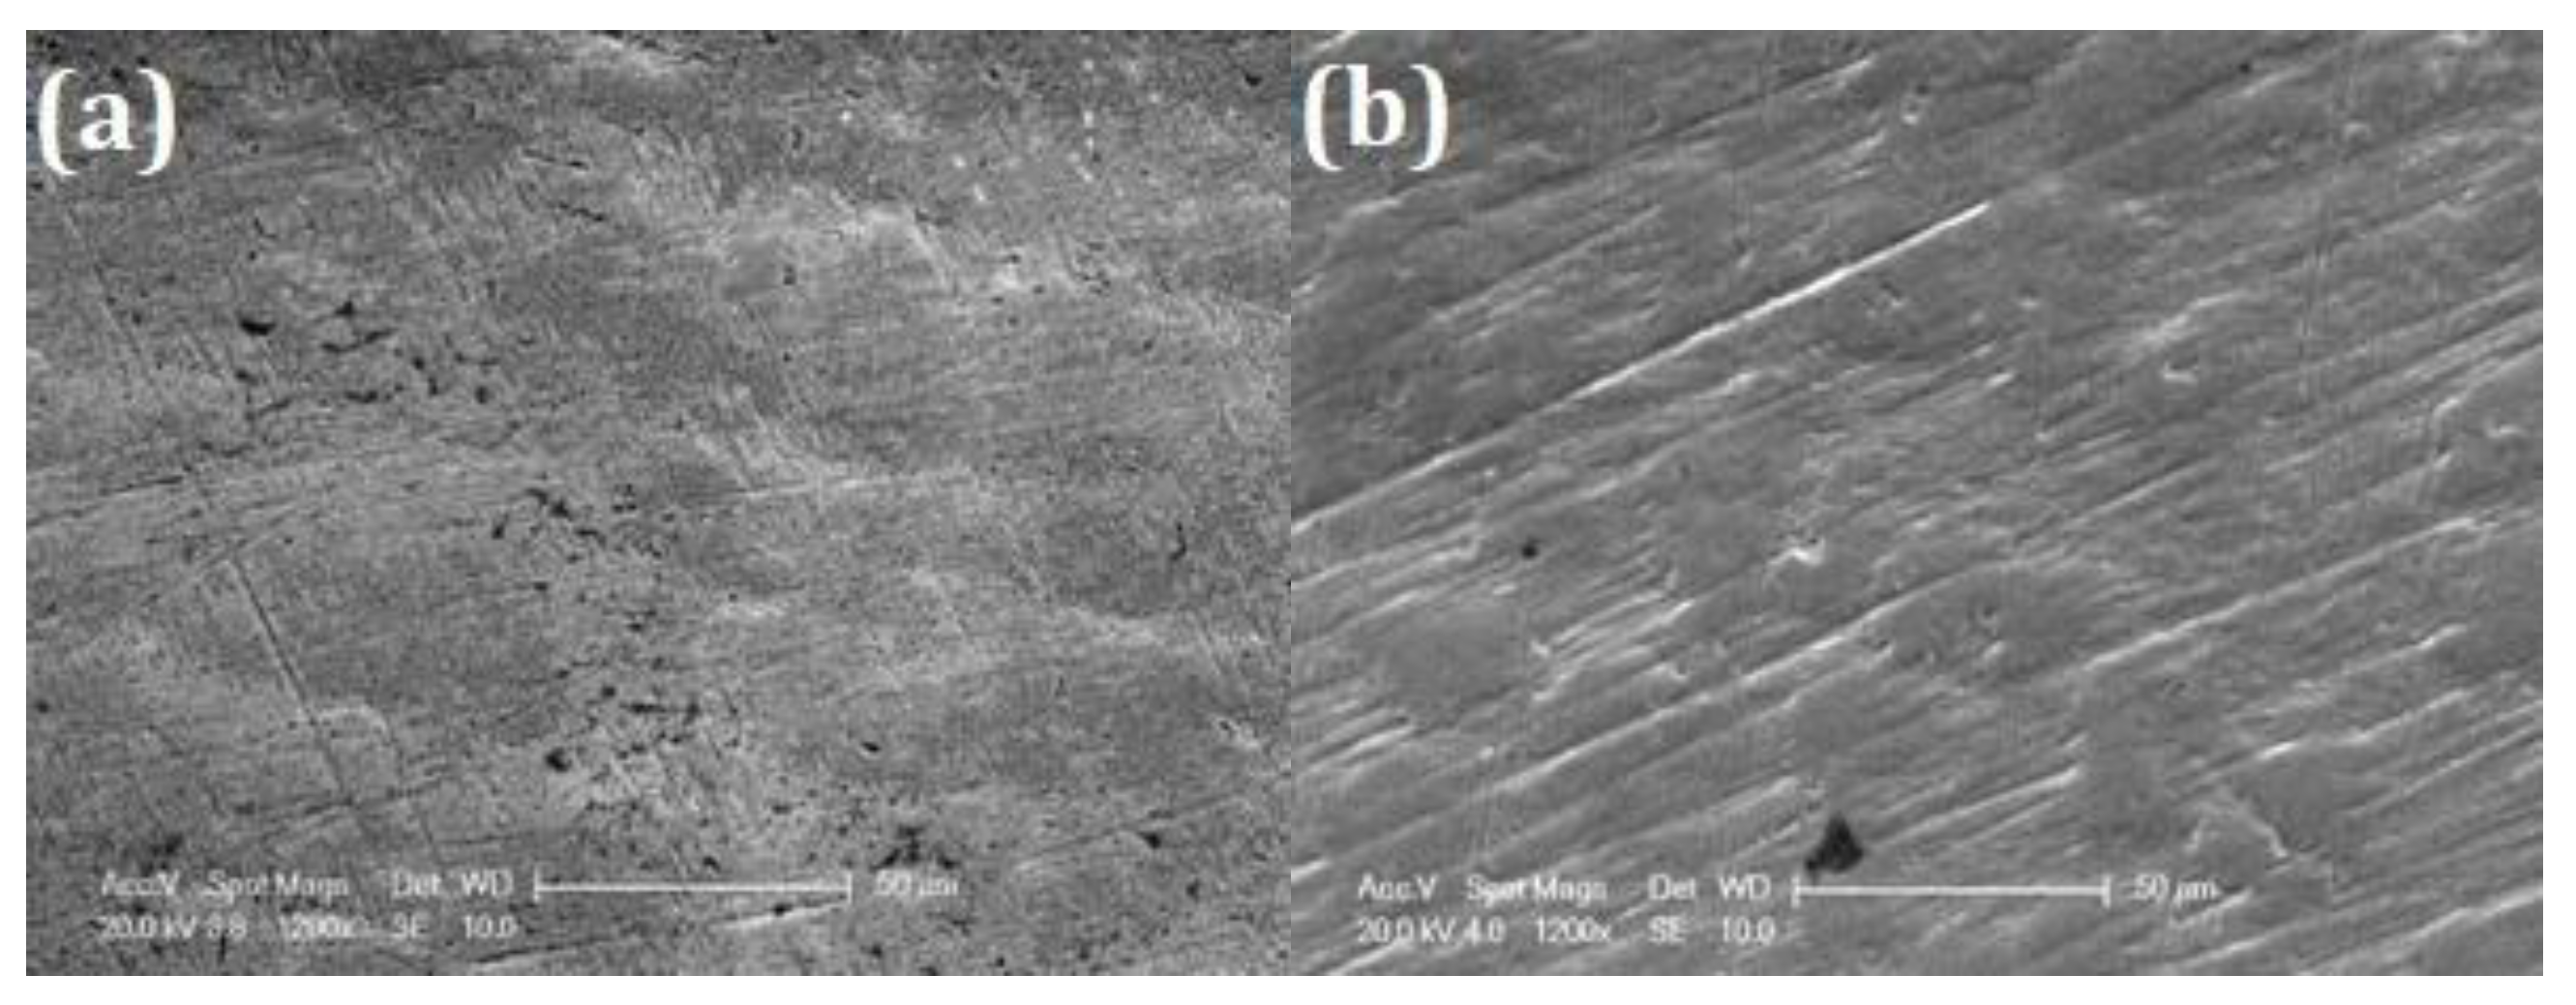

Table 1.
Elemental composition (in wt%) obtained by energy-dispersive X-ray spectroscopy (EDS) for untreated titanium (B), electrochemically oxidized titanium (EO), and thermally treated titanium (TT) samples prior to corrosion testing.
Table 1.
Elemental composition (in wt%) obtained by energy-dispersive X-ray spectroscopy (EDS) for untreated titanium (B), electrochemically oxidized titanium (EO), and thermally treated titanium (TT) samples prior to corrosion testing.
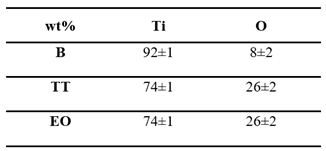 |
Table 2.
Electrochemical parameters obtained from Tafel plots on untreated titanium (B) immersed in Fusayama-Meyer artificial saliva at 37 °C, under different pH conditions (2.5, 6.5, and 9.0).
Table 2.
Electrochemical parameters obtained from Tafel plots on untreated titanium (B) immersed in Fusayama-Meyer artificial saliva at 37 °C, under different pH conditions (2.5, 6.5, and 9.0).
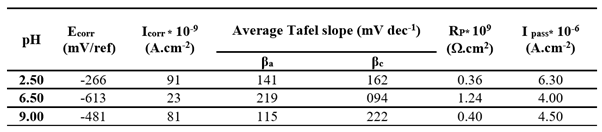 |
Table 3.
Fitting electrochemical parameters determined from Nyquist diagrams (Figure 4) for untreated titanium (B) immersed for 1 hour in Fusayama-Meyer artificial saliva at different pH values (2.5, 6.5, and 9.0), using an equivalent electrical circuit model.
Table 3.
Fitting electrochemical parameters determined from Nyquist diagrams (Figure 4) for untreated titanium (B) immersed for 1 hour in Fusayama-Meyer artificial saliva at different pH values (2.5, 6.5, and 9.0), using an equivalent electrical circuit model.
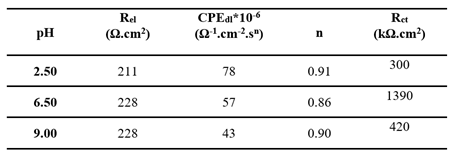 |
Table 4.
Electrochemical parameters obtained from Tafel plots in Figure 5a for Ti electrochemically oxidized (EO) for different durations (20 min, 1 h, 2 h, and 4 h) and tested in Fusayama-Meyer saliva (pH 6.5) at 37 °C.
Table 4.
Electrochemical parameters obtained from Tafel plots in Figure 5a for Ti electrochemically oxidized (EO) for different durations (20 min, 1 h, 2 h, and 4 h) and tested in Fusayama-Meyer saliva (pH 6.5) at 37 °C.
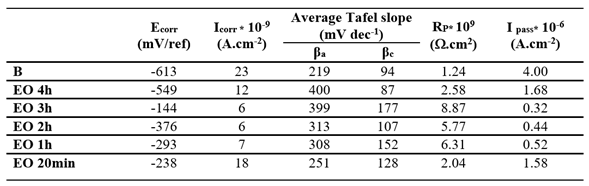 |
Table 5.
Electrochemical parameters obtained from Tafel plots in Figure 5b for Ti thermally treated (TT) at 450 °C for different durations (20 min, 1 h, 2 h, and 4 h) and tested in Fusayama-Meyer saliva (pH 6.5) at 37 °C.
Table 5.
Electrochemical parameters obtained from Tafel plots in Figure 5b for Ti thermally treated (TT) at 450 °C for different durations (20 min, 1 h, 2 h, and 4 h) and tested in Fusayama-Meyer saliva (pH 6.5) at 37 °C.
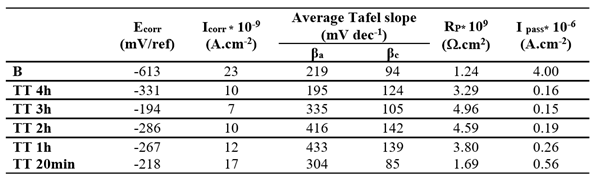 |
Table 6.
Electrochemical impedance spectroscopy (EIS) fitting parameters from Nyquist plots (Figure 6) for EO samples treated for various durations, immersed in Fusayama-Meyer saliva (pH 6.5) at 37 °C. Data fitted using the equivalent circuit shown in Figure 10.
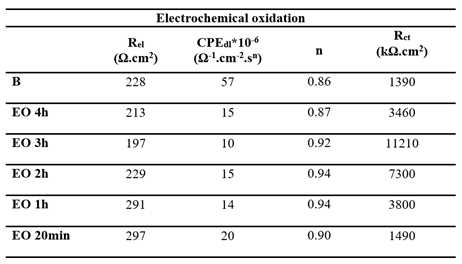 |
Table 7.
EIS fitting parameters from Nyquist plots (Figure 7) for TT samples oxidized at 450 °C for different durations, immersed in Fusayama-Meyer saliva (pH 6.5) at 37 °C. Parameters obtained using the equivalent circuit of Figure 10.
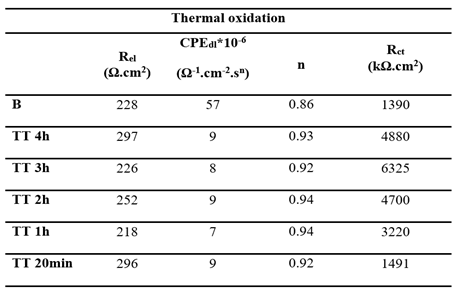 |
Table 8.
Electrochemical parameters obtained from Tafel plots in Figure 8, on untreated titanium (B) exposed to Fusayama-Meyer saliva at 37 °C with increasing fluoride concentrations (1,000, 5,000, and 12,300 ppm).
Table 8.
Electrochemical parameters obtained from Tafel plots in Figure 8, on untreated titanium (B) exposed to Fusayama-Meyer saliva at 37 °C with increasing fluoride concentrations (1,000, 5,000, and 12,300 ppm).
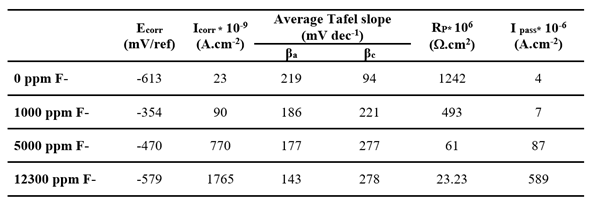 |
Table 9.
EIS fitting parameters derived from Nyquist plots (Figure 9) for untreated titanium (B) immersed for 1 hour in Fusayama-Meyer saliva containing different fluoride concentrations (1,000, 5,000, and 12,300 ppm), modeled using the equivalent circuit in Figure 10.
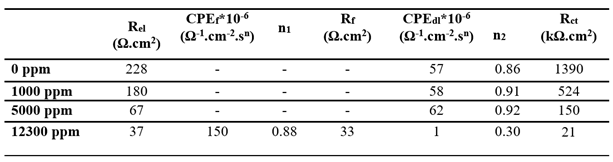 |
Table 10.
Electrochemical parameters obtained from Tafel plots presented in Figure 12 comparing untreated titanium (B), electrochemically oxidized (EO), and thermally treated (TT) samples after 3 hours of treatment, tested in Fusayama-Meyer saliva with 12,300 ppm F⁻ at 37 °C.
Table 10.
Electrochemical parameters obtained from Tafel plots presented in Figure 12 comparing untreated titanium (B), electrochemically oxidized (EO), and thermally treated (TT) samples after 3 hours of treatment, tested in Fusayama-Meyer saliva with 12,300 ppm F⁻ at 37 °C.
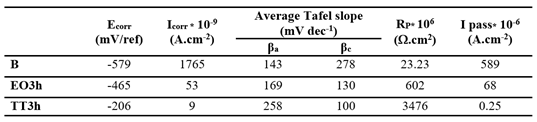 |
Table 11.
EIS fitting parameters from Nyquist plots (Figure 13) for B, EO.3h, and TT.3h samples after corrosion testing in Fusayama-Meyer saliva with 12,300 ppm fluoride at 37 °C, fitted using the two-layer equivalent circuit in Figure 10.
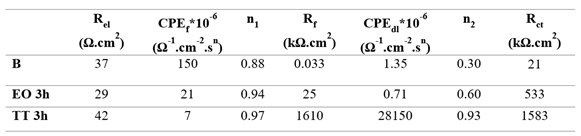 |
Table 12.
EDS elemental composition (in wt%) of the surface oxide layers on EO. and TT. samples both obtained after 3 hours treatment, after immersion in Fusayama-Meyer saliva containing 12,300 ppm fluoride at 37 °C.
Table 12.
EDS elemental composition (in wt%) of the surface oxide layers on EO. and TT. samples both obtained after 3 hours treatment, after immersion in Fusayama-Meyer saliva containing 12,300 ppm fluoride at 37 °C.
 |
Disclaimer/Publisher’s Note: The statements, opinions and data contained in all publications are solely those of the individual author(s) and contributor(s) and not of MDPI and/or the editor(s). MDPI and/or the editor(s) disclaim responsibility for any injury to people or property resulting from any ideas, methods, instructions or products referred to in the content. |
© 2025 by the authors. Licensee MDPI, Basel, Switzerland. This article is an open access article distributed under the terms and conditions of the Creative Commons Attribution (CC BY) license (https://creativecommons.org/licenses/by/4.0/).
Copyright: This open access article is published under a Creative Commons CC BY 4.0 license, which permit the free download, distribution, and reuse, provided that the author and preprint are cited in any reuse.


