Submitted:
20 March 2025
Posted:
20 March 2025
You are already at the latest version
Abstract
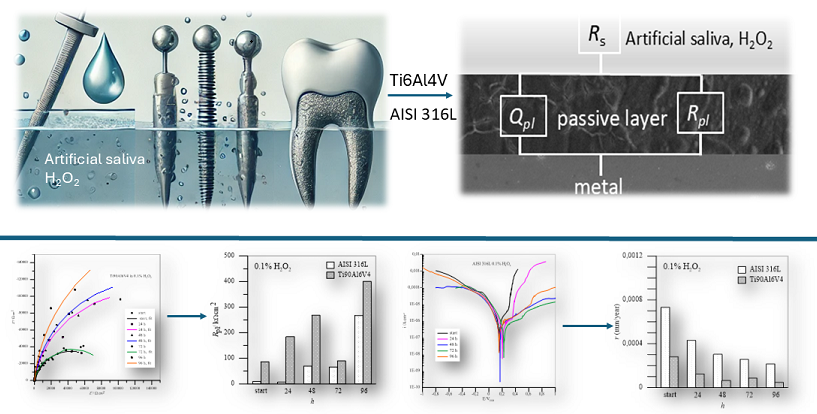
Titanium and its alloys as well as stainless steel are commonly used materials for implants in the human body due to their excellent biocompatibility, corrosion resistance and mechanical properties. However, the long-term performance of these implants in the oral cavity can be affected by the complex oral environment, including the ingestion of food, beverages and oral hygiene products, leading to the presence of various ions, pH fluctuations and inflammatory processes. Investigating the performance of AISI 316L stainless steel and Ti6Al4V alloy, two commonly used dental materials, in conditions that mimic inflammation can provide valuable insights into their suitability and long-term reliability and offer the opportunity to select the material according to the patient's health condition. The samples were exposed to artificial saliva with different concentrations of H2O2 with lactic acid for 24, 48, 72 and 96 hours. The study includes the potentiodynamic method, EIS, SEM and EDS analysis. The determined corrosion rates clearly show that Ti6Al4V has better corrosion properties at lower H2O2 concentrations, which decrease with increasing immersion time due to its excellent passivity ability, while AISI 316L is more corrosion resistant with increasing H2O2 concentration. Both samples also exhibit re-passivation after being exposed to a high concentration of H2O2 for 96 hours.
Keywords:
Corrosion
; EIS
; Inflammatory conditions
; Titanium
; Stainless steel
; dental materials
1. Introduction
Titanium and its alloys, such as Ti6Al4V, are known for their superior biocompatibility and osseointegrative properties, making them a popular choice for dental implants for years [1]. However, the potential release of titanium ions and particles due to corrosion processes can lead to adverse tissue reactions, known as peri-implantitis [2,3,4,5,6]. On the other hand, stainless steel such as AISI 316L used in orthopaedics, dentistry and orthodontics, have demonstrated good corrosion resistance also in the oral environment, but concerns have been raised about the long-term release of metal ions, such as chromium and nickel, and their potential cytotoxicity [7].
Titanium has the amazing ability to form a stable oxide layer of TiO2 with oxygen, which further protects the metal surface from corrosion or greatly slows it down. Most new research is focused on improving titanium and its alloys through various processes that reduce its corrosiveness and increase its biocompatibility in medical applications. The corrosion rate can be reduced by increasing the thickness of the protective layer of TiO2 on the metal surface by various methods, such as: selective laser melting which induces changes in the microstructure of the alloy [8,9], the anodization [10], sol – gel method [11], sputtering and evaporation [12] or thermal oxidation [13]. Electrolytic oxidation [14] and surface modifications which generate a mixed oxide layer resembling the extracellular matrix of two TiO2 layers [15] improve the bone osseointegration. This can also be improved by development of innovative materials such as Ti -Zr [16], Ti – Zr - Mo – Mn [17], Ti – Nb [18], Ti – Zr – Nb [19], Ti – Ag [20], Nb [21], Ti in trabecular form [22] Ta in trabecular form [23,24] and others.
AISI 316L low carbon stainless steel is the most commonly used material for orthodontic brackets and crowns, offering high tensile strength and good corrosion resistance [25]. It shows excellent biocompatibility and has been studied in various simulated body fluids such as artificial saliva, artificial saliva with fluoride ions [26], mouthwash solutions [16], simulated oral environment via extracellular electron transfer and acid metabolites of subgingival microbiota [27], microbiologically influenced corrosion [28], borovine serum [29], lactic and phosphoric acid in artificial saliva [30] or adding some effective plants extracts to mouth hygiene products [31].
AISI 316L steel has excellent biocompatibility properties and forms a protective layer on its surface consisting mainly of Cr oxides, mostly Cr2O3, which prevents and slows down further corrosion [16,25,26]. The oxides of the other elements are low or negligible compared to bulk concentration. The main problem with the AISI 316L alloy is undoubtedly its tendency to pitting corrosion which increases with increasing levels of Cr, Ni and Ti [16,26]. Further problems can arise from bacterial infections, which is why several studies are being carried out on the addition of copper or silver to AISI 316L [32,33,34,35]. Microbiologically induced intergranular corrosion and localized pitting of AISI 316L stainless steel dental material can also be accompanied by the evolution of volatile sulphur compounds within this anaerobic culture [28].
Scientific studies on dental materials are often conducted in model solutions containing fluoride ions, which are present in oral hygiene products, or in sodium chloride (NaCl) [36,37,38,39,40,41] solutions that simulate exposure to salt, which contains highly corrosive chloride ions. However, within the oral cavity, inflammation of the surrounding tissues frequently occurs, significantly influencing the corrosion behaviour of dental alloys. To address these factors, this study aims to compare the corrosion behaviour of AISI 316L stainless steel and Ti6Al4V dental materials, as well as other dental accessories, in artificial saliva under simulated inflammatory conditions. Inflammation related conditions are mimicked using hydrogen peroxide (H₂O₂) and lactic acid. Namely, during inflammation resulting from abscesses or some surgical trauma, hydrogen peroxide is released by both bacteria and leucocytes [23,30,42,43,44,45], which can act as a driving force for the enhanced dissolution and regrowth of the passive layer on the metal surface.
The study will employ various scientific techniques, including electrochemical impedance spectroscopy, scanning electron microscopy, and potentiodynamic electrochemical measurements, to evaluate the corrosion resistance and corrosion rate of both materials.
The findings of this research will contribute to the understanding of the long-term performance and suitability of these dental implant materials in the challenging oral environment, ultimately aiding in the selection of the most appropriate material for dental implant applications.
2. Materials and Methods
The samples AISI 316L (mass %: C ≤ 0.03; Mn ≤ 2.00; P ≤ 0.045; S ≤ 0.03; Si ≤ 0.75; Cr 16 – 18; Ni 10 – 14; Mo 2.00 – 3.00; N ≤ 0.10; Fe balanced; Goodfellow, Cambridge Ltd., UK) and Ti6Al4V (mass %: Ti 90; Al 6; V 4; C < 0.10; O < 0.20; N < 0.50; H < 0.0125; Fe < 0.3; Goodfellow, Cambridge Ltd., UK) with a diameter of 10 mm and a thickness of 3 mm, were cut into shape of discs. Mechanical polishing was carried out using abrasive papers from 400 to 1200, followed by a treatment with diamond pastes to achieve a mirror-like quality. Once the samples were well ground and polished, they were degreased in ethanol and cleaned in an ultrasonic bath for 10 minutes. Finally, the samples were dried with compressed air and weighed.
To the modified Fusuyama’s artificial saliva (KCL - 0.4 g/L, NaCl – 0.4g /L; CaCl₂H₂O - 0,906 g/L Na₂H₂PO₄ x 2H₂O - 0,96 g/L, Urea – 1 g/L) 0,1 % H2O2, 5.0 % H2O2 and 10.0 % H2O2 were added, respectively. Lactic acid was added to all solutions to achieve a pH value of 4.5, which corresponds to the pH value of dental plaque in the oral cavity. The measurements were performed after 24, 48, 72 and 96 hours after passivation of the samples at 37°C.
The electrochemical measurements were carried out in a standard three-electrode cell with the sample as the working electrode, platinum as the counter electrode and the reference SCE. The cell was thermostated at 37°C and filled with 300 mL of the prepared solution. The measurements were carried out using a Solartron 1287 electrochemical interface and a Solartron 1250 frequency response analyser. The impedance curves were recorded at the OCP in the frequency range from 60 kHz to 1 mHz. The amplitude of the excitation voltage was set to 10 mV. EIS measurements were performed 20 minutes after polarization, and data were acquired and processed using ZPlot and ZView, developed by Scribner Associates, Inc. [46].
Potentiodynamic curves were plotted within the potential range of -0.6 V to 1.0 V vs. SCE at a sampling rate of 1 mVs-1. Data was recorded using CorrWare and processed using CorrView software, both developed by Scribner Associates, Inc. [46].
The surface morphology of the passive layers was analysed with a Scanning Electron Microscope (Sirion 400 NC) and the microchemical analysis was performed with the EDS (Energy Dispersive Spectroscopy) INCA 350 for each sample.
3. Results and Discussion
3.1. Surface Analysis
After the samples had been thermostated in pure artificial saliva and artificial saliva with different concentrations of H2O2, they were passivated, i.e. coated with a protective layer that further reduces corrosion processes. The morphology of the passive layers and the composition of their elements were analysed using scanning electron microscopy (SEM) and EDS. Figure 1 and Figure 3 show the morphology of the treated samples in the same order of magnitude, while Figure 2 and Figure 4 show the EDS results.
The surface of the AISI 316L appears smooth with some dark spots identified as Cr, Ni, O and Fe by the EDS method, but the largest spot had an increased carbon content, which could indicate pitting corrosion with carbide formation. After the steel was immersed in H2O2, the surface changed slightly. The highest percentage of oxygen is 26.08 wt.% and chromium 29.95 wt.% at the selected test site indicating passive layer of chromium oxide.
While the lamellar microstructure of the Ti6Al4V surface can be clearly recognized in Figure 3 (a), the phases α (dark grains) and β (bright contrast – on black scattered electron images) can be clearly distinguished on the surface after passivation in 10% H2O2, as has also been reported by other authors [4,14,21,47]. The phase β is located at α grain boundaries and triple junctions. At start in pure artificial saliva only the high content of titanium is detected by the EDS method: 90.03 wt.%, and the rest vanadium and aluminum, (Figure 4 (a)). After 96 hours of immersion in 10% H2O2, a high oxygen content was found in the dark grains: 35.55 wt.%, 56.54 wt.% of titanium and the remainder vanadium and aluminium (Figure 4 (b)) indicating the formation of TiO2, while the β phase (bright lines) contains more titanium – 75.35 wt.% and has lower aluminum/vanadium ratio: 4.37/2.77 wt.%.
3.2. Potentiodynamic Measurements
The anodic polarisation curves of AISI 316L are shown in Figure 5, and the parameter values from curves are listed in Table 1. The samples were immersed in pure artificial saliva and in artificial saliva with H2O2 at different concentrations: 0.1, 5.0 and 10.0 %. All samples showed immediate passivation. At 0.1% H2O2, the corrosion potentials are slightly shifted in the positive direction. The corrosion current decreases with the time the samples are immersed in the medium, which means that the passivity becomes more efficient with time. If the concentration of H2O2 is increased to 5.0%, the potential values shift towards positive values and the corrosion currents are also reduced. This indicates that the increased concentration in this case further accelerates the passivation of AISI 316L.
At a concentration of 10.0% H2O2, the potential values do not change significantly, but the corrosion currents increase considerably, so that passivation is less effective. At both concentrations, 5.0 and 10.0% H2O2, a peak value of the corrosion current is observed after 72 hours of immersion, which means that the material corrodes the most during this time, but the corrosion current decreases again after 96 hours, indicating a repassivation process.
Potentiodynamic curves for Ti6Al4V presented in Figure 6 showed that in the anodic region no well-defined Tafel slopes were observed, suggesting that the samples exhibit passive behaviour. In such a case, the corrosion rate is defined by the passive current density [44]. The passivation current densities were determined from the plateau areas of the anodic curves shown in Figure 6 and are listed in Table 2.
At a concentration of 0.1 % H2O2, the corrosion currents are quite low, especially compared to AISI 316L, and the potentials move in positive directions with the immersion time. The highest corrosion current is observed at the beginning and the lowest after 96 hours of immersion, indicating excellent passivation that improves with time. However, already when the concentration of H2O2 is increased to 5.0%, the picture with regard to AISI 316L changes drastically. The corrosion currents are higher in all cases and the potential values do not move towards higher positive values. Again, the corrosion current is highest at the beginning and after 72 hours of immersion, but decreases after 96 hours, indicating the good possibility of repassivation. When the concentration of H2O2 increases to 10.0%, the corrosion currents increase significantly and are consistently above the values for AISI 316L. The maximum value is again reached after 72 hours of immersion, but with a possibility of repassivation if the immersion time is at least 96 hours.
3.2. EIS Measurements
The fitting procedure was carried out using equivalent circuits known as the modified Randle’s circuit with RC elements in series with the solution resistance. Rs and Rpl stand for electrolyte (solution) resistance and the resistance of the oxide layer, respectively. Element C represents the capacitance that exists at the interface between an electrode and the surrounding electrolyte. Instead of C, the element CPE is usually used for capacitance calculation in connection with the passive layer which describes the non - ideal behaviour of the capacitor. It provides better agreement between experimental and theoretical data, especially when the experimentally obtained impedance curves are not ideal semi - circles, which is a criterion for the inhomogeneity and irregularities of corrosive systems. The impedance of a constant phase element is defined as [48,49,50]:
where Q is the frequency - dependent element (constant phase element, CPE) and is a combination of properties related to both the surface area and the electroactive species. The exponent n is related to the slope of log Z versus log f in the Bode diagram, i.e. to the phase angle θ by the relation n = 2θ / π; j = (-1)0.5. ω is the angular frequency. For n = 1, the Q is reduced to a capacitor with capacitance C and for n = 0 to a pure resistor. n = 0.5 gives the Warburg impedance that occurs when a charge carrier diffuses through a material. The parameter Q (sn Ω-1cm-2) can be converted into capacitance C (F cm-2) when n < 1, which is particularly important when using experimental data to quantify system parameters such as thickness or dielectric constant.
ZCPE = [Q (jω)n]-1
The equivalent circuit for the simple passivation system shown in Figure 7 was used for fitting the data.
Figure 8 shows impedance data for AISI 316L. The Nyquist curves are typical for high impedance systems that do not reach a low frequency limit and have only a partial semicircle, indicating an excellent passivation process. The parameter values from curves are summarized in Table 3.
Figure 8 (a) clearly shows that the resistances of the resulting passive layers increase with the passivation time and reach a maximum value after 96 hours of immersion in 0.1% H2O2, which represents the best passivation in this case. In the case of 5.0 % H2O2, the Rpl still increase after 24 hours of immersion, but decrease after 48 and even more after 72 hours of immersion. After 96 hours, there is a visible increase in the resistance of the protective layer, which represents a repassivation in which there is an obvious increase in the deposition of corrosion products that further protects the metal surface. After increasing the H2O2 concentration to 10.0%, all Rpl values decreased, with good passivation observed after 24 hours of immersion and slight repassivation again after 96 hours.
The impedance spectra for Ti6Al4V are shown in Figure 9 and the calculated values of the parameters from the curves are collected in Table 4. In these cases, the Nyquist curves are also typical of passive systems in which only part of a semicircle is visible.
As with AISI 316L, the resistance of the passive layer of Ti6Al4V in 0.1% H2O2, which represents a deposit of compact TiO2, also increases with the immersion time, with the lowest value being reached after 72 hours of passivation and the highest after 96 hours - the repassivation of the protective layer can also be confirmed here. When the concentrations of immersion media increase to 5.0 and 10.0% H2O2, the resistances of the passive layers drop drastically and offer little corrosion protection, but in both cases, there is a minimal possibility of repassivation after 96 hours.
For a better comparison between AISI 316L and Ti6Al4, the data of the Rpl of the passive layers as a function of the exposure time for different H2O2 concentrations are summarized in Figure 10.
3.5. Corrosion Rate
The resistances Rpl agree well with the calculated corrosion rates shown in Figure 11, which shows the corrosion rate between the two tested materials. The corrosion rates were calculated from the potentiodynamic curves at different time intervals based on the Tafel extrapolation from the polarization curves representing the logarithmic current density as a function of overpotential η, [51]. Firstly, Tafel constants and corrosion current density, icorr, are determinated and then corrosion rate, rcorr, is calculated from the equation via Faraday’s law in terms of penetration rate (mm/year) [52]. The results are summarized in Table 4.

Table 4.
Corrosion rates in mm/year for Ti6Al4V and AISI 316L at different H2O2 concentrations with and time of immersion.
Table 4.
Corrosion rates in mm/year for Ti6Al4V and AISI 316L at different H2O2 concentrations with and time of immersion.
| r (mm/year) | ||||||
|---|---|---|---|---|---|---|
| 0.1% H2O2 | 5.0% H2O2 | 10.0% H2O2 | ||||
| h | Ti6Al4V | AISI 316L | Ti6Al4V | AISI 316L | Ti6Al4V | AISI 316L |
| 0 | 2.82⋅ 10-3 | 7.23⋅ 10-3 | 6.23⋅ 10-3 | 4.74⋅ 10-3 | 11.10⋅ 10-3 | 4.82⋅ 10-3 |
| 24 | 1.25⋅ 10-3 | 4.30⋅ 10-3 | 3.12⋅ 10-3 | 1.54⋅ 10-3 | 3.69⋅ 10-3 | 2.02⋅ 10-3 |
| 48 | 0.65⋅ 10-3 | 3.04⋅ 10-3 | 4.32⋅ 10-3 | 1.76⋅ 10-3 | 11.12⋅ 10-3 | 2.14⋅ 10-3 |
| 72 | 2.78⋅ 10-3 | 2.57⋅ 10-3 | 5.41⋅ 10-3 | 4.69⋅ 10-3 | 12.05⋅ 10-3 | 9.01⋅ 10-3 |
| 96 | 0.49⋅ 10-3 | 2.17⋅ 10-3 | 2.91⋅ 10-3 | 1.57⋅ 10-3 | 3.08⋅ 10-3 | 2.52⋅ 10-3 |
When the concentration of the aggressive medium is low (0.1 % H2O2), the corrosion rates are also low overall. The corrosion rate of Ti6Al4V is significantly lower than that of AISI 316L and decreases with the passivation time, with the lowest value being reached after 96 hours of exposure to the medium. This all points to the extremely good protective function of the passivation layer made of TiO2 which becomes increasingly compact over time and effectively protective against further corrosion.
At higher concentrations of H2O2, the picture changes considerably: Ti6Al4V is initially slightly better protective than AISI 316L, but as the immersion time increases, its performance is reduced. It is assumed that the chromium forms insoluble Cr2O3, creating a continuous network of Cr–O–Cr–O that prevents the dissolution of iron [26]. At 5.0 % H2O2, Ti6Al4V is the least protected after 72 hours, but after 96 hours a sufficient protective layer has apparently been deposited on the surface to reduce the further corrosion rate. It can also be assumed that at shorter time intervals the formation of sub-oxides TiO and Ti2O3 takes place [39], which after 72 hours completely transform into TiO2, which forms a high protective layer on the surface, so that the corrosion resistance increases after 96 hours of passivation. In artificial saliva with 10.0% H2O2, Ti6Al4V reaches its maximum corrosion rate at the first moment of immersion in the medium, then passivates relatively well, but the corrosion rate increases again after 48 - 72 hours. The corrosion rates of stainless steel in artificial saliva with 5.0% H2O2 indicate such passivation, which provides better protection of the material’s surface, and a relatively low corrosion rate compared to Ti6Al4V. The corrosion rates of AISI 316L increased sharply in artificial saliva with 10.0% H2O2 and became highest after 72 hours of immersion but decreased significantly again after 96 hours.
4. Conclusions
The measured values and the consistent results with potentiodynamic and EIS methods clearly indicate good passivation of both test materials, with a protective layer of TiO2 being applied to Ti6Al4V and chromium oxides to AISI 316L. At low concentrations of H2O2, which corresponds to the mild inflammatory conditions in the oral cavity, Ti6Al4V performs better, as its corrosion rates in this case are very low, between 0.003 and 0.0005, while these values for AISI 316L are between 0.007 and 0.002 mm/year in term of penetration. Interestingly, the situation changes at higher H2O2 concentrations, presenting an extensive inflammation: as expected, all corrosion rates increase and the resistance of the protective layers decreases accordingly, but AISI 316L reacts surprisingly better than the titanium alloy. On average, corrosion rate is about 30% lower than the corrosion rate for Ti6Al4V in 5.0% H2O2 and almost 50% lower in the case of 10.0% H2O2. The problem that arises here is the tendency of AISI 316L to pitting corrosion. What both alloys have in common is that they exhibit the worst passivation after 72 hours, which also means that most corrosion products are brought to the surface, while after 96 hours these products are obviously deposited on the surface and thus abruptly reduce the corrosion rate or contribute to the repassivation of the protective layer.
In the light of this study, it is therefore important to decide which material should be used in patients who may be more susceptible to oral inflammation.
Funding
Financial support from the Slovenian Research and Innovation Agency (ARIS) for the program P2-0006: “Physico - Chemical Processes on the Surface Layers and Application of Nanoparticles”, is hereby gratefully acknowledged.
Acknowledgments
The author would like to thank dr. Maša Hren for some laboratory work and prof. dr. Franc Zupanič for the SEM images, both from the University of Maribor, Faculty of Mechanical Engineering.
Conflicts of Interest
The author has no conflict of interest relevant to this article.
References
- Das, R.; Bhattacharjee, C. 16 - Titanium-based nanocomposite materials for dental implant systems. In Applications of Nanocomposite Materials in Dentistry, Asiri, A.M., Inamuddin, Mohammad, A., Eds. Woodhead Publishing: 2019; pp. 271-284. [CrossRef]
- Alhamad, M.; Barão, V.A.R.; Sukotjo, C.; Cooper, L.F.; Mathew, M.T. Ti-Ions and/or Particles in Saliva Potentially Aggravate Dental Implant Corrosion. Materials 2021, 14, 5733. [CrossRef]
- Delgado-Ruiz, R.; Romanos, G. Potential Causes of Titanium Particle and Ion Release in Implant Dentistry: A Systematic Review. International Journal of Molecular Sciences, 2018; Vol. 19. [CrossRef]
- Leban, M.B.; Kosec, T.; Finšgar, M. Corrosion characterization and ion release in SLM-manufactured and wrought Ti6Al4V alloy in an oral environment. Corrosion Science 2022, 209, 110716. [CrossRef]
- Sgolastra, F.; Petrucci, A.; Severino, M.; Gatto, R.; Monaco, A. Periodontitis, implant loss and peri-implantitis. A meta-analysis. Clin Oral Implants Res 2015, 26, e8-e16. [CrossRef]
- Li, Y.; Wong, C.; Xiong, J.; Hodgson, P.; Wen, C. Cytotoxicity of Titanium and Titanium Alloying Elements. Journal of Dental Research 2010, 89, 493-497. [CrossRef]
- Ren, Y.; Yang, K.; Zhang, B. In vitro study of platelet adhesion on medical nickel-free stainless steel surface. Materials Letters 2005, 59, 1785-1789. [CrossRef]
- Hamza, H.M.; Deen, K.M.; Haider, W. Microstructural examination and corrosion behavior of selective laser melted and conventionally manufactured Ti6Al4V for dental applications. Materials Science and Engineering: C 2020, 113, 110980. [CrossRef]
- Nguyen, A.-N.; Kung, K.-C.; Chen, K.-C.; Hsu, C.-W.; Huang, C.-L.; Lee, T.-M. Characteristics and biological responses of selective laser melted Ti6Al4V modified by micro-arc oxidation. Journal of Dental Sciences 2024, 19, 1426-1433. [CrossRef]
- Jáquez-Muñoz, J.M.; Gaona-Tiburcio, C.; Méndez-Ramírez, C.T.; Baltazar-Zamora, M.Á.; Estupinán-López, F.; Bautista-Margulis, R.G.; Cuevas-Rodríguez, J.; Flores-De los Rios, J.P.; Almeraya-Calderón, F. Corrosion of Titanium Alloys Anodized Using Electrochemical Techniques. Metals 2023; Vol. 13. [CrossRef]
- Alam, M.J.; Cameron, D.C. Preparation and Characterization of TiO2 Thin Films by Sol-Gel Method. Journal of Sol-Gel Science and Technology 2002, 25, 137-145. [CrossRef]
- Löbl, P.; Huppertz, M.; Mergel, D. Nucleation and growth in TiO2 films prepared by sputtering and evaporation. Thin Solid Films 1994, 251, 72-79. [CrossRef]
- Diamanti, M.V.; Codeluppi, S.; Cordioli, A.; Pedeferri, M.P. Effect of thermal oxidation on titanium oxides’ characteristics. Journal of Experimental Nanoscience 2009, 4, 365-372. [CrossRef]
- Garcia-Cabezón, C.; Rodriguez-Mendez, M.L.; Amigo Borrás, V.; Raquel, B.; Rodriguez Cabello, J.C.; Ibañez Fonseca, A.; Martin-Pedrosa, F. Application of Plasma Electrolytic Oxidation Coating on Powder Metallurgy Ti-6Al-4V for Dental Implants. Metals 2020; Vol. 10. [CrossRef]
- Sun, Y.-S.; Huang, H.-H.; Tsai, Y.-H.; Kuo, Y.-L.; Lee, J.-W.; Lee, Y.-J.; Linn, T.Y.; Chen, P. Creating an extracellular matrix-like three-dimension structure to enhance the corrosion resistance and biological responses of titanium implants. Journal of Dental Sciences 2024, 19, S70-S80. [CrossRef]
- Porcayo-Calderon, J.; Casales-Diaz, M.; Salinas-Bravo, V.M.; Martinez-Gomez, L. Corrosion Performance of Fe-Cr-Ni Alloys in Artificial Saliva and Mouthwash Solution. Bioinorg Chem Appl 2015, 2015, 930802. [CrossRef]
- Liu, H.; Yang, J.; Zhao, X.; Sheng, Y.; Li, W.; Chang, C.-L.; Zhang, Q.; Yu, Z.; Wang, X. Microstructure, mechanical properties and corrosion behaviors of biomedical Ti-Zr-Mo-xMn alloys for dental application. Corrosion Science 2019, 161, 108195. [CrossRef]
- Fojt, J.; Joska, L.; Malek, J.; Sefl, V. Corrosion behavior of Ti–39Nb alloy for dentistry. Materials Science and Engineering: C 2015, 56, 532-537. [CrossRef]
- Cordeiro, J.M.; Beline, T.; Ribeiro, A.L.R.; Rangel, E.C.; da Cruz, N.C.; Landers, R.; Faverani, L.P.; Vaz, L.G.; Fais, L.M.G.; Vicente, F.B.; et al. Development of binary and ternary titanium alloys for dental implants. Dental Materials 2017, 33, 1244-1257. [CrossRef]
- Zhang, B.B.; Wang, B.L.; Li, L.; Zheng, Y.F. Corrosion behavior of Ti–5Ag alloy with and without thermal oxidation in artificial saliva solution. Dental Materials 2011, 27, 214-220. [CrossRef]
- Prestat, M.; Vucko, F.; Holzer, L.; Thierry, D. Microstructural aspects of Ti6Al4V degradation in H2O2-containing phosphate buffered saline. Corrosion Science 2021, 190, 109640. [CrossRef]
- Torres Pérez, A.I.; Fernández Fairén, M.; Torres Pérez, Á.A.; Gil Mur, J. Use of Porous Titanium Trabecular as a Bone Defect Regenerator: In Vivo Study. Metals 2022; Vol. 12. [CrossRef]
- Eid, Y. The myths of trabecular metal: ‘the next best thing to bone’. The Egyptian Orthopaedic Journal 2013, 48. [CrossRef]
- Balla, V.K.; Bodhak, S.; Bose, S.; Bandyopadhyay, A. Porous tantalum structures for bone implants: Fabrication, mechanical and in vitro biological properties. Acta Biomaterialia 2010, 6, 3349-3359. [CrossRef]
- Milošev, I.; Strehblow, H.-H. The behavior of stainless steels in physiological solution containing complexing agent studied by X-ray photoelectron spectroscopy. Journal of Biomedical Materials Research 2000, 52, 404-412. [CrossRef]
- Kocijan, A.; Merl, D.K.; Jenko, M. The corrosion behaviour of austenitic and duplex stainless steels in artificial saliva with the addition of fluoride. Corrosion Science 2011, 53, 776-783. [CrossRef]
- Zheng, Y.; Yang, Y.; Liu, X.; Liu, P.; Li, X.; Zhang, M.; Zhou, E.; Zhao, Z.; Wang, X.; Zhang, Y.; et al. Accelerated corrosion of 316L stainless steel in a simulated oral environment via extracellular electron transfer and acid metabolites of subgingival microbiota. Bioactive Materials 2024, 35, 56-66. [CrossRef]
- Eduok, U. Microbiologically induced intergranular corrosion of 316L stainless steel dental material in saliva. Materials Chemistry and Physics 2024, 313, 128799. [CrossRef]
- Burstein, G.T.; Liu, C. Nucleation of corrosion pits in Ringer’s solution containing bovine serum. Corrosion Science 2007, 49, 4296-4306. [CrossRef]
- Lima, A.R.; Pinto, A.M.P.; Toptan, F.; Alves, A.C. Impact of simulated inflammation and food breakdown on the synergistic interaction between corrosion and wear on titanium. Corrosion Science 2024, 228, 111839. [CrossRef]
- Sheit, H.M.K.; Mohan, K.S.; Srinivasan, P.; Muthu, S.E.; Dinesh, A.; Rajeswari, B.; Priya, L.S.; Gnanasekaran, L.; Iqbal, M. Anti-corrosive efficiency of salvadora persica plant stick powder on SS 316L orthodontic wire in artificial saliva. Results in Chemistry 2024, 12, 101894. [CrossRef]
- Seo, B.; Kanematsu, H.; Nakamoto, M.; Miyabayashi, Y.; Suzuki, M.; Tanaka, T. Corrosion and antibacterial performance of 316L stainless steel with copper patterns by super-spread wetting of liquid copper. Surface and Coatings Technology 2023, 462, 129496. [CrossRef]
- Echeverrigaray, F.G.; Echeverrigaray, S.; Delamare, A.P.L.; Wanke, C.H.; Figueroa, C.A.; Baumvol, I.J.R.; Aguzzoli, C. Antibacterial properties obtained by low-energy silver implantation in stainless steel surfaces. Surface and Coatings Technology 2016, 307, 345-351. [CrossRef]
- Wang, X.; Ye, X.; Zhang, L.; Shao, Y.; Zhou, X.; Lu, M.; Chu, C.; Xue, F.; Bai, J. Corrosion and antimicrobial behavior of stainless steel prepared by one-step electrodeposition of silver at the grain boundaries. Surface and Coatings Technology 2022, 439, 128428. [CrossRef]
- Xi, T.; Shahzad, M.B.; Xu, D.; Sun, Z.; Zhao, J.; Yang, C.; Qi, M.; Yang, K. Effect of copper addition on mechanical properties, corrosion resistance and antibacterial property of 316L stainless steel. Materials Science and Engineering: C 2017, 71, 1079-1085. [CrossRef]
- Lv, J.; Liang, T. Improved corrosion resistance of 316L stainless steel by nanocrystalline and electrochemical nitridation in artificial saliva solution. Applied Surface Science 2015, 359, 158-165. [CrossRef]
- Nakagawa, M.; Matsuya, S.; Shiraishi, T.; Ohta, M. Effect of Fluoride Concentration and pH on Corrosion Behavior of Titanium for Dental Use. Journal of Dental Research 1999, 78, 1568-1572. [CrossRef]
- Zhang, H.; Man, C.; Dong, C.; Wang, L.; Li, W.; Kong, D.; Wang, L.; Wang, X. The corrosion behavior of Ti6Al4V fabricated by selective laser melting in the artificial saliva with different fluoride concentrations and pH values. Corrosion Science 2021, 179, 109097. [CrossRef]
- Milošev, I.; Kapun, B.; Šelih, V.S. The effect of fluoride ions on the corrosion behaviour of Ti metal, and Ti6-Al-7Nb and Ti-6Al-4V alloys in artificial saliva. Acta chimica Slovenica 2013, 60 3, 543-555.
- Souza, J.C.M.; Barbosa, S.L.; Ariza, E.; Celis, J.P.; Rocha, L.A. Simultaneous degradation by corrosion and wear of titanium in artificial saliva containing fluorides. Wear 2012, 292-293, 82-88. [CrossRef]
- Turkina, A.Y.; Makeeva, I.M.; Dubinin, O.N.; Bondareva, J.V.; Chernodoubov, D.A.; Shibalova, A.A.; Arzukanyan, A.V.; Antoshin, A.A.; Timashev, P.S.; Evlashin, S.A. The Impact of Commercially Available Dry Mouth Products on the Corrosion Resistance of Common Dental Alloys. Materials 2023, 16, 4195. [CrossRef]
- Fonseca-García, A.; Pérez-Alvarez, J.; Barrera, C.C.; Medina, J.C.; Almaguer-Flores, A.; Sánchez, R.B.; Rodil, S.E. The effect of simulated inflammatory conditions on the surface properties of titanium and stainless steel and their importance as biomaterials. Materials Science and Engineering: C 2016, 66, 119-129. [CrossRef]
- Mabilleau, G.; Bourdon, S.; Joly-Guillou, M.L.; Filmon, R.; Baslé, M.F.; Chappard, D. Influence of fluoride, hydrogen peroxide and lactic acid on the corrosion resistance of commercially pure titanium. Acta Biomaterialia 2006, 2, 121-129. [CrossRef]
- Handzlik, P.; Fitzner, K. Corrosion resistance of Ti and Ti–Pd alloy in phosphate buffered saline solutions with and without H2O2 addition. Transactions of Nonferrous Metals Society of China 2013, 23, 866-875. [CrossRef]
- Freeman, B.A.; Crapo, J.D. Biology of disease: free radicals and tissue injury. Lab Invest 1982, 47, 412-426.
- ZView, ZPlot, CorrView, CorrWare, version 2.8. Scribner Associates, Inc, Southern Pines, NCD, USA 1990-1999.
- Motyka, M. Martensite Formation and Decomposition during Traditional and AM Processing of Two-Phase Titanium Alloys—An Overview. In Metals, 2021; Vol. 11. [CrossRef]
- Boukamp, B.A. Equivalent Circuit Users Manual, Report CT88/265/128. University of Twente, Department of Chemical Technology, The Netherlands 1989.
- Impedance spectroscopy: emphasizing solid materials and systems. Macdonald, J.R., Ed. Wiley: New York, 1987.
- Liao, H.; Watson, W.; Dizon, A.; Tribollet, B.; Vivier, V.; Orazem, M.E. Physical properties obtained from measurement model analysis of impedance measurements. Electrochimica Acta 2020, 354, 136747. [CrossRef]
- Corrosion: Third Edition. Shreir, L.L., Jarman, R.A., Burstein, G.T., Eds. 1994; Vol. 1, pp 1-2815.
- ASTM G102.
Figure 1.
SEM images for AISI 316L a) Artificial Saliva, b) Artificial saliva with 10% H2O2 both after 96 h of immersion.
Figure 1.
SEM images for AISI 316L a) Artificial Saliva, b) Artificial saliva with 10% H2O2 both after 96 h of immersion.
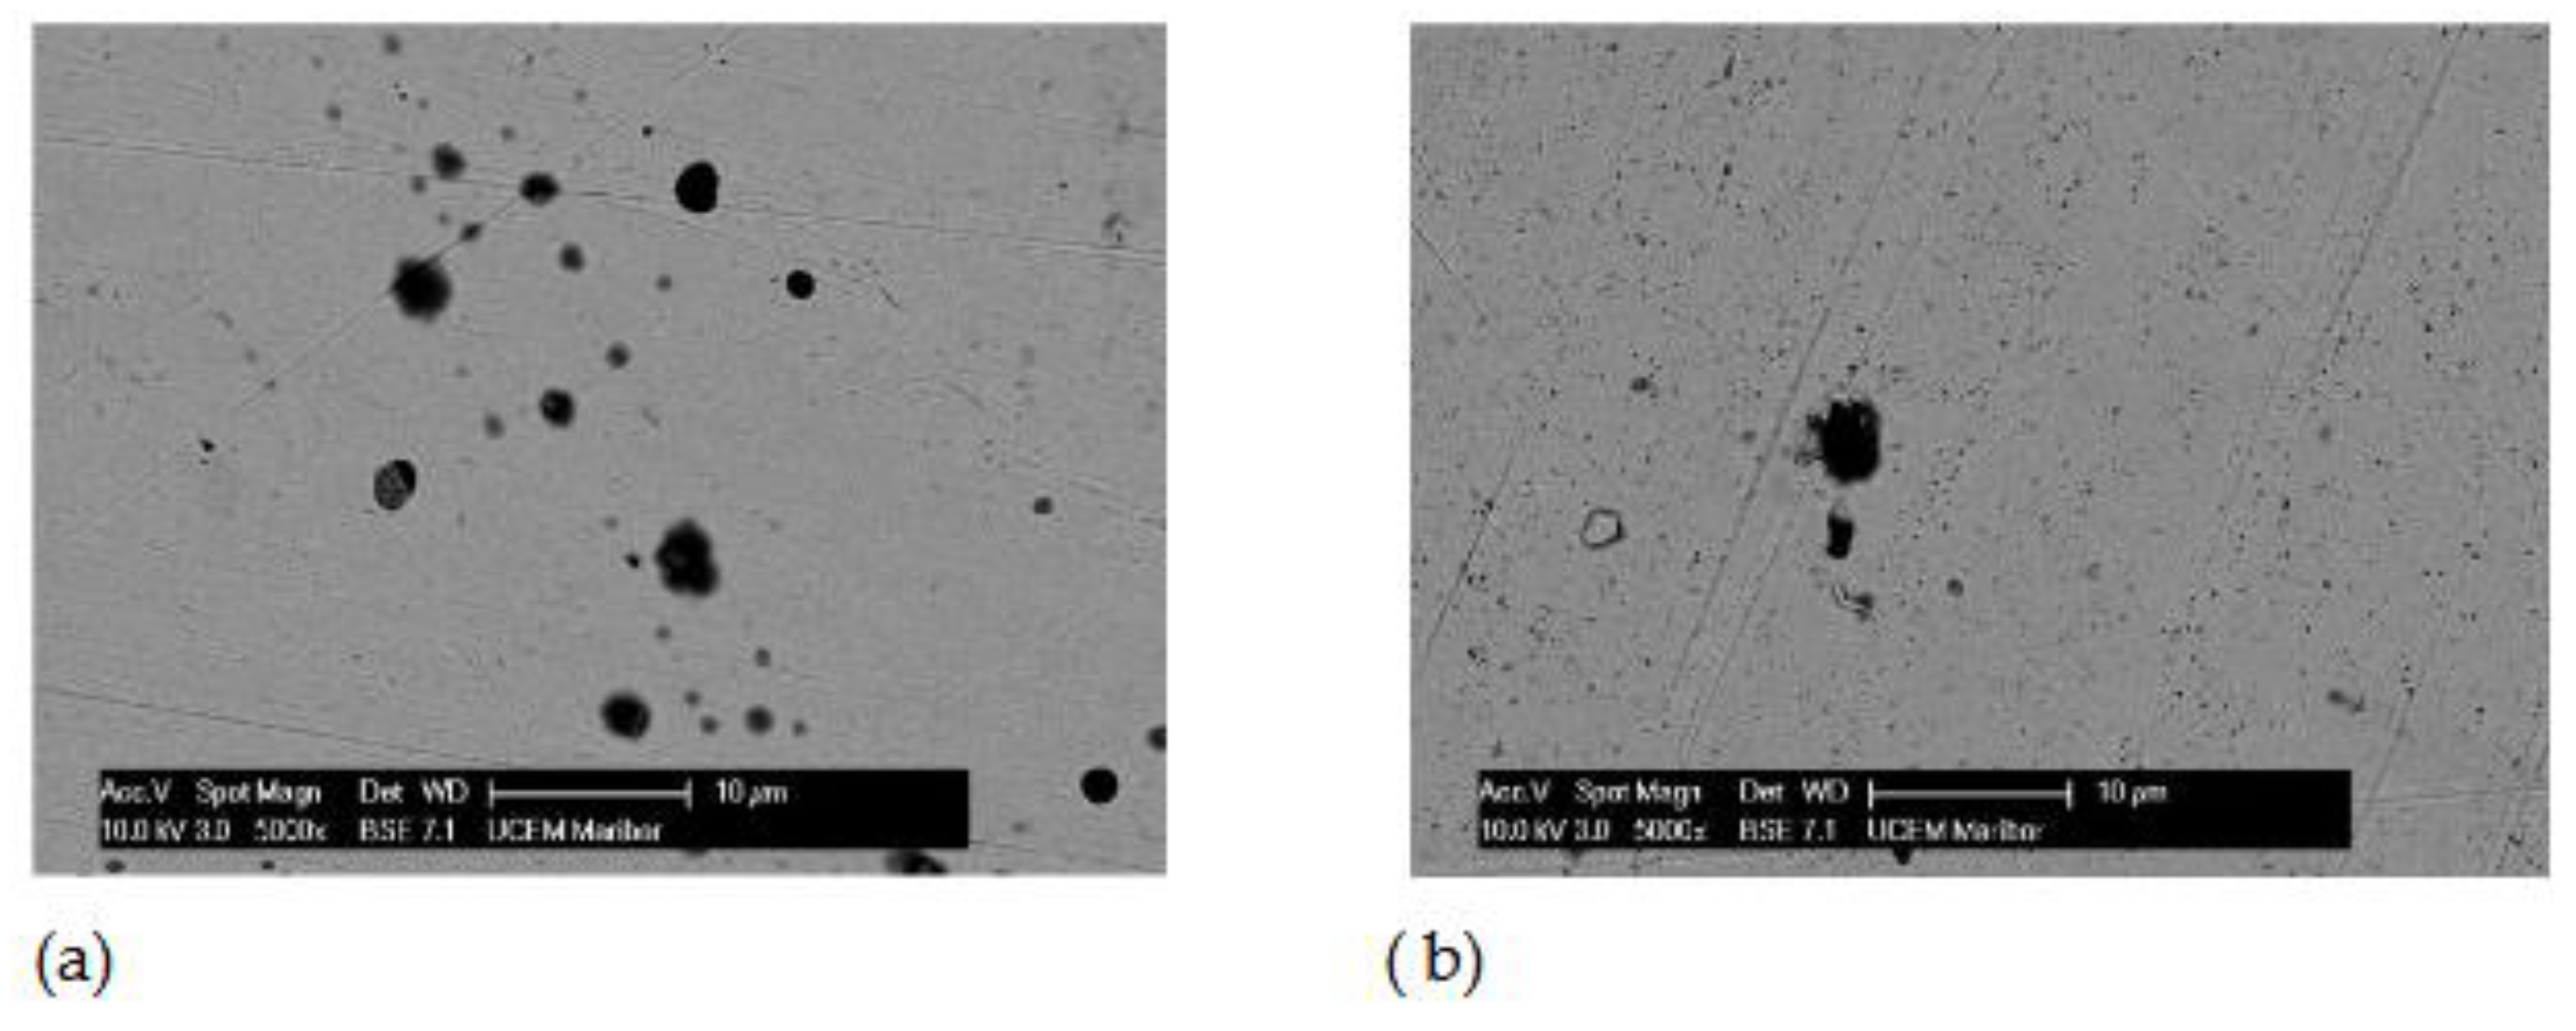
Figure 2.
EDS for AISI 316L: a) Artificial Saliva, b) Artificial saliva with 10% H2O2, both after 96 h of immersion.
Figure 2.
EDS for AISI 316L: a) Artificial Saliva, b) Artificial saliva with 10% H2O2, both after 96 h of immersion.
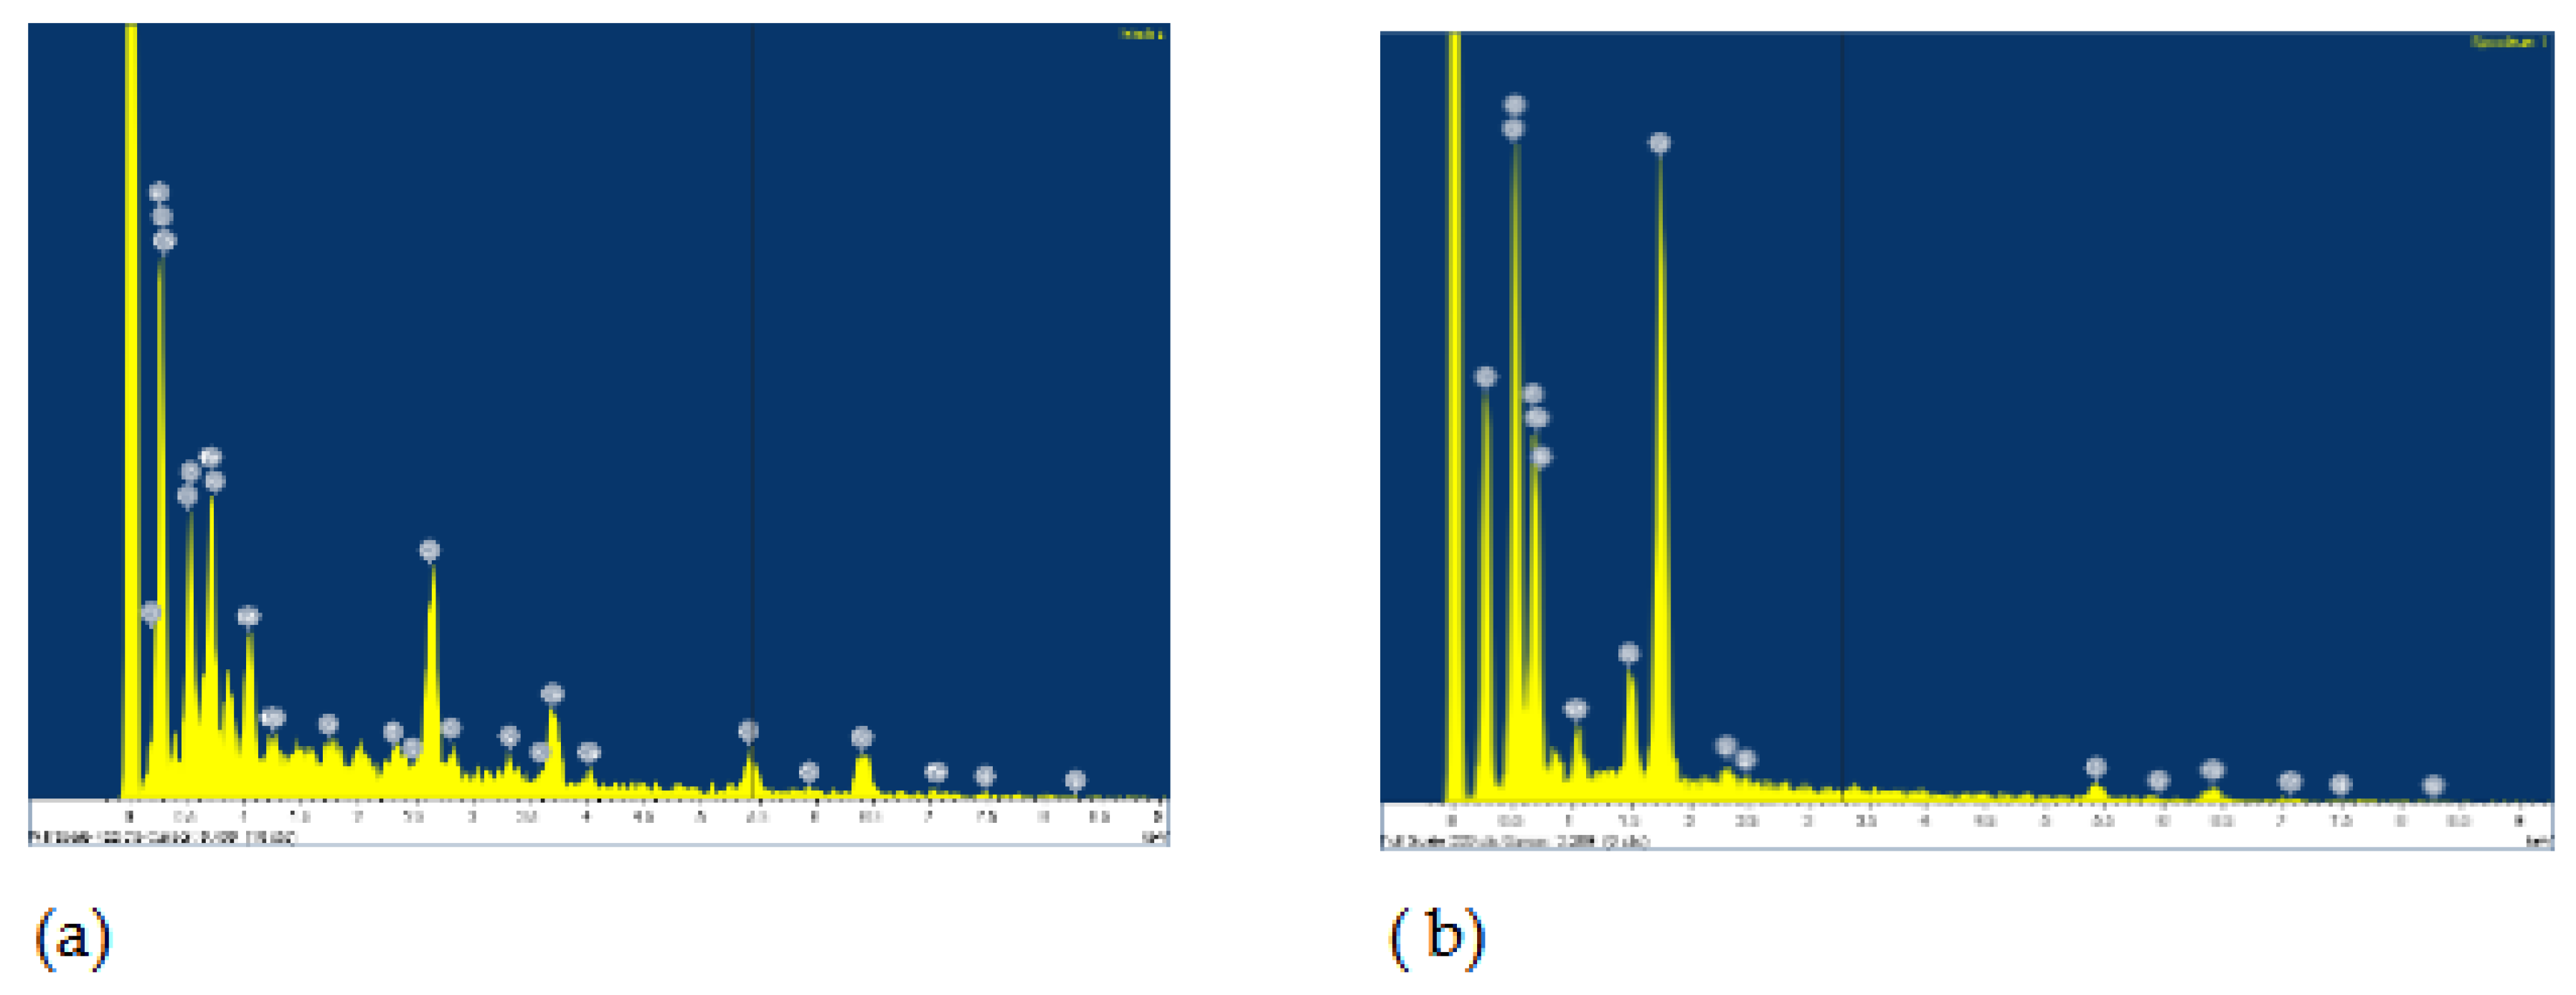
Figure 3.
SEM images for Ti6Al4V: a) Artificial Saliva, b) Artificial saliva with 10 % H2O2, both after 96 h of immersion.
Figure 3.
SEM images for Ti6Al4V: a) Artificial Saliva, b) Artificial saliva with 10 % H2O2, both after 96 h of immersion.
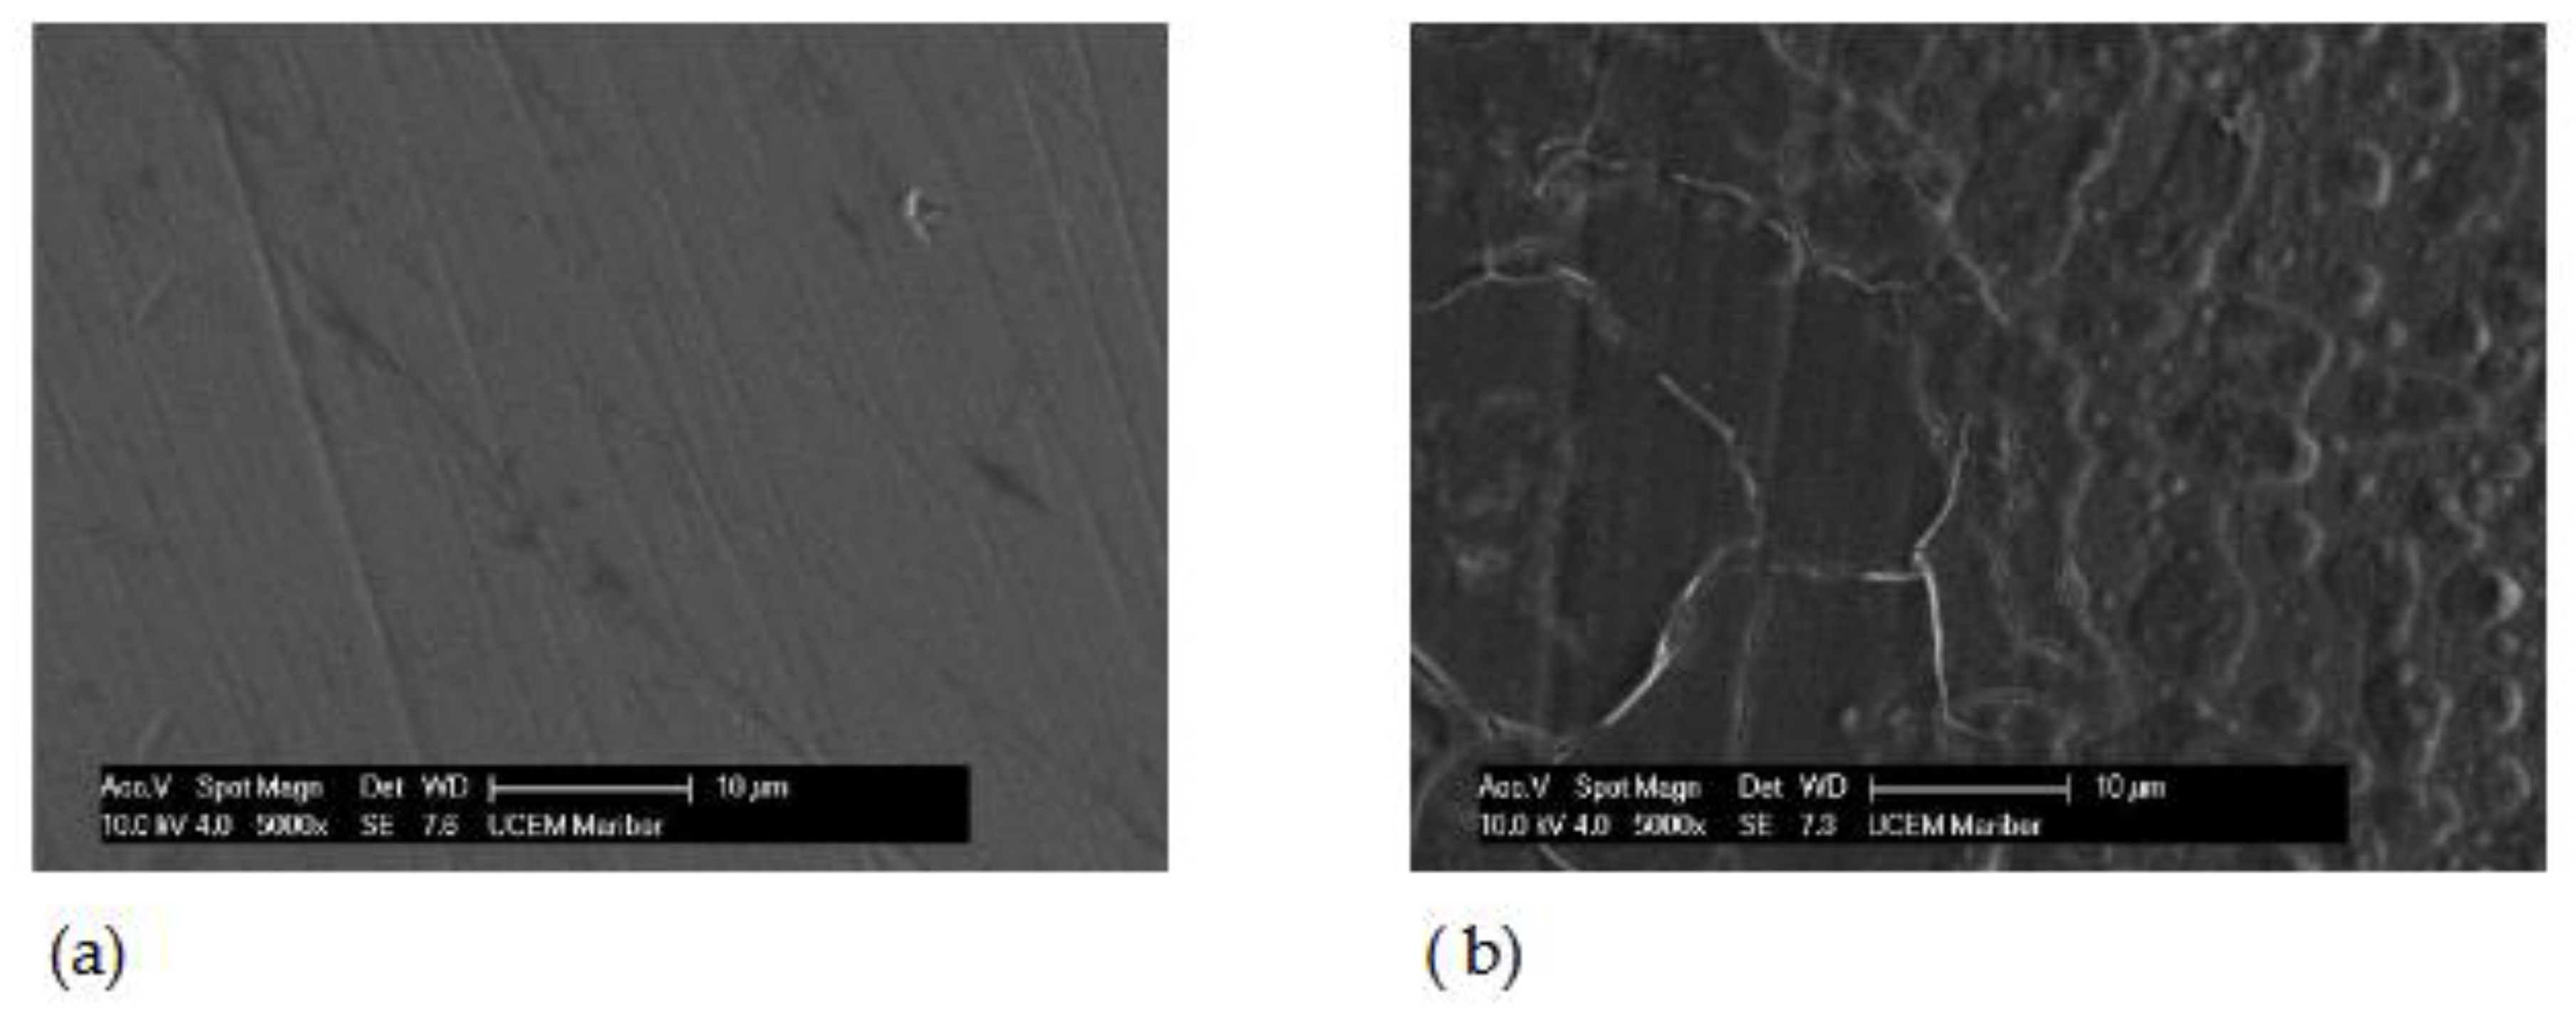
Figure 4.
EDS for Ti6Al4V: a) Artificial Saliva, b) Artificial saliva with 10% H2O2, after 96 h of immersion.
Figure 4.
EDS for Ti6Al4V: a) Artificial Saliva, b) Artificial saliva with 10% H2O2, after 96 h of immersion.
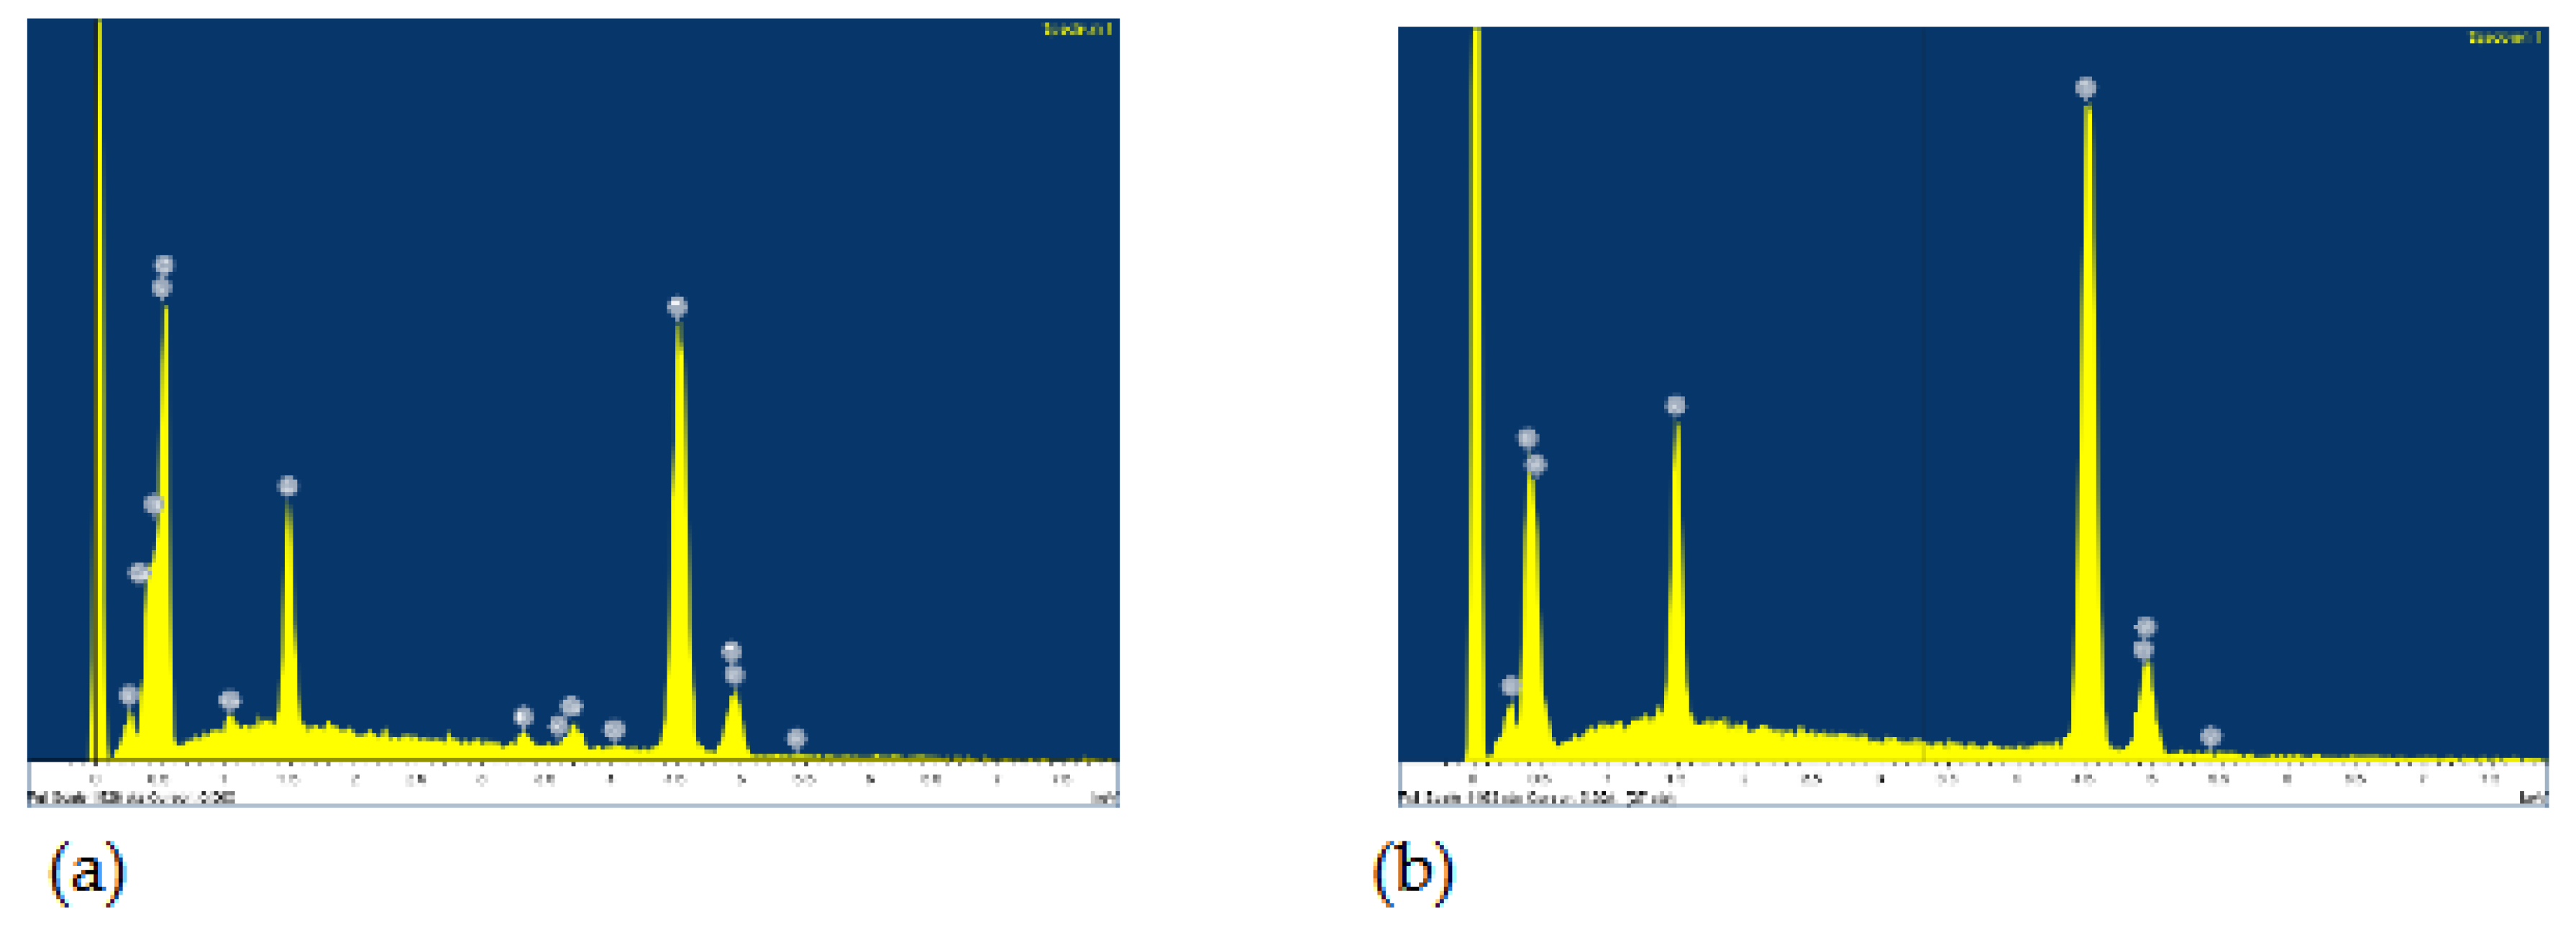
Figure 5.
Polarization curves for AISI 316L in different concentrations of H2O2.
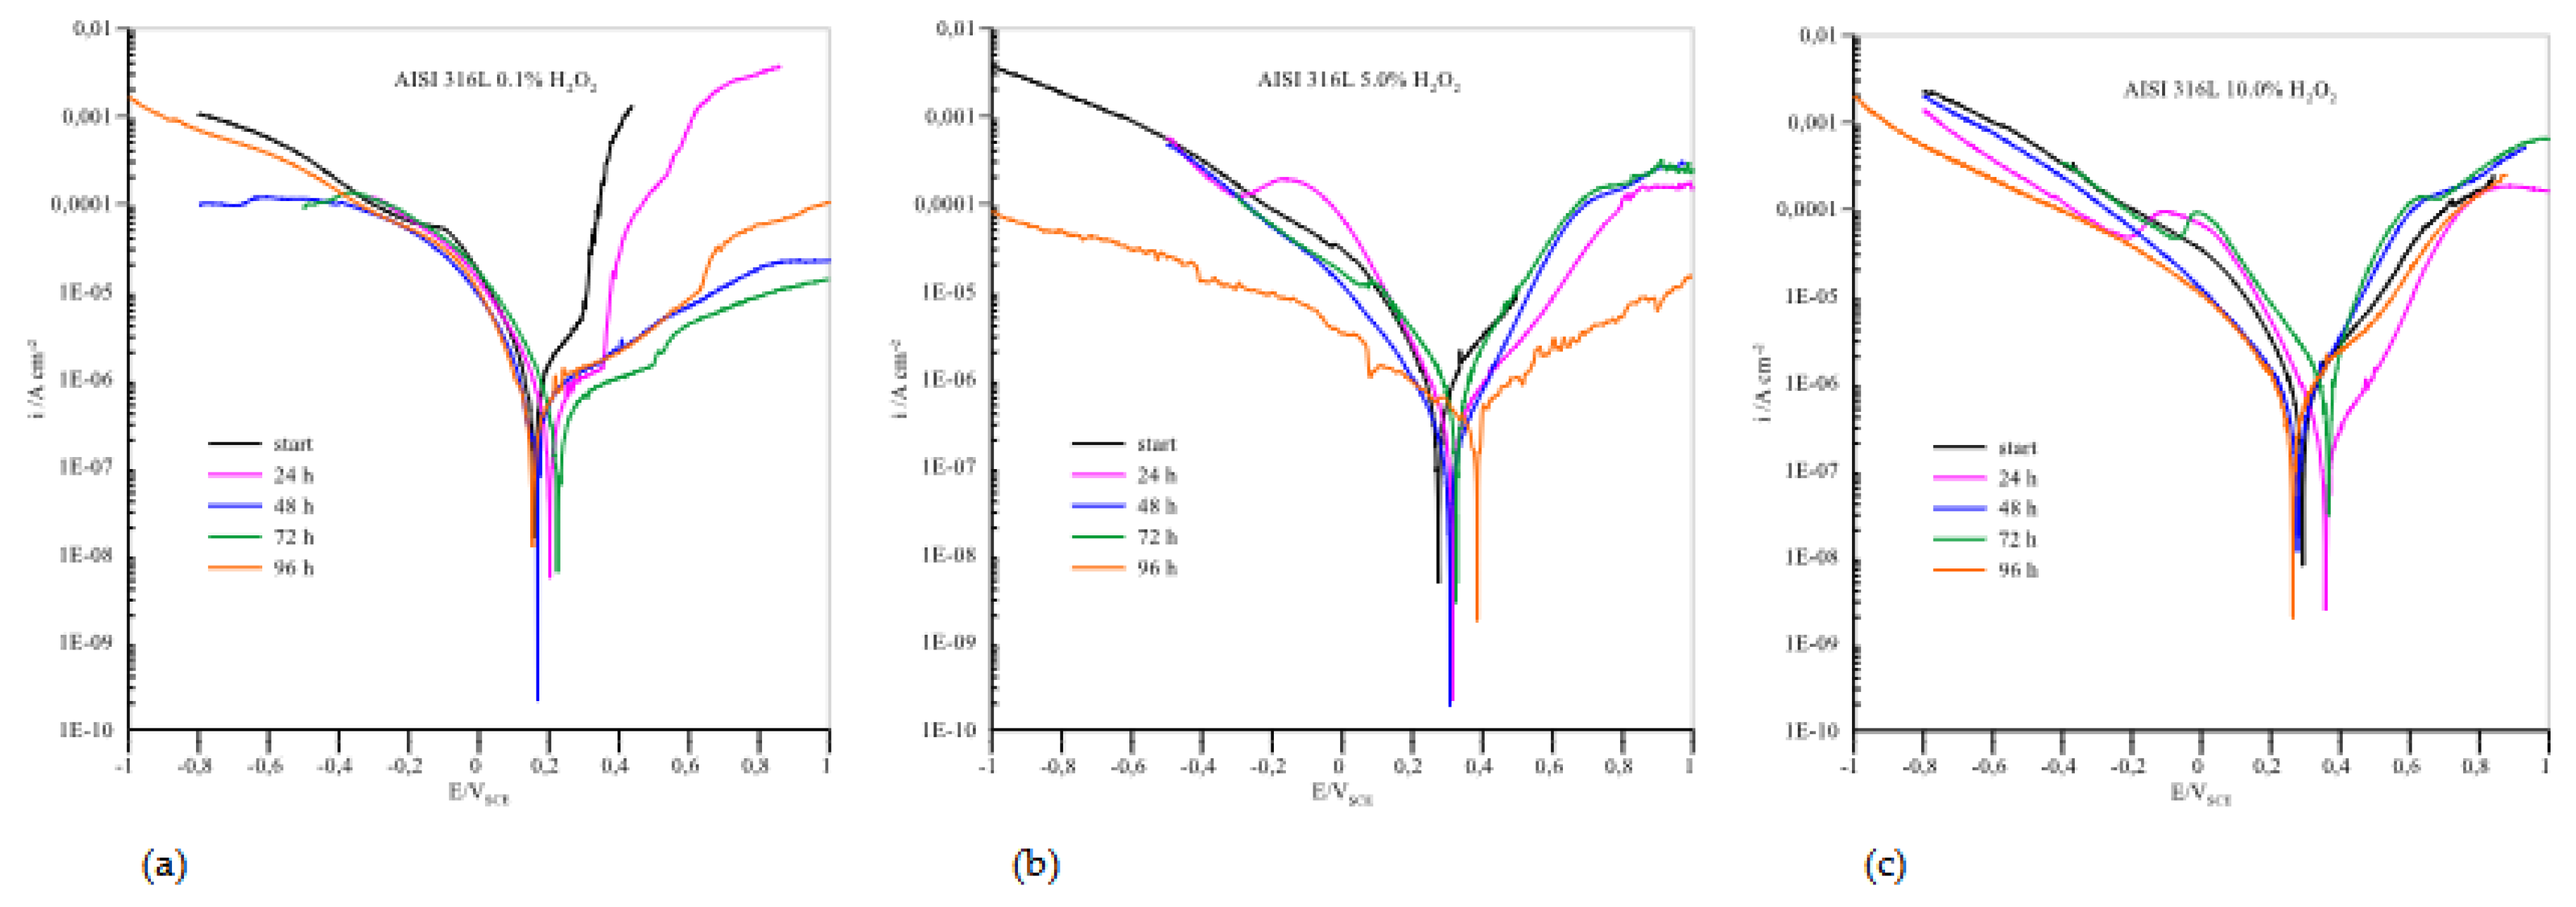
Figure 6.
Polarization curves for Ti6Al4V in different concentrations of H2O2.
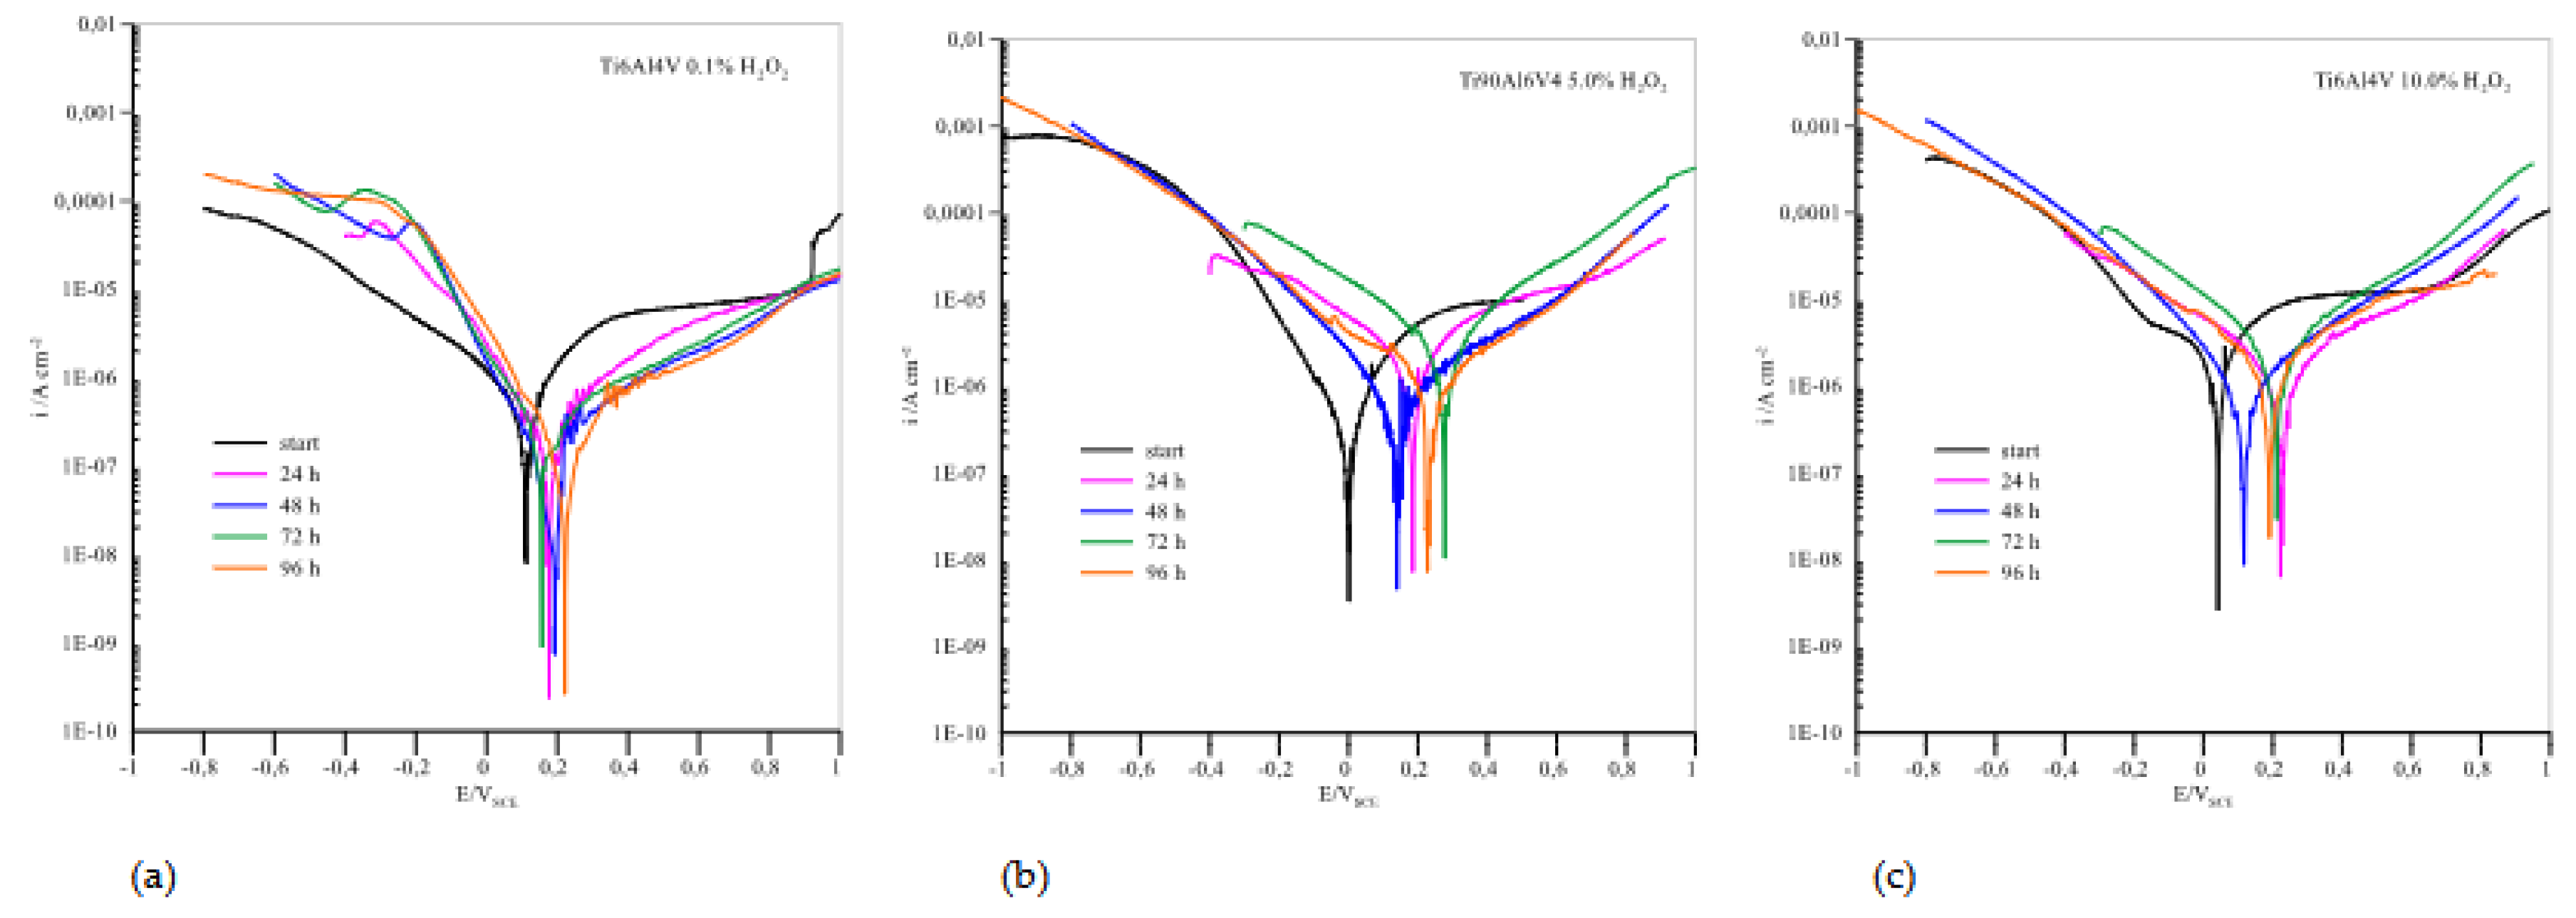
Figure 7.
Equivalent circuit used for modelling the EIS results.
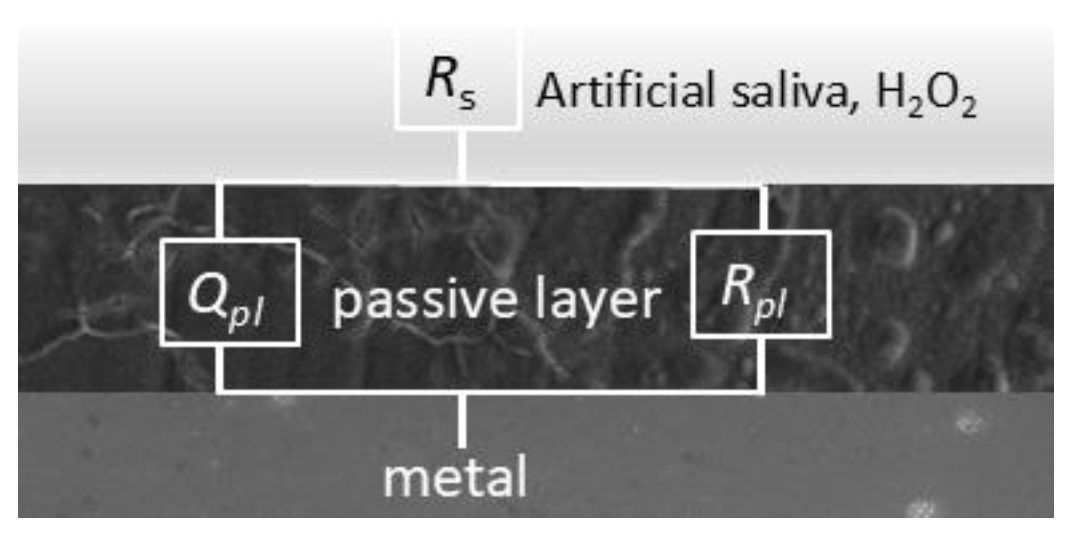
Figure 8.
Impedance spectra for AISI 316L in different concentrations of H2O2.
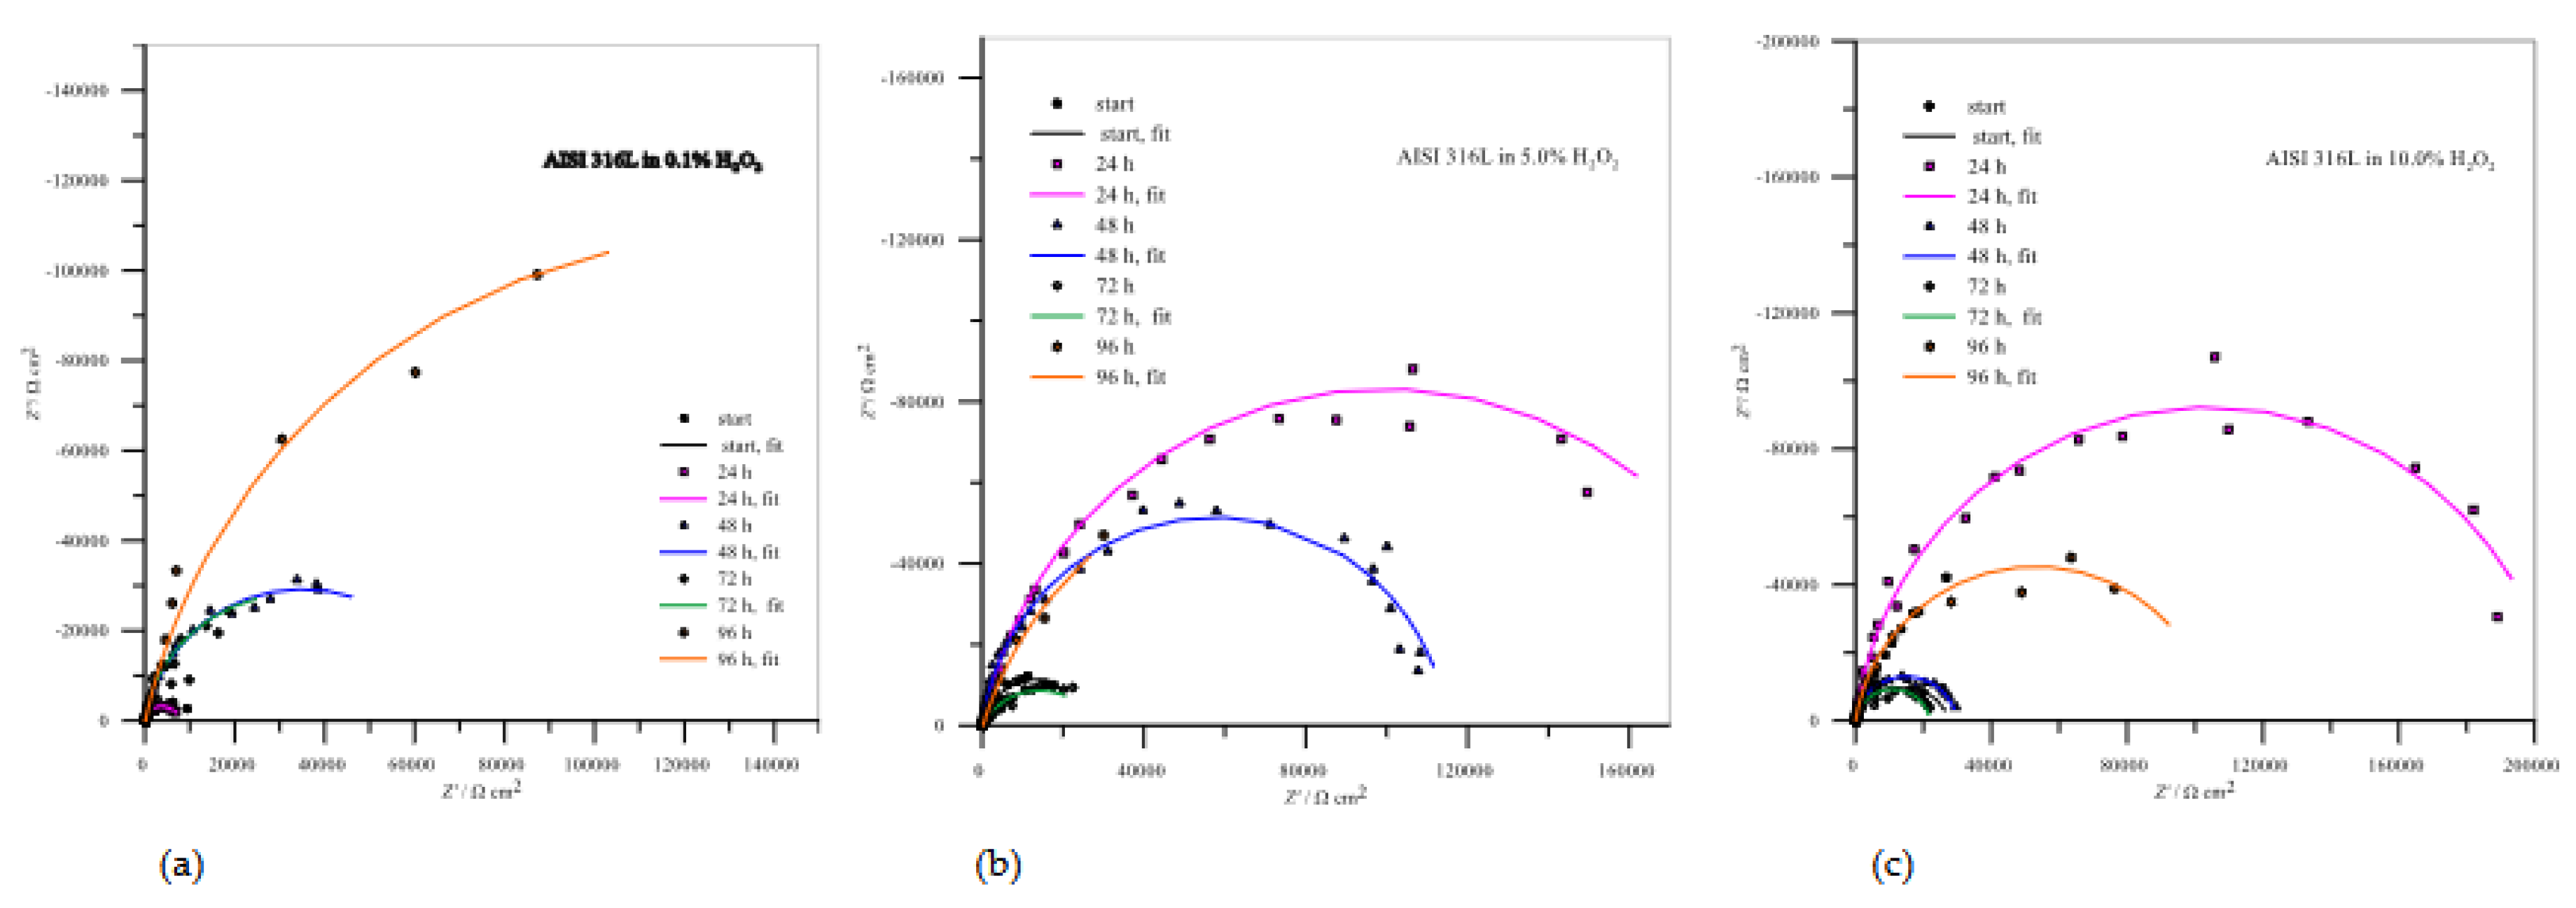
Figure 9.
Impedance spectra for Ti6Al4V in different concentrations of H2O2.
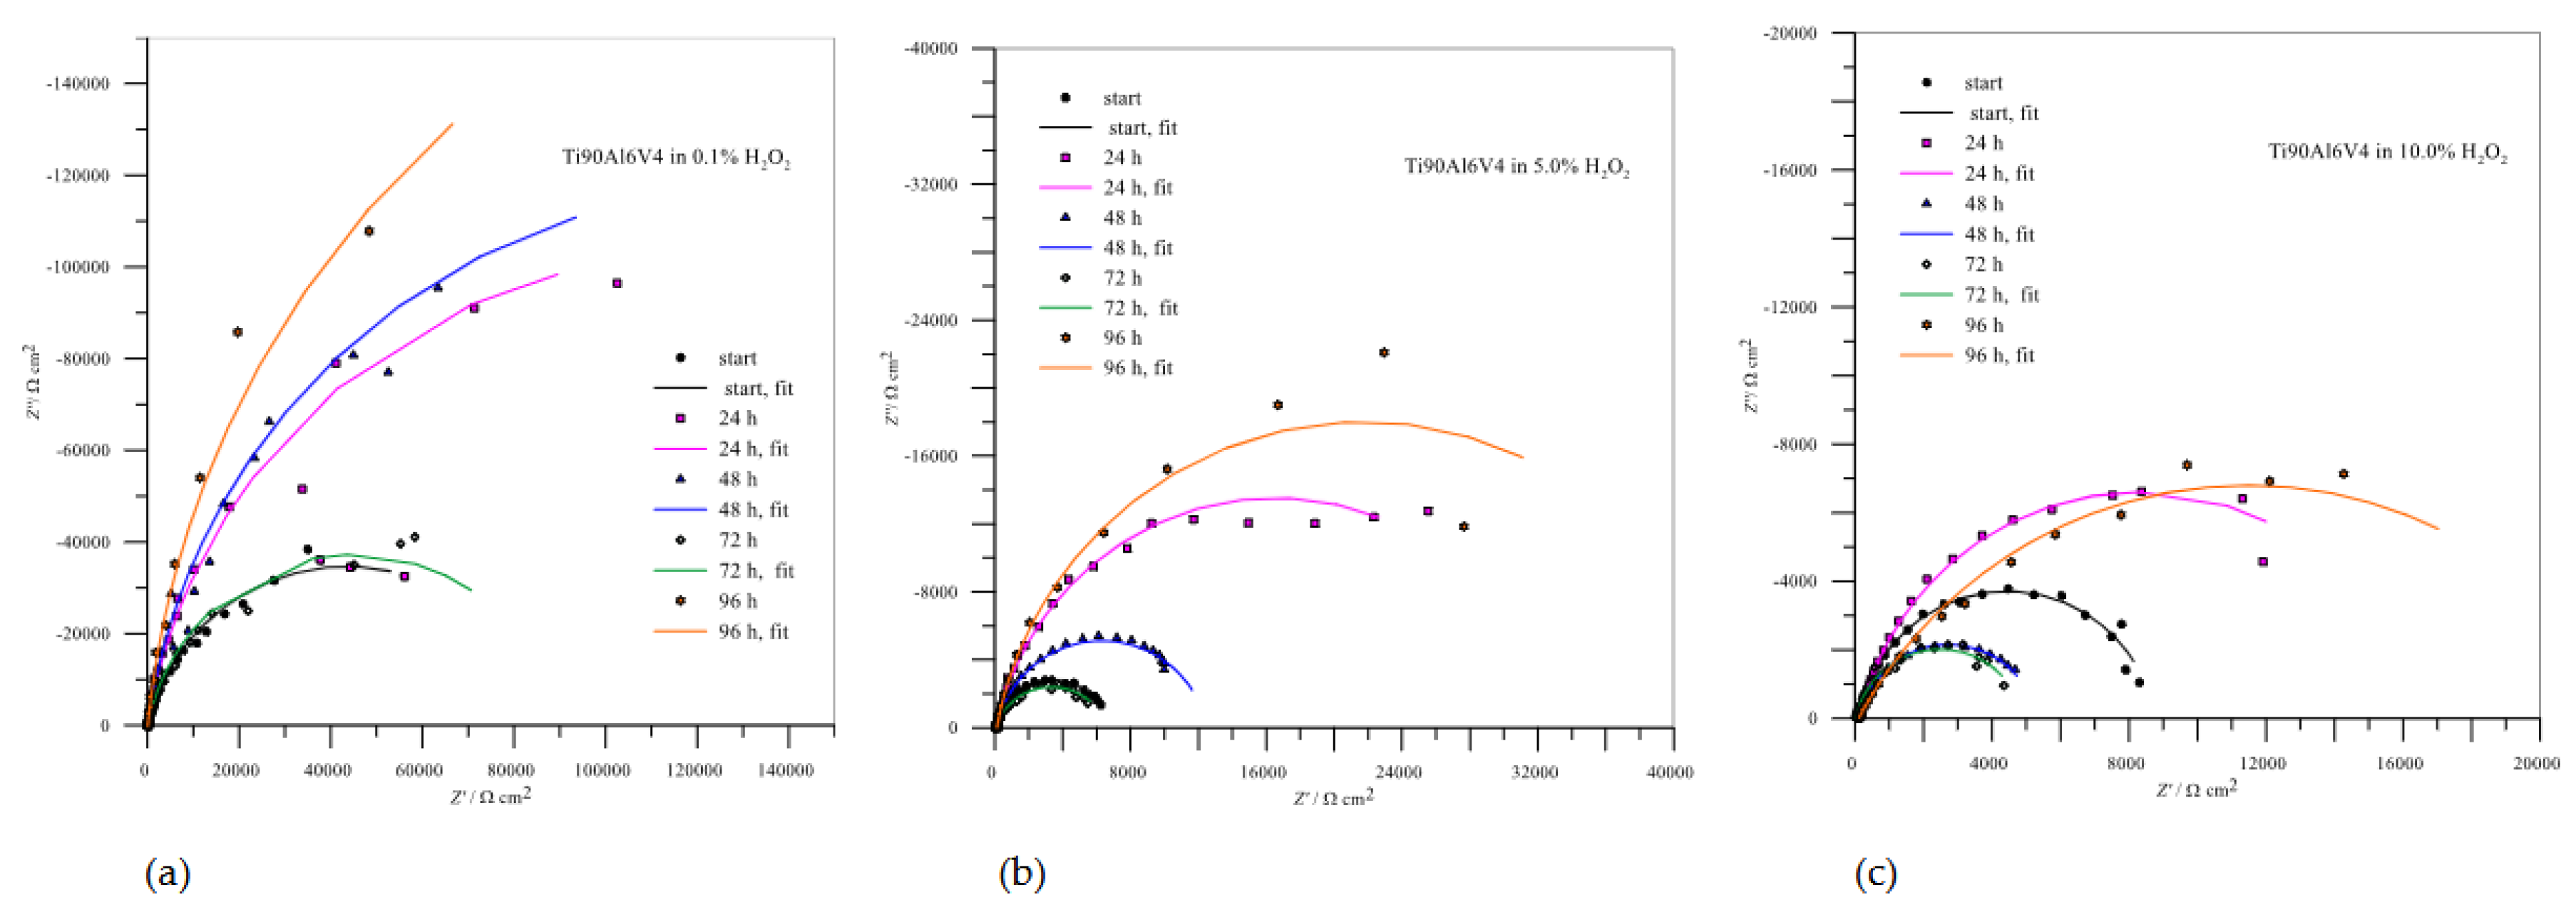
Figure 10.
Rpl values from impedance spectra: comparison between AISI 316L and Ti6Al4V in different concentrations of H2O2.
Figure 10.
Rpl values from impedance spectra: comparison between AISI 316L and Ti6Al4V in different concentrations of H2O2.
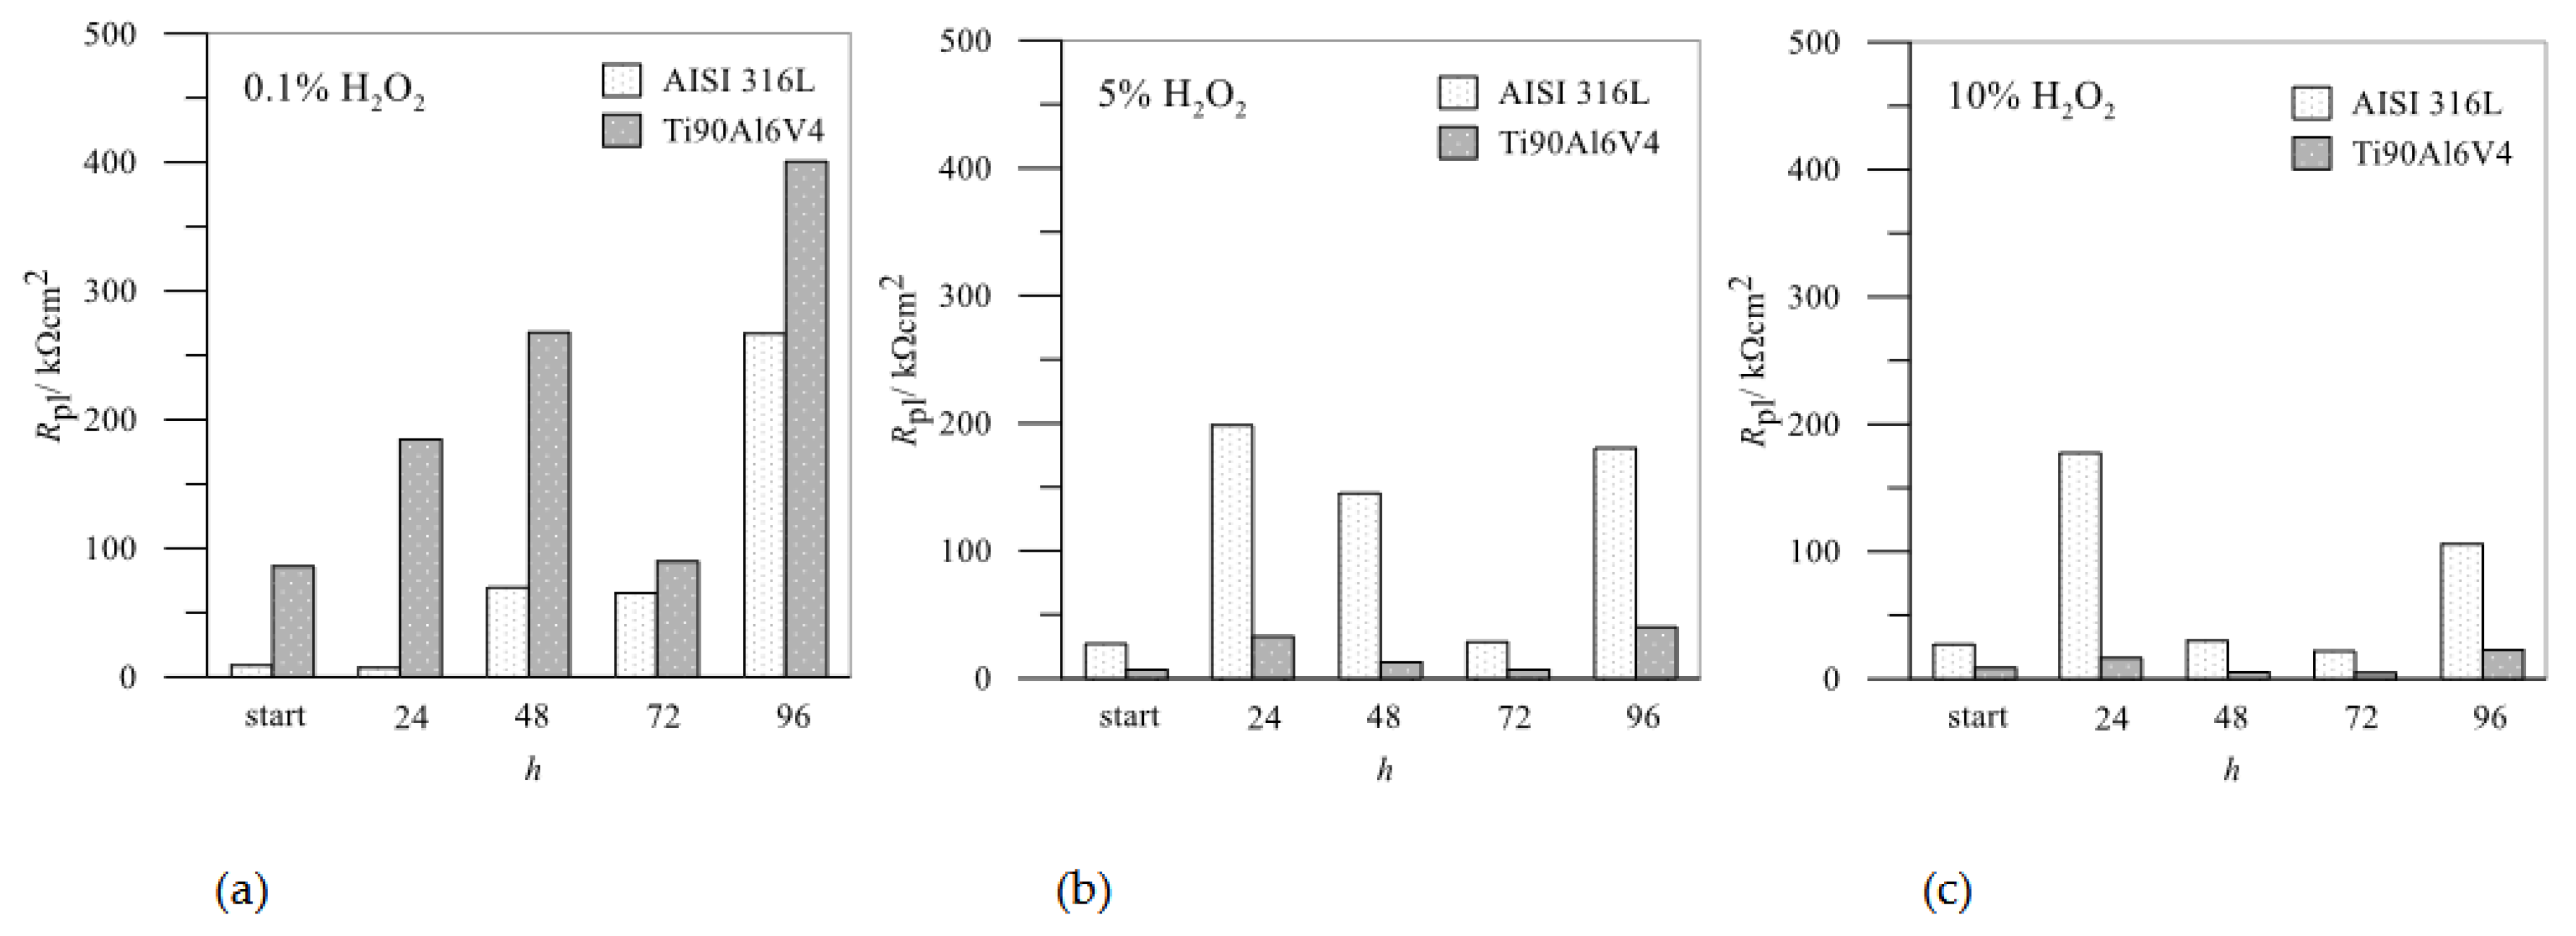
Figure 11.
Corrosion rates in mm/year: comparison between AISI 316L and Ti6Al4V in different concentrations of H2O2.
Figure 11.
Corrosion rates in mm/year: comparison between AISI 316L and Ti6Al4V in different concentrations of H2O2.
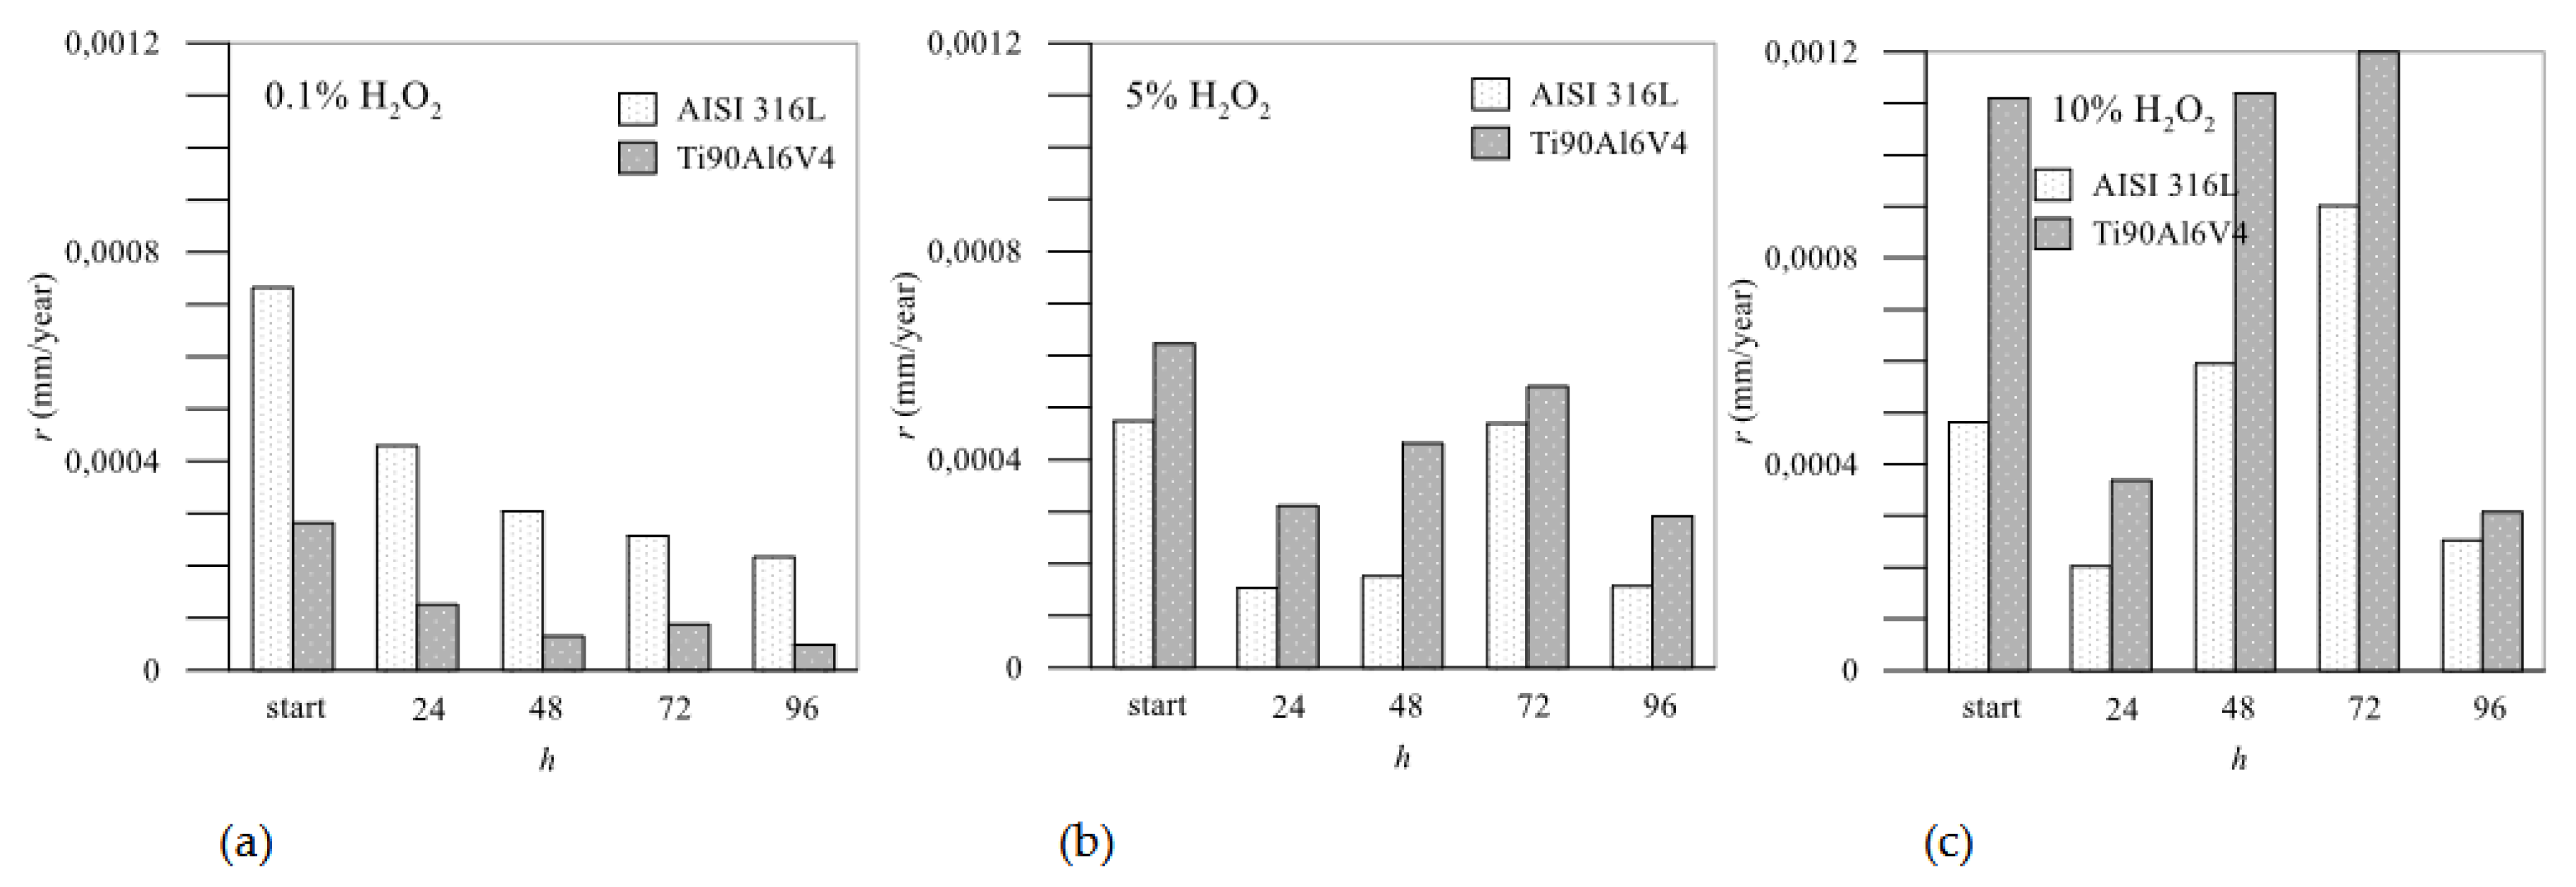
Table 1.
Parameter values from potentiodynamic curves for AISI 316L.
| 0.1% H2O2 | 5.0% H2O2 | 10.0% H2O2 | ||||||||||
| h |
icorr (A/cm2) |
Ecorr (VSCE) |
ipas (A/cm2) |
Epas (VSCE) |
icorr (A/cm2) |
Ecorr (VSCE) |
ipas (A/cm2) |
Epas (VSCE) |
icorr (A/cm2) |
Ecorr (VSCE) |
ipas (A/cm2) |
Epas (VSCE) |
| 0 | 6.93⋅10-7 | 0.1573 | 4.69⋅10-8 | 0.159 | 4.54⋅10-7 | 0.2738 | 7.52⋅10-7 | 0.309 | 4.62⋅10-7 | 0.2908 | 2.81⋅10-8 | 0.291 |
| 24 | 4.12⋅10-7 | 0.2032 | 5.05⋅10-8 | 0.205 | 1.48⋅10-7 | 0.3120 | 7.8⋅10-9 | 0.314 | 1.93⋅10-7 | 0.3580 | 9.05⋅10-9 | 0.359 |
| 48 | 2.92⋅10-7 | 0.1659 | 0.159⋅10-7 | 0.168 | 1.69⋅10-7 | 0.3074 | 1.23⋅10-8 | 0.308 | 5.78⋅10-7 | 0.2770 | 5.55⋅10-8 | 0.280 |
| 72 | 2.47⋅10-7 | 0.2252 | 1.097⋅10-7 | 0.230 | 4.50⋅10-7 | 0.3262 | 4.78⋅10-9 | 0.320 | 8.62⋅10-7 | 0.3671 | 8.98⋅10-8 | 0.367 |
| 96 | 2.08⋅10-7 | 0.1510 | 3.59⋅10-8 | 0.153 | 1.51⋅10-7 | 0.3840 | 5.44⋅10-8 | 0.386 | 4.61⋅10-7 | 0.2626 | 2.19⋅10-8 | 0.263 |
Table 2.
Parameter values from potentiodynamic curves for Ti6Al4V.
| 0.1% H2O2 | 5.0% H2O2 | 10.0% H2O2 | ||||||||||
| h |
icorr (A/cm2) |
Ecorr (VSCE) |
ipas (A/cm2) |
Epas (VSCE) |
icorr (A/cm2) |
Ecorr (VSCE) |
ipas (A/cm2) |
Epas (VSCE) |
icorr (A/cm2) |
Ecorr (VSCE) |
ipas (A/cm2) |
Epas (VSCE) |
| 0 | 3.18⋅10-7 | 0.1110 | 7.2⋅10-8 | 0.113 | 7.20⋅10-7 | 0.0016 | 6.52⋅10-8 | 0.0051 | 12.5⋅10-7 | 0.0432 | 1.14⋅10-5 | 0.401 |
| 24 | 1.41⋅10-7 | 0.1752 | 3.56⋅10-8 | 0.180 | 3.57⋅10-7 | 0.1845 | 2.64⋅10-7 | 0.191 | 4.17⋅10-7 | 0.2271 | 7.8⋅10-9 | 0.314 |
| 48 | 0.73⋅10-7 | 0.1556 | 1.48⋅10-8 | 0.199 | 4.98⋅10-7 | 0.1377 | 1.08⋅10-7 | 0.148 | 17.28⋅10-7 | 0.1169 | 1.23⋅10-8 | 0.308 |
| 72 | 3.22⋅10-7 | 0.1257 | 4.83⋅10-7 | 0.161 | 6.24⋅10-7 | 0.2762 | 2.51⋅10-7 | 0.208 | 19.42⋅10-7 | 0.2120 | 6.62⋅10-6 | 0.400 |
| 96 | 0.56⋅10-7 | 0.2223 | 2.72⋅10-7 | *0.240 | 3.36⋅10-7 | 0.2250 | 1.01⋅10-7 | 0.234 | 4.78E⋅10-7 | 0.1914 | 4.75⋅10-6 | 0.364 |
Table 3.
Parameter values from EIS measurements for AISI 316L at different H2O2 concentrations and immersion time.
Table 3.
Parameter values from EIS measurements for AISI 316L at different H2O2 concentrations and immersion time.
| Rpl (kΩcm2) |
Qpl·10-5 (snΩ -1cm-2) |
n |
Rpl (kΩcm2) |
Qpl·10-5 (snΩ -1cm-2) |
n |
Rpl (kΩcm2) |
Qpl·10-5 (snΩ -1cm-2) |
n | |
| h | 0.1% H2O2 | 5.0% H2O2 | 10% H2O2 | ||||||
| 0 | 9.22 | 2.57 | 0.85 | 26.99 | 1.78 | 0.89 | 26.91 | 2.15 | 0.85 |
| 24 | 7.31 | 4.27 | 0.90 | 198.63 | 1.19 | 0.88 | 170.33 | 1.39 | 0.92 |
| 48 | 69.51 | 3.22 | 0.89 | 114.96 | 1.53 | 0.92 | 29.78 | 2.04 | 0.91 |
| 72 | 65.50 | 1.97 | 0.90 | 28.36 | 7.37 | 0.70 | 21.95 | 2.76 | 0.89 |
| 96 | 267.08 | 2.36 | 0.86 | 180.28 | 1.19 | 0.81 | 105.91 | 1.91 | 0.90 |
Table 4.
Parameter values from EIS measurements for Ti6Al4V at different H2O2 concentrations and immersion time.
Table 4.
Parameter values from EIS measurements for Ti6Al4V at different H2O2 concentrations and immersion time.
| Rpl (kΩcm2) |
Qpl·10-5 (snΩ -1cm-2) |
n |
Rpl (kΩcm2) |
Qpl·10-5 (snΩ -1cm-2) |
n |
Rpl (kΩcm2) |
Qpl·10-5 (snΩ -1cm-2) |
n | |
| h | 0.1% H2O2 | 5.0% H2O2 | 10.0% H2O2 | ||||||
| 0 | 86.00 | 3.40 | 0.85 | 6.52 | 3.25 | 0.91 | 8.60 | 3.02 | 0.90 |
| 24 | 184.81 | 3.19 | 0.94 | 32.8 | 4.17 | 0.88 | 16.34 | 24.1 | 0.86 |
| 48 | 268.00 | 3.43 | 0.91 | 12.39 | 18.33 | 0.88 | 5.19 | 22.75 | 0.88 |
| 72 | 89.91 | 4.64 | 0.88 | 6.62 | 36.05 | 0.80 | 4.90 | 47.54 | 0.87 |
| 96 | 400.58 | 4.13 | 0.93 | 40.00 | 4.13 | 0.94 | 22.70 | 3.65 | 0.68 |
Disclaimer/Publisher’s Note: The statements, opinions and data contained in all publications are solely those of the individual author(s) and contributor(s) and not of MDPI and/or the editor(s). MDPI and/or the editor(s) disclaim responsibility for any injury to people or property resulting from any ideas, methods, instructions or products referred to in the content. |
© 2025 by the author. Licensee MDPI, Basel, Switzerland. This article is an open access article distributed under the terms and conditions of the Creative Commons Attribution (CC BY) license (http://creativecommons.org/licenses/by/4.0/).
Copyright: This open access article is published under a Creative Commons CC BY 4.0 license, which permit the free download, distribution, and reuse, provided that the author and preprint are cited in any reuse.


