
Submitted:
23 June 2025
Posted:
25 June 2025
You are already at the latest version
Abstract
Anodic oxidation of titanium implants is a practical, cost-effective method to enhance implant success, especially due to rising hypersensitivity concerns. This study investigated the electrochemical behavior, surface characteristics, and biocompatibility of anodized commercially pure titanium (cpTi, grade IV). Anodization is performed on polished, cleaned cpTi sheet samples in 1 M H2SO4 using a constant voltage of 15 V for 15 and 45 min. The color of oxide layer is evaluated using CIELab color space, while composition is analyzed by Scanning Electron Microscope (SEM) equipped with Energy Dispersive Spectrometer (EDS). Additionally, X-ray diffraction (XRD) and X-ray photoelectron spectroscopy (XPS) are performed to identify and monitor phase transformations of formed titanium oxides. Corrosion measurements are performed in 9 g L–1 NaCl, pH = 7.4, and shows excellent corrosion stability of the anodized samples in comparison with pure titanium. Biological response is assessed by mitochondrial activity and gene expression of human fibroblasts. Anodized surfaces, particularly Ti-45, promoted higher mitochondrial activity and upregulation of adhesion-related genes (N-cadherin and Vimentin) in human gingival fibroblasts, indicating improved biocompatibility and potential for enhanced early soft tissue integration.
Keywords:
titanium oxide
; surface characterization
; corrosion resistance
; gene expression
; cytotoxicity
1. Introduction
The American Dental Association [1] since 2001. recommended the use of titanium and different titanium alloys as a feasible choice to more traditional noble and base metal alloys. Regarding the surface characteristics of dental implants, when exposed to air, titanium develops a thin natural protective oxide layer with an average thickness of ~10 nm on its surface [2]. Several surface modification techniques have been successfully introduced to increase this layer thickness and generate a bioactive TiO2 [3]. Those coatings are developed to perform multiple functions, such as improving the healing process, reducing the prevalence of periimplantitis, and increasing the long-term effectiveness of the implant. After the implant placement, direct contact of peri-implant tissue with the titanium surface induces a host immune response, a phenomenon crucial for proper tissue integration. In addition, the permanent implantation of the protein in the desired position would promote cell adhesion and cell differentiation and the new tissue formation around the implant [4]. Contemporary findings suggest that a thin layer of proteins is seen between the titanium implant surface and osseous tissue [5]. These proteins’ activity is particularly important for therapeutic success during immediate and early implant loading protocols [6]. A few seconds after the implant placement, cells secret a range of substances as a type of cell-to-cell communication [7]. A few days after surgery, fibroblasts usually travel to the wound and produce extracellular matrix and protective elements such as collagen, elastin, and proteoglycans[8]. The release of messenger molecules causes the proliferation phase to begin. In reaction to low tissue oxygen concentrations at the wound site (~50 mmHg pO2), cells create hypoxia-induced factors [9]. The most important is VEGF, which interacts with the cells that surround blood vessels. At that moment, angiogenesis takes place, a process responsible for connecting new vessels to the preexisting vascular system.
Despite the formation of a natural or anodized TiO2 layer, widely recognized as the primary factor enhancing the corrosion resistance of titanium and its alloys, localized corrosion phenomena such as pitting and crevice corrosion remain significant challenges [10,11,12,13,14,15]. These forms of corrosion can lead to the release of metal ions, potentially compromising the biocompatibility and mechanical integrity of titanium-based implants due to cytotoxic effects [16,17]. Therefore, evaluating the susceptibility of titanium and its alloys to localized corrosion in physiological environments is critical. In order to improve the corrosion stability of Ti and its alloys, oxidation (anodization) is usually performed. The anodic oxidation is a process governed by the dynamic equilibrium between oxide film growth and its dissolution, both of which are strongly influenced by the electrolyte composition and temperature. This method also offers the possibility to overcome the disadvantage of titanium’s grayish appearance by interfering color of the oxide formation. The applied voltage can vary to form a thicker titanium oxide (TiO2) layer, resulting in a more desired color on the Ti surface [18,19,20].
The many different compositions of the anodizing solutions based on inorganic acids and bases, organic acids, organic solvents, etc. have been used [11,18,19] In the literature, compact oxide films, nanostructured materials including, disordered porous films, are formed through anodization utilizing different electrolytes such as H2SO4, H3PO4, NaOH, CH3COOH, Na2HPO4, NH4Cl, and self-organized porous or nanotubular films can be obtained in the presence of fluoride ions from, NH4F, HF, NaF, [11,12,20,21]. Also, different organic-based electrolytes containing ethylene glycol, glycerol, diethylene glycol, citric, and oxalic acid are used, but mainly for nanotube formation [22-24.] It is also worth mentioning that adjusting the anodization variables, such as the type of electrolyte, concentration of the electrolyte, pH level, temperature, applied voltage or current, and duration, can influence the color of the anodized samples, physical and chemical characteristics of the oxide layer that develops on titanium and its alloys [25].
Depending on the electrolyte and voltage practically whole spectra of color can be obtained, for more details please see [17,19,26,27,28,29]
For example, Khadiri et al. [30] investigated anodization in the range of the applied voltage from 20 to 35 V in a 5 M phosphoric acid solution. A red-violet shade is observed at 20 V, which shifts to a dark blue at 25 V and then transits to a light blue at 35 V. By the anodizing of cpTi in 1 M KOH solution at 25 °C for 1 min at 5, 10, 20, 30, and 40 V voltage variations in the color are from color varieties of gold, violet, dark, blue, and light blues {31]. The corrosion current in simulated body fluid (SBF) depends on the applied anodizing voltage, for the voltages of 5 V, 10 V, 20 V, 30 V, and 40 V, determined corrosion currents are 4.35 μA, 2.6 μA, 2.75 μA, 3.42 μA, and 2.65 μA, respectively. Numerous studies have investigated the corrosion behavior of commercially pure titanium (cpTi) and its alloys mainly in simulated body fluids, such as Ringer’s and Hanks’ solutions. For instance, Tamilselvi et al. [32] reported corrosion potentials (Ecorr) of −387 mV and −401 mV, with corrosion current densities (jcorr) values of 5.97 × 10⁻⁷ A cm−2 and 4.84 × 10⁻⁷ A cm−2 for cpTi and Ti-6Al-4V, respectively, in saline solutions. Under an impressed potential of +500 mV for 1 hour, these values improved to 3.05 × 10⁻⁸ A cm−2 and 1.06 × 10⁻⁸ A cm−2, respectively, due to the formation of a protective TiO2 passive film. Similarly, Jáquez-Muñoz et al. [12] evaluated the electrochemical corrosion behavior of Ti-cp2, Ti-6Al-2Sn-4Zr-2Mo, Ti-6Al-4V, and Ti Beta-C, anodized in 1 M H2SO4 and H3PO4 solutions at a constant current density of 0.025 A cm−2, and tested in 3.5 wt% NaCl and H2SO4 environments. Non-anodized alloys exhibited jcorr values in the range of 10−6 A cm−2, while anodized samples showed improved corrosion resistance, with jcorr values decreasing to 10−7 A cm−2 to 10−9 A cm−2 and Ecorr values shifting approximately 0.2 V to the more positive value The authors noted that anodizing produced a more homogeneous and protective oxide layer, particularly in α-phase-dominated alloys like Ti-6Al-4V, whereas β-phase-rich alloys, such as Ti Beta-C, formed less uniform oxide layers, resulting in relatively poorer corrosion performance. Additionally, Almeraya-Calderón et al. [11] reported a jcorr of 7.16 × 10⁻⁶ A cm−2 and an Ecorr of −421 mV vs. SCE for Ti-cp2 in Ringer’s solution, with a passive range of 1.154 V. Surface preparation techniques also significantly influence corrosion behavior. Milošev et al. [13] demonstrated that grinding, diamond polishing, and chemo-mechanical polishing of Ti-6Al-4V in 0.9 wt.% NaCl and in artificial saliva reduced surface roughness, correlating with enhanced polarization resistance, as confirmed by electrochemical impedance spectroscopy.
Even the many electrolytes for anodization are used, the one based on sulfuric acid is dominant in the practice [19,33]. The electrolyte can be a moderately concentrated sulfuric acid (1 to 2 M is appropriate). Kumar et al. [33] investigated anodization in the sulfuric acid in the range of concentration 0.5-5 M, applying voltage from 10 V to 90 V, proposed that the optimal concentration is 1 M H2SO4 and voltage of 15 V. Also, Capek et al. [34] investigated the Ti anodization in 1 M H2SO4 varying the temperature from 6 °C, 2, °C and 36 °C, applying the voltage of 5 V, 10 V and 15 V. Using the ellipsometry for the samples anodized during 4 min, 60 min and 180 min with 5 V and 15 V, determined the thickness of ~10 nm for 5 V and an exponential increase of thickness from 30 nm to 110 nm for 15 V. However, reported corrosion parameters vary widely due to differences in surface preparation, alloy microstructure, and testing conditions, such as the composition and pH of solutions like Ringer’s and Hanks’ [11,35]. This variability underscores the need for standardized corrosion testing protocols.
Therefore, this study aims to systematically investigate the corrosion behavior of commercially pure and anodized titanium in 9 g L–1 NaCl environment, with a focus on the effects of anodization on corrosion resistance and its relevance to biomedical applications. Given that the microstructure, composition, thickness, and phase distribution of the oxide layer influence soft tissue integration, the study aimed to evaluate the effect of anodically oxidized cpTi surfaces on human fibroblasts biocompatibility.
2. Materials and Methods
2.1. Anodization and Characterization of Oxidized Titanium
2.1.1. Anodization
For the anodization, a cpTi plate (in the rest of the text, cpTi was denoted as Ti), 0.127 mm thick (Alfa Aesar, Ward Hill, MA, USA), with the dimensions of 1 cm × 1 cm with a neck of 0.2 cm × 3 cm was used. The samples were ground with SiC abrasive papers (1000–4000 grit) and polished with 0.05 μm Al2O3 on polishing cloth, followed by degreasing in acetone and DI water in an ultrasonic bath. Anodization was performed in 1 M H2SO4 (Merck KGaA, Darmstadt, Germany) at room temperature with a constant voltage of 15 V for 15 min and 45 min [33,34]. As a constant voltage power supply, the ISKRA MA 4153 0-25 V, 0.4 A (Iskar, Kranj, Slovenia) was used. The anodization was performed in a 100 cm3 beaker, with two platinum, 2 cm × 2 cm, counter electrodes. After immersion of the Ti electrode in the solution, the voltage was gradually increased from 0 V to 15 V for 30 s. The voltage was kept constant for 15 min and 45 min, and voltage and current were recorded with a digital voltmeter ISO-Tech IDM 73 (Iso-Tech, Corby, Northamptonshire UK), interfaced to a PC via RS-232, with a step size of 10 s. The potential was measured using a saturated calomel electrode (SCE) with Gamry 1010E (Gamry, Warminster, PA, USA) potentiostat/galvanostat. After anodization, the samples were removed from the solution, washed with distilled water, and in isopropanol. In the following text, base Ti and Ti anodized for 15 and 45 minutes are denoted as Ti-0, Ti-15, and Ti-45, respectively.
2.1.2. Color Measurements
The color of the anodized samples, as well as the color of the no oxidized Ti plate, was measured with a Datacolor Spectro 700 (DATACOLOR, Switzerland, Basel) spherical spectrophotometer, under the following conditions: D65, 10°, SPI. The final result, i.e., the color coordinates, was obtained by averaging from three measurements at three different locations on each sample, based on the CIELab color system. The images of samples were taken using a Canon 77D camera (Canon, Tokyo, Japan).
2.1.3. SEM and EDS Characterization
For the non-electrochemical characterization, only pure Ti, Ti-0, and Ti-45 were used, to avoid the significant number of figures. The morphology and chemical composition of the samples were analyzed using a scanning electron microscope (SEM) JEOL JSM-6610LV (JEOL, Tokyo, Japan), at 20 kV, coupled to an Energy Dispersive Spectrometer (EDS) model, X-Max Large Area Analytical Silicon Drift connected with INCA Energy 350 (Oxford Instruments, Concord, MA, USA).
2.1.3. X-Ray Diffraction (XRD) Measurements
X-ray diffraction was done on a Philips PW 1050 diffractometer with Cu–Kα1,2 radiation using a Ni filter, at room temperature. The diffraction data were collected with a scanning step width of 0.05° and 3 s time per step in a 2θ range from 10° to 80°.
2.1.4. X-Ray Photoelectron Spectroscopy (XPS) Measurements
X-ray Photoelectron Spectroscopy (XPS) measurements were carried out using a SPECS system equipped with an XP50M X-ray source, a Focus 500 X-ray monochromator, and a PHOIBOS 100/150 analyzer. The system employed an Al Kα anode (photon energy of 1486.74 eV), operating at 12.5 kV and 32 mA. Survey scans were acquired over a binding energy range of 0 to 1000 eV using a constant pass energy of 40 eV, a step size of 0.5 eV, and a dwell time of 0.2 seconds in FAT mode. High-resolution spectra for Ti 2p and O 1s regions were recorded with a pass energy of 20 eV, a step size of 0.1 eV, and a dwell time of 2 seconds. The base pressure in the analysis chamber was maintained at 8×10⁻⁹ mbar. All binding energies were calibrated with respect to the C 1s peak at 284.8 eV.
2.2. Corrosion Measurements
The corrosion measurements were performed according to the modified ISO 10271:2009 [36] and ASTM F 2129-01 standards [37]. All the experiments were conducted in a 9 g L–1 (0.9 wt.%) NaCl (Merck KGaA, Darmstadt, Germany) solution at pH = 7.4 adjusted with 0.1 M NaOH (Merck KGaA, Darmstadt, Germany), ISO 10271:2009, at room temperature. The three-compartment glass cell with a volume of 200 cm3 using the saturated calomel electrode (SCE) as a reference, and lead plate 1 cm × 6 cm, inserted in a micro-porous polypropylene bag, to avoid the formation of hypochlorite that could disturb measurements, were used. Because, ISO 10271:2009, recommended that the following parameters have to be determined: Open circuit potential, Eocp, V, the potential after one hour of immersion in the electrolyte; Zero current potential, Ez,n, V, (n = 1, 2, 3…..), corrosion potentials obtained from the polarization curves when the current changes direction from cathodic to anodic and vice versa; Active peak potentials, Ec,n, V, (n = 1, 2, 3…..), active or transition peak potentials on the polarization curves with corresponding current density jc,n, A cm−2; Breakdown potential, Ep, V, transpassive, critical, pitting or active dissolution potential with corresponding current density jp, A cm−2; Current density, I0.3 or j0.3, A cm−2, at the potential E0.3 = Ez,1 + 0.3 V (SCE), we modified standards by the means that during the establishing of the open circuit potentials, simultaneously linear polarization measurements was conducted ± 10 mV vs. Eocp, and polarization resistance, Rp, was determined. Also, both standards recommend that the polarization curve starts from –100 mV in cathodic directions vs. Eocp, which is insufficiently small polarization that Tafel slop could be properly determined. Similarly, the standard ISO 10271:2009 did not consider reverse scan, from which repassivation potential can be obtained. In that manner, we performed a cyclic polarization test, but not to +0.8 V as recommended by ASTM F 2129-01, considering that the breakdown potential for Ti and its alloys is at much higher potentials. Also, both standard recommended experiments in the electrolyte purged with an inert gas to remove dissolved oxygen, as oxygen reduction is considered the dominant cathodic reaction under given conditions. But, for the application in the mouth for example prosthesis, oxygen is present, so the obtained results according to the standards will be unrealistic. For the problems of using those two standards please refer to [35,38]. Hereafter, after 1 h, of exposure to 9 g L–1 NaCl, the cyclic polarization curve was recorded with a sweep rate of 1 mV s–1 starting from –0.5 V with conditioning during 300 s, followed by a forward scan to breakdown potential and increase of current density to ~100 μA cm–2, and then applying backward scan to –0.5 V. The imaginary and real capacitance is determined, at the open circuit potential in the frequency range from 10 kHz to 0.1 mHz. All corrosion investigations were performed using Gamry 1010E (Gamry, Warminster, PA, USA) potentiostat/galvanostat
2.3. Biocompatibility
2.3.1. Mitochondrial Activity Assay (MTT Assay)
Human gingival fibroblasts (HGF) were isolated from the gingival tissue of a healthy 18-year-old donor, following the protocol described in a previous study [39], previously approved by the ethics committee (No: 36/7), Faculty of Dental Medicine, University of Belgrade, and carried out in compliance with the Declaration of Helsinki. Cells after the third passage were used in the experiment.
The experimental samples were first placed into 24-well plates and sterilized under ultraviolet light for 15 minutes on each side. Complete culture medium (Dulbecco’s Modified Eagle Medium (DMEM) supplemented with 10% fetal bovine serum (FBS) and 100 U/mL penicillin-streptomycin (all reagents from Invitrogen, Thermo Fisher Scientific, Waltham, MA, USA)) was added in the plates. On the following day, the samples were transferred to new 24-well plates. A total of 1 × 10⁴ HGFs were seeded onto each sample and cultured under standard conditions (37 °C, 5% CO2, humidified atmosphere). Cell viability was assessed after 7 days of culture. The culture medium was removed and replaced with an MTT solution (0.5 mg mL–1; Sigma-Aldrich, St. Louis, MO, USA). The samples were incubated for 4 hours. Subsequently, the MTT solution was discarded, and dimethyl sulfoxide (DMSO; Sigma-Aldrich, St. Louis, MO, USA) was added. The plates were shaken at 250 rpm for 20 minutes at 37 °C in the dark. The solutions were transferred into a 96-well plate, and absorbance was measured at 540 nm using a microplate reader (RT-2100c, Rayto, Shenzhen, China). Mitochondrial activity was expressed as a percentage relative to the control group.
2.3.2. Gene Expression
Samples were prepared following the same protocol used for the MTT assay. HGF cells, at a density of 5 × 10⁴ cells per sample, were seeded onto samples and cultured under standard conditions (37 °C, 5% CO2, in a humidified incubator). After 7 days of incubation, total RNA was extracted using the TRIzol reagent (Thermo Fisher Scientific), in accordance with the manufacturer’s protocol. RNA concentration was quantified using a microvolume spectrophotometer BioSpec-nano UV–Vis Spectrophotometer (Shimadzu Scientific Instruments, Columbia, MD, USA). For cDNA synthesis, 1 μg of total RNA was reverse-transcribed using the RevertAid First Strand cDNA Synthesis Kit (Thermo Fisher Scientific, Waltham, Massachusetts, USA) and oligo(dT) primers. Target gene amplification was performed with the SensiFAST™ SYBR® Hi-ROX Kit (Bioline, London, UK). Glyceraldehyde 3-phosphate dehydrogenase (GAPDH) served as the internal control for normalization. The primer sequences used for quantitative PCR (qPCR) were as follows (5′–3′), as represented in Table 1.
PCR reactions were carried out in a final volume of 15 μL, comprising SYBR Green Master Mix, 200 nmol L–1 of each primer, and 2 μL of synthesized cDNA. Each sample was run in duplicate across three independent experiments. qPCR was performed using the CFX96 real-time PCR system (Bio-Rad Laboratories, Hercules, CA, USA). A melting curve analysis followed each run to verify amplification specificity. Cycle threshold (Ct) values, defined as the number of cycles required for the fluorescent signal to cross a preset threshold, were recorded. Relative mRNA expression was quantified using the 2^−∆Ct method, with gene expression levels of N-cadherin, VEGF-A, and Vimentin normalized to GAPDH.
2.3.3. Contact Angle Measurements
Surface wettability was measured under room temperature (22.5±0.2 °C) conditions. Samples (Ti, Ti-15, and Ti-45) were set onto a measurement settle, and a 2 µL drop of deionized water, as a polar component, was placed onto the film’s surface, using a micropipette (Finnpipette, Thermo Fisher, Helsinki, Finland), at a distance of 4 mm and angle of 90°. The measurements of the non-polar components, diiodomethane, and ethylene glycol, were conducted similarly. Contact angles (θ) were measured 1 s after the liquid achieved contact with the substrate surface by measuring the angle between the plane tangent to the drop and the plane of the underlying surface. The analyzer’s setup consists of a Canon 77D camera with a Canon ultrasonic micro-lens f100 mm (Tokyo, Japan) and a position stand. Data were analyzed using ImageJ contact angle softer (version 1.5t, National Institutes of Health, LOCI, University of Wisconsin, Madison, Wisconsin, USA).
2.3.4. Statistical Analysis
For the assessment of the biocompatibility testing software package, GraphPad Prism ver. 9 was used (GraphPad Software, Inc., San Diego, CA, USA). The Kolmogorov–Smirnov test was used to assess whether the data followed a normal distribution. For biocompatibility testing Kruskal-Wallis test was used. The values are presented as mean ± SD. The results of contact angle measurements were subjected to statistical analysis using descriptive measurements and the Kruskal-Wallis test. P value less than 0.05 was considered significant.
3. Results and Discussion
3.1. Anodization and Characterization of Oxidized Titanium
3.1.1. Titanium Anodization
In Figure 1 the dependence of the voltage, potentials, and current densities, during anodization of Ti, are shown. Given the constant applied voltage of 15 V, the observed lower electrode potential (~13 V) is associated with a high overpotential for the hydrogen evolution reaction at the cathode. The current density, initially fast rises to 5-7 mA cm–2 and then decreases to the ~1.5 mA cm–2. By integrating the current density over time, a charge of 1.59 C is determined for the sample anodized for 15 min, and 4.64 C for the sample anodized for 45 min. Although oxygen evolution and a change in the color of the electrolyte are observed during anodization, the maximum oxide thicknesses can be estimated from the given charge values using the modified Faraday’s law:
where Q is the passed charge, C, in C, M(TiO2), 79.9 g mol–1 and ρ(TiO2) = 4.23 g cm–3, molar mass and, ρ~4.3 g cm–3, density of TiO2, and η current efficiency. Using the Equation 1, the theoretical thickness of 0.75 μm and 2.25 μm are calculated. But, Capek et al. [34] determined the oxide thickness of Ti oxide film anodized at 15 V in 1 M H2SO4 of ~40 nm for 15 min and around 70 nm for 45 min of anodization. As pointed out by Prando et al. [40] in 0.5 M H2SO4 for the passed charge of 1 C cm−2 yields an oxide film thickness of about 560 nm in the absence of any parasitic reactions. In our case, the charge is 1.59 C for 15 min, and 4.64 C for 45 min of anodization that corresponds to the thicknesses of 0.890 μm and 2.6 μm, which is in good agreement with the thickness determined using Equation 1.
On the other hand, the anodization process in acidic media proceeds via an overall simplified reaction:
Ti + 2H2O = TiO2 + 4H+ + 4e–
Zhang et al. and Sul et al. [41,42] give some more probable mechanisms for the anodization of Ti that include the formation of non-stoichiometric hydrated TiO2-x(OH)2x via the following plausible reactions:
the product of hydrolyses could be metatitanic TiO(OH)2, orthotitanic H4TiO4, pyrotitanic H2Ti2O or H2TiO3 acid, and so forth.
Ti = Ti4+ + 4e–
Ti4+ +(4-x)H2O = TiO2-x(OH)2x + 4H+
or:
Ti4+ +4H2O = Ti(OH)4 + H2
Ti(OH)4 = TiO2-x(OH)2x + (2-x)H2O
However, in addition to the reactions described by Equation 2, alternative processes such as oxygen evolution may also occur. Moreover, Ti3+ can form a soluble hydrated complex, [Ti(H2O)]63+ [43,44], which can significantly reduce the current efficiency.
2H2O = 4H+ + O2 + 4e–
Ti + 6H2O = [Ti(H2O)]63+ + 3e–
Hence, we chose a different approach to estimate formed oxide thickness. Assuming that TiO2 without UV light could be treated as an insulator, the Ti and solution can represent the conducting plates of the capacitors, and knowing that the capacitance is:
and that theoretically ideal capacitance is frequency independent. But in the electrochemical measurements, the impedance of the capacitance is frequency dependent according to:
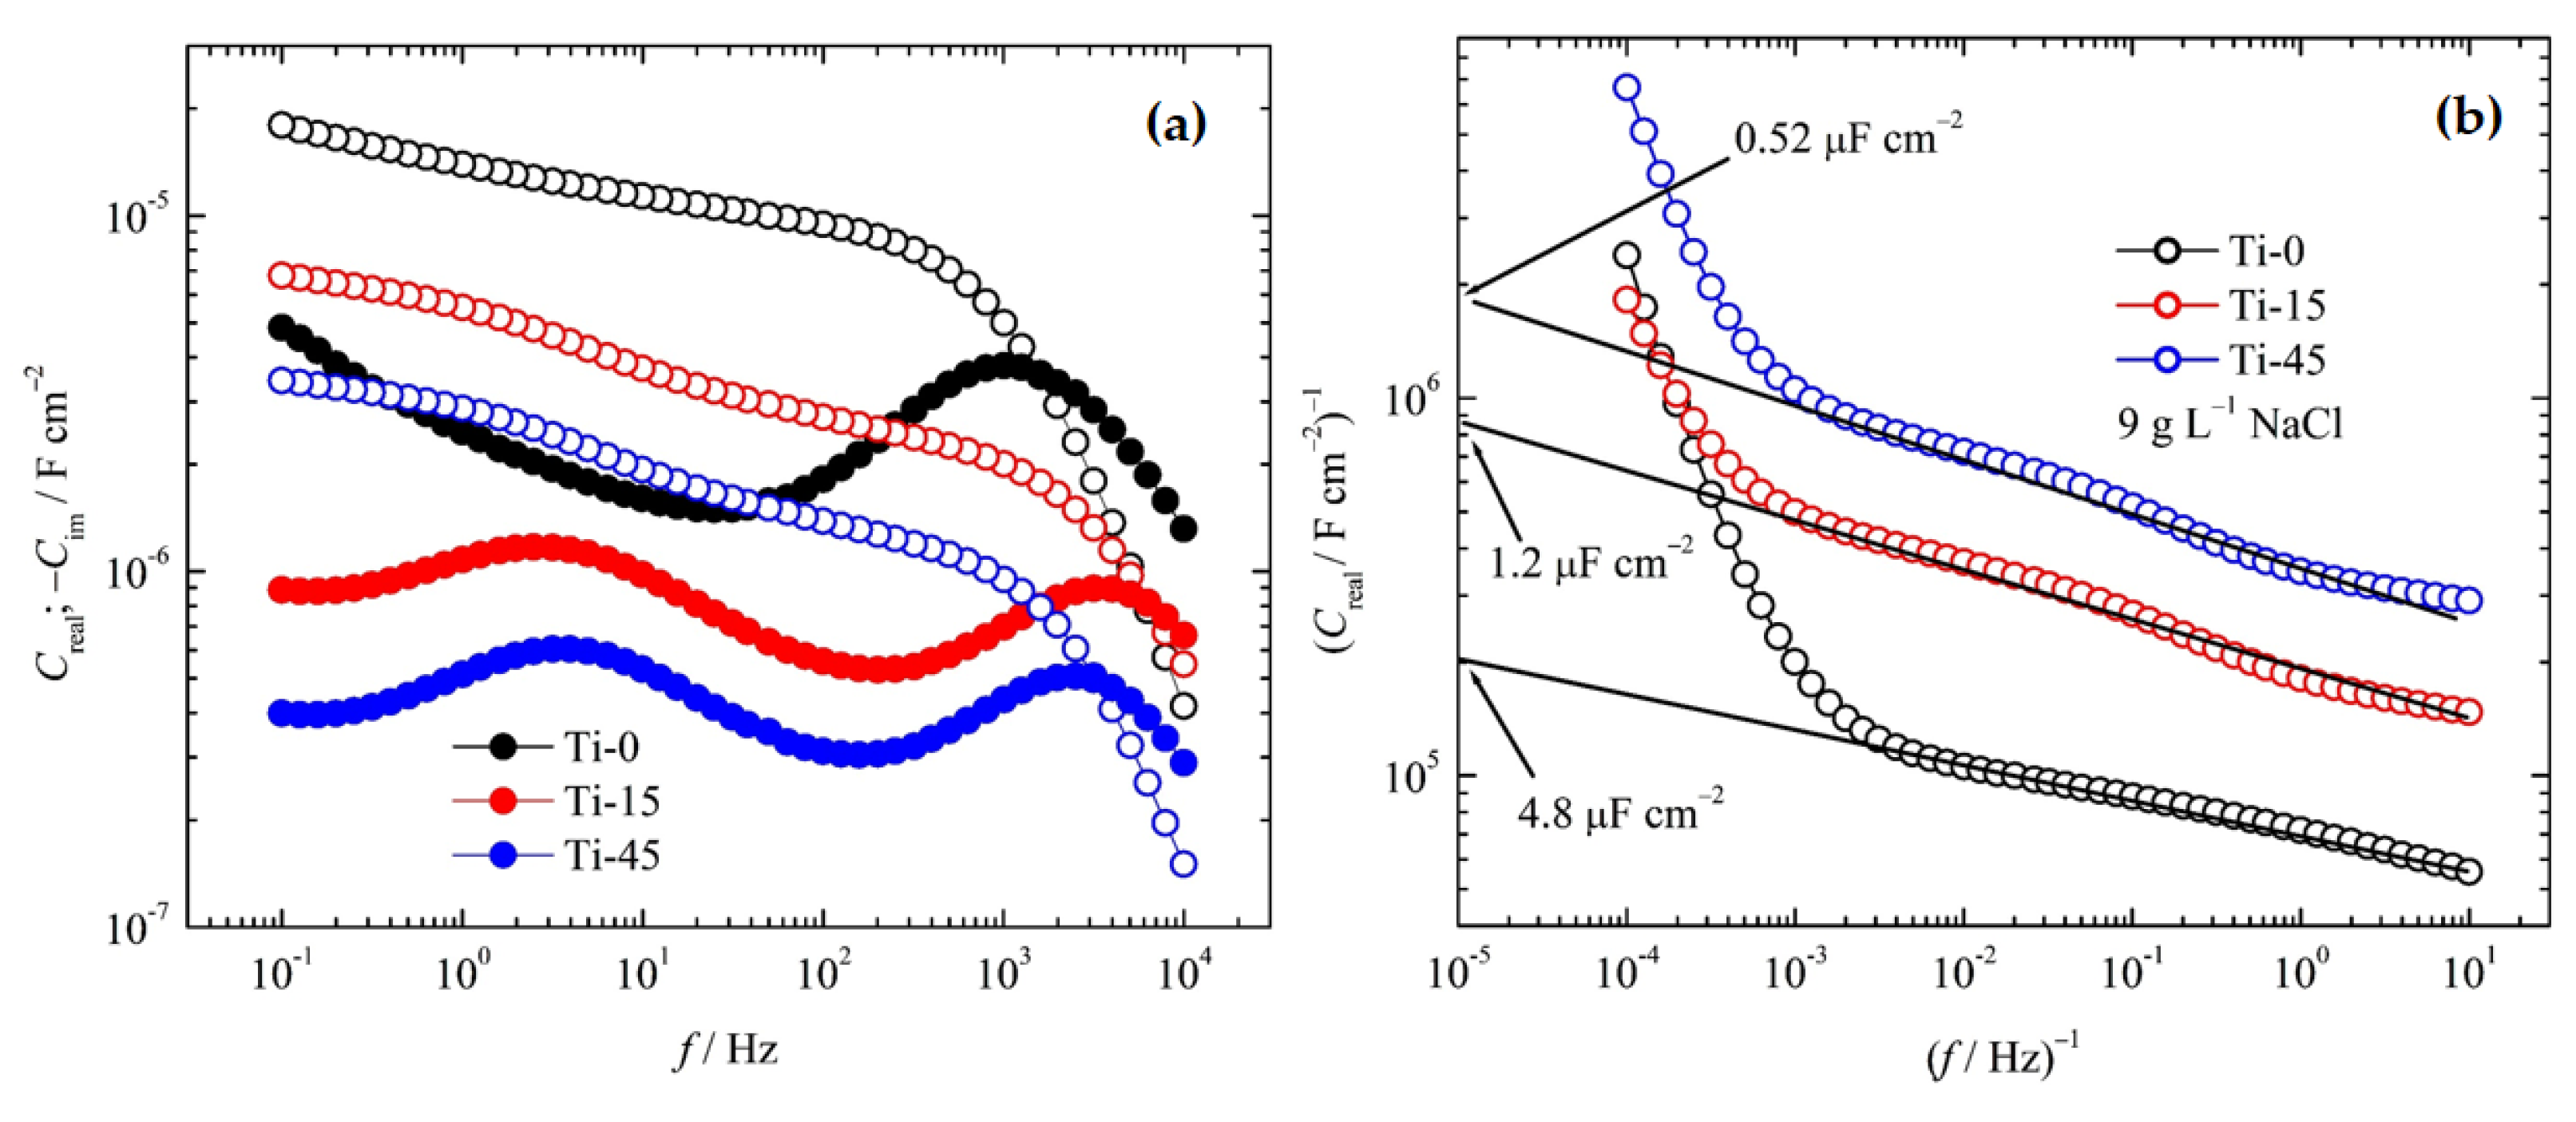
Consequently, in Figure 2a, the dependence of real and imaginary capacitance over the logarithm of the frequency at open circuit potential are shown. It should be noted that the Ti-0 imaginary part shows only one time constants at 1000 Hz, while, Ti-15 and Ti-45 show two time constants, at 3800 Hz and 2500 Hz, and at 1.2 Hz and 4.2 Hz, respectively. This could be interpreted as the existence of naturally formed and electrochemically grown oxide films. The real capacitance part, Figure 2a, significantly increases from high to medium frequencies, and then much slower to low frequencies. At high frequencies, the data is not unreliable, due to the occurrence of electrochemical double layer, parasitic capacitances, etc. So, if we look at the real part of Equation 8, it can be written as:
or
Representing log (Creal)–1 over the log (f)–1, in the case when f → ∞, log (f)–1 → 0, Equation 12 becomes:
therefore impedance becomes reciprocal capacitance. Because all the slopes are practically parallel, we can suppose that 100 kHz could be taken as infinitive, and the determined capacitances for Ti-0, T-15, and Ti-45 are 4.8 μF cm–2, 1.2 μF cm–2 and 0.52 μF cm–2, respectively. It is known from the literature that the thickness, d, of naturally formed oxide on Ti and its alloys, is around 10 nm (1×10⁻⁶ cm) [2,45]. From Equation 9, it can be calculated the constant of the film thickness, k:
and the estimated value of k is 4.7x10⁻¹², nm F cm–2. Consequently, the thickness of the anodized samples can be calculated by dividing constant k with capacitance. For Ti-15, the estimated thickness is ~40±15 nm, and for Ti-45 is 90±30 nm which is in excellent agreement with the experimentally determined value by Capek et al. [34]. Accordingly, it can be concluded that the current efficiency for anodization is very low, as was also observed by Prando et al. [40]. For example, under the galvanostatic oxidation of Ti with a current density of 5 mA cm–2, the current efficiency was <10%.
Figure 2.
(a) The dependence of real capacitance (open symbols) and imaginary capacitance (full symbols) over frequency. (b) The dependence of the reciprocal values of the real capacitance over the reciprocal value of frequency.
Figure 2.
(a) The dependence of real capacitance (open symbols) and imaginary capacitance (full symbols) over frequency. (b) The dependence of the reciprocal values of the real capacitance over the reciprocal value of frequency.
3.1.2. Color Measurements
In Figure 3 the images of the Ti samples are shown. It can be seen that the nonoxidized sample had a grey color, the anodized sample during 15 min uniform dark green, and the sample anodized for 45 min dark purple. But considering that the color appearance is dependent on the spectator’s eye, the color is determined by spectrophotometry.
The results of the color measurements, as well as the approximate color appearance of the samples, are shown in Table 2. The L*a*b* values of the untreated sample correspond to a predominantly neutral gray tone, with a slight yellow tint. The L* coordinate (brightness) decreases with the duration of electrochemical anodization, so the sample becomes darker as the oxide layer becomes thicker. The a* coordinate values (red-green) increase with the duration of anodization, i.e., shift towards the red end of the color axis. However, the values of the b* coordinate (yellow-blue) decrease more for the sample anodized for 15 minutes, compared to the sample anodized for 45 min, resulting in a greenish appearance of the Ti-15 sample and a reddish appearance of the Ti-45 sample. The approximate color appearance calculated from the obtained parameters is in good agreement with the images given in Figure 3.
3.1.3. EDS and SEM Analysis
Figure 4a and d, shows EDS spectra for Ti-0 and Ti-45, taken from SEM images shown in Figure 4b and e. The determined compositions are for Ti-0 98.4 wt.% of Ti and 7.1 wt.% of O, while for Ti-45, 81.5 wt.% of Ti and 18.5 wt.% of O. This clearly indicates that on anodized Ti oxide film is formed. At low magnifications, in Figure 4b and e, the homogenous surface can be observed, with the appearance of small black dots. The black dots observed on the polished Ti surfaces in SEM images often indicate the presence of surface imperfections or embedded particles. These imperfections can be due to the soft and ductile nature of Ti that are easily deformed by abrasive particles during grinding and polishing processes. Embedded particles could originate from grinding with SiC abrasive papers [46]. At higher magnifications, Figure 4c and f, practically did not show significant differences. The matrix Ti material during grinding and polishing is mainly removed in the ductile mode. Typically, the flaws that occur in the surface layer can be categorized into the following groups: (i) voids and micro-cracks, (ii) fractures or crushed areas, (iii) pulled-out sections, and (iv) smearing [47].
Converting wt.% to at.%, Table 3, it can be seen that oxygen content significantly increases after anodization, from 17.8 at.%. to 40.5 at.%. But, from the manual of Oxford Instruments for used EDS detector, the penetration depth of rays at 20 kV is ~1 μm, so the titanium content originated also from the bulk of materials.
3.1.4. XRD Analysis
X-ray patterns of the titanium sheet before and after anodization are presented in Figure 5. The diffractograms follow the symmetry of the α-Ti phase, a hexagonal close-packed (hcp) structure. No additional peaks associated with the crystalline oxide phase are observed after anodization. XRD cannot confirm the presence of titanium oxide due to its low crystallinity and/or thin layer.
The Le Bail whole pattern decomposition method [48] is used to calculate the lattice parameters (Table 4). The fit is done in a hexagonal space group P63/mmc. Lattice parameters of pristine titanium are in agreement with the literature data (PDF# 00-089-2762). There is a slight decrease in lattice parameters after anodization. This can be related to the surface effect and the formation of an oxide layer. Namely, before anodization, the X-rays came from the surface of the titanium sheet, while after anodization, they penetrated through the oxide layer before coming off the bulk metal. The surface may experience more strain, leading to a slight expansion of the lattice compared to the interior of the metal. Khadiri et al. [30], also did not observe crystalline structure by anodizing cpTi in 5 M H3PO4 in the voltage range from 20 V to 35 V. Also, the small anatase peaks are detected in 1 M H2SO4 only at 50 V. [49]
3.1.5. XPS Analysis
X-ray Photoelectron Spectroscopy (XPS) measurements are used to determine the elemental composition and oxidation states of the surface of the samples. Figure 6 displays the XPS survey spectra for two titanium-containing samples Ti-0 and Ti-45. Both spectra show the presence of titanium (Ti), oxygen (O), and carbon (C), with no detectable impurities. The carbon signal is most likely due to surface contamination from organic compounds adsorbed from air during sample preparation, handling, or storage. The increase of peaks connected with Ti and O is significant for the anodized sample. The calculated at.% of Ti and O for the sample Ti-0 is 37.6 at% Ti and 62.4 at.% O, That correspond to stoichiometry of ~Ti0.4O0.6 that could represent ~Ti2O3 phase, but is deficient in oxygen for formation of TiO2. For the anodized sample, Ti-45, the composition is 23.7 at.% Ti and 76.3 at.% O, so the O to Ti ratio is 3.2 indicating complex stricture of the formed oxide film.
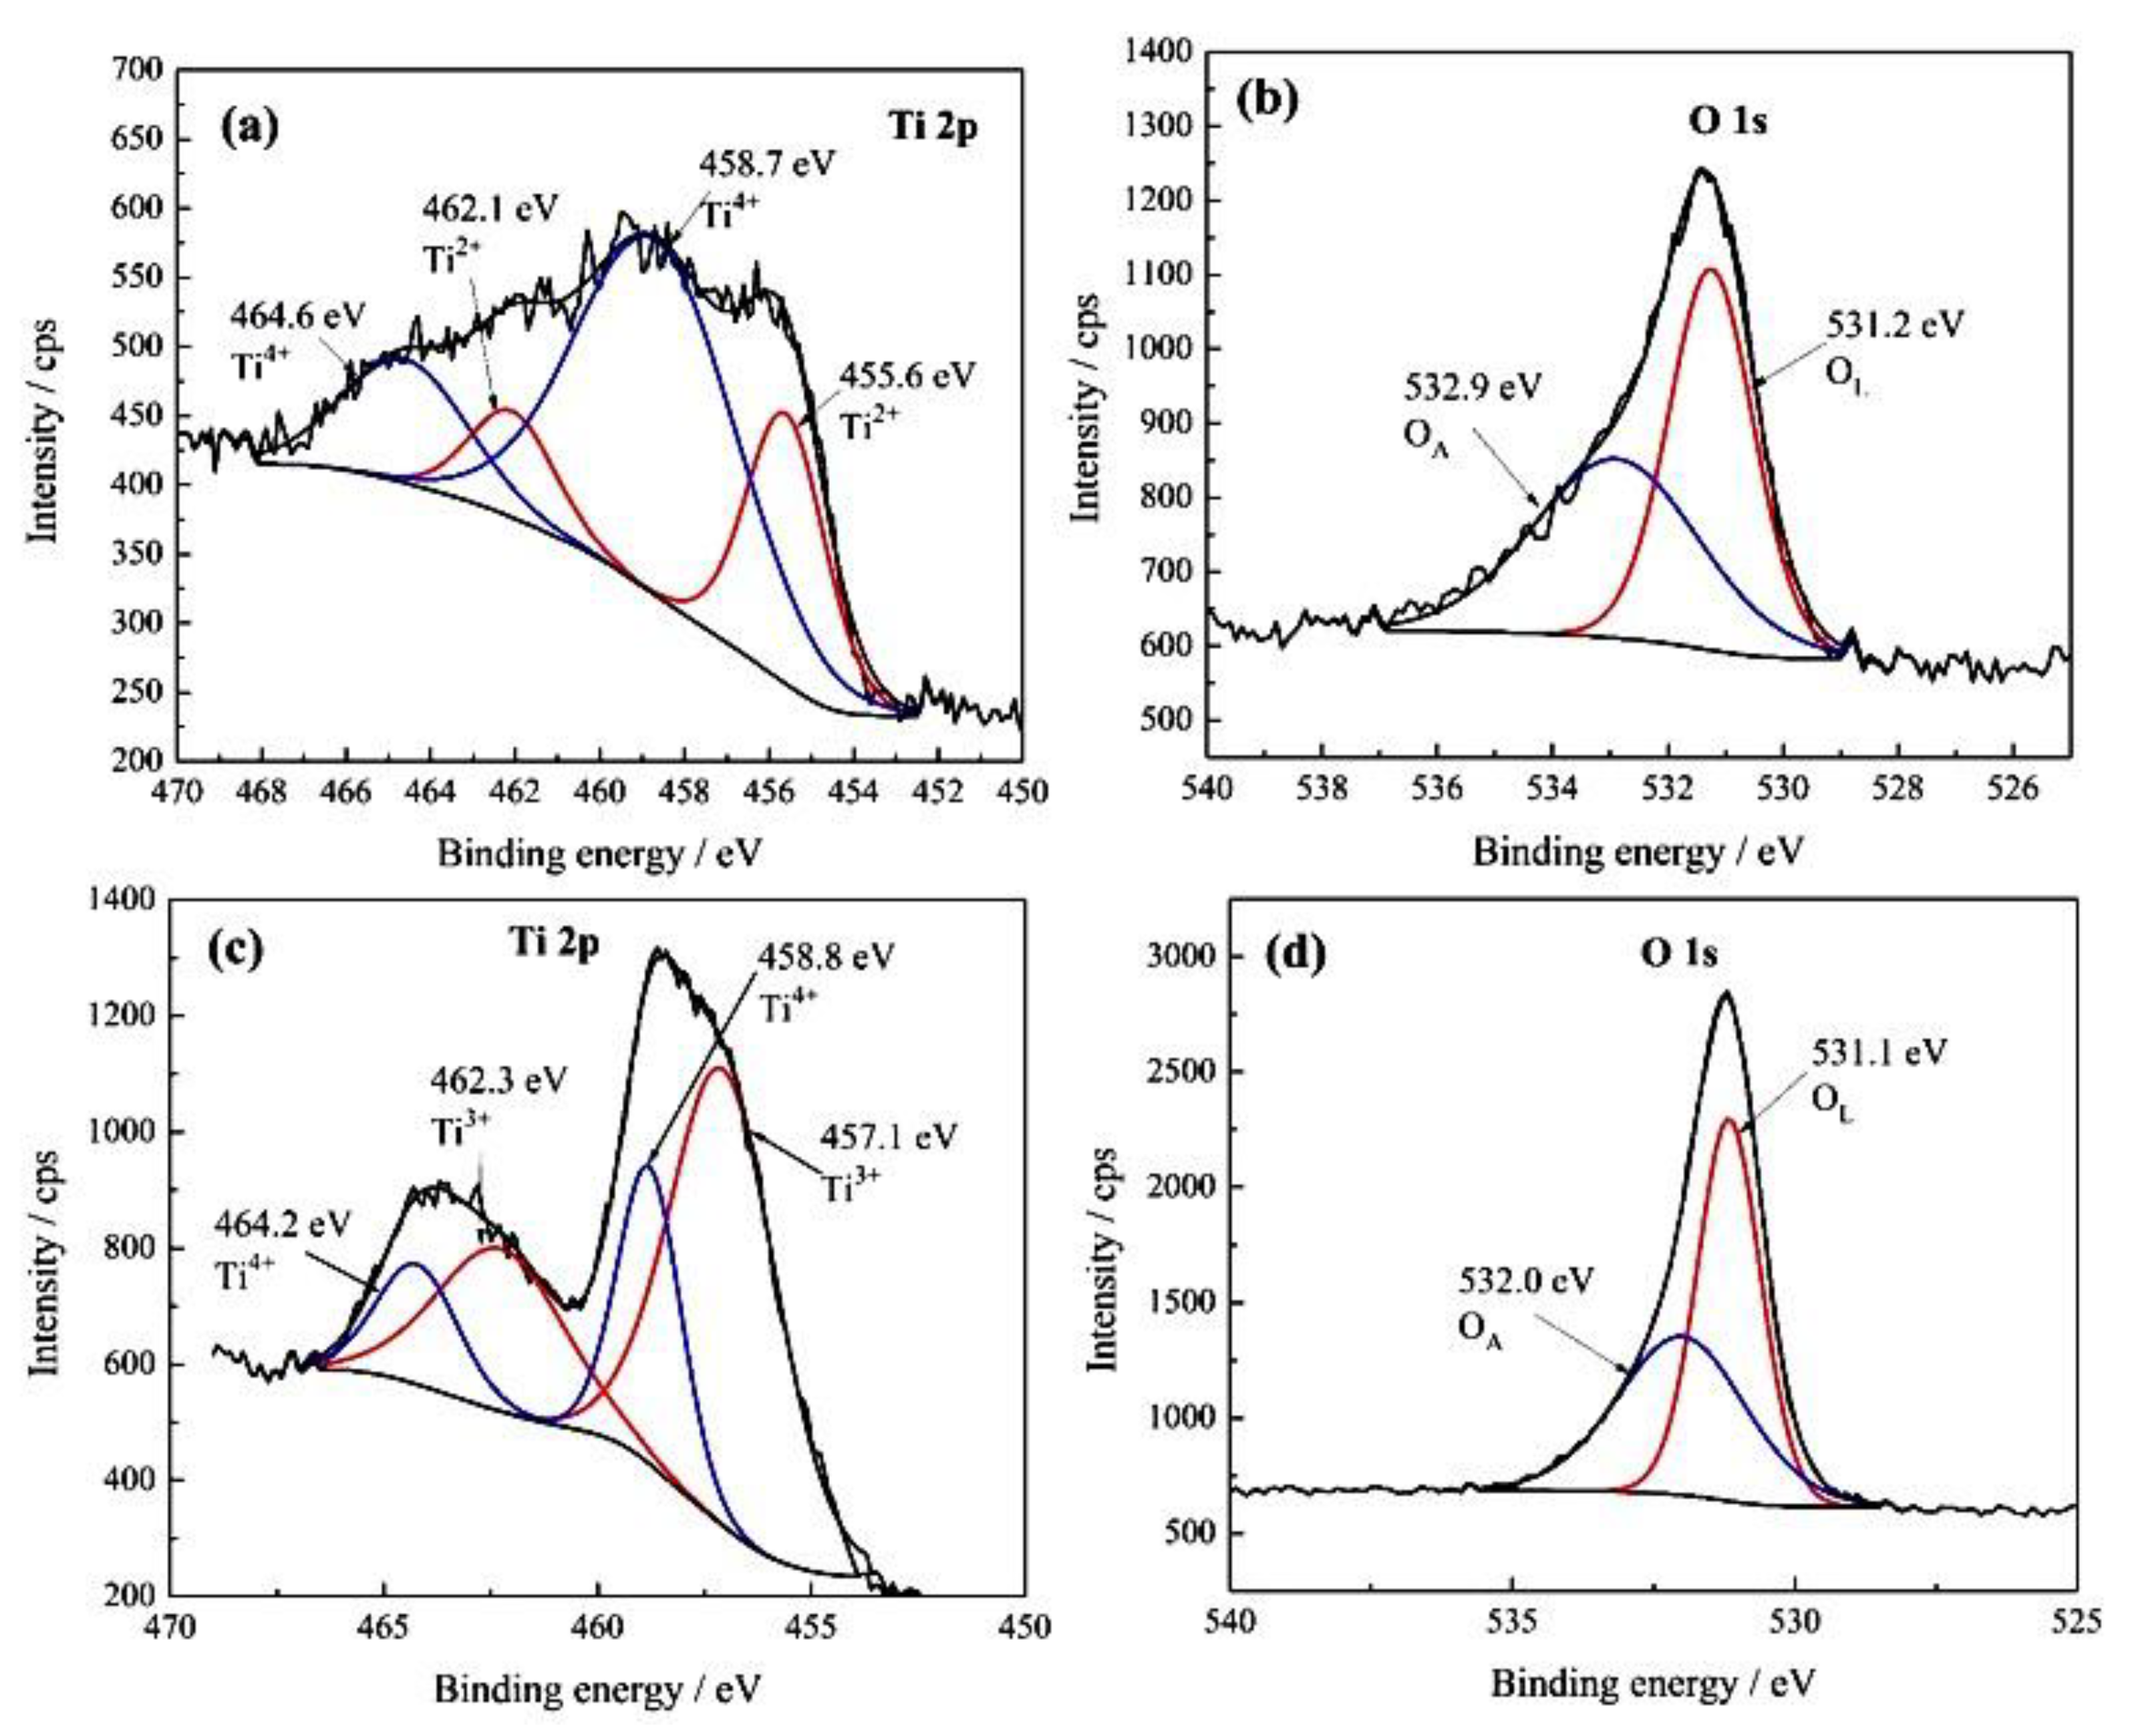
High-resolution XPS spectra of the Ti 2p and O 1s regions for two titanium-containing samples are shown in Figure 7. In the Ti 2p spectrum for Ti-0 (Figure 7a), peaks at 455.6 eV and 462.1 eV can be attributed to Ti4+, while additional peaks at 458.7 eV and 464.6 eV are assigned to Ti2+ [50]. The presence of Ti4+ is characteristic of titanium dioxide (TiO2), where titanium is in its fully oxidized state. In contrast, the Ti2+ component indicates a more reduced titanium species, consistent with Ti-0. The coexistence of these oxidation states suggests a mixed valence system, likely resulting from oxygen deficiency, non-stoichiometry, or surface reduction. The corresponding O 1s spectrum for Ti-0 (Figure 7b) exhibits two primary components. A peak at 531.2 eV corresponding to lattice oxygen (O2−) within the titanium oxide structure, and a higher binding energy peak at 532.9 eV, attributed to adsorbed oxygen-containing species such as hydroxyl groups, molecular water, or carbonates present on the surface [50].
Spectra of Ti 2p for Ti-45 (Figure 7c) shows a doublet. Peaks at 457.1 and 462.3 eV can be assigned to Ti3+ oxidation state, while the peaks at 458.8 and 464.2 eV can be attributed to Ti4+ oxidation state. Ti3+ is commonly associated with compounds like Ti2O3, where titanium exists in an intermediate oxidation state. The combination of Ti3+ and Ti4+ suggests an even more reduced sample compared to the previous, possibly indicating a sub-stoichiometric oxide or a surface rich in oxygen vacancies [50]. For Ti-45, its O 1s spectra (Figure 7d) also contain two peaks at 531.1 and 532.0 eV, which can be ascribed to lattice and adsorbed oxygen, respectively. The relative B.E. position of this adsorbed oxygen peak varies between the samples, reflecting differences in surface reactivity, hydration, or contamination between them.
Figure 7.
High-resolution XPS spectra of a) Ti 2p for Ti-0, b) O 1s for Ti-0, c) Ti 2p for Ti-45, and d) O 1s for Ti-45.
Figure 7.
High-resolution XPS spectra of a) Ti 2p for Ti-0, b) O 1s for Ti-0, c) Ti 2p for Ti-45, and d) O 1s for Ti-45.
3.2. Corrosion Measurements
Figure 8a shows the dependence of the open circuit potentials, Eocp, of the investigated electrodes in 9 g L–1 NaCl. The anodized samples show some small increase of the potential after the immersion in the electrolyte from ~0 V to 75 mV. In contrast, pure Ti shows a significant nonlinear increase of the open circuit potential over time, from –0.375 V to ~0 V. The polarization resistance, Rp, for the pure sample gradually increases from ~50 kΩ cm–2 to 250 kΩ cm–2, as can be seen from Figure 8b. The anodized sample shows the initial decrease of the polarization resistance and stabilizes around 2.0 MΩ cm–2 for Ti-15 and 3.5 MΩ cm–2 for Ti-45. Such behavior could be explained as follows. The naturally formed oxide film on pure Ti is likely inhomogeneous. Upon contact with the electrolyte, the solution penetrates through its pores and reacts with the underlying Ti surface, forming additional oxide. This process leads to an increase in open circuit potential and polarization resistance. In contrast, for the anodized samples, the electrolyte initially fills the pores of the oxide layer, which results in a temporary decrease in the film’s polarization resistance.
The anodic linear polarization curves of the investigated samples are shown in Figure 9. The pure Ti shows some increase of the current density already at the potential of ~0.150 V in the range from 5 μA cm–2 to 10 μA cm–2, followed by an additional increase of the current density above 1 V. Rapid increase of the current density is observed above potentials of ~1.3 V. Anodized samples, did not shows any feature below ~1.35 V, where increase of the current is observed. It should be mentioned that rapid increase in the current density are at significantly higher potentials than the thermodynamic potential for oxygen evolution reaction:
4H2O = O2 + 2OH– + 4e–
of 0.548 V vs. SCE at pH 7.4.
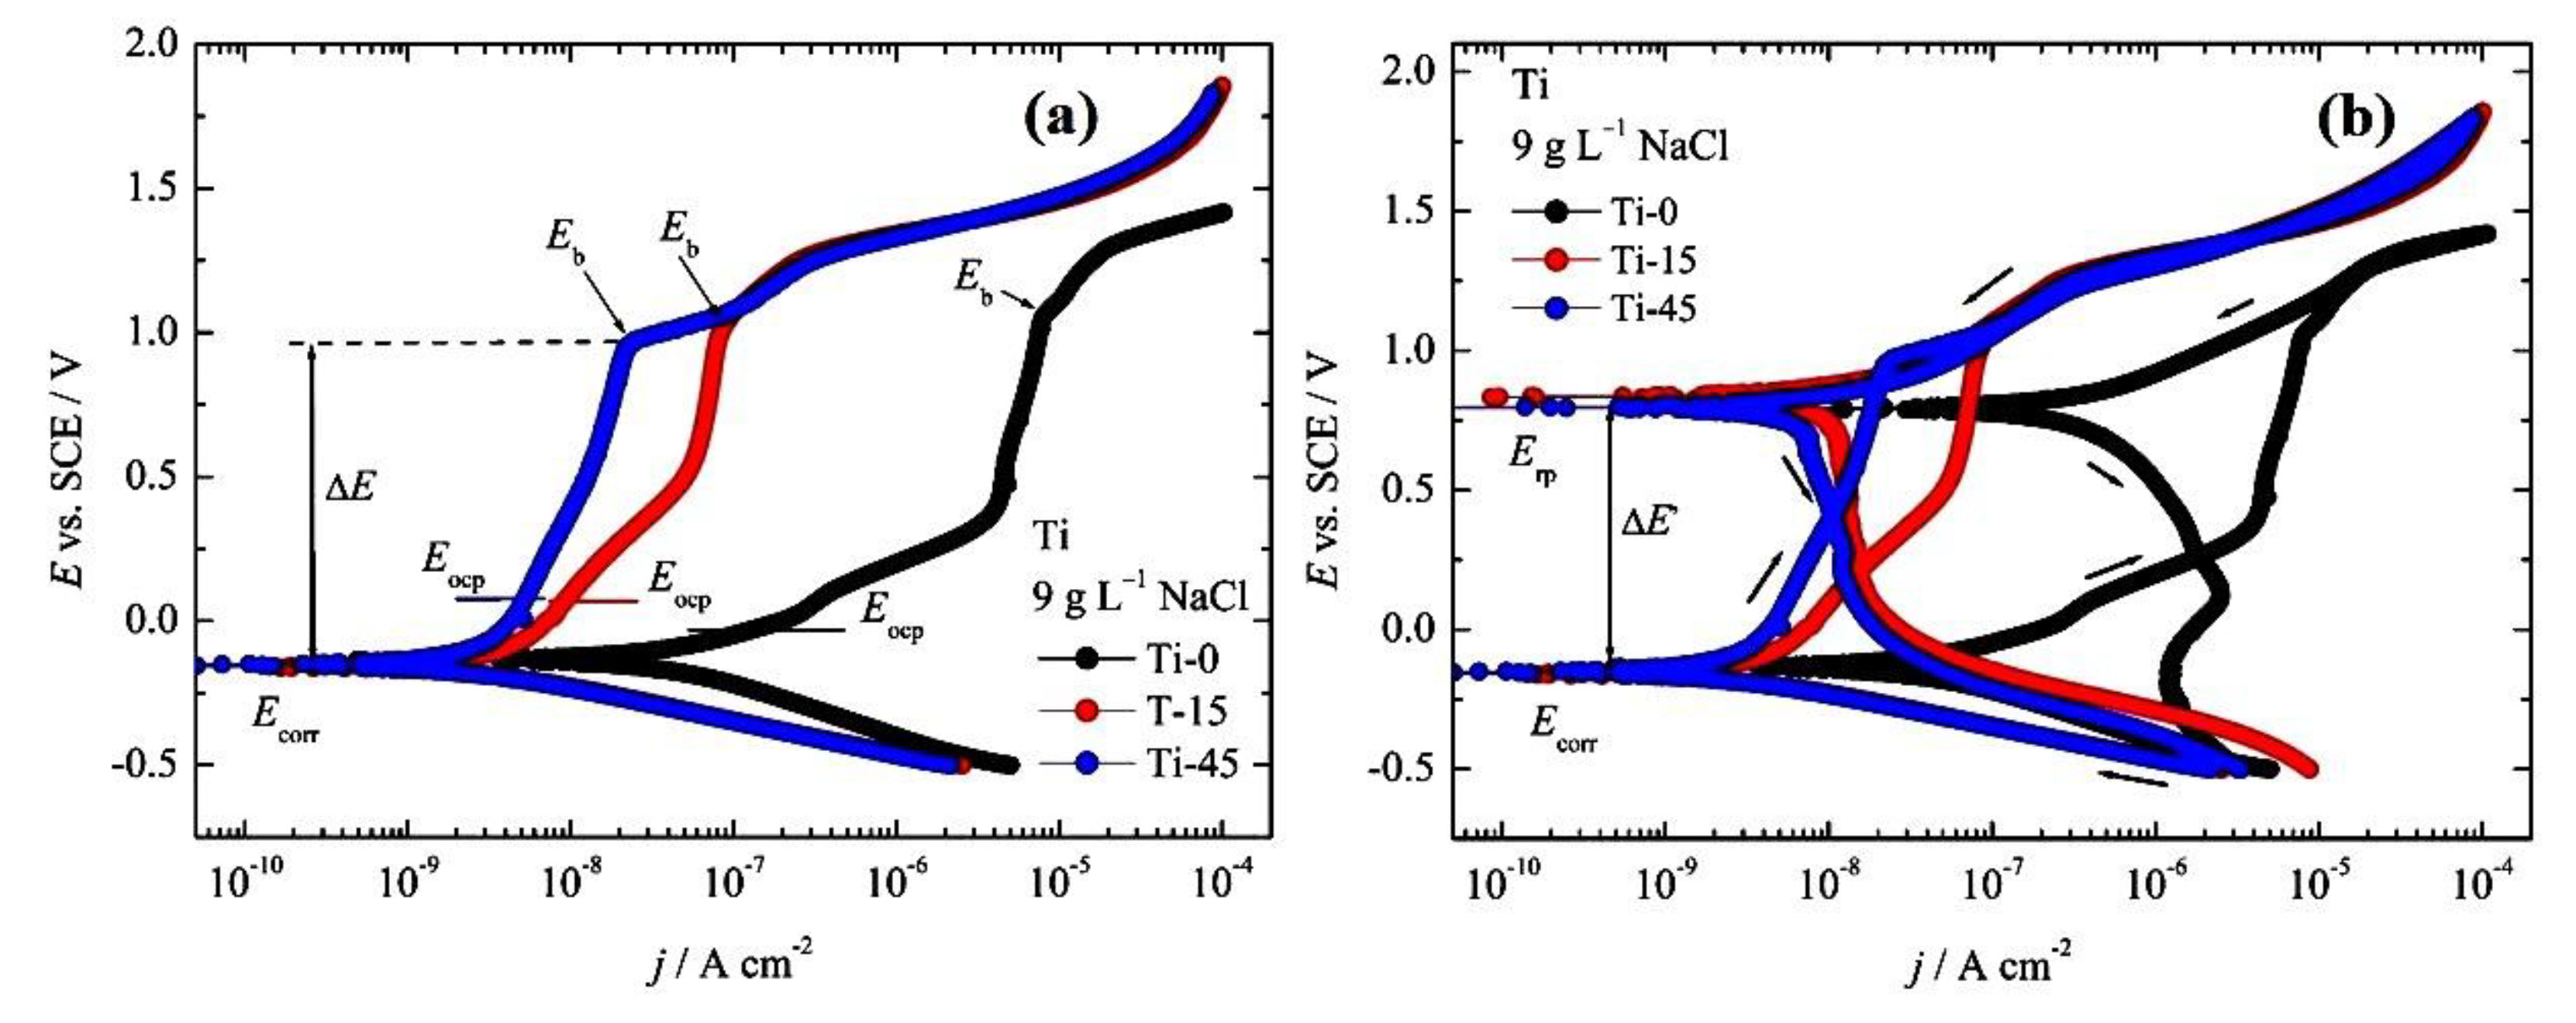
In Figure 10a the Evans diagram of investigated pure and anodized samples is shown. Starting from –0.5 V the linear part of the cathodic pat of the polarization curves over two magnitudes of current density are observed. The slopes of the line ranging from –177 mV dec–1 for pure Ti and ~ –115 mV dec–1 for anodized samples could be associated with Tafel behavior, most probably with oxygen reduction reaction (ORR). Increasing potential practically means that the same corrosion potentials are reached at around –0.15 V. The pure Ti does not form a passive film near the corrosion potential, but active dissolution occurs up to the potentials of 0.3 V when passive behavior is reached. Breakdown potential occurred at ~0.97 V. Anodized samples show similar behavior in the cathodic branches, but after reaching the corrosion potentials practically passivity begins. Before reaching the breakdown potential Ti-15 in the passive range show some increase in the current that could be associated with changes in the oxide film structure. Researchers often express a metal pitting resistance, labeled Rpit, with the equation Rpit = ΔE = |Ecorr – Epit|. The gap between Ecorr and Epit shows how easily pitting can start on that surface [51]. When ΔE is very small, the material becomes more vulnerable; and tiny shifts in potential push the metal toward severe pitting. In our case ΔE is higher than 1 V, indicating excellent resistance to the pitting corrosion. From the intercept of the cathodic Tafel lines and corrosion potentials, the corrosion current densities are estimated. To determine whether the samples undergo repassivation after the breakdown potentials, cyclic polarization curves are recorded and presented in Figure 10b.
It can be seen that after reaching ~100 μA cm–2, the reverse scan is recorded, and interestingly, for all three samples hysteresis, characteristics for pitting corrosion are not observed [51]. Also, in the passive region, the occurrence of metastable pitting is not observed. Thus it is plausible that instead of the pitting corrosion, oxygen evolution occurs. Repassivation of all three samples occurred at practically the same potentials of ~0.8 V.
Figure 10.
(a) The Evans diagram, and (b) The cyclic polarization curves, of the investigated pure and anodized samples in 9 g L–1 NaCl.
Figure 10.
(a) The Evans diagram, and (b) The cyclic polarization curves, of the investigated pure and anodized samples in 9 g L–1 NaCl.
All the determined corrosion parameters are summarized in Table 5. The open circuit potential after one hour is 0 V for Ti-0, 69 mV for Ti-15, and 75 mV for Ti-45, indicating that the delicate balance between oxygen reduction reaction (ORR) and dissolution of base metals or oxides exists. When the overpotential, η, is minimal (±10 mV) and the electrochemical system is in a state of equilibrium, the traditional Stern-Geary equation for the polarization resistance, Rp, can be expressed with the equation:
from which current densities can be estimated. From Table 5. it can be seen that the calculated current density, jp,c, at open circuit potentials, is in very good agreement with values of jocp determined from Figure 10a. It is worth mentioning that for the blank Ti samples jocp is more than an order of magnitude higher than for anodized samples. Determined corrosion potentials, Ecorr, are more negative than open circuit potentials, which could be explained that under cathodic polarization, a delicate balance between ORR and corrosion reactions is disturbed. Corrosion current density, jcorr, determined by Tafel extrapolation is also an order of magnitude smaller for anodized than for pure Ti. Passive currents show tremendous improvement for the anodized sample. For pure Ti, passive current density is in the range of ~5.5 μA cm–2, while for Ti-15 is in the range of 7-80 nA cm–2, and for Ti-45 in the range of 4-20 nA cm–2. The breakdown potentials for all samples are higher than 1 V. An interesting discussion about breakdown potential is elaborated by Rosenbloom et al. [35]. Authors relying solely on in vitro tests have developed conservative acceptance criteria, which could be applied broadly to all materials tested according to ASTM F 2129-12. This benchmark stems from published in vivo measurements showing that most in vivo biological resting potentials lie below roughly +0.3 V vs. SCE. Any component destined for living tissue must tolerate potentials higher than those normally reached in the body. Because a single corrosion failure may have severe clinical and financial effects, adding an extra safety margin is only practical. For these reasons, authors conclude that a material demonstrating breakdown potential at, or above, +0.6 mV vs. SCE can reasonably be regarded as corrosion-safe for medical use. Therefore all our samples satisfied these recommendations.
Among the determined corrosion parameters shown in Table 5, in Table 6 determined corrosion parameter, required from ISO 10271 is given.
From Table 5 and Table 6, it is obvious that anodized samples possess superior corrosion properties than pure Ti.
3.2.3. SEM and EDS Analysis After Corrosion
After the cyclic polarization test, pure Ti and anodized Ti during 45 min are investigated by EDS and SEM.
Comparing the result of EDS analysis before cyclic polarization, Table 3, and after polarization, Table 7, it can be observed that, for pure Ti, there is a slight decrease in Ti content from 82.2 at.% to 78.0 at.%, accompanied by an increase in O content from 17.8 at.% to 22.0 at.%, indicating an increase in oxide thickness during polarization. In contrast, for Ti-45, the Ti content slightly increases from 59.5 at.% to 61.0 at.%, while the O content decreases from 40.5 at.% to 39.0 at.%, suggesting a different surface behavior during polarization. This could be explained by the slight dissolution of Ti through oxide pores, reaction with oxygen, OH– and Cl–, and formation of unstable TiOCl2 that immediately hydrolyze and form TiO2 onto the surface. The small white spots that are visible in Figure 11f, could be the formed TiO2 that explains the increase of the oxygen in EDS. Also, from Figure 11b and e, can be seen that the black spots visible in Figure 4b and e, for pure Ti are practically completely removed, but for Ti-45 are still slightly visible, probably due to occlusion with oxide film formed during anodization. Also from SEM analysis, it can be concluded that pitting corrosion does not occur and that after the breakdown potentials, only an oxygen evolution reaction occurrs.
3.3. Biocompatibility
3.3.1. MTT Assay
The mitochondrial activity of oral fibroblasts seeded on Ti samples and cultured for 7 days is approximately equal to the control in the Ti-15 group (98.6%), and significantly higher in the Ti-45 group (123.9%), Figure 12.
3.3.2. Gene Expression
The relative gene expression of molecules involved in cell adhesion and vascularization is analyzed after 7 days of culturing HGF on the samples, Figure 13. N-cadherin and Vimentin are significantly upregulated in both experimental groups, Ti-15 and Ti-45. In contrast, VEGF-A expression is downregulated in the experimental groups compared to the polished Ti surface.
3.3.3. Wettability
The contact angle measurements of reference liquids of samples are presented in Table 8. Comparing the contact angle measurements between groups (polished Ti, 15 min, and 45 min anodized Ti) the Kruskal-Wallis test showed that anodization has a statistically significant effect on the decrease of contact angle, p=0.019.
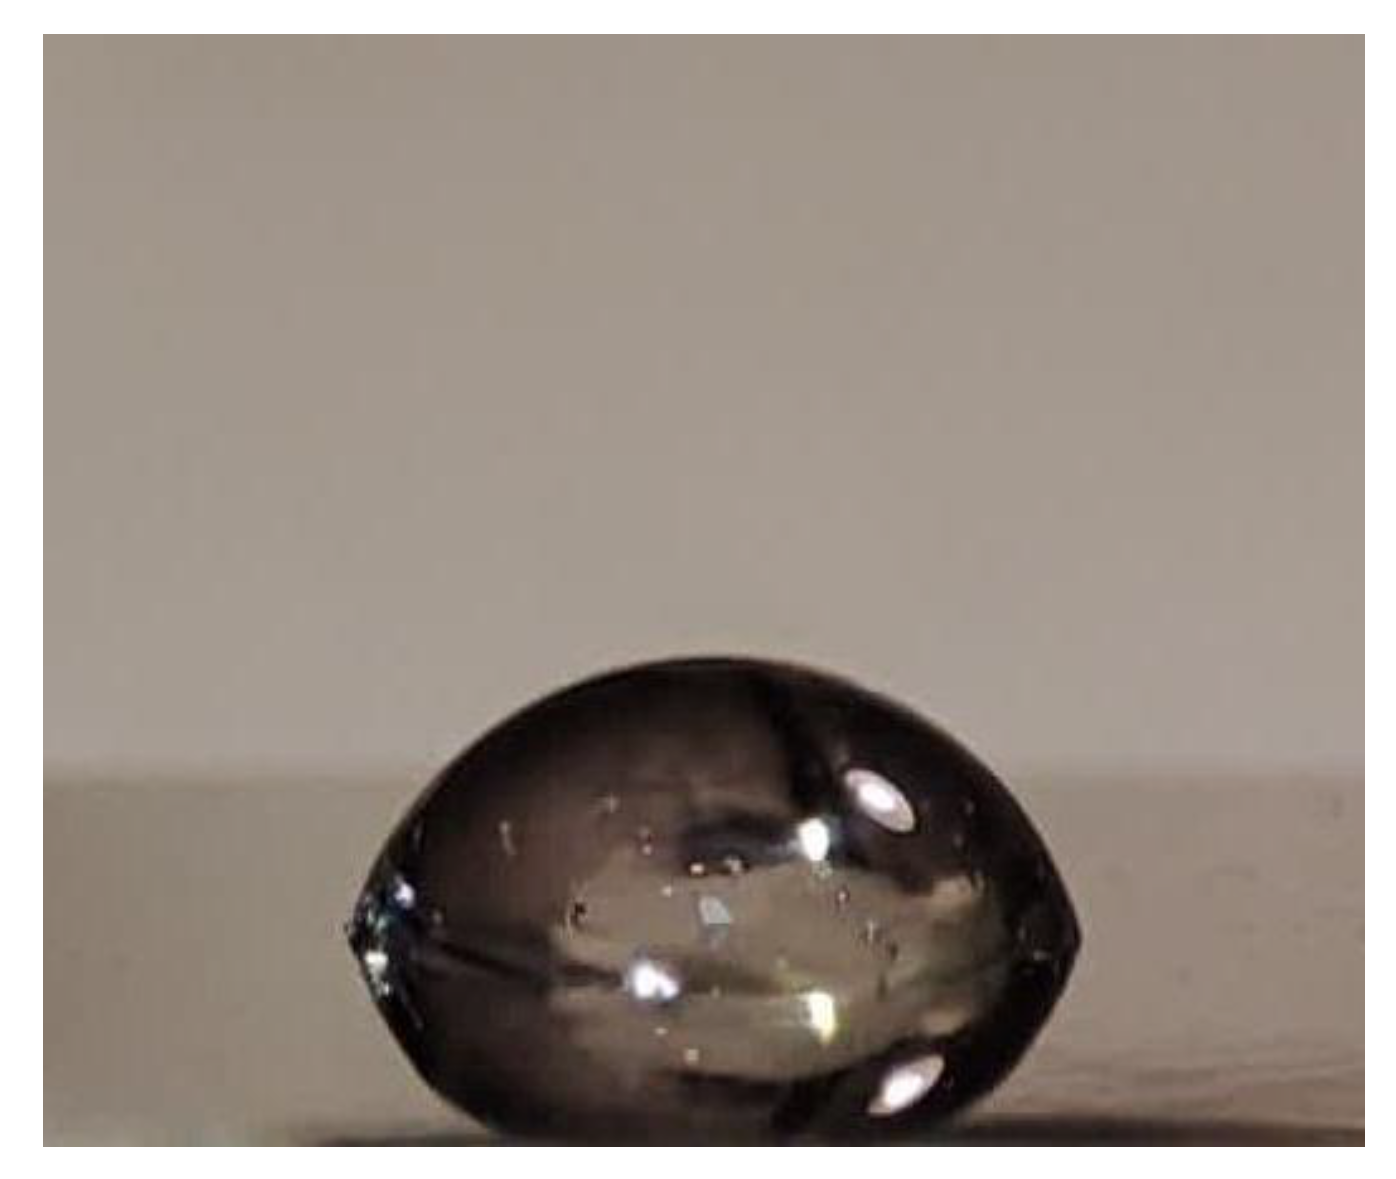
Figure 14.
Example of a contact angle for Ti sample with a moderate wettability.
3.3.4. Biological Activity
Results of several in vitro studies demonstrated that anodized titanium expressed increased levels of cell proliferation and maturation [18,20,52].
N-cadherin is considered one of the main factors in guiding cell-to-cell interactions during fibroblast differentiation, as it is well-documented that N-cadherin regulates the formation and renewal of junctions through the cell’s microtubule network [53]. Our results showed a statistically higher expression of this gene, which indicates the potential for greater tissue deposition on the titanium implant surface. Similar results were confirmed in previous research [19].
As far as ECM Vimentin protein, the results were similar. Vimentin is engaged in cell-matrix adhesion, both with cell spreading and migration. It has been reported that it successfully regulates the directional migration of fibroblasts [54]. Our results demonstrated that the anodization process could increase the ability of fibroblasts to spread on an anodized titanium surface, statistically significant in comparison to machined and polished titanium.
In contrast, the results revealed a different expression pattern for VEGF-A. Previous research has shown that VEGF-A, a key pro-angiogenic factor during wound healing, is primarily produced in response to hypoxic conditions [55]. Downregulation of VEGF-A in our experimental samples could be explained by changes in surface chemistry after anodization. It is assumed that the surface oxide layer formed during oxidation in sulfuric acid would have reduced angiogenesis. Anodic oxidation could stimulate adherent fibroblast cell phenotypes rather than angiogenic. Reduced VEGF-A expression indicates a lack of migratory pro-angiogenic factors, potentially leading to dicreased angiogenesis in initial healing stages. N-cadherin, vimentin, and VEGF-A play distinct but interconnected roles, especially in tissue remodeling, angiogenesis, and fibroblast behavior. N-cadherin and vimentin support fibroblast mobility, structure, and ECM deposition [56,57], while VEGF-A predominantly stimulates endothelial cell proliferation and migration [16]. Anodized titanium surfaces have been reported to upregulate adhesion-related proteins in human gingival fibroblasts, suggesting a phenotypic shift toward extracellular matrix production and structural support. This indicates that titanium surfaces may direct fibroblasts toward tissue remodeling functions rather than promoting angiogenic signaling [58].
In this study, we prepared model surfaces with the anodized substrate to achieve an oxide layer with excellent chemical stability. Titanium oxides with low roughness, produced through oxidation, exhibit low friction, making them suitable for long-term fluid flow and enhanced heat exchange [59,60]. In line with that, these surfaces also promote nonspecific adsorption of proteins, cells, and other biomolecules, which expands their applications, particularly in dental implantology [61]. Moderately hydrophilic surfaces (contact angle around 40°) support optimal cell attachment [62], a trend also observed in studies using polymer thin films with contact angles between 20° and 60° [63]. It is also reported that hydrophilic surfaces can promote cell differentiation [64].
Moreover, hydrophilic behavior is desirable for application as coatings of orthopedic implants, because good wettability promotes better tissue integration [65]. The results of our study justified that anodic oxidation significantly increased the hydrophilicity of the titanium surface.
4. Conclusions
- cpTi is successfully anodized in 1 M H2SO4 at constant voltage of 15 V for 15 and 45 min.
- The thickness of anodized samples are determined by newly developed method by the analysis of frequency dependent capacitance.
- For 15 min anodization the thickness was estimated to ~40±15 nm, and for 45 min 90±30 nm
- From EDS, XRD and XPS analysis it is confirmed that oxide layer is very complex.
- Anodized samples has a superior corrosion stability in 9 g L–1 NaCl than pyre cpTi.
- By the SEM analzsis, after cyclic polarization, it is concluded that all three samples do not undergo pitting corrosion, and that the oxygen evolution reaction is the main one.
- Anodized samples enhances surface hydrophility
- Anodized samples produces a surface-driven stimulation of human gingival fibroblasts by activating their adhesion and spreading mechanisms.
Author Contributions
Conceptualization, B.N.G, A.S.P. and M.M.L;.; methodology, B.N.G, M.M.L., D.M.; validation, B.N.G, A.S.P. and M.M.L; formal analysis, B.N.G, A.S.P., M.M.L and D.M; investigation, , A.S.P., M.M.L, D.M, L.R. D.J. P.Ž. and B.N.G; resources, M.M.L. and B.N.G.; data curation, A.S.P., M.M.L, D.M, L.R. D.J. P.Ž. and B.N.G; writing—original draft preparation, B.N.G, A.S.P., M.M.L and D.M; writing—review and editing, B.N.G, A.S.P., and M.M.L; visualization, B.N.G, A.S.P. and M.M.L; supervision, B.N.G and, M.M.L..; project administration, A.S.P.; funding acquisition, B.N.G.. All authors have read and agreed to the published version of the manuscript.
Funding
This research was funded by Ministry of Education, Science and Technological Development, Serbia, grant number 451-03-137/2025-03/200135
Institutional Review Board Statement
This study was conducted in accordance with the Declaration of Helsinki and approved by the Institutional Review Board of the Faculty of Dental Medicine, University of Belgrade (protocol code 36/7).
Data Availability Statement
Data will be provided on request.
Acknowledgments
We are grateful to Prof. Dr. Maja Radetić, from Department of Textile Engineering from Faculty of Technology and Metallurgy University of Belgrade, Serbia for her help in sample color measurements.
Conflicts of Interest
The authors declare no conflicts of interest.
References
- F.C. Eichmiller.; Titanium applications in dentistry. J. Am. Dent. Assoc. 2003, 134 (3), 347–349. [CrossRef]
- Prando, D.; Brenna, A.; Diamanti, M.V.; Beretta, S.; Bolzoni, F.; Ormellese, M.; Pedeferri, M. Corrosion of titanium: Part 2: Effects of surface treatments. J. Appl. Biomater. Funct. Mater. 2018, 16, 3–13. [CrossRef]
- Long, S.; Zhu, J.; Jing, Y.; He, S.; Cheng, L.; Shi, Z. A comprehensive review of surface modification techniques for enhancing the biocompatibility of 3D-Printed titanium implants. Coatings 2023, 13 (11), 1917. [CrossRef]
- Williams, D. F. Biocompatibility pathways and mechanisms for bioactive materials: The bioactivity zone. Bioact. Mater. 2021, 10, 306–322. [CrossRef]
- Barberi, J.; Spriano, S. Titanium and Protein Adsorption: An Overview of Mechanisms and Effects of Surface Features. Materials, 2021, 14, 1590. [CrossRef]
- Romanos, G. Biomolecular Cell-Signaling Mechanisms and Dental Implants: A review on the regulatory molecular biologic patterns under functional and immediate loading. Int. .J Oral. Maxillofac. Implants. 2016, 31 (4), 939–951. [CrossRef]
- Pandey, C.; Rokaya, D.; Bhattarai, B. P. Contemporary Concepts in Osseointegration of Dental Implants: A review. Bio. Med. Research. International. 2022, 2022, 1–11. [CrossRef]
- Tracy, L.E.; Minasian, R.A.; Caterson, E.J. Extracellular matrix and dermal fibroblast function in the healing wound. Adv. Wound. Care. (New Rochelle) 2016, 5, 119–136. [CrossRef]
- Han, X.; Ju, L. S.; Irudayaraj, J. Oxygenated wound dressings for hypoxia mitigation and enhanced wound healing. Mol. Pharm. 2023, 20 (7), 3338–3355. [CrossRef]
- Gaona-Tiburcio, C.; Jáquez-Muñoz, J. M.; Nieves-Mendoza, D.; Maldonado-Bandala, E.; Lara-Banda, M.; Lira-Martinez, M. A.; Reyes-Blas, H.; Baltazar-Zamora, M. Á.; Landa-Ruiz, L.; Lopez-Leon, L. D.; Almeraya-Calderon, F. Corrosion behavior of titanium alloys (Ti CP2, Ti-6Al-2Sn-4Zr-2Mo, Ti-6Al-4V and Ti Beta-C) with anodized and exposed in NaCl and H2SO4 Solutions. Metals 2024, 14 (2), 160. [CrossRef]
- Almeraya-Calderón, F.; Jáquez-Muñoz, J. M.; Lara-Banda, M.; Zambrano-Robledo, P.; Cabral-Miramontes, J. A.; Lira-Martínez, A.; Estupinán-López, F.; Tiburcio, C. G. Corrosion behavior of titanium and titanium alloys in Ringer ́s Solution. Int. J. Electrochem. Sci. 2022, 17 (7), 220751. [CrossRef]
- Jáquez-Muñoz, J.; Gaona-Tiburcio, C.; Chacón-Nava, J.; Cabral-Miramontes, J.; Nieves-Mendoza, D.; Maldonado-Bandala, E.; Delgado, A.; Rios, J. F.-D. L.; Bocchetta, P.; Almeraya-Calderón, F. Electrochemical corrosion of titanium and titanium alloys anodized in H2SO4 and H3PO4 solutions. Coatings 2022, 12 (3), 325. [CrossRef]
- Milošev, I.; Sačer, D.; Kapun, B.; Rodič, P. The effect of metallographic preparation on the surface characteristics and corrosion behaviour of TI-6AL-4V alloy in simulated physiological solutions. J. Electrochem. Soc. 2024, 171 (11), 111503. [CrossRef]
- Wu, B.; Tang, Y.; Wang, K.; Zhou, X.; Xiang, L. Nanostructured Titanium Implant Surface Facilitating Osseointegration from Protein Adsorption to Osteogenesis: The Example of TiO2 NTAs. Int. J. Nanomedicine. 2022, 17, 1865–1879. [CrossRef]
- Eisenbarth, E.; Velten, D.; Müller, M.; Thull, R.; Breme, J. Biocompatibility of β-stabilizing elements of titanium alloys. Biomaterials 2004, 25, 5705–5713. [CrossRef]
- Zhang, L.; Chen, L. A Review on biomedical titanium alloys: recent progress and prospect. Adv. Eng. Mater. 2019, 21, 1801215. [CrossRef]
- Zhang, Y.; Li, J.; Che, S.; Yang, Z.; Tian, Y. Chemical Leveling Mechanism and Oxide Film Properties of Additively Manufactured Ti–6Al–4V Alloy. Journal of Materials Science 2019, 54, 13753–13766. [CrossRef]
- Vattanasup, C.; Kuntiyaratana, T.; Rungsiyakull, P.; Chaijareenont, P. Color formation on titanium surface treated by anodization and the surface characteristics: A review. Dent. J. 2023, 44 (2), 13–21. [CrossRef]
- Wang, T.; Wang, L.; Lu, Q.; Fan, Z. Changes in the esthetic, physical, and biological properties of a titanium alloy abutment treated by anodic oxidation. J. Prosthet. Dent. 2018, 121 (1), 156–165. [CrossRef]
- Gulati, K.; Prideaux, M.; Kogawa, M.; Lima-Marques, L.; Atkins, G. J.; Findlay, D. M.; Losic, D. Anodized 3D-printed titanium implants with dual micro- and nano-scale topography promote interaction with human osteoblasts and osteocyte-like cells. J. Tissue. Eng. Regen. Med. 2016, 11 (12), 3313–3325. [CrossRef]
- Regonini, D.; Bowen, C. R.; Jaroenworaluck, A.; Stevens, R. A review of growth mechanism, structure and crystallinity of anodized TiO2 nanotubes. Mat. Sci. Eng. R: Rep. 2013, 74 (12), 377–406. [CrossRef]
- Niu, D.; Han, A.; Cheng, H.; Ma, S.; Tian, M.; Liu, L. Effects of organic solvents in anodization electrolytes on the morphology and tube-to-tube spacing of TiO2 nanotubes. Chem. Phys. Lett. 2019, 735, 136776. [CrossRef]
- Kieser, T. A.; Kunst, S. R.; Morisso, F. D. P.; Machado, T. C.; Oliveira, C. T. Anodização de titânio em ácido cítrico. Res. Soc. Dev. 2022, 11 (8), e25311830872. [CrossRef]
- Pilipenko, A.; Maizelis, A.; Pancheva, H.; Zhelavska, Y. Electrochemical oxidation of VT6 titanium alloy in oxalic acid solutions. Chem. Chem. Technol. 2020, 14 (2), 221–226. [CrossRef]
- İzmir, M.; Ercan, B. Anodization of titanium alloys for orthopedic applications. Frontiers of Chem. Sci. Eng. 2018, 13 (1), 28–45. [CrossRef]
- Karambakhsh, A.; Afshar, A.; Ghahramani, S.; Malekinejad, P. Pure commercial titanium color anodizing and corrosion resistance. J. Mater. Eng. Perform. 2011, 20 (9), 1690–1696. [CrossRef]
- Wadhwani, C. P. K.; O’Brien, R.; Kattadiyil, M. T.; Chung, K.-H. Laboratory technique for coloring titanium abutments to improve esthetics. J. Prosthet. Dent. 2015, 115 (4), 409–411. [CrossRef]
- Wadhwani, C.; Brindis, M.; Kattadiyil, M. T.; O’Brien, R.; Chung, K.-H. Colorizing titanium-6aluminum-4vanadium alloy using electrochemical anodization: Developing a color chart. J. Prosthet. Dent. 2017, 119 (1), 26–28. [CrossRef]
- Webster, T. J.; Ross, N. Anodizing color coded anodized Ti6Al4V medical devices for increasing bone cell functions. Int. J. Nanomedicine. 2013, 109. [CrossRef]
- Khadiri, M.; Elyaagoubi, M.; Idouhli, R.; Koumya, Y.; Zakir, O.; Benzakour, J.; Benyaich, A.; Abouelfida, A.; Outzourhit, A. Electrochemical study of anodized titanium in phosphoric acid. Adv. Mater. Sci. Eng. 2020, 2020 (1). [CrossRef]
- Kurniawan, K. F.; Ulfah, I. M.; Kozin, M. Effect of anodic oxidation voltages on the color and corrosion resistance of commercially pure titanium (CP-Ti). Journal of Evrimata. 2023, 18–23. [CrossRef]
- Tamilselvi, S.; Murugaraj, R.; Rajendran, N. Electrochemical impedance spectroscopic studies of titanium and its alloys in saline medium. Mater. Corros. 2007, 58 (2), 113–120. [CrossRef]
- Kumar, A.; Kushwaha, M. K. Surface modification of titanium alloy by anodic oxidation method to improve its biocompatibility. Curr. Sci. 2021, 120 (5), 907. [CrossRef]
- 34 Capek, D.; Gigandet, M.-P.; Masmoudi, M.; Wery, M.; Banakh, O. Long-time anodisation of titanium in sulphuric acid. Surf. Coat. Technol. 2007, 202 (8), 1379–1384. [CrossRef]
- Rosenbloom, S.N.; Corbett, R.A. An Assessment of ASTM F 2129 Electrochemical testing of small medical implants-lessons learned.; NACE, 2007; p. NACE-07674. Available on-line at: https://corrosionlab.com/wp-content/uploads/2024/06/NACE2007.pdf.
- ISO 10271:2009: Dentistry - Corrosion test methods for metallic materials, International Organization for Standardization; Switzerland, Geneva, 2009.
- ASTM F 2129-01:.Standard test method for conducting cyclic potentiodynamic polarization measurements to determine the corrosion susceptibility of small implant devices. West Conshohocken, PA: ASTM International; 2001.
- Grgur, B. N.; Lazić, V.; Stojić, D.; Rudolf, R. Electrochemical testing of noble metal dental alloys: The influence of their chemical composition on the corrosion resistance. Corr. Sci., 2021, 184, 109412. [CrossRef]
- Lazić, M. M.; Majerič, P.; Lazić, V.; Milašin, J.; Jakšić, M.; Trišić, D.; Radović, K. Experimental investigation of the biofunctional properties of Nickel–Titanium alloys depending on the type of production. Molecules 2022, 27 (6), 1960. [CrossRef]
- Prando, D.; Fajardo, S.; Pedeferri, M.; Ormellese, M. Titanium anodization efficiency through real-time gravimetric measurement of oxygen evolution. J. Electrochem. Soc. 2020, 167 (6), 061507. [CrossRef]
- Zhang, Y.; Fang, Z. Z.; Xia, Y.; Huang, Z.; Lefler, H.; Zhang, T.; Sun, P.; Free, M. L.; Guo, J. A novel chemical pathway for energy efficient production of Ti metal from upgraded titanium slag. Chem. Eng. Journal 2015, 286, 517–527. [CrossRef]
- Sul, Y.-T.; Johansson, C. B.; Jeong, Y.; Albrektsson, T. The electrochemical oxide growth behaviour on titanium in acid and alkaline electrolytes. Med. Eng. Phys. 2001, 23 (5), 329–346. [CrossRef]
- Uudsemaa, M.; Tamm, T. Calculations of hydrated titanium ion complexes: structure and influence of the first two coordination spheres. Chem. Phys. Lett. 2001, 342 (5–6), 667–672. [CrossRef]
- Kallies, B.; Meier, R. Electronic structure of 3d [M(H2O)6]3+ Ions from ScIII to FeIII: A quantum mechanical study based on DFT computations and natural bond orbital analyses. Inorg. Chem. 2001, 40 (13), 3101–3112. [CrossRef]
- Liu, Z.; Thompson, G. E. Formation of porous anodic oxide film on titanium in phosphoric acid electrolyte. J. Mater. Eng. Perform. 2014, 24 (1), 59–66. [CrossRef]
- Spajić, I.; Rodič, P.; Šekularac, G.; Lekka, M.; Fedrizzi, L.; Milošev, I. The effect of surface preparation on the protective properties of Al2O3 and HfO2 thin films deposited on cp-titanium by atomic layer deposition. Electrochim. Acta 2020, 366, 137431. [CrossRef]
- Zhao, B.; Ding, W. F.; Dai, J. B.; Xi, X. X.; Xu, J. H. A comparison between conventional speed grinding and super-high speed grinding of (TiCp + TiBw) / Ti–6Al–4V composites using vitrified CBN wheel. Int. J. Adv. Manuf. Technol. 2014, 72 (1–4), 69–75. [CrossRef]
- Bail, A. L. Whole powder pattern decomposition methods and applications: A retrospection. Powder Diffr. 2005, 20 (4), 316–326. [CrossRef]
- Liu, Z. J.; Zhong, X.; Walton, J.; Thompson, G. E. Anodic film growth of titanium oxide using the 3-electrode electrochemical technique: effects of oxygen evolution and morphological characterizations. J. Electrochem. Soc 2015, 163 (3), E75–E82. [CrossRef]
- Milićević, N.; Novaković, M.; Potočnik, J.; Milović, M.; Rakočević, L.; Abazović, N.; Pjević, D. Influencing surface phenomena by Au diffusion in buffered TiO2-Au thin films: Effects of deposition and annealing processing. Surf. Interfaces. 2022, 30, 101811. [CrossRef]
- Esmailzadeh, S.; Aliofkhazraei, M.; Sarlak, H. Interpretation of cyclic potentiodynamic polarization test results for study of corrosion behavior of metals: A review. Prot. Met. Phys. Chem. Surf. 2018, 54 (5), 976–989. [CrossRef]
- Kim, M.-H.; Park, K.; Choi, K.-H.; Kim, S.-H.; Kim, S.; Jeong, C.-M.; Huh, J.-B. Cell adhesion and in vivo osseointegration of Sandblasted/Acid Etched/Anodized dental implants. Int. J. Mol. Sci.. 2015, 16 (5), 10324–10336. [CrossRef]
- Mary, S.; Charrasse, S.; Meriane, M.; Comunale, F.; Travo, P.; Blangy, A.; Gauthier-Rouvière, C. Biogenesis of N-Cadherin-dependent cell-cell contacts in living fibroblasts is a microtubule-dependent kinesin-driven mechanism. Mol Biol. Cell. 2002, 13, 285–301. [CrossRef]
- Miron-Mendoza, M.; Poole, K.; DiCesare, S.; Nakahara, E.; Bhatt, M.P.; Hulleman, J.D.; Petroll, W.M. The role of vimentin in human corneal fibroblast spreading and myofibroblast transformation. Cells 2024, 13, 1094. [CrossRef]
- Bao, P.; Kodra, A.; Tomic-Canic, M.; Golinko, M. S.; Ehrlich, H. P.; Brem, H. The role of vascular endothelial growth factor in wound healing. J. Surg. Res. 2008, 153 (2), 347–358. [CrossRef]
- Jiang, D.; Christ, S.; Correa-Gallegos, D.; Ramesh, P.; Gopal, S. K.; Wannemacher, J.; Mayr, C. H.; Lupperger, V.; Yu, Q.; Ye, H.; Mück-Häusl, M.; Rajendran, V.; Wan, L.; Liu, J.; Mirastschijski, U.; Volz, T.; Marr, C.; Schiller, H. B.; Rinkevich, Y. Injury triggers fascia fibroblast collective cell migration to drive scar formation through N-cadherin. Nat Comm. 2020, 11 (1). [CrossRef]
- Cheng, F.; Shen, Y.; Mohanasundaram, P.; Lindström, M.; Ivaska, J.; Ny, T.; Eriksson, J.E. Vimentin Coordinates Fibroblast Proliferation and Keratinocyte Differentiation in Wound Healing via TGF-β-Slug Signaling. Cheng, F.; Shen, Y.; Mohanasundaram, P.; Lindström, M.; Ivaska, J.; Ny, T.; Eriksson, J. E. Vimentin coordinates fibroblast proliferation and keratinocyte differentiation in wound healing via TGF-β–Slug signaling. Proc Natl Acad Sci. 2016, 113 (30). [CrossRef]
- Crenn, M.-J.; Dubot, P.; Mimran, E.; Fromentin, O.; Lebon, N.; Peyre, P. Influence of Anodized Titanium Surfaces on the Behavior of Gingival Cells in Contact with: A Systematic Review of In Vitro Studies. Crystals 2021, 11 (12), 1566. [CrossRef]
- Jokanović, V.; Čolović, B.; Nenadović, M.; Petkoska, A. T.; Mitrić, M.; Jokanović, B.; Nasov, I. Ultra-high and near-zero refractive indices of magnetron sputtered thin-film metamaterials based on TIXOY. Adv. Mater. Sci. Eng. 2016, 2016, 1–9. [CrossRef]
- Yeniyol, S.; Bölükbaşı, N.; Bilir, A.; Çakır, A.F.; Yeniyol, M.; Ozdemir, T. Relative contributions of surface roughness and crystalline ttructure to the biocompatibility of titanium nitride and titanium oxide coatings deposited by PVD and TPS coatings. Int. Sch. Res. Notices. 2013, 2013, 783873. [CrossRef]
- Čolović, B.; Kisić, D.; Jokanović, B.; Rakočević, Z.; Nasov, I.; Petkoska, A. T.; Jokanović, V. Wetting properties of titanium oxides, oxynitrides and nitrides obtained by DC and pulsed magnetron sputtering and cathodic arc evaporation. Mater. Sci. Pol. 2019, 37 (2), 173–181. [CrossRef]
- Arima, Y.; Iwata, H. Effect of wettability and surface functional groups on protein adsorption and cell adhesion using well-defined mixed self-assembled monolayers. Biomaterials 2007, 28, 3074–3082. [CrossRef]
- Chen, L.; Yan, C.; Zheng, Z. Functional Polymer Surfaces for Controlling Cell Behaviors. Materials Today 2018, 21, 38–59. [CrossRef]
- Al-Azzam, N.; Alazzam, A. Micropatterning of cells via adjusting surface wettability using plasma treatment and graphene oxide deposition. PLoS ONE 2022, 17 (6), e0269914. [CrossRef]
- Priyanka, C.P.; Keerthi Krishnan, K.; Sudeep, U.; Ramachandran, K.K. Osteogenic and Antibacterial Properties of TiN-Ag Coated Ti-6Al-4V Bioimplants with Polished and Laser Textured Surface Topography. Surf. Coat. Tech. 2023, 474, 130058. [CrossRef]
Figure 1.
The dependence of anodization voltage, potential, and current densities of Ti in 1 M H2SO4.
Figure 1.
The dependence of anodization voltage, potential, and current densities of Ti in 1 M H2SO4.
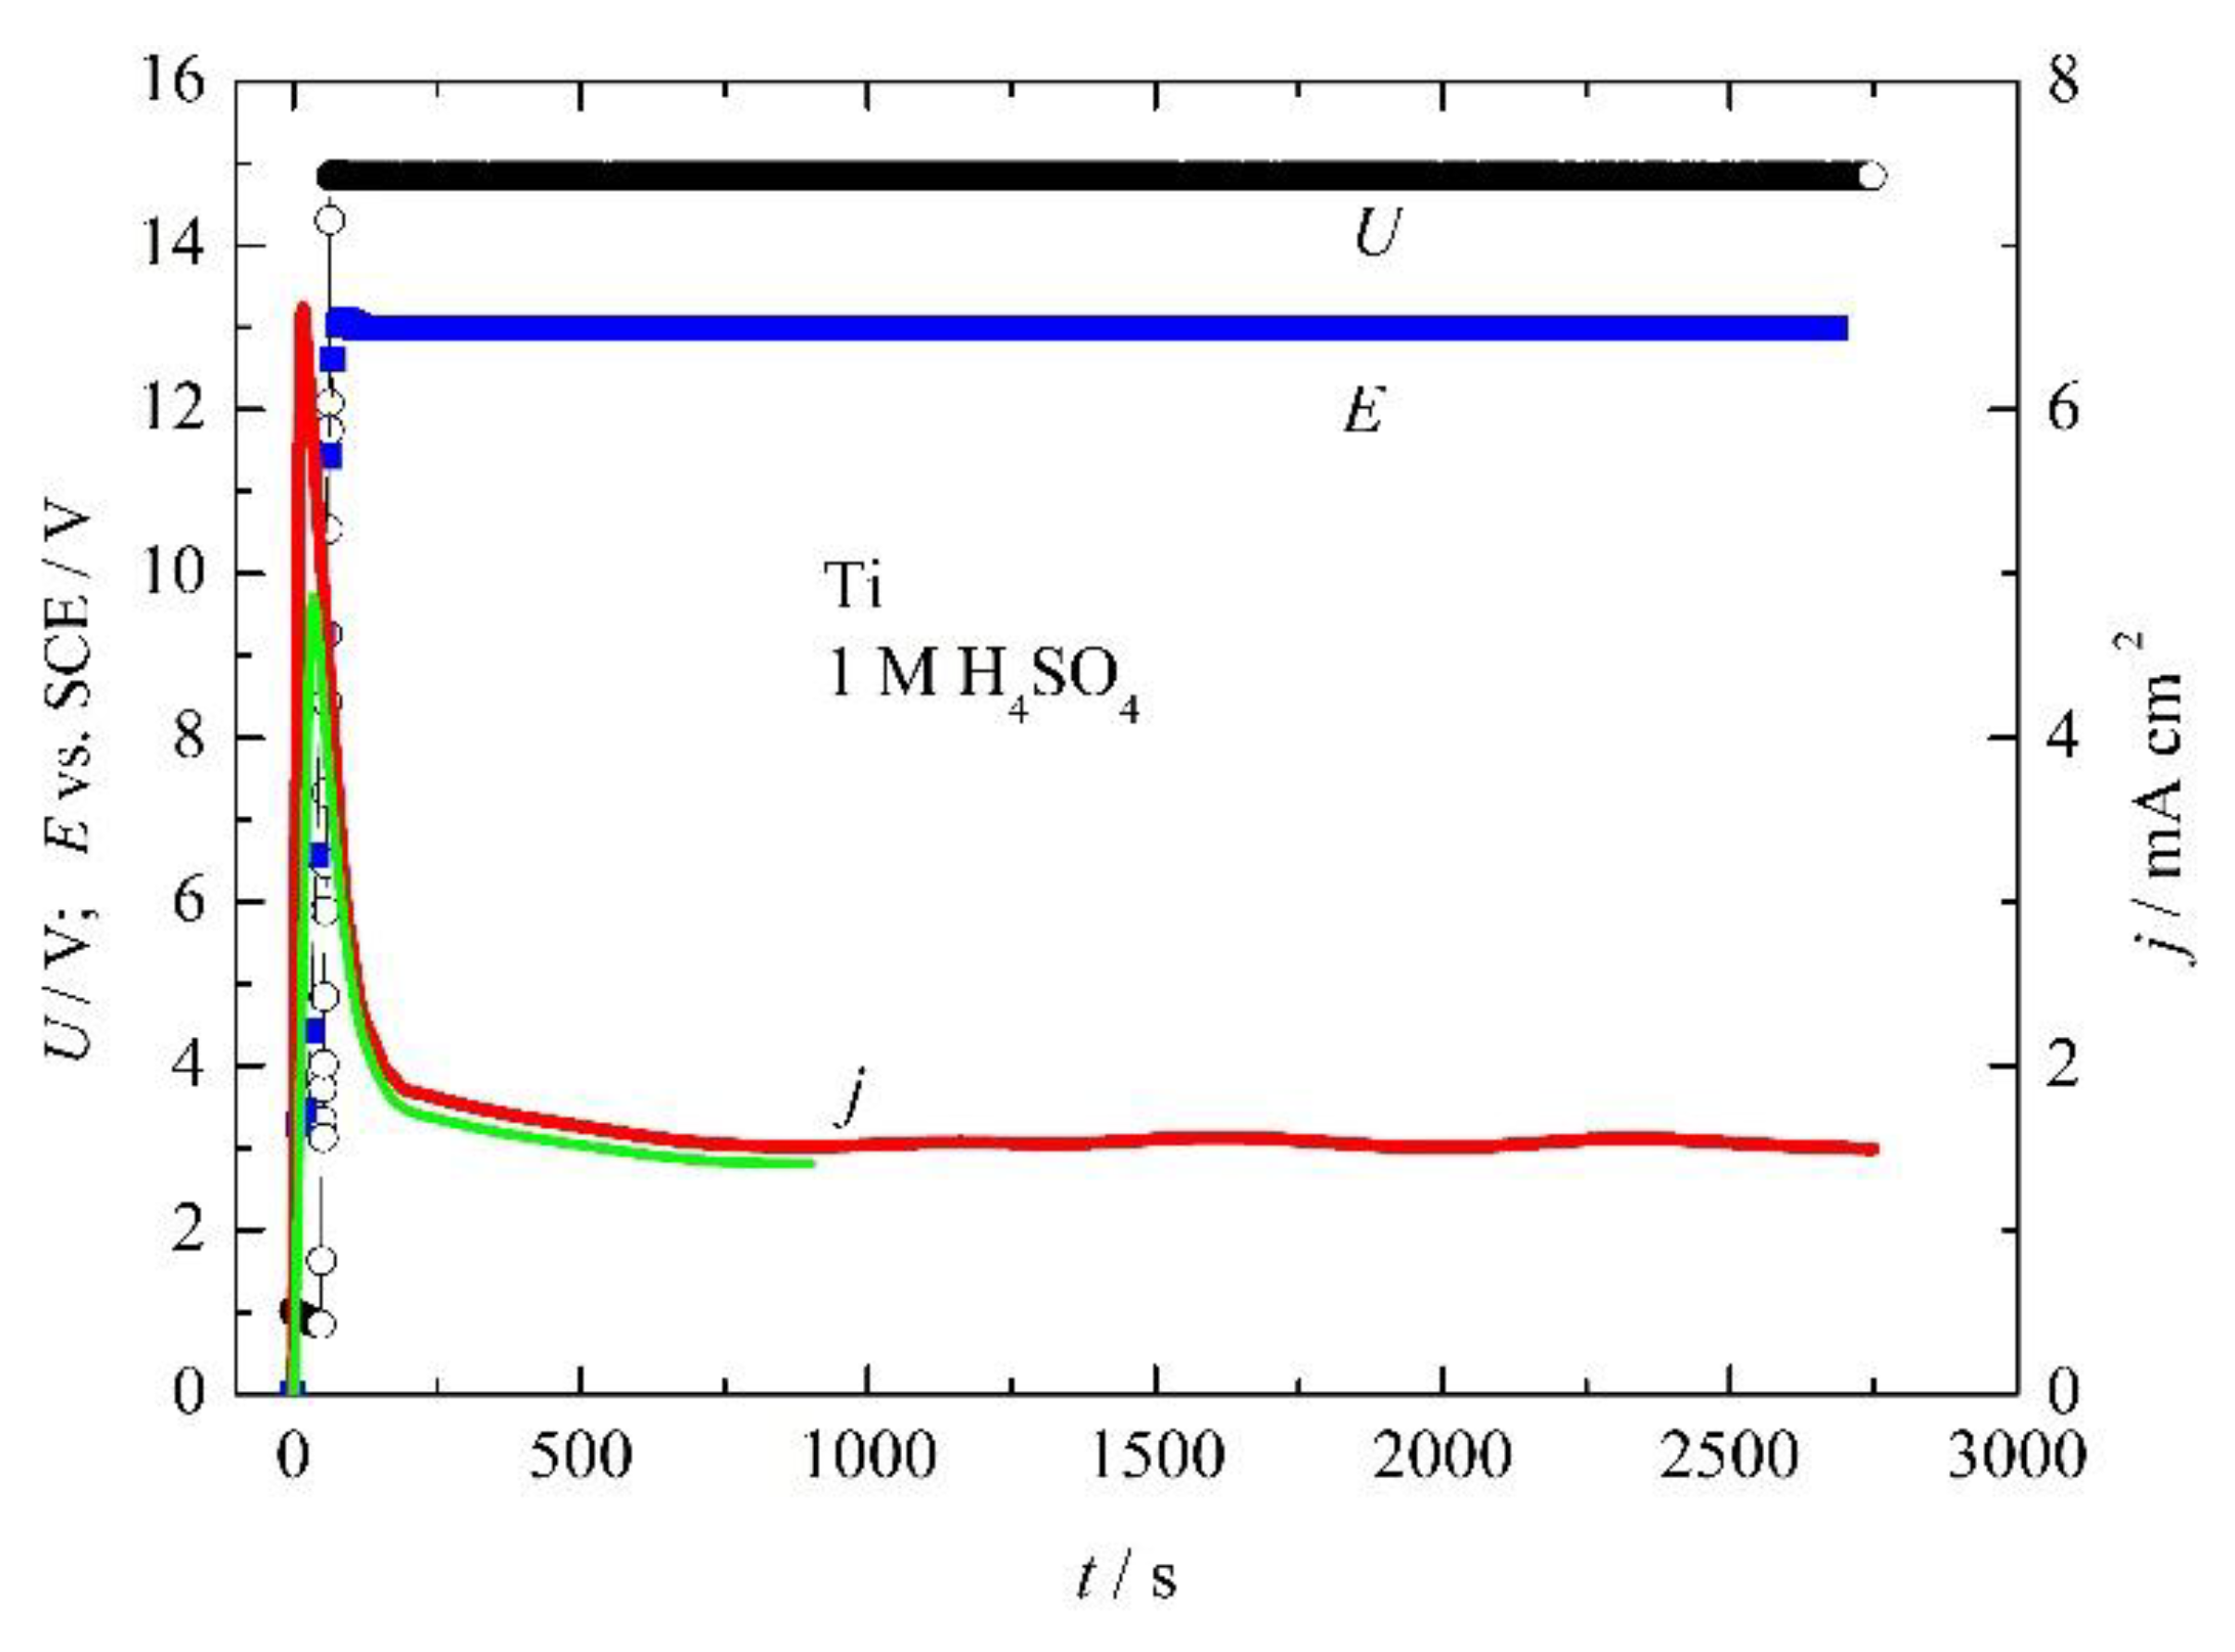
Figure 3.
Appearance of the color during anodization of Ti in 1 M H2SO4, for 0, 15, and 45 min.
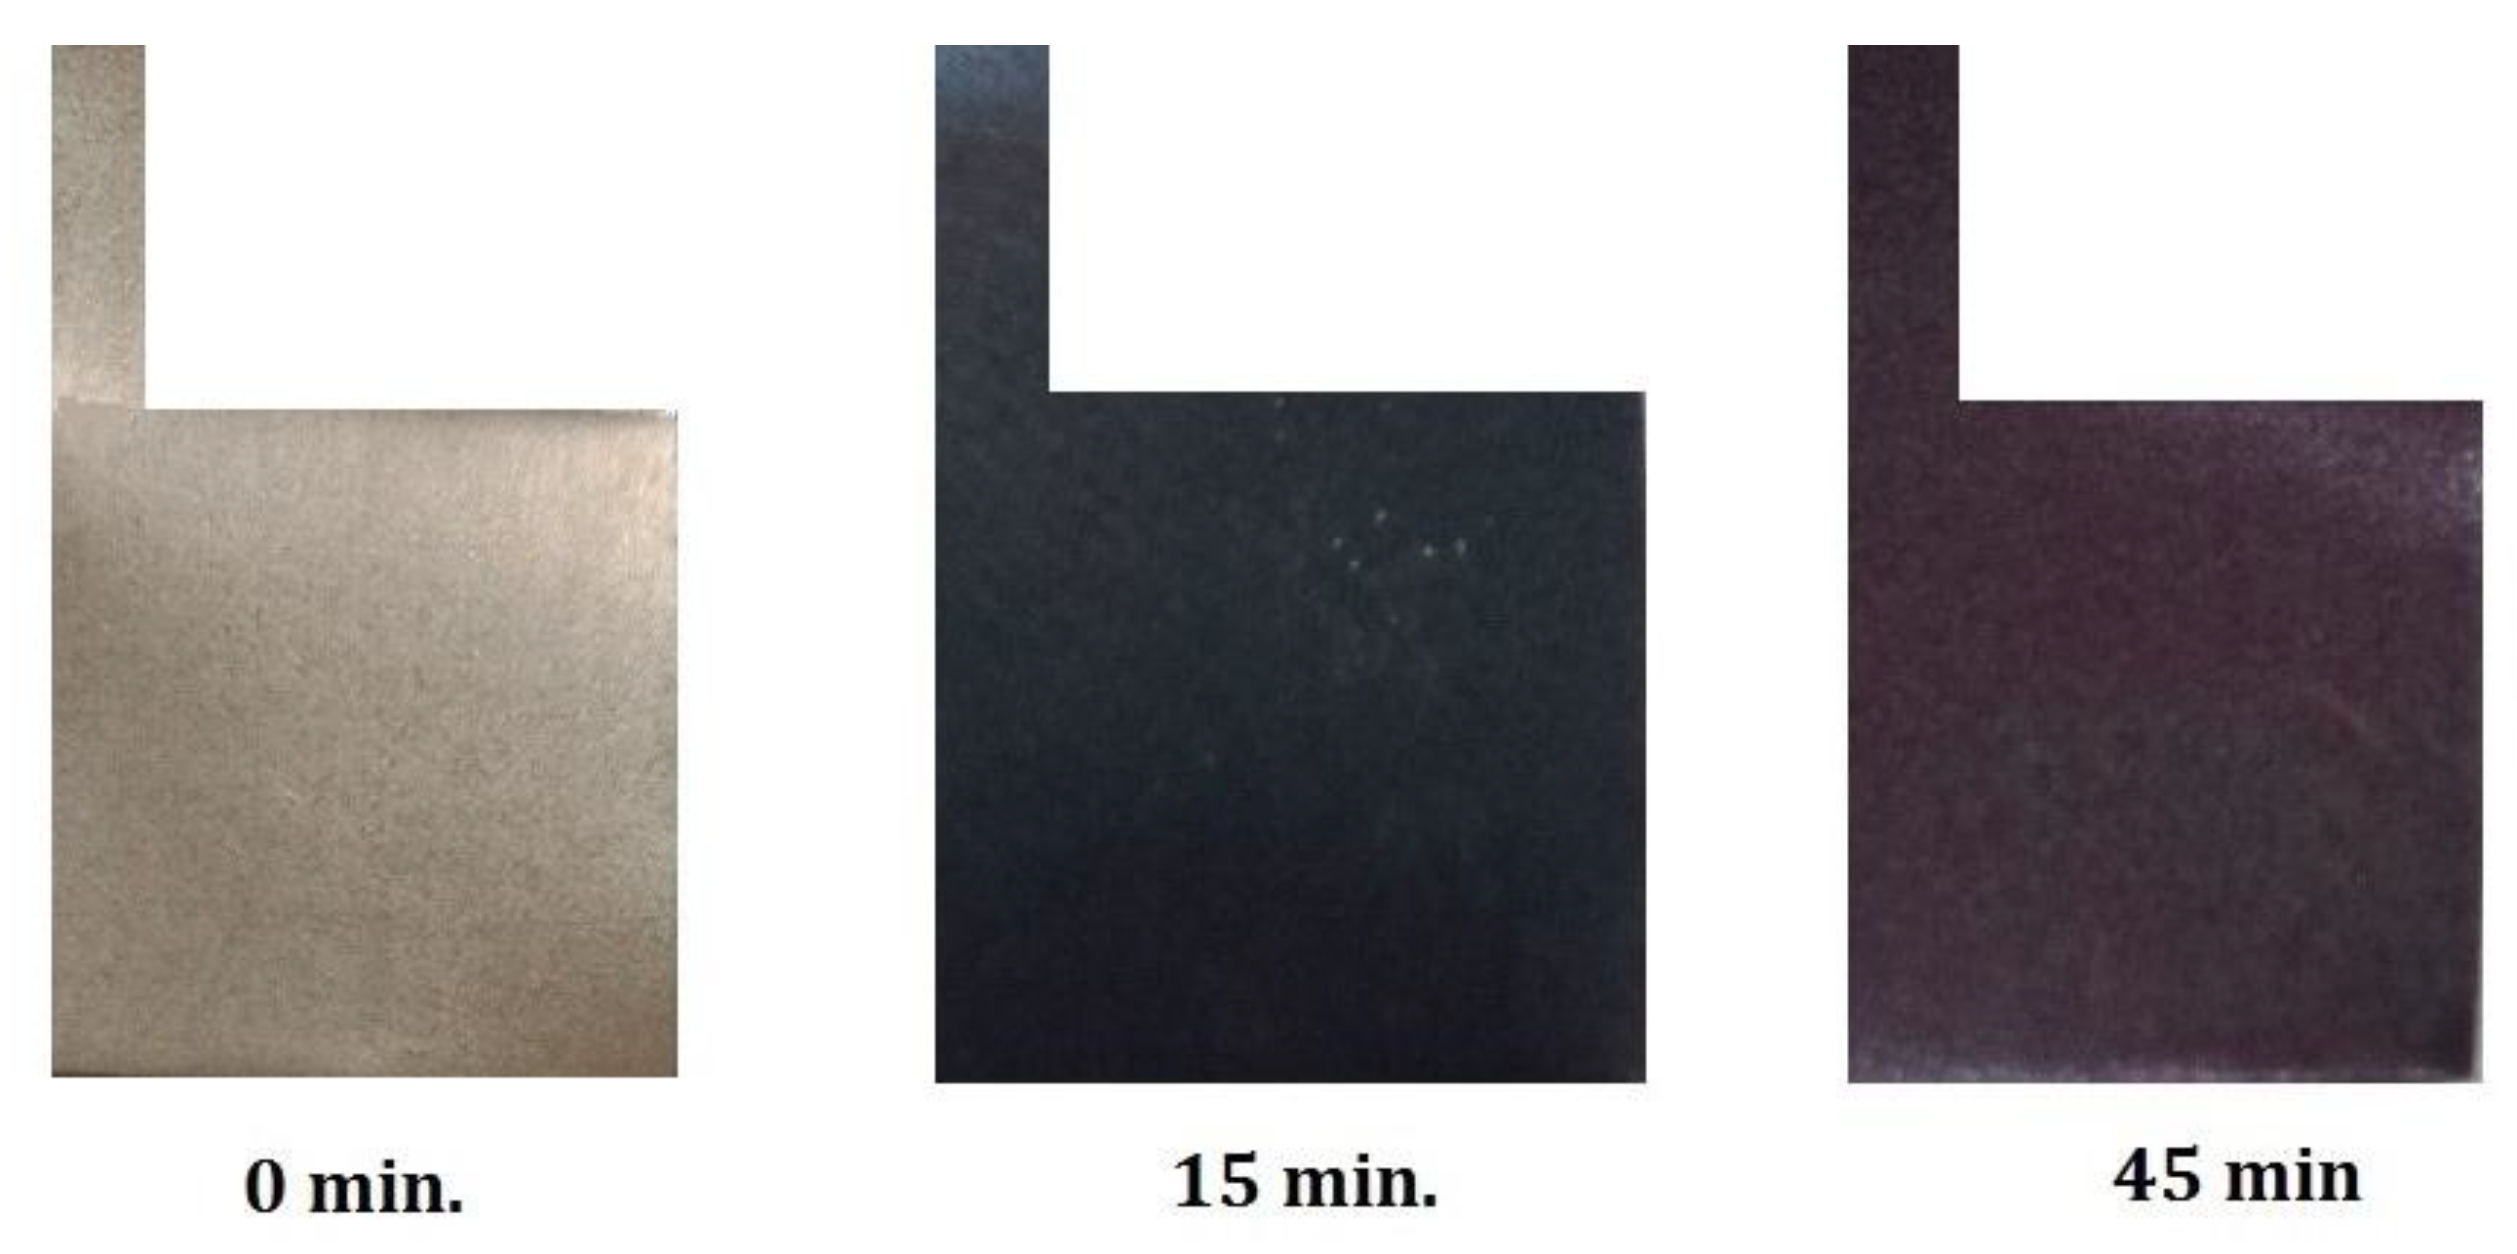
Figure 4.
EDS and SEM images of the Ti-0 (a, b, c), and T-45 (d, e, f).
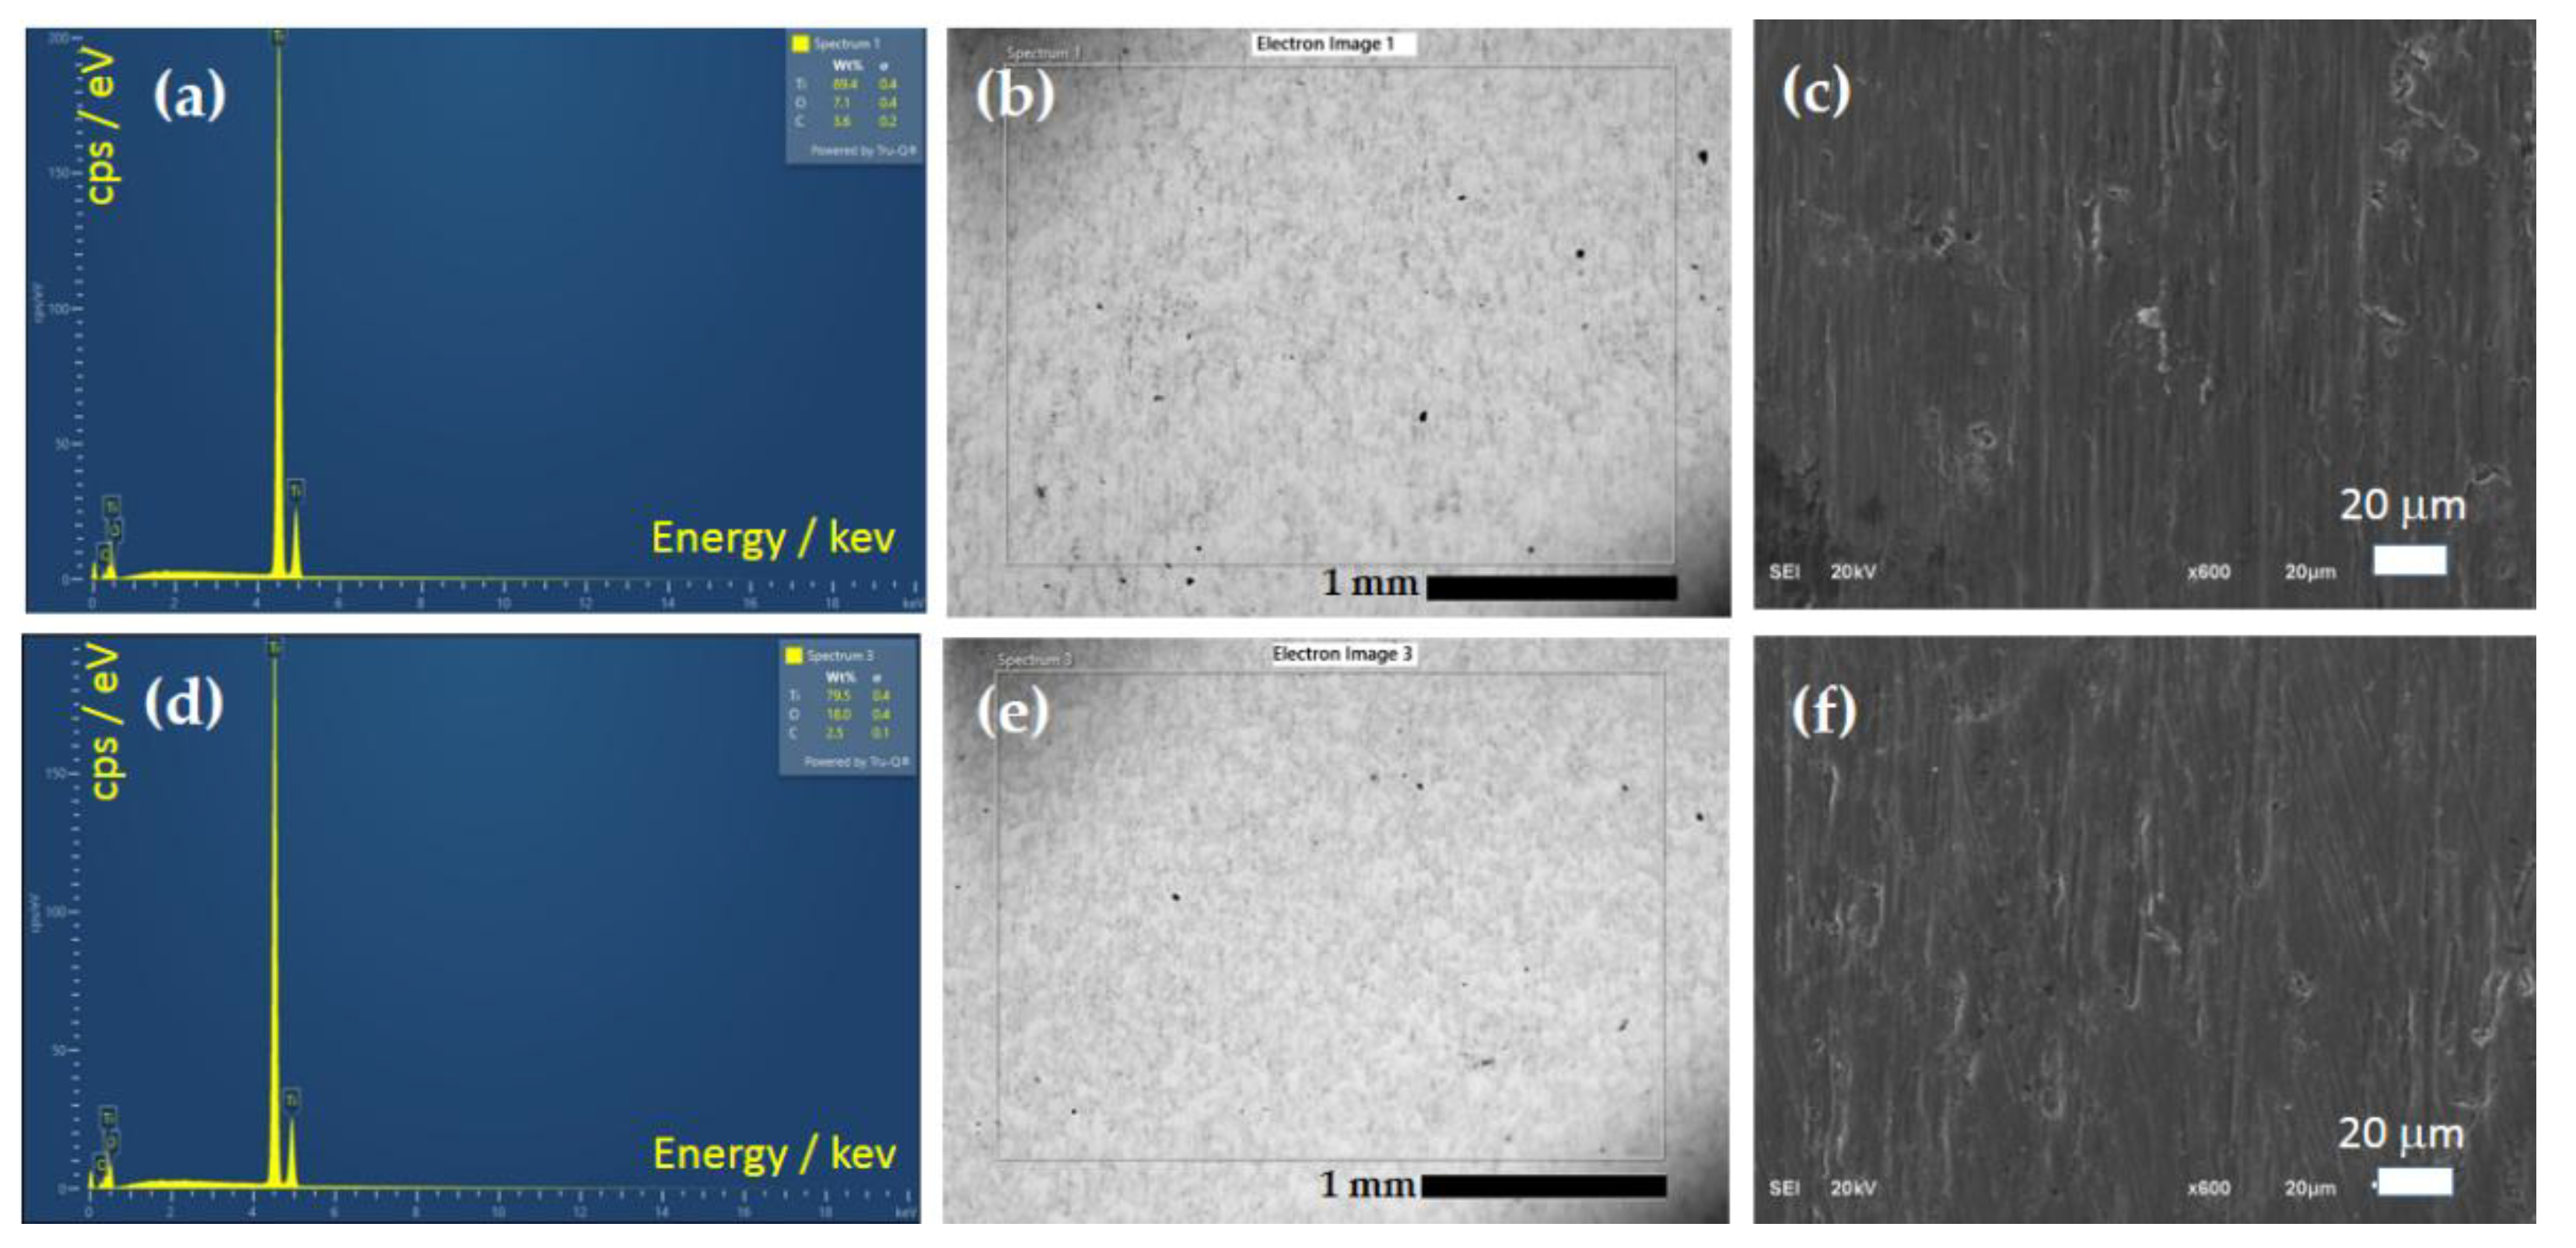
Figure 5.
XRD pattern of the titanium before (Ti-0) and after anodization (Ti-45).
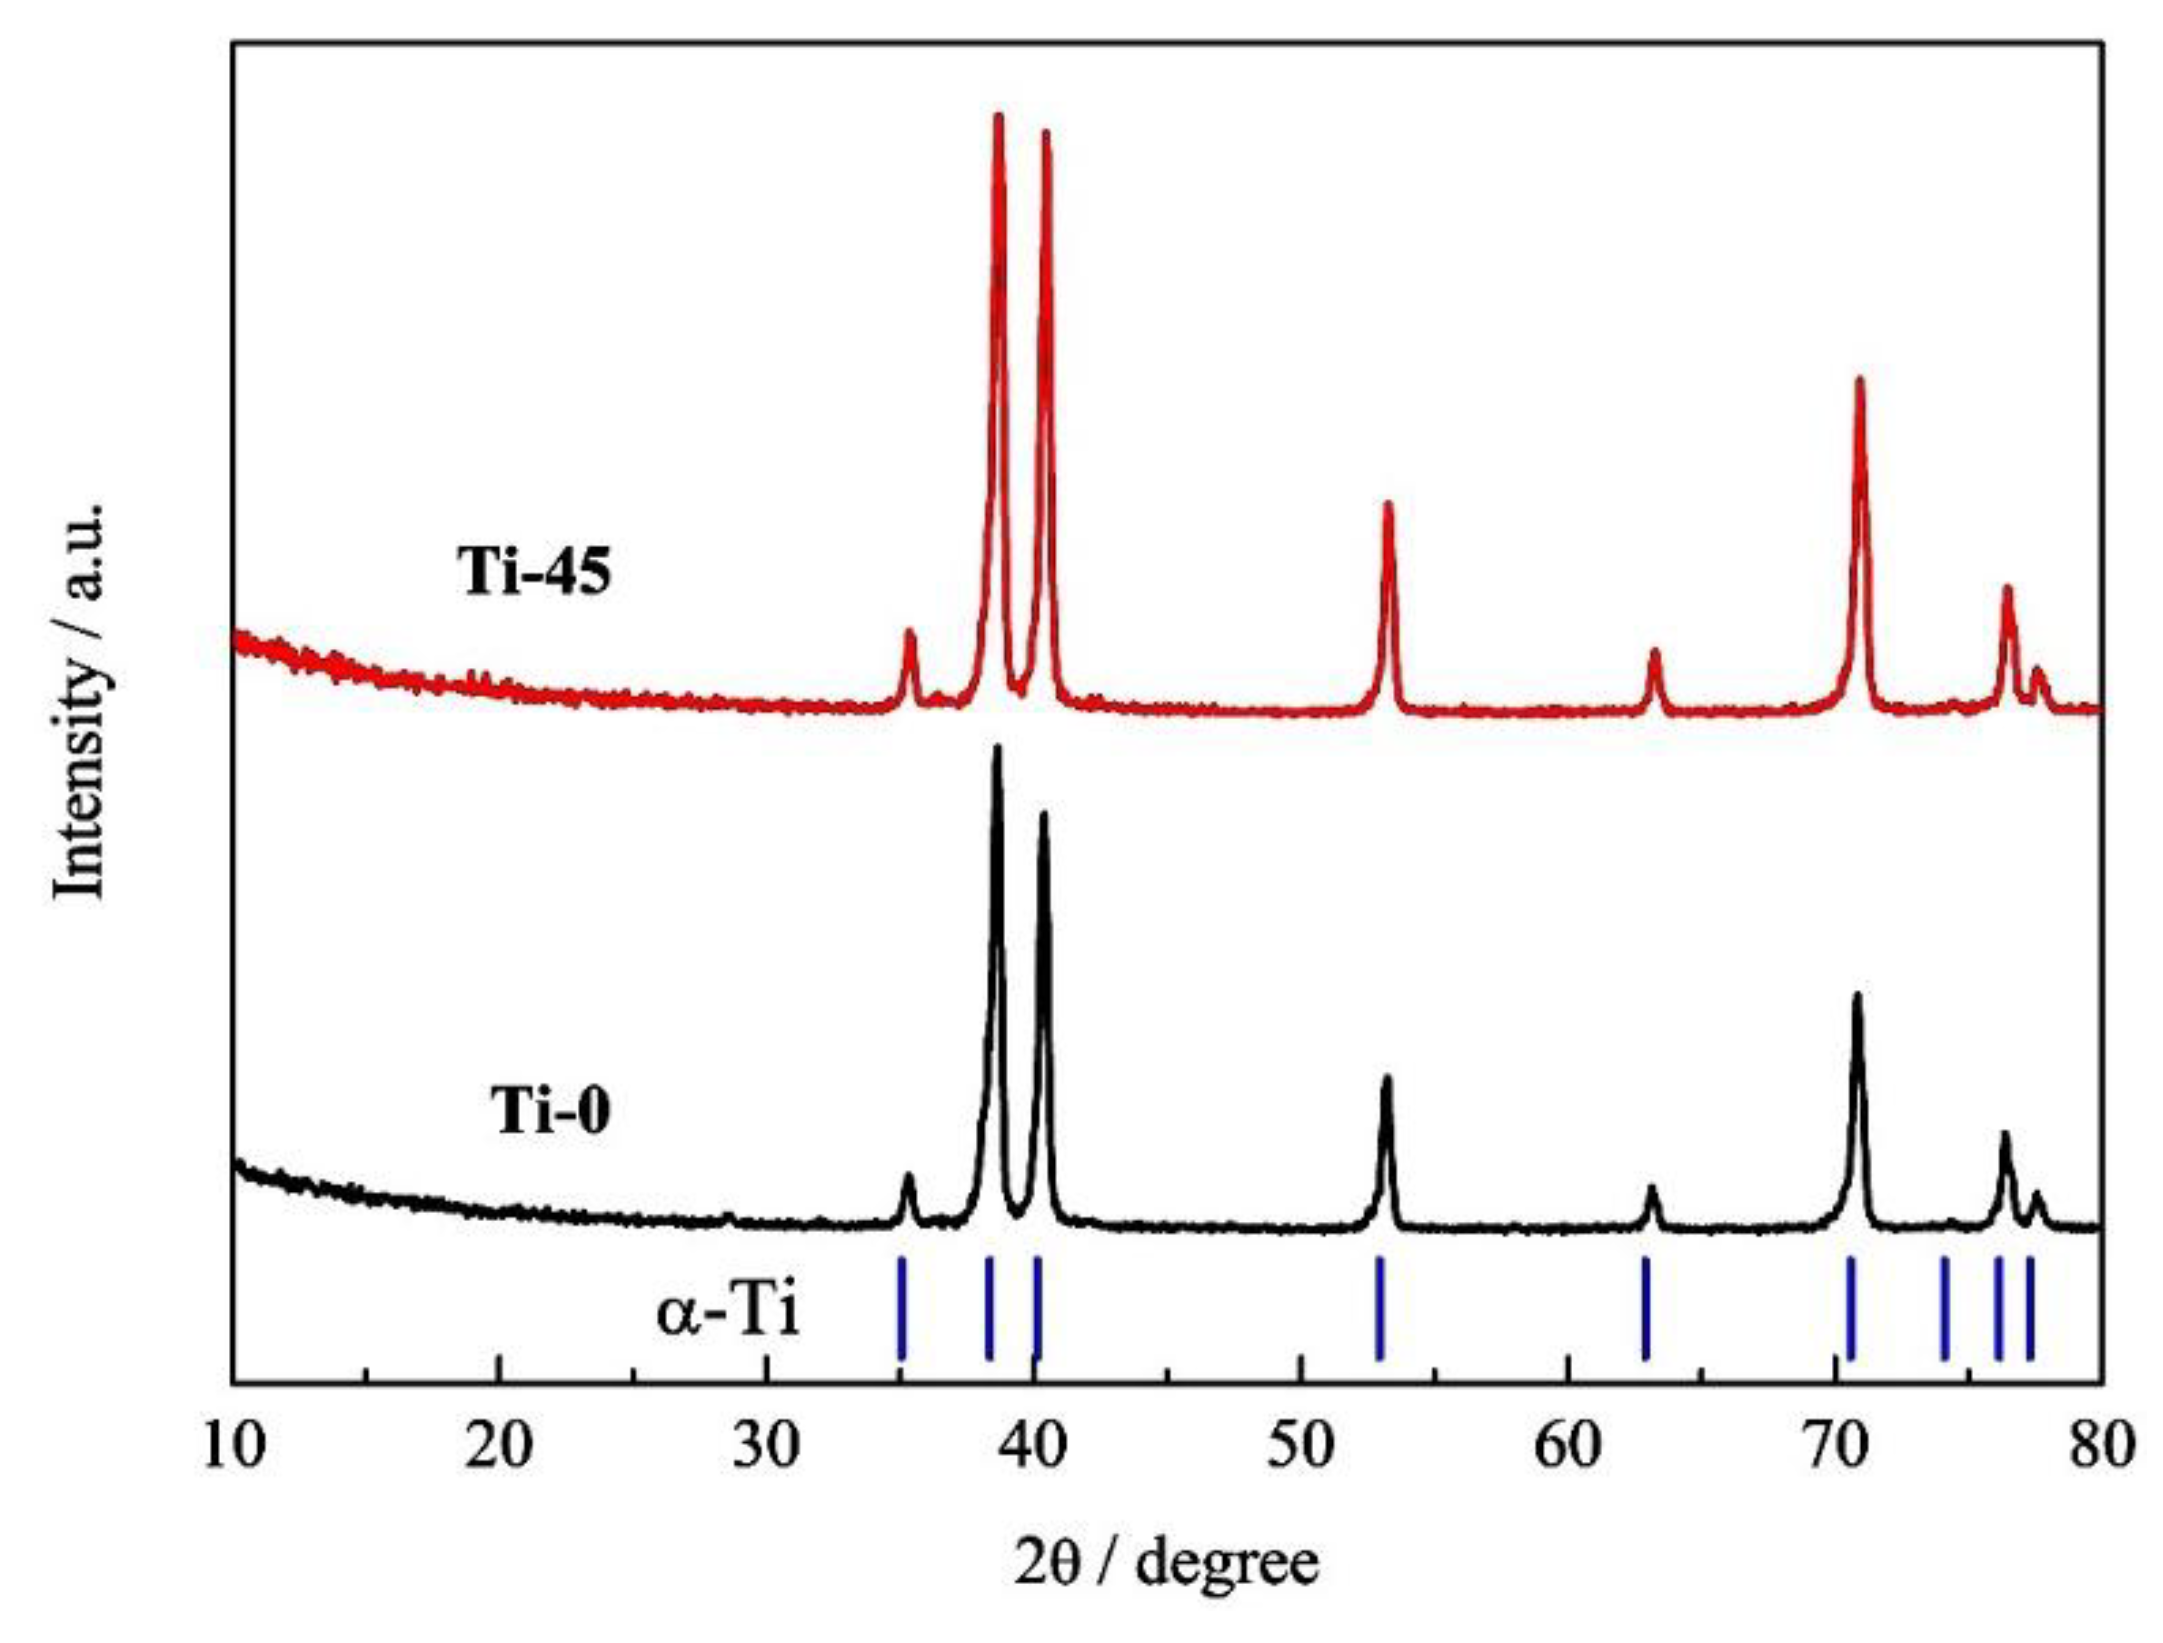
Figure 6.
Survey XPS spectra of TiO and Ti45.
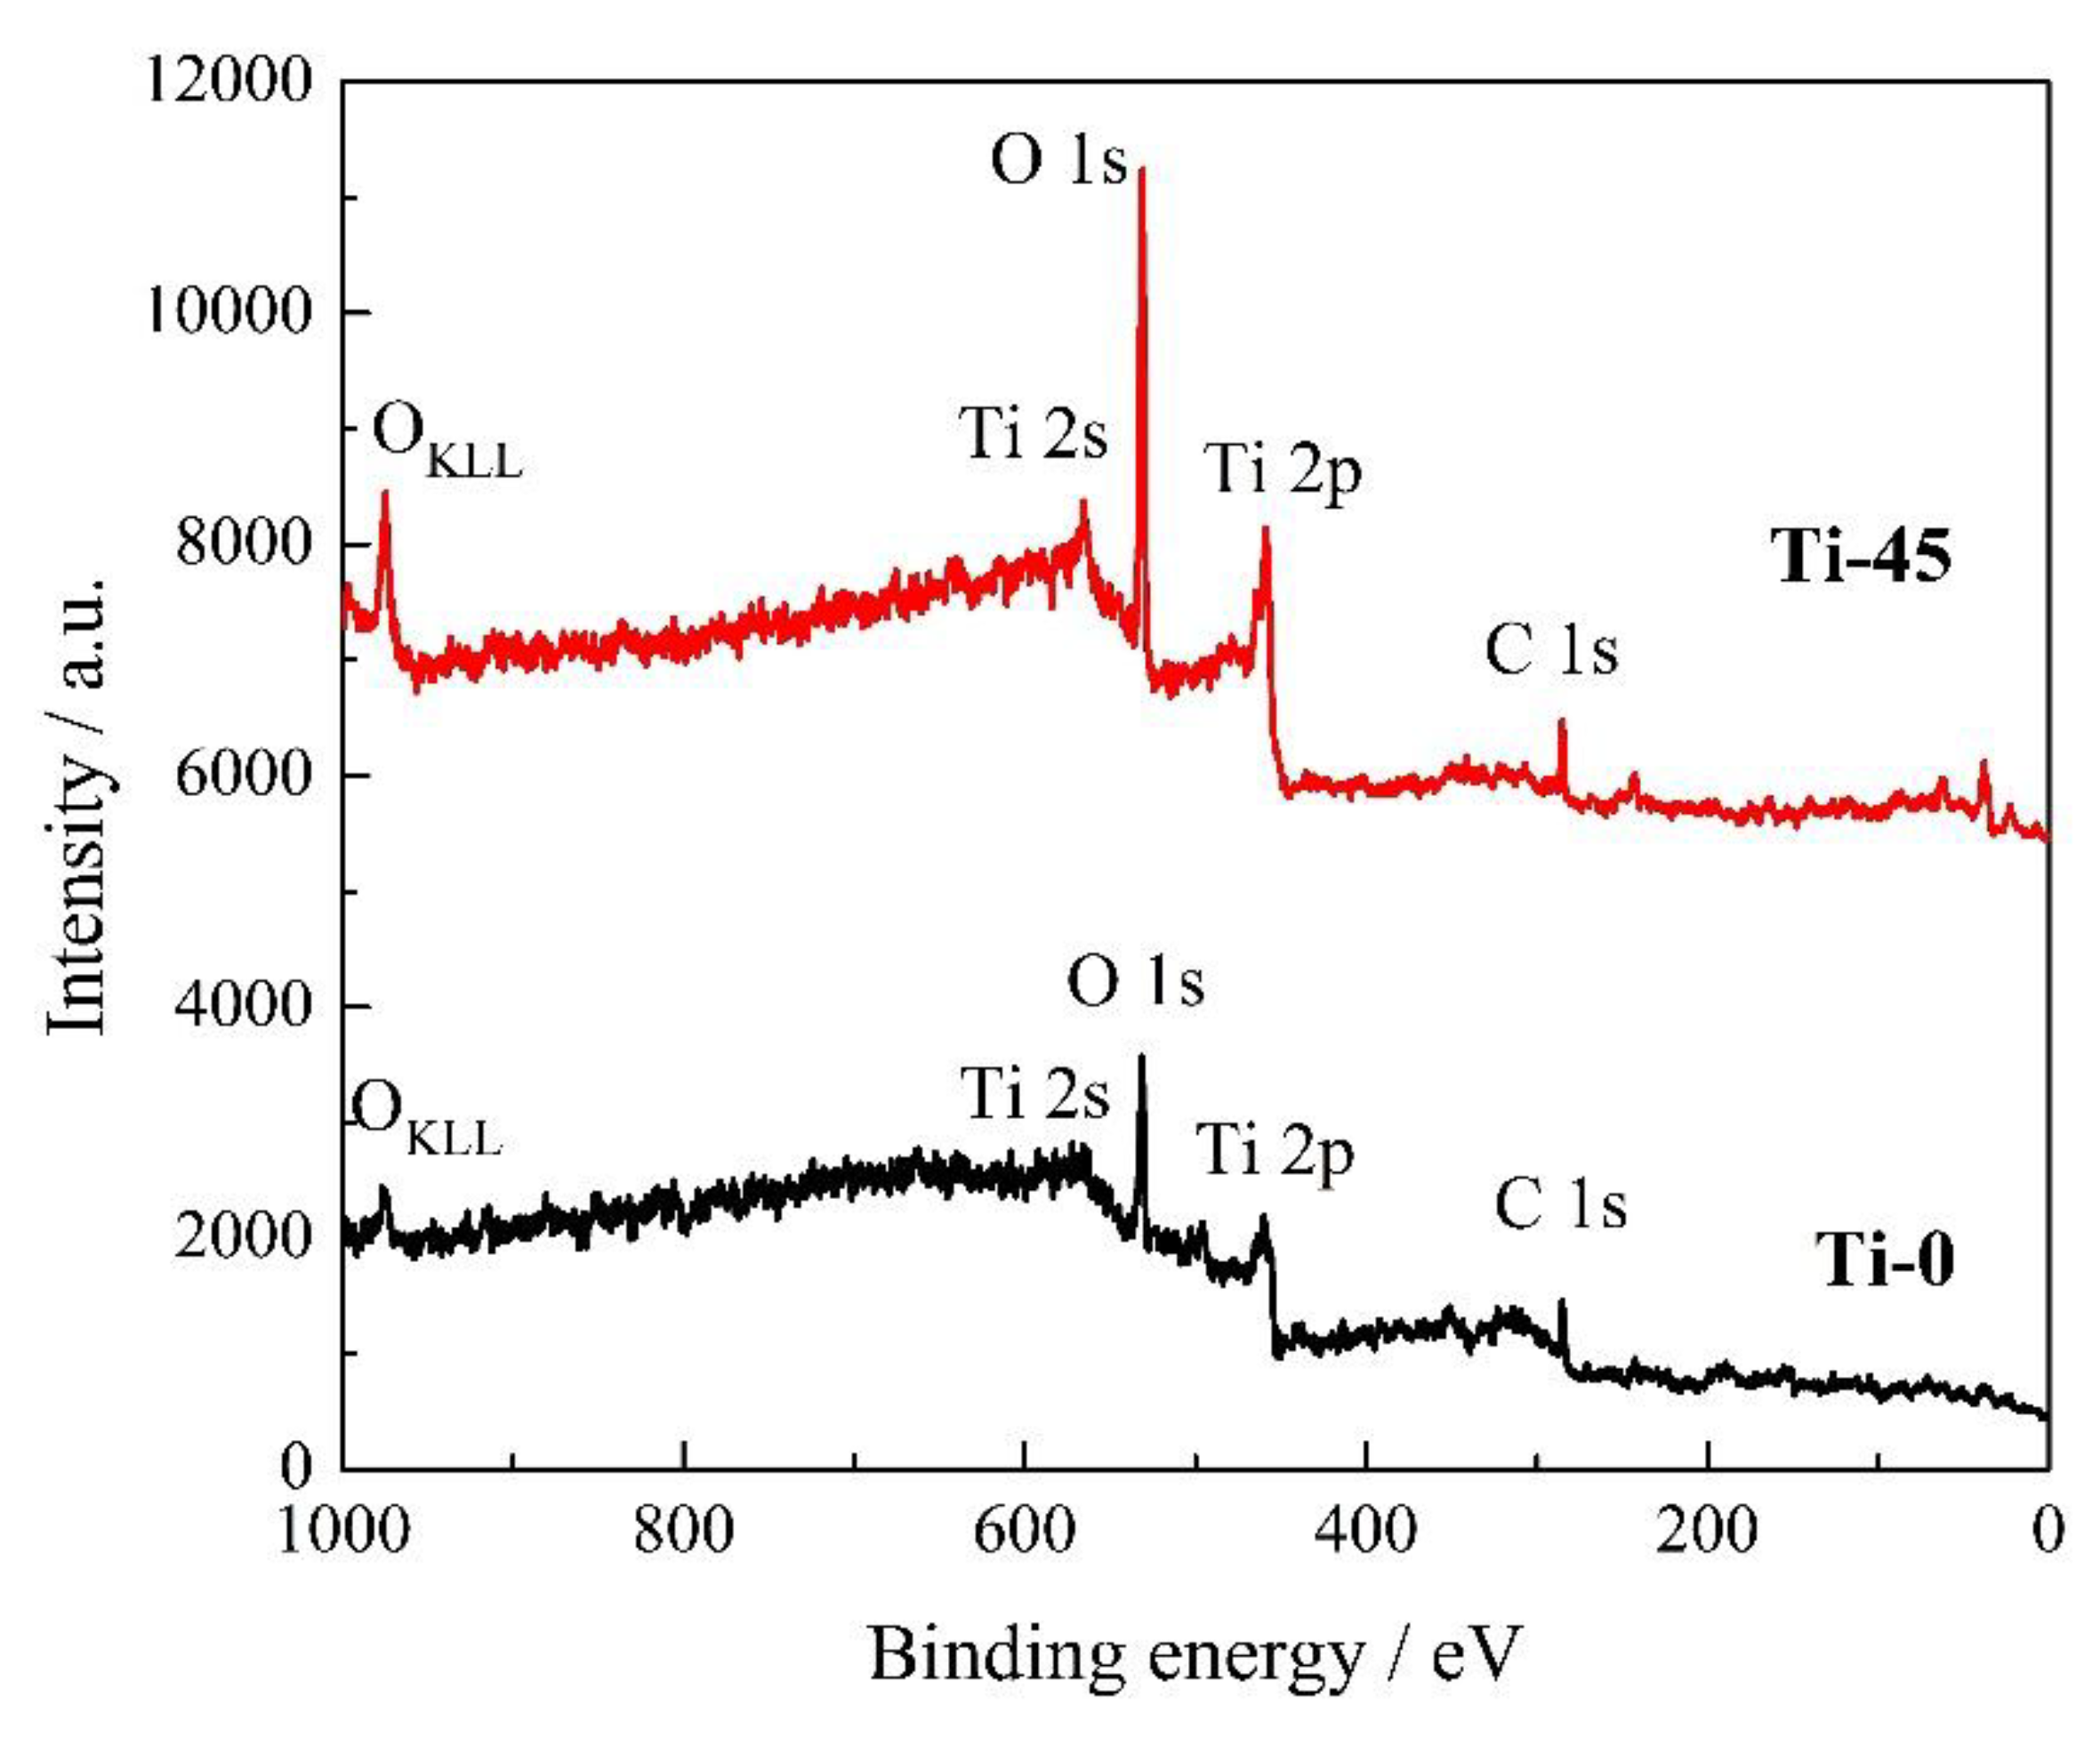
Figure 8.
(a) The dependence of the open circuit potentials, Eocp, over time, and (b) The dependence of the polarization resistance, Rp, over time, for Ti-0, Ti-15, and Ti-45.
Figure 8.
(a) The dependence of the open circuit potentials, Eocp, over time, and (b) The dependence of the polarization resistance, Rp, over time, for Ti-0, Ti-15, and Ti-45.
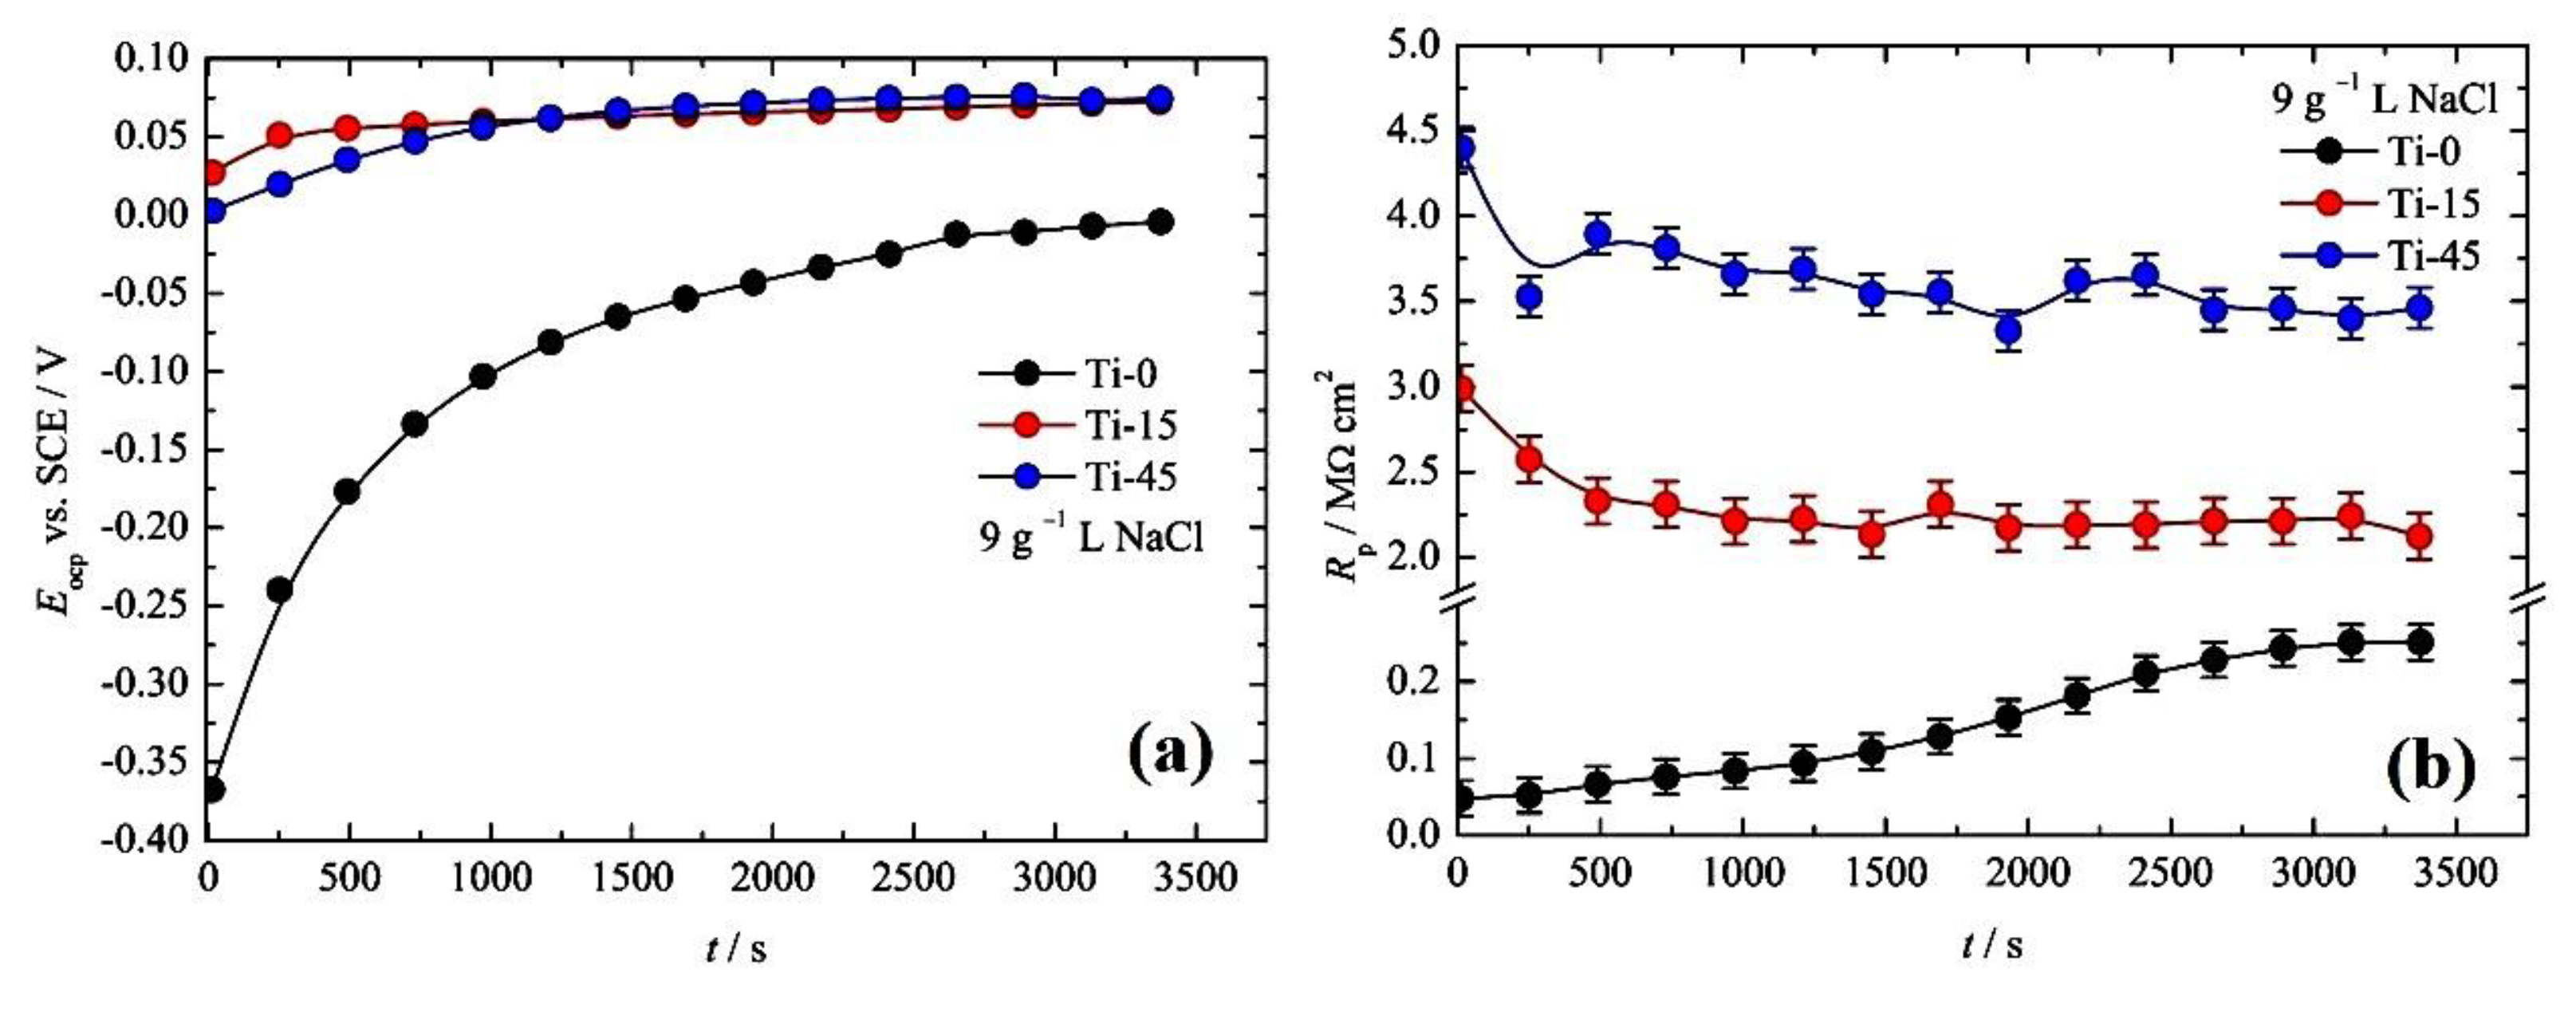
Figure 9.
The anodic linear polarization curve of the investigated samples.
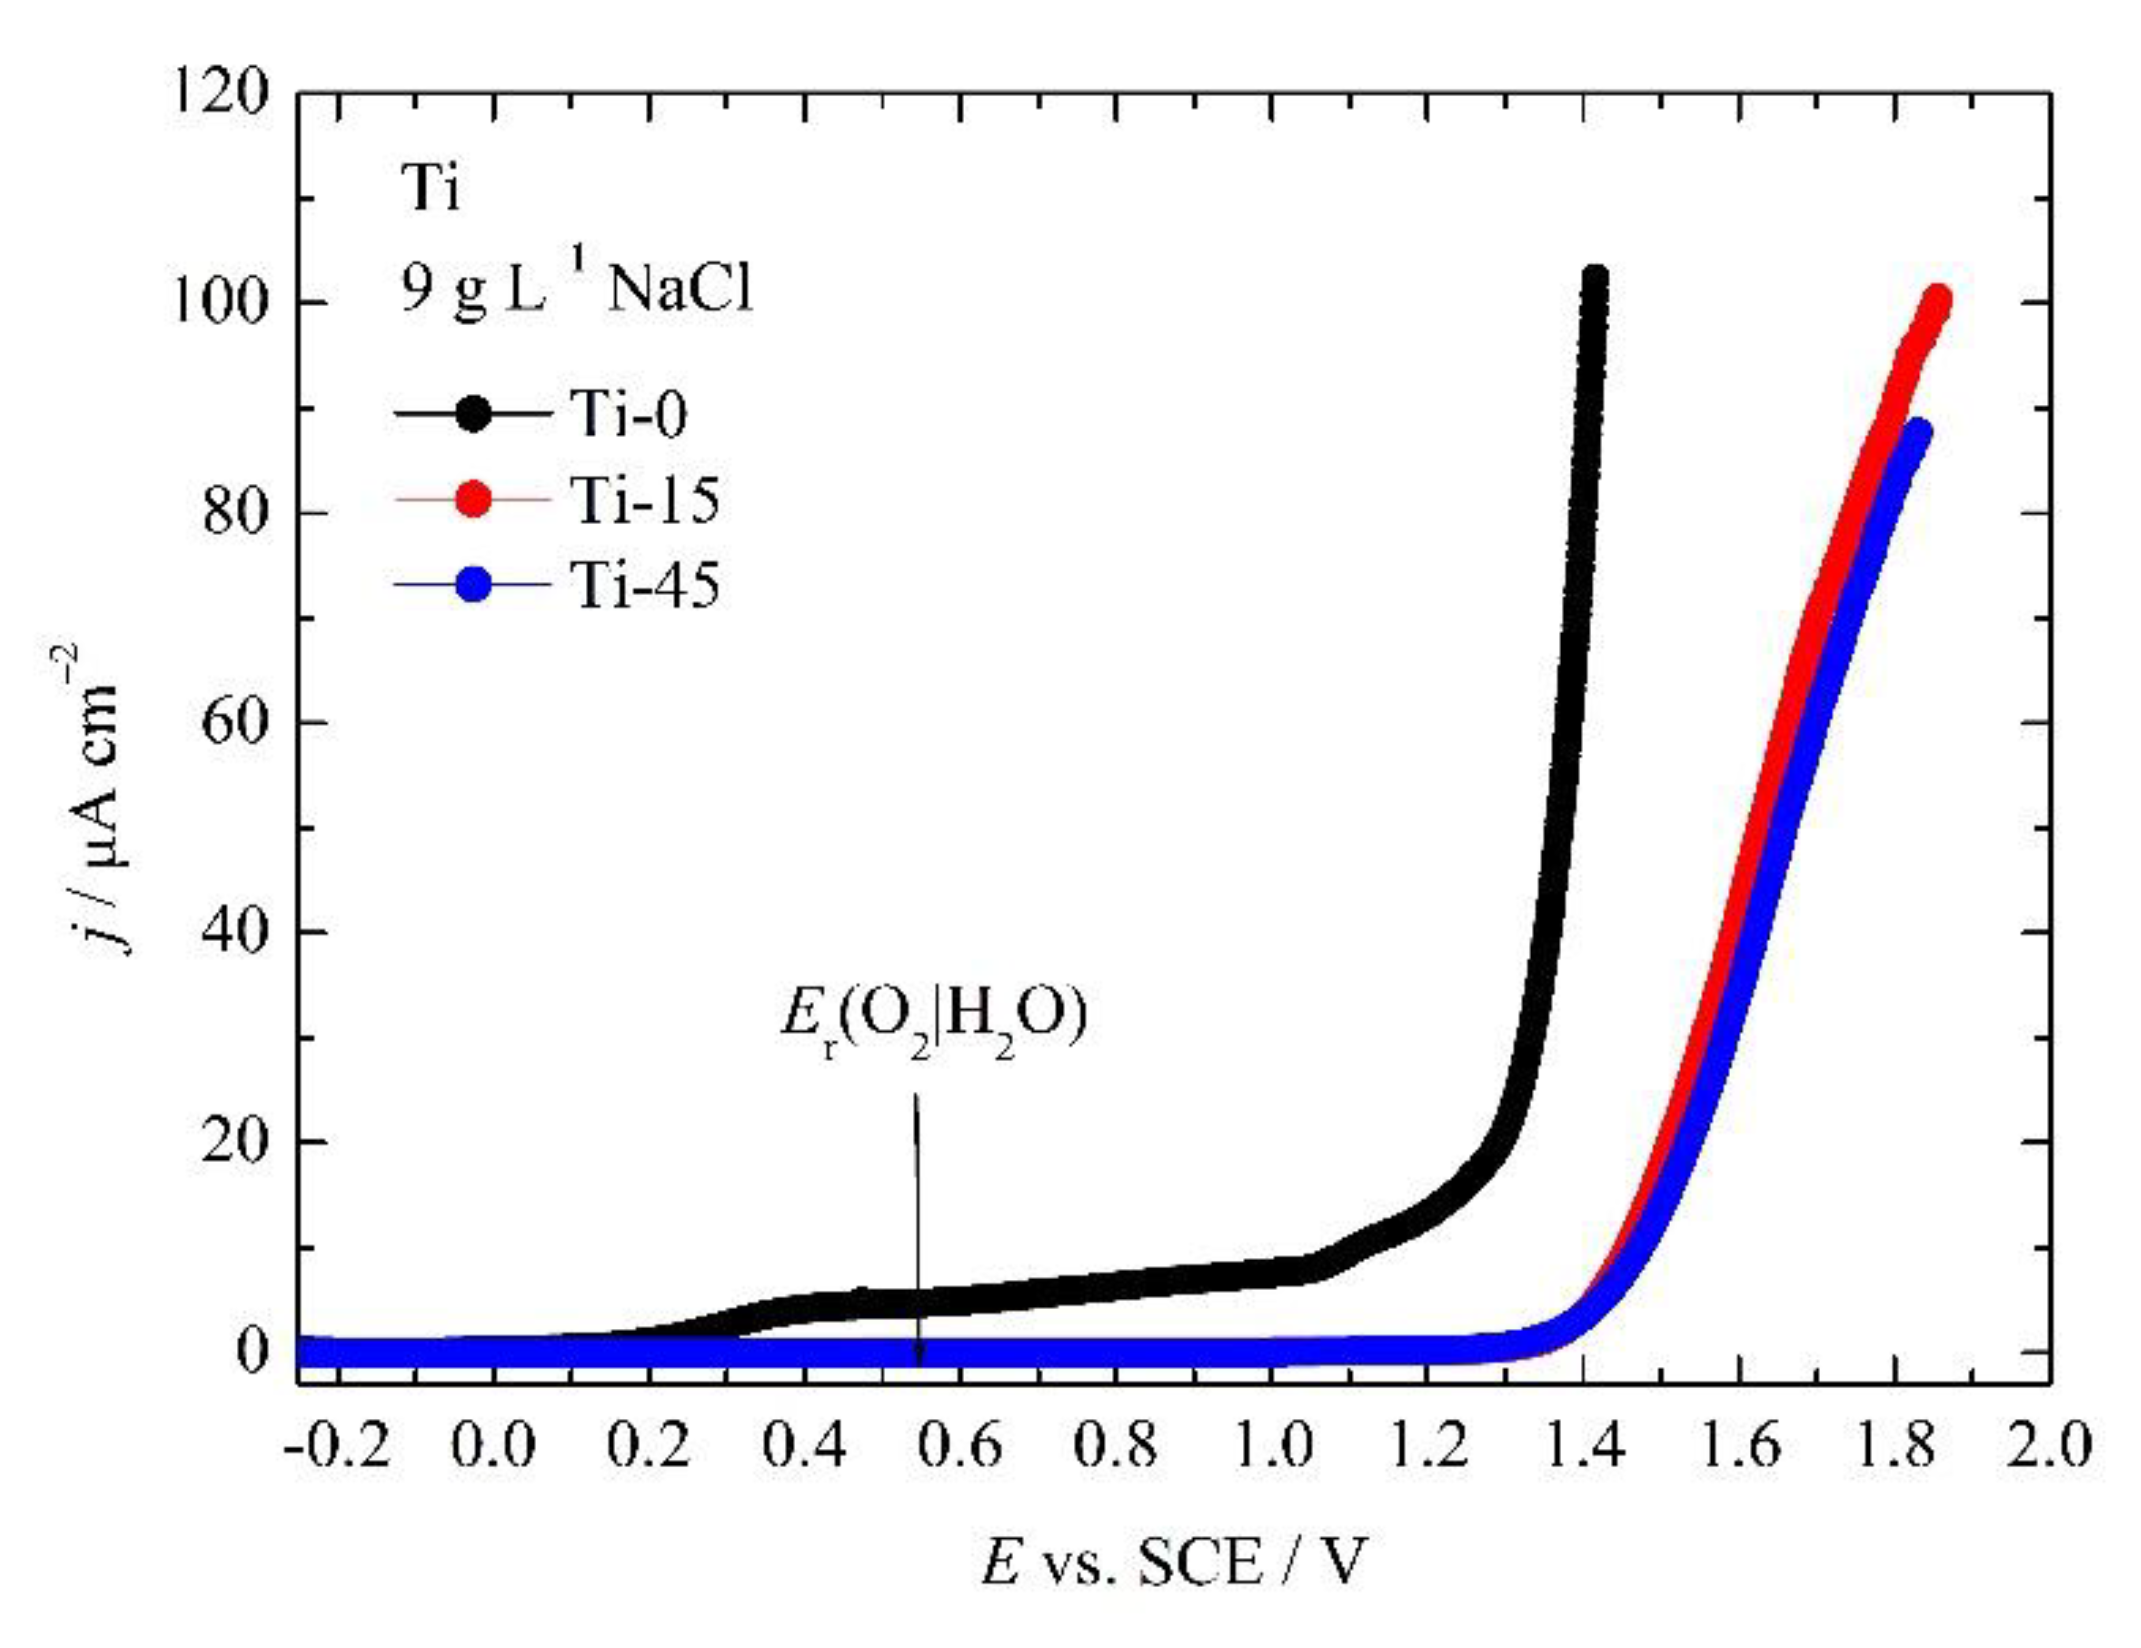
Figure 11.
EDS and SEM analysis of pure Ti (a-c) and Ti-45 (d-f) after cyclic polarization.
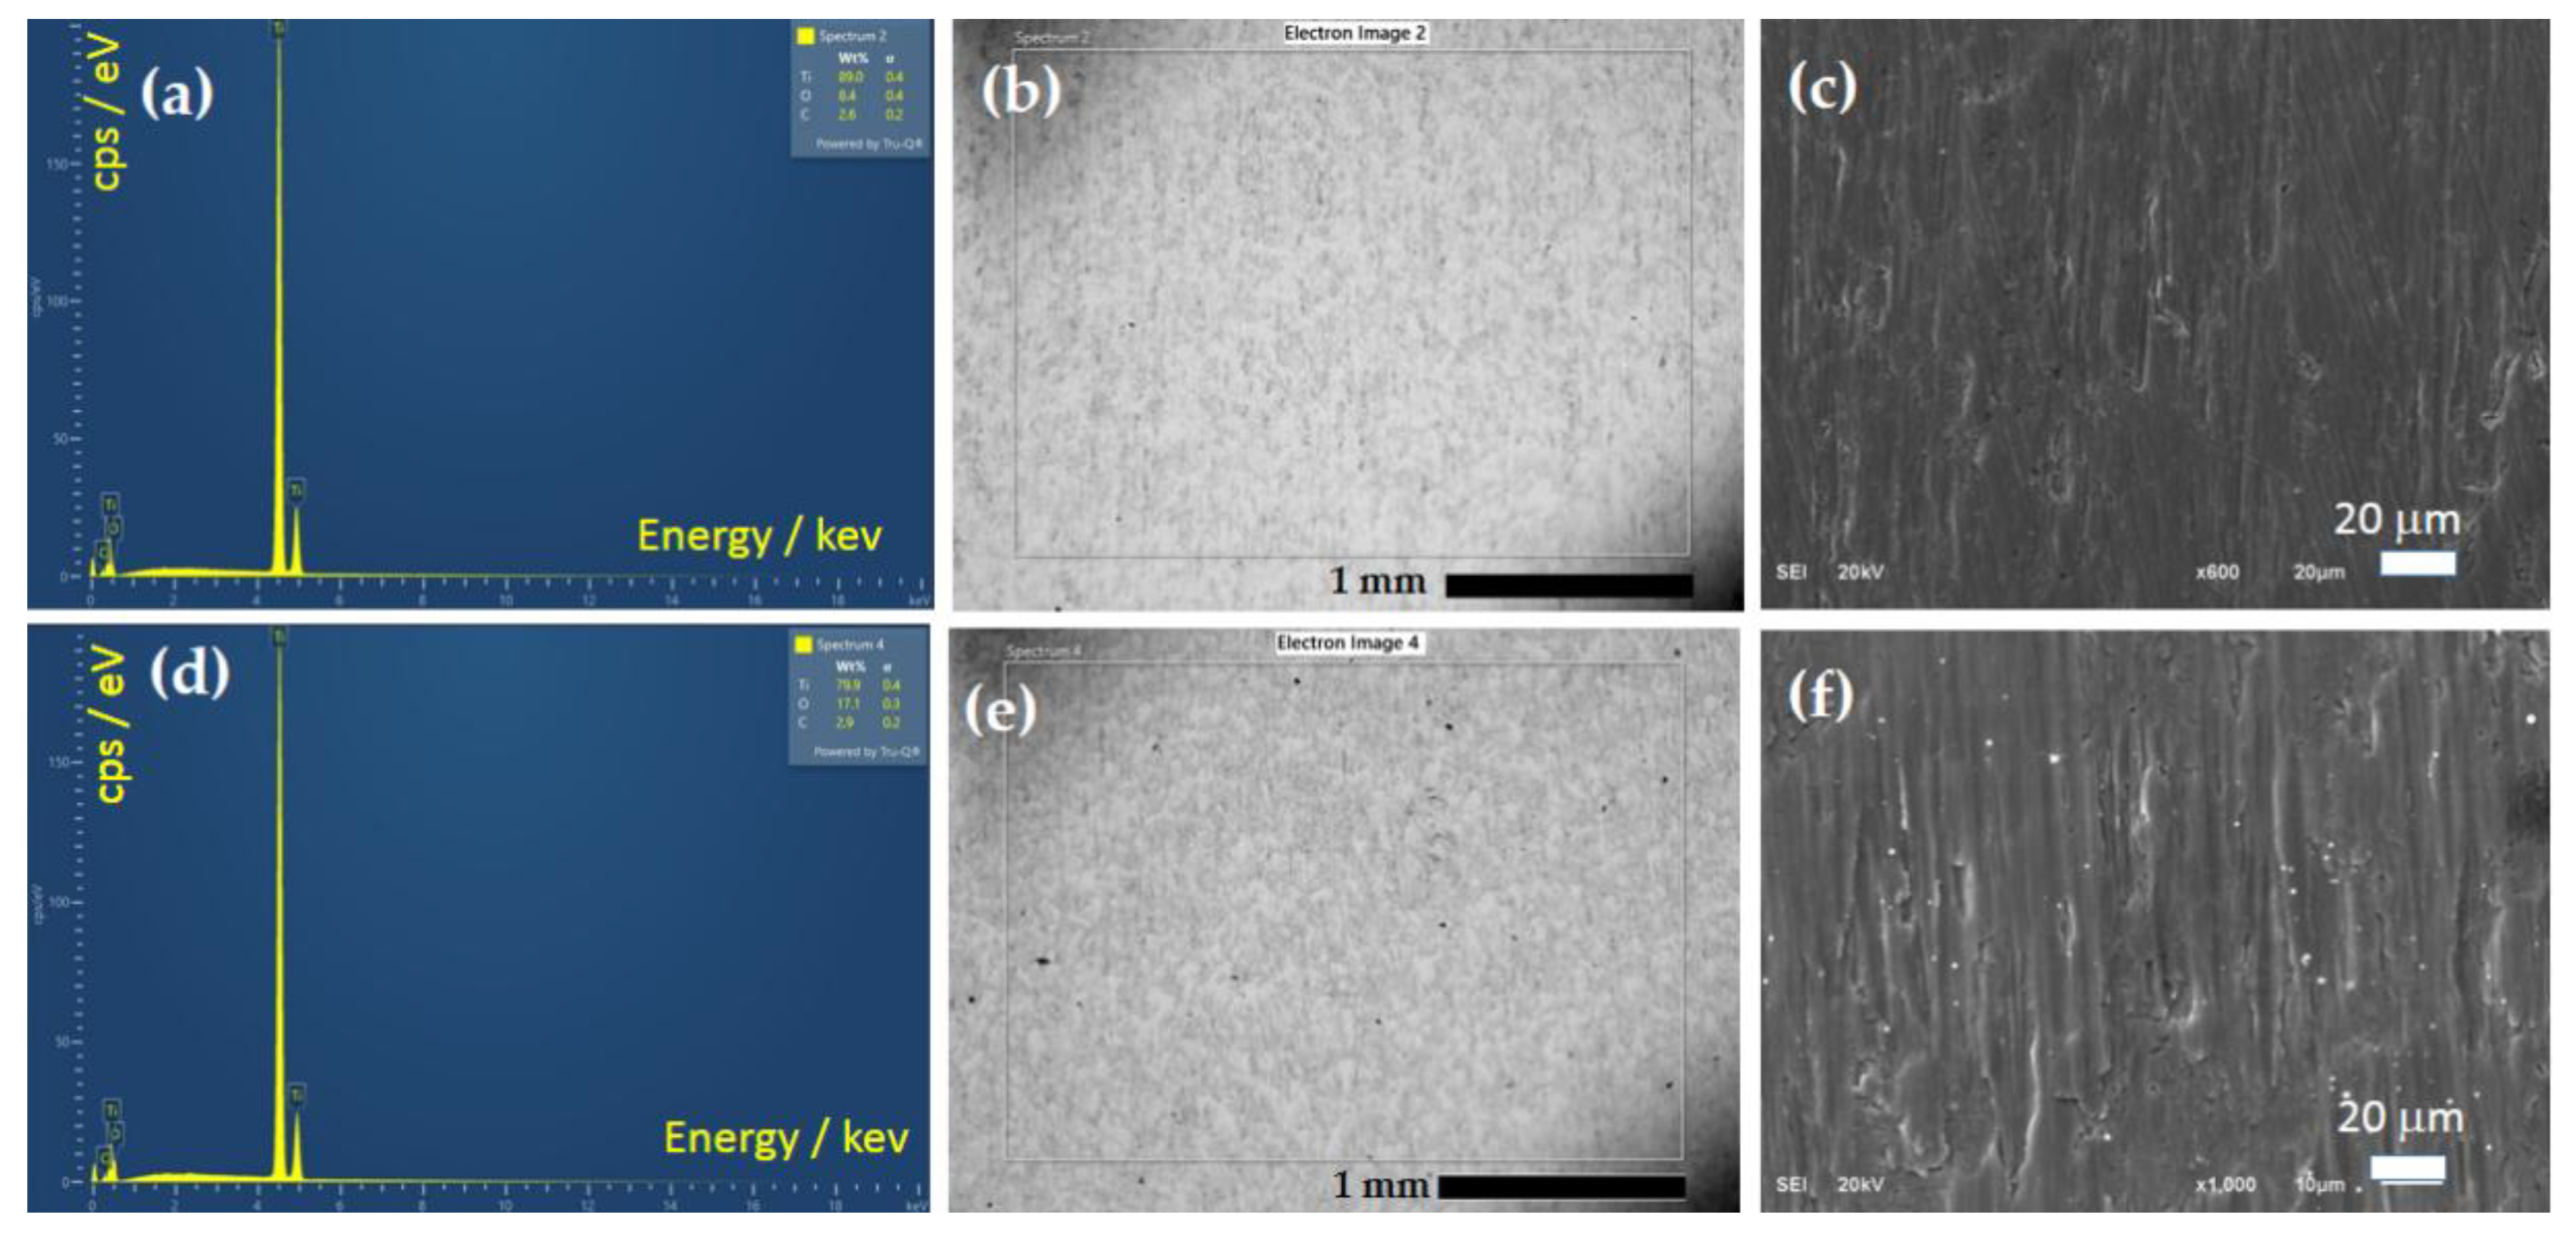
Figure 12.
Cell viability for the three groups polished Ti-0, anodized T-15 min, and Ti-45, at 7 days of culturing; Kruskal-Wallis test, **p < 0.01.
Figure 12.
Cell viability for the three groups polished Ti-0, anodized T-15 min, and Ti-45, at 7 days of culturing; Kruskal-Wallis test, **p < 0.01.
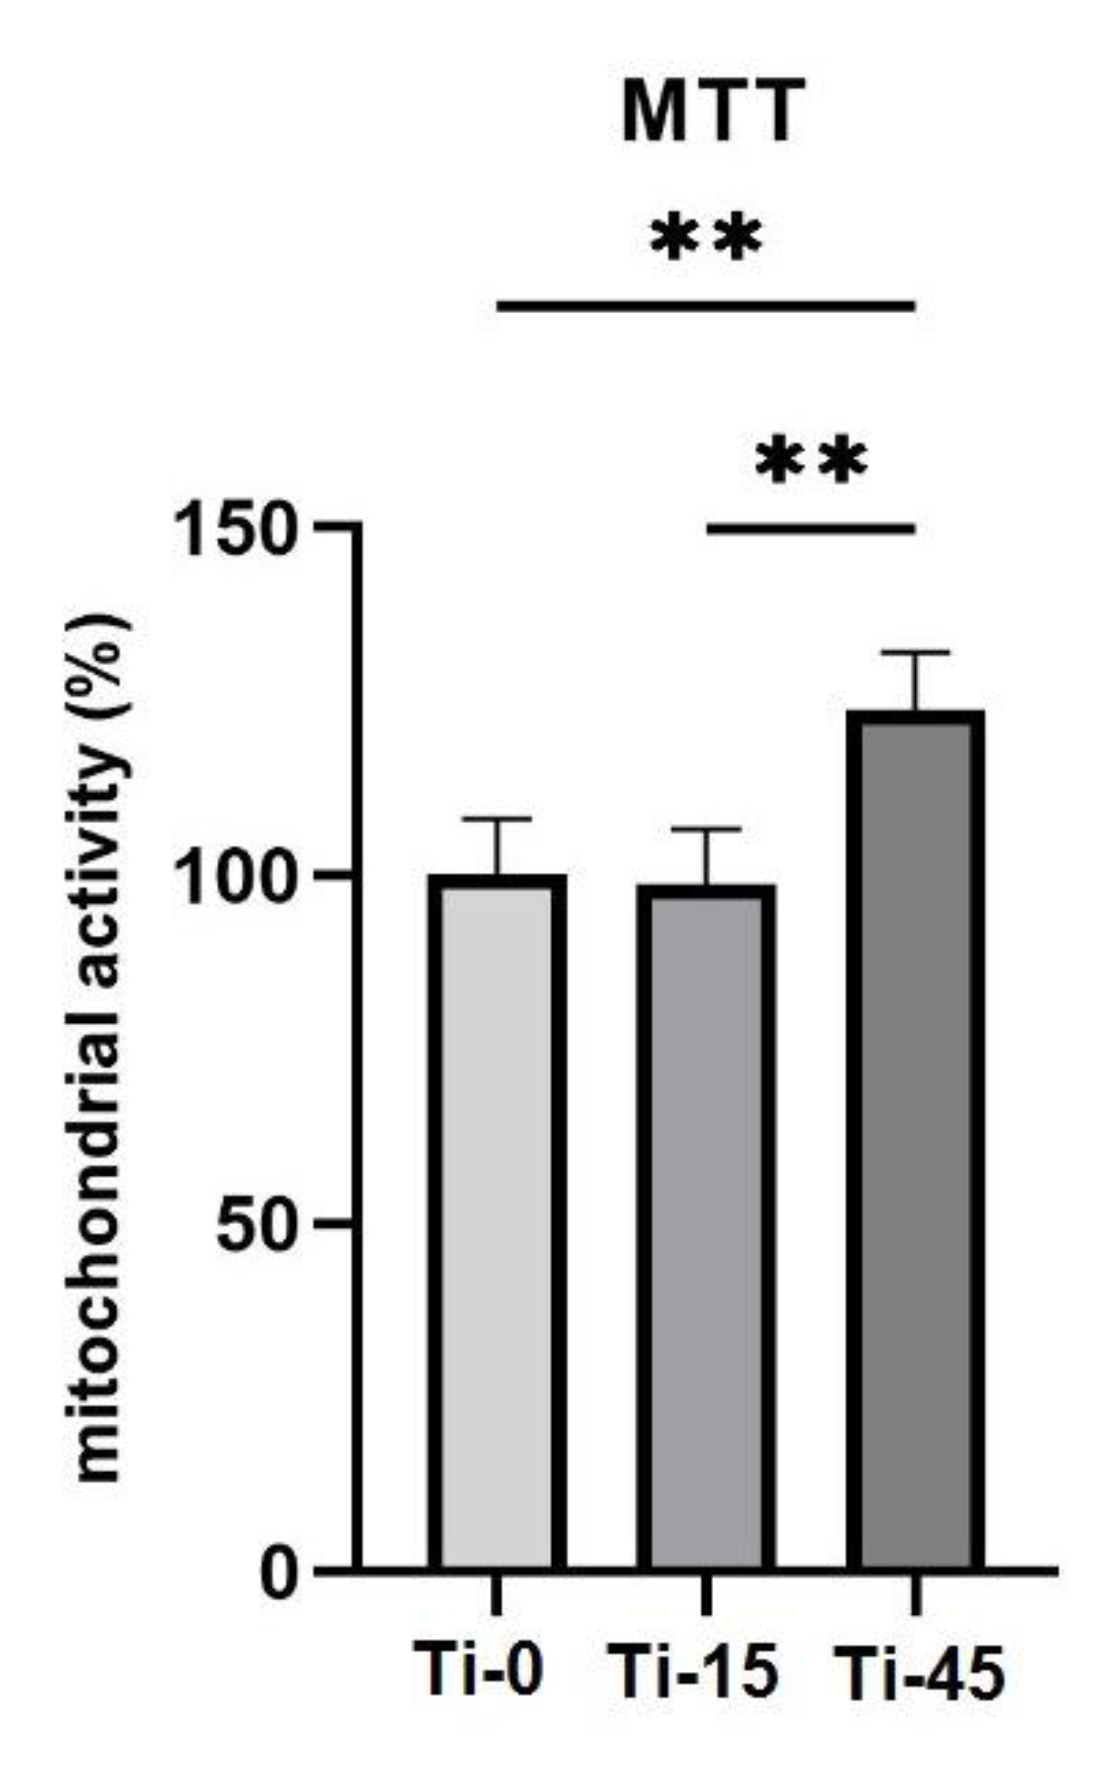
Figure 13.
Relative gene expression of N-cadherin, Vimentin, and VEGF-A, obtained after 7 days of HGF culturing on polished Ti (Ti-0), 15 min anodized Ti (Ti-15), and 45 min anodized Ti (Ti-45); Kruskal-Wallis test, *p<0.05, **p < 0.01.
Figure 13.
Relative gene expression of N-cadherin, Vimentin, and VEGF-A, obtained after 7 days of HGF culturing on polished Ti (Ti-0), 15 min anodized Ti (Ti-15), and 45 min anodized Ti (Ti-45); Kruskal-Wallis test, *p<0.05, **p < 0.01.
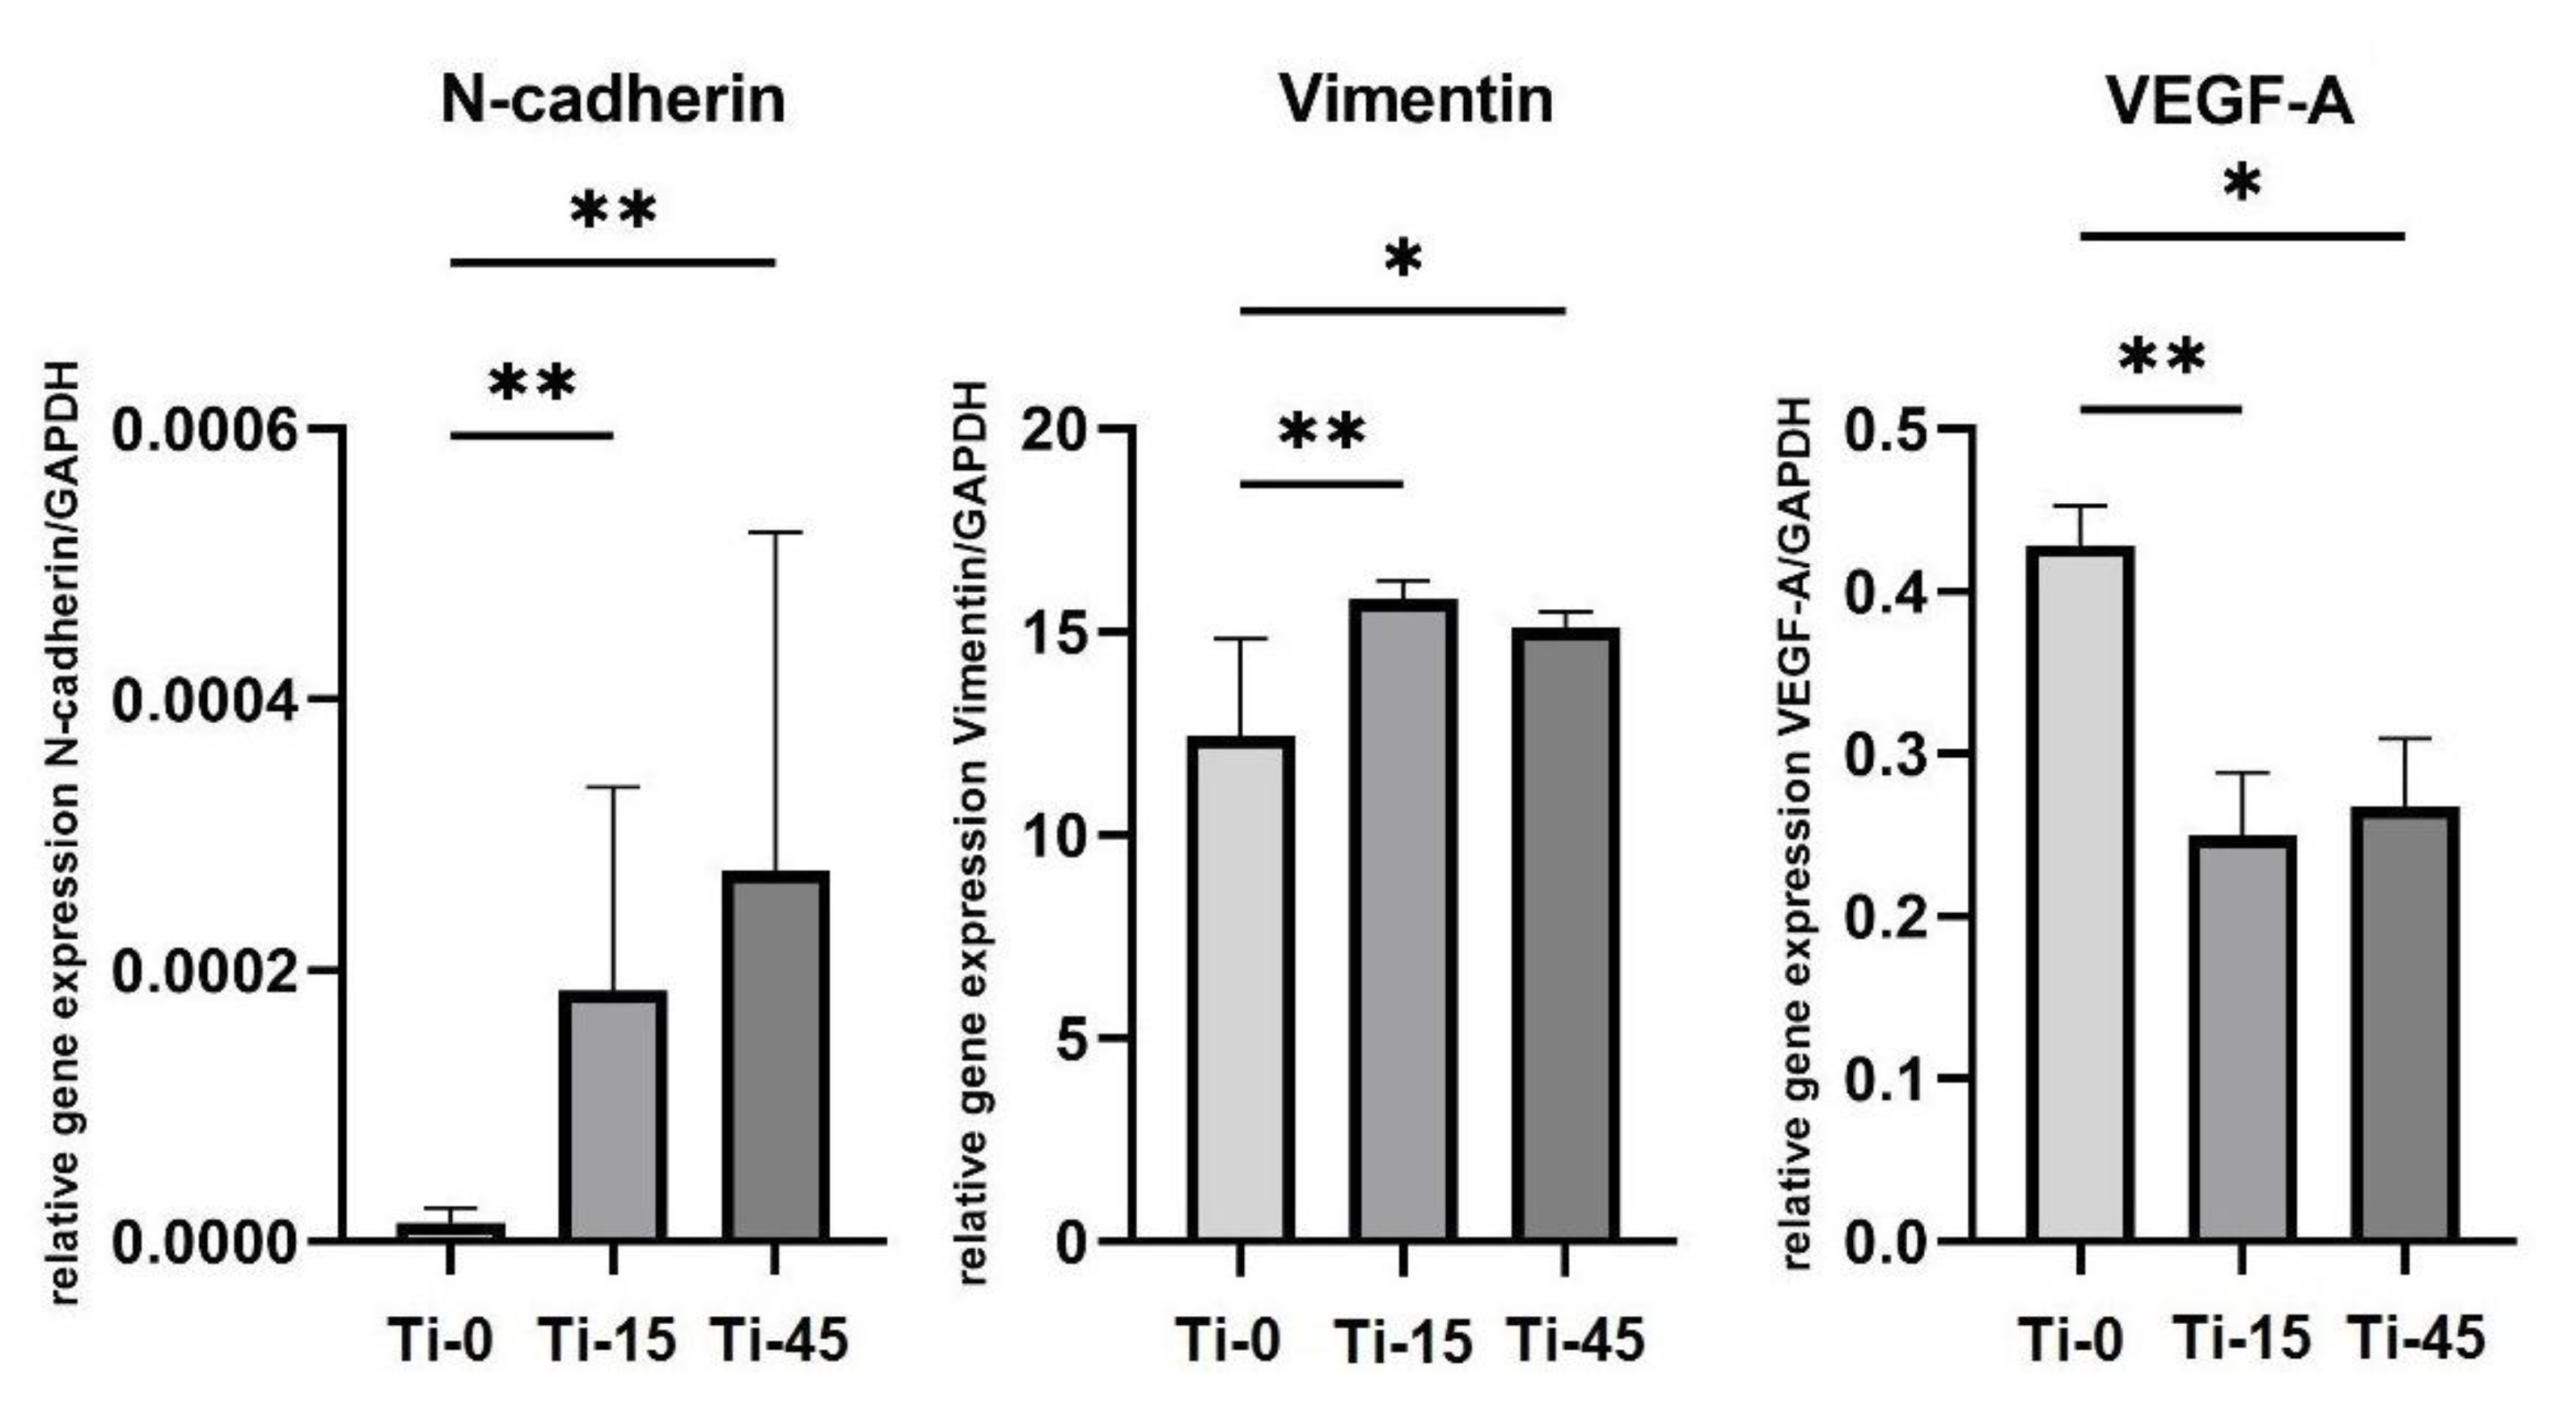

Table 1.
The primer sequences used for quantitative PCR (qPCR).
| Gene | Forward | Reverse |
| N-cadherin: | AGGGTGGACGTCATTGTAGC | CTGTTGGGGTCTGTCAGGAT |
| VEGF-A: | GGGAGCTTCAGGACATTGCT | GGCAACTCAGAAGCAGGTGA |
| Vimentin: | TCTACGAGGAGGAGATGCGG | GGTCAAGACGTGCCAGAGAC |
| GAPDH: | TCATGACCACAGTCCATGCCATCA | CCTGTTGCTGTAGCCAAATTCGT |
Table 2.
The results of the color measurements of the pure, and anodized Ti.
| Sample | L* | a* | b* | Approximate color appearance |
| Ti-0 | 57,43 | 1,33 | 4,74 |  |
| Ti-15 | 36,44 | 6,19 | -12,87 |  |
| Ti-45 | 32,79 | 10,14 | -10,17 |  |
Table 3.
The summarized EDS analysis of the surfaces shown in Figure 4c and e.
Table 3.
The summarized EDS analysis of the surfaces shown in Figure 4c and e.
| Sample | Ti wt.% | O wt.% | Ti at.% | O at.% |
| Ti-0 | 98.4 | 7.1 | 82.2 | 17.8 |
| Ti-45 | 81.5 | 18.5 | 59.5 | 40.5 |
Table 4.
Lattice parameters determined by the Le Bail method.
| Lattice parameters, space group P63/mmc | |||
| Sample | a [Å] | b [Å] | c [Å] |
| Ti-0 | 2.9531 | 2.9531 | 4.6900 |
| Ti-45 | 2.9516 | 2.9516 | 4.6877 |
Table 5.
Summarized corrosion parameters of investigated samples in 9 g L–1 NaCl.
| Sample |
Eocp mV |
jocp nA cm–2 |
Rp MΩ cm2 |
jp,c nA cm–2 |
Ecorr mV |
bc mV dec–1 |
jcorr nA cm–2 |
jpass nA cm–2 |
Eb mV |
Erp mV |
ΔE mV |
| Ti-0 | 0 | 139 | 0.25 | 103 | –134 | –177 | 29 | ~5500 | 968 | 794 | 1102 |
| Ti-15 | 69 | 9.8 | 2.14 | 12 | –152 | –115 | 2.42 | 7-80 | 1032 | 835 | 1180 |
| Ti-45 | 75 | 4.9 | 3.48 | 7.3 | –154 | –116 | 1.84 | 4-20 | 1062 | 801 | 1225 |
Table 6.
The determined corrosion parameter as suggested by ISO 10271.
| Sample |
Eocp mV |
Ecorr mV |
j at Ecorr+0.3 V nA cm–2 |
Eb V |
jb nA cm–2 |
| Ti-0 | 0 | –134 | 650 | 0.968 | 8500 |
| Ti-15 | 69 | –148 | 12.1 | 0.1032 | 90 |
| Ti-45 | 75 | –163 | 4.7 | 0.1062 | 21 |
Table 7.
EDS analysis of the Ti-0 and Ti-45 after cyclic polarization test.
| Ti wt.% | O wt.% | Ti at.% | O at.% | |
| Ti-0 | 91.4 | 8.6 | 78.0 | 22.0 |
| Ti-45 | 82.4 | 17.6 | 61.0 | 39.0 |
Table 8.
Descriptive statistics of wettability measurements.
| Reference liquid | Sample | Mean | St. dev | Min | Max |
| Distilled water | Ti-0 | 50.01 | 3.83 | 45.20 | 54.81 |
| Distilled water | T-15i | 42.43 | 1.90 | 39.88 | 44.98 |
| Distilled water | T-45i | 40.27 | 3.13 | 36.53 | 44.66 |
| Diiodomethane | Ti-0 | 36.10 | 1.73 | 33.90 | 38.23 |
| Diiodomethane | T-15i | 27.64 | 2.14 | 26.40 | 29.06 |
| Diiodomethane | Ti -45 | 24.20 | 1.60 | 22.5 | 25.4 |
| Ethylene-glycol | Ti-0 | 46.66 | 2.47 | 43.64 | 49.12 |
| Ethylene-glycol | Ti-15 | 36.05 | 2.15 | 33.90 | 37.06 |
| Ethylene-glycol | Ti 45 | 21.51 | 1.13 | 20.05 | 23.22 |
Note: n=5.
Disclaimer/Publisher’s Note: The statements, opinions and data contained in all publications are solely those of the individual author(s) and contributor(s) and not of MDPI and/or the editor(s). MDPI and/or the editor(s) disclaim responsibility for any injury to people or property resulting from any ideas, methods, instructions or products referred to in the content. |
© 2025 by the authors. Licensee MDPI, Basel, Switzerland. This article is an open access article distributed under the terms and conditions of the Creative Commons Attribution (CC BY) license (http://creativecommons.org/licenses/by/4.0/).
Copyright: This open access article is published under a Creative Commons CC BY 4.0 license, which permit the free download, distribution, and reuse, provided that the author and preprint are cited in any reuse.


