Submitted:
05 January 2026
Posted:
07 January 2026
You are already at the latest version
Abstract
The smart grid concept is based on the full integration of renewable energy sources. Due to the short- and long-term volatility of these sources, new flexibility measures are necessary to ensure the smart grid operates stably and reliably. One option is to convert renewable energy into hydrogen, especially during periods of generation overcapacity. So hydrogen that is produced can be stored effectively and used “just in time” to stabilize the power system by undergoing a reverse conversion process in gas turbines or fuel cells which then supply power to the network. On the other hand and in order to achieve a sustainable general energy system (GES) it is necessary to replace other forms of fossil energy use, such as that used for heating and other industrial processes. Research indicates that a comprehensive hydrogen supply infrastructure is required. This infrastructure would include electrolysers, conversion stations, pipelines, storage facilities, and hydrogen gas turbines and/or fuel cell power stations. Some studies in Germany suggest that the existing gas infrastructure could be used for this purpose. Further, nuclear and coal power plants are not considered reserve power plants (also German case), an additional 20–30 GW of generation capacity in H2 operated gas turbines and strong H₂ transportation infrastructure will be required over the next ten years. This paper describes the systematic transformation from today's power system to one that includes a hydrogen economy. It discusses the components of this new system in depth, focusing on current challenges and applications. Some scaled current applications demonstrate the state of the art in this area, including not only technical requirements (reliability, risks) and possibilities, but also economic aspects (cost, business models, impact factors).
Keywords:
Hydrogen technologies
; hydrogen infrastructure
; electrolyzer
; hydrogen storage
; energy hub
; modeling and simulation
; business models
; H2 project development
; risks
; costs
; CAPEX
; OPEX
; H2 use cases
1. Introduction
Reducing or avoiding greenhouse gas emissions and the associated limitation of global warming or the so-called climate risk index are some of the most important current goals of the global community. On the other hconsideringal and economic situation, the desire of many countries to be less dependent on their own energy supplies, the limited and geographically constrained availability of fossil fuels, and the globally uncertain and highly dynamic markets and prices are further increasing the need for energy independence, taking into account the possibilities for the various forms of energy for different application.
A sustainable and economically viable transformation to so called general energy system (GES), considering all usable forms of final energy such as electricity, heat, and gas for different consumer groups such as industry, commerce, households, and transport, is essential and must be viewed as a very long-term process [1].
Various levels of government, including the European Union (EU) and individual countries such as Germany, already have sustainability strategies in place. These strategies outline methods for reducing greenhouse gases and establish different timelines for achieving greenhouse gas neutrality.
The EU, for example, wants to achieve greenhouse gas neutrality by 2045 with its “Green Deal” program. In some federal states in Germany, such as Saxony-Anhalt, there are concrete sub-strategies, such as the hydrogen strategy, to implement the energy transition, also known as the “Energiewende”, which is a lengthy process that began in the 20th century and continues to this day (see Figure 1).
Generation by renewable energy plants, transport and distribution via the power grids, flexible loads, and storage (stationary and mobile) play a decisive role in the supply of electrical energy of the future and will continue to be expanded [2,3,4]. On the other hand, other sustainable and necessary forms of energy use, such as green heat for households or green gases for industry, are not being developed and integrated into the system in a way that is comparable to renewable electricity generation. In 2024, the share of renewable energies in the electricity sector in Germany were 54,4%, in the heating sector 18,1%, and in the transport sector 7,2% [5]. This development can certainly be explained by the initial focus on the electricity sector in the 2000s, among other things through the Renewable Energy Sources Act (EEG). Nevertheless, profound energy transformation is also necessary in the household and commercial sectors (especially heating) as well as in industry, including energy-intensive industries such as chemicals and steel (especially as a substitute for gas supplies) [6]. In the future, this will be possible through so-called sector coupling—Phase 3 Measure 7 on Figure 1 of the overall energy transformation from around 2020, which basically produces sustainable, further usable forms of energy such as hydrogen from green electricity through various processes.
Sector coupling, currently one of the most important measures for driving forward the energy transition, particularly in other sectors, is a bundle of technical and organizational measures that will result in the majority of the energy consumed in the future being generated from renewable sources. In order to use this renewable energy (mostly wind or solar energy) effectively, it is first converted into electrical energy in highly efficient plants. Depending on demand, green electricity or products made from green electricity through Power-to-X processes are made available to the sectors that use them [7]. P2X distinguishes between the following areas, which represent a direct link and dependency between renewable energy and all sectors [8]:
- Power-to-Gas: Generation of energy gases from surplus renewable electricity through electrolysis and, if necessary, subsequent methanation (production of renewable natural gas by attaching hydrogen atoms to carbon atoms) as a central coupling element [9].
- Power-to-Heat: Use of surplus electricity in the heating market through the using controllable heating elements in local heat storage systems, district heating systems, or the connection of heat pumps [10].
- Power-to-Chemicals: Use of surplus electricity in industry for the targeted production of basic chemicals for chemical products [11].
- Power-to-Liquids: Process for producing fuels from surplus electricity via electrolysis/hydrogen production to usable basic chemicals (methanol) or fuels from synthetic hydrocarbons (dimethyl ester, kerosene, etc.) [12].
Power2Gas technology, which enables green hydrogen production based on renewable energy generation and water, is one of the most important branches, particularly for industry, transport, and private households, in making them more sustainable and less dependent on energy imports. Hydrogen is already an indispensable raw material today and is also necessary as an energy source in various industrial processes. In the future, climate-friendly hydrogen is expected to replace fossil fuels to drive decarbonization forward and, especially for energy-intensive and gas-based industries, it often offers the only way to advance energy transition. In the chemical industry, it is used as a means of producing ammonia (for fertilizers), methanol, and other chemicals, and in petroleum refineries, it is necessary for use in the “cracking” of hydrocarbons. In steel production, it can already be used as an additive to natural gas in direct iron reduction to produce emission-free steel in the future (complete gas replacement also relevant for other industries such as copper). In addition, hydrogen enables the provision of high-temperature heat for energy-intensive industries and building heating and can be used directly in the transport sector as a propellant (hydrogen mobility) [15] or as a substrate for the production of synthetic fuels. Since hydrogen is versatile, could play a crucial role in the industrial, heating, and transportation sectors in the future (emission reduction), and is generally produced in a relatively costly and complex manner using renewable electricity and water, it is necessary to take a closer look at this challenge from both a technical application perspective (production process, transport and storage, safety and reliability) and economic perspective (costs, profits, business and operating models).
2. Hydrogen Infrastructure—Technical Requirements and Technologies
The hydrogen system can serve as an example of a cross-sector infrastructure (see Figure 2). It encompasses electricity generation, water treatment, hydrogen production facilities, transport, storage, and possible further processing facilities such as a synthesis reactor for methanol production. Due to the different energy conversion processes and the dynamics of the individual technologies and plants sector-specific and cross-sector), it is very complex [16].
2.1. Renewable Electricity Generation
Hydrogen can be produced in various ways: steam reforming, methane pyrolysis, and electrolysis. Independent and sustainable (green) hydrogen production is essentially based on the electrolysis process, in which renewable electricity is used to split treated water.
In order to meet the demand for renewable energies (photovoltaics, wind, biomass, hydropower) for direct use (electricity) or indirect processing (Power2X technologies), massive expansion is still required. The EU has set itself the goal of increasing the share of renewable energies to 45% by 2030 and reducing greenhouse gas emissions by 90% compared to 1990 levels by 2040. The expansion of renewable energies has been increasing continuously since 2000, especially photovoltaics and wind (onshore and offshore), although energy consumption is relatively high, which can be explained by increasing device efficiency but also by the number of consumers/devices, as shown by the Figure 3 using Germany as an example. This does not take into account the demand for electrolyze capacity (electricity capacity) and transport (electromobility), which will lead to challenges in meeting demand depending on time and costs.
2.2. Water Treatment for Electrolysis
In order to produce green hydrogen, it is necessary to provide not only electricity from renewable energy sources but also suitable water, known as ultrapure water. The treatment of ultrapure water takes place in several stages. Typically, pre-treatment begins in stage 1, e.g., with reverse osmosis in a reverse osmosis plant, with the aim of roughly removing ions, germs, and molecules so that the water treated here has a significantly lower conductivity. In stage 2—fine cleaning—(e.g., deionization or electrodeionization EDI), the pure water is further treated to remove any remaining dissolved salts and ions, resulting in ultrapure water with low conductivity (often below 0,1 μS/cm) and very high specific resistance (above 18,2 MΩ/cm). A final and optional polishing stage with mixed bed resins (mixed bed ion exchangers) may be necessary to achieve the highest degrees of purity and remove the last traces of impurities. Ultrapure water of the highest quality is necessary for an electrolyzer in order to avoid malfunctions, corrosion, and long-term damage (including the service life of the membranes) and is also a prerequisite for stable and efficient operation of the electrolysis [5]. In addition to ultrapure water for the electrolysis process, additional water is required to ensure the cooling of the electrolyzers. It can be noted that in order to produce 1 kg of hydrogen by electrolysis, between 12 and 30 L of raw water (groundwater, drinking water, seawater) are required (9 to 10 L of ultrapure water as raw material and the need for cooling water and water necessary for the treatment of the raw water), which must certainly be taken into account in the overall assessment of the hydrogen infrastructure.
2.3. Electrolyzer
Electrolysis is a process in which water is directly split into hydrogen and oxygen molecules under the influence of an electric current supplied from an external power source. The charge carriers in the electrolysis process are anions and cations. At the negative electrode (cathode), hydrogen is released in a reduction process, while at the positive electrode (anode), oxygen is released in an oxidation process. It should be noted that the reactions occurring during electrolysis are the reverse of those occurring in electrochemical fuel cells. Technical devices capable of conducting these reactions in a controlled manner are called electrolyzers.
The current scale of actual hydrogen production and implementation of hydrogen technologies remains insufficient compared to political and market declarations. In conventional electrolysis, more energy is consumed to produce hydrogen than can later be recovered from it. The main barriers to the widespread adoption of this technology are the costs of electrolyzers and the electricity required for the electrolysis process. On average, about 3 kWh of electricity is needed to produce 1 m3 of hydrogen. Producing 1 kg of hydrogen at 25 °C and atmospheric pressure requires approximately 39 kWh of electricity and around 9-12 L of water (ultrapure water). Operating costs can be reduced by integrating electrolyzers with renewable energy sources. A separate challenge lies in ensuring adequate infrastructure for hydrogen transport and storage.
Several electrolysis technologies have been described in the literature, differing in technical parameters, process efficiency, material requirements, and integration potential with renewable energy sources [19]. The most technologically mature types of electrolyzers include:
- Alkaline electrolyzers (AES),
- Proton exchange membrane electrolyzers (PEM),
- Anion exchange membrane electrolyzers (AEM),
- High-temperature solid oxide electrolyzers (SOEC).
Alkaline electrolysis is currently considered the most mature technology in terms of industrial applications. Alkaline electrolyzers use potassium or sodium hydroxide solutions as the electrolyte. Typical operating parameters for AES electrolyzers include a current density of 0,2–0,4 A/cm2, an operating temperature range of 60–90 °C, and an energy efficiency of 60–70%. The use of readily available and inexpensive materials in their construction translates into lower investment and operational costs. The average capital cost is estimated at between 400 and 800 €/kW of electrolyzer capacity. These devices are also characterized by high durability, with a service life of up to 90 000 operating hours. The disadvantages of alkaline electrolyzers include relatively slow load dynamics (particularly important when powered by renewable energy sources such as photovoltaic panels and wind turbines), the risk of corrosion and the need for countermeasures, operational limitations at high pressures, and relatively large device dimensions in relation to power output [20,21].
PEM electrolyzers use a solid polymer membrane that exchanges protons as the electrolyte. These devices operate at temperatures between 50 and 80 °C and feature a compact design due to high current densities ranging from 1 to 2 A/cm2. PEM electrolyzers are more flexible to load variations (capable of rapid power changes within a short time), making them well suited for integration with renewable energy sources. Another significant advantage is their ability to operate at high pressures (30–70 bar), which reduces the energy required for subsequent hydrogen compression for delivery or storage. However, PEM technology is costly due to the use of expensive materials such as iridium and platinum as electrode catalysts. The production of durable polymer membranes also adds to the cost. Additional operational expenses arise from the need for high-purity water and advanced cooling systems. The estimated service life of PEM electrolyzers ranges from 20 000 to 40 000 operating hours, with a maximum efficiency of up to 75% [22,23,24].
AEM technology combines some advantages of alkaline (lower costs due to the use of cheaper catalyst materials) and PEM electrolyzers (compact size, solid polymer membrane electrolyte, capability for high-pressure operation). This technology is still under development. AEM electrolyzers exhibit efficiencies comparable to PEM devices, operating temperatures between 50 and 70 °C, and current densities from 0,5 to 1 A/cm2. The clear advantages of anion exchange membrane electrolyzers include less stringent water purity requirements and the absence of the need for noble metals. However, development challenges include achieving sufficient membrane stability and addressing polymer degradation in alkaline, oxygen-rich environments. The expected service life of AEM electrolyzers currently ranges from 2000 to 8000 operating hours [21,25].
High-temperature solid oxide electrolyzers (SOEC) operate at temperatures between 700 and 900 °C, requiring solid ceramic electrolytes. SOEC electrolyzers can reach efficiencies of up to 90% by reducing electrical energy demand through simultaneous hydrogen production and the utilization of residual heat from other industrial processes. An important advantage of operating at such high temperatures is the ability to directly electrolyze steam. However, these high operating temperatures also pose challenges, such as the need for expensive ceramic materials capable of withstanding thermal stress. Additional drawbacks include material durability issues after multiple thermal cycles and the necessity of a stable heat source [24,26,27].
A comparison of the parameters of the discussed water electrolysis technologies is presented in Table 1.
Integration of electrolyzers with renewable energy sources is essential for producing green hydrogen, but it brings a range of challenges and opportunities. Electrolyzers can be designed either for continuous operation at a constant load or for flexible operation with frequent start-up and shut-down cycles and varying power levels, to match the fluctuating generation from wind turbines and photovoltaic panels, so generally depending on defined use case scenarios based on generation and also consumer side. Suitable technologies for frequent power changes include PEM-type devices and some modern AEM units. Electrolyzers based on AES technology perform better in continuous operation mode, although modified designs have been developed to improve their flexibility.
2.4. Hydrogen Storage
In large industrial plants, the hydrogen produced by the electrolyzer is immediately consumed in on-site technological processes. However, in smaller-scale industry and transport applications, the generated gas must be stored for later use. Moreover, efficient hydrogen storage is essential for balancing the variable output of renewable energy sources (RES) and ensuring the energy security of hydrogen-based systems. Current hydrogen storage technologies can be divided into three main categories: physical, chemical, and geological.
The simplest physical hydrogen storage technology involves compressing the gas and storing it in tanks at pressures ranging from 200 to 700 bar. This solution is suitable for both stationary and mobile applications. Compressed hydrogen storage systems feature a volumetric energy density of about 5 MJ/dm3 and a gravimetric energy density of approximately 120 MJ/kg. Another physical hydrogen storage method is the storage of hydrogen in liquid form. Such storage offers higher volumetric energy density, reaching approximately 9 MJ/dm3. However, the liquefaction process requires energy-intensive cryogenic installations capable of cooling hydrogen to temperatures below −253 °C. For this reason, the technology is economically justified primarily for long-distance hydrogen transport and rocket propulsion. The main disadvantages of physical hydrogen storage technologies include additional costs associated with building and operating compression and liquefaction systems. It is also worth noting that hydrogen stored in liquid or compressed form has a lower energy density than fossil fuels [28,29,30].
Among chemical hydrogen storage technologies, LOHC (Liquid Organic Hydrogen Carriers) technology involves using liquid compounds, such as toluene, that chemically bind hydrogen through a catalytic process, enabling safe transport and storage in a manner similar to liquid fossil fuels. LOHC technology has great potential for large-scale hydrogen storage; however, hydrogen recovery requires a dehydrogenation process conducted at temperatures of 200–300 °C in the presence of catalysts. This is considered a drawback, as it generates additional costs and reduces overall energy efficiency. Another chemical hydrogen storage method involves hydrogen absorption by metals to form metal hydrides (e.g., MgH2). This process is regarded as safe, but the resulting materials are heavy and require temperatures of about 300–400 °C to release the stored hydrogen [31].
The group of geological hydrogen storage methods (including caverns) appears to offer the most promising solutions for seasonal, large-scale storage of hydrogen. These methods include injecting hydrogen into porous rock formations, depleted natural gas and oil fields, and salt caverns. The latter are considered the safest and most leak-tight option, with available storage capacities reaching up to 5 000 tons of hydrogen and losses below 5% per year. Geological storage methods are viewed as a viable approach for long-term balancing of energy systems; however, their feasibility and economic viability strongly depend on local geological conditions [32,33]. A comparison of hydrogen storage methods is presented in Table 2.
2.5. Hydrogen Transport
In future, the hydrogen produced will generally be used at a different location than where it is generated, as electricity-based production from renewable energy sources will be the main source. Either mobile transport systems (low capacity) or hydrogen networks will be used to transport the hydrogen. The existing gas networks can already be used today (adding H2 to existing networks), converted/adapted (procedure for converting natural gas networks to hydrogen networks in accordance with the Energy Industry Act EnWG in Germany), or new dedicated hydrogen networks can be built, which involves considerable costs.
The example of Germany (transport length 13 300 km, high pressure 124 000 km, total 517 000 km) clearly shows that existing gas network structures are very well developed and suitable for meeting the new challenges of long-distance hydrogen transport at minimal cost (conversion or adaptation) in the future. According to [34], 80% of the gas networks in Germany are fundamentally suitable for hydrogen operation, as 11 000 km of the transport network has already been converted and the final configuration is expected to have an energy capacity of 504 TWh p.a. and a possible peak consumption of 110 GWh/h. Whether the existing capacities will have to be fully utilized or fully loaded in the future and whether further expansion/additional construction will be necessary depends on the expansion scenarios for the overall energy system, as domestic supply for heat provision is becoming less important (e.g., heat pumps instead of gas heating), so that gas connections and, in some cases, gas distribution networks will no longer be needed to the same extent, see Figure 4.
Another alternative for the direct use of hydrogen and feeding hydrogen back into the power grid (e.g., during power peaks or as a blueprint for renewable power generation) is direct combustion using gas engines. There are already many gas engines on the market that can operate efficiently and reliably with different mixtures of natural gas and hydrogen and can serve as a complete replacement for gas engines in the future. Conversion options for existing natural gas CHP plants are also likely to come onto the market as a further alternative, offering broad and long-term opportunities for a complete switch to green hydrogen operation [35] and thus increasing the sustainability of the overall energy system.
2.6. H2 Use and Consumption
Green hydrogen has a wide range of applications, but due to its properties (e.g., energy density), its use is concentrated in power system, in industry as an energy source or substrate for various production processes (material use of hydrogen).
In the power system hydrogen will be use in the levelling and backup gas turbine for support, balance and by deficit of renewable generation [35]. The main industrial sectors are steel, chemicals, and refineries, where green hydrogen is a unique alternative on the path to sustainability and will increasingly serve as a substitute for natural gas (including CO2 reduction). Other areas of application for H2 include transportation (fuel cell-powered vehicles), heating (direct firing, reduction of energy conversion stages), and energy (feedback into the power grid). It is expected that there will be an increasing demand for green hydrogen worldwide in the future. In Germany alone, 71 TWh will be needed in 2030 and 504 TWh in 2050 to reliably meet demand, with approximately 42 GW of secured generation having to be imported into Germany [36]. According to [34], the greatest demand in 2050 is expected to be in basic chemicals (approx. 30%) and chemical sites (approx. 18%), closely followed by transportation (approx. 18%) and the steel industry (approx. 16%—replacement of blast furnaces with direct reduction plants (DRI)). The heating sector’s demand for green hydrogen in 2050 is estimated at approx. 11% of total demand. Refineries using green hydrogen will play a minor role in 2050, accounting for approx. 0,7% [36].
3. System Modeling and Practical Project Development—Technical and Economic Requirements and Potential
The models and associated simulations are used to investigate and verify the properties of the system and its components and interrelationships, and to map their physical and technical characteristics. A fundamental distinction is made between static and dynamic simulations, whereby the aim of dynamic simulations is to verify the control behavior of the system under investigation, i.e., its operation. During the planning phase, static models are used to describe the physical properties of the individual operating resources, the so-called design values, and are then expanded to include economic and financial aspects. Individual models, see Figure 5, are connected as so-called black boxes (simplified/usable or complete models) in overall system structures, even across sectors, as energy hub models, whereby the interfaces, i.e., energy or coupling parameters, play a binding role.
The application of the energy hub modeling method allows highly complex structures of a multimedia energy conversion system to be represented in the form of a graph. Nodes of the graph represent the conversion processes, while media flows are represented by edges. Graph theory allows the relationships between input and output values (vectors) to be formulated mathematically. The input and output nodes enable the energy hub to be connected to other external structures and/or other energy nodes [8].
Depending on the application, the models can be highly complex, e.g., including replication via differential equations, which also contain Laplace transforms to enable the dynamic behavior of the plants or subsystems. For the planning of plants or, in this case, hydrogen infrastructures, it is sufficient to use static models that represent the individual plants and thus represent the overall system via the coupling point with the aid of, for example, efficiency factors, see Figure 6.
In addition to the technical models that represent the physical properties of the individual plants and the overall infrastructure, their economic properties (in this case, CAPEX and OPEX in particular) are also taken into account in order to derive an overall model of the infrastructure and thus be able to drive the project development forward. CAPEX stands for “capital expenditures” and refers to the investments a company makes to acquire, improve, or maintain long-term assets such as buildings, land, machinery, or equipment. CAPEX includes expenditures for physical assets that are necessary for the company’s business activities and are expected to provide benefits over a longer period of time. Investments in assets are usually significant and can affect the company’s financial position, future growth, and profitability. Therefore, they are often carefully planned and evaluated before decisions are mad [37]. OPEX, on the other hand, refers to the general operating expenses associated with the day-to-day operations of the company. These include expenses such as rent, salaries, utilities, marketing and sales, office supplies, and other similar costs. These expenses are typically recorded in the company’s income statement and have a direct impact on the company’s profit in a given fiscal year [38].
When developing a hydrogen infrastructure project, all phases of the plant’s life cycle are generally considered, starting with idea development, design and planning, installation and commissioning, as well as operation and management, including maintenance and servicing, where cross-sector characteristics (electricity, water, gas) with a higher degree of complexity are to be expected. Not only technical requirements such as reliability and safety must be considered, but also economic factors, in particular CAPEX and OPEX, i.e., for example, investment, H2 production, and operating costs for the entire infrastructure.
Technical requirements already play a major role when considering electricity and water sources, i.e., it makes a technical and economic difference whether the electricity comes directly from renewable sources (required area, volatility, energy storage requirements to ensure continuous supply, electrical distance to the electrolyzer, fixed or variable electricity price PPA or direct sales) or the energy supply grid (note electricity mix, significantly higher stability of supply vs. renewable energy sources, possibly higher electricity transmission costs, grid effects, fixed or variable electricity price). These technical requirements regarding the electrical energy supply are reflected in the direct but also indirect costs (direct consumers or a hydrogen storage facility required, what volumes of hydrogen can be purchased when, and what quantities of hydrogen are required). In addition, there are direct technical requirements that may arise from the construction and operation of the electrolyzer on the part of the investor, such as technology (typically AEM or PEM), production efficiency (hydrogen and oxygen production capacity, nominal pressure, operating temperature, e.g.,: 80 kgH2/h, operating temperature 90+/-5 degrees Celsius), plant availability (e.g., 97% of the time), hydrogen purity (before and after purification, e.g.,: 99,995% and depending on further use, e.g.,: directly in the chemical industry or for mobility, which must first be transported further), electrolyzer power (e.g.,: 5 MW or 10 MW modules), electrolyzer supply voltage (depending on power and grid, but typically medium voltage 10, 20 kV), Cooling system (closed and self-sufficient or open), electrolyzer design (redundant, modular, or singular, pressure stages, e.g.,: 30 bar/g, and compressors), and operating options (standby, island, load-controlled, emergency operation).
The costs (CAPEX) defined in the idea development, design, and planning phase must be supplemented by initially estimated operating costs (OPEX), take technical and specific requirements into account, and estimate uncertain risks (costs). For a practical hydrogen infrastructure with an electrolyzer (including power − 10 MW, production capacities of 800 Nm3/h, efficiency of 0,85, plant availability of 8200 h/a] and a compressor with a mass flow of 90 kg/h coupled with an H2 storage tank (capacity 2000 kg), a cost model was developed taking into account all relevant parameters (including water consumption and costs, electricity consumption and price). Construction, installation, and commissioning play a decisive role in the investment costs (more than 40% of the total investment costs), followed by the electrolyzer as the system delivered to the installation site (more than 35% of the total investment costs). This cost structure for construction and commissioning is mainly due to the costs of the engineers and material costs (foundations), which have not yet been optimized, especially for new technologies, but this is expected to happen in the future. The costs of the technology are, on the one hand, the plant costs, which are also not yet widely used systems with long experience in planning and operation, as well as transport and insurance see Figure 7a. The costs for hydrogen storage and any compressors that may be necessary to achieve higher pressure levels are elements that can vary depending on the application (power supply to the electrolysis plant directly from renewable sources or from the grid, direct H2 use, e.g.,: in the chemical industry as a substrate or as an energy source for mobility). Engineering costs of approximately 4% must always be taken into account and should be optimized as experience with the planning, construction, and operation of such infrastructure increases.
Electricity costs for supplying the electrolyzer play a decisive role (more than 90%) in the operating costs of a hydrogen infrastructure and can vary greatly depending on the supply concept (grid connection, length of the line) and the price of electricity (renewable, grid electricity mix, PPA contracts, exchange purchase). Maintenance and repair costs include, among other things, maintenance of the systems and necessary repair costs (e.g.,: age-related replacement of membranes), hedging of possible risks in connection with guaranteed system availability (guaranteed parameters according to contract) and amount to approximately 9% in the example shown. On the other hand, the costs for water procurement play a minor role (0,3%), but may increase significantly in the future due to various scenarios (water scarcity, climate change) see Figure 7b.
When planning the hydrogen infrastructure, and in particular the electrolyzer, a technically viable solution must be found that meets the requirements and offers the most economical configuration between CAPEX and OPEX costs. On the one hand, there is the technological possibility of reducing the electrolyzer’s power consumption, which could clearly reduce OPEX, but on the other hand, this would increase the CAPEX of the plants due to reduced operating assets. On the other hand, increasing the hydrogen production capacity (operating hours) of a plant also means rising electricity costs and accelerated plant aging, and thus also the so-called maintenance CAPEX costs.
In the developed model of the overall hydrogen infrastructure, which takes into account both technical plant parameters such as efficiency, pressure stages, temperatures, and others, as well as economic parameters such as investment and operating costs, various scenario changes are calculated in order to investigate the possible influence on the cost structure.. Based on the base scenario system configuration (electrolysis capacity 10 MW, production capacity 800 Nm3/h, efficiency of 0,85, plant availability of 8200 h/a] and a compressor with a mass flow of 90 kg/h coupled with an H2 storage tank (capacity 2000 kg), see Figure 9, four further scenarios were developed and modeled:
1. Replacement of the AES with PEM technology for the electrolyzer,
2. System without H2 storage and necessary compressor,
3. Reduction of the pressure stage at the outlet from 700 bar to 350 bar,
4. Reduction of the expected operating hours from 8200h/a to 4000 h/a.
These scenario extensions correspond to real-world applications (e.g.,: direct H2 feed and therefore no H2 necessary because consumption is very high in relation to production, direct supply of the electrolyzer from renewable energy sources and therefore reduction of operating hours to 4000 h/a) and are evaluated in terms of possible CAPEX and OPEX impact.
Figure 8.
Cost allocation (CAPEX (a), OPEX (b)) for typical hydrogen infrastructure.
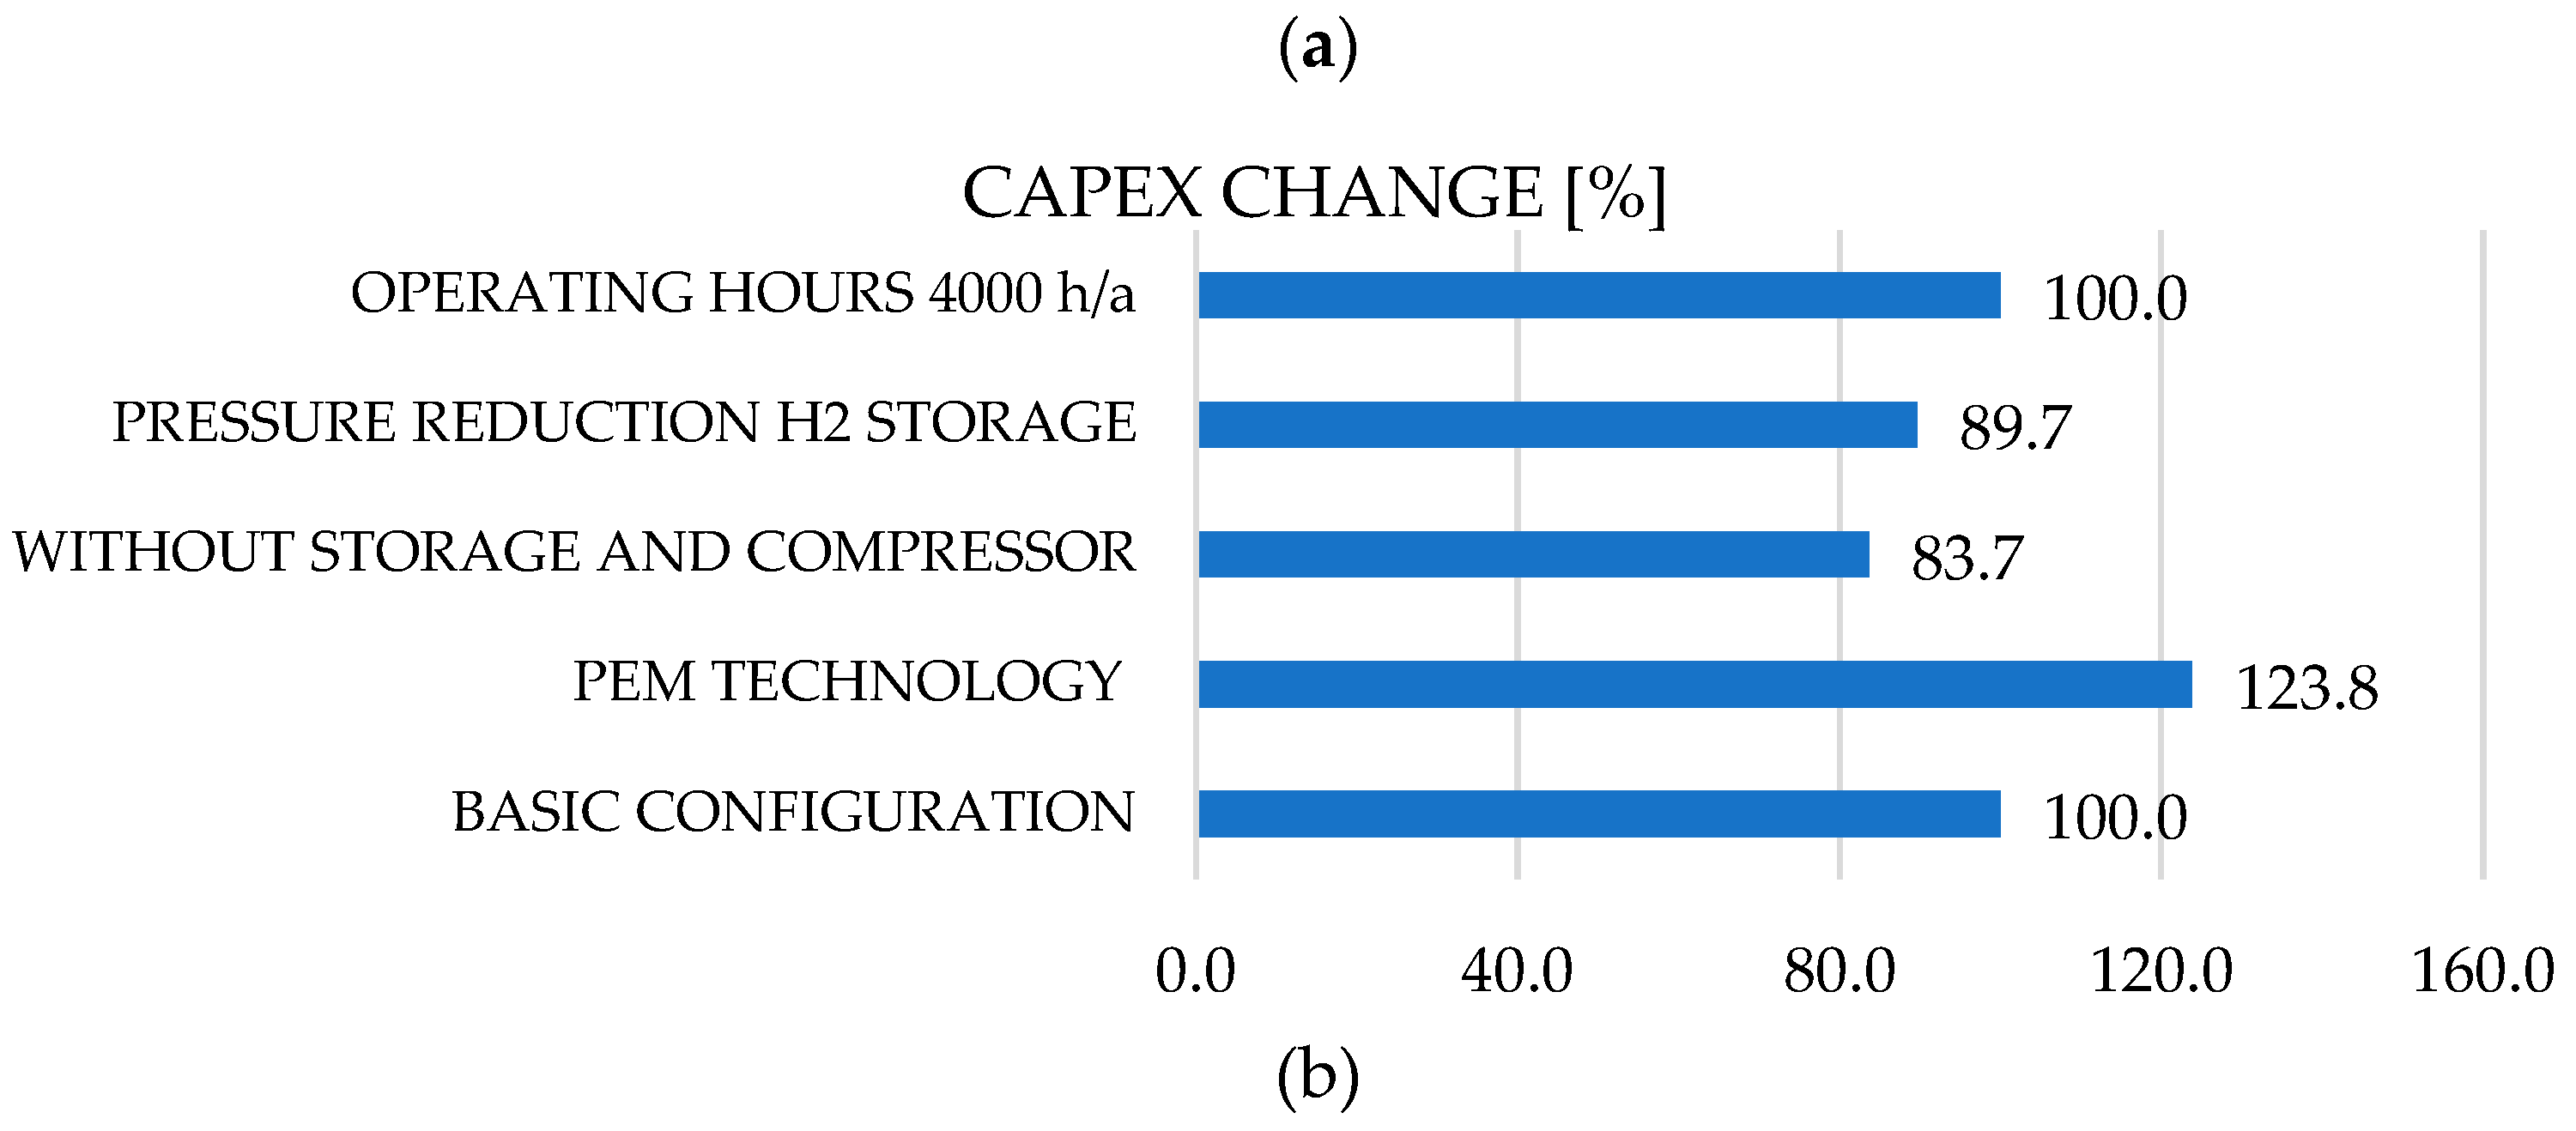
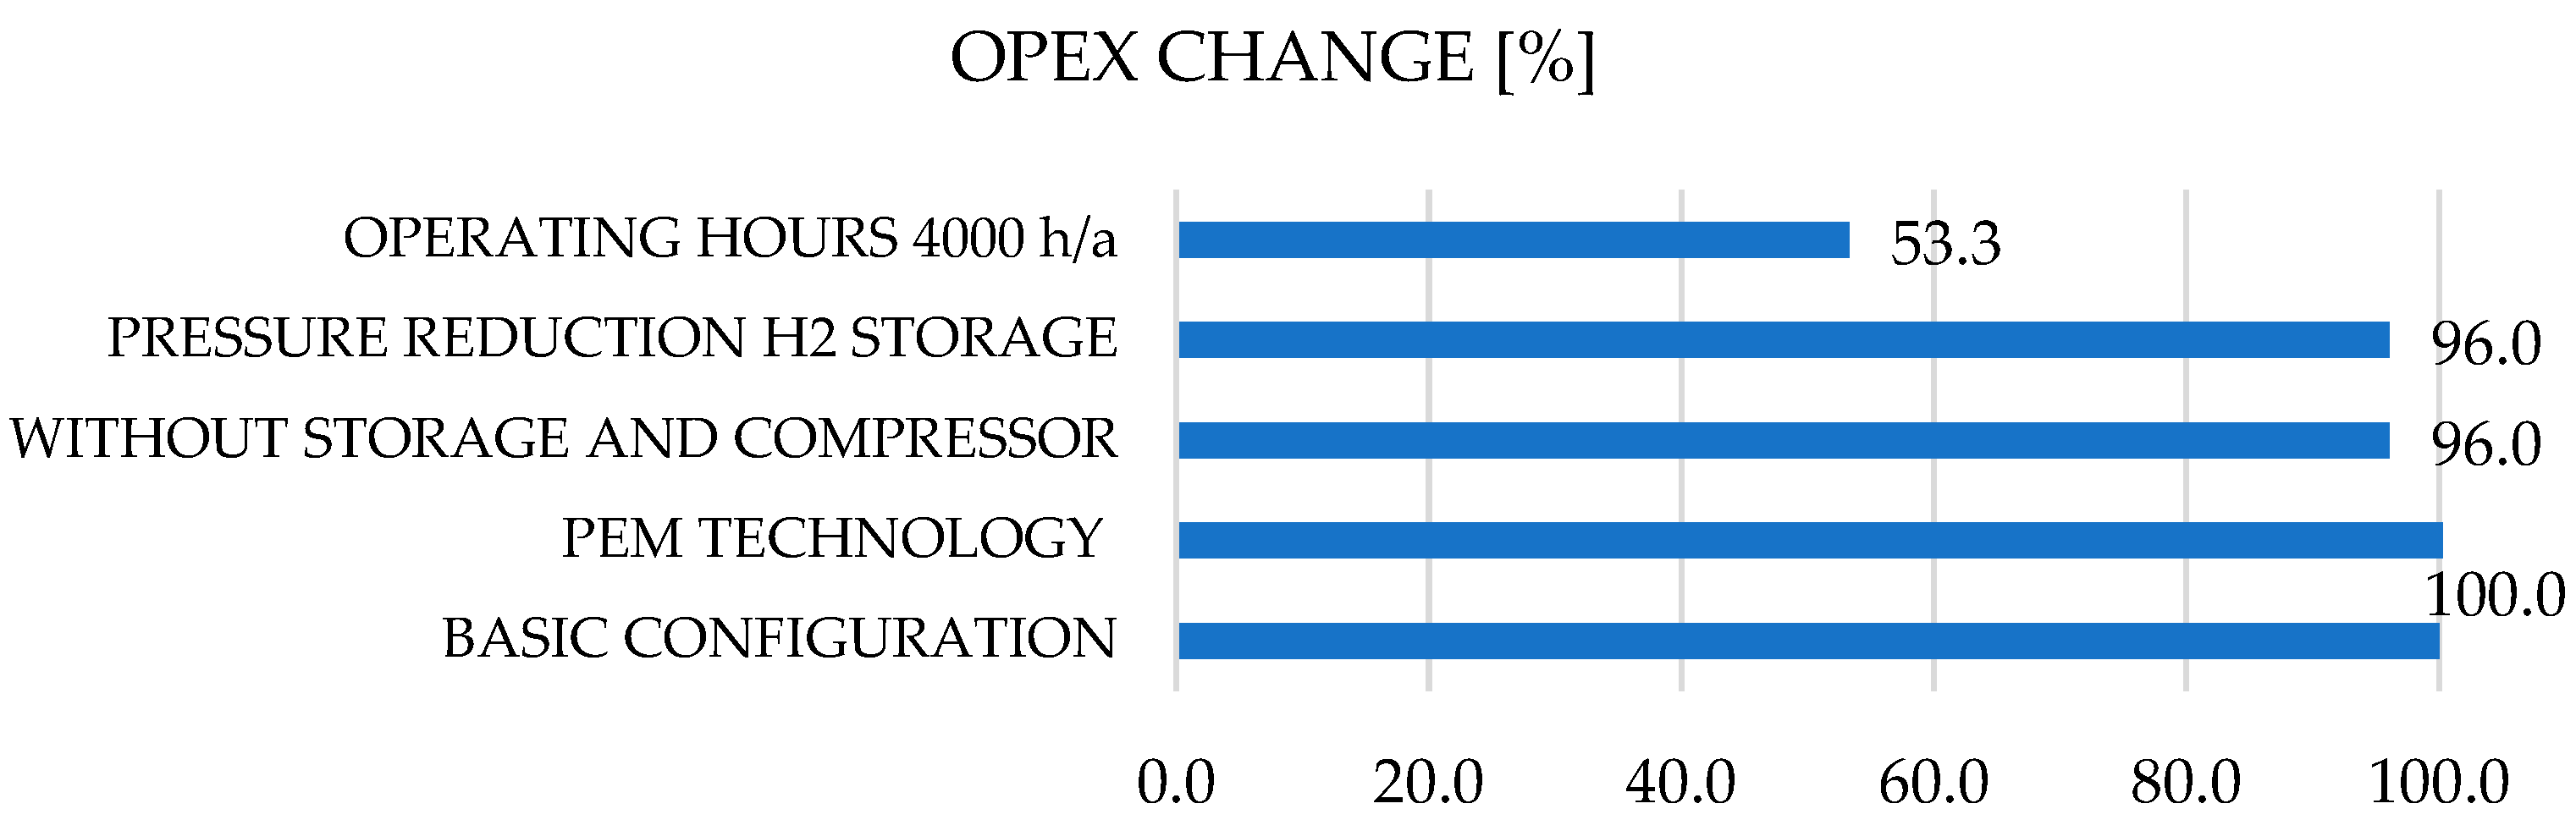
It should be noted that the large CAPEX increase of approximately 23% of the total investment is caused by the change in technology from AES to PEM, which in practice is justified by, for example, increased requirements for dynamic operation of the electrolyzer, e.g., direct renewable feed. The largest reduction in total CAPEX investment, approx. 16%, can be achieved by dispensing with the installation of the hydrogen storage tank and associated compressor, which is understandable in terms of plant costs and feasible for certain applications see Figure 8a. Operating costs (OPEX) can be significantly reduced by approximately 47% by halving the operating hours, which is due in particular to lower electricity costs and optimal operation of the systems (fewer cycles and less maintenance) Figure 8b. It should be noted that the optimization of both CAPEX and OPEX costs are interrelated and must always be considered on a case-by-case basis. For example, in the case of PEM electrolysers, CAPEX costs are generally reduced (e.g., by increasing the life cycle and durability of the plant, which reduces investment costs and, at the same time, operating costs), although there is a tipping point beyond which profits can decline. On the other hand, such complex and cross-sector hydrogen systems (power generation, water treatment, electrolyzer, storage, compressor, peripherals) are developed retrospectively, i.e., the system configuration is defined by end-use requirements (power, time and power gradients, limits, etc.).
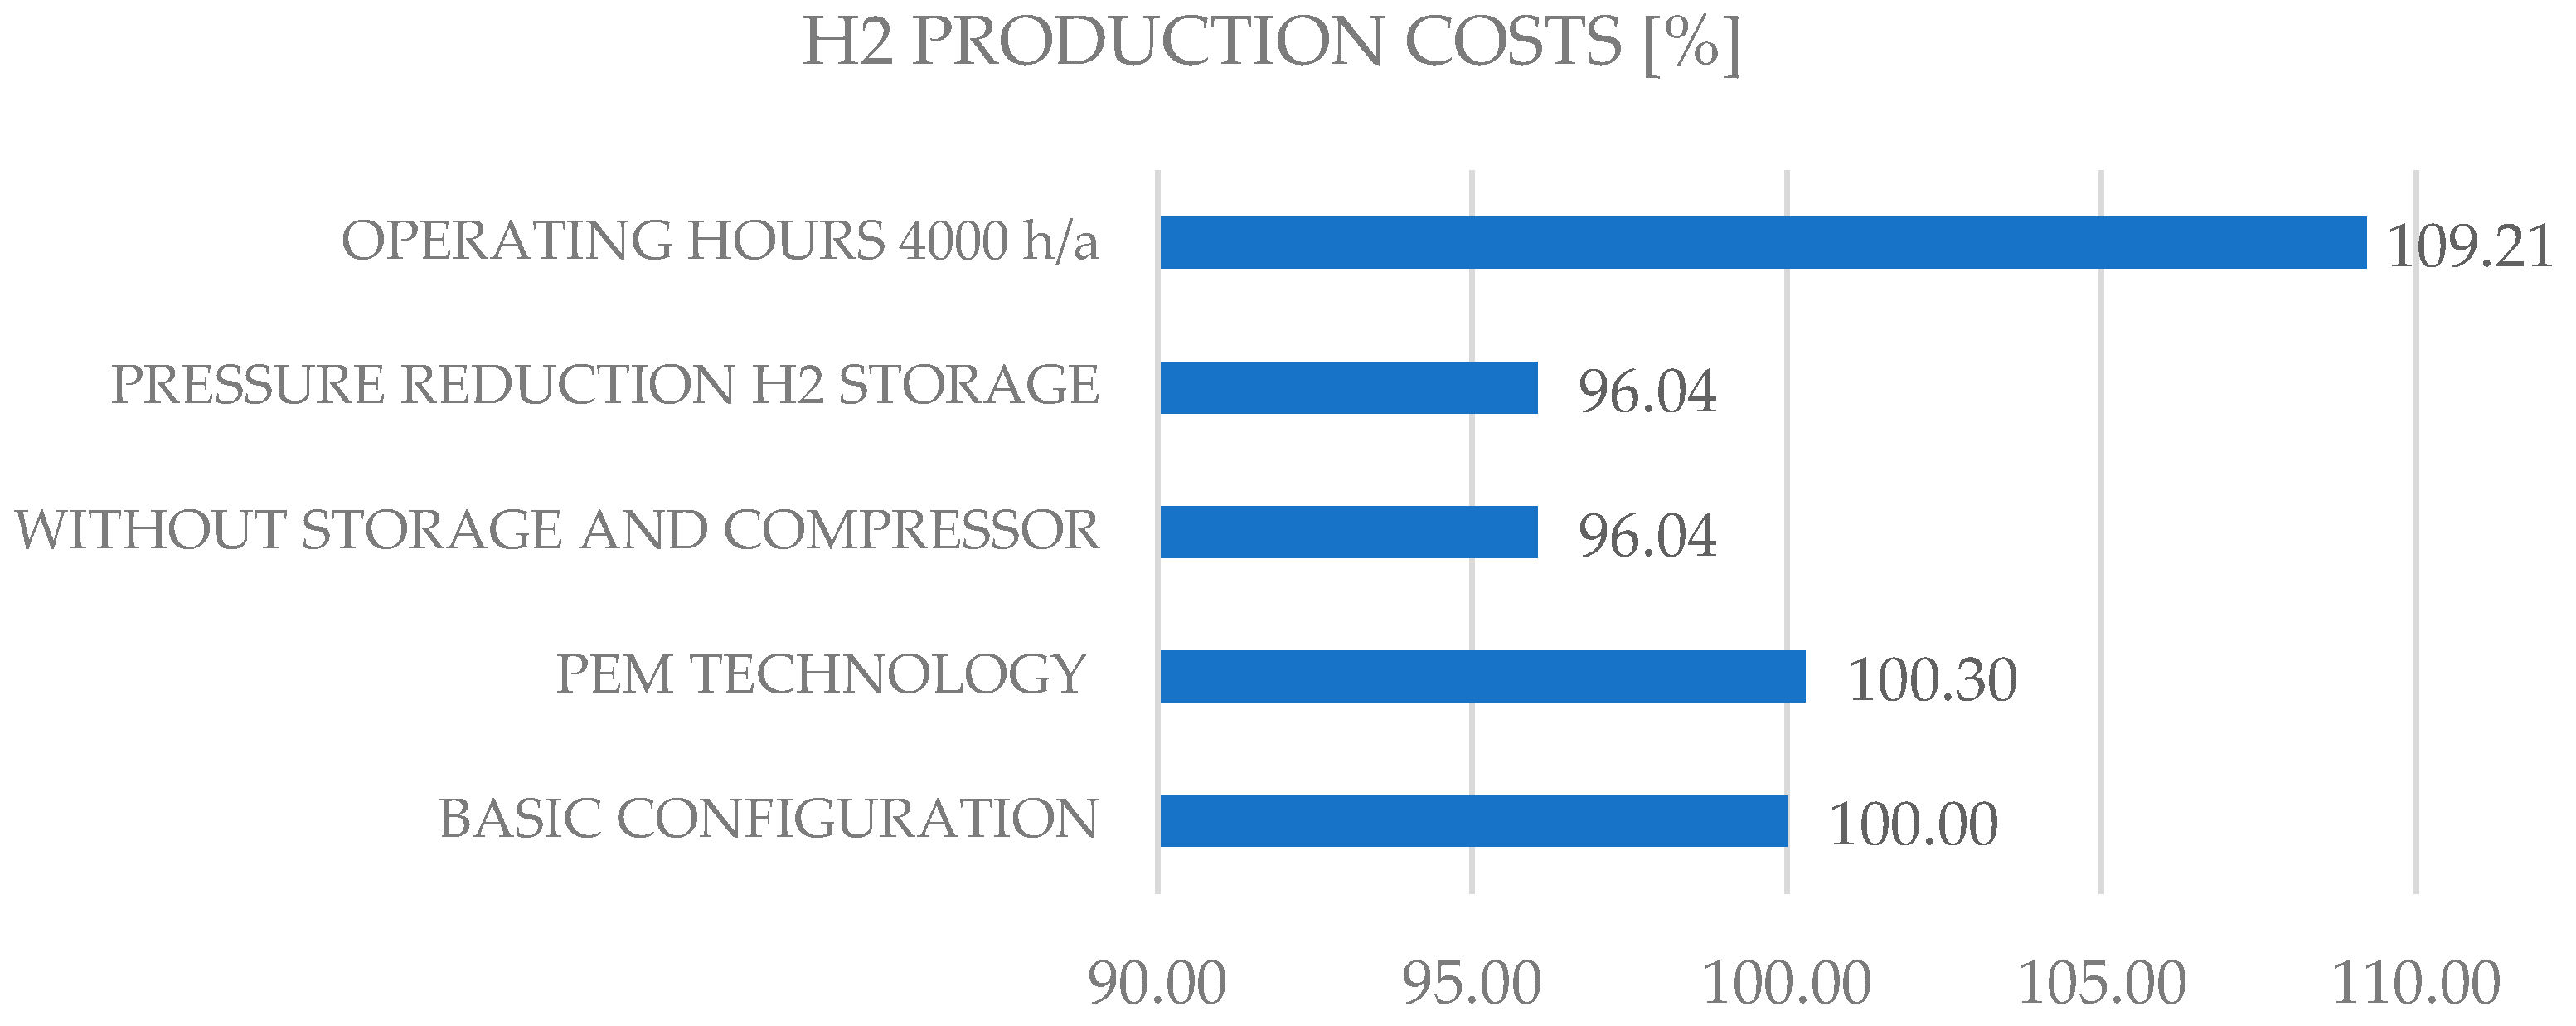
The final commercial and economic assessment of the overall system, including equipment and infrastructure, is reflected in the final price of the green hydrogen produced, so that competitive pricing can be achieved for customers, taking into account technical and environmental requirements, see Figure 9. As can be seen from the illustration, the price difference between different scenarios varies and can be influenced by CAPEX (e.g., without storage and compressor, the production price of 1 kgH2 is reduced by approx. 4% compared to the base) or OPEX (reduction of operating hours leads to an increase in the price of the production price of 1 kgH2 by approx. 9%), without taking into account possible transport costs, margins, and taxes. The future number for hydrogen costs to be achieved is 2 €/kg. Today, the cost of producing hydrogen from solar power plants is 6 €/kg and from wind power 4 €/kg. Regionally, green hydrogen can already be produced for 2.50 €/kg. For 2050, some scenarios simulated in various studies predict significantly lower costs for green hydrogen of up to 1.26 €/kg [1].
Figure 9.
H2 production costs in relation to different system and operating configurations.
The planning, construction, and operation of such complex and relatively new infrastructures, including technologies, involve various technical and subsequent economic direct and indirect risks that can only be considered to a limited extent when drawing up the financing concept. These include, among other things, technology ordering and its delivery and transport route (loading, unloading, mode of transport, and length), including insurance, adherence to deadlines for construction and commissioning, ensuring a neutral cash flow for such long and cost-intensive investments, continuous optimization of detailed planning, and adaptation to conditions and situations encountered. As can be seen from the case study presented and described for implementation, various technical and economic factors play an important role in developing and implementing an optimal case. In addition, the cross-sector hydrogen infrastructure (electricity, water, gas) offers many potentials, such as electricity storage or supplying other structures with green heat, but also poses various risks (new technologies, complex risk assessment that must be considered across sectors). Furthermore, the future will involve planning, building, and operating individual H2 infrastructures to create a continuous link beyond system boundaries and establish a hydrogen cycle, thereby exploiting various synergy effects (efficiency, flexibility, reliability) while ensuring technical feasibility and economic viability, see Figure 10. The multifaceted application possibilities of green hydrogen should be taken into account, considering its properties such as energy density and storage, thereby developing an energy cycle economy with a focus on green hydrogen as a hub for the energy transition, which, depending on necessity and thanks to the flexibility of H2, allows the reliability of supply to be ensured in all energy sectors, see Figure 10.
5. Discussion and Conclusions
Green hydrogen is necessary for achieving a reliable smart grid. This new, broad flexibility connected with the use of the hydrogen as an inside energy medium is necessary for stable operation of smart grid due to the increasing share of renewable energies. For that the development, implementation, and operation of complex and partially new infrastructures for green hydrogen, including specific additional facilities such as storage, compressors, and pipelines, depending on the application, is necessary from a technical, regulatory, and economic perspective. The sustainable energy transition for the energy sector and other sectors such as energy-intensive industries (steel, chemicals) can only be achieved by switching to green hydrogen as the starting product. Hydrogen universal properties such as high energy density, enabling better storage than other storage media such as batteries. It is therefore suitable for many applications and sectors, as it can function both as a raw material and energy source and as an energy storage medium. However, it is also clear that the production process for green hydrogen depends on many resources (including electricity and water) and that the conversion chain is associated with losses. This, together with the use of volatile renewable energy sources, means that such hydrogen infrastructures represent a relatively complex and completely new task. They have not yet been implemented on a large scale, and there is only limited experience and optimization approaches. As shown in the paper, it is apparent that both the technologies (especially electrolysers, but also storage facilities with a relatively manageable number of current producers) and the business models (CAPEX, OPEX, dynamic electricity prices, volatile energy sources, long-term projects with relatively long payback periods) currently still lead to a lack of planning security. Therefore, the regulatory framework (including hydrogen color and meaning) must be further developed in order to implement such systems in a scalable and economically viable manner. Nevertheless, a number of demonstration and production pilot plants are currently being built worldwide, especially in Europe, so it can be assumed that this technology, which is critical for sustainability, will become established in the near future.
Funding
This research was funded as part of the H2ITS project by Ministerium für Wissenschaft, Energie, Klimaschutz und Umwelt des Landes Sachsen-Anhalt (kurz: MWU Sachsen-Anhalt).
Conflicts of Interest
The authors declare no conflicts of interest.
References
- Komarnicki, P.; Kranhold, M.; Styczynski, Z.A. General Energy System (GES) of the Future essentials; Springer Fachmedien Wiesbaden: Wiesbaden, 2024; ISBN 978-3-658-45573-6. [Google Scholar]
- Wenge, C.; Arendarski, B.; Balischewski, S.; Pietracho, R. Renewable Self-Sufficient Energy Supply for Smart Devices in Urban Areas, Energy-Hub—Case Study. In Proceedings of the 2023 IEEE Power & Energy Society General Meeting (PESGM), July 16 2023; IEEE; pp. 1–5. [Google Scholar]
- Hallmann, M.; Wenge, C.; Komarnicki, P.; Balischewski, S. Methods for Lithium-Based Battery Energy Storage SOC Estimation. Part I: Overview. Arch. Electr. Eng. 2022, 139–157. [Google Scholar] [CrossRef]
- Wenge, C.; Arendarski, B.; Haensch, K.; Naumann, A.; Komarnicki, P. Electric Vehicle Simulation Models for Power System Applications. In Proceedings of the 2012 IEEE Power and Energy Society General Meeting; IEEE, July 2012; pp. 1–6. [Google Scholar]
- Energy-Sustainable Economy of the Future; 2012.
- Joyo, F.H.; Groppi, D.; Villani, L.; Irfan; Astiaso Garcia, D. Techno-Economic Assessment of Hydrogen Integration for Decarbonizing the Steel Industry: A Case Study. Hydrogen 2025, 6, 104. [Google Scholar] [CrossRef]
- Ingersoll, J.G. The Case of Renewable Methane by and with Green Hydrogen as the Storage and Transport Medium for Intermittent Wind and Solar PV Energy. Hydrogen 2024, 5, 209–229. [Google Scholar] [CrossRef]
- Komarnicki, P.; Kranhold, M.; Styczynski, Z.A. Sector Coupling—Energy-Sustainable Economy of the Future; Springer Fachmedien Wiesbaden: Wiesbaden, 2023; ISBN 978-3-658-38110-3. [Google Scholar]
- Franco, A.; Rocca, M. Hydrogen Injection into Natural Gas Grids as a Flexibility Option for Renewable Energy Integration and Storage. Hydrogen 2025, 6, 112. [Google Scholar] [CrossRef]
- Polakovičová, D.; Variny, M. Evaluating the Role of Hydrogen as an Energy Carrier: Perspectives on Low-Emission Applications. Hydrogen 2025, 6, 86. [Google Scholar] [CrossRef]
- Buonomenna, M.G. Proton-Conducting Ceramic Membranes for the Production of Hydrogen via Decarbonized Heat: Overview and Prospects. Hydrogen 2023, 4, 807–830. [Google Scholar] [CrossRef]
- Alturki, A. Techno-Economic Analysis of a Process to Convert Methane to Olefins, Featuring a Combined Reformer via the Methanol Intermediate Product. Hydrogen 2021, 3, 1–27. [Google Scholar] [CrossRef]
- Komarnicki, P.; Wenge, C.; Pietracho, R. Elektromobilność—Integracja Pojazdów Elektrycznych z Infrastrukturą Sieci Elektroenergetycznej. PRZEGLĄD ELEKTROTECHNICZNY 2020, 1, 3–15. [Google Scholar] [CrossRef]
- Pietracho, R.; Wenge, C.; Komarnicki, P.; Kasprzyk, L. Multi-Criterial Assessment of Electric Vehicle Integration into the Commercial Sector—A Case Study. Energies 2022, 16, 462. [Google Scholar] [CrossRef]
- Kasprzyk, L. Modelowanie Pracy Ogniw Paliwowych w Pojazdach Wodorowych. PRZEGLĄD ELEKTROTECHNICZNY 2021, 1, 119–122. [Google Scholar] [CrossRef]
- Kountouris, I.; Bramstoft, R.; Madsen, T.; Gea-Bermúdez, J.; Münster, M.; Keles, D. A Unified European Hydrogen Infrastructure Planning to Support the Rapid Scale-up of Hydrogen Production. Nat. Commun. 2024, 15, 5517. [Google Scholar] [CrossRef] [PubMed]
- bdwe Bruttostromerzeugung in Deutschland Nach Energieträger in Den Jahren 2000 Bis 2024 (in Terawattstunden). Available online: https://www.bdew.de/media/documents/2024_12_18_Die_Energieversorgung_2024_Final.pdf.
- bdew Stromverbrauch Nach Verbrauchergruppe in Deutschland in Den Jahren 2014 Bis 20241 (in Terawattstunden). Available online: https://de.statista.com/statistik/daten/studie/170390/umfrage/stromverbrauch-nach-sektoren-in-deutschland/.
- Buonomenna, M.G.; Patonia, A. Green Hydrogen in Europe: Where Are We Now? Hydrogen 2025, 6, 105. [Google Scholar] [CrossRef]
- Global Hydrogen Review 2023, 2023.
- El-Shafie, M. Hydrogen Production by Water Electrolysis Technologies: A Review. Results Eng. 2023, 20, 101426. [Google Scholar] [CrossRef]
- Backurs, A.; Jansons, L.; Laizans, A. Water Electrolysis Technologies: Comparison of Maturity, Operational and Cost Efficiency. 2025. [Google Scholar] [CrossRef]
- Carmo, M.; Fritz, D.L.; Mergel, J.; Stolten, D. A Comprehensive Review on PEM Water Electrolysis. Int. J. Hydrogen Energy 2013, 38, 4901–4934. [Google Scholar] [CrossRef]
- Vedrtnam, A.; Kalauni, K.; Pahwa, R. Water Electrolysis Technologies and Their Modeling Approaches: A Comprehensive Review. Eng 2025, 6, 81. [Google Scholar] [CrossRef]
- No Title. Available online: https://www.elektrolyseur-vergleich.de.
- Araújo, H.F.; Gómez, J.A.; Santos, D.M.F. Proton-Exchange Membrane Electrolysis for Green Hydrogen Production: Fundamentals, Cost Breakdown, and Strategies to Minimize Platinum-Group Metal Content in Hydrogen Evolution Reaction Electrocatalysts. Catalysts 2024, 14, 845. [Google Scholar] [CrossRef]
- Sezer, N.; Bayhan, S.; Fesli, U.; Sanfilippo, A. A Comprehensive Review of the State-of-the-Art of Proton Exchange Membrane Water Electrolysis. Mater. Sci. Energy Technol. 2025, 8, 44–65. [Google Scholar] [CrossRef]
- Singh, D.; Singh, N.K.; Sharma, A.K. Water Electrolysis Technologies for Producing Hydrogen: A Review. J. Renew. Sustain. Energy 2025, 17. [Google Scholar] [CrossRef]
- Yang, M.; Hunger, R.; Berrettoni, S.; Sprecher, B.; Wang, B. A Review of Hydrogen Storage and Transport Technologies. Clean Energy 2023, 7, 190–216. [Google Scholar] [CrossRef]
- Abdin, Z.; Tang, C.; Liu, Y.; Catchpole, K. Large-Scale Stationary Hydrogen Storage via Liquid Organic Hydrogen Carriers. iScience 2021, 24, 102966. [Google Scholar] [CrossRef]
- Wang, X.; Peng, P.; Witman, M.D.; Stavila, V.; Allendorf, M.D.; Breunig, H.M. Technoeconomic Insights into Metal Hydrides for Stationary Hydrogen Storage. Adv. Sci. 2025, 12. [Google Scholar] [CrossRef]
- Hematpur, H.; Abdollahi, R.; Rostami, S.; Haghighi, M.; Blunt, M.J. Review of Underground Hydrogen Storage: Concepts and Challenges. Adv. Geo-Energy Res. 2023, 7, 111–131. [Google Scholar] [CrossRef]
- Tarkowski, R. Underground Hydrogen Storage: Characteristics and Prospects. Renew. Sustain. Energy Rev. 2019, 105, 86–94. [Google Scholar] [CrossRef]
- FNB GAS Hydrogen Network 2050: For a Climate-Neutral Germany. Available online: https://fnb-gas.de/en/hydrogen-transport/hydrogen-network-2050-for-a-climate-neutral-germany/.
- Zhou, H.; Xue, J.; Gao, H.; Ma, N. Hydrogen-Fueled Gas Turbines in Future Energy System. Int. J. Hydrogen Energy 2024, 64, 569–582. [Google Scholar] [CrossRef]
- Fleiter, T.; Fragoso, J.; Lux, B.; Alibaş, Ş.; Al-Dabbas, K.; Manz, P.; Neuner, F.; Weißenburger, B.; Rehfeldt, M.; Sensfuß, F. Hydrogen Infrastructure in the Future CO 2 -Neutral European Energy System—How Does the Demand for Hydrogen Affect the Need for Infrastructure? Energy Technol. 2025, 13. [Google Scholar] [CrossRef]
- Symestic GmbH (Business Administration Guide) CAPEX (Capital Expenditure)—Meaning, Definition & Examples. Available online: https://symestic.com/de-de/was-ist/capex.
- Kenton, W. Operating Expense (OpEx) Definition and Examples. Available online: https://investopedia.com/terms/o/operating_expense.asp.
- Landesenergieagentur Sachsen-Anhalt GmbH (LENA) Energieatlas Sachsen-Anhalt. Available online: https://www.sachsen-anhalt-energie.de/de/energie-foerderung-beratung.html.
- Lipiäinen, S.; Lipiäinen, K.; Ahola, A.; Vakkilainen, E. Use of Existing Gas Infrastructure in European Hydrogen Economy. Int. J. Hydrogen Energy 2023, 48, 31317–31329. [Google Scholar] [CrossRef]
Figure 1.
Energy transition—The path to the sustainable GES of the future [1].
Figure 1.
Energy transition—The path to the sustainable GES of the future [1].
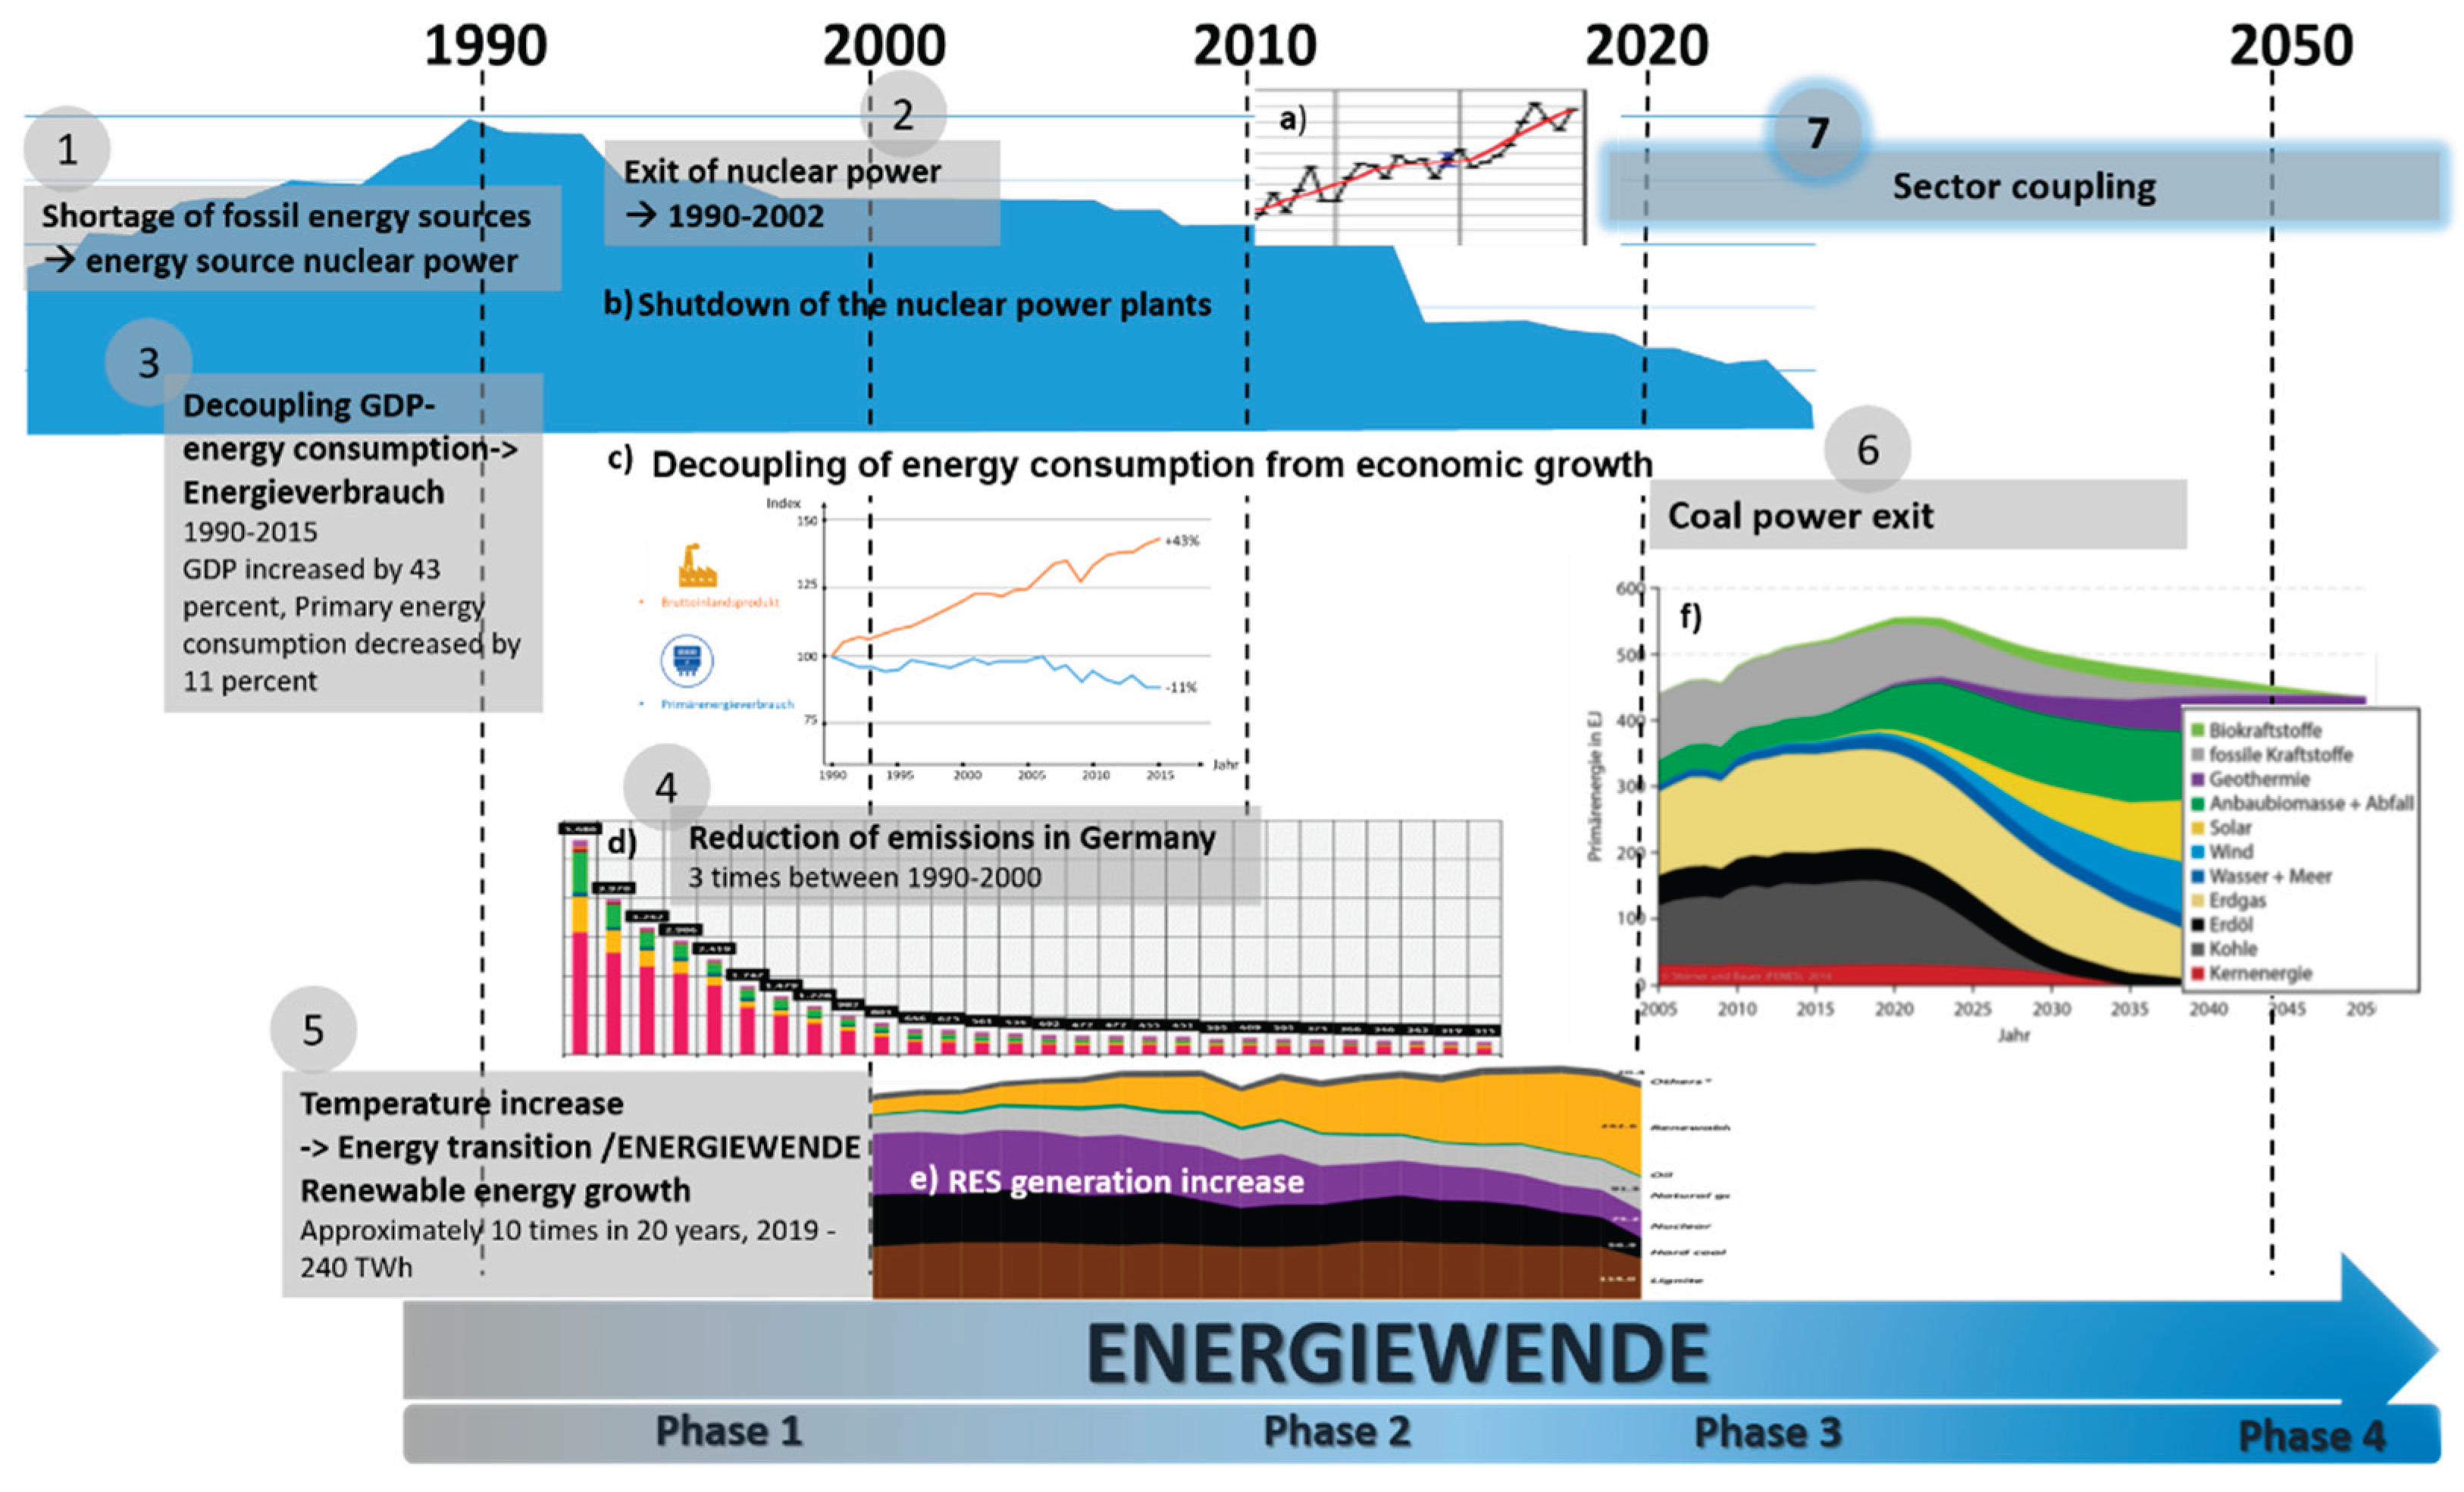
Figure 2.
Overall hydrogen infrastructure from production to consumption or further processing.
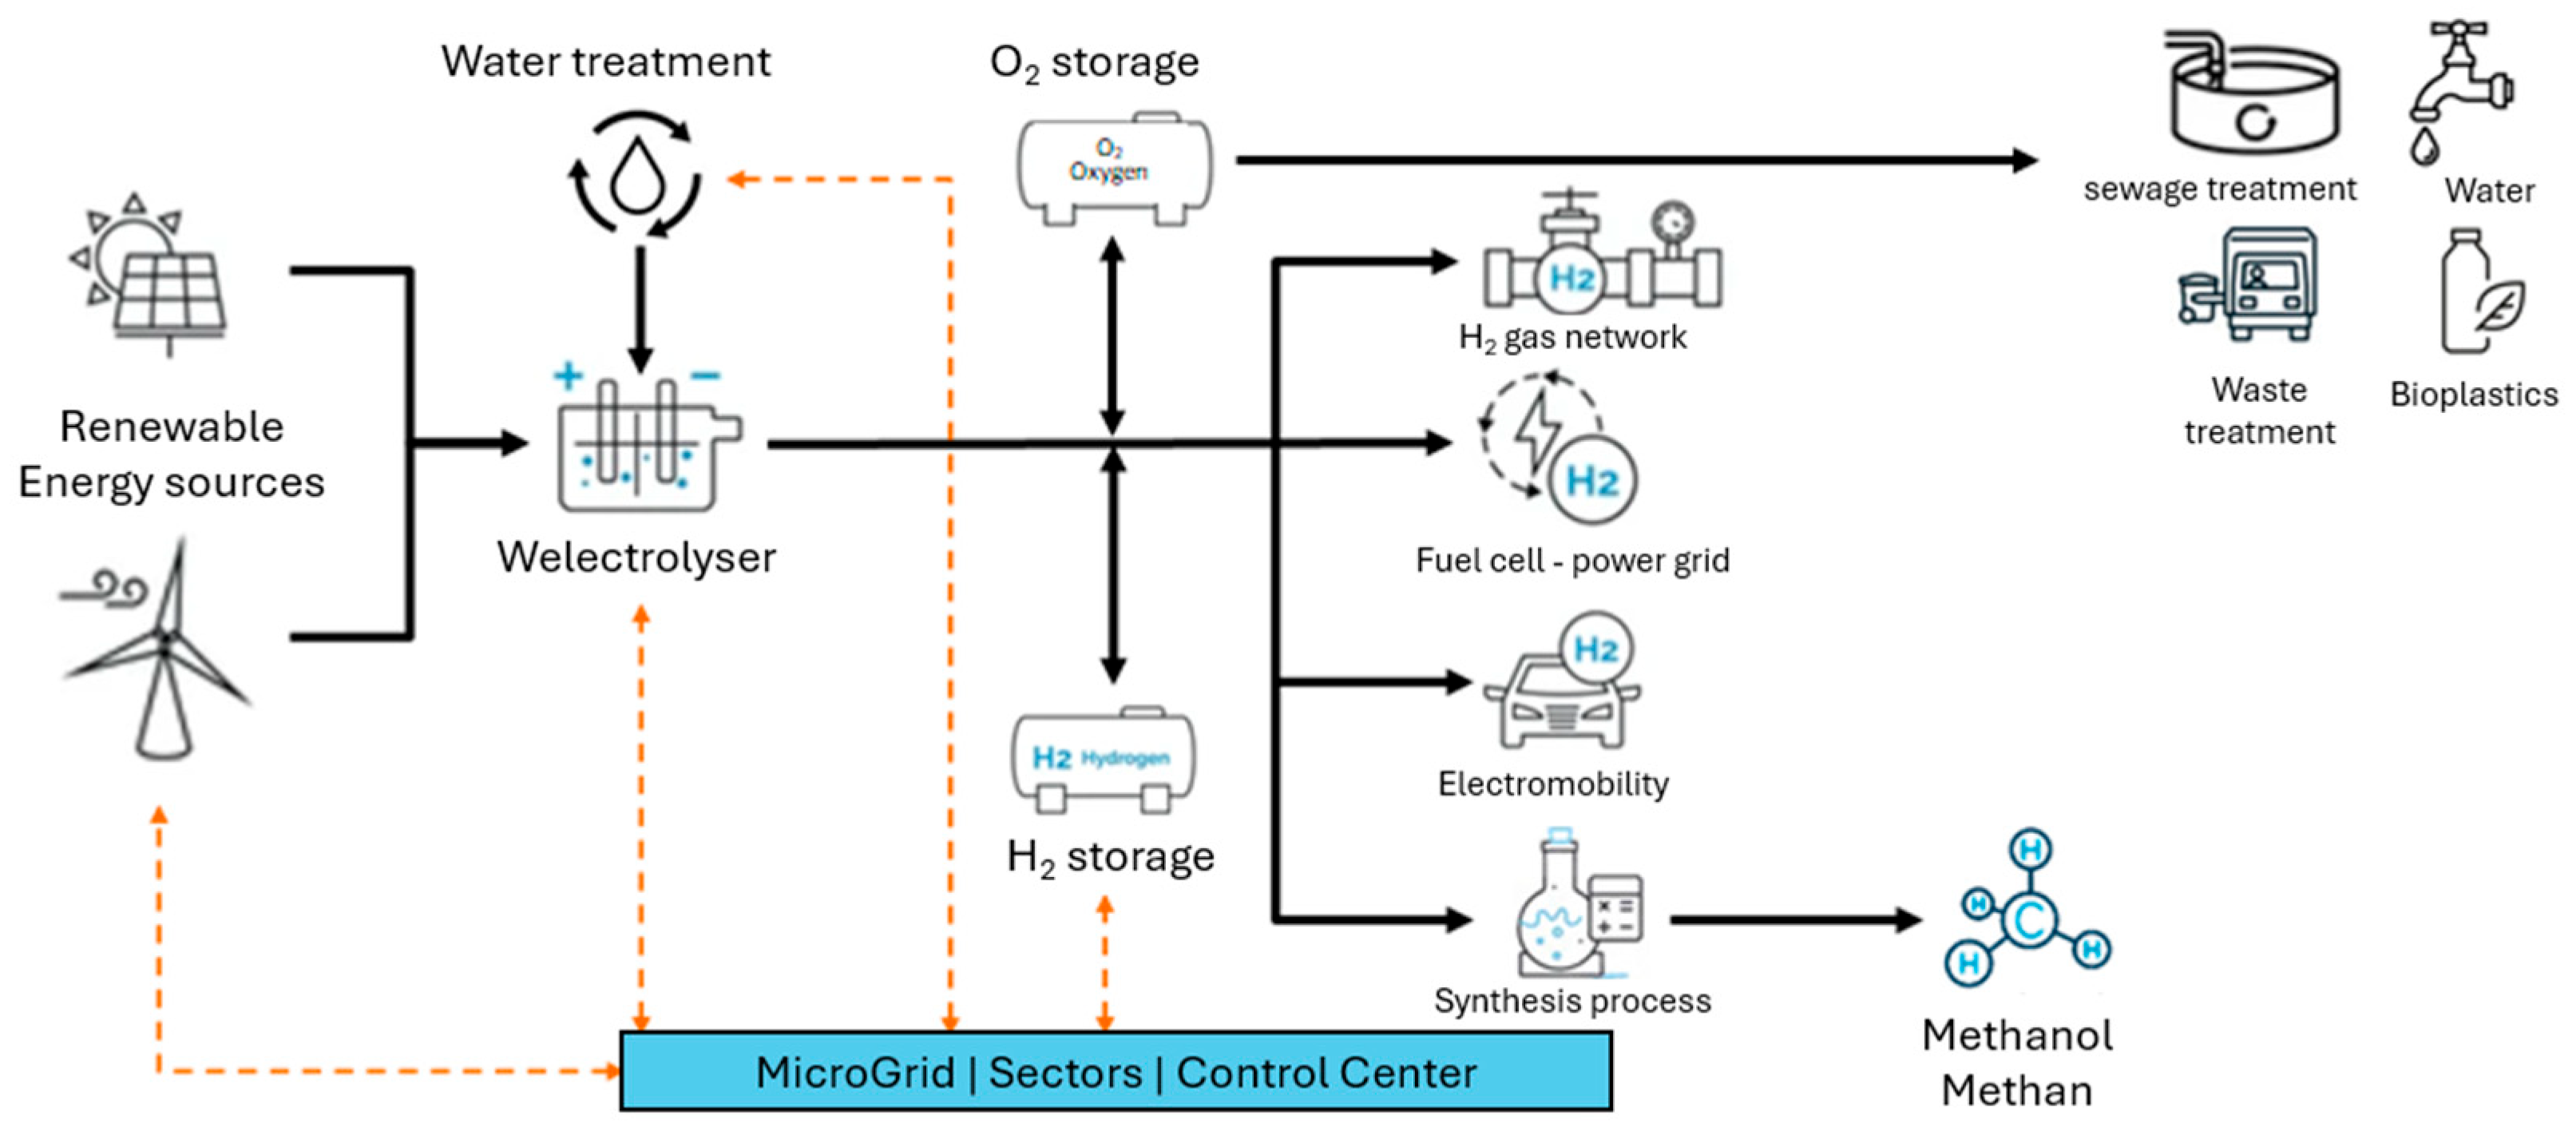
Figure 3.
Gross electricity generation by energy source 2000-2024 in TWh (a) [17] and (b) electricity consumption by consumer group 2014-2024 in TWh in Germany [18].
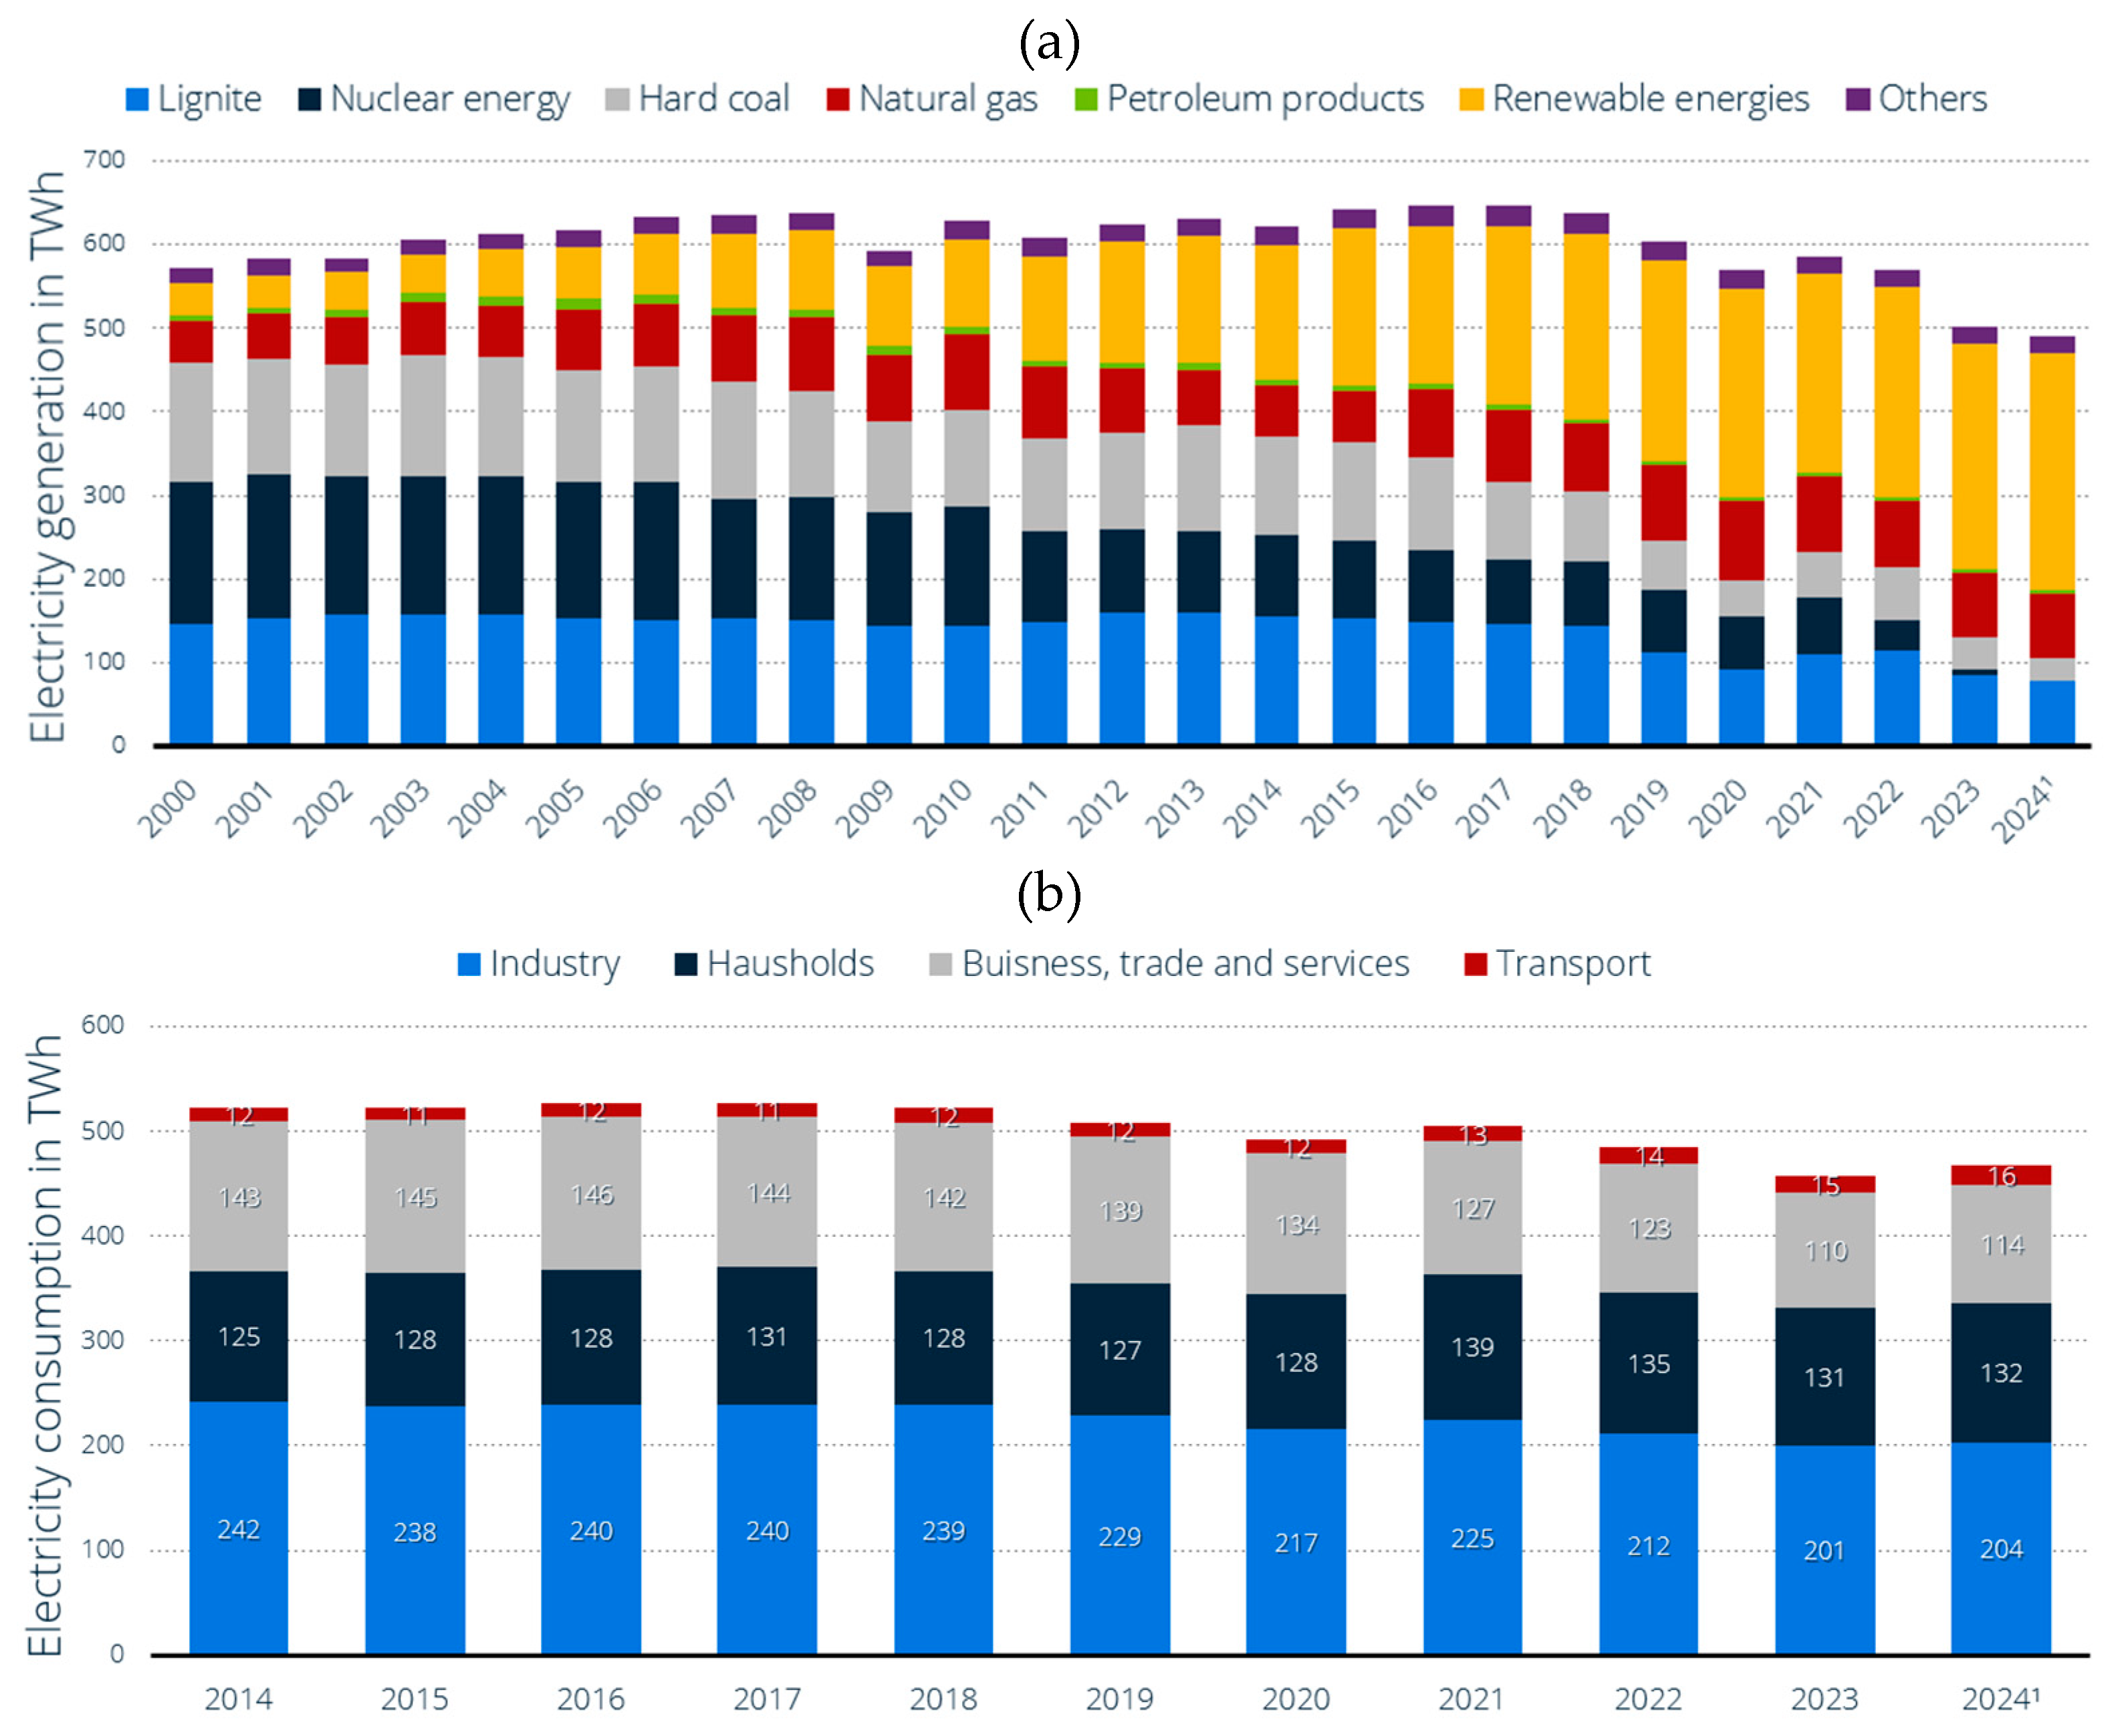
Figure 4.
(a) Overview of the German gas transmission network and (b) the future hydrogen network in 2050 [1].
Figure 4.
(a) Overview of the German gas transmission network and (b) the future hydrogen network in 2050 [1].
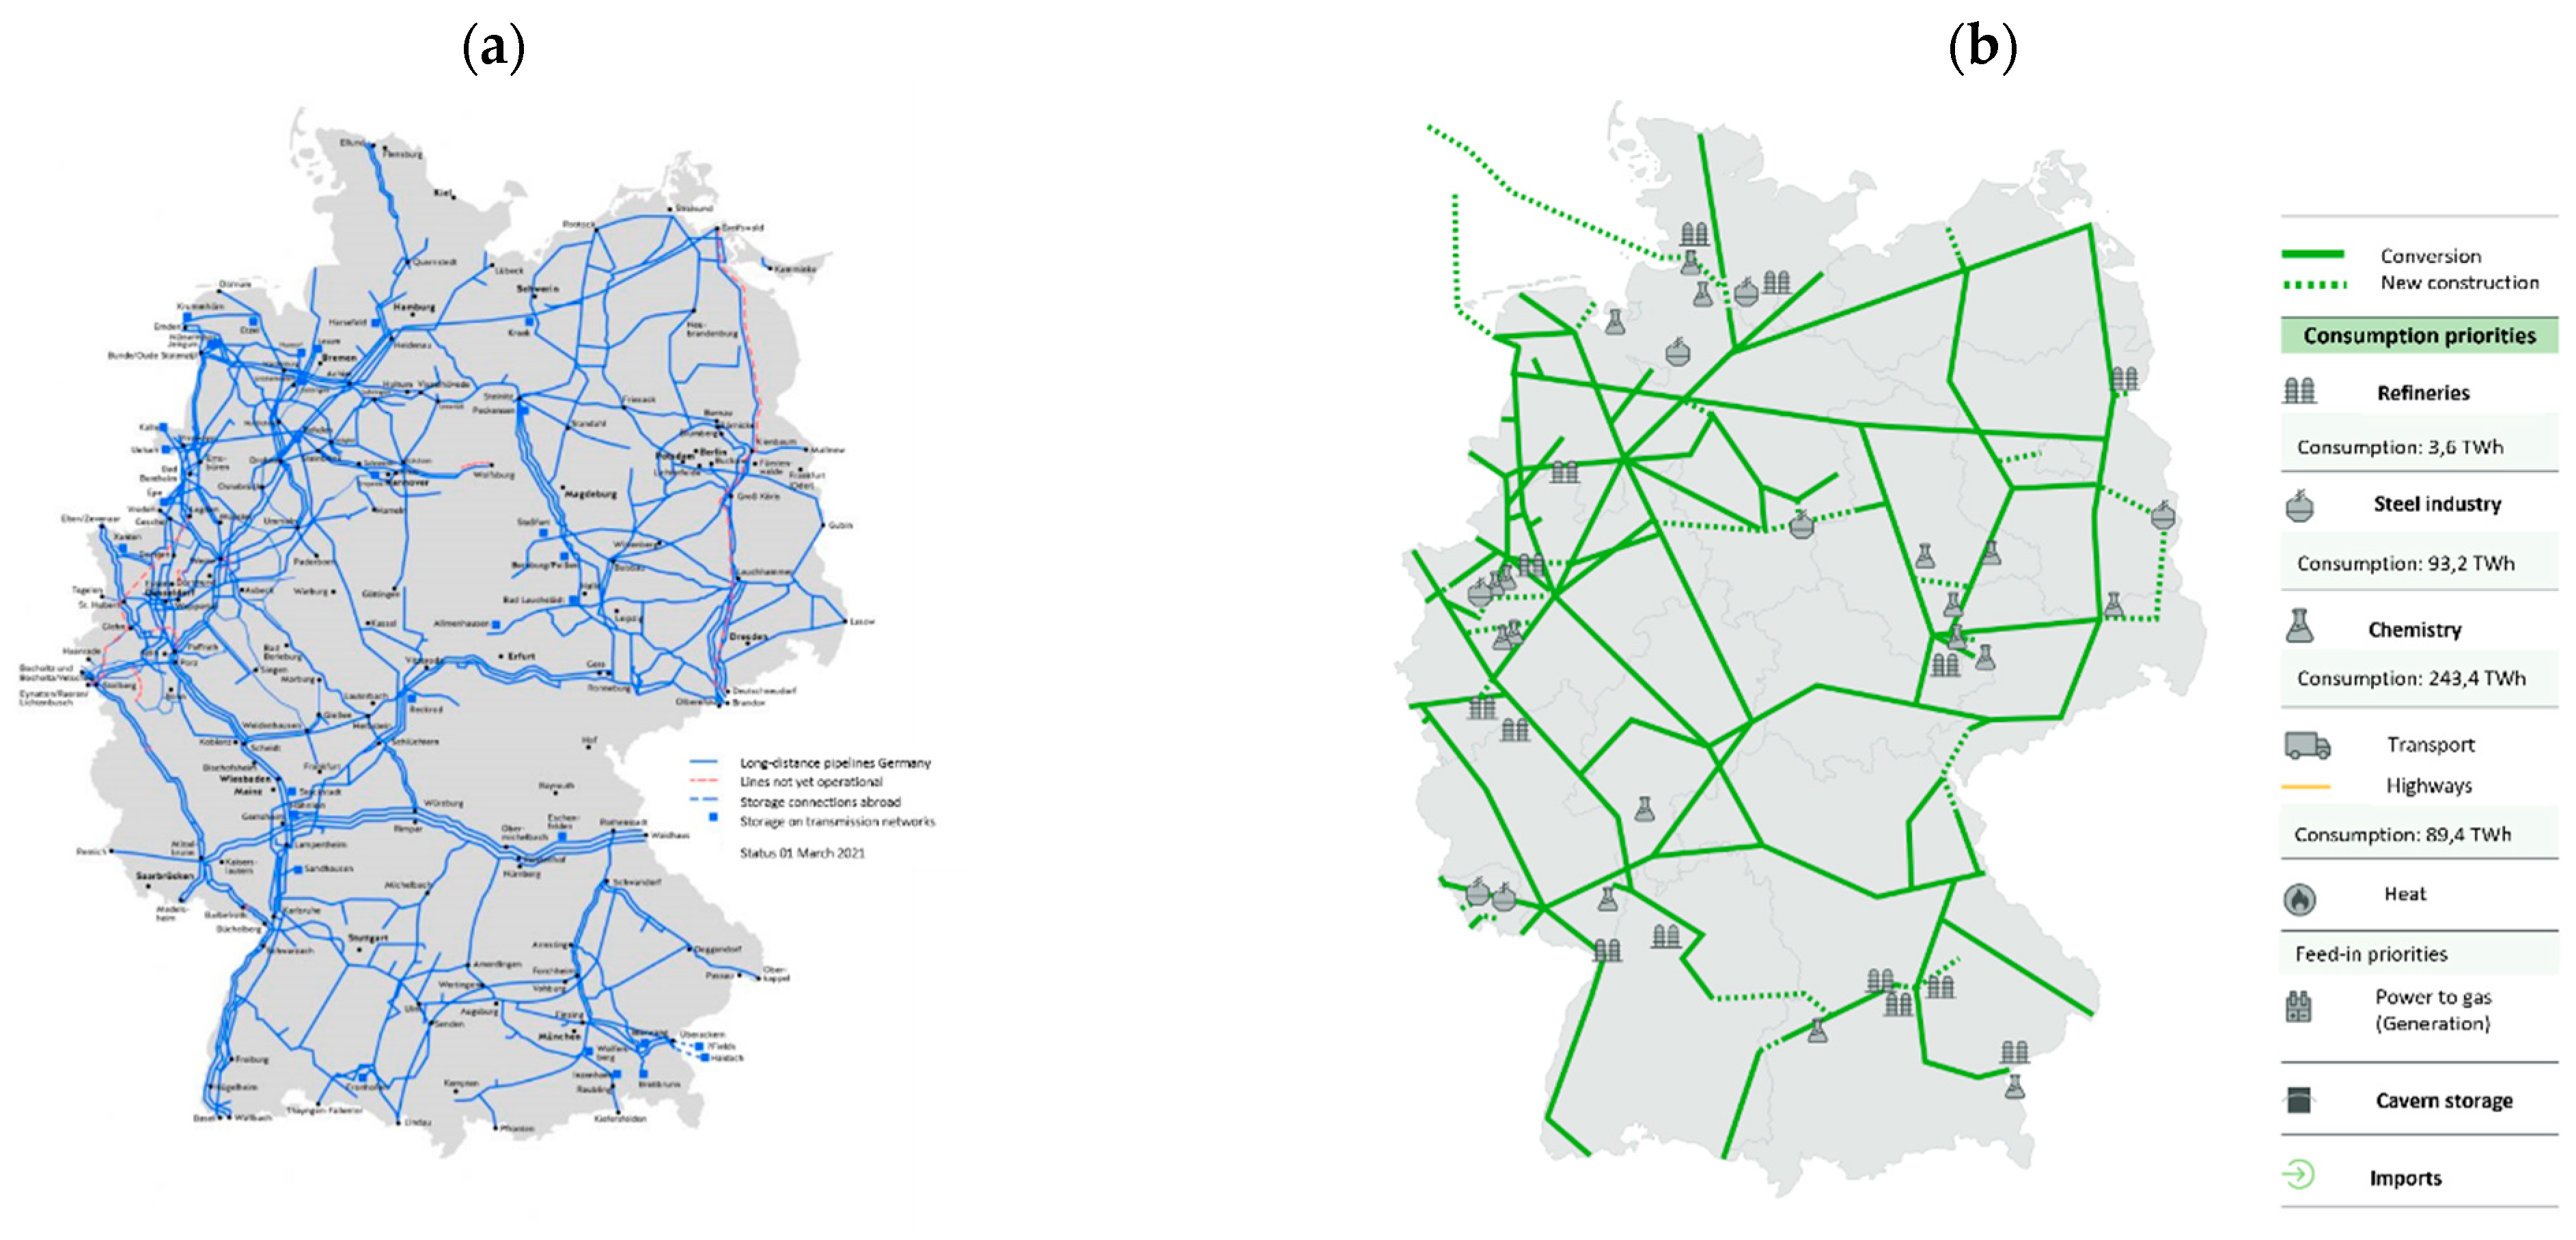
Figure 5.
Simulation models (a) fuel cell black box and (b) energy hub model examples [8].
Figure 5.
Simulation models (a) fuel cell black box and (b) energy hub model examples [8].
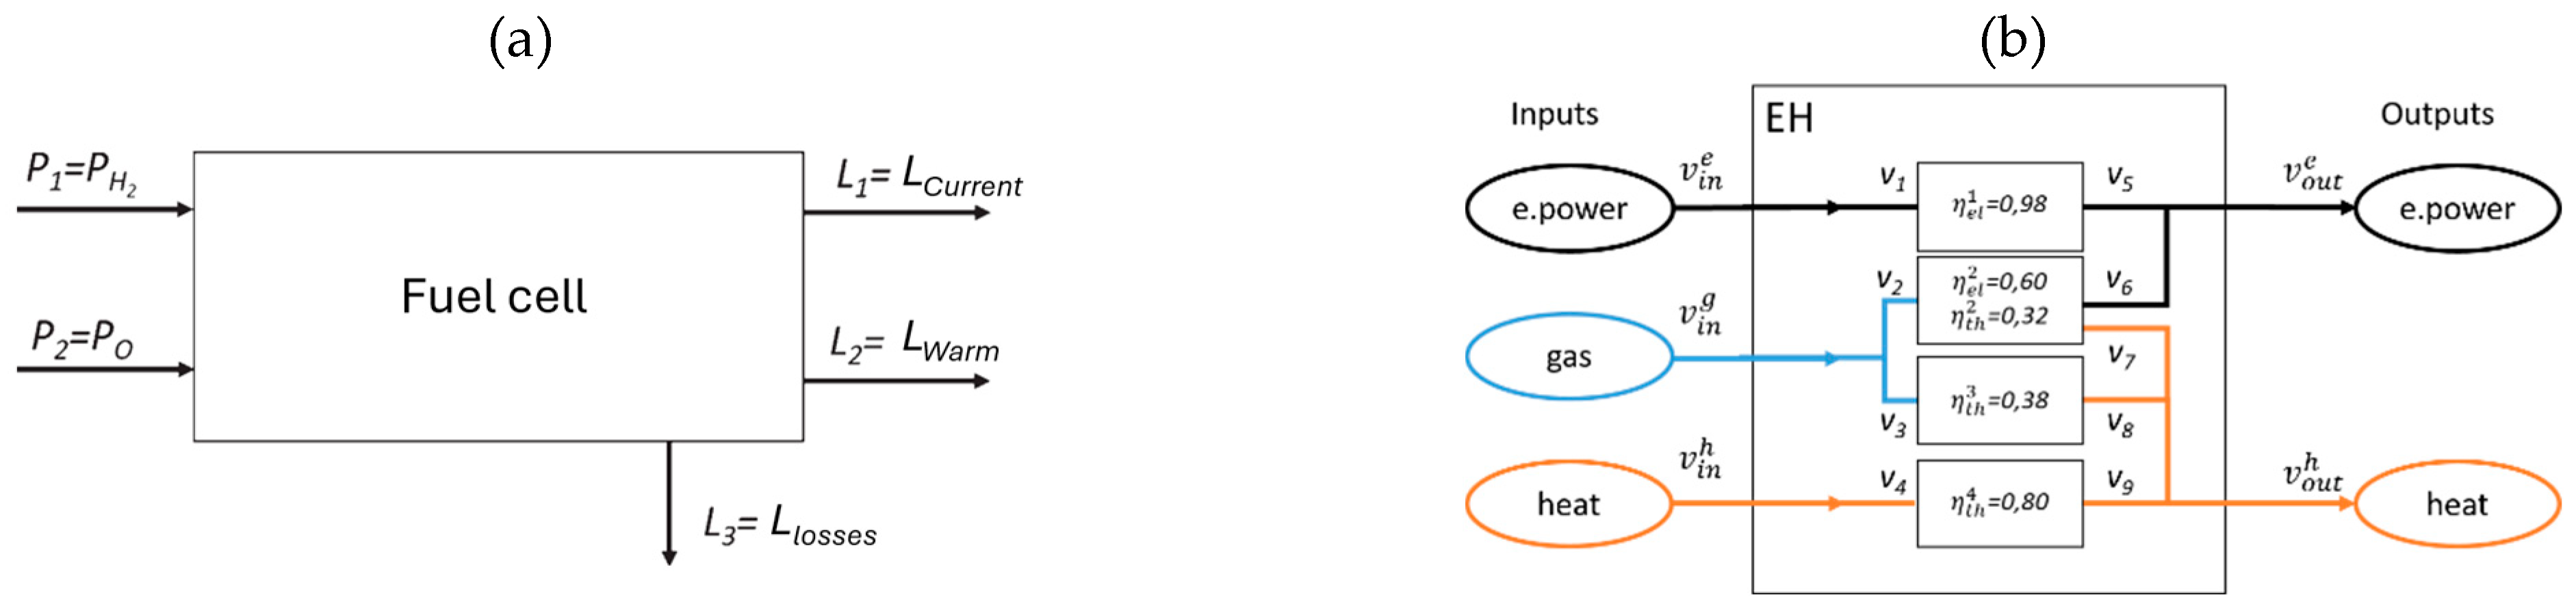
Figure 6.
Electrolyzer-CHP system representation using efficiency chain [8].
Figure 6.
Electrolyzer-CHP system representation using efficiency chain [8].
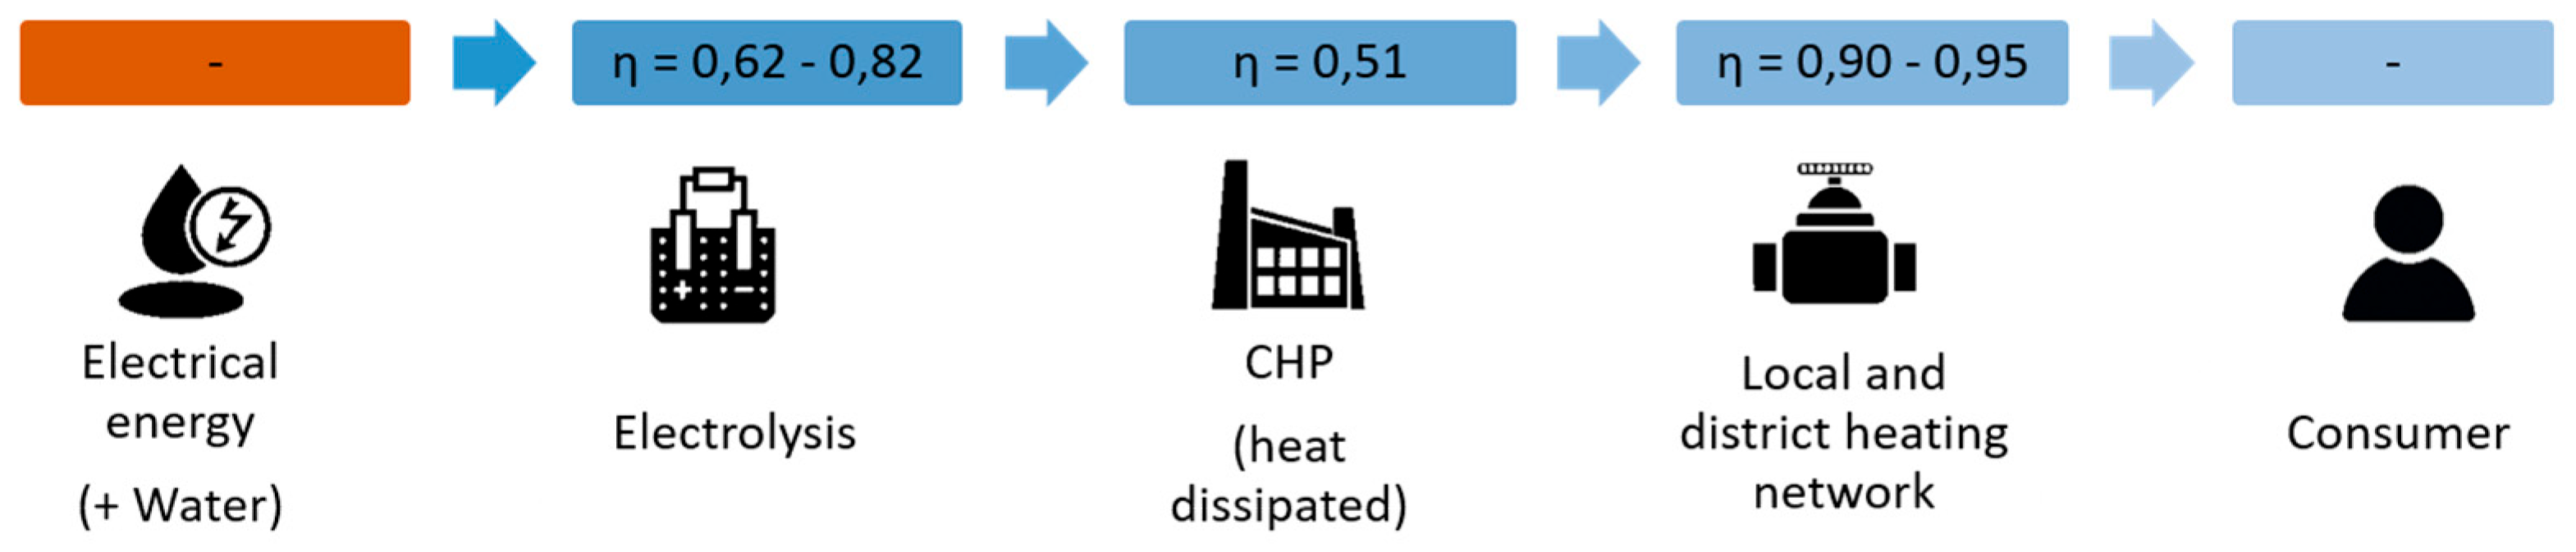
Figure 7.
Cost allocation (CAPEX (a), OPEX (b)) for typical hydrogen infrastructure.
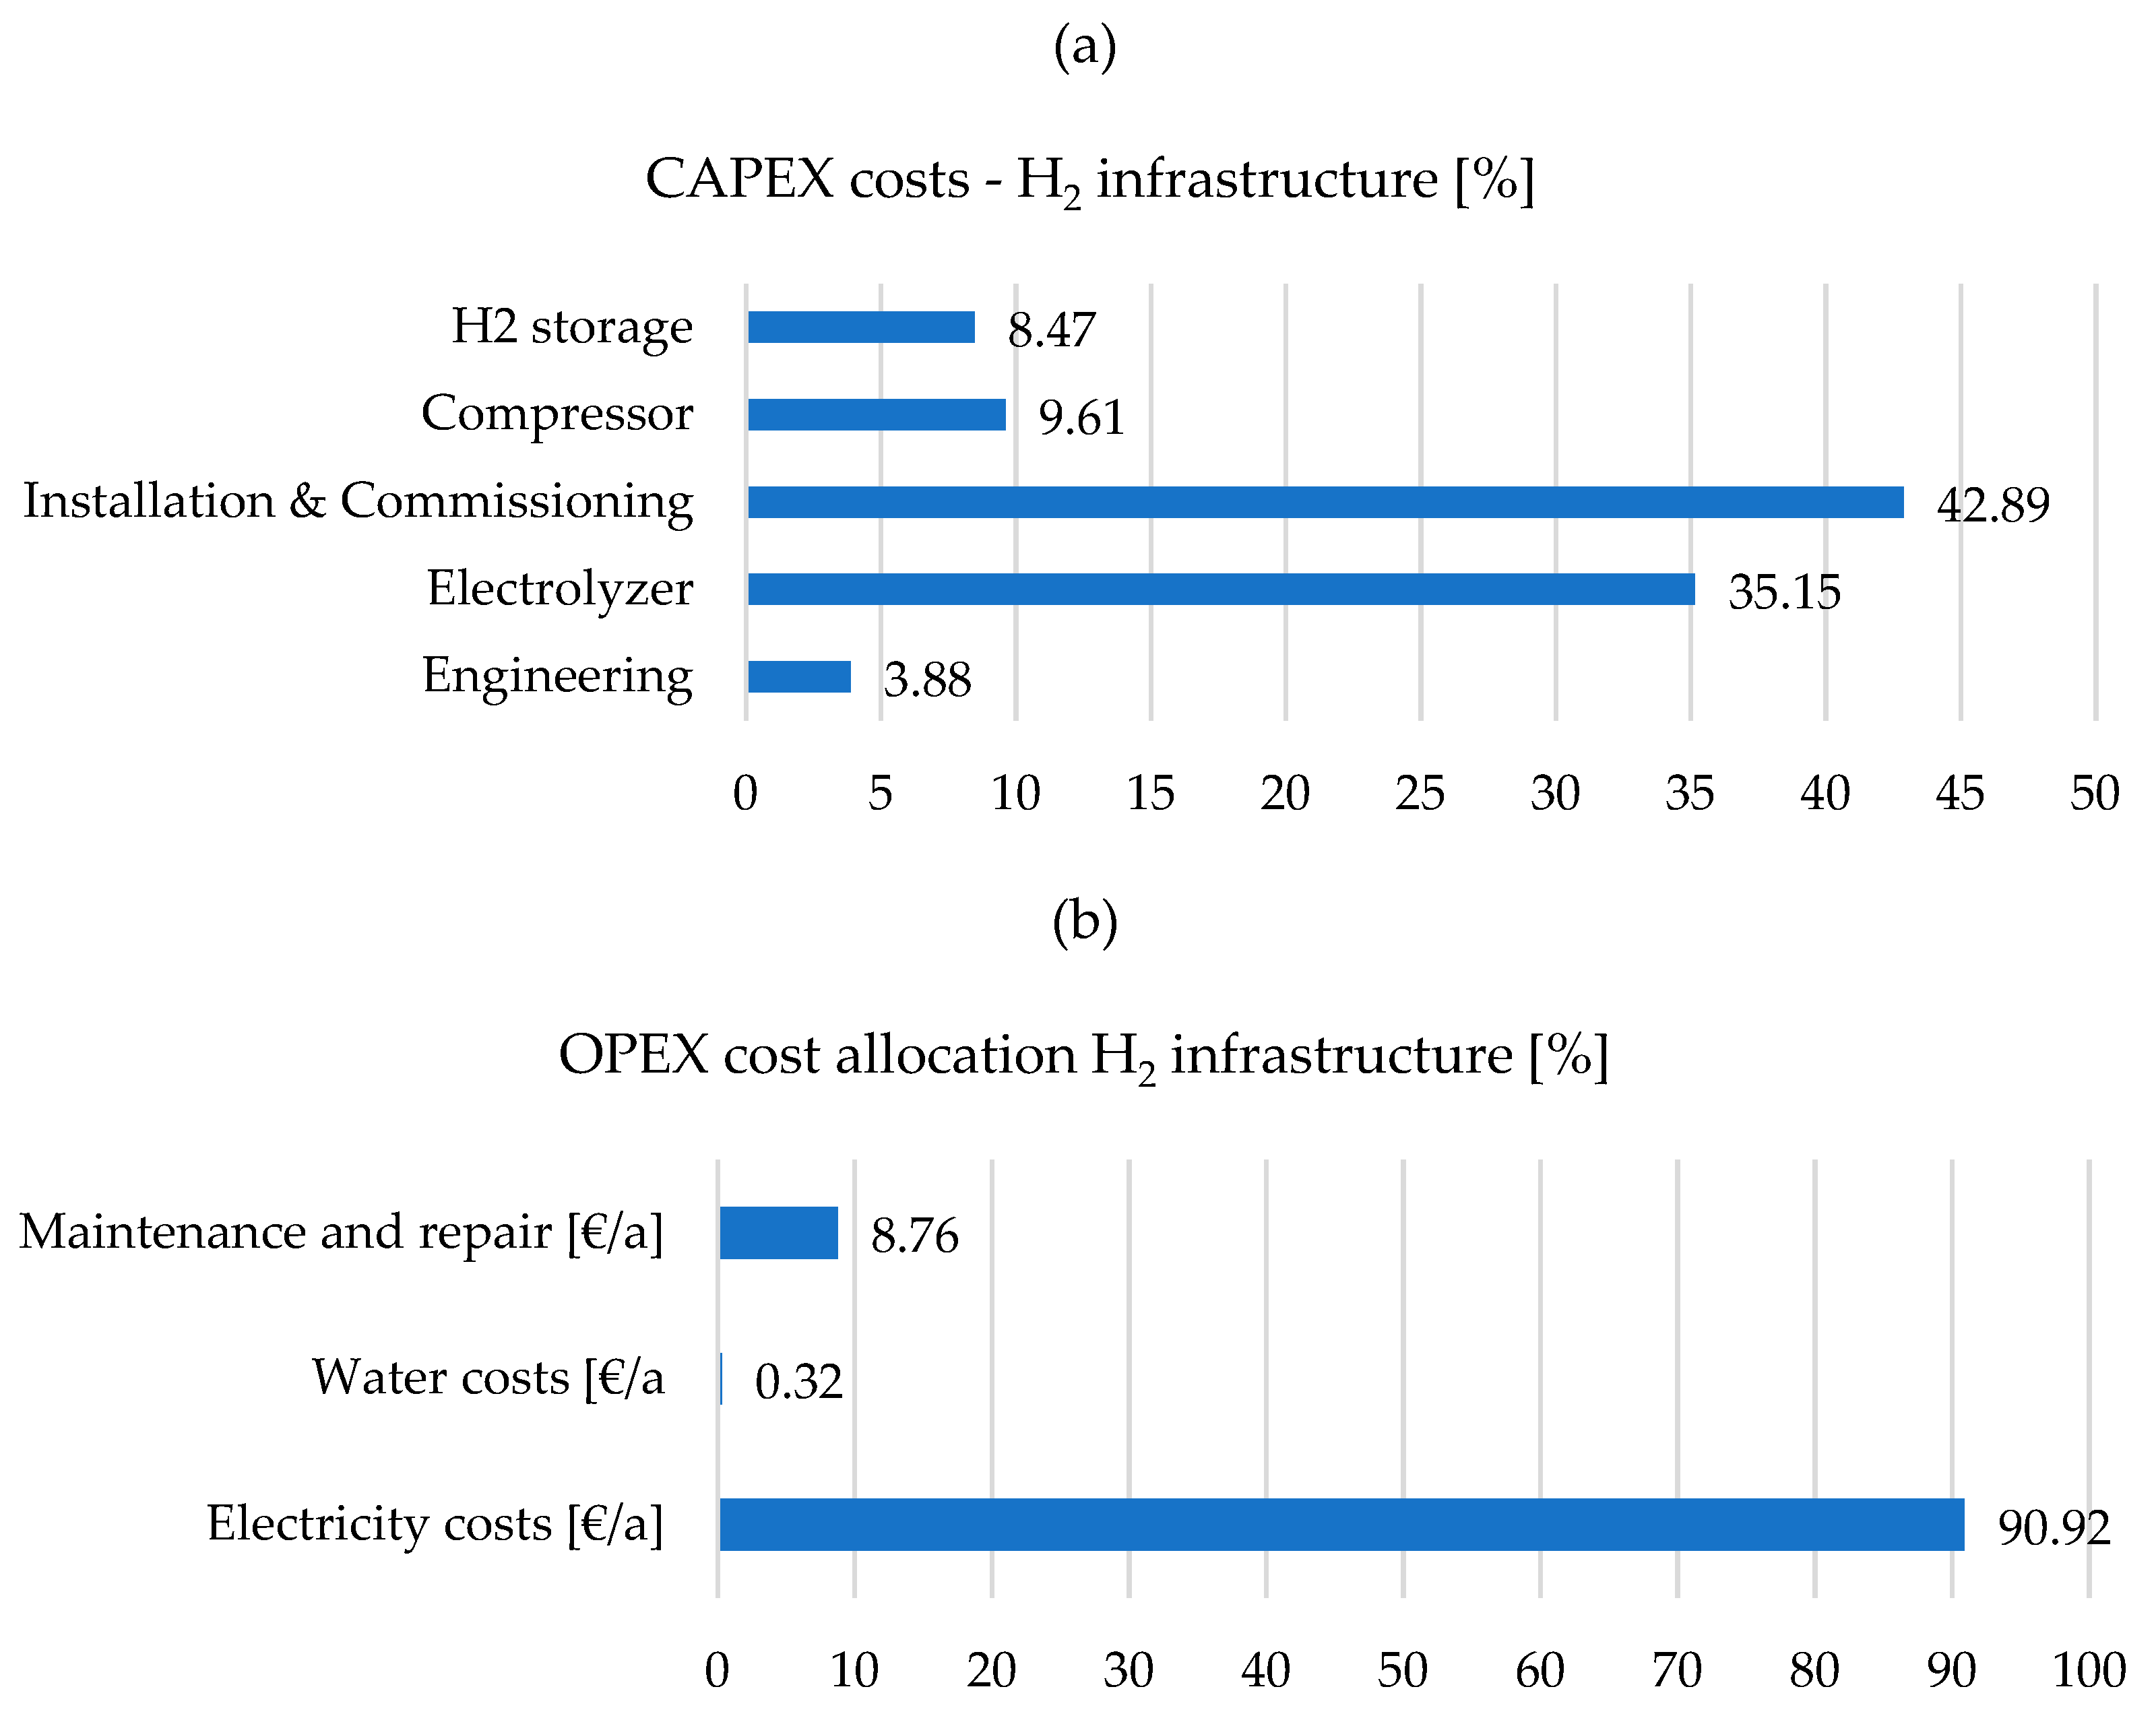
Figure 10.
Hydrogen cycle in the future—overall energy system [8].
Figure 10.
Hydrogen cycle in the future—overall energy system [8].
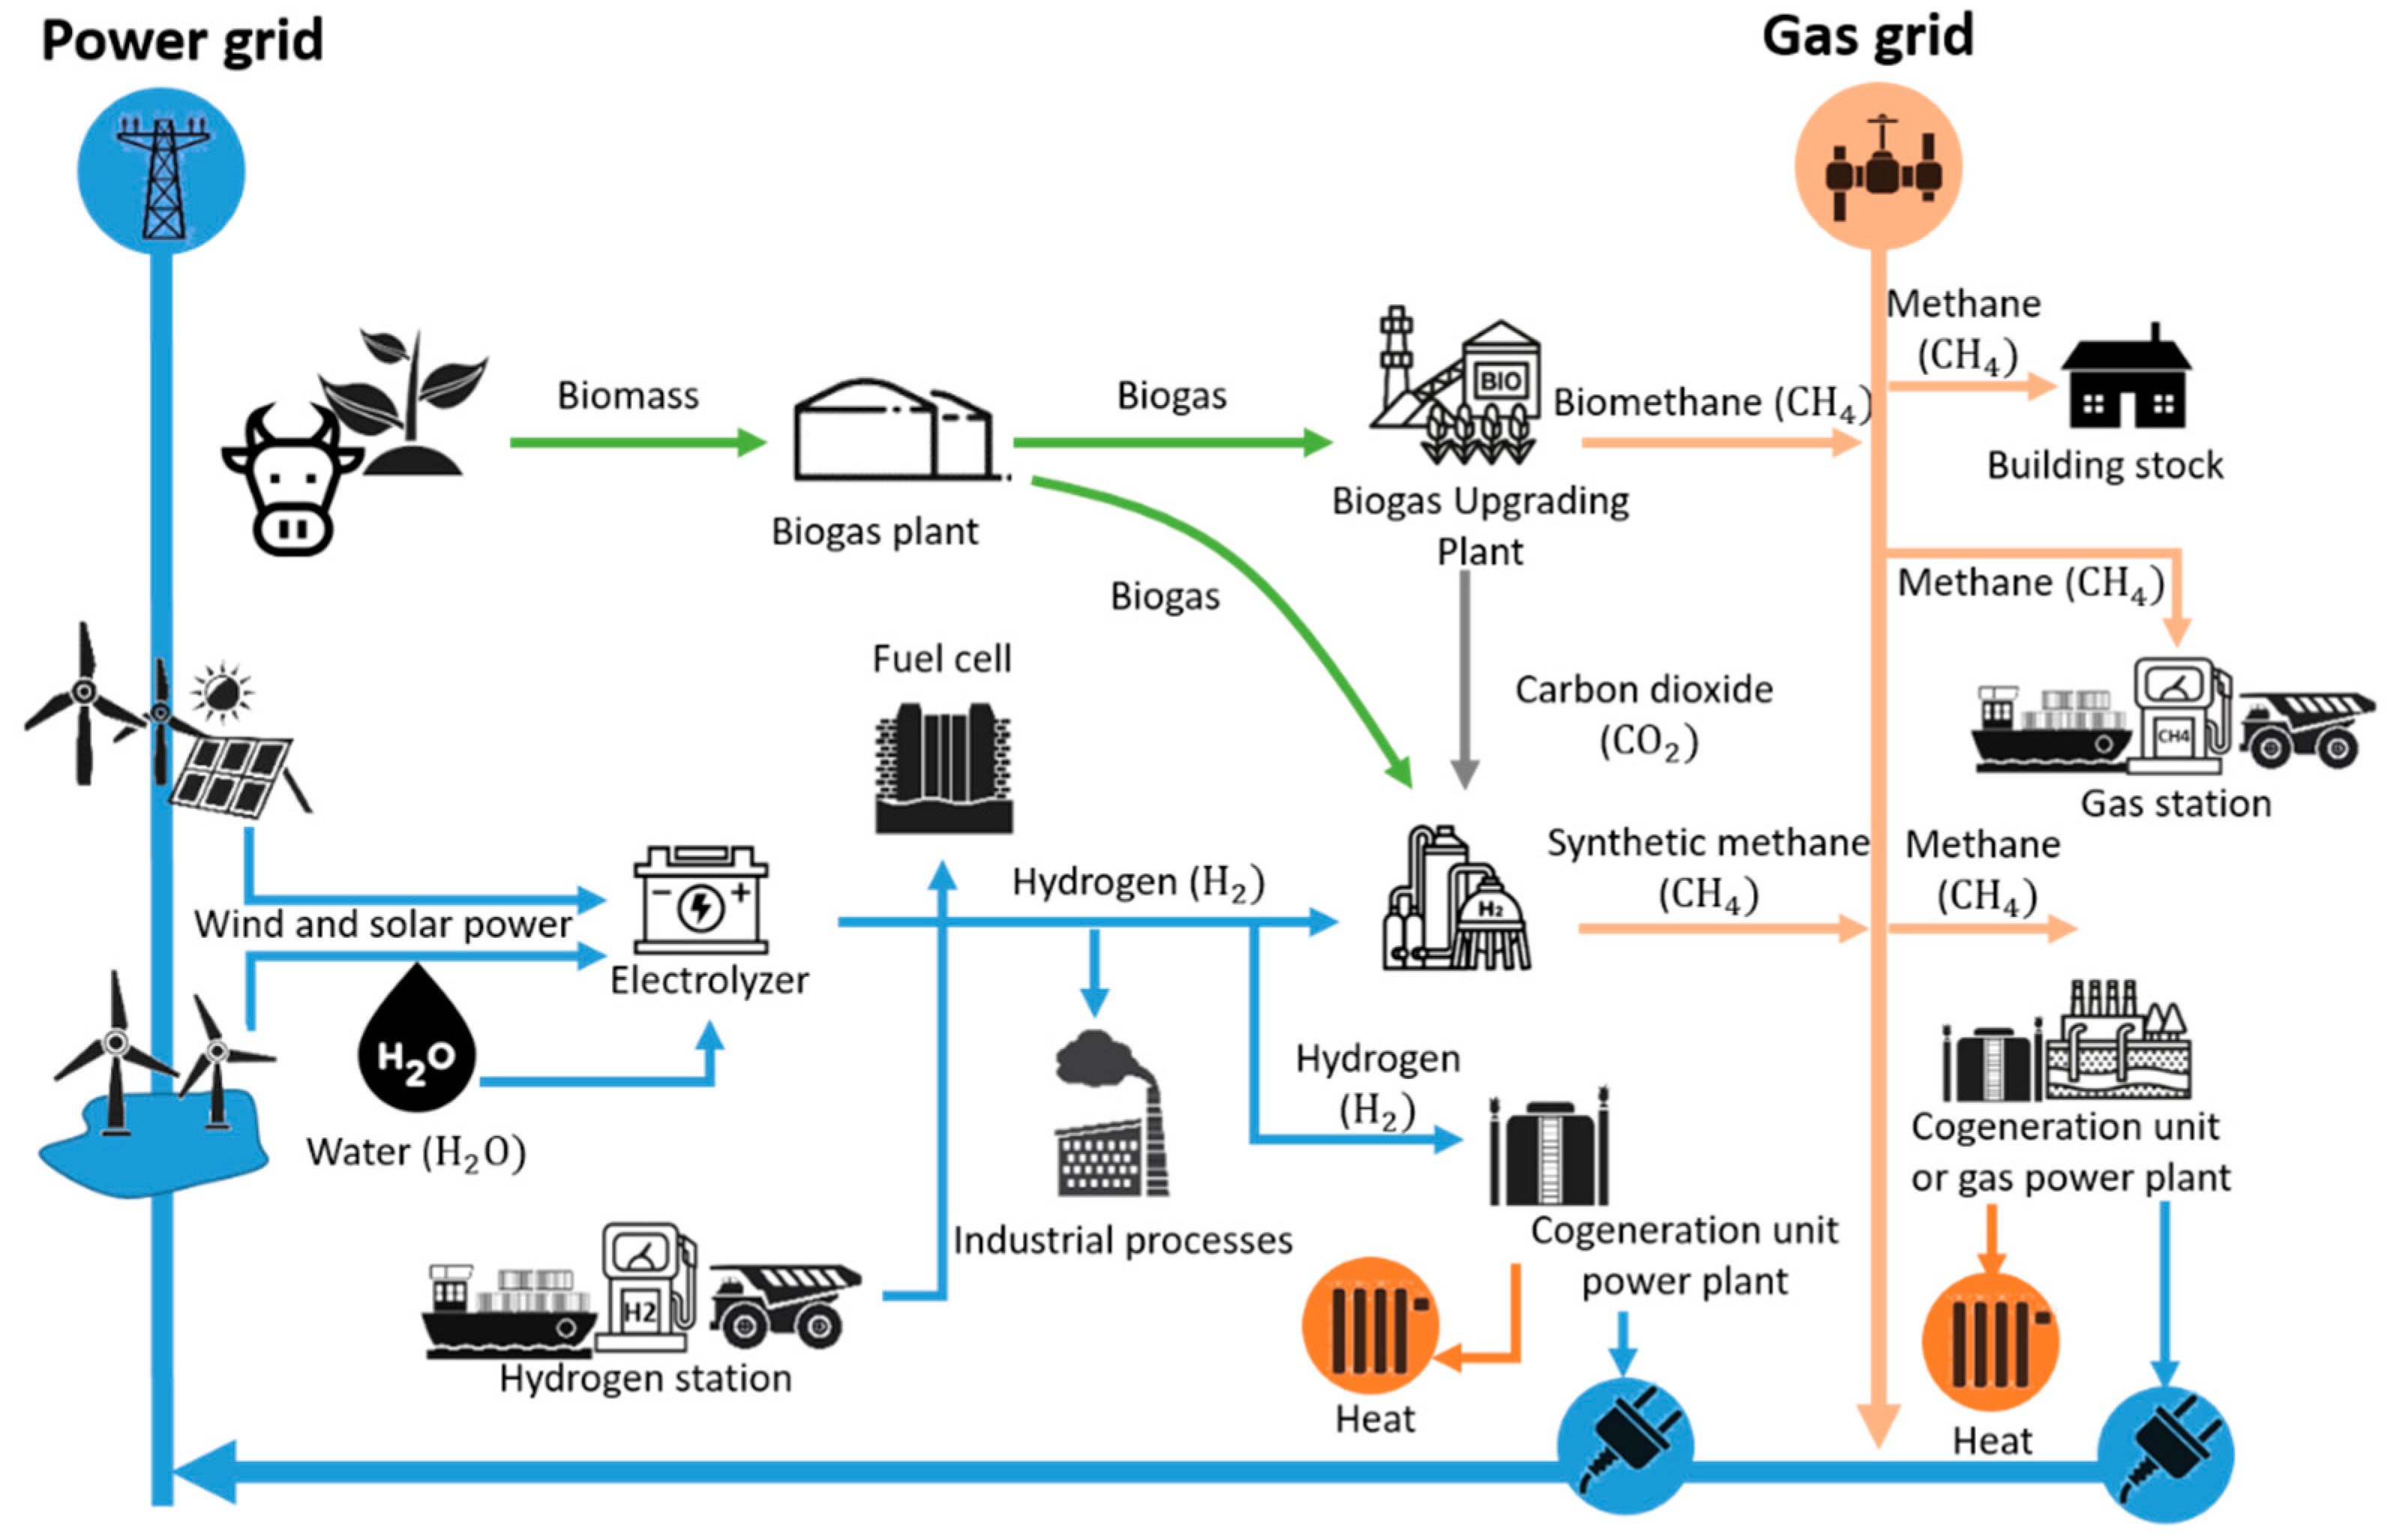

Table 1.
Comparison of parameters of the discussed water electrolysis technologies.
| Technology | AES | PEM | AEM | SOEC |
|---|---|---|---|---|
| Electrolyte | Liquid solution KOH or NaOH | Polymer proton exchange membrane | Polymer anion exchange membrane | Ceramic |
| Operating temperature [°C] | 60 | 50 | 50 | 700–900 |
| Operating pressure [bar] | <=30 | 30–70 | <=30 | <=10 |
| Efficiency [%] | 60 | 70 | 65 | 80 |
| Current density [A/cm2 ] | 0,2–0,4 | 1 | 0,5–1 | 0,3–1 |
| Hydrogen production [m3/h] | < 760 | < 30 | --- | <760 |
| Load response dynamics | Slow (s—min) |
Fast (ms—s) |
Medium | Medium |
| Start-up time [min] | ~15 | <15 | --- | >60 |
| CAPEX [€/kW] | 400–800 | 900–1500 | <700 | >2000 |
| Lifetime [h] | 60,000–90,000 | 20,000–40,000 | 2,000–8,000 | 10,000–20,000 |
| Noble metals | None | Iridium, platinum | None | None |
| TRL | 9 | 8–9 | 6 | 5–7 |
| Applications | Industry, hydrogen refueling stations | RES integration, mobility | RES integration | High-temperature industrial processes |
Table 2.
Comparison of hydrogen storage methods.
| Technology | H2 compression |
H2 Liquefaction | Metal hydride absorption | LOHC | Geological storage |
|---|---|---|---|---|---|
| Physical state | Gas | Liquid | Solid | Liquid | Gas |
| Operating temperature [°C] | 15 | < -253 | 300–400 | 200–300 | Rock temperature |
| Operating pressure [bar] | 200–700 | ~1 | ~1 | ~1 | 10–200 |
| Energy density [MJ/dm3] | 4 | 8 | 6 | 7–8 | --- |
| Energy losses [%] | 10 | 30 | 10 | 20 | <5 |
| TRL | 9 | 8–9 | 6–8 | 6–8 | 8–9 |
| Applications | Transport, hydrogen refueling stations | Transport, rocket propulsion | Stationary storage | Transport, seasonal storage |
Industry, seasonal storage |
Disclaimer/Publisher’s Note: The statements, opinions and data contained in all publications are solely those of the individual author(s) and contributor(s) and not of MDPI and/or the editor(s). MDPI and/or the editor(s) disclaim responsibility for any injury to people or property resulting from any ideas, methods, instructions or products referred to in the content. |
© 2026 by the authors. Licensee MDPI, Basel, Switzerland. This article is an open access article distributed under the terms and conditions of the Creative Commons Attribution (CC BY) license (http://creativecommons.org/licenses/by/4.0/).
Copyright: This open access article is published under a Creative Commons CC BY 4.0 license, which permit the free download, distribution, and reuse, provided that the author and preprint are cited in any reuse.


