
Submitted:
04 January 2026
Posted:
06 January 2026
You are already at the latest version
Abstract
Stiffened panels are essential structural elements that play a critical role in maintaining the integrity of engineering structures, particularly when subjected to torsional loading. Ensuring their adequate strength is therefore a fundamental requirement in design and assessment. Conventional approaches to strength evaluation using the finite element method (FEM) often face challenges due to the complexity of modeling stiffened geometries and the time-consuming setup required, which can reduce efficiency and limit accessibility for practical applications. To overcome these limitations, this study introduces the development of a graphical user interface (GUI) specifically designed to facilitate FEM-based strength analysis of stiffened panels under torsional loads. The GUI, implemented in Python, automates essential modeling steps, streamlines the input process, and enhances user interaction through an intuitive interface, thereby making torsional strength analysis more efficient and user-friendly. Numerical simulations were carried out on nine panel configurations, systematically combining three variations of plate thickness with three variations of longitudinal stiffener geometry. The results demonstrate that plate thickness has a direct influence on torsional resistance, with thicker plates exhibiting significantly higher strength, while stiffener design was also found to strongly affect performance: the 80 x 80 x 8 stiffener provided the greatest resistance against general torsional loading, whereas the 100 x 65 x 9 stiffener displayed superior behavior under pure torque conditions. These findings are consistent with theoretical predictions, confirming the reliability of the developed approach, and overall, the proposed GUI proves to be an effective tool in supporting FEM-based strength assessment of stiffened panels, offering both accuracy and efficiency while highlighting the potential of integrating computational modeling with user-oriented interfaces to broaden the applicability of FEM in structural engineering practice, particularly in analyzing complex torsional behaviors of stiffened panel systems.
Keywords:
finite element method
; graphical user interface
; stiffened panel
; torsion
1. Introduction
Stiffened panels are fundamental structural elements in a ship, functioning to resist external and internal loads while contributing to the overall longitudinal strength of the hull. Their design is closely linked to the ability of the structure to remain watertight, which is essential for preventing leakage and protecting the integrity of cargo compartments. Due to their role as primary load-carrying members, stiffened panels must be carefully engineered to endure complex loading conditions, including torsional stresses that can compromise structural safety [1,2]. Failure of these panels may result in serious consequences, such as loss of watertightness, cargo contamination, and in critical cases, hazards to operational safety. For this reason, strength analysis of stiffened panels is a key aspect in the structural design and construction of ships, ensuring both durability and reliability throughout service life [3]. In addition, the arrangement and configuration of stiffeners directly affect the panel’s resistance to deformation and overall structural performance. When the design is inadequate, panels may experience excessive deflection, local buckling, or even cracking under operational loads [4]. Such failures not only threaten the safety of the vessel but also reduce its serviceability and economic value. Therefore, maintaining the structural integrity of stiffened panels is essential to guarantee both safety and efficiency in ship operations.
Torsional loads impose a complex combination of stresses on stiffened panels that can severely compromise their strength and stability [5,6,7,8]. Unlike axial or bending loads, torsion induces significant shear and warping stresses, causing interaction between the plating and stiffeners that often triggers premature local buckling [9,10]. Under these conditions, stiffeners may twist due to torsional buckling, while the adjacent plating can deform in a non-uniform manner, leading to progressive loss of stiffness and load-carrying capacity [11,12,13]. Studies on torsional and local buckling of stiffener pillars show that geometric characteristics, including slenderness, flange width and the ratio of plate thickness to panel length, strongly influence the panel’s resistance to torsion-induced instability [14]. Furthermore, research has shown that boundary conditions and the degree of torsional restraint provided by transverse members are decisive in controlling the failure modes, where insufficient restraint accelerates the onset of collapse. Real-world factors make this behavior more complex. Initial imperfections, welding-induced residual stresses, and material degradation such as corrosion can reduce the torsional stiffness of the panel [15,16]. As a result, failure modes may shift from global deformation to localized or distortional buckling. These effects are especially critical in marine applications. Stiffened panels form the main components of decks, bulkheads, and hull structures, which must remain watertight and structurally reliable under varying load conditions. Torsional stresses not only lower the ultimate strength but also increase the risk of progressive collapse [17,18]. This may jeopardize the global integrity of the ship. Therefore, considering torsional effects is essential in the structural strength assessment of stiffened panels.
One widely used approach to analyze the strength of stiffened panels is the Finite Element Method (FEM), which has proven to be an effective tool for addressing complex and non-linear structural problems. Stiffened panels, as primary structural components in marine and aerospace applications, must withstand various loading conditions, including torsional stresses that can significantly influence their overall strength and stability [19,20]. The design of stiffened panels often varies depending on factors such as structural location, geometric configuration, and service requirements, making accurate assessment essential. Experimental testing provides valuable insight into the behavior of stiffened panels. However, it is costly, time-consuming, and difficult to apply, especially for full-scale models or complex load cases such as combined torsion and other stresses [9,22]. Finite Element Method (FEM) offers a more practical and economical alternative. It discretizes the panel into smaller elements that can be analyzed locally and assembled into a complete model, greatly reducing resource requirements. Despite the lower cost, FEM maintains high accuracy. Many studies have shown that numerical results closely match experimental measurements in terms of buckling loads, collapse behavior, fatigue crack growth, and post-buckling response [23,24,25]. Therefore, FEM is a reliable and efficient method for predicting the structural response of stiffened panels under torsional loads.
The incorporation of a Graphical User Interface (GUI) in the structural analysis of stiffened panels significantly enhances usability, interpretability, and accessibility of FEM-based tools. A well-designed GUI makes it easier for users to define geometry, material properties, stiffener layout, boundary conditions, and loading, including torsional loads [26,27,28]. It offers an intuitive visual framework that reduces input errors and lowers the barrier for students and non-experts. In sizing-optimization and structural analysis software, the GUI allows users to visually review parameters such as skin thickness, stiffener dimensions, margin of safety, and critical load cases after the analysis. This helps users compare design alternatives and identify potential areas where instabilities may initiate, including torsional buckling or stiffener outstand failure. CAD-like interfaces also enable plate, shell, and stiffened-panel elements to be modeled and loaded in three dimensions, allowing rapid modifications to geometry and loading when assessing torsional effects across different panel configurations [29,30]. However, GUI-based FEM tools dedicated specifically to stiffened panel analysis remain limited. Many platforms still rely on command-driven or script-based inputs, which can reduce efficiency and hinder user engagement. This gap indicates a strong need for more integrated and user-friendly GUI development tailored to structural strength assessment, enabling torsional effects on stiffened panels to be studied with greater accuracy, clarity, and efficiency.
This research focuses on the structural strength assessment of stiffened panels subjected to torsional loading by employing a Finite Element Modeling (FEM) framework integrated with a custom graphical user interface (GUI). The study is organized into five main sections to ensure a coherent and systematic presentation: Section 2 establishes the theoretical foundation, including FEM principles, torsional load characterization, and the GUI design philosophy; Section 3 introduces the case study parameters and describes the simulation procedure along with the variations considered; Section 4 presents the numerical findings with emphasis on yield strength, ultimate strength, shear behavior, and the evolution of stresses and moments under increasing torsional deformation; Section 5 provides deeper interpretation of these responses, examining how stiffener configuration, boundary conditions, and torsional amplification influence structural capacity; and Section 6 summarizes the key insights and highlights the value of integrating GUI tools with FEM to enhance efficiency, reproducibility, and accessibility in torsional strength assessments for marine and structural engineering applications.
2. Numerical Framework
2.1. Finite Element Method
The Finite Element Method (FEM) is implemented in this study to analyze the structural strength of stiffened panels subjected to torsional loads. Due to the geometric complexity of stiffeners and the non-uniform response generated by torsion, analytical solutions become impractical for real structures. FEM enables the problem to be solved approximately by converting a continuous structure into a discrete model that consists of finite elements. In this manner, the global structural behavior is obtained by assembling the response of each individual element.
The physical domain of the stiffened panel is divided into finite elements as:
where each element represents either a plate section or a stiffener component. This discretization allows local stress concentrations and torsional effects to be captured with higher accuracy.
Within each element, the displacement field is approximated using interpolation (shape) functions:
where is the shape function matrix, and is the nodal displacement vector which contains all degrees of freedom. This interpolation converts the continuous displacement field into a set of discrete variables defined only at the nodes. For an element with nodes, the displacement field can be expressed as:
where is the shape function associated with node i. The selection of shape functions determines the accuracy and convergence of the FEM solution.
The strain generated due to deformation is computed using spatial derivatives of the displacement field. For small deformation theory, the strain–displacement relation becomes:
where is the strain–displacement matrix derived from partial derivatives of the shape functions. This matrix ensures compatibility between displacements and strains throughout the element and plays a crucial role in calculating stresses.
Assuming linear elastic material behavior, Hooke’s law is applied to relate strain to stress:
where is the constitutive (elasticity) matrix, determined by Young’s modulus and Poisson’s ratio. In the case of torsional loading, the shear modulus governs the resistance against twisting and warping deformation.
The governing equations are derived using the principle of virtual work, which provides the weak form:
where is the body force and is the boundary traction. The left-hand side represents the internal virtual work, whereas the right-hand side corresponds to the external virtual work. This formulation naturally incorporates torsional boundary conditions and allows the inclusion of stiffener–plate interaction.
Substituting the constitutive and kinematic relations into the weak form leads to the elemental stiffness matrix:
and the elemental load vector:
These integrals are evaluated numerically using Gauss quadrature within each element.
The global stiffness matrix is constructed by assembling the elemental matrices:
resulting in the final system of linear equations:
where is the global displacement vector, and is the global load vector containing the torsional loading components.
Solving this equation provides the displacement field from which stresses, twisting deformation, and warping effects can be evaluated. The formulation presented here forms the basis for the numerical assessment of stiffened panels under torsional loads, which is further utilized in the subsequent GUI-based implementation.
2.2. Finite Element Formulation for Stiffened Panels under Torsional Loads
In this formulation, the stiffened panel is modeled as an assembly of plate elements and attached stiffeners, where both membrane and bending behaviors are captured. The presence of stiffeners increases torsional rigidity and introduces non-uniform warping displacements, which cannot be captured by simple beam theory. Therefore, a finite element formulation is required to describe the coupled plate–stiffener behavior under torsional loading.
The total strain vector consists of membrane strains and bending curvatures, written as:
where are displacements in the directions, respectively.
Under torsional loading, a rotation is imposed at the panel edge, inducing warping displacements:
This produces additional shear deformation along the thickness of the plate–stiffener system. The resulting torsional shear stresses are computed as:
where is the shear modulus. These stresses are essential for evaluating stress concentration at stiffener–plate junctions.
To account for the stiffener contribution, each stiffener is modeled using beam or shell elements and coupled to the corresponding plate nodes. The overall stiffness of the torsion-resistant structure is expressed as:
where is the total number of stiffeners. This coupling formulation enables FEM to accurately capture the interaction between plate deformation, stiffener rigidity, and torsional warping — which are all critical for structural strength assessment.
The proposed formulation is suitable for implementation within a GUI-based FEM framework, enabling automated model generation, load application, and post-processing for torsional stress evaluation.
2.3. Boundary Conditions and Load Application
The correct definition of boundary conditions is essential to accurately capture the structural response of stiffened panels under torsional loading. To avoid rigid body motion and ensure structural stability, essential (Dirichlet) boundary conditions are imposed along the fixed edge of the panel as:
where u, v, and w are the translational degrees of freedom. This prevents any unwanted global translation or lateral movement during torsion.
Torsional loading is introduced either by prescribing a rotation or by applying a torque along the panel boundary. A prescribed twist angle at the loaded edge generates warping deformation and shear stresses:
while the equivalent torque formulation is expressed as:
where is the position vector, and is the applied traction along the edge .
For uniformly distributed torsional or shear loading, the corresponding elemental load vector is obtained as:
where is the body force per unit volume, and is the shape function matrix. This formulation enables the simulation of both concentrated torque and distributed torsional effects.
By defining boundary conditions in this manner, stiffness contributions from the plate and stiffeners can be accurately evaluated, allowing the FEM model to provide a reliable prediction of stress concentration, warping behavior, and potential failure regions under torsional loads.
2.4. GUI-Based Numerical Implementation
A dedicated graphical user interface (GUI) was developed to automate the finite element analysis of stiffened panels subjected to torsional loading. The GUI acts as an integrated numerical platform that consolidates preprocessing, model generation, FEM solving, and post-processing in a structured and efficient manner. This automation minimizes user intervention, avoids repetitive manual inputs, and enables high-fidelity parametric studies with improved repeatability.
As shown in Table 1, the proposed GUI provides a combination of core functionalities and a stepwise numerical workflow. These enable automated model generation, FE solver execution, and post-processing of torsional responses, allowing efficient assessment of stiffened panels with minimal user intervention.
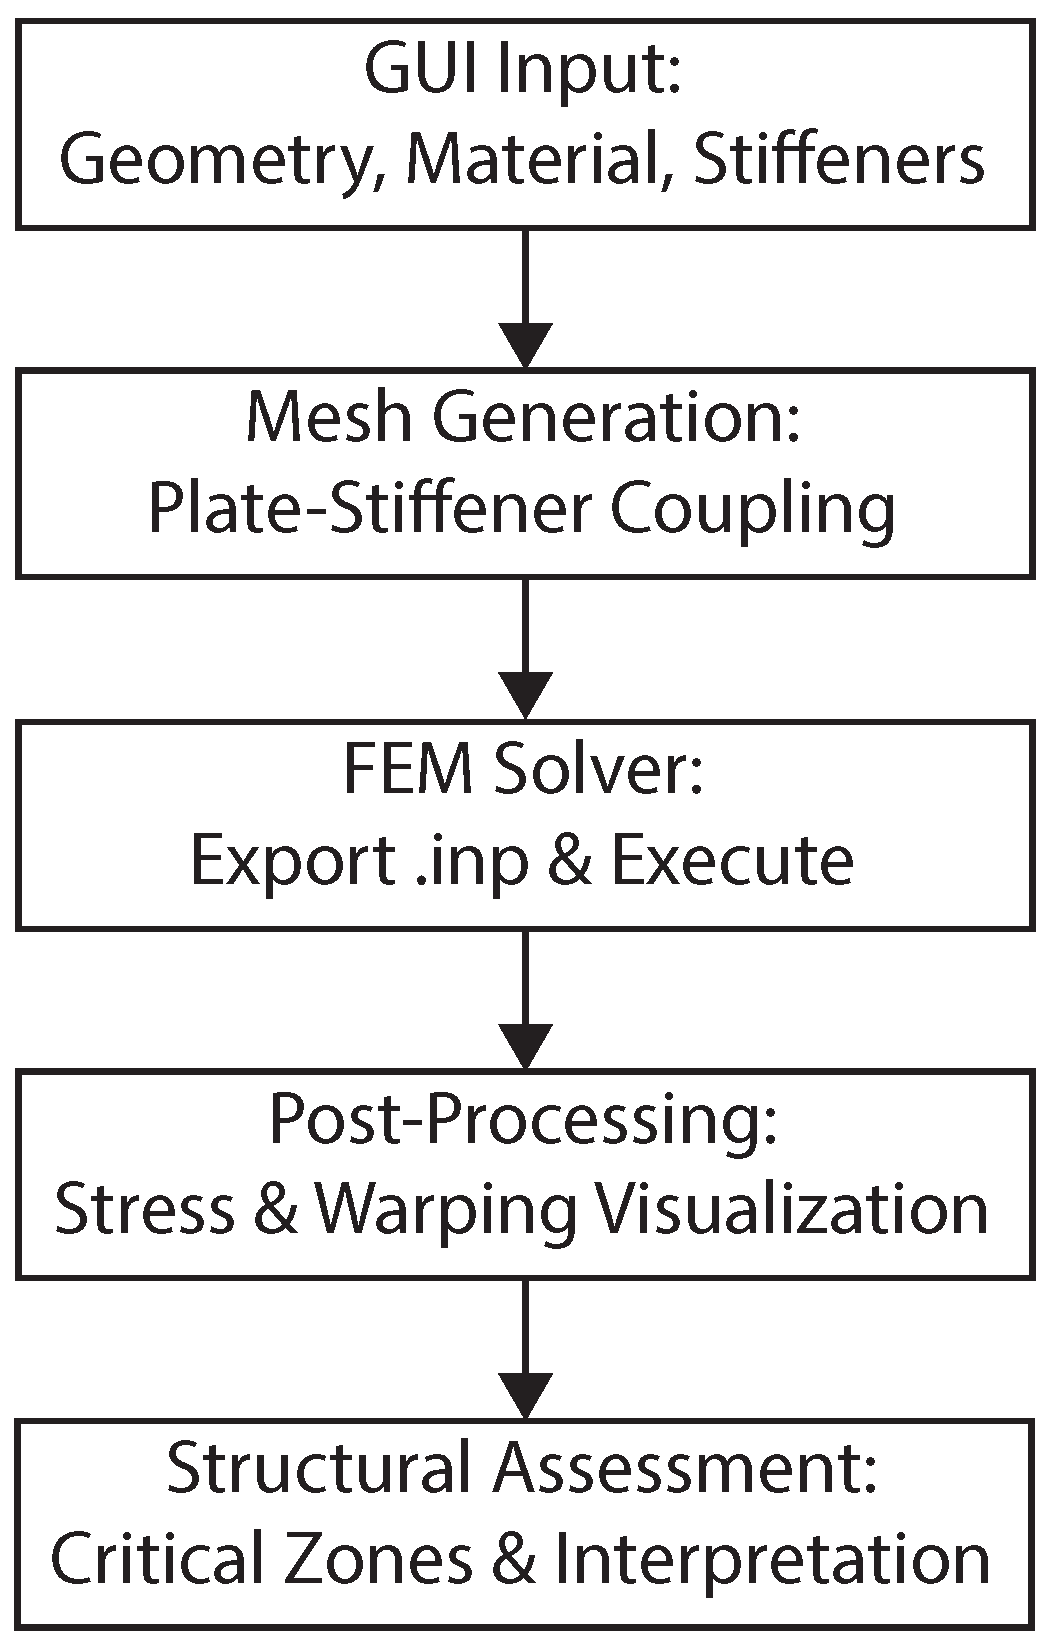
Figure presents the automated workflow used in the GUI, which eliminates several manual preprocessing steps typically required in conventional FEM modeling. Each stage is organized sequentially, enabling a streamlined transition from geometry definition to structural assessment. This integration allows efficient simulation of torsional effects on stiffened panels while maintaining consistency and reproducibility of results.
Figure 1.
Workflow of the GUI-based FEM procedure for torsional assessment of stiffened panels.
Once the numerical model is generated, the GUI automatically produces a solver-compatible input file. After solution of the global stiffness equation,
the GUI retrieves numerical outputs and visualizes deformation contours, stress distribution, and localized stress concentration near stiffener–plate junctions. This automated implementation provides a reliable and efficient framework for practical strength assessment, fatigue risk evaluation, and early-stage structural design optimization under torsional loading.

Table 2.
GUI Input Parameters for FEM-Based Torsional Analysis.
| Parameter | Description | Unit |
|---|---|---|
| Plate length () | Dimension in x-direction | mm |
| Plate width () | Dimension in y-direction | mm |
| Plate thickness () | Plate thickness | mm |
| Stiffener spacing (s) | Distance between stiffeners | mm |
| Stiffener height () | Web or flange height | mm |
| Material modulus (E) | Young’s modulus | MPa |
| Poisson’s ratio () | Elasticity parameter | – |
| Applied torque (T) | Torsional loading | N·mm |
| Twist angle () | Imposed boundary rotation | rad |
| Mesh density () | Number of finite elements | – |
2.5. Post-Processing and Stress Evaluation
Once the finite element solution is completed, the nodal displacement vector is extracted and used to compute the strain and stress fields at each integration point. The strain field is defined as:
where denotes the strain–displacement matrix. The corresponding stress components are obtained using the constitutive relation for linear elasticity:
Under torsional loading, the dominant stress components arise due to shear. The resulting maximum shear stress is evaluated as:
which serves as a key indicator of torsional resistance and potential failure modes. The variation of and along stiffener–plate intersections is particularly important due to the presence of stress concentrations and possible warping-induced distortions.
To assess structural integrity, stress concentration factors (SCFs) along stiffener junctions are computed and compared against allowable limits or fatigue-related criteria. Regions exhibiting elevated shear stress are automatically identified by the GUI, which provides visualization in the form of:
- contour plots of principal and von Mises stresses,
- distribution of maximum shear stress and warping deformation,
- critical stress paths along stiffener–plate connections.
These post-processing features enable rapid interpretation of the numerical results and facilitate structural evaluation under torsional loads, including strength verification, fatigue risk estimation, and design optimization.
3. Materials and Methods
3.1. Stiffened Panel Configuration
The finite element modeling process was conducted using a macro-based recording system for reproducibility, supported by a graphical user interface (GUI) that facilitates geometry creation, meshing, material assignment, and solver execution. The stiffened panel was modeled as a 3D deformable shell, allowing both bending and membrane behavior to be captured under torsional loading. Stiffeners were coupled to the plate via shared nodes, ensuring a realistic transfer of shear, bending, and warping-induced stresses.
Figure 2 illustrates the finite element representation of the stiffened panel used in the structural analysis. The model consists of a flat plate reinforced by longitudinal and transverse stiffeners, with nodal connectivity employed to ensure proper interaction between membrane and bending responses. The panel geometry was generated using the GUI-based modeling system, and each structural component was defined as a 3D deformable shell.
The corresponding geometric dimensions and scantling data used for the model construction are summarised in Table 3. These input parameters were embedded within the GUI and directly exported to the solver, enabling consistent reproduction of the stiffened panel configuration and facilitating numerical evaluation of stress distribution and deformation.
Structural steel grade AH36 was selected as the material for the entire model due to its reliable ductility and widespread use in marine and offshore structures. Both linear elastic and nonlinear plasticity properties were included to enable strength assessment and post-yield response under torsional loading. The material properties adopted in the numerical simulation are summarized in Table 4.
To represent the nonlinear hardening behavior, the stress–strain relationship was defined using incremental data points suitable for elastic–plastic FEM analysis. The values used in the model are presented in Table 5, and are compatible with standard material input formats used in commercial solvers such as Abaqus, ANSYS, and MSC Nastran.
These nonlinear data points were embedded within the GUI and automatically exported to the solver during model generation. With the inclusion of both elastic and post-yield material behavior, the model is capable of capturing stress redistribution, strain localization, and potential failure mechanisms under torsional loading.
3.2. Scripting and GUI-Based Automation Framework
The graphical user interface (GUI) developed in this study operates through a parametric Python scripting framework that replaces fixed macro-recorded commands with user-defined parameters. Macro recording in the finite element software produces a long sequence of instructions containing fixed numerical inputs and redundant operations. To support automated model generation, these scripts must be rewritten so that all geometric, material, boundary condition, and mesh definitions depend entirely on parameters supplied through the GUI.
Geometry scripting. The modeling of the stiffened panel begins with the conversion of coordinate-based macro commands into parameterized syntax. This approach enables users to modify plate width, camber length, camber height, and stiffener spacing. The example below shows the parametric form used to construct the main plate geometry:
panjang_miring = (lebar_pelat - panjang_camber)/2
s1.Line(point1=(0.0,0.0), point2=(panjang_miring, tinggi_camber))
s1.Line(point1=(panjang_miring, tinggi_camber),
point2=(panjang_miring + panjang_camber, tinggi_camber))
s1.Line(point1=(panjang_miring + panjang_camber, tinggi_camber),
point2=(lebar_pelat,0.0))
Through parametric scripting, the geometry automatically adjusts to any user-defined input from the GUI.
Material and section scripting. The material module converts density, elastic modulus, Poisson’s ratio, and plate thickness into modifiable parameters, allowing AH36 steel properties to be assigned programmatically:
mdb.models[nama_model].materials[’Steel’].Density(
table=((density_material,),))
mdb.models[nama_model].materials[’Steel’].Elastic(
table=((young_modulus*1e9, poisson_ratio),))
mdb.models[nama_model].HomogeneousShellSection(
name=’Pelat’, material=’Steel’, thickness=tebal_pelat)
This ensures consistency between material definition and GUI input.
Assembly scripting. Macro-recorded patterns and translations are replaced with loop-based commands, allowing the number and spacing of stiffeners to be varied:
for i in range(jumlah_pelintang):
instance_name = ’Profile-T-’ + str(i+1)
a.Instance(name=instance_name, part=part, dependent=OFF)
posisi_z = (i + 1) * jarak_profile_T
a.translate(instanceList=(instance_name,),
vector=(0.0,0.0,posisi_z))
This modular structure greatly enhances flexibility compared with fixed macro commands.
Interaction scripting. Coupling constraints between reference points (RP) and the plate edges are defined using set-based region assignments, which remain valid even if the geometry changes:
region1 = a.Set(referencePoints=refPoints1_RP1, name=’m_Set-cou1’)
region2 = a.sets[’Set-1ref1’]
mdb.models[nama_model].Coupling(
name=’Coupling-1’, controlPoint=region1, surface=region2,
couplingType=KINEMATIC, u1=ON, u2=ON, u3=ON,
ur1=ON, ur2=ON, ur3=ON)
Boundary condition scripting. Rotation is entered by users in degrees and automatically converted to radians:
rotasi_radian = derajat_rotasi*(3.14159/180)
mdb.models[nama_model].DisplacementBC(
name=’BC-Rotasi’, region=region1,
u1=0.0, u2=0.0, u3=0.0,
ur1=0.0, ur2=0.0, ur3=rotasi_radian)
This enables torsional deformation to be applied consistently.
Step and output scripting. Only the output variables needed for structural analysis are enabled:
mdb.models[nama_model].fieldOutputRequests[’F-Output-1’].setValues(
variables=(’S’,’PE’,’PEEQ’,’U’,’RF’,’RM’))
mdb.models[nama_model].historyOutputRequests[’H-Output-1’].setValues(
variables=(’UR3’,’RM3’))
The rotation–reaction moment relationship is used to evaluate global torsional response.
Mesh scripting. Mesh density and refinement parameters are defined as GUI inputs:
a.seedPartInstance(regions=partInstances,
size=ukuran_mesh,
deviationFactor=0.1,
minSizeFactor=0.1)
Job scripting. The final executable job is created automatically using the model name:
job_name = nama_model + ’_Torsion’
mdb.Job(name=job_name, model=nama_model)
All scripting modules are fully integrated within the GUI framework. Users control geometry, material parameters, boundary conditions, mesh density, and solver execution entirely from the interface, while the underlying script ensures consistent and reproducible finite element model generation.
3.3. Loading Application
Figure 3 shows the complete configuration of the stiffened panel formed by the combination of plate, longitudinal stiffeners, and transverse stiffeners. The objective of the analysis is to evaluate the structural response of the panel when subjected exclusively to torsional deformation, while other loading conditions are intentionally neglected.
Boundary conditions and torsional loading are applied using interaction couplings that connect both ends of the panel to two reference points, denoted as RP-1 and RP-2 (see Figure 4). The applied constraints are:
meaning that all translational and rotational degrees of freedom are restricted except for the rotation about the z-axis. Controlled torsional deformation is introduced by prescribing rotational displacement about the z-axis (URz) at RP-1 with values of
while the corresponding values at RP-2 are assigned with opposite signs. These angles represent incremental torsional loading levels, where the last value indicates the critical deformation threshold used to capture maximum stress distribution.
3.4. Mesh Convergence Studies
A mesh convergence study was performed to ensure that the numerical results obtained from the finite element model were independent of mesh size. Inadequate mesh refinement may lead to inaccuracies in stress prediction, especially in stiffened panels where geometric discontinuities generate localized stress concentrations. Therefore, the mesh density was systematically refined until the change in von Mises stress between two consecutive mesh levels fell below.
The procedure began with a coarse global element size and was refined following an approximate 2:1 ratio. For each mesh level, the maximum von Mises stress was extracted at the critical region of the stiffened panel. The convergence criterion is expressed as:
As shown in Table 6, the stress values increase with mesh refinement, indicating reduced numerical stiffness and improved resolution of local stress gradients. Convergence was achieved at a global mesh size of 40 mm, where the change from the previous mesh (58.5 mm) was 4.61%, satisfying the convergence requirement. Further refinement (27.5 mm) produced only a small additional change (4.75%), verifying that 40 mm was sufficiently accurate while remaining computationally efficient.
The mesh convergence curve shows that the computed von Mises stress increases with mesh refinement and progressively approaches a stable value, demonstrating the expected behavior of finite element discretization. Coarser meshes underestimate the stress due to insufficient resolution of local gradients, while intermediate refinements more accurately capture bending–shear interactions and localized stress concentrations. In the fine-mesh range, successive refinements produce only minimal changes, indicating numerical convergence. A graphical illustration of this behavior is presented in Figure 5, where the solution approaches an asymptotic trend as the mesh is progressively refined toward the converged response. The difference between the 40 mm and 27.5 mm mesh sizes falls below the commonly accepted 5% criterion, confirming that a 40 mm global mesh provides an appropriate balance between computational efficiency and accuracy for the subsequent structural analysis.
3.5. Structural Parameter Sensitivity Analysis
A structural parameter sensitivity analysis was performed to quantify the influence of plate thickness and longitudinal stiffener geometry on the mechanical behaviour of the stiffened panel. The selected parameter ranges were informed by the minimum scantling requirements of the Indonesian Classification Bureau (BKI), which prescribe a minimum plate thickness of 7.12 mm and a longitudinal section modulus of 63.77 cm3. To examine the sensitivity of the panel response around these regulatory limits, plate thicknesses of 7 mm, 8 mm, and 9 mm were adopted, representing incremental variations in bending and membrane stiffness.
In addition, three longitudinal stiffener geometries— mm, mm, and mm—were selected to introduce controlled variations in web height, flange width, and thickness. These geometric differences directly influence sectional rigidity and shear resistance, thereby affecting both the global torsional stiffness and the local stress distribution of the panel.
Combining the three plate thicknesses with the three stiffener profiles results in nine distinct numerical models, as shown in Table 7. This configuration matrix enables a systematic assessment of how individual and coupled scantling parameters influence the structural response, including deformation patterns, stress concentration zones, and overall load-carrying capacity. The resulting parametric dataset forms a rigorous basis for evaluating the relative sensitivity of the panel to variations in both plating and stiffener characteristics.
This parameter-driven modelling framework provides a robust foundation for identifying the relative influence of material thickness and stiffener configuration on structural performance. The insights obtained from this sensitivity analysis support the rational selection and optimisation of scantlings to improve structural efficiency and safety.
4. Results
4.1. Stress Limit Assessment
The structural adequacy of the stiffened panel under torsional loading was evaluated by comparing the computed stress response with the allowable stress limits prescribed by the Indonesian Classification Bureau (BKI). The allowable stress, commonly referred to as the working stress, represents the maximum permissible stress level that ensures the structure remains within the elastic range and avoids yielding during service loading. According to BKI rules, the allowable stress criterion for combined normal and shear stresses is expressed as
where and denote the longitudinal normal and shear stresses, respectively, and k is the material safety factor. For AH36 steel, this requirement yields an allowable von Mises stress of 197.92 N/mm2.
To determine the torsional capacity corresponding to this allowable limit, each model was subjected to an incremental rotation, and the resulting stress distribution was recorded. Figure 6 illustrates the representative stress contours obtained for a rotation of 0.1203 radians. As shown in the figure, the torsional loading produces a predominantly shear-driven stress field, with elevated stress concentrations forming near the intersections between the plate and stiffeners. These regions represent critical structural zones where shear flow is intensified due to geometric discontinuities, providing insight into how torsional effects propagate through the structural system.
The allowable stress for each variation was identified by locating the rotation angle at which the peak von Mises stress first reached the threshold of 197.92 N/mm2. This procedure enables the comparison of torsional stiffness across all nine models, as stiffer configurations reach the allowable stress at smaller rotation angles. The distribution of allowable twist angles across all model variations is presented graphically in Figure 7. The figure clearly depicts the relative stiffness hierarchy among the models, with lower twist angles indicating higher torsional rigidity. This visual representation highlights the sensitivity of torsional response to changes in plate thickness and stiffener configuration.
The results, summarised in Figure 7, reveal notable differences among the variations. Variation 3 exhibits the smallest allowable rotation angle, indicating the highest torsional stiffness among the evaluated configurations. This behaviour is consistent with its combination of a 7 mm plate thickness and the mm stiffener, which together provide improved sectional rigidity. Conversely, Variation 7 displays the largest allowable rotation, reaching radians (), and is therefore the most flexible configuration within the parameter set.
Overall, the allowable stress evaluation reveals that all models reach their stress limits at relatively small twist angles, all below . This finding demonstrates the inherent torsional sensitivity of stiffened plate structures and highlights the significant influence of scantling parameters on torsional rigidity. The narrow range of allowable twist angles also suggests that even modest changes in plate thickness or stiffener geometry can lead to measurable differences in structural stiffness. Such insights are valuable for guiding the optimisation of stiffened panel designs in applications where torsional loading is prominent.
4.2. Torsional Yield Capacity Evaluation
The torsional yield capacity of the stiffened panel was assessed by determining the rotation angle at which the von Mises stress first reaches the material yield strength of AH36 steel. This limit marks the onset of permanent deformation and provides a critical benchmark for evaluating structural safety and deformation tolerance under torsional loading. The analysis procedure mirrors that of the allowable stress evaluation, whereby each variation undergoes incremental twisting until the yielding threshold is attained.
The results indicate that the relative behaviour across the nine structural variations is broadly consistent with that observed in the allowable stress analysis. As shown in Figure 8, the twist angle required to reach yielding lies within a narrow range for all models, illustrating the close grouping of structural responses despite differences in plate thickness and stiffener geometry. In the figure, Variation 7 exhibits the largest twist angle at yielding ( rad or ), indicating the most compliant response, while Variation 3 reaches yielding at the smallest rotation, reflecting its comparatively higher torsional rigidity.
This clustered behaviour highlights a key structural observation: while plate thickness and stiffener cross-sectional geometry strongly affect the elastic torsional stiffness, their influence diminishes as the response approaches the yield limit. Consequently, all variations demonstrate yield angles within a narrow band around , underscoring the inherent torsional sensitivity of stiffened plates and the limited deformation reserve before yielding occurs.
4.3. Ultimate Torsional Capacity Assessment
The ultimate stress represents the maximum load-carrying capacity of the structure before global or local failure occurs. To evaluate this limit state, the stiffened panel was subjected to a prescribed rotation of 0.2406 radians, corresponding to the deformation level at which the von Mises stress reaches the material’s ultimate strength. As shown in Figure 9, the resulting stress field exhibits a distinct concentration pattern: the highest stresses occur along the central region of the plate, forming a relatively narrow and elongated band, while the outer regions experience elevated stress gradients, marked by the transition from green to yellow contours. These stress concentrations reflect the combined effects of shear flow redistribution and geometric discontinuities at the stiffener–plate intersections.
The analysis confirms that a rotation of 0.2406 radians is sufficient to drive the panel to its maximum stress state, with the peak value reaching 531.1650 N/mm2, consistent with the ultimate strength of AH36 steel. The corresponding twist angles at which each structural variation reaches ultimate stress are summarised in Figure 10. The results display a similar trend to the allowable and yield stress analyses, wherein variations with thicker plating exhibit increased torsional flexibility. Specifically, the 9 mm plate configurations show the largest twist angles at failure, indicating greater deformation tolerance before reaching the ultimate stress limit.
The influence of stiffener geometry on the ultimate torsional response is clearly evident in the variation results. Models incorporating the longitudinal stiffener consistently exhibit slightly larger twist angles at the point of ultimate stress, indicating a comparatively more flexible reinforcement configuration. This behaviour arises from the smaller sectional modulus and reduced shear area of this stiffener profile, which diminish its ability to resist torsion-induced warping and shear flow along the plate–stiffener interface. As a result, a greater global rotation is required for the panel to attain the ultimate stress limit.
In contrast, stiffeners with larger sectional moduli—such as the and profiles—enhance torsional rigidity by providing a more robust restraint against out-of-plane deformation. These geometries enable more efficient transfer of torsional shear through the stiffener–plate system, thereby lowering the twist angle at which peak von Mises stresses develop. The increased stiffness stems from both a higher flexural rigidity () and improved torsional stiffness (), which jointly act to suppress warping displacements and delay the formation of critical stress regions.
Despite these geometric differences, the ultimate twist angles fall within a remarkably narrow interval of approximately –. This limited spread indicates that, at the ultimate limit state, the structural response is governed predominantly by the material strength threshold rather than by variations in sectional geometry. Once the structure approaches the upper bound of the material stress capacity, deformation patterns converge, and the influence of stiffener configuration becomes significantly reduced. This behaviour reflects the transition from elasticity to nonlinear material-driven failure mechanisms, wherein yielding propagates across substantial regions of the panel, constraining the deformation capacity regardless of moderate geometric modifications.
4.4. Evaluation of Torsional Moment Capacity
The torsional moment capacity of the stiffened panel was assessed by identifying the rotation at which the applied moment ceases to increase, marking the onset of structural softening and the limit of global torsional resistance. Unlike stress-based criteria—where the focus lies on material yielding or ultimate strength—maximum moment behaviour reflects the overall stiffness and deformation capacity of the structural system. For this purpose, all model variations were subjected to a twist angle of 0.4363 rad to ensure that the peak moment response was captured.
Figure 11 illustrates the stress distribution at this rotation level. The region aligned with the torsional axis develops intense stress concentrations, evidenced by the reduction of low-stress (blue) zones. Simultaneously, portions of the plate perimeter show decreasing stress levels (green contours), indicating localized unloading as the structure transitions into post-peak behaviour. This redistribution is characteristic of torsional softening, where additional rotation leads to damage accumulation rather than increased resistance.
The scatter plot of maximum torsional moments shows that, although all variations reach their ultimate state at similar twist angles, their torsional capacities differ markedly, demonstrating the strong influence of geometric configuration on structural performance, as shown in Figure 12. Variations incorporating thicker plates and stiffeners with larger sectional moduli achieve substantially higher maximum moments, with Variation 9 exhibiting the highest capacity (36,672.70 kNm) and Variation 2 the lowest (27,831.10 kNm). This variation indicates that torsional strength is governed primarily by global stiffness rather than deformation tolerance, as the twist angles remain tightly clustered while the moment values vary by more than 30%. Overall, the results highlight that strategic adjustments to plate thickness and stiffener geometry can significantly enhance torsional resistance, offering a clear pathway for optimizing stiffened panel designs under torsional loading.
The maximum torsional moment analysis shows that, although all stiffened panel variations reach their ultimate deformation capacity within a narrow range of twist angles (approximately 22.8°–24.0°), their corresponding torsional moment capacities vary significantly, indicating that global stiffness rather than deformation tolerance primarily governs ultimate behaviour. As illustrated in Figure 11, stress concentrations intensify along the torsional axis at 0.4363 rad, while stress reduction near the plate boundaries signals redistribution of internal forces and the onset of structural softening. The scatter results in Figure 13 reveal that Variation 9 achieves the highest torsional moment (36,672.70 kNm), whereas Variation 2 exhibits the lowest (27,831.10 kNm), emphasizing the strong influence of plate thickness and stiffener sectional modulus on torsional capacity. Thicker plates and stiffeners with larger sectional moduli—such as the mm profile—enhance torsional resistance by improving warping restraint and shear rigidity. Despite these capacity differences, the similar twist angles at maximum moment suggest that global warping-dominated behaviour governs deformation at failure. These findings highlight that geometric modifications can markedly improve torsional strength without substantially affecting deformation limits, offering valuable insight for optimizing stiffened panel configurations under severe torsional loading.
4.5. Shear Stress Analysis
Shear stress refers to the component of internal stress that acts tangentially along the material surface. The shear stress evaluation in this study is carried out by computing the maximum shear stress using Equation 23. For each structural variation, the applied moment corresponds to the moment level at which the panel reaches its allowable stress limit, ensuring consistency with the procedure adopted in the maximum moment analysis. The required geometric parameters including the sector coordinates (), sectoral moment of inertia (), and the effective span length (L) are obtained directly from the finite element model geometry. This approach enables a rigorous and geometry-dependent estimation of shear stress, facilitating direct comparison across all stiffened-panel configurations.
Based on these calculations, Variation 7 exhibits the highest shear stress (44.35 N/mm2), reflecting the proportional relationship between applied moment and shear response as formulated in Equation 23. As illustrated in Figure 14, configurations subjected to larger torsional moments naturally develop higher shear stresses, causing the moment magnitude to overshadow the geometric influence in the initial comparison. Because the variations experience different moment levels at their allowable-stress limits, the geometric effect cannot be clearly distinguished from the raw results. To address this, an additional analysis was performed using a uniform torsional moment of 100 kNm across all variations, enabling geometry-driven differences to be more objectively evaluated. The recalculated shear stresses show that models with thicker plates and higher–section modulus stiffeners exhibit slightly reduced shear stress, indicating improved torsional rigidity. Furthermore, stiffeners with symmetric cross-sections, such as the profile, consistently produce lower shear stress compared with asymmetric shapes, demonstrating a more uniform shear-flow distribution. Together, these findings confirm that while shear stress initially appears dominated by the applied moment, geometric characteristics—particularly plate thickness, sectional modulus, and cross-sectional symmetry—play a measurable role when evaluated under standardized loading conditions.
Based on the computed results presented in Figure 15, the lowest shear stress is obtained for Variation 7, with a value of 37.20 N/mm2. The overall trend closely matches the behaviour observed in the FEM-based shear stress evaluation at a rotation angle of 0.1203 radians. Across all plate-thickness groups, the longitudinal stiffener with dimensions consistently produces the smallest shear stress. This response is attributed to its symmetric cross-sectional geometry, which promotes a more uniform shear-flow distribution compared with the asymmetric stiffener profiles used in other variations.
Furthermore, the 9 mm plate-thickness category exhibits lower shear stress values than the 7 mm and 8 mm configurations, indicating that increased plate thickness enhances the global load-carrying capability and reduces localised stress concentrations. The influence of stiffener rigidity is also evident: stiffeners with smaller sectional modulus values tend to generate lower shear and von Mises stresses, as the reduced stiffness allows the torsional deformation to be distributed more evenly across the plate rather than concentrated within the stiffener. Conversely, stiffeners with larger rigidity channel a greater portion of the torsional load into the stiffener web and flange, resulting in higher stress responses.
These analytical observations are consistent with the shear-stress contours generated by the finite element model, as illustrated in Figure 16. The strong agreement between analytical predictions and numerical results reinforces the validity of the maximum shear–stress formulation and further demonstrates that the shear–stress distribution is highly sensitive to variations in plate thickness and stiffener geometry.
Based on the numerical results presented in Figure 17, the shear stress obtained from the FEM analysis differs from the analytically calculated values by approximately 13.19–17.28 N/mm2. This discrepancy arises because Equation 23 represents the maximum shear stress formulation typically applied to the global torsional response of a ship hull, whereas the finite element model resolves local stress distributions, including the influence of stiffener geometry and boundary conditions. Nevertheless, the trend observed in Figure 17 is consistent with the analytical predictions derived from the BKI formulation. Model 7 exhibits the lowest shear stress, while Model 3 shows the highest, indicating that configurations with lower shear stress possess greater torsional resistance. This behaviour aligns with the theoretical relationship in which shear stress is inversely proportional to the polar moment of inertia; hence, lower shear stress reflects a higher torsional stiffness. The observed differences between the shear stress and maximum moment analyses stem from the distinct underlying assumptions: the maximum moment evaluation is based on uniform (pure) torsion, whereas the shear stress calculation incorporates warping effects. As a result, the two approaches highlight different aspects of the structural response under torsion, providing complementary insights into the global and local stiffness characteristics of the stiffened panel.
4.6. Structural Response Analysis
The combined response of von Mises stress, shear stress, and bending moment as a function of rotation angle (0–0.5 rad) demonstrates a clear divergence in sensitivity among the three parameters, as shown in Figure 18. The von Mises stress increases gradually from approximately 100 MPa at zero rotation to about 120 MPa at 0.5 rad, corresponding to an average slope of roughly 40 MPa per rad. In contrast, the shear stress exhibits only a modest rise from about 20 MPa to 25 MPa over the same interval, indicating that shear effects contribute minimally to the overall structural response in this range. The bending moment, however, increases sharply from near zero to roughly 70 units, representing the dominant response variable with an average slope of about 140 units per rad. The markedly higher sensitivity of bending moment relative to von Mises and shear stresses suggests that geometric amplification, rather than material softening, governs the system’s behavior as angle increases. The near-linear increase in von Mises stress without evidence of plateauing implies that the structure remains primarily within the elastic regime throughout the tested rotation range, assuming a yield strength above approximately 120 MPa. Meanwhile, the minimal change in shear stress indicates that shear-driven failure modes are unlikely to be critical under these loading conditions. From a design perspective, these trends highlight that limiting rotational displacement is significantly more effective in reducing structural demand than modifying shear-resisting features.
5. Discussion
This study investigates the structural strength of tanker main deck panels subjected to torsional loading using finite element modeling, supported by a graphical user interface (GUI) developed to streamline the model-generation process. The numerical results demonstrate that both deck plate and longitudinal plate thickness play an important role in enhancing torsional capacity; increasing plate thickness leads to higher overall strength. The stress evaluation further reveals a distinct trend among the longitudinal variations: although increasing deck plate thickness contributes noticeably to torsional rigidity, increasing the longitudinal stiffener thickness does not significantly modify the stress distribution. This indicates that, for the structural configuration examined, the deck plate is the dominant component in resisting torsional deformation, while longitudinal stiffener thickness has a comparatively minor influence on torsional stress response. The GUI assists in ensuring consistent modeling across variations, improving efficiency without altering the underlying structural behavior assessed in the simulations.
More broadly, these findings provide valuable insights for optimizing structural dimensions in ship design, particularly in components where torsional loading is critical. Plate thickness selection, especially for the main deck, has direct implications not only for torsional resistance but also for overall weight management and construction cost. However, the conclusions drawn here are specific to panel-scale analyses and should not be generalized to entire hull blocks without further investigation. Future research should incorporate longitudinal stiffener variations based on web–face dimensional ratios rather than solely on modulus-based classification criteria, as this would allow a clearer evaluation of geometric influence on torsional resistance. In addition, expanding the modeling approach and GUI functionality to accommodate a broader range of deck configurations and stiffener layouts would support more comprehensive assessments of torsional behavior in large-scale ship structures.
6. Conclusions
The structural analysis of the tanker main deck under torsional loading leads to the following conclusions. First, the applied torsional moment generates significant stress redistribution across the panel, influencing both von Mises and shear stress components. The results show that a twist of radians initiates plastic deformation in variation 3, while the maximum stress response occurs at radians. The shear stresses obtained from the numerical simulations range from in variation 7 to in variation 3, reflecting the influence of geometric configuration on shear capacity. Torsional loading also governs the structural limit state, with the main deck sustaining a maximum moment of in variation 9, representing the upper bound of torsional resistance for the configurations analyzed. The GUI developed as part of this study supports consistent model generation across variations, ensuring uniform boundary conditions and load applications; however, it does not influence the underlying structural response observed in the numerical results.
Second, the investigation highlights the role of plate and stiffener geometry in enhancing torsional strength. A deck plate thickness of provides the most favorable torsional resistance among the studied variations. Longitudinal stiffener geometry contributes substantially to warping resistance, where the profile performs optimally when warping effects dominate, while the profile demonstrates superior capacity under pure torque conditions. These findings underscore the need to select structural dimensions that correspond appropriately to the governing torsional mechanism, whether dominated by pure torque or influenced by warping effects. Overall, the study provides a deeper understanding of torsional behavior in stiffened main deck panels and offers practical guidance for optimizing structural design against torsional loads, while the accompanying GUI enhances the reproducibility and efficiency of conducting such analyses.
Author Contributions
Conceptualization, F.A.F. and T.P.; methodology, F.A.F. and T.P.; software, F.A.F. and T.P.; validation, F.A.F. and T.P.; formal analysis, F.A.F. and T.P.; investigation, F.A.F., T.P., I.K.A.P.U, D.S., and N.H.; resources, F.A.F. and T.P.; data curation, F.A.F. and T.P.; writing—original draft preparation, F.A.F. and T.P.; writing—review and editing, F.A.F. and T.P.; visualization, F.A.F. and T.P.; supervision, T.P.; project administration, T.P.; funding acquisition, T.P. All authors have read and agreed to the published version of the manuscript.
Funding
This research was supported by Institut Teknologi Sepuluh Nopember (ITS) through the “ITS Center Collaboration Research Scheme,” under grant number 1319/PKS/ITS/2024.
Acknowledgments
The authors gratefully acknowledge the financial support provided by Institut Teknologi Sepuluh Nopember (ITS) through the “ITS Center Collaboration Research Scheme” (Grant No. 1319/PKS/ITS/2024). This support made the completion of the present study possible.
Conflicts of Interest
The authors declare no conflicts of interest.
References
- Zhang, Q.; Yang, H.; Wu, S.; Cheng, W.; Liang, Y.; Huang, Y. A Study on the Ultimate Strength and Failure Mode of Stiffened Panels. J. Mar. Sci. Eng. 2023, 11, 1214. [Google Scholar] [CrossRef]
- Geng, X.; Qin, D. A Study on the Ultimate Strength and Failure Mode of Stiffened Panels. Int. J. Nav. Archit. Ocean Eng. 2025, 17, 100688. [Google Scholar] [CrossRef]
- Mancini, F.; Remes, H.; Romanoff, J. On the modelling of distorted thin-walled stiffened panels via a scale reduction approach for a simplified structural stress analysis. Thin-Walled Struct. 2024, 197, 111637. [Google Scholar] [CrossRef]
- Qin, Z.; Song, X.; Liao, C.; Yu, L.; Liu, X.; Yan, S.; Li, X. In-plane compressive responses and failure behaviors of composite sandwich plates with resin reinforced foam core. Heliyon 2024, 10, e26679. [Google Scholar] [CrossRef]
- Louca, L.A.; Harding, J.E. Torsional buckling of outstands in longitudinally stiffened panels. Thin-Walled Struct. 1996, 24, 211–229. [Google Scholar] [CrossRef]
- Zha, Y.; Moan, T. Ultimate strength of stiffened aluminium panels with predominantly torsional failure modes. Thin-Walled Struct. 2001, 39, 631–648. [Google Scholar] [CrossRef]
- Cao, J.; Shi, Y.; Wang, H.; Yao, R.; Wang, S. Optimal Design of Stiffened Panels Considering Torsion of Supporting Stiffeners. IOP Conf. Ser. Mater. Sci. Eng. 2019, 616, 012030. [Google Scholar] [CrossRef]
- Wang, M.; Zeng, Y.; Bai, X.; Lyu, F. Research on torsion deformation of integral stiffened panel by pre-stress shot peen forming. Procedia Manuf. 2020, 50, 74–78. [Google Scholar] [CrossRef]
- Wang, Q.; Wang, D. Ultimate strength envelope of a 10,000TEU large container ship subjected to combined loads: From compartment model to global hull girder. Ocean Eng. 2020, 213, 107767. [Google Scholar] [CrossRef]
- Cakiroglu, C.; Bekdaş, G.; Kim, S.; Geem, Z.W. Optimisation of Shear and Lateral–Torsional Buckling of Steel Plate Girders Using Meta-Heuristic Algorithms. Appl. Sci. 2020, 10, 3639. [Google Scholar] [CrossRef]
- Cho, S.-R.; Muttaqie, T.; Do, Q.T.; Kim, S.; Kim, S.M.; Han, D.-H. Experimental investigations on the failure modes of ring-stiffened cylinders under external hydrostatic pressure. Appl. Sci. 2018, 10, 711–729. [Google Scholar] [CrossRef]
- Lennon, R.F.; Das, P.K. Torsional buckling behaviour of stiffened cylinders under combined loading. Thin-Walled Struct. 2000, 38, 229–245. [Google Scholar] [CrossRef]
- Zhang, J.; Bisagni, C. Buckling-driven mechanisms for twisting control in adaptive composite wings. Aerosp. Sci. Technol. 2021, 118, 107006. [Google Scholar] [CrossRef]
- Deng, H.; Shao, Y.-B.; Hassanein, M.F. Experimental shear testing of corrugated web girders with compression tubular flanges used in conventional buildings. Thin-Walled Struct. 2022, 179, 109557. [Google Scholar] [CrossRef]
- Feng, L.; Hong, K.; Li, D.; Shi, H.; Hassanein, M.F. Ultimate torsional strength assessment of large deck opening stiffened box girder subjected to pitting corrosion. Ocean Eng. 2022, 251, 111059. [Google Scholar] [CrossRef]
- Woloszyk, K.; Garbatov, Y.; Kowalski, J. Experimental ultimate strength assessment of stiffened plates subjected to marine immersed corrosion. Appl. Ocean Res. 2023, 138, 103679. [Google Scholar] [CrossRef]
- Elsanadedy, H.; Sezen, H.; Abbas, H.; Almusallam, T.; Al-Salloum, Y. Progressive collapse risk of steel framed building considering column buckling. Eng. Sci. Technol. 2022, 35, 101193. [Google Scholar] [CrossRef]
- Paik, J.K.; Thayamballi, A.K.; Pedersen, P.T.; Park, Y.I. Ultimate strength of ship hulls under torsion. Ocean Eng. 2001, 28, 1097–1133. [Google Scholar] [CrossRef]
- Papangelis, J. On the Stresses in Thin-Walled Channels Under Torsion. Buildings 2024, 14, 3533. [Google Scholar] [CrossRef]
- Malikan, M.; Krasheninnikov, M.; Eremeyev, V.A. Torsional stability capacity of a nano-composite shell based on a nonlocal strain gradient shell model under a three-dimensional magnetic field. Int. J. Eng. Sci. 2020, 148, 103210. [Google Scholar] [CrossRef]
- Wang, Q.; Wang, C.; Wu, J.; Wang, D. Experimental and numerical investigations of the ultimate torsional strength of an ultra large container ship. Mar. Struct. 2020, 70, 102695. [Google Scholar] [CrossRef]
- Wang, C.; Wu, J.; Wang, D. Design similar scale model of a 10,000 TEU container ship through combined ultimate longitudinal bending and torsion analysis. Appl. Ocean Res. 2019, 88, 1–14. [Google Scholar] [CrossRef]
- Vescovini, A.; Li, C.X.; Paz Mendez, J.; Jin, B.C.; Manes, A.; Bisagni, C. Post-buckling behavior and collapse of Double-Double composite single stringer specimens. Compos. Struct. 2024, 327, 117699. [Google Scholar] [CrossRef]
- Gopalan, V.; Suthenthiraveerappa, V.; David, J.S.; Subramanian, J.; Annamalai, A.R.; Jen, C.-P. Experimental and Numerical Analyses on the Buckling Characteristics of Woven Flax/Epoxy Laminated Composite Plate under Axial Compression. Polymers 2021, 13, 995. [Google Scholar] [CrossRef]
- Ao, L.; Li, F.; Liu, B.; Zhao, N.; Deng, J. Experimental and Numerical Analysis of the Collapse Behaviour of a Cracked Box Girder Under Bidirectional Cyclic Bending Moments. J. Mar. Sci. Eng. 2025, 13, 1802. [Google Scholar] [CrossRef]
- Phongthanapanich, S.; Dechaumphai, P. EasyFEM—An object-oriented graphics interface finite element/finite volume software. Adv. Eng. Softw. 2006, 37, 797–804. [Google Scholar] [CrossRef]
- Rahman, M.M.; Nahar, T.T.; Kim, D. FeView: Finite element model (FEM) visualization and post-processing tool for OpenSees. SoftwareX 2021, 15, 100751. [Google Scholar] [CrossRef]
- Chen, H.-M.; Lin, Y.-C. Web-FEM: An internet-based finite-element analysis framework with 3D graphics and parallel computing environment. Adv. Eng. Softw. 2008, 39, 55–68. [Google Scholar] [CrossRef]
- Wang, Y.; Jin, L.; Zhang, Y.; Hao, P.; Wang, B. CAD-integrated stiffener sizing-topology design via force flow members (FFM). Comput. Methods Appl. Mech. Eng. 2023, 415, 116201. [Google Scholar] [CrossRef]
- Ryumin, S.; Tryaskin, V.; Plotnikov, K. Algorithms for the Recognition of the Hull Structures’ Elementary Plate Panels and the Determination of Their Parameters in a Ship CAD System. J. Mar. Sci. Eng. 2023, 11, 189. [Google Scholar] [CrossRef]
Figure 2.
The Stiffened panel model.
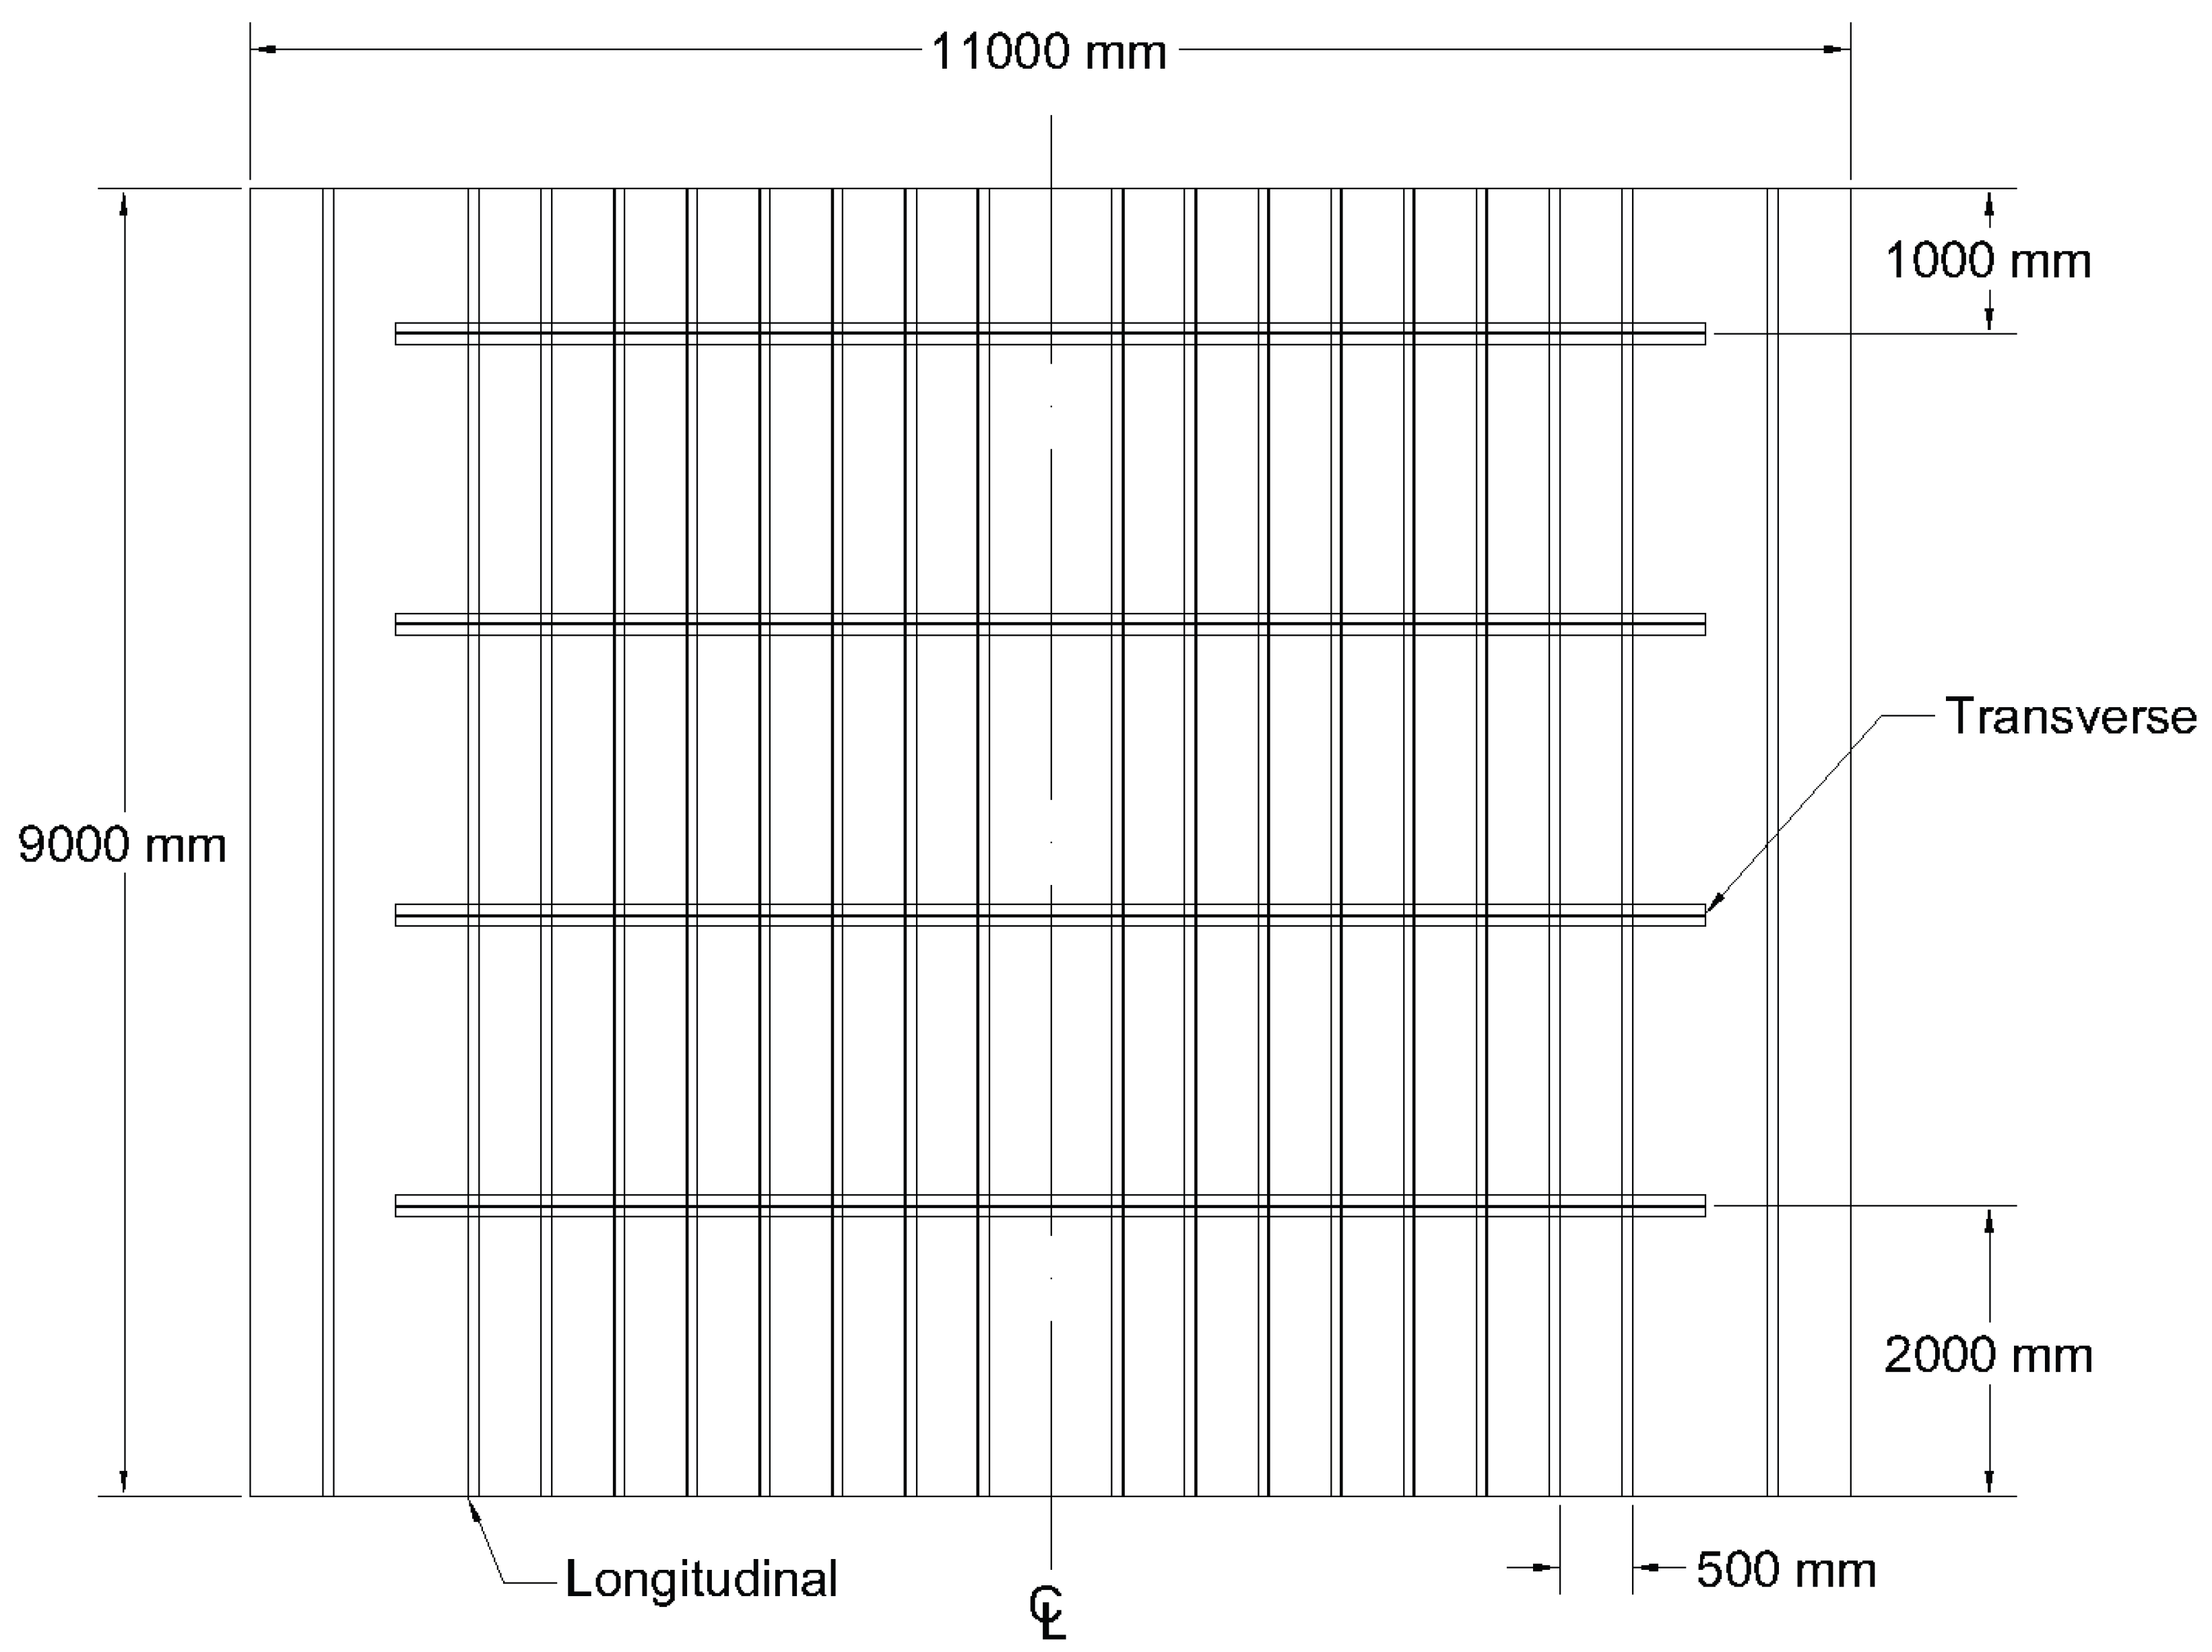
Figure 3.
Stiffened panel configuration from the combination of plate, longitudinal, and transverse components.
Figure 3.
Stiffened panel configuration from the combination of plate, longitudinal, and transverse components.
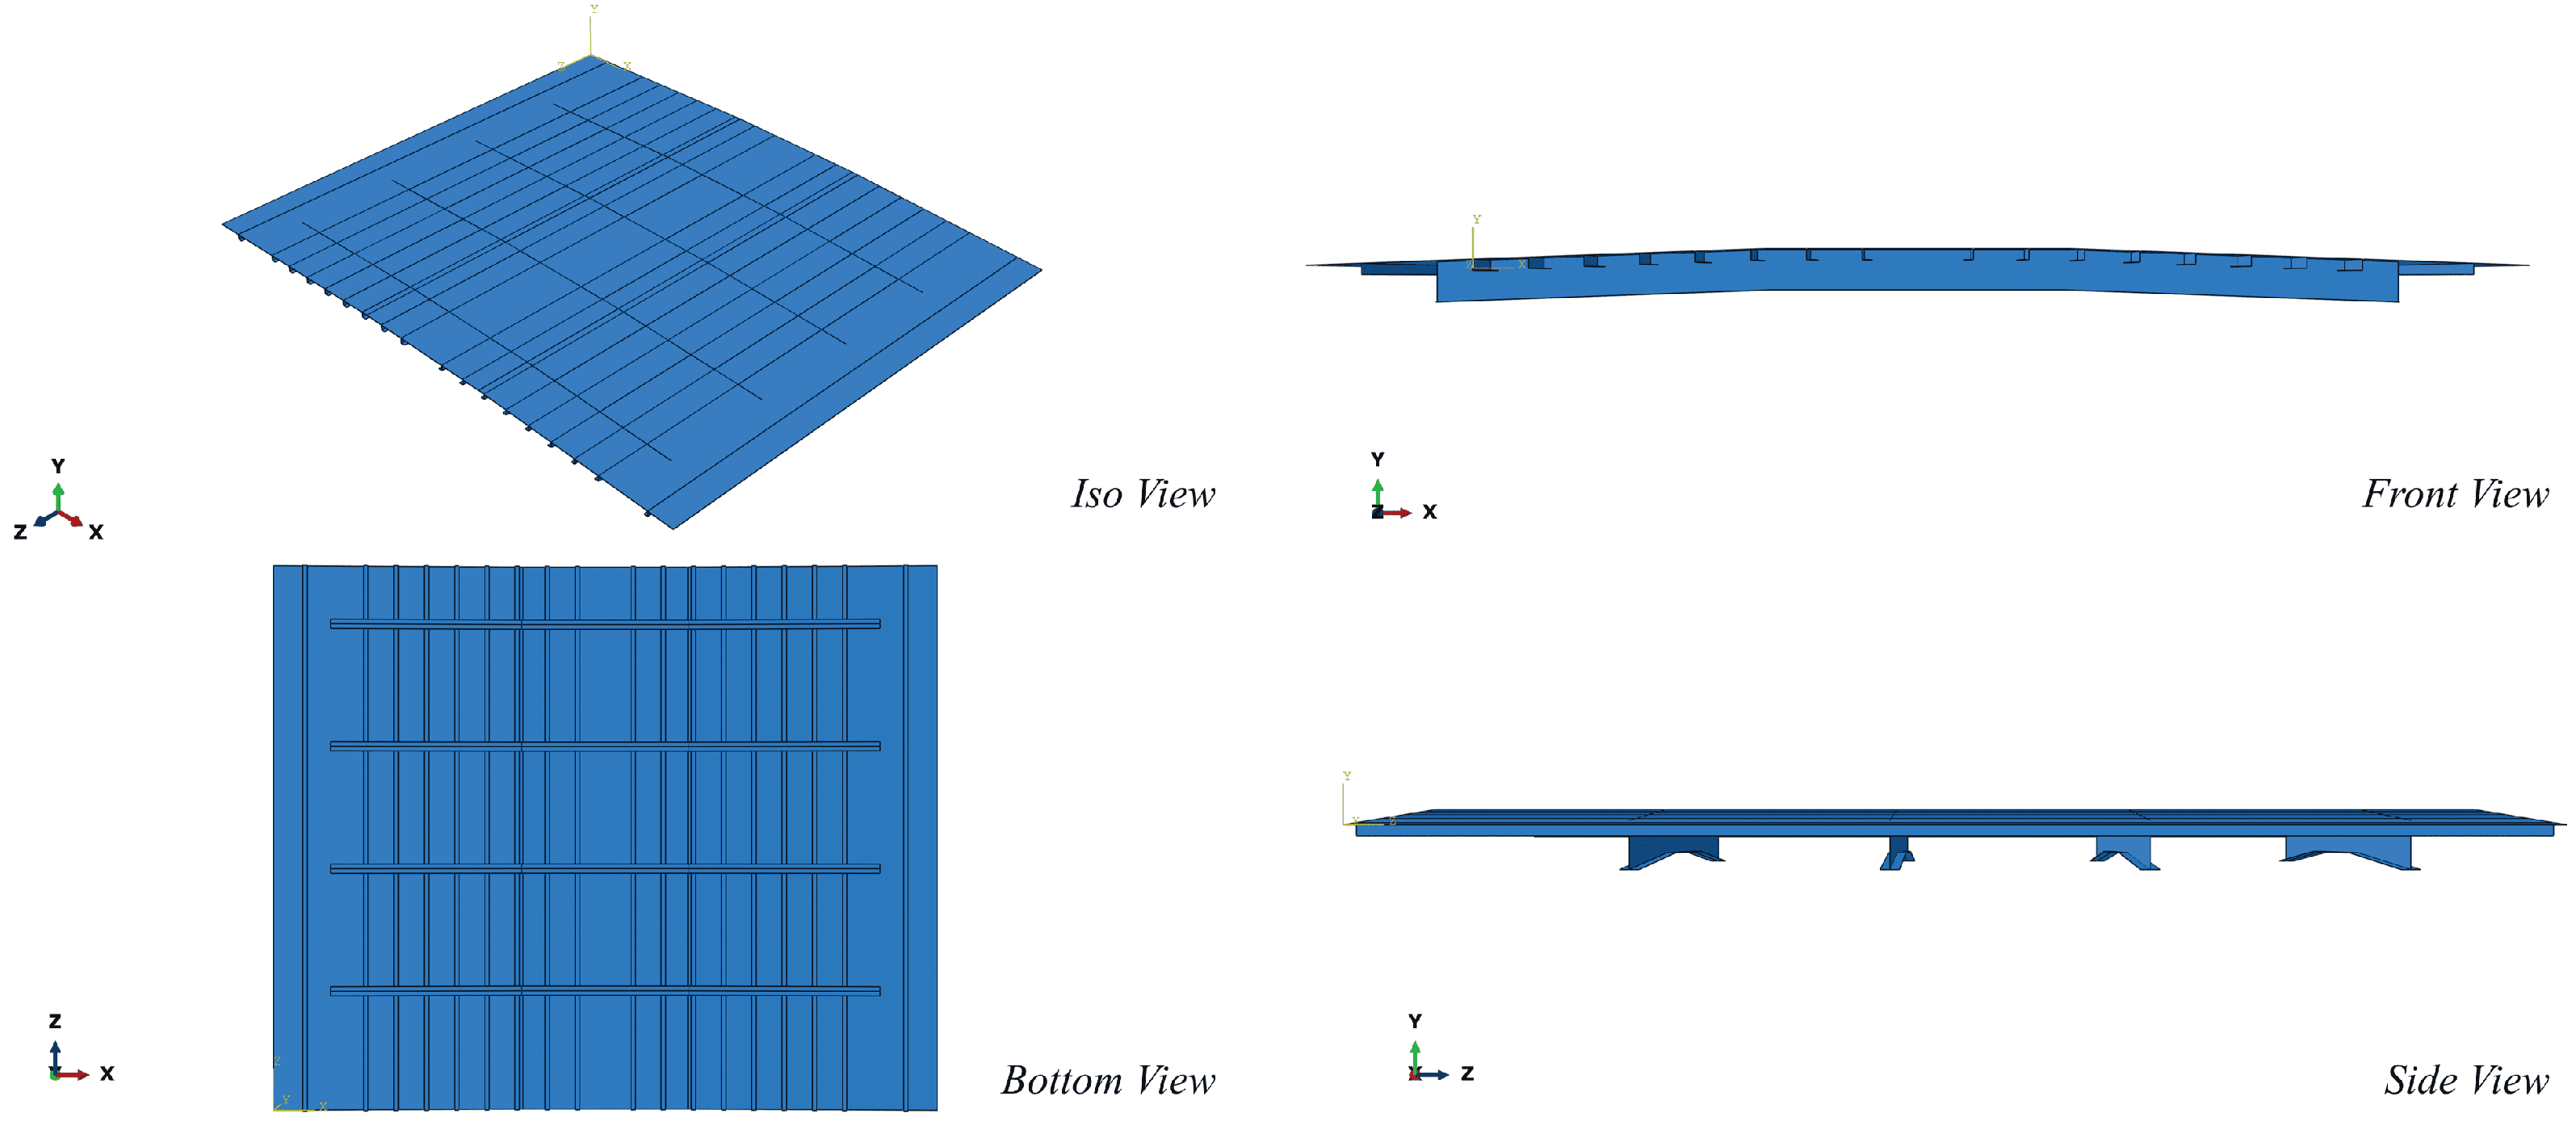
Figure 4.
Boundary conditions and loading application.
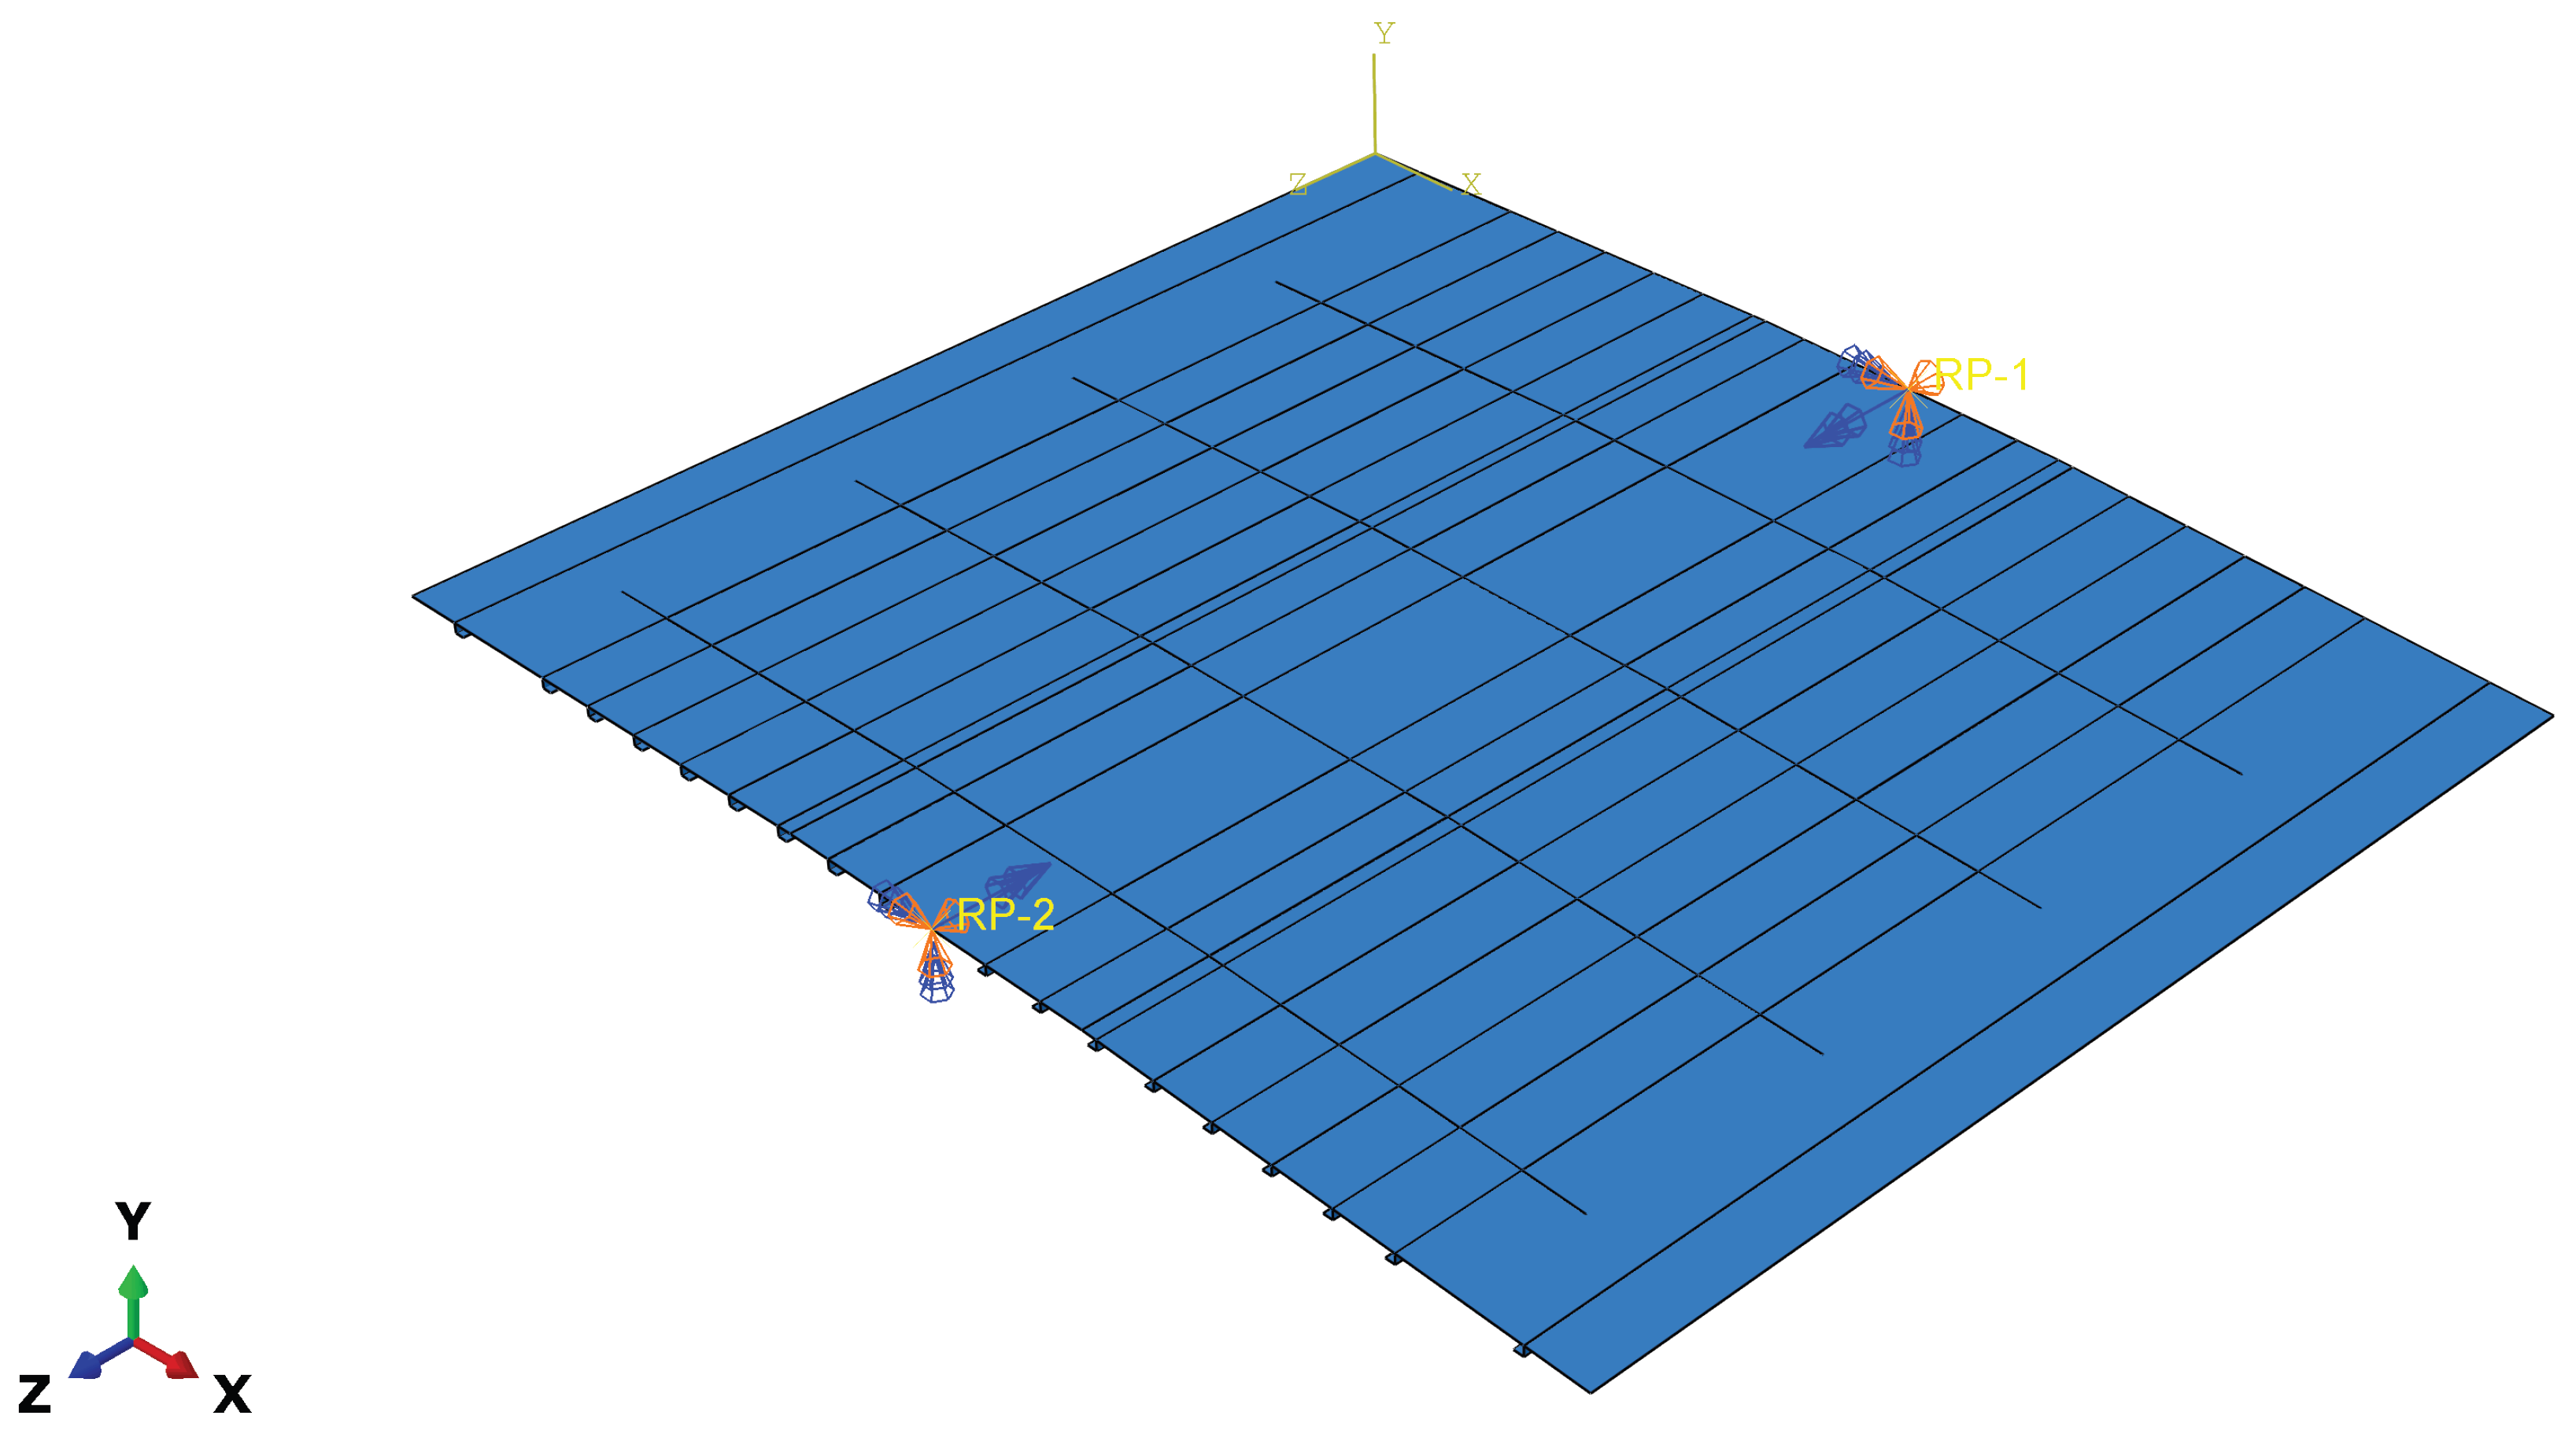
Figure 5.
Mesh convergence curve based on maximum von Mises stress.
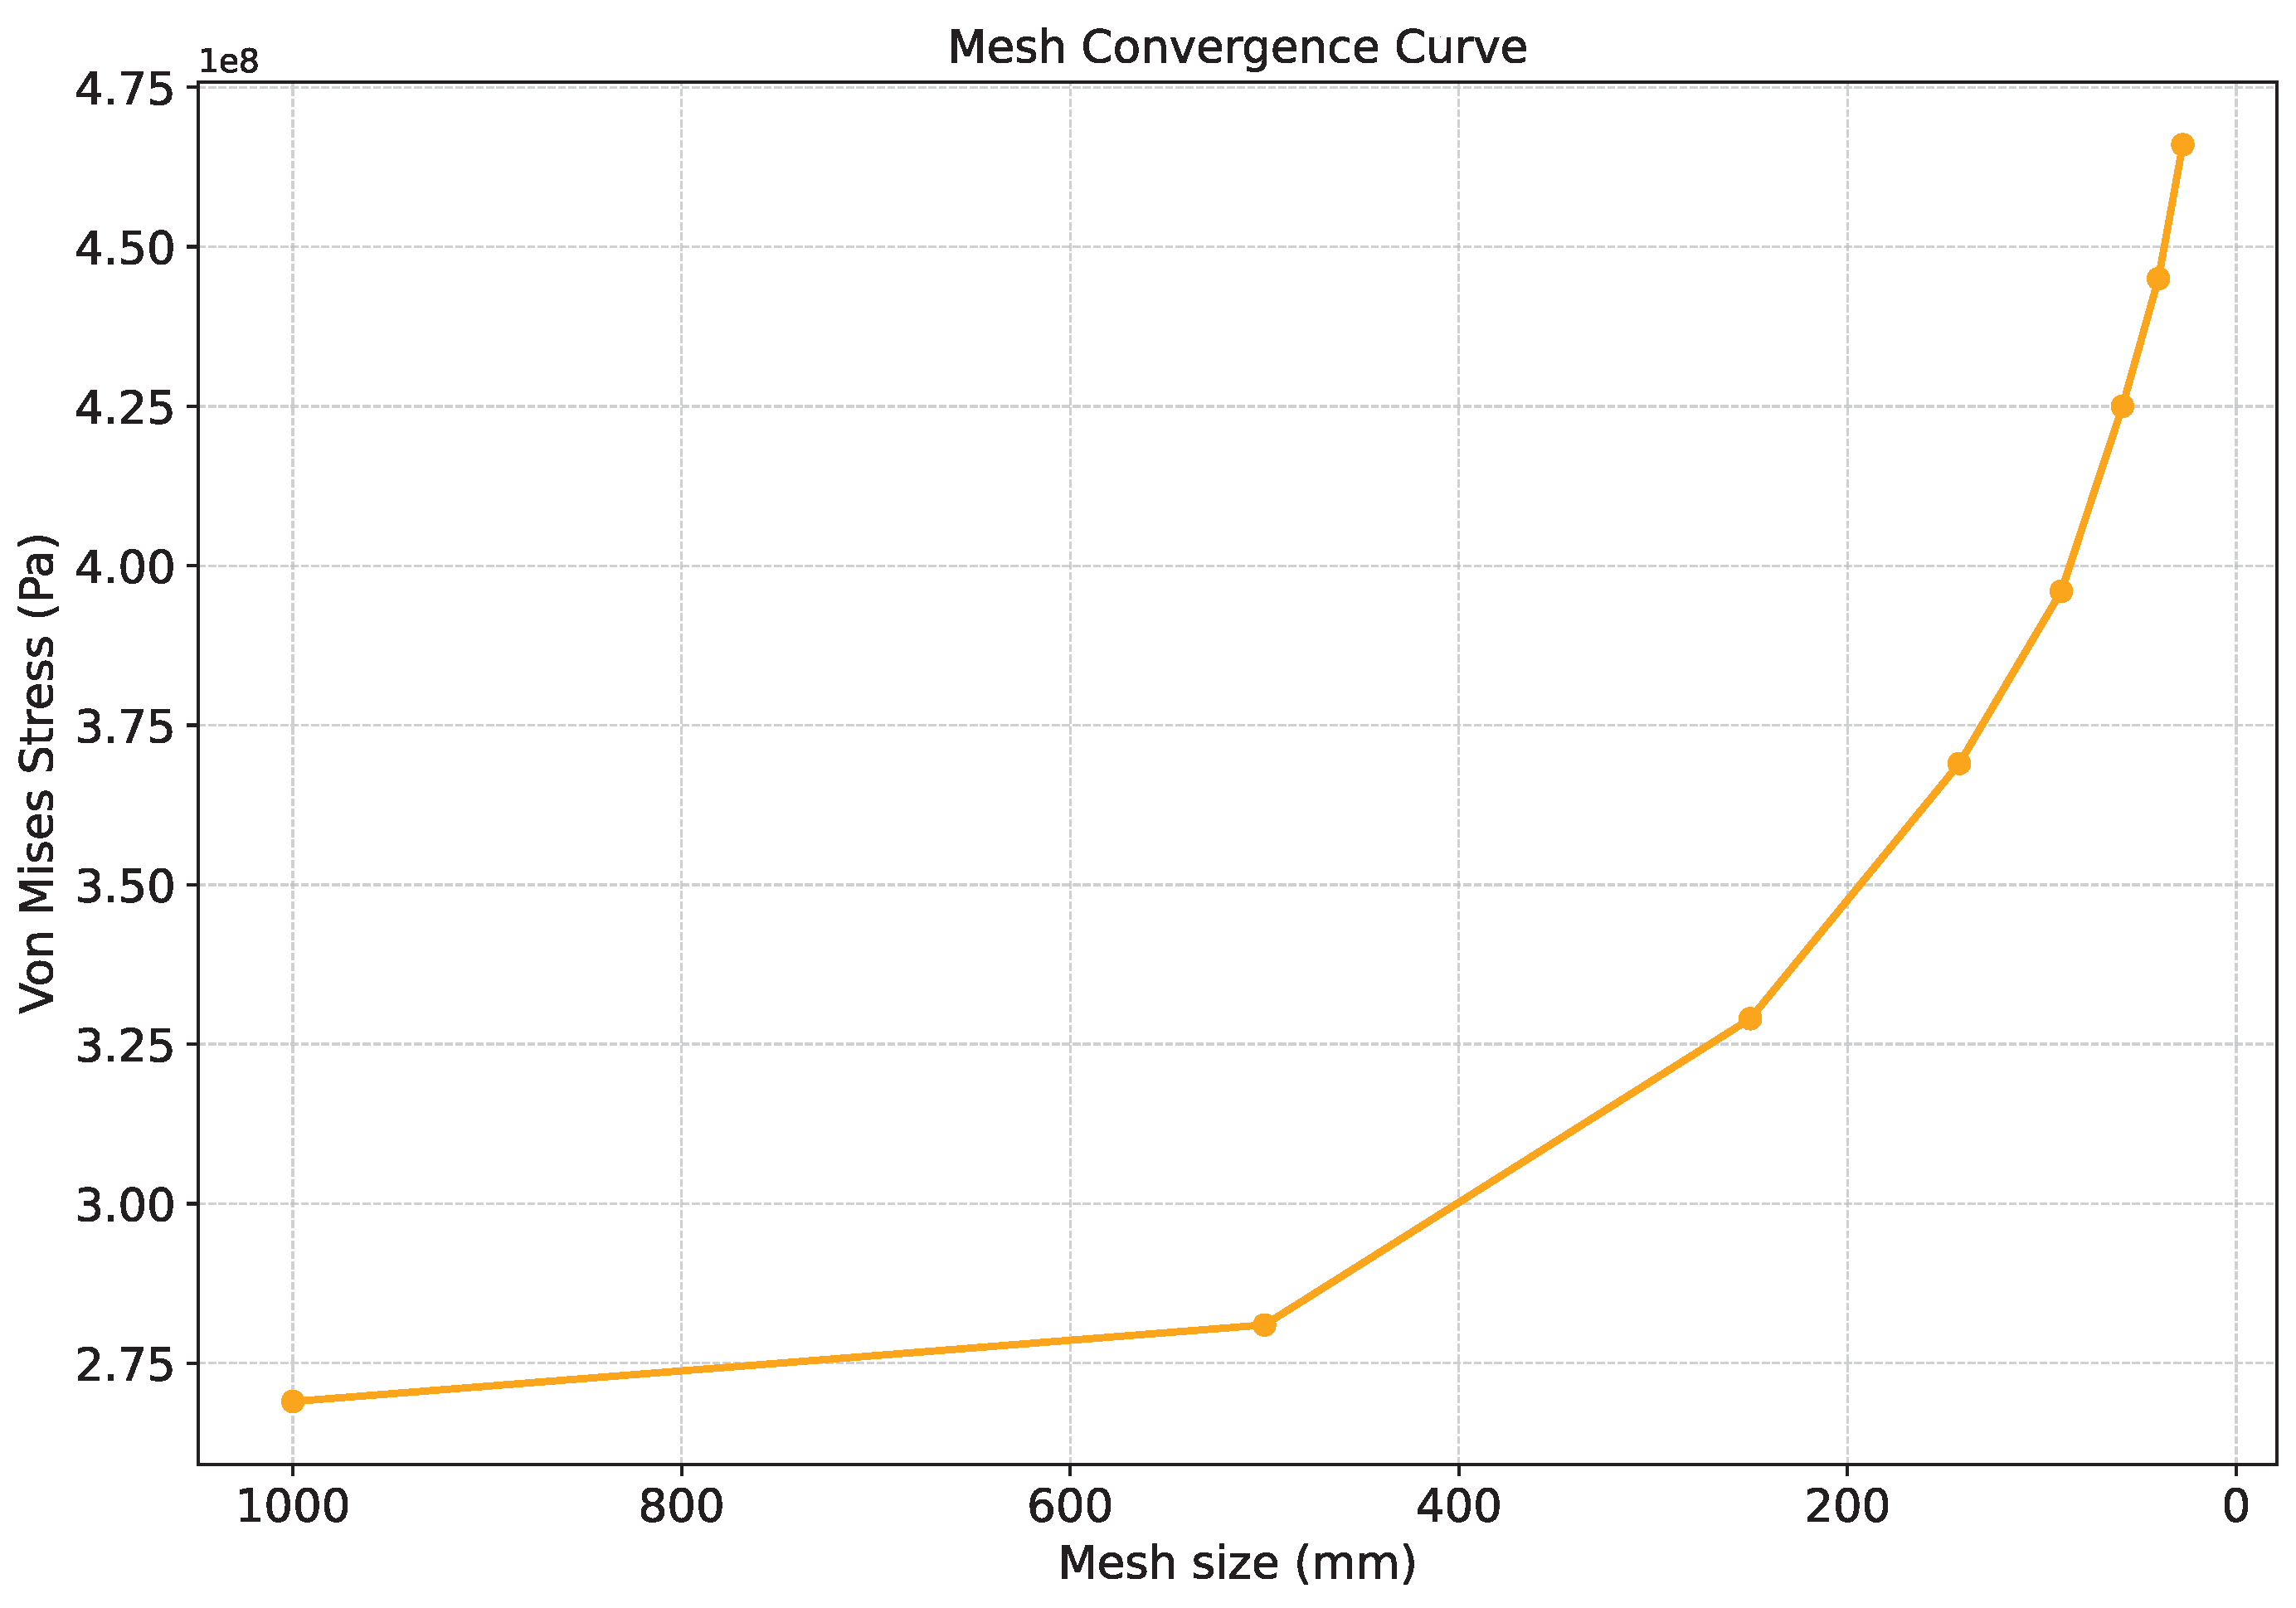
Figure 6.
Stress contour distribution for a rotation of 0.1203 radians.
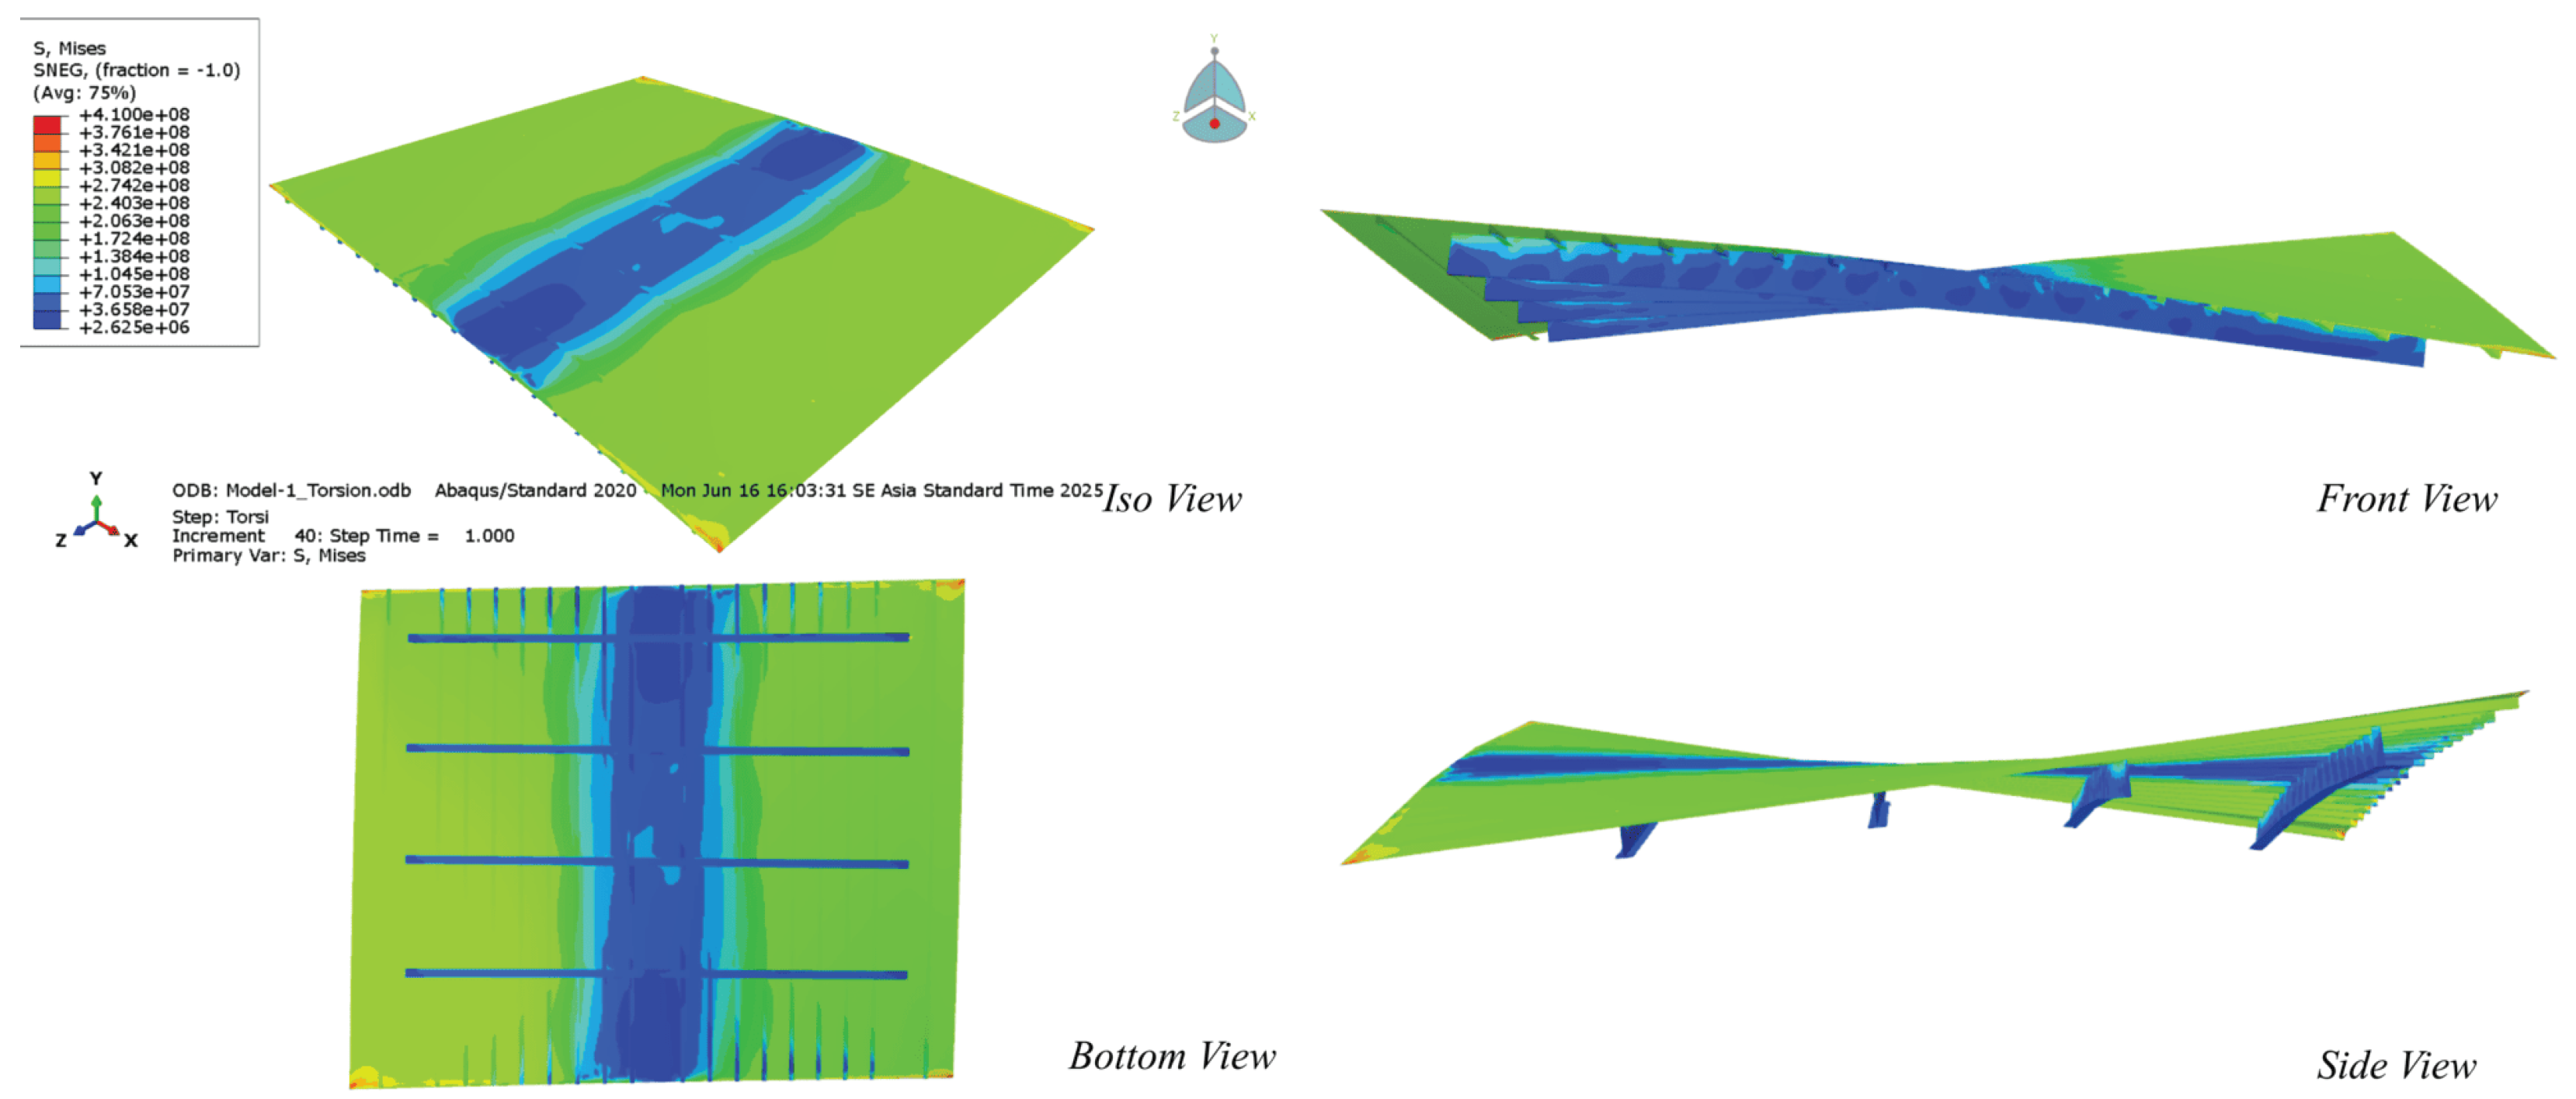
Figure 7.
Results of allowable stress analysis under torsional loading.
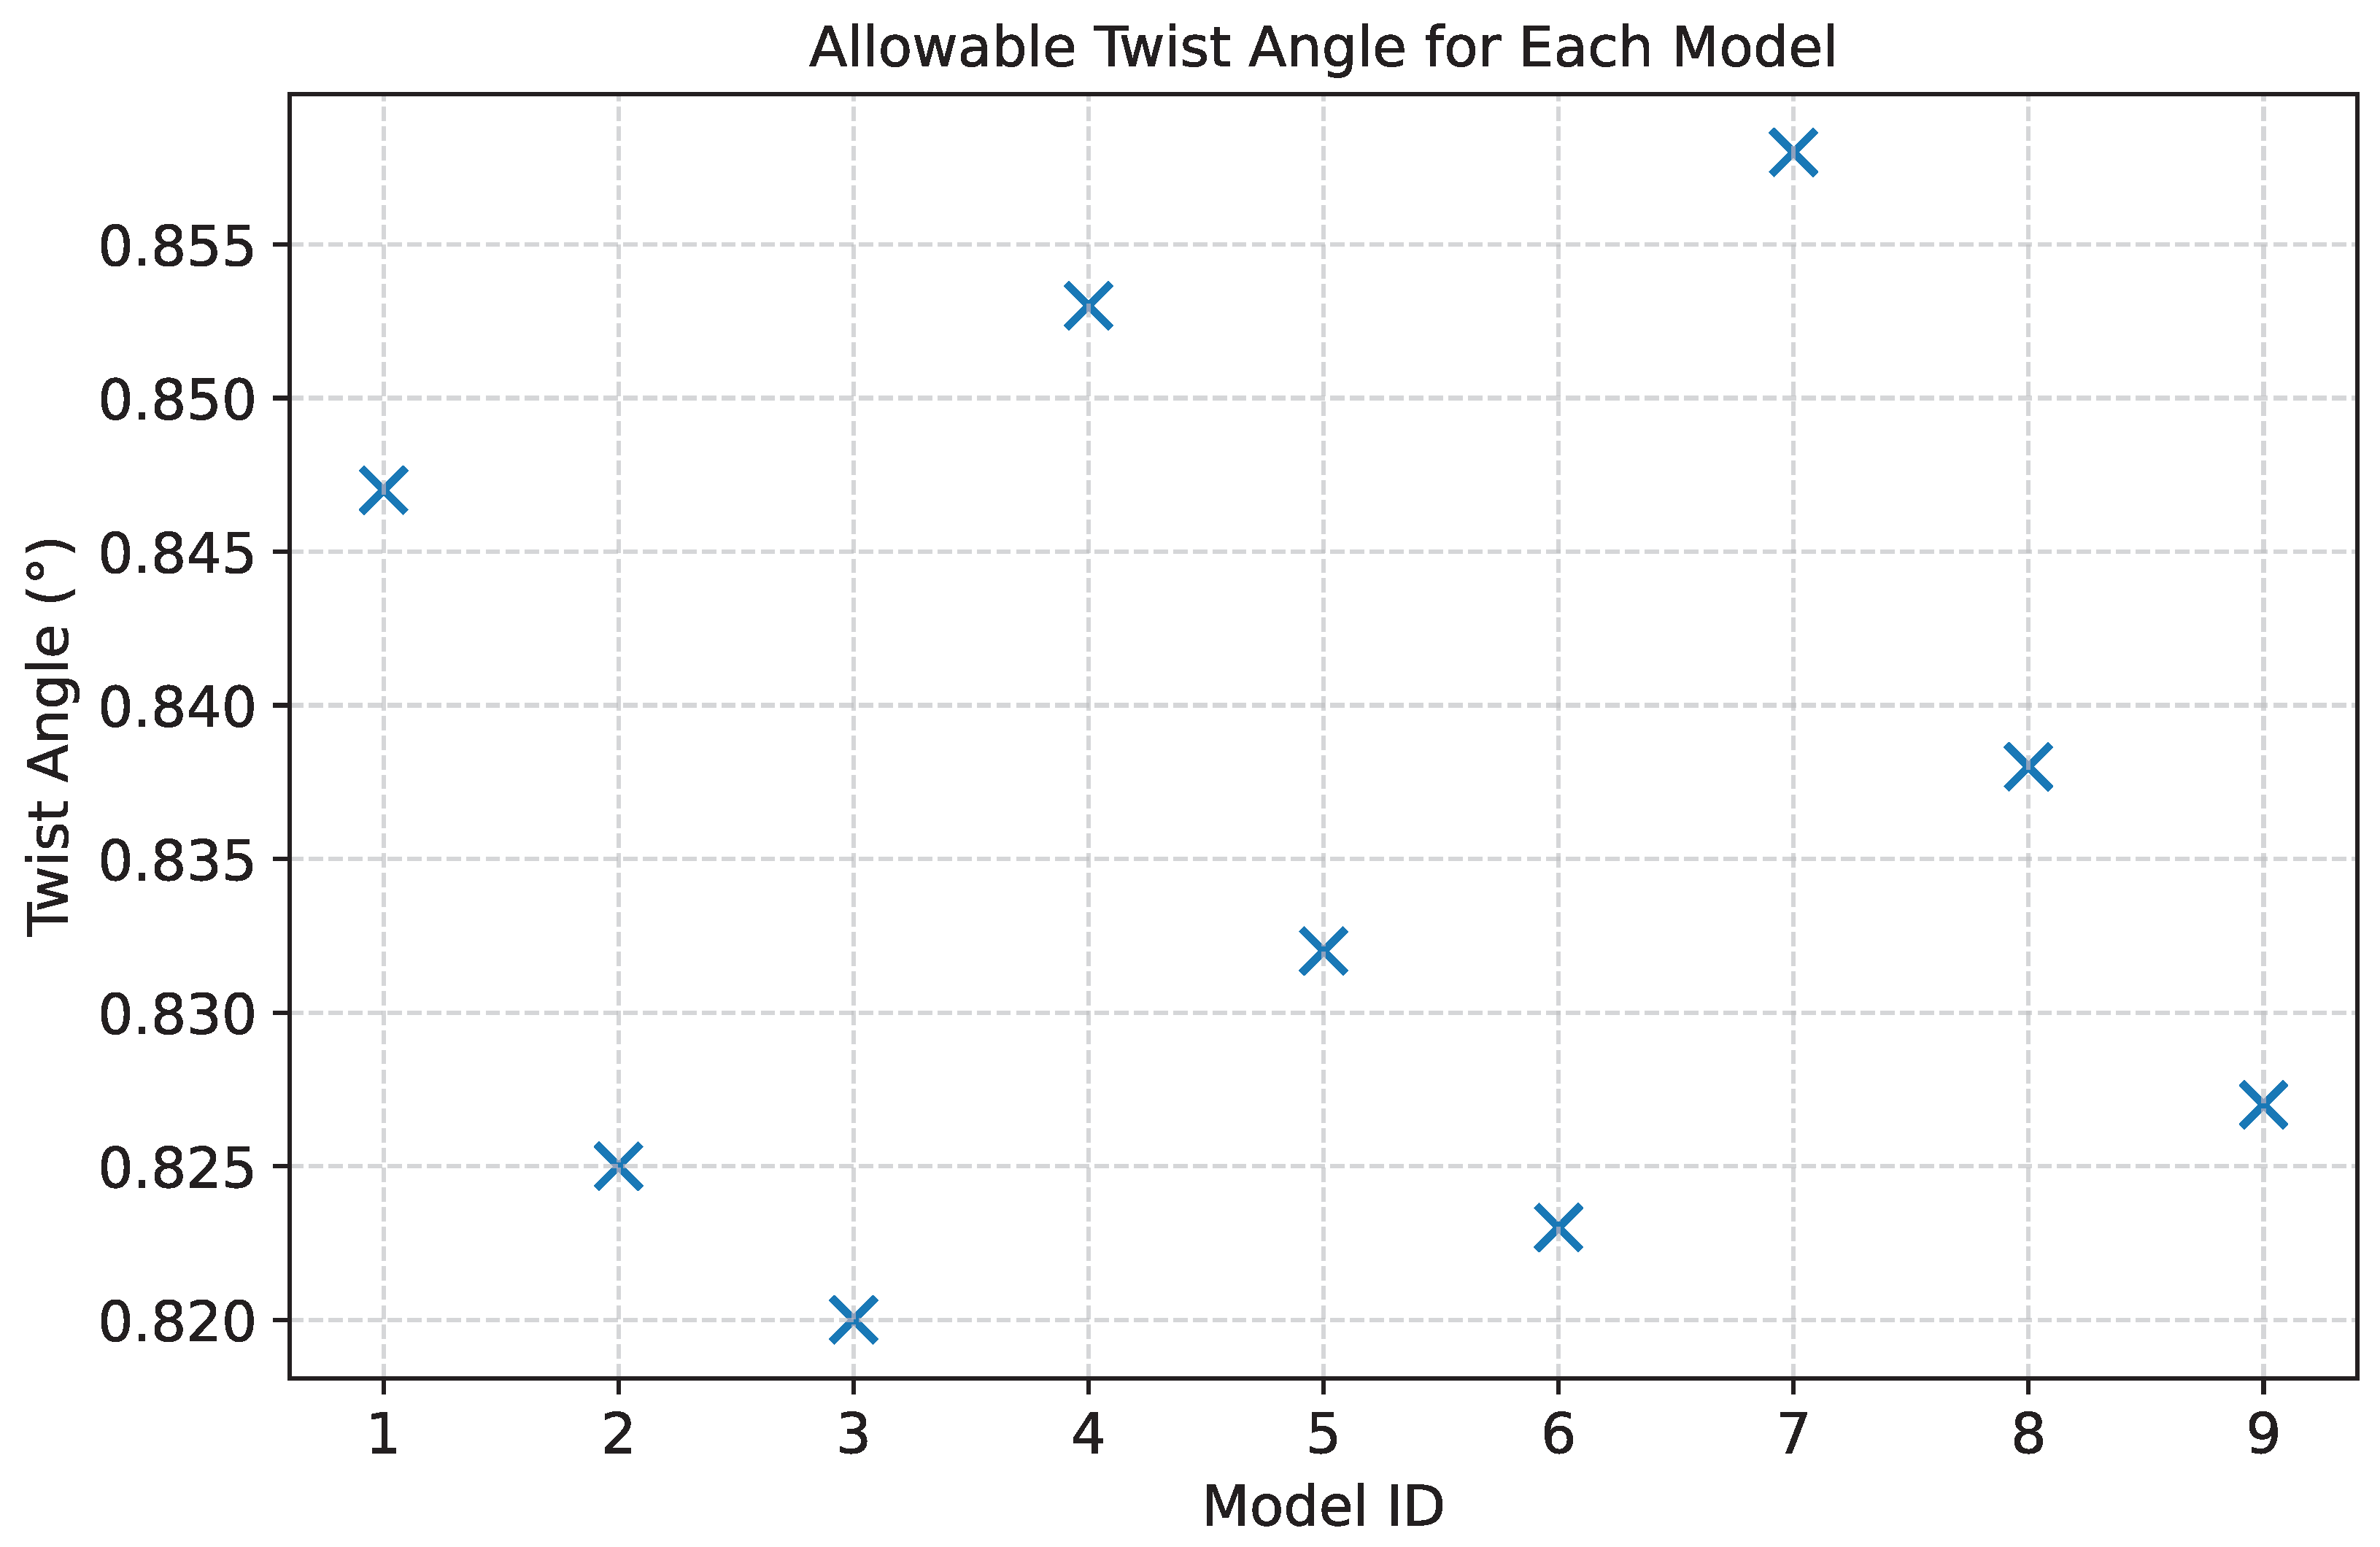
Figure 8.
Twist angle required to reach the yield stress for all stiffened panel variations.
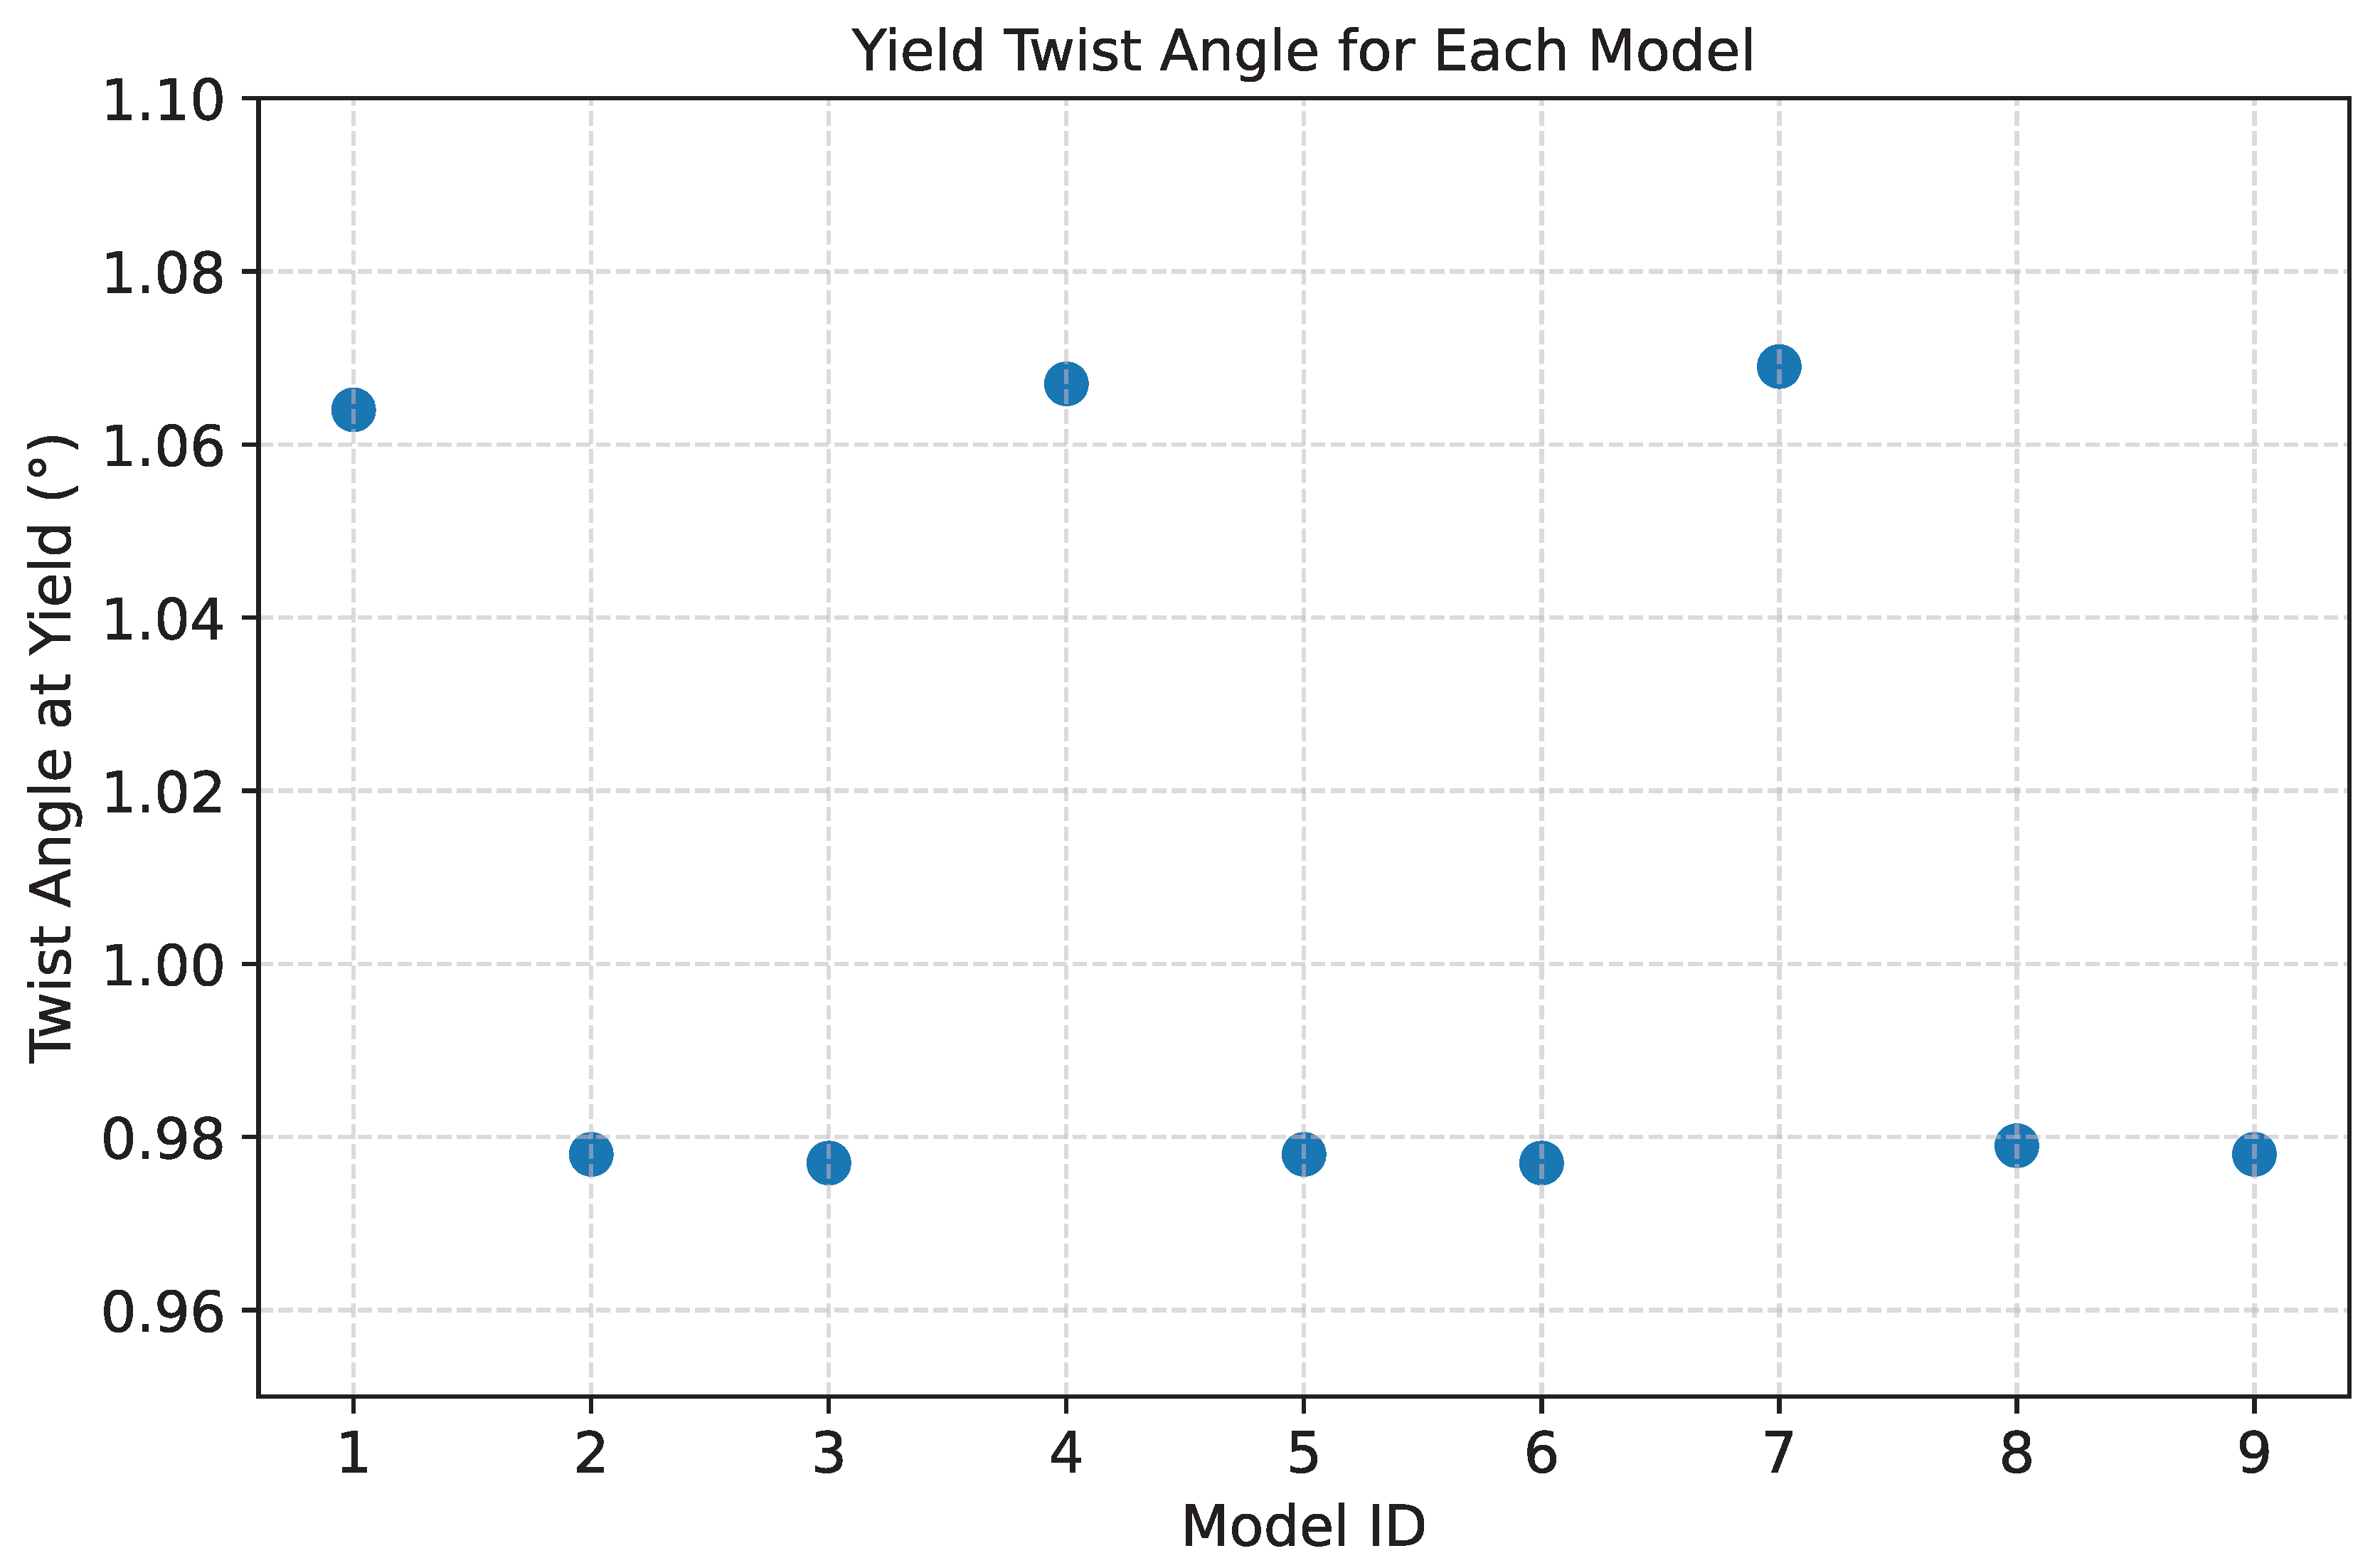
Figure 9.
Stress distribution at an applied rotation of 0.2406 radians, showing the onset of ultimate stress.
Figure 9.
Stress distribution at an applied rotation of 0.2406 radians, showing the onset of ultimate stress.
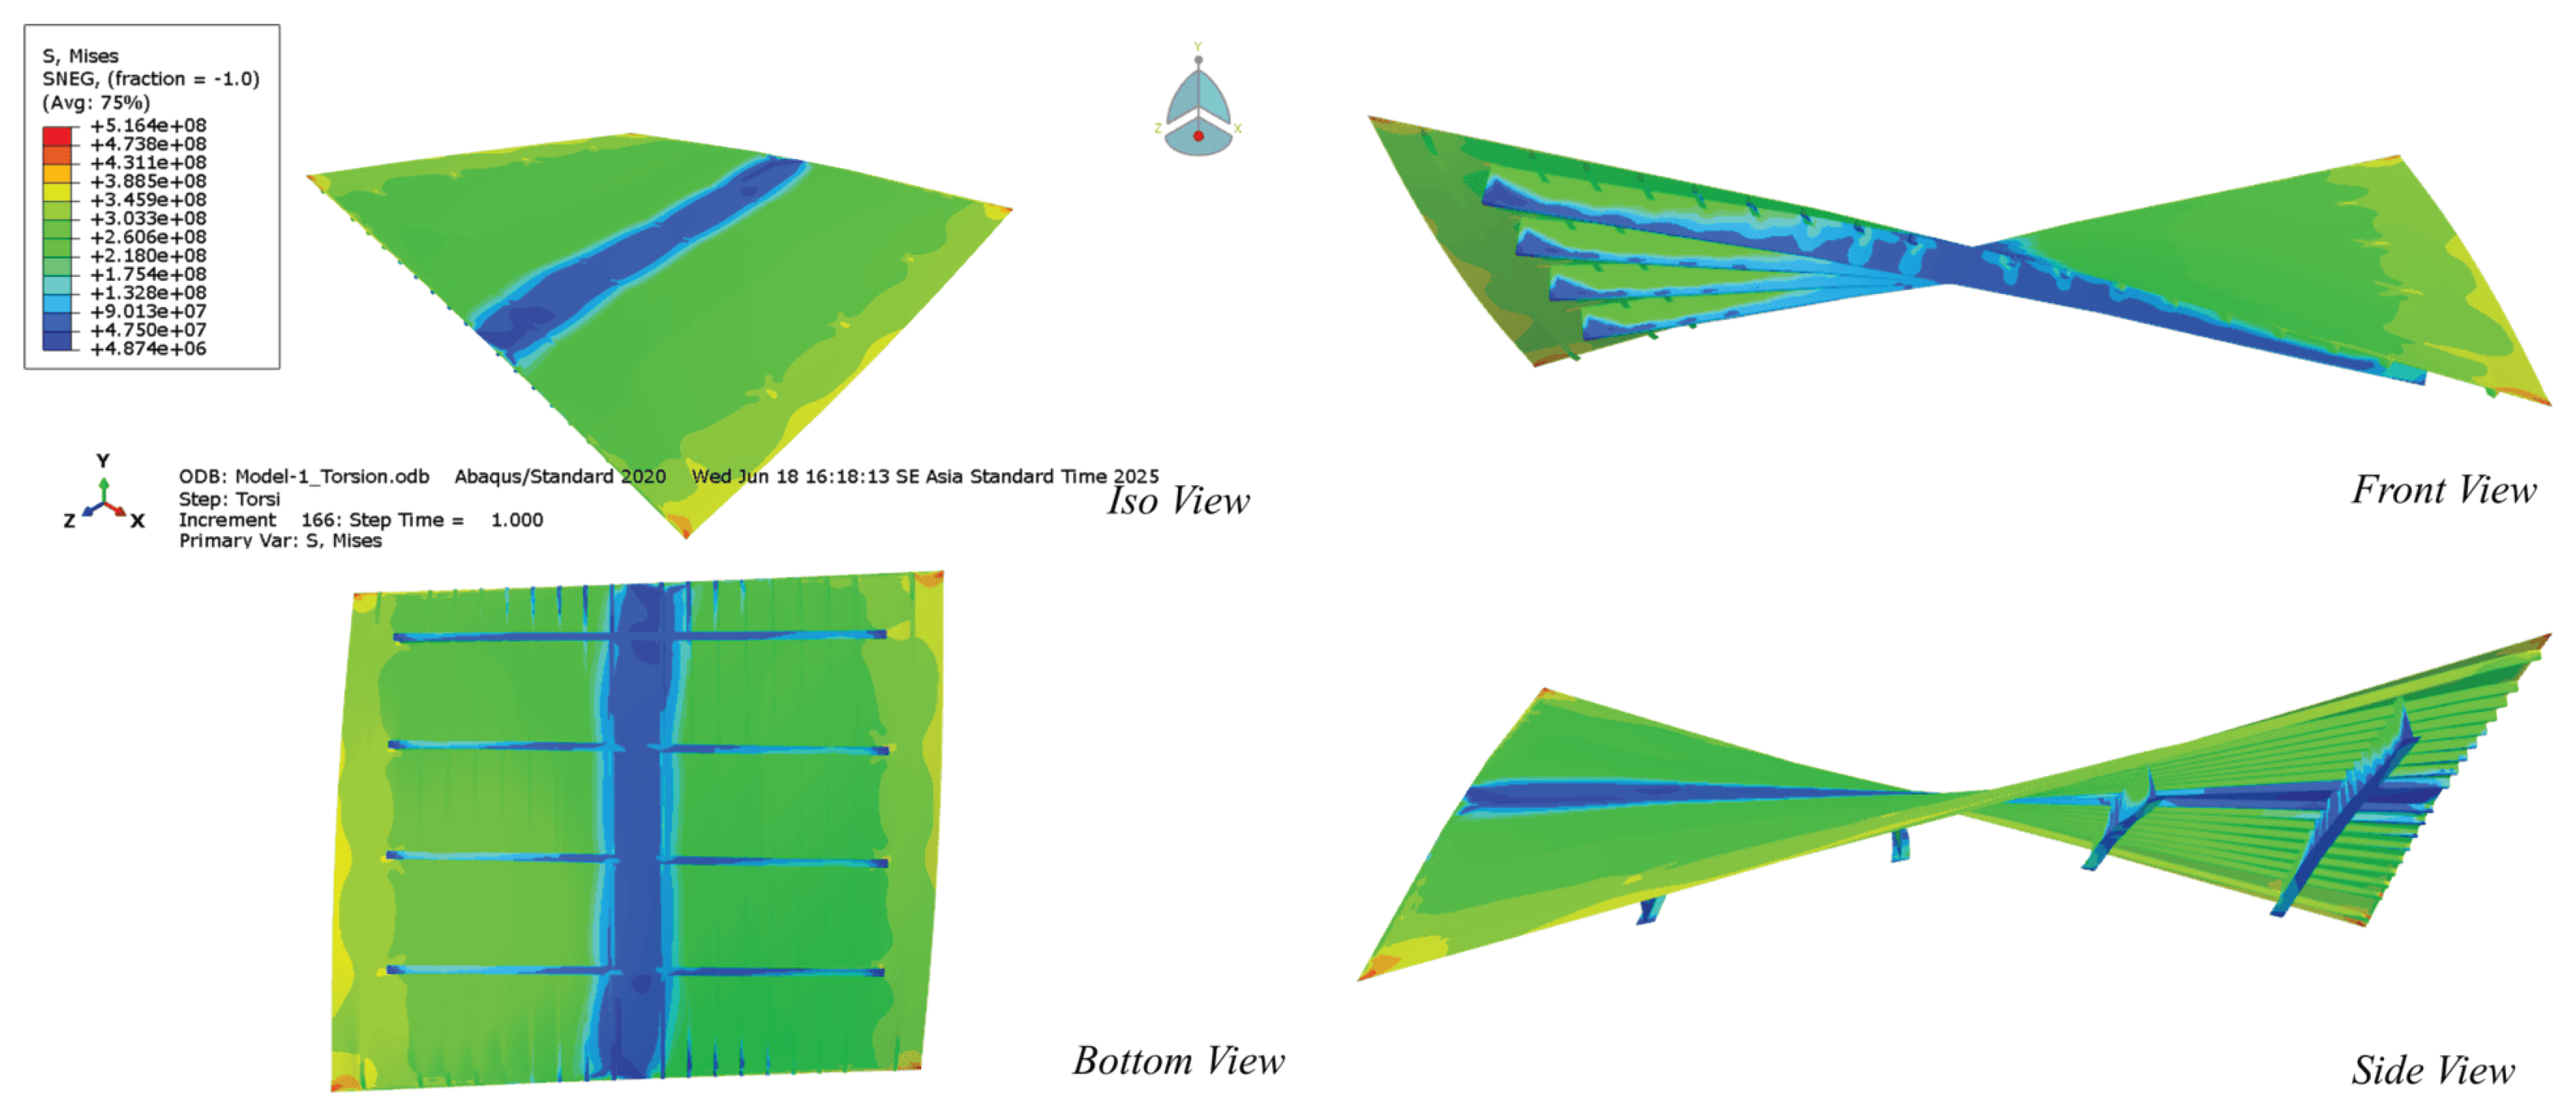
Figure 10.
Twist angles corresponding to ultimate stress for all structural variations.
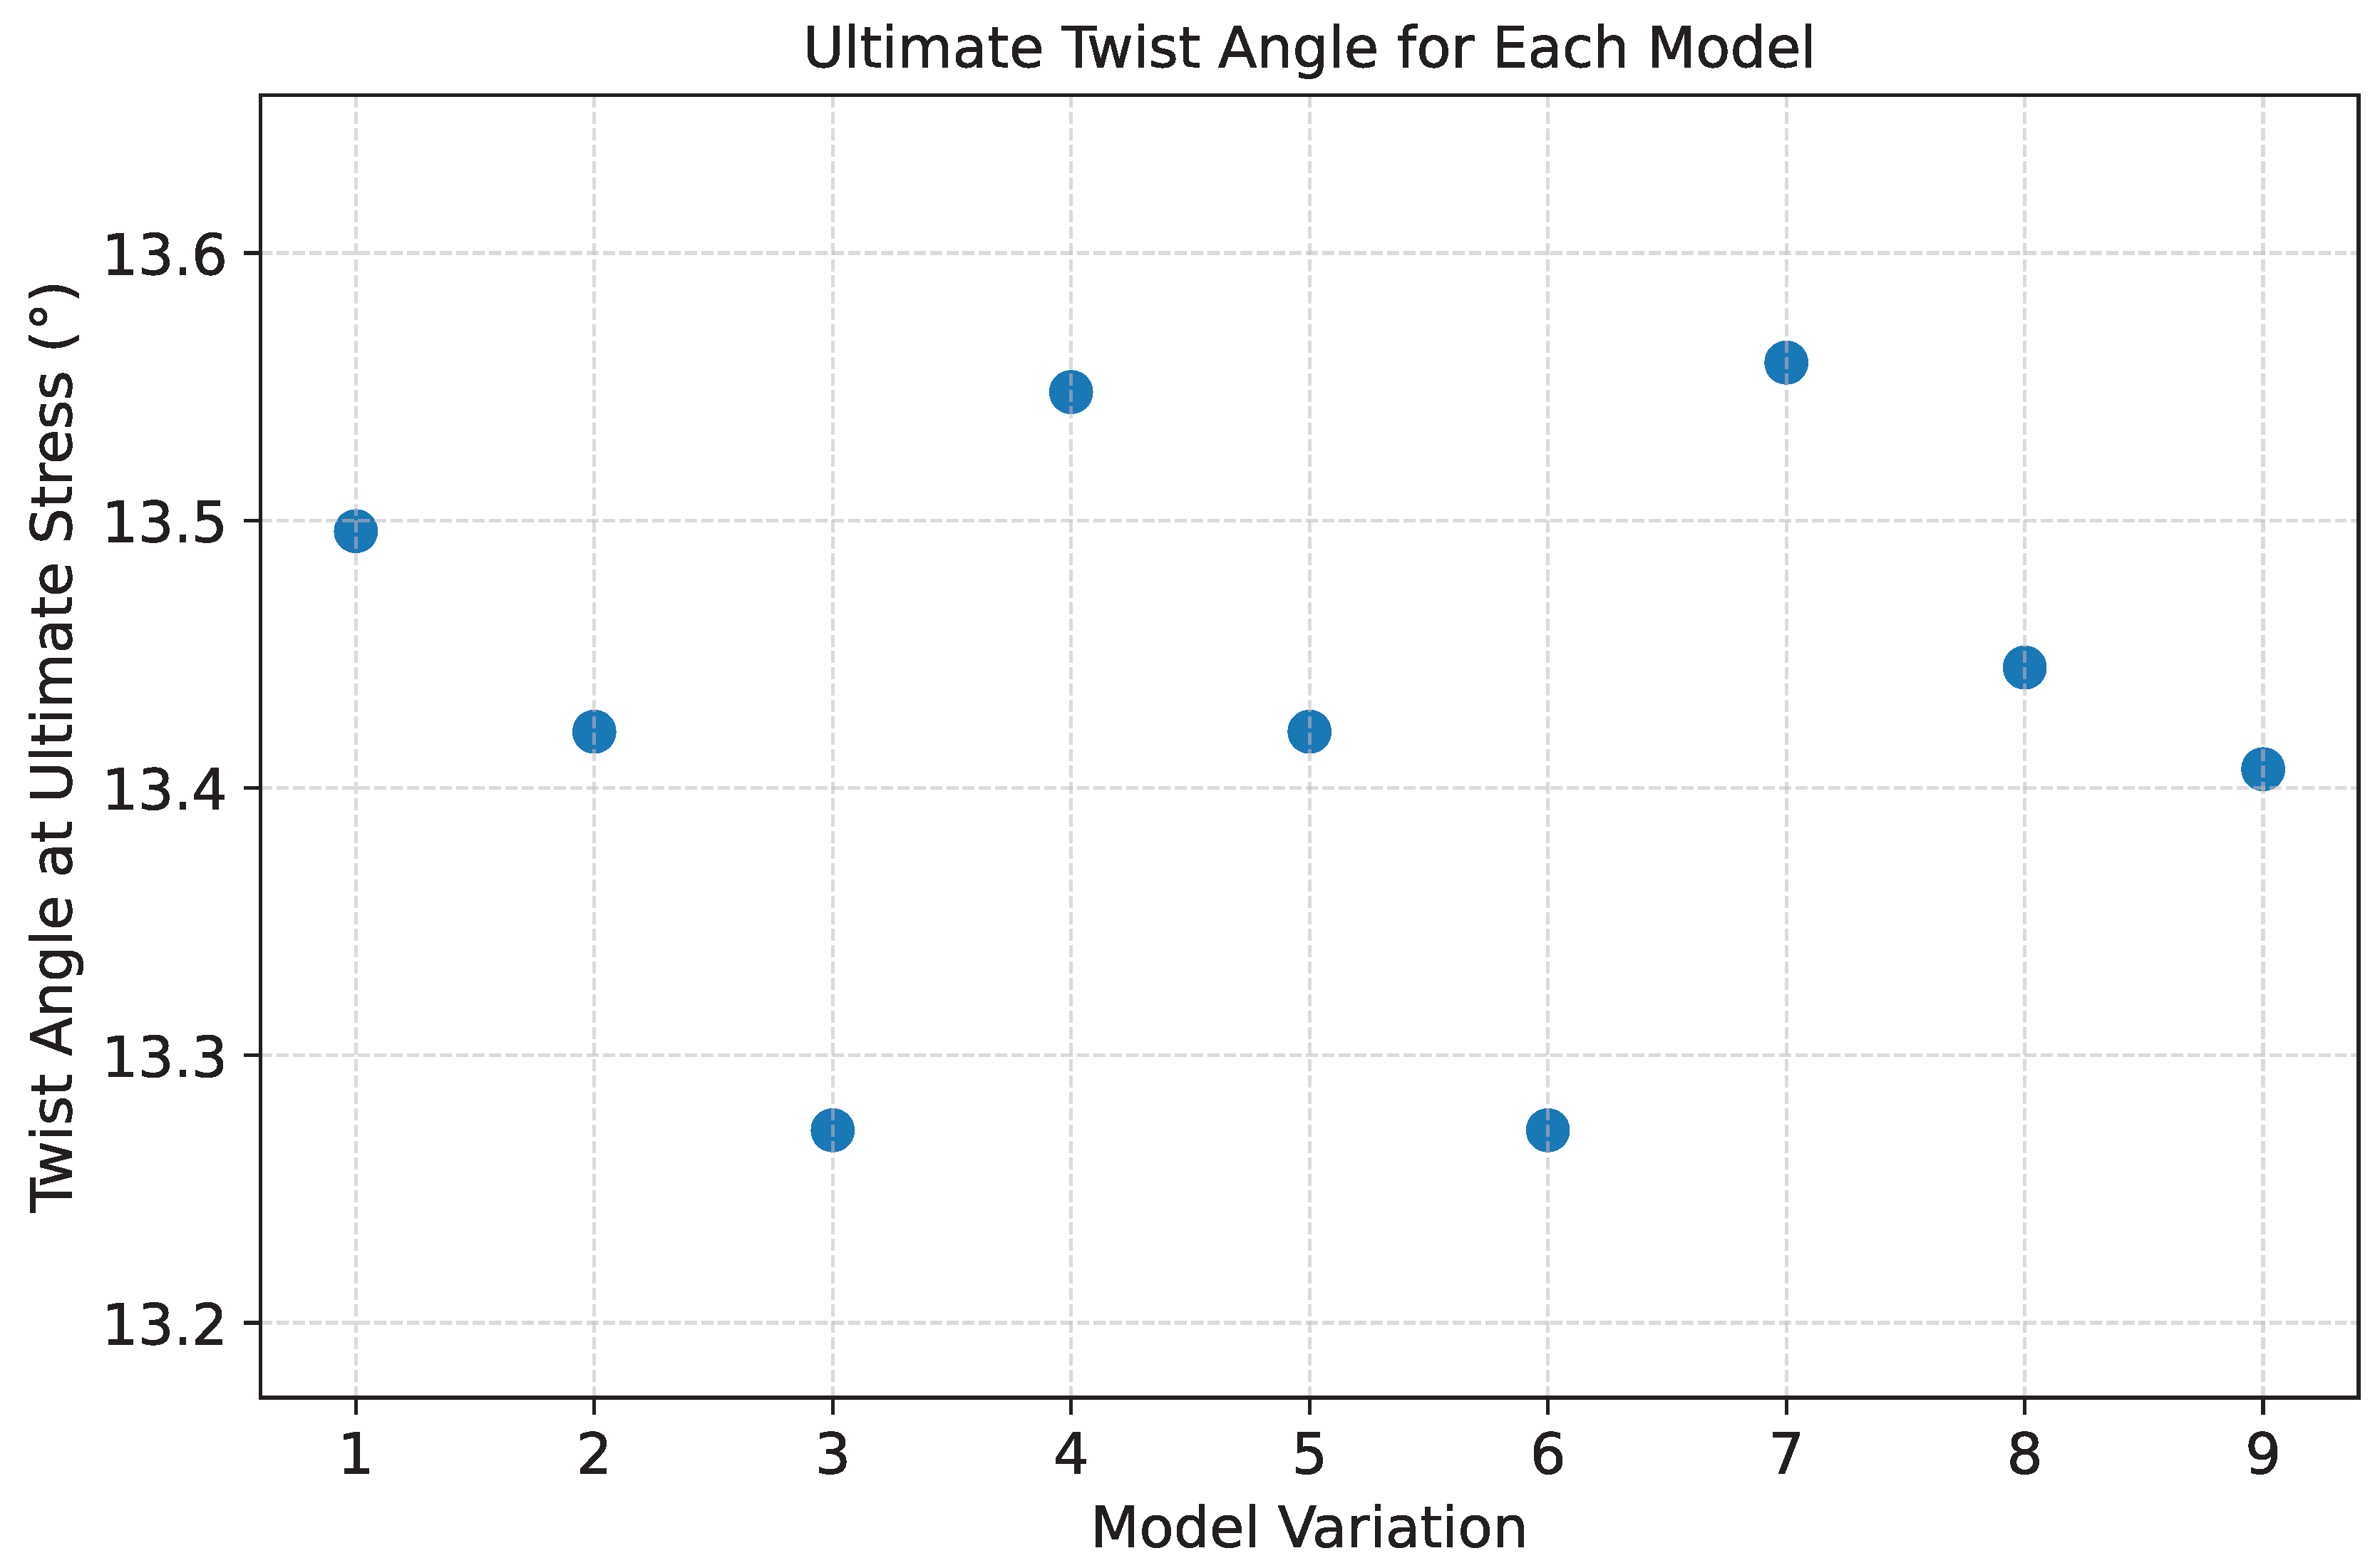
Figure 11.
Stress field response of the stiffened panel at a torsional rotation of 0.4363 radians.
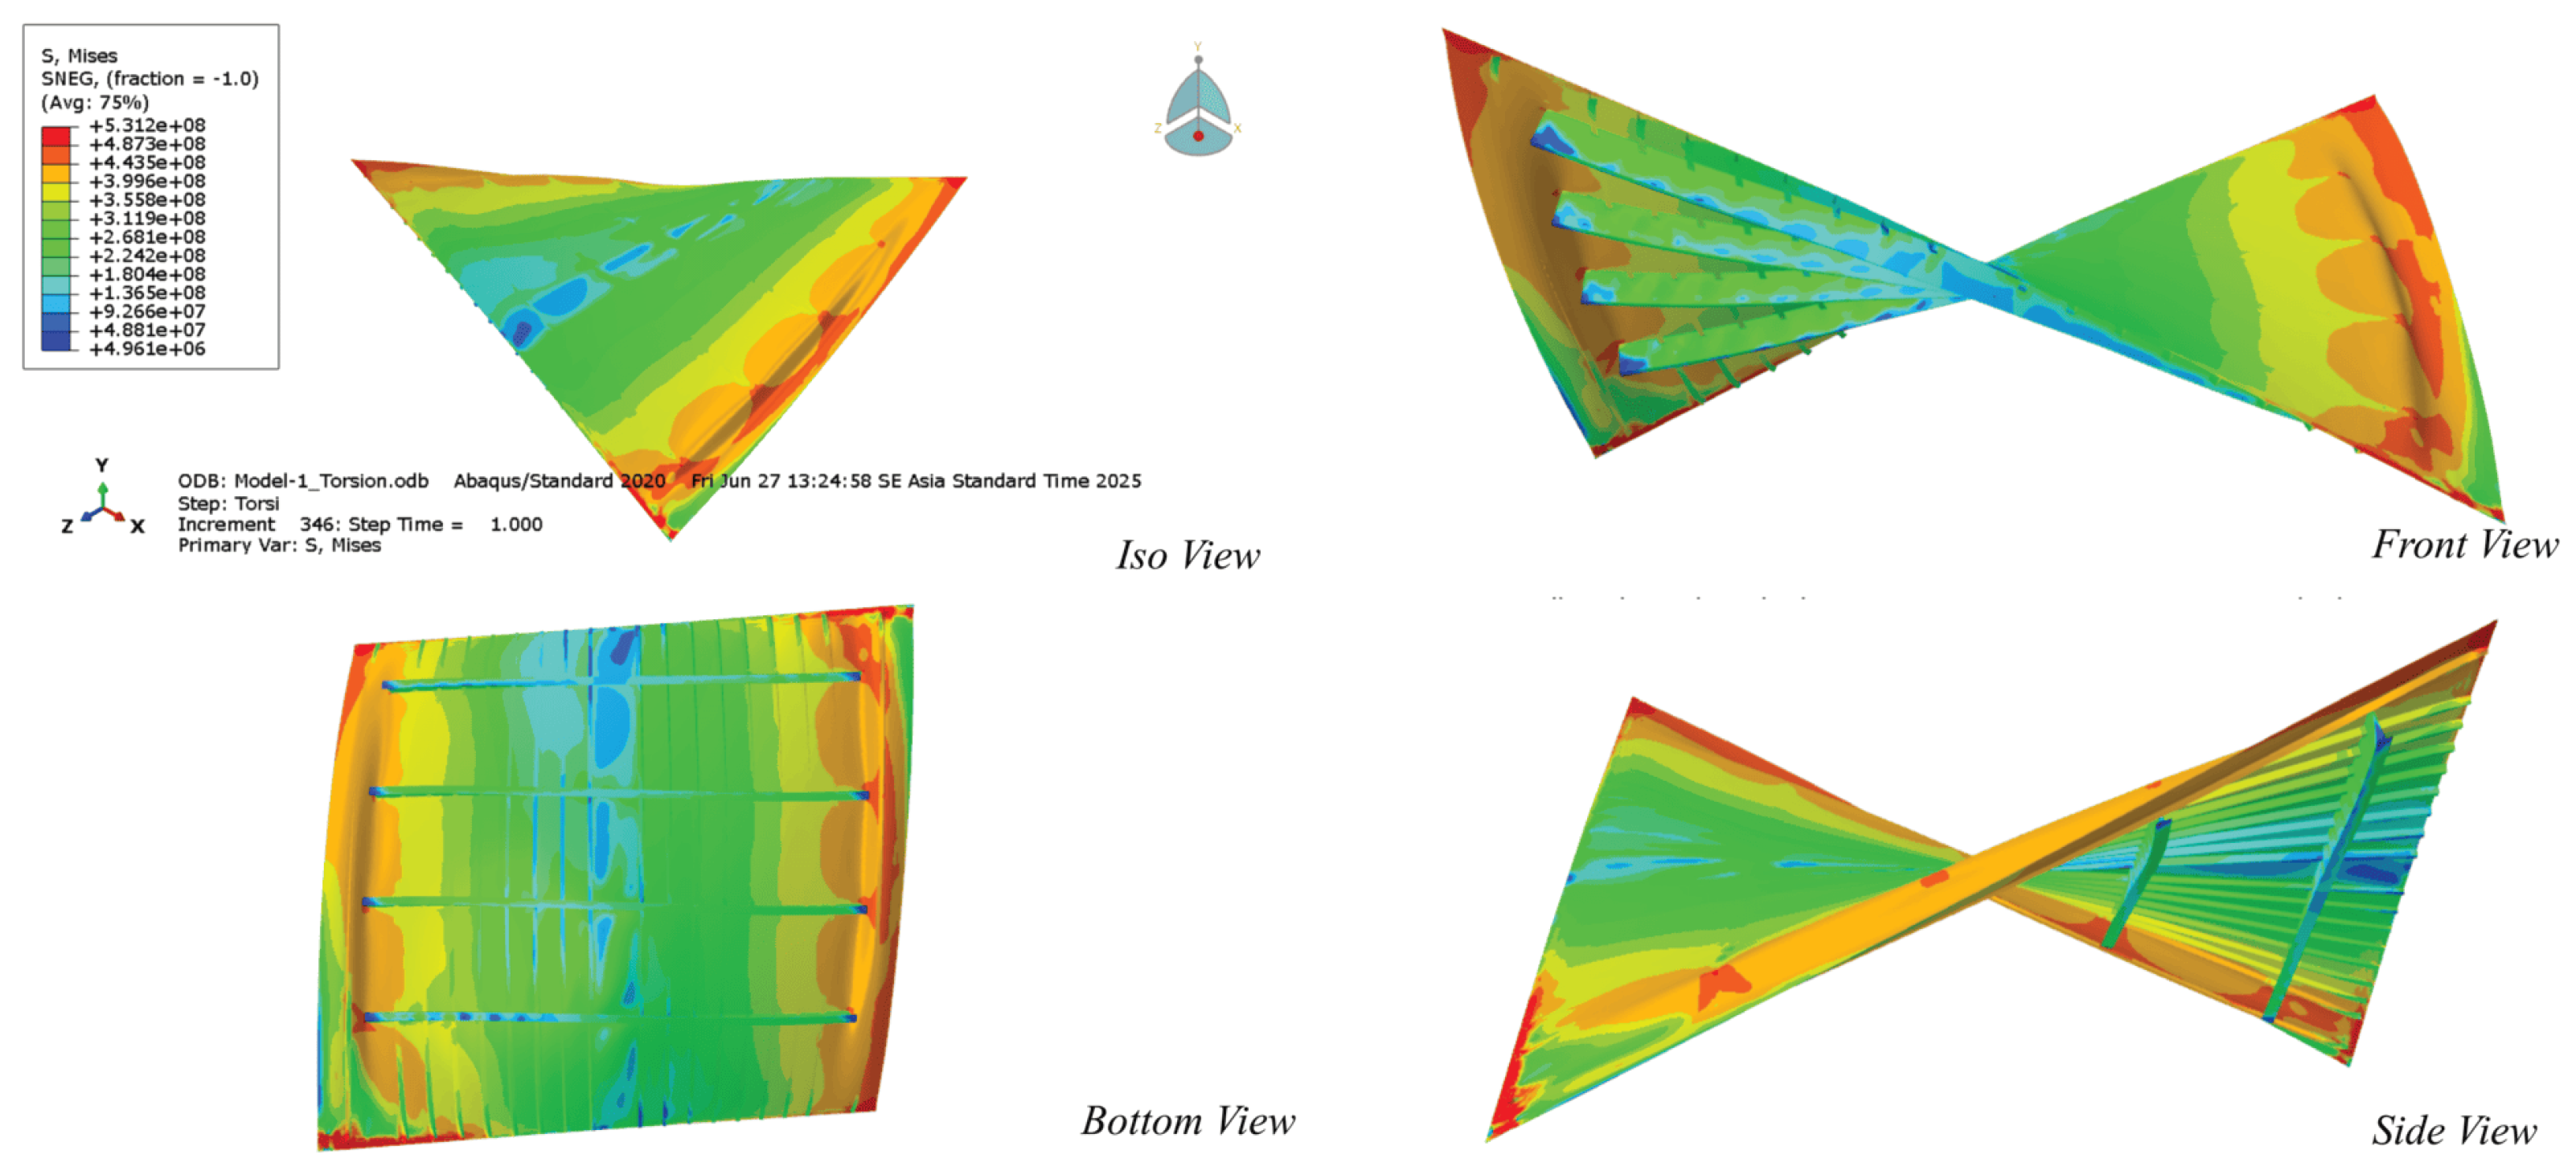
Figure 12.
Scatter plot of maximum torsional moment for all model variations.
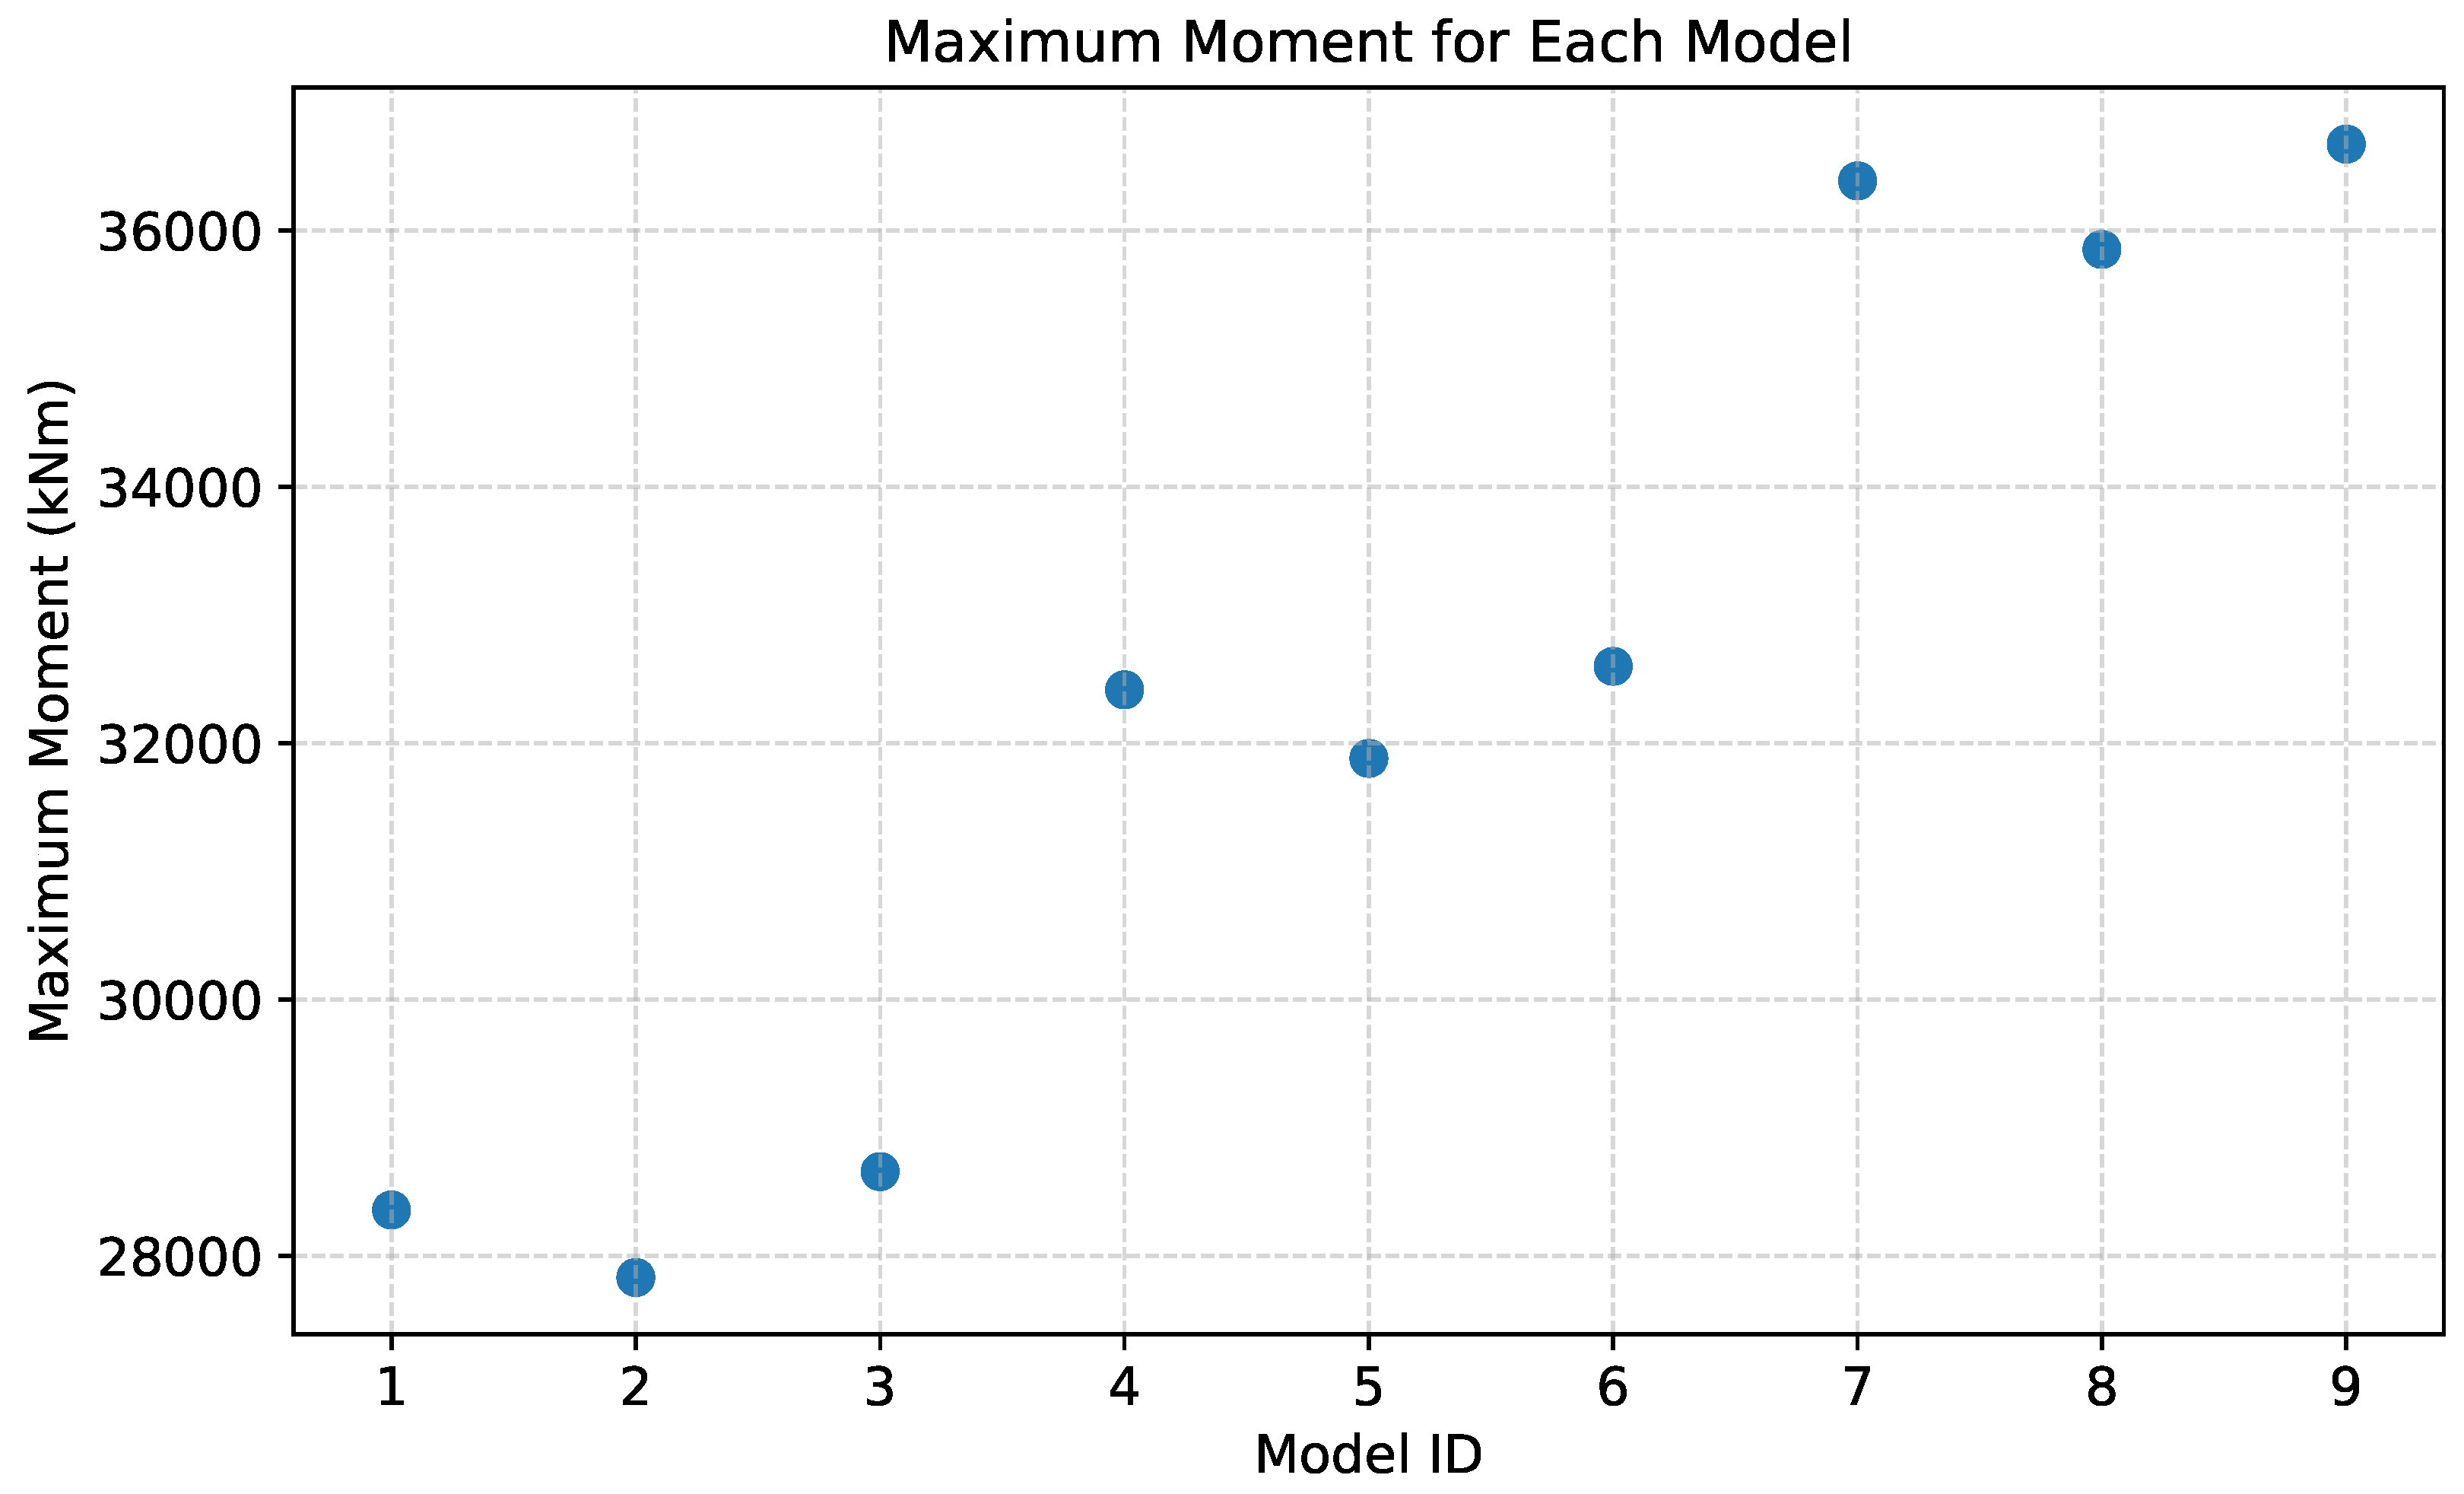
Figure 13.
Stress contours at a twist angle of 0.4363 rad, representing the structural state near the maximum torsional moment.
Figure 13.
Stress contours at a twist angle of 0.4363 rad, representing the structural state near the maximum torsional moment.
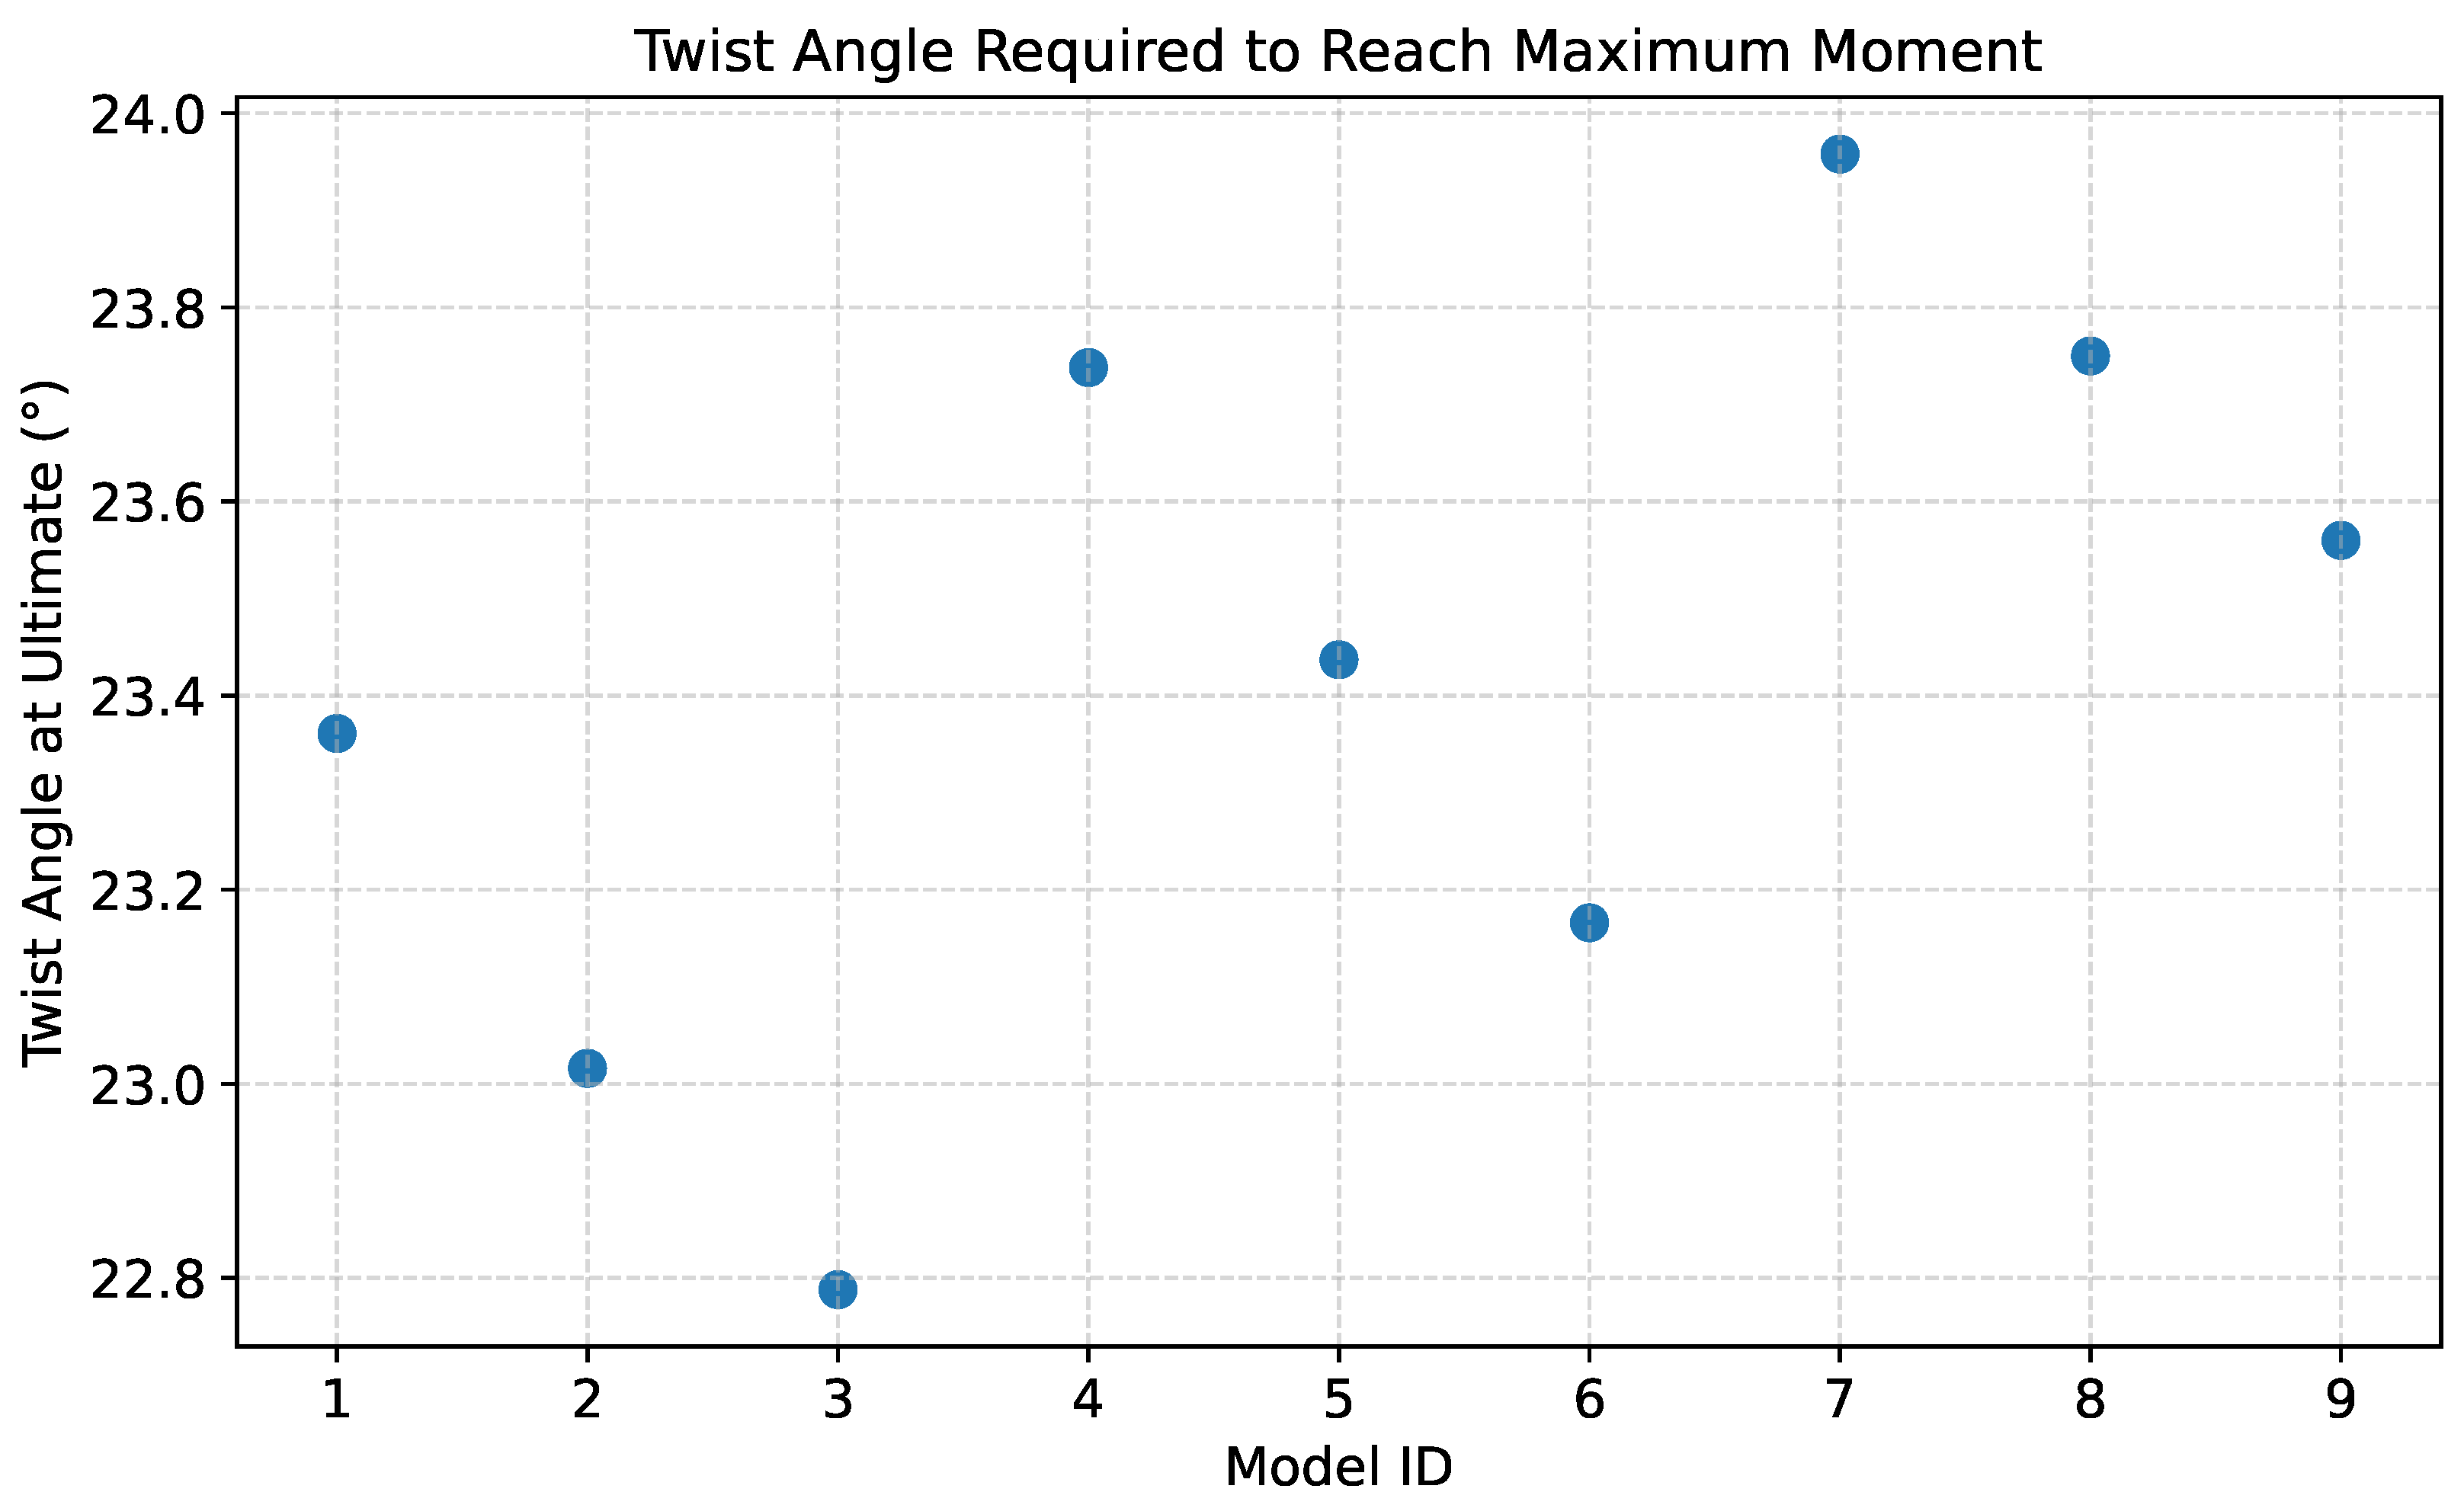
Figure 14.
Computed values derived from the maximum shear stress equation.
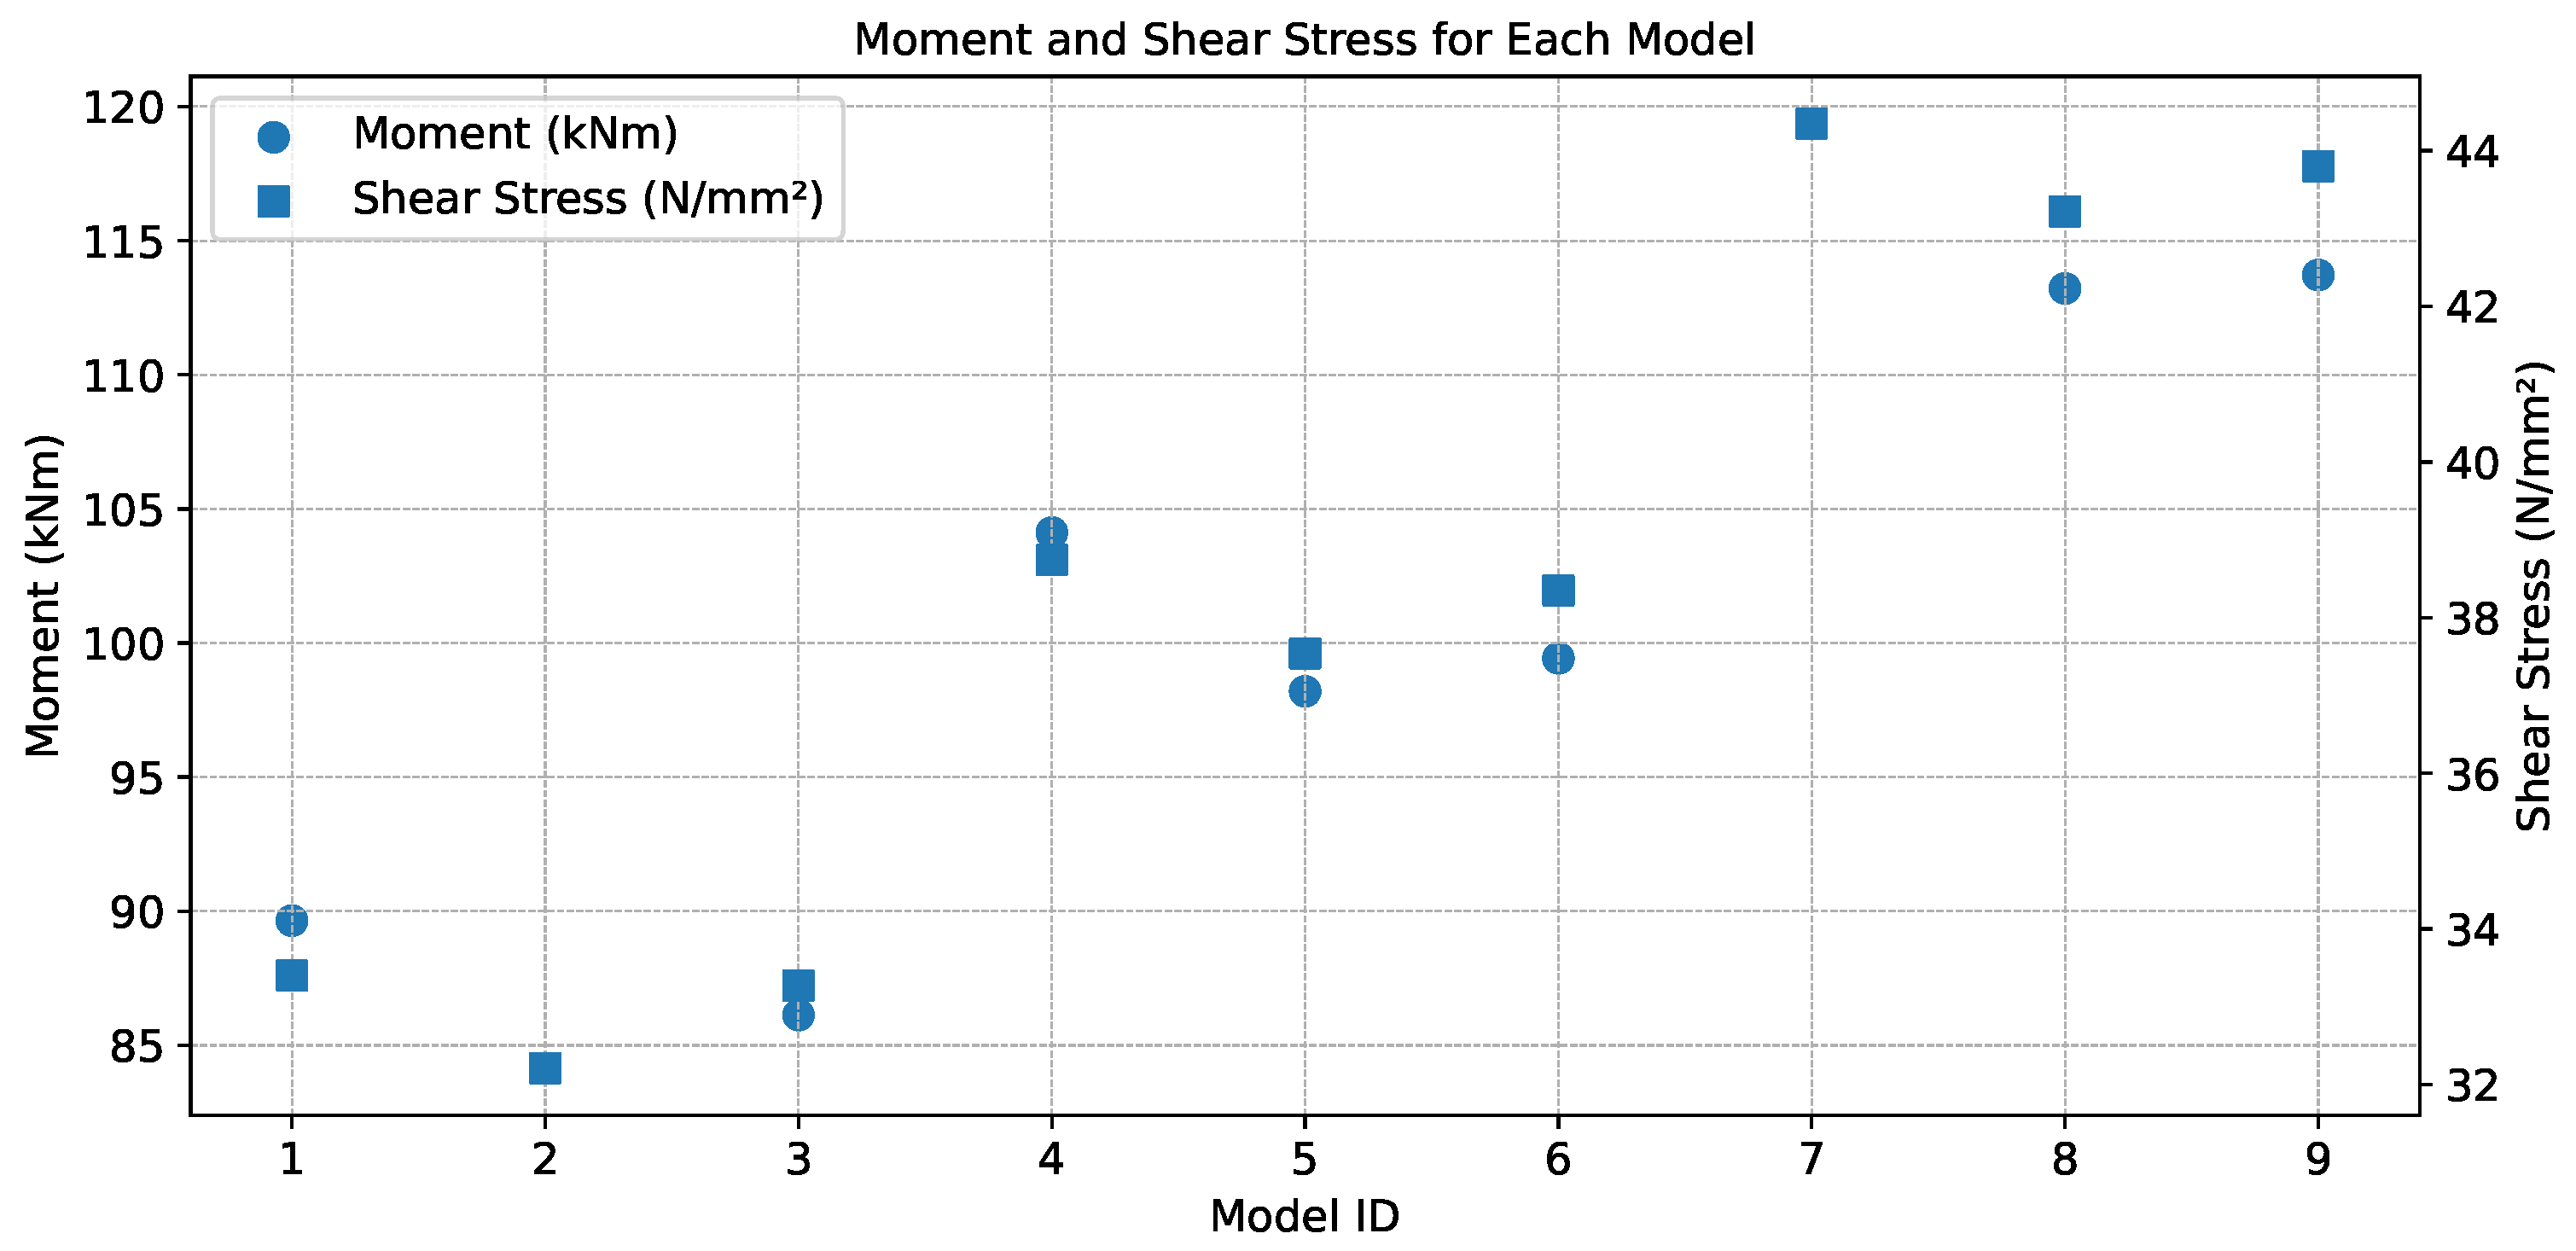
Figure 15.
Computed values derived from the maximum shear stress equation with moment 100 kNm.
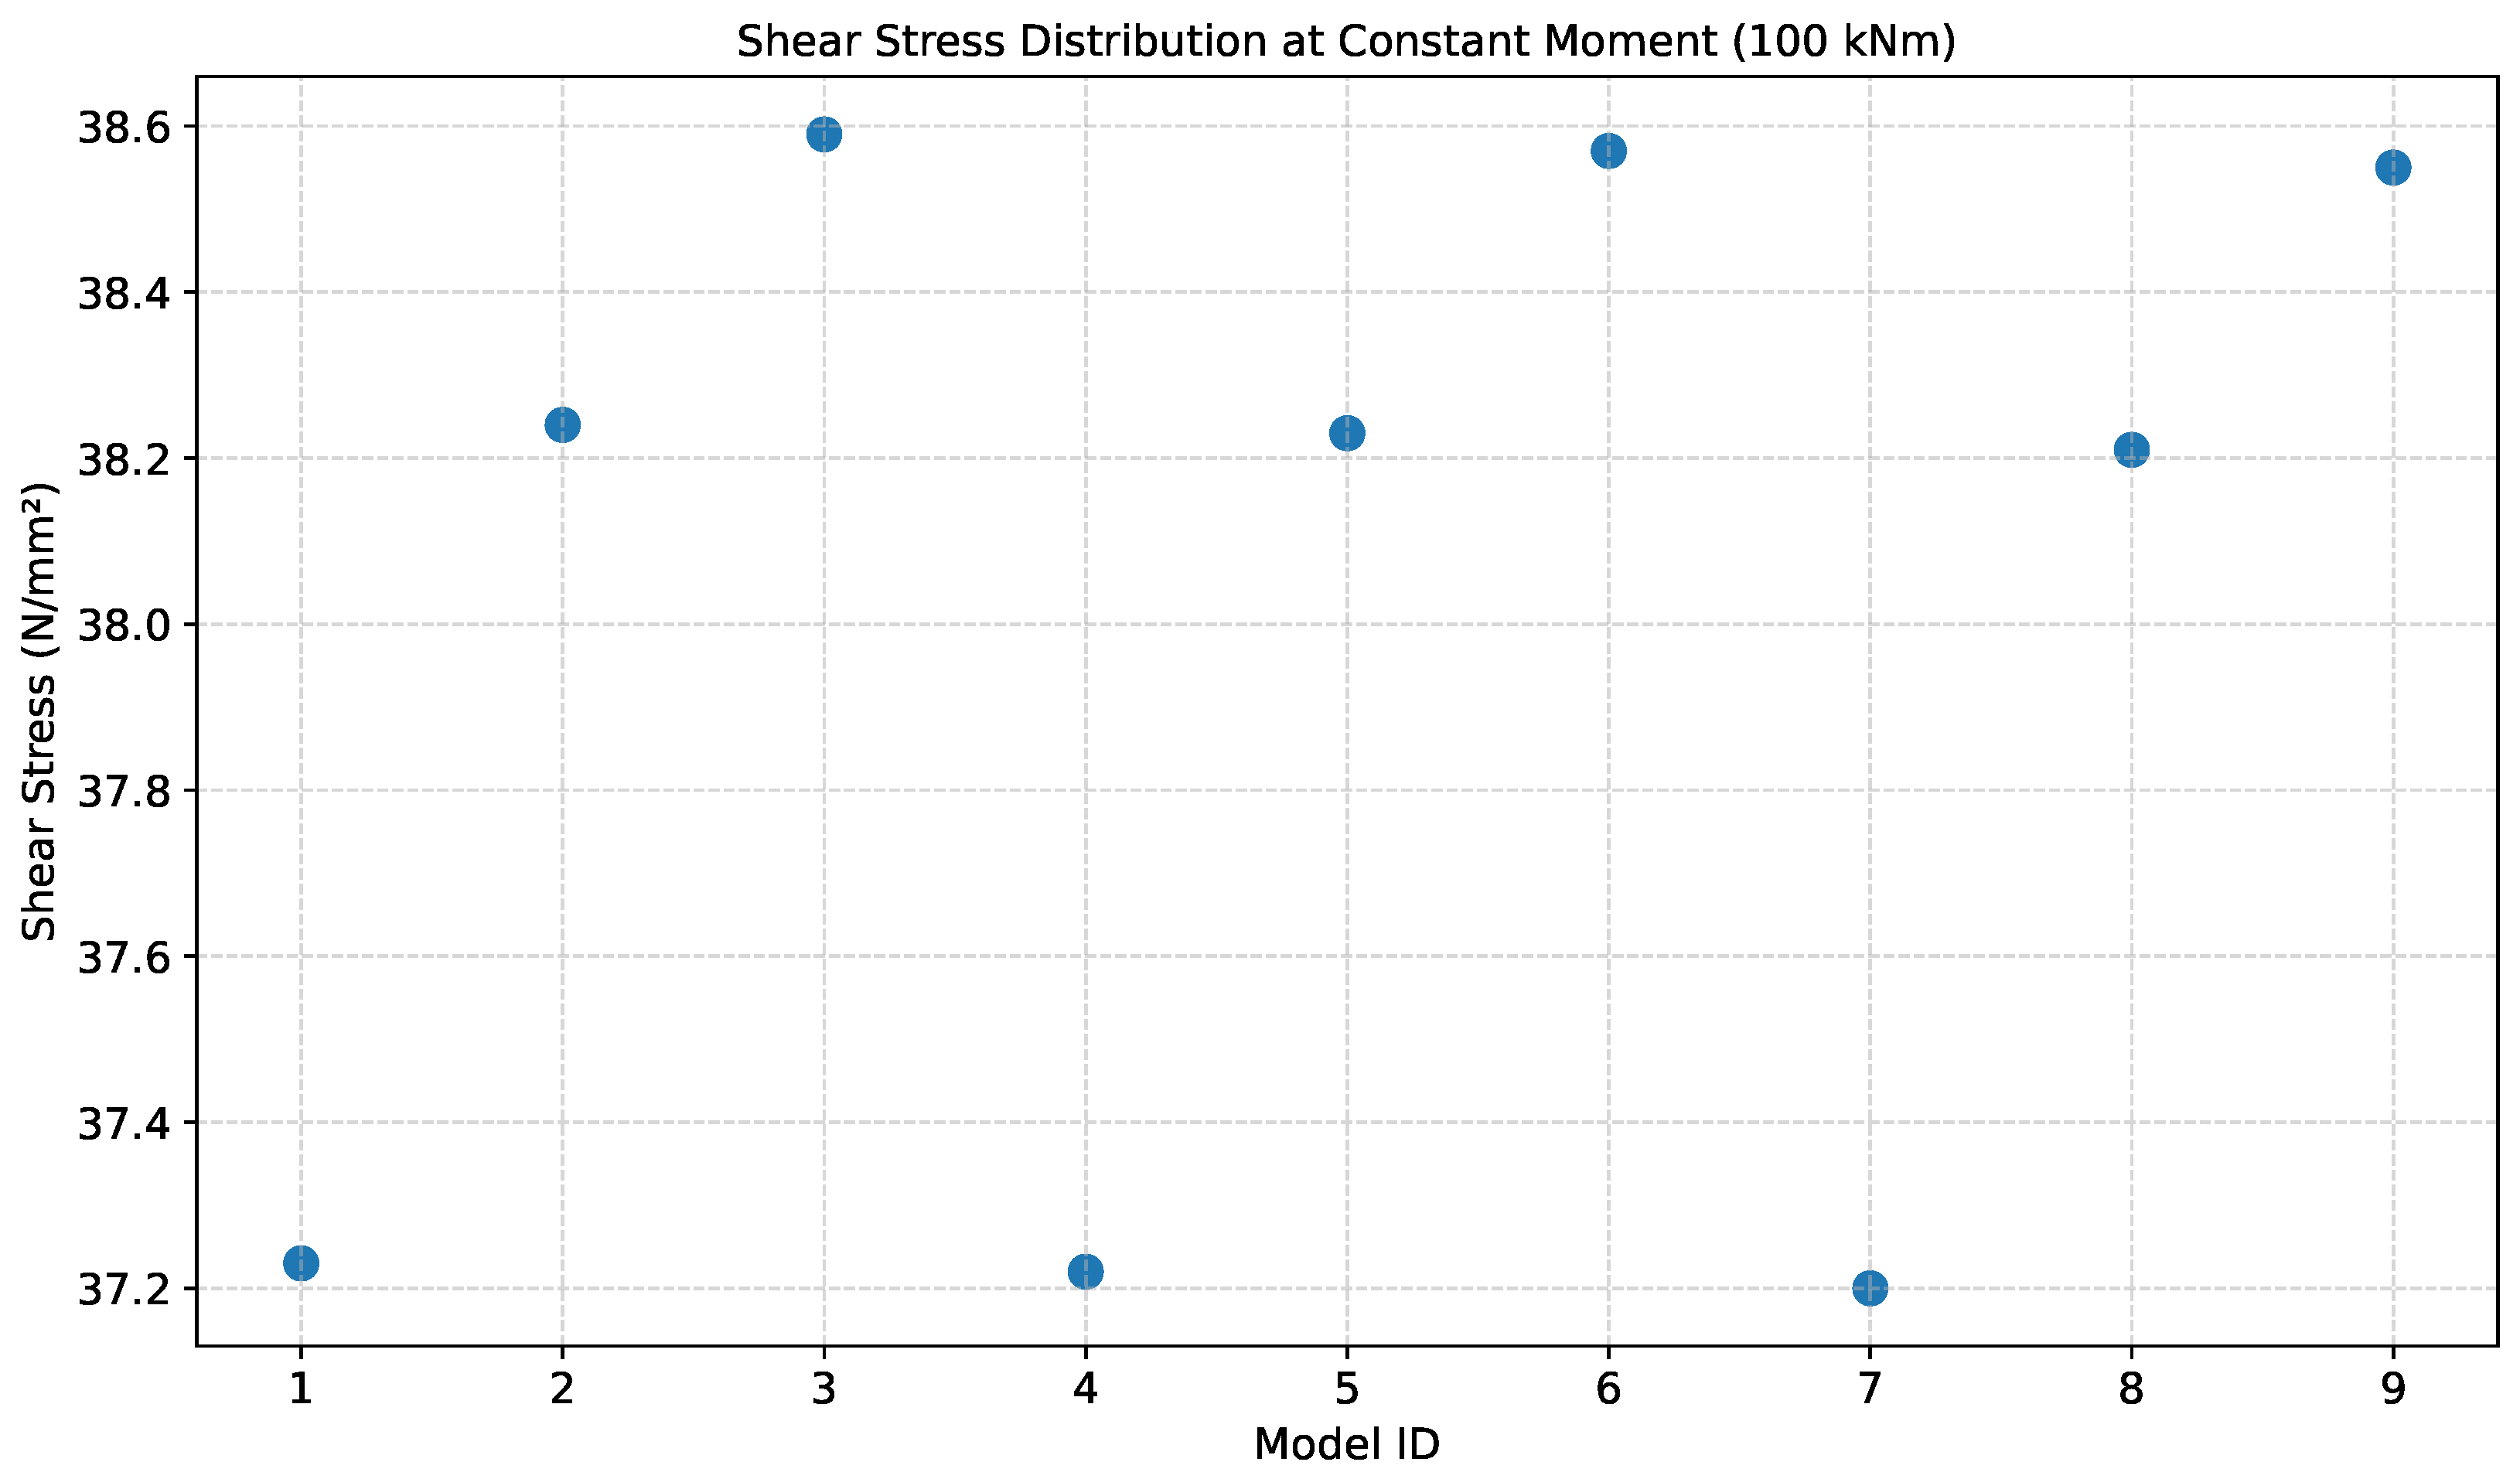
Figure 16.
Shear stress response corresponding to a twist angle of 0.1203 radians.
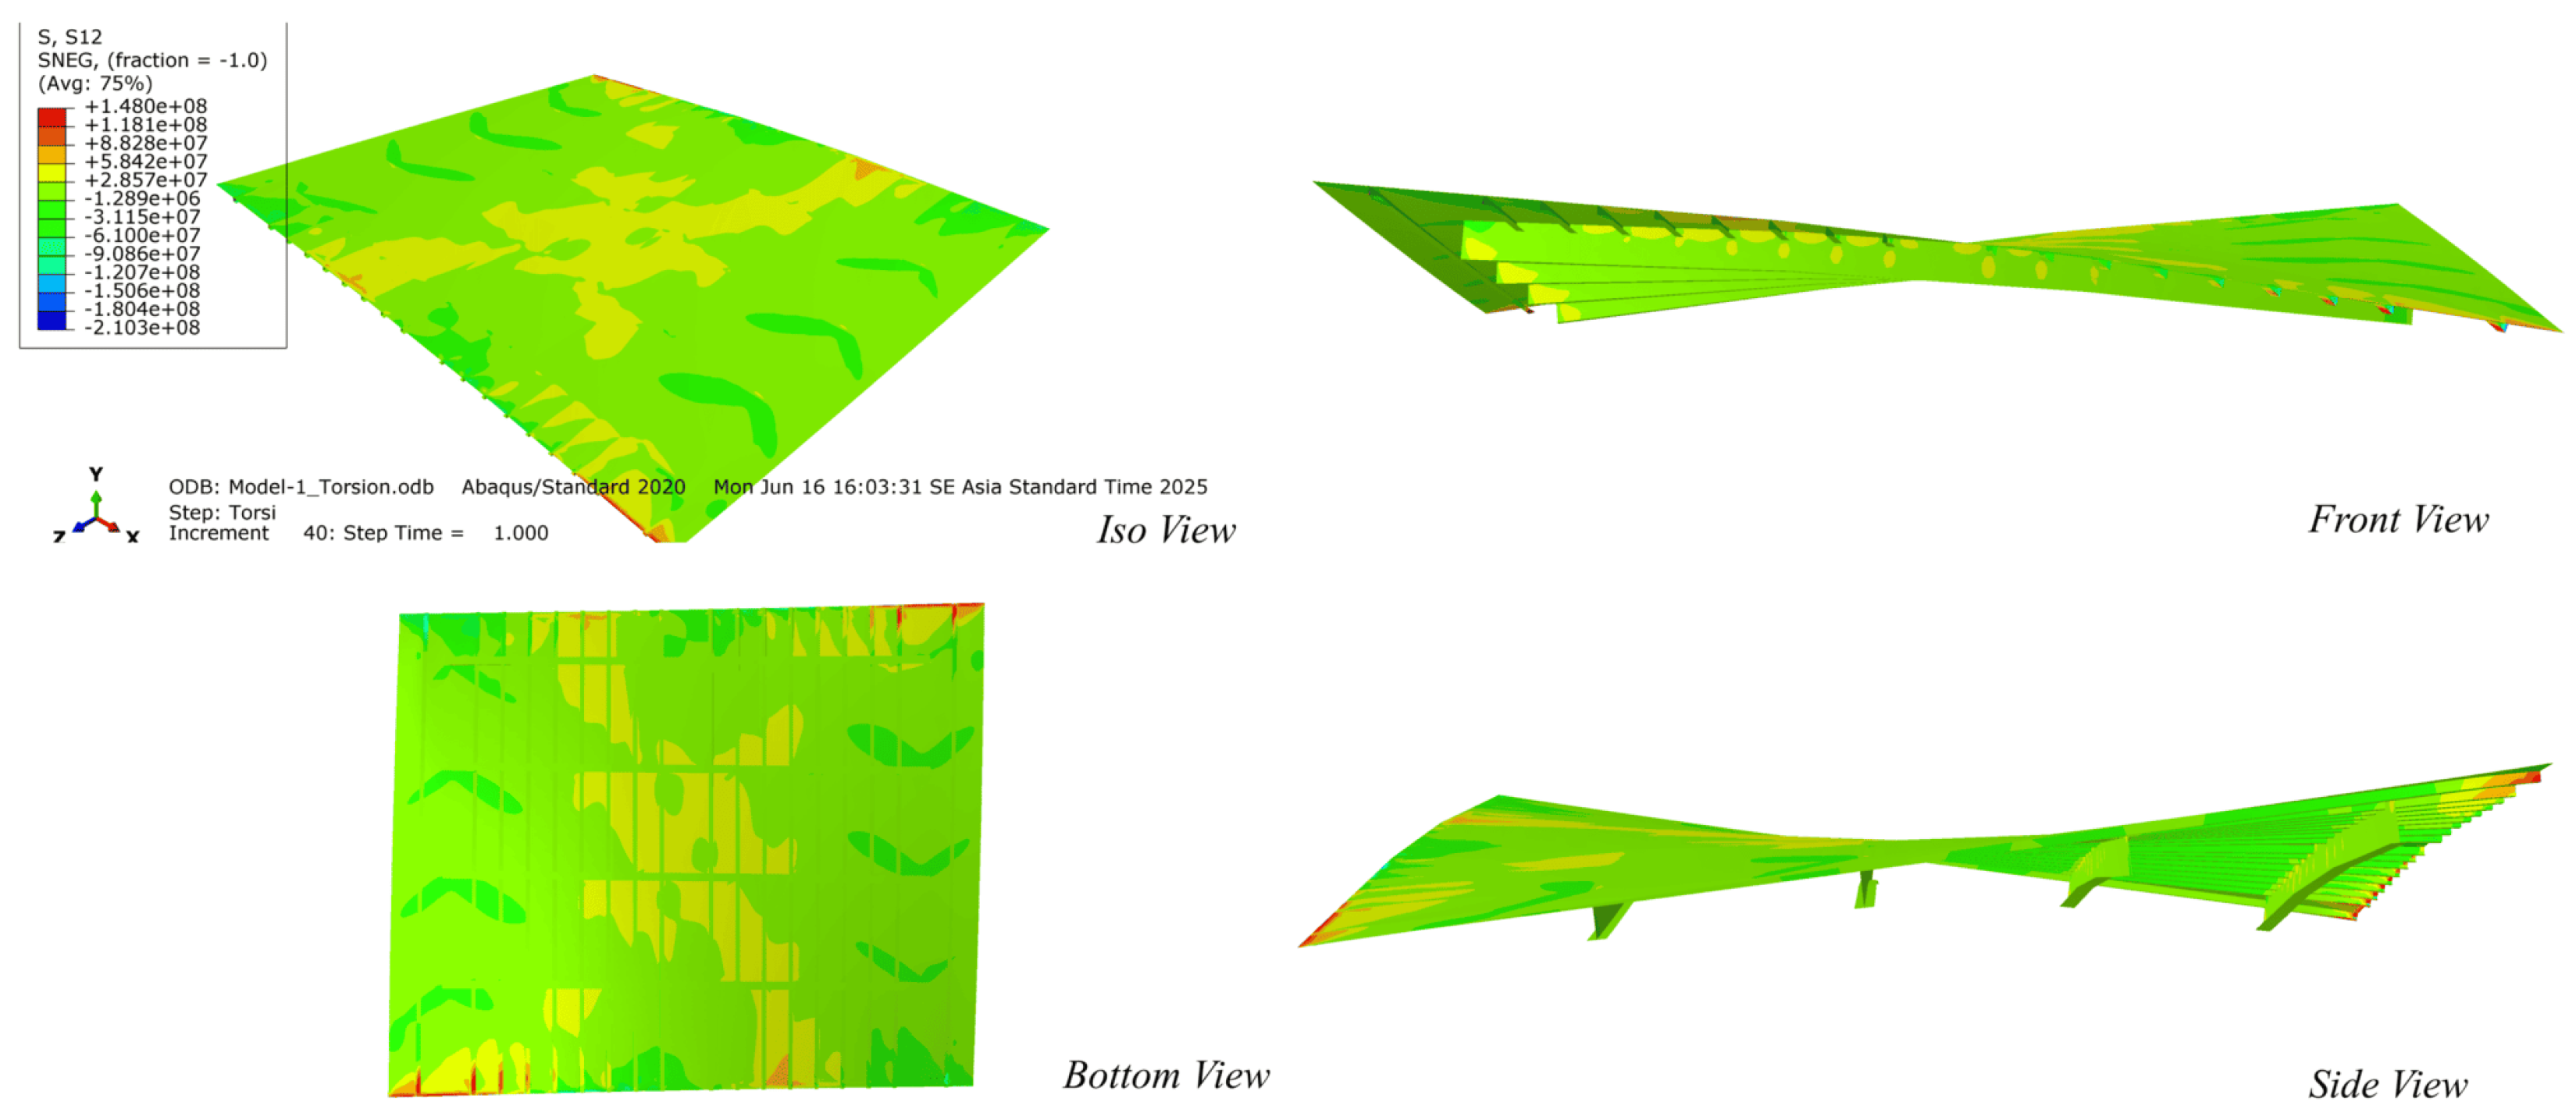
Figure 17.
Shear Stress Distribution Analysis Results.
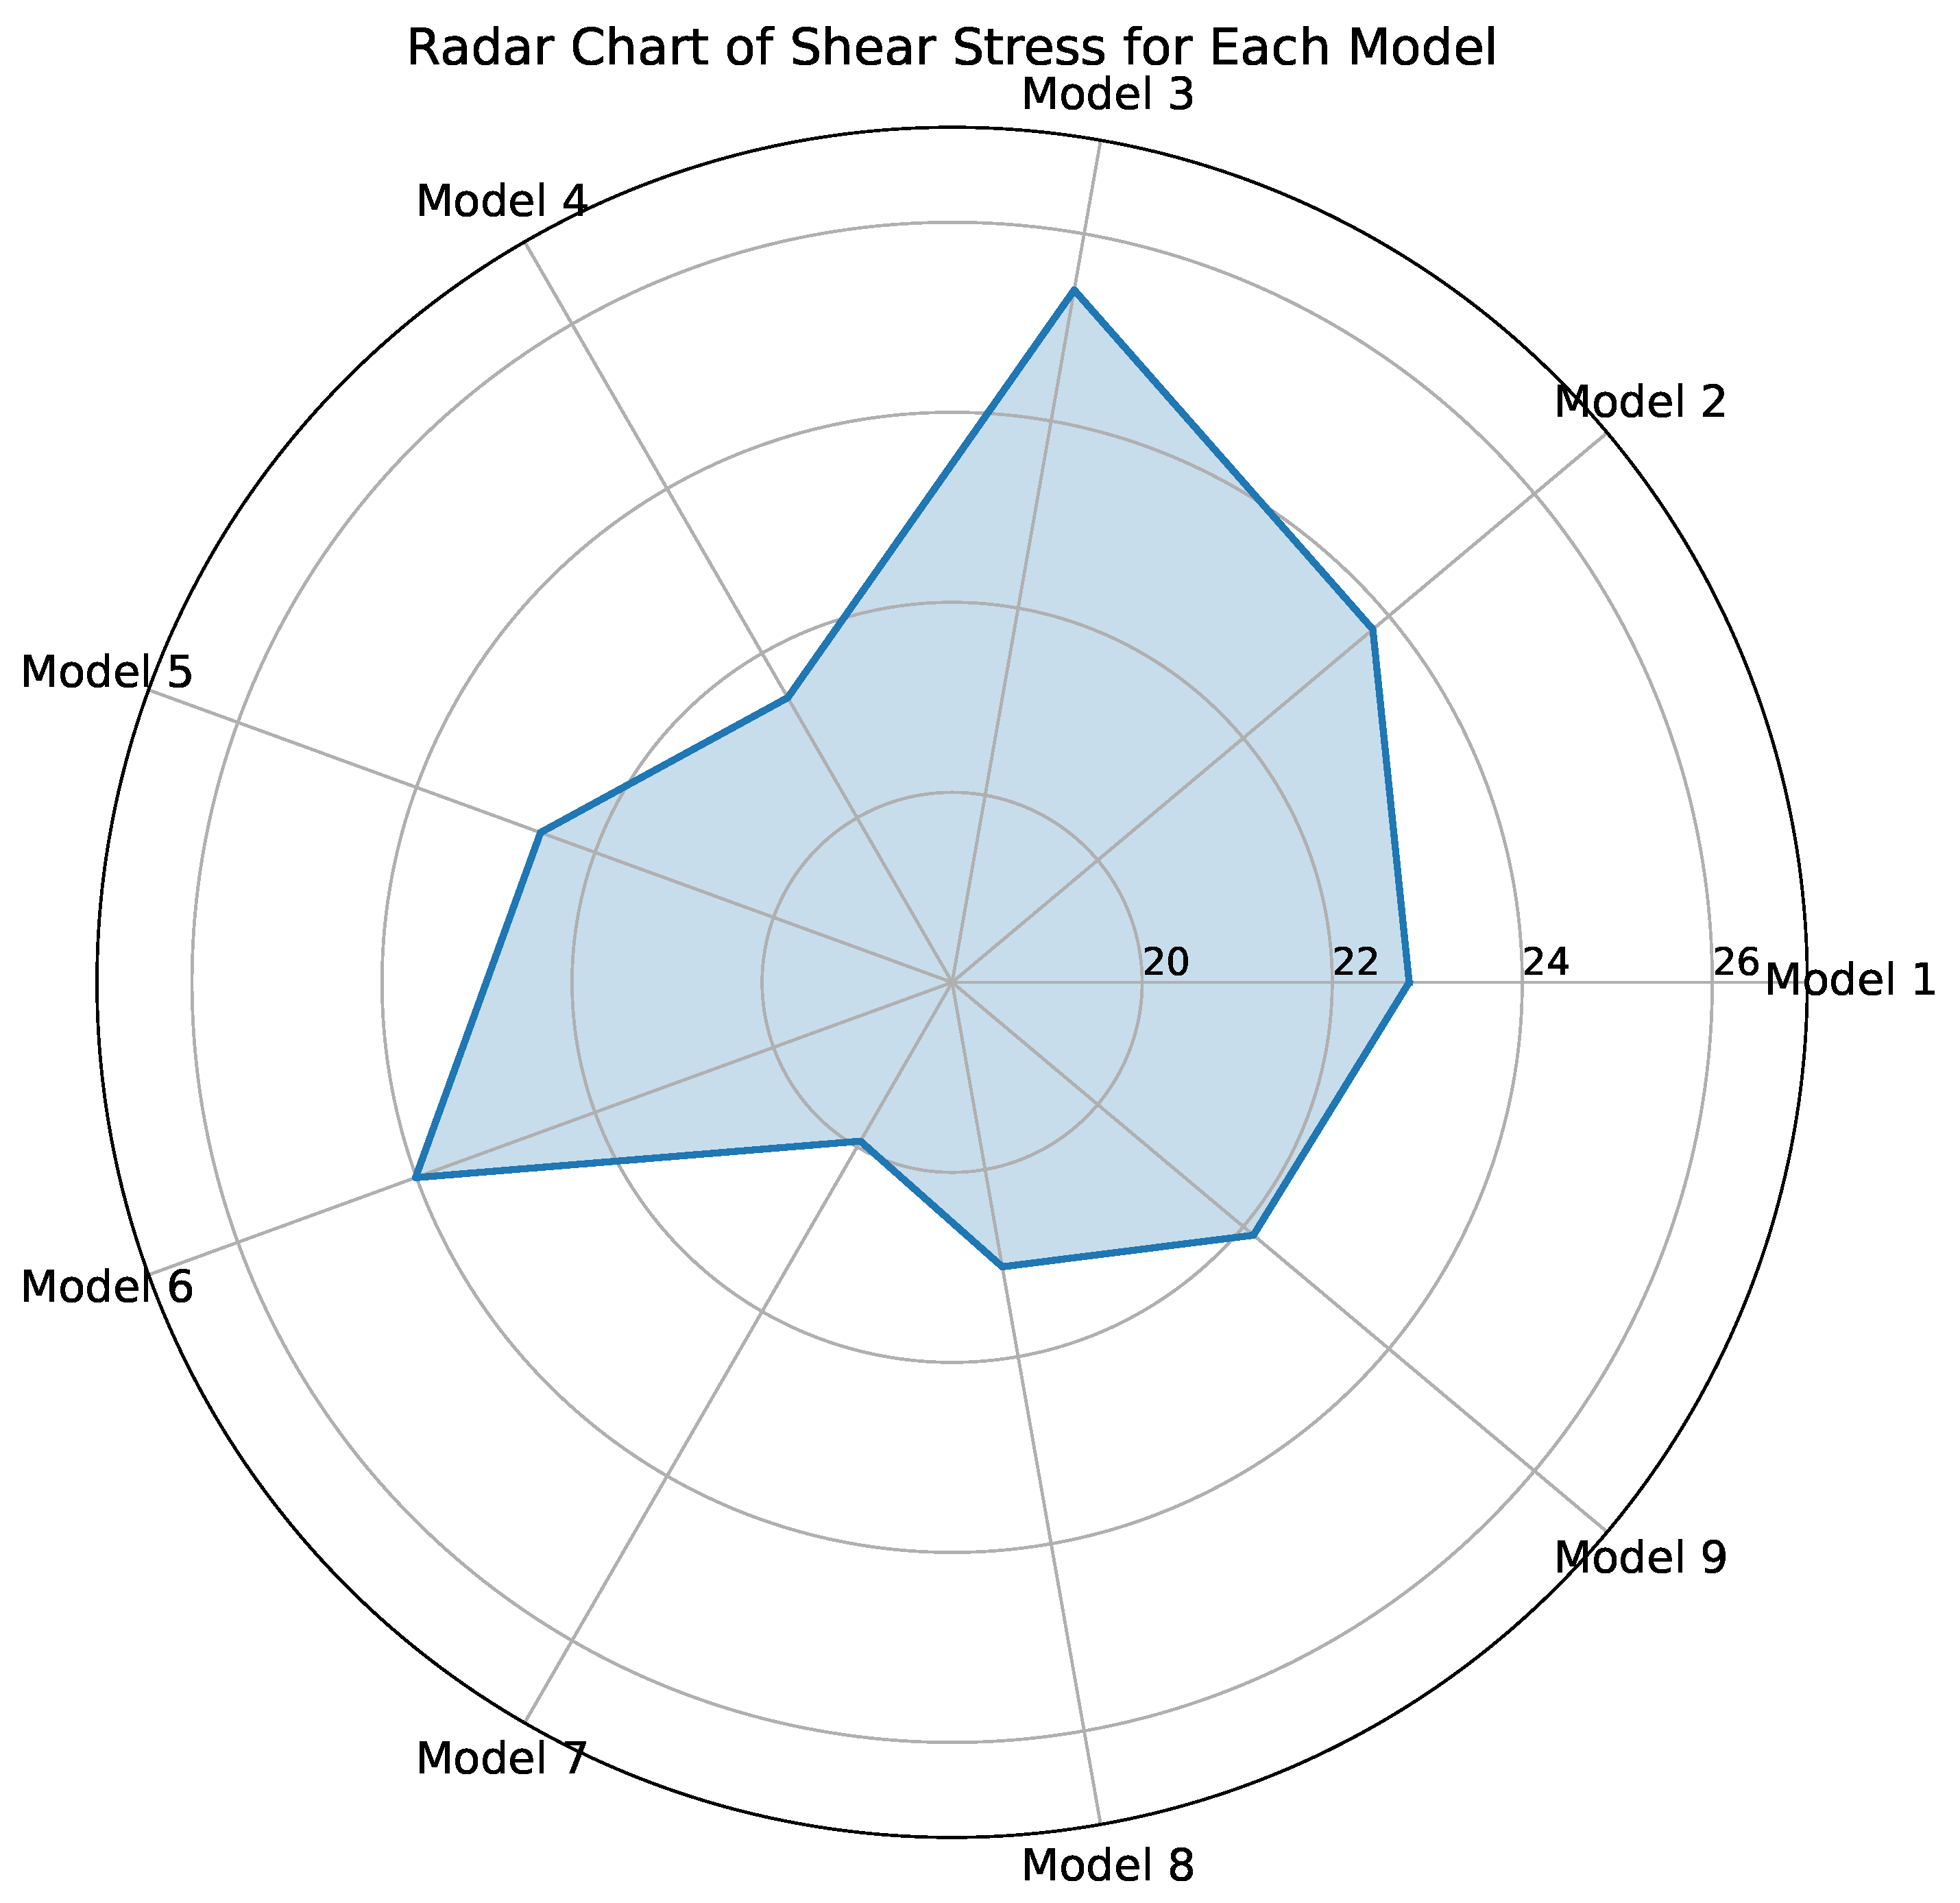
Figure 18.
Von mises stress analysis graph.
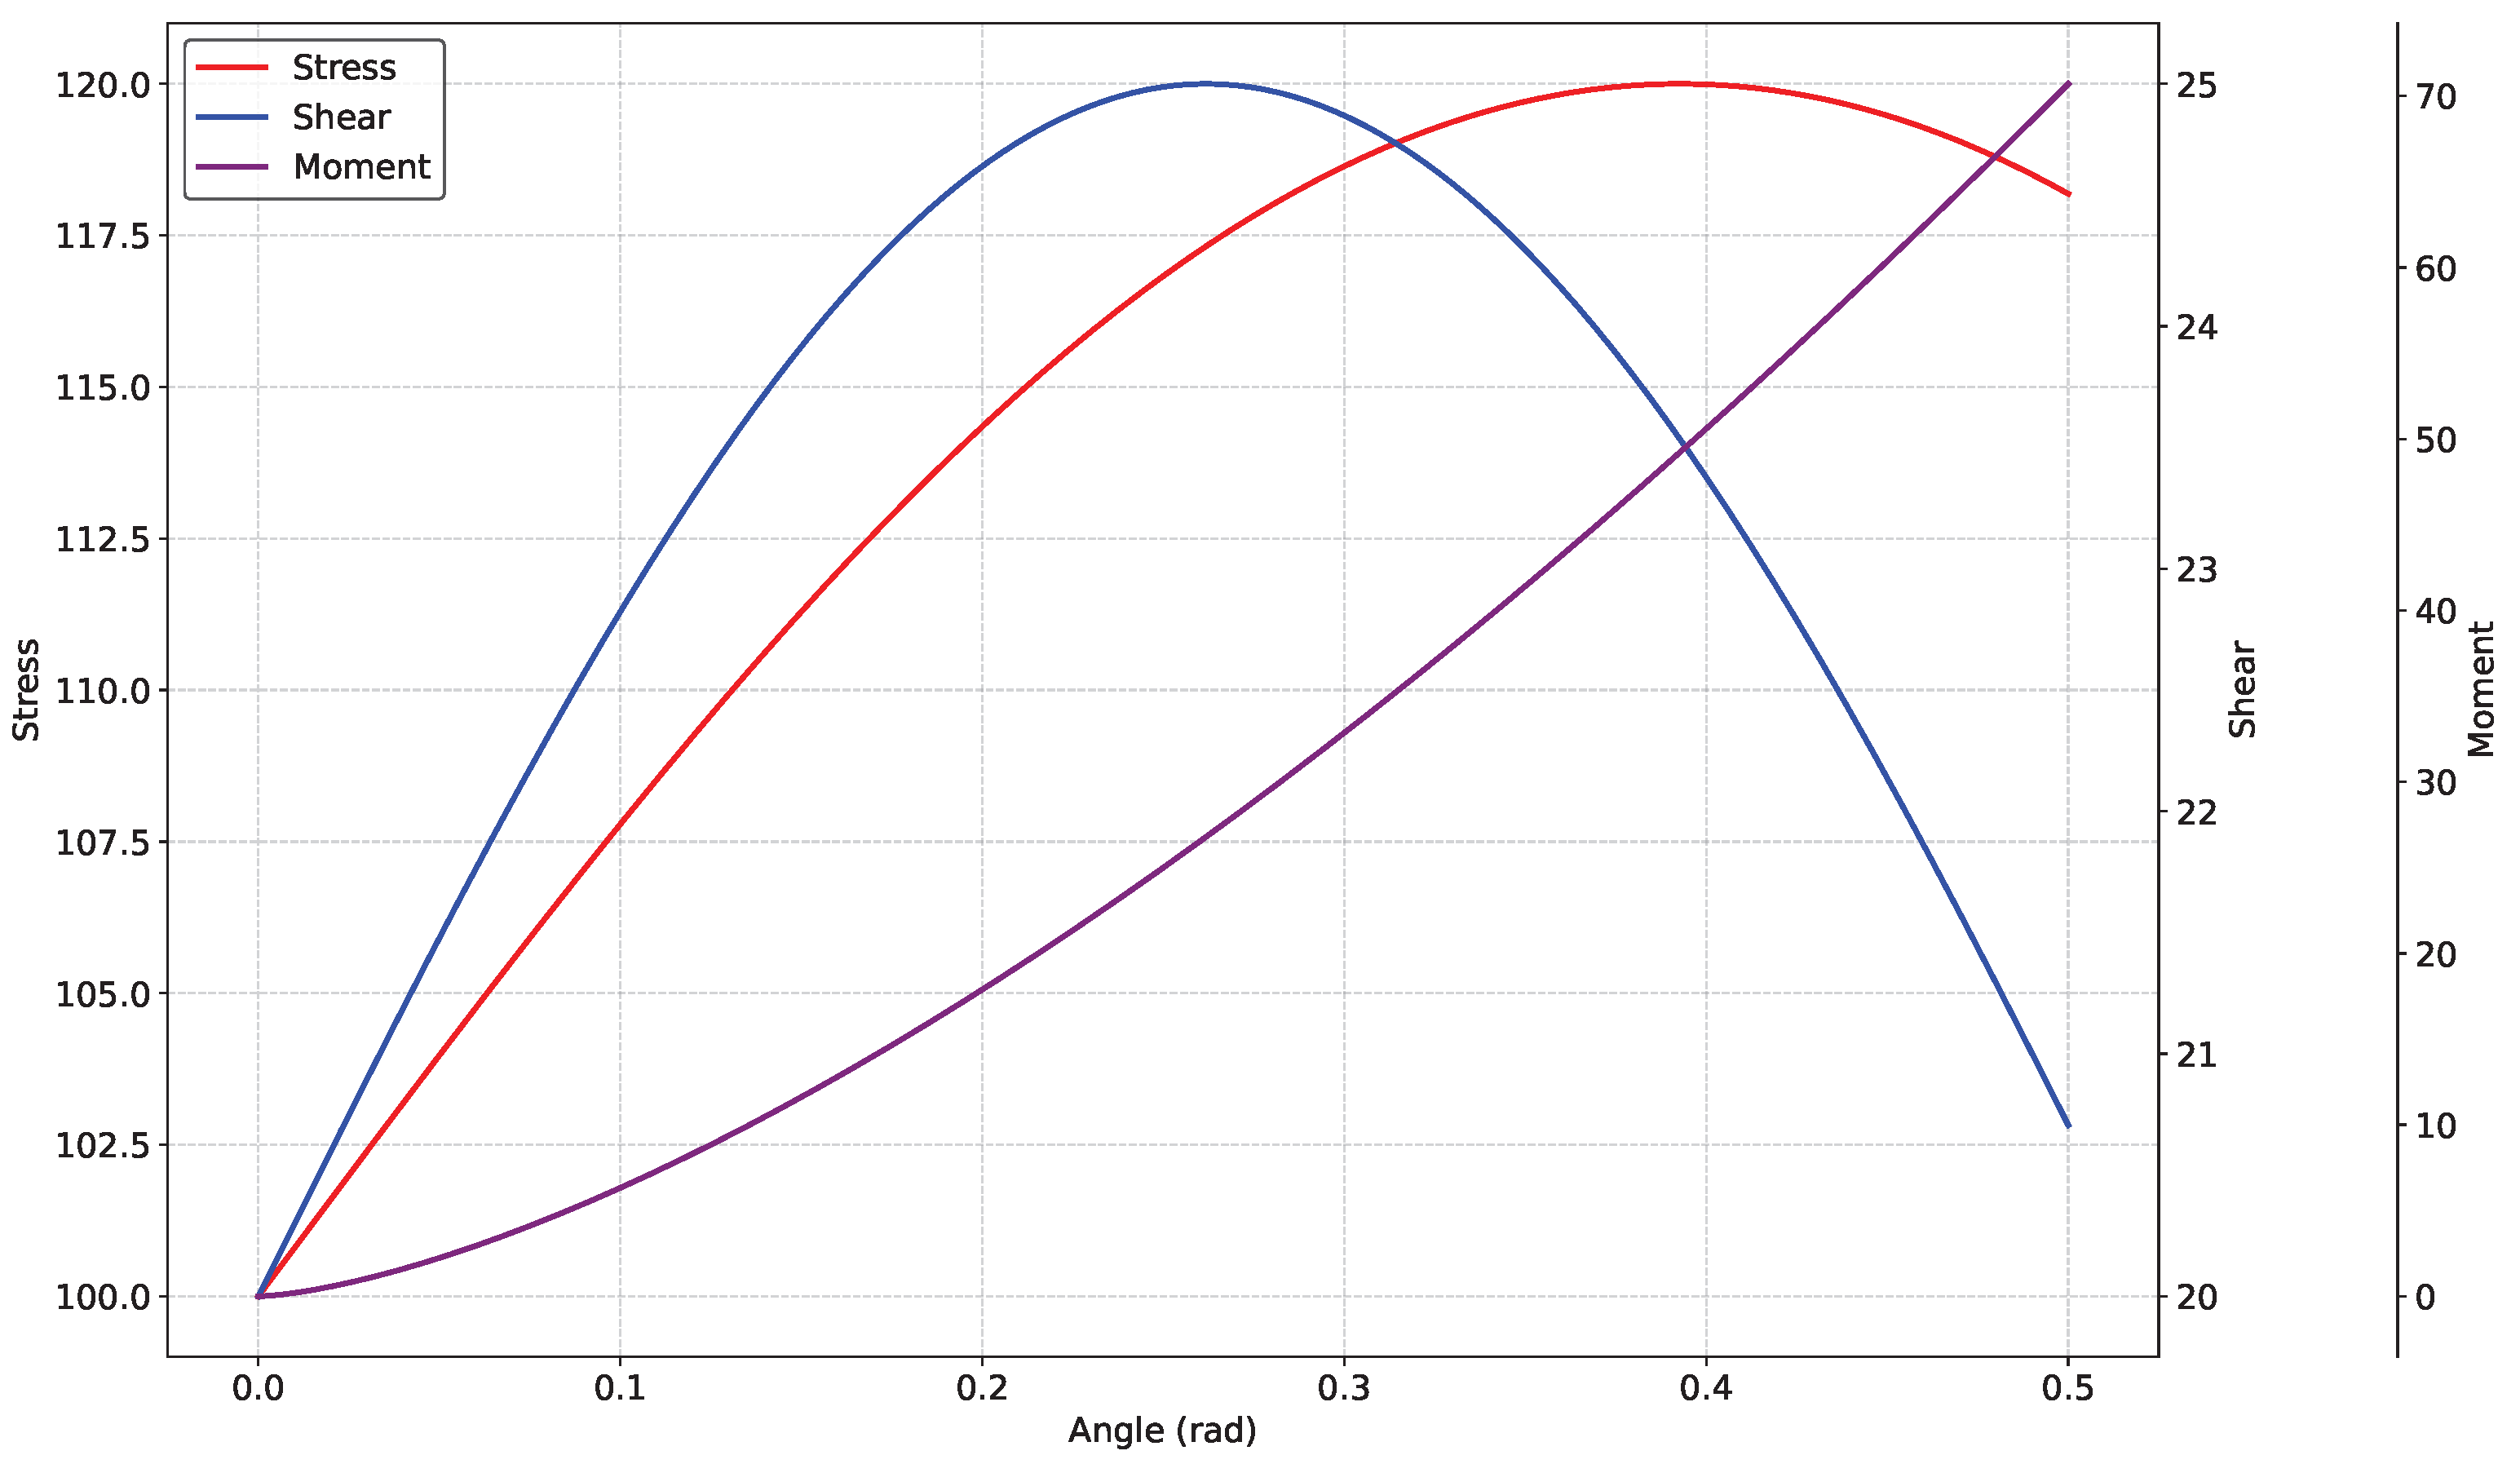
Table 1.
Functional modules and numerical workflow implemented in the GUI.
| Category | Description |
|---|---|
| 1. Functional Capabilities | |
| Geometry Input | Parametric generation of plate and stiffener configurations |
| Mesh Generator | Automated meshing and element type selection |
| Local System Assignment | Definition of coordinate systems for stiffener orientation |
| Load Application | Specification of torsional loading and boundary conditions |
| Post-Processing | Stress, displacement, and warping visualization |
| 2. Numerical Workflow | |
| User-defined Input | Geometry, stiffener layout, material properties, mesh density, loading parameters |
| Model Generation | FEM model creation with automatic element assignment and plate–stiffener coupling |
| Mesh & Solver Export | Structured input file generation for FEM execution |
| FEM Solution | Computation of displacement fields and torsional stress responses |
| Post-Processing | Identification of critical stress regions and warping deformation assessment |
Table 3.
Plate thickness and scantling of stiffened panel.
| Part Name | Size (mm) |
|---|---|
| Deck Plate | |
| Deck Longitudinal | |
| Deck Transverse | |
| Deck Longitudinal Spacing | 500 |
| Deck Transverse Spacing | 2000 |
Table 4.
Material properties of AH36 steel used in the numerical model.
| Property | Value |
|---|---|
| Linear Elastic Properties | |
| Young’s Modulus, E (GPa) | 210 |
| Poisson’s Ratio, | 0.30 |
| Density, (kg/m3) | 7850 |
| Nonlinear / Plasticity Parameters | |
| Yield Strength (MPa) | 355 |
| Ultimate Strength (MPa) | 490–620 |
| Plastic Strain at Yield | 0.002–0.003 |
| Tangent Modulus, (GPa) | 1.5 |
| Hardening Rule | Isotropic |
| Material Model (FEM) | Elastic–plastic von Mises |
Table 5.
Stress–strain data for nonlinear AH36 material modelling.
| Point | Strain (–) | Stress (MPa) |
|---|---|---|
| 1 | 0.0000 | 0 |
| 2 | 0.0017 | 355 |
| 3 | 0.0060 | 365 |
| 4 | 0.0150 | 390 |
| 5 | 0.0300 | 420 |
| 6 | 0.0500 | 450 |
| 7 | 0.0800 | 480 |
| 8 | 0.1200 | 510 |
Table 6.
Consecutive-interval errors for mesh refinement (von Mises stress).
| Interval | (Pa) | (Pa) | Absolute diff. (Pa) | Percent diff. (%) |
|---|---|---|---|---|
| 1000 → 500 | ||||
| 500 → 250 | ||||
| 250 → 142.5 | ||||
| 142.5 → 90 | ||||
| 90 → 58.5 | ||||
| 58.5 → 40 | ||||
| 40 → 27.5 |
Table 7.
Matrix representation of plate–stiffener combinations used in the sensitivity analysis.
| Plate Thickness (mm) | Longitudinal Stiffener Size (mm) | ||
|---|---|---|---|
| 7 mm | Model 1 | Model 2 | Model 3 |
| 8 mm | Model 4 | Model 5 | Model 6 |
| 9 mm | Model 7 | Model 8 | Model 9 |
Disclaimer/Publisher’s Note: The statements, opinions and data contained in all publications are solely those of the individual author(s) and contributor(s) and not of MDPI and/or the editor(s). MDPI and/or the editor(s) disclaim responsibility for any injury to people or property resulting from any ideas, methods, instructions or products referred to in the content. |
© 2026 by the authors. Licensee MDPI, Basel, Switzerland. This article is an open access article distributed under the terms and conditions of the Creative Commons Attribution (CC BY) license (http://creativecommons.org/licenses/by/4.0/).
Copyright: This open access article is published under a Creative Commons CC BY 4.0 license, which permit the free download, distribution, and reuse, provided that the author and preprint are cited in any reuse.


