Preprint
Article

This version is not peer-reviewed.

Transcriptomic Analysis of Soybean Defense Mechanism Against Aphid and Nematode Co-Infestation

Submitted:

04 January 2026

Posted:

06 January 2026

You are already at the latest version

Abstract

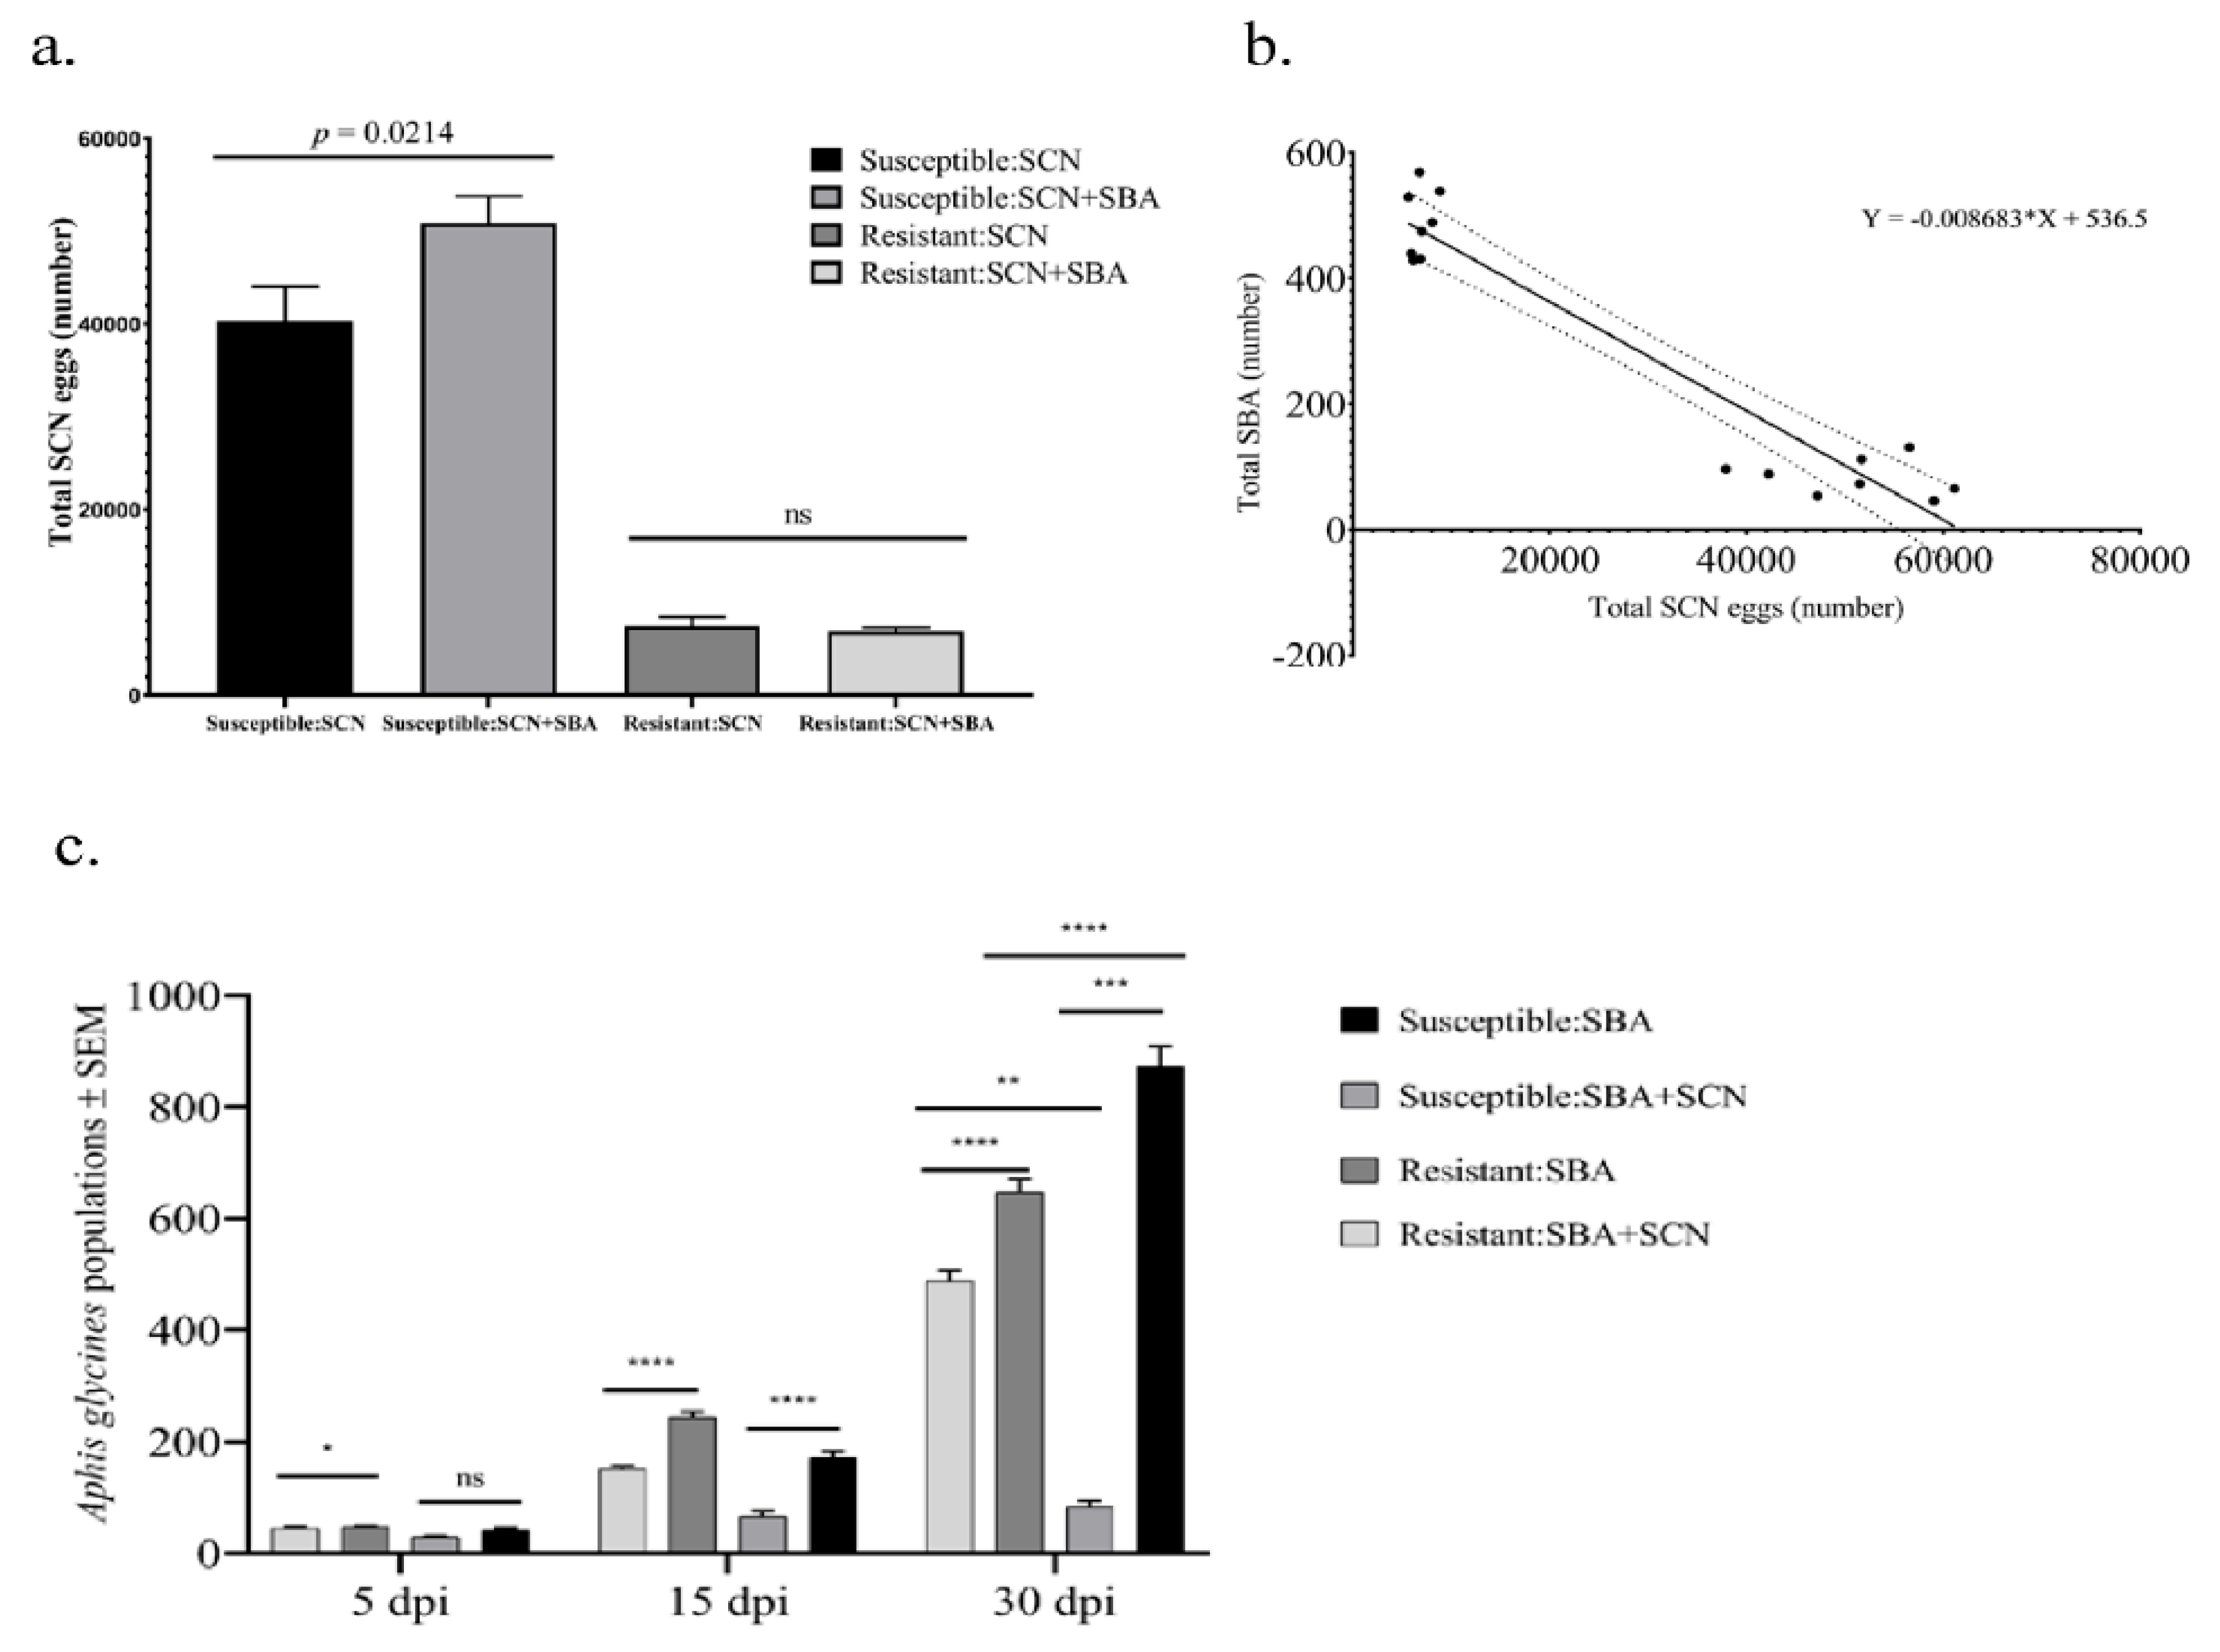
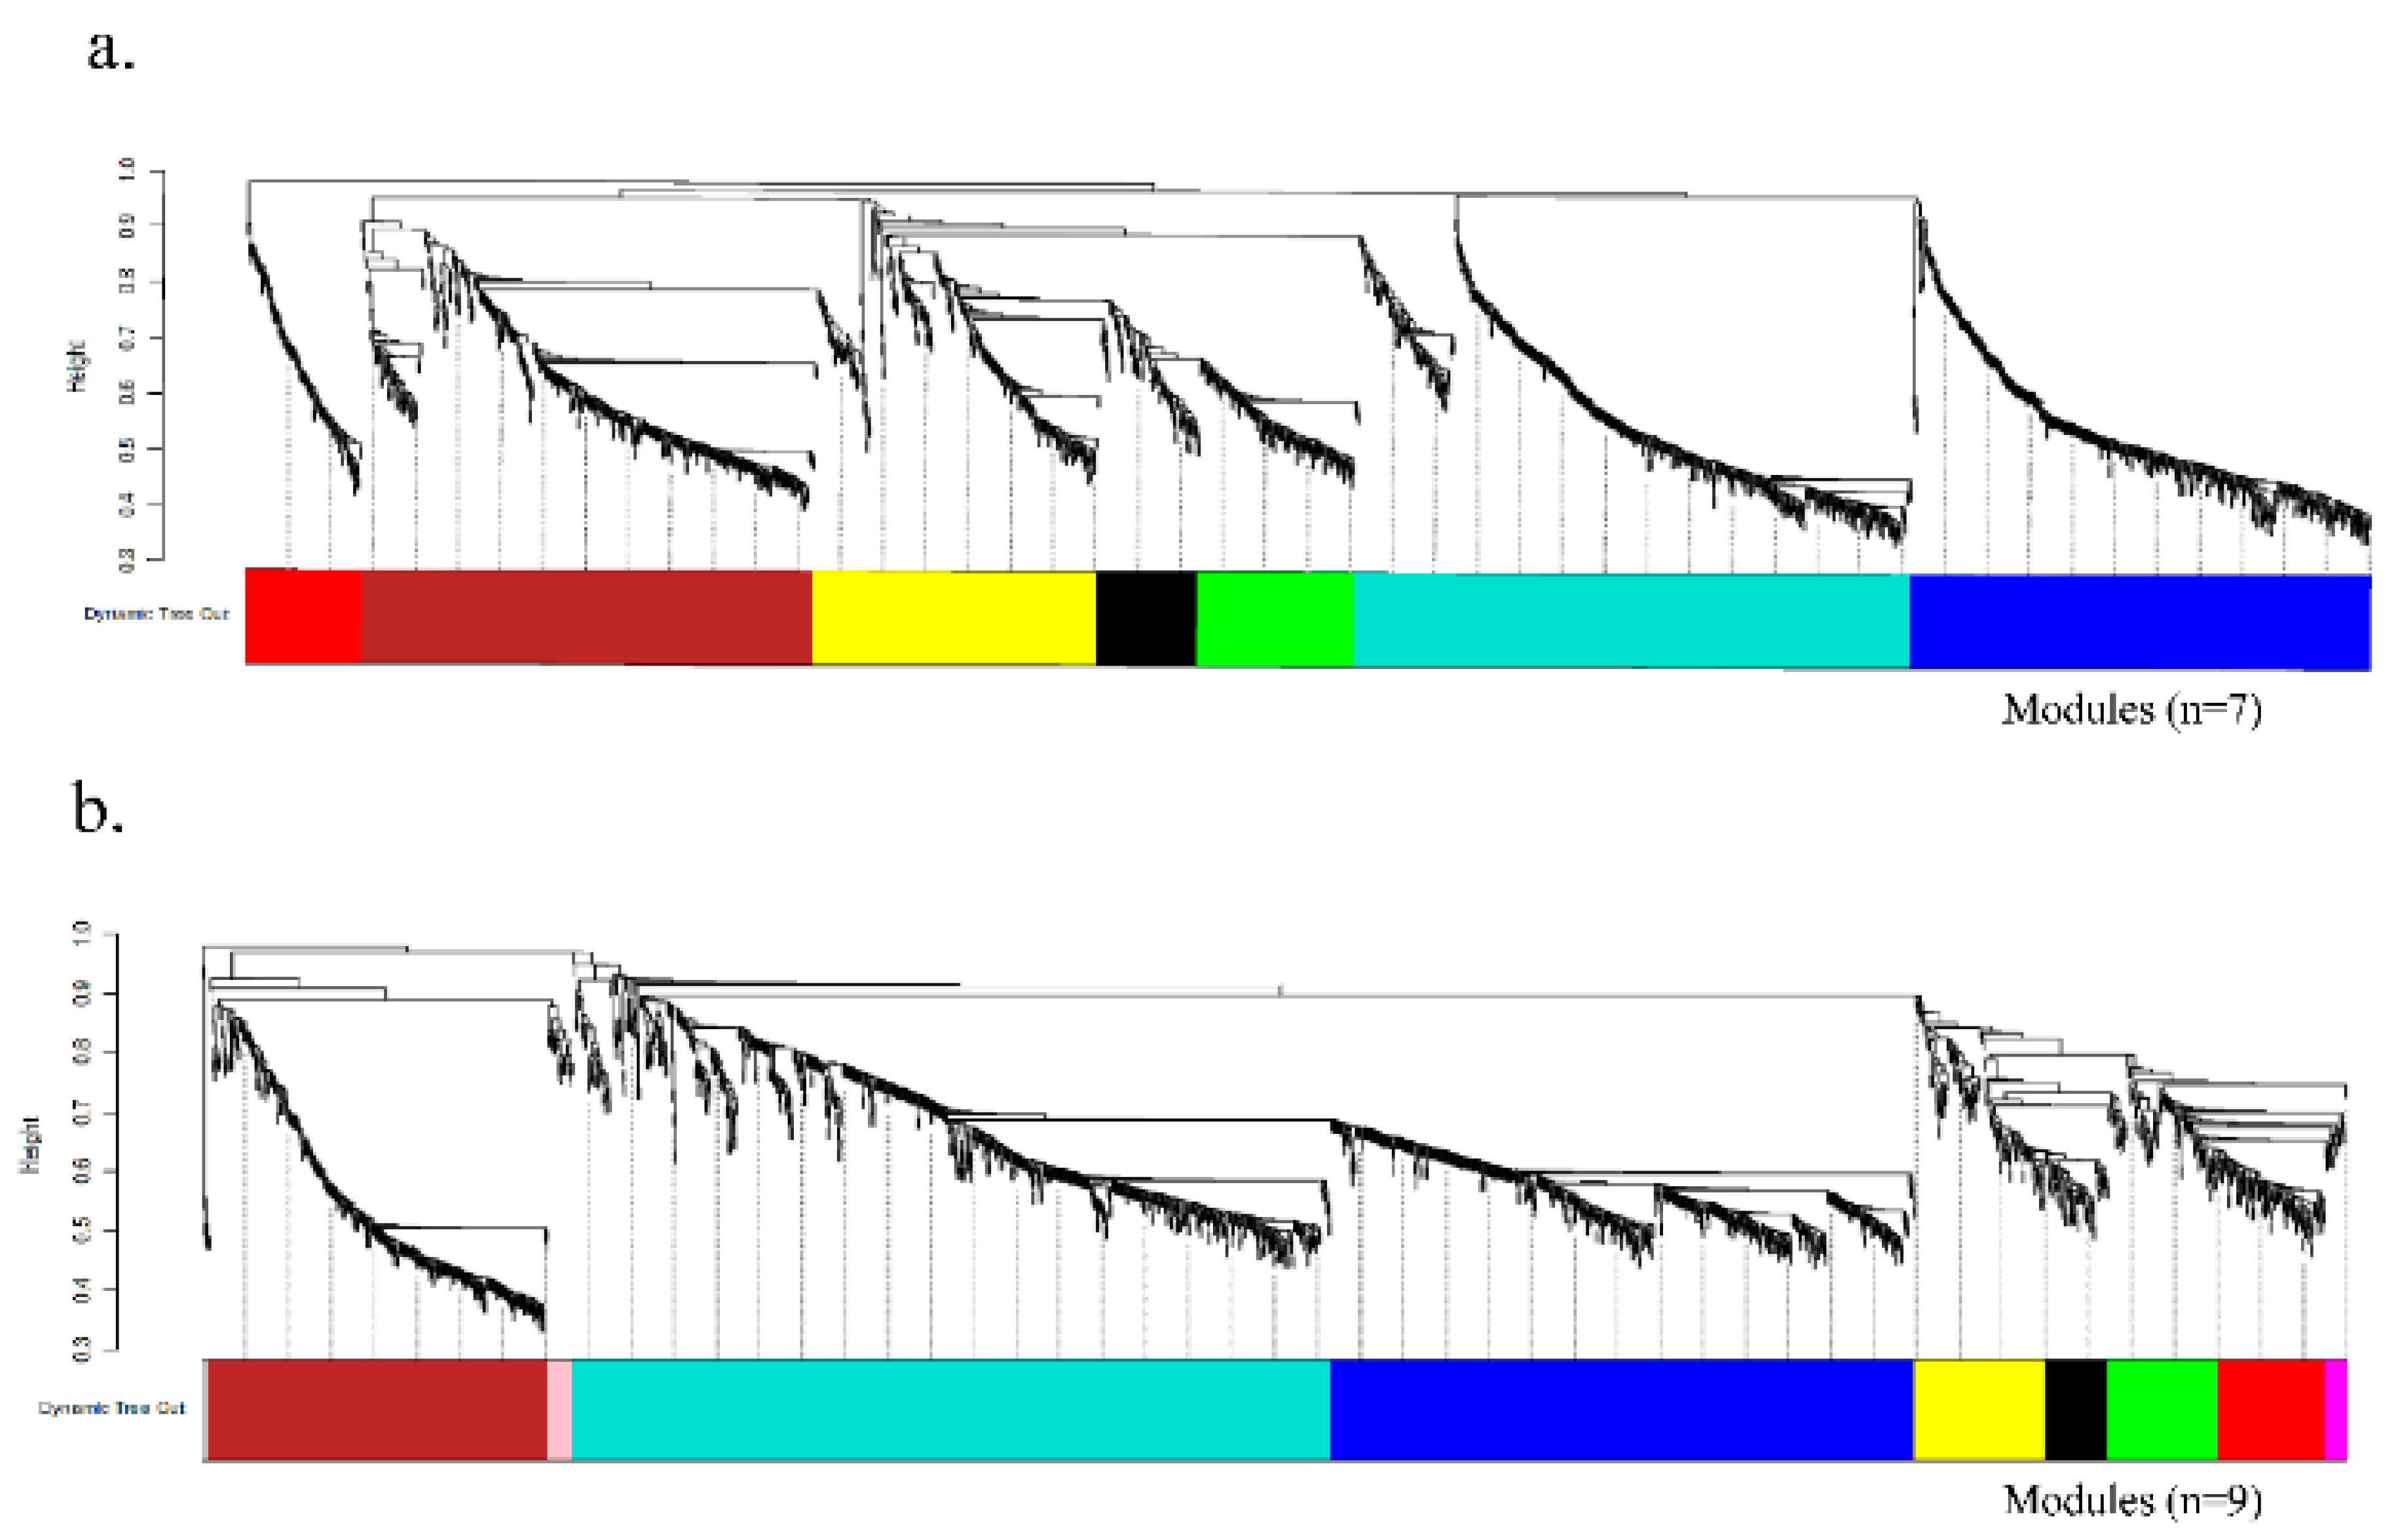
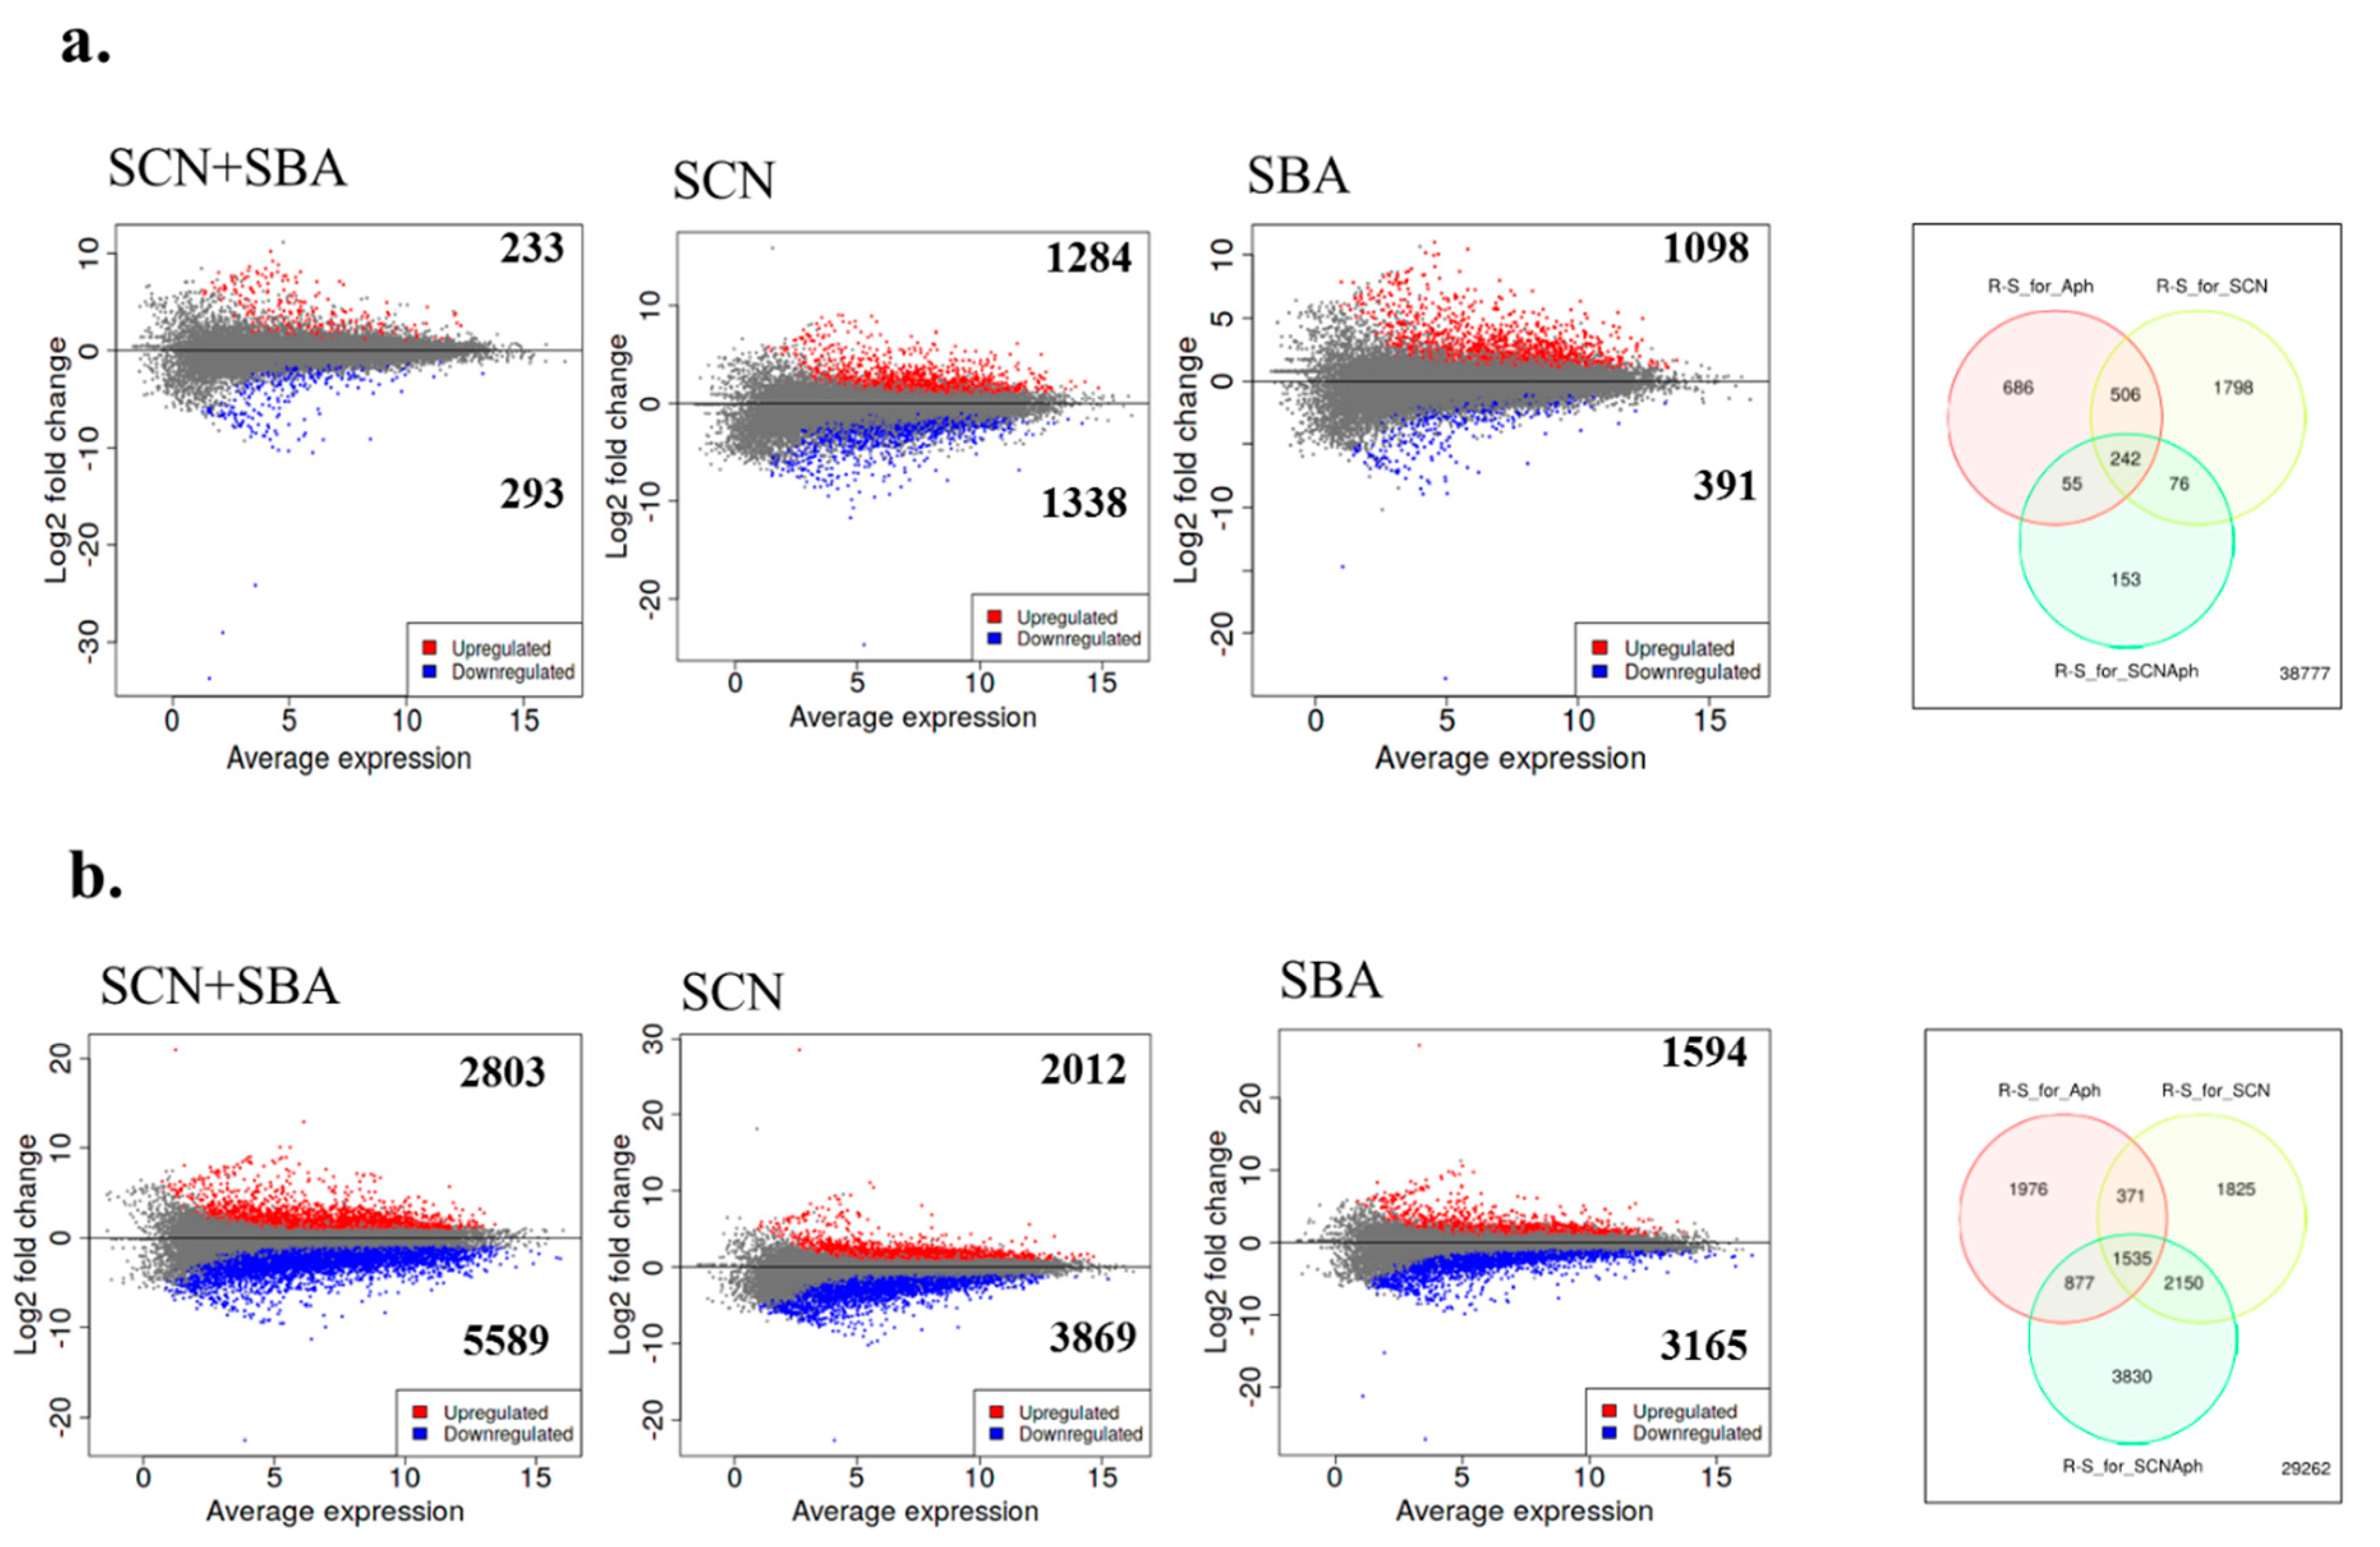
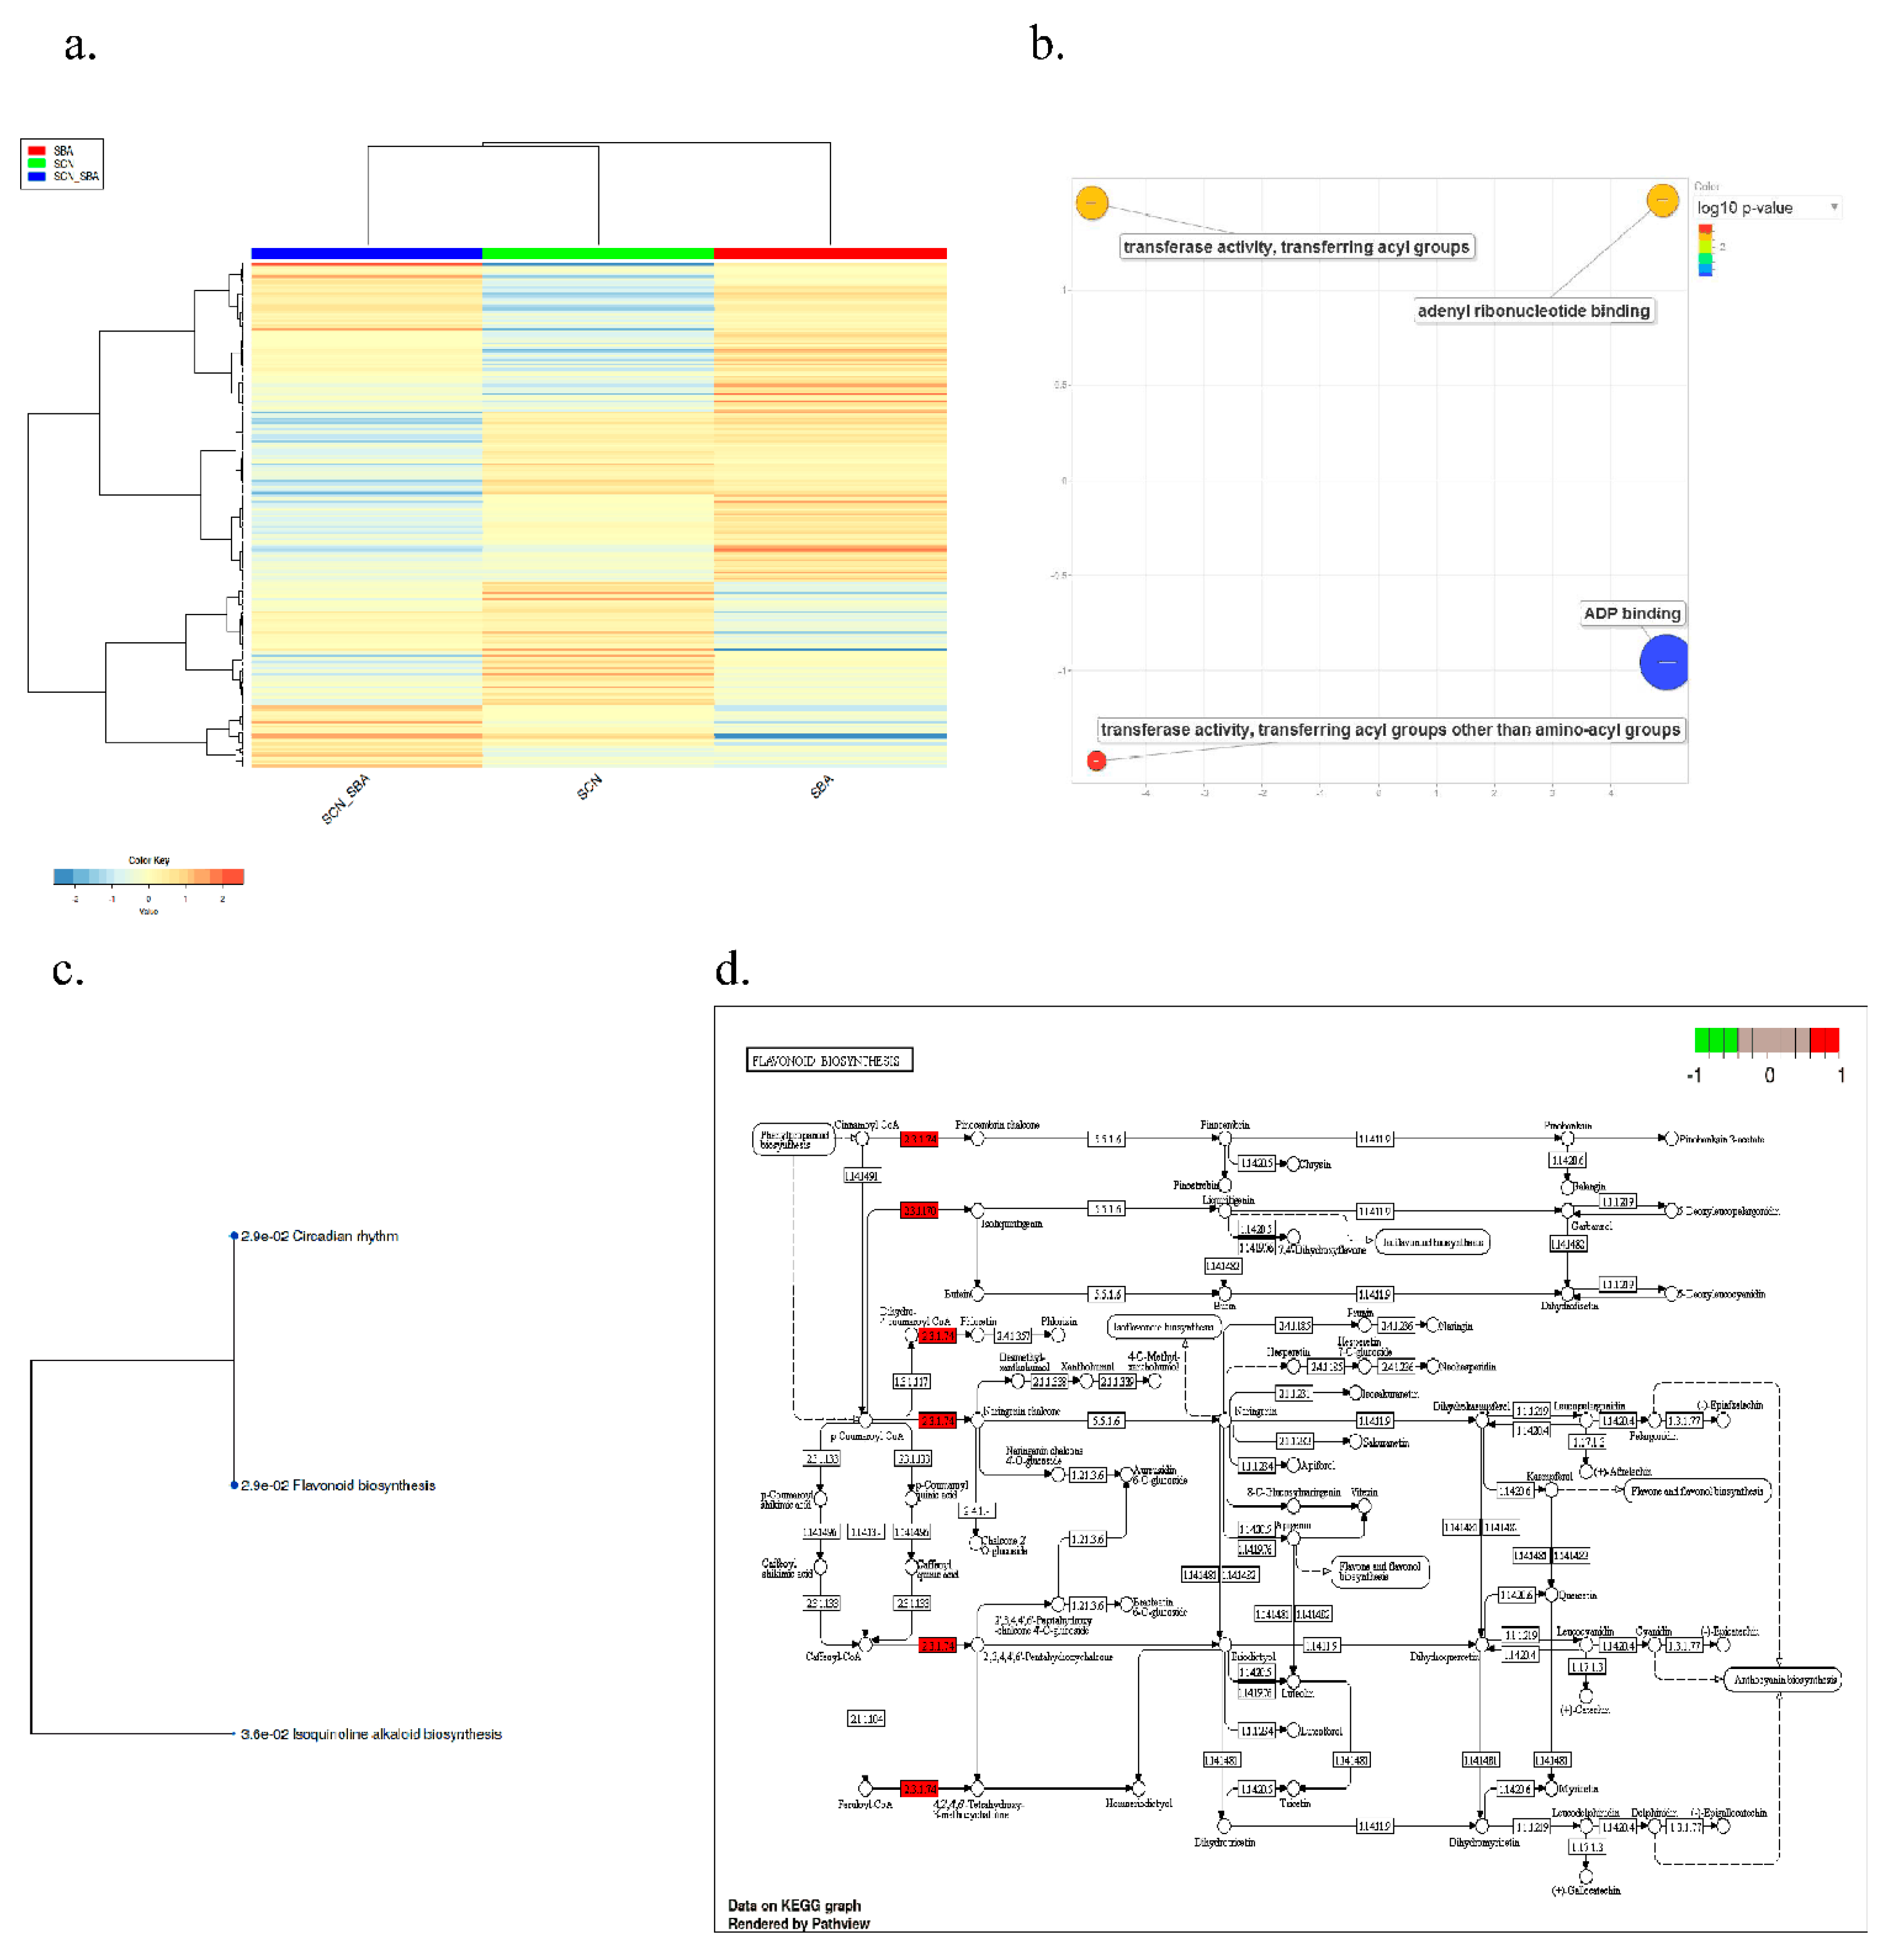
Soybean aphid (SBA), Aphis glycines Matsumura (Hemiptera: Aphididae), and soybean cyst nematode (SCN), Heterodera glycines Ichinoe (Tylenchida: Heteroderidae), are major pests of soybean, Glycine max L. Merr., in the U.S. Midwest. This study examined three-way interactions among soybean, SBA, and SCN using demographic and transcriptomic analyses. SCN-resistant and SCN-susceptible cultivars were evaluated under three treatments (SBA, SCN, SCN+SBA) in a randomized complete block design with six replicates, repeated eight times in greenhouse cone-tainers. Plants were infested with 2,000 SCN eggs at planting or 15 SBA at the V2 stage. Aphid populations were counted at 5-, 15-, and 30-days post-infestation (dpi), and SCN eggs sampled at 30 dpi. SCN egg density increased significantly in the susceptible cultivar but remained unchanged in the resistant cultivar in the presence of SBA, while SBA populations declined under SCN infestation. RNA-seq identified 4,637 differentially expressed genes (DEGs) at 5 dpi and 19,032 DEGs at 30 dpi. Analyses focused on DEGs shared across treatments but discordantly expressed in resistant cultivars during SBA–SCN interactions. Weighted Gene Co-expression Network Analysis revealed seven and nine modules at 5 and 30 dpi, respectively. Enrichment analyses identified ‘Plant–Pathogen Interaction’ and ‘Cutin, Suberin, and Wax Biosynthesis’ at 5 dpi, and ‘Isoflavonoid Biosynthesis’ and ‘One-Carbon Pool by Folate’ at 30 dpi. Several DEGs overlapped with SCN resistance QTLs, identifying candidate genes for cross-resistance breeding.

Keywords: 
;  ;  ;  ;  ;  ;  ;  ;  ;  

1. Introduction

Soybean, Glycine max (L.) Merr., is a globally important crop valued for its high-quality protein and oil [1,2]. In the Midwestern United States, the soybean aphid (SBA), Aphis glycines Matsumura (Hemiptera: Aphididae), and soybean cyst nematode (SCN), Heterodera glycines Ichinohe (Tylenchida: Heteroderidae), are the two most economically significant pests [3,4]. The soybean aphid is an aboveground phloem-feeding herbivore, whereas SCN is a belowground parasite of soybean roots. Their infestations often co-occur and can further exacerbate yield loss [5,6]. Annual economic losses in the United States are estimated at ~$4 billion for SBA and $1.3 billion for SCN [7,8,9]. Management strategies primarily rely on host plant resistance and chemical control [10,11,12]. However, challenges to sustainability have emerged. Pyrethroid resistance in SBA populations has been reported in Iowa, Minnesota, North Dakota, and South Dakota, with additional risks to non-target beneficial organisms [13,14]. Similarly, long-term deployment of SCN resistance has selected for virulent SCN populations capable of overcoming resistance genes (i.e., HG types)[15]. Although host resistance is not widely implemented for SBA, multiple virulent SBA biotypes have been identified in the U.S.; together the evolution of virulent SBA biotypes and SCN races threatens the durability of host plant resistance [15,16,17,18]. Thus, genetic insights from greenhouse-based experiments on SBA and SCN interactions are critical for identifying resistance genes and regulatory networks that can support durable pest resistance in soybean.
Despite occupying distinct niches, above- and belowground herbivores share the host through systemic tissues and can influence each other [19]. Prior studies have investigated SBA–SCN interactions in soybean using demographic approaches [5,6,20,21,22]. For example, McCarville, O’Neal, Tylka, Kanobe and MacIntosh [5] showed that SCN reproduction increased 5.24-fold in the presence of SBA and the fungus Cadophora gregata, while aphid populations decreased by 26.4% when SCN and the fungus were present. Later, McCarville et al. (2014) [6] found that SBA feeding improved soybean’s suitability as a host for SCN, although outcomes varied with cultivar and experiment duration. These demographic studies highlight the complexity of SBA–SCN interactions, but their molecular underpinnings remain unexplored.
Recent studies have substantially advanced understanding of soybean aphid biology and virulence, showing that abiotic stress such as flooding can alter fitness and transcriptomic responses of virulent versus avirulent aphid biotypes, while new chromosome-level genome assemblies of SBA now provide key resources for identifying genes underlying virulence, host adaptation, and effector functions relevant to resistance breeding [23,24]. Field-scale monitoring datasets further demonstrate that aphid population densities vary among soybean lines carrying different Rag (Resistance to Aphis glycines) genes, strengthening links between host genetics and pest pressure under real-world conditions[25]. For soybean cyst nematode (SCN), recent discoveries include novel resistance genes at the qSCN10 locus that confer broad-spectrum resistance independent of classic rhg1/Rhg4 pathways [26], alongside functional validation of defense-related genes such as GmPOD53L that enhance resistance through lignin deposition and peroxidase activity [27]. Updated surveys have also expanded the known geographic distribution of SCN, reinforcing its continued and growing agricultural significance worldwide [28]. From an applied perspective, extension surveys report more than 900 SCN-resistant soybean varieties available for the 2025 growing season, reflecting increased deployment of diverse resistance sources such as Peking in response to evolving SCN populations, while ongoing USDA-NIFA projects are developing molecular tools to detect and manage insecticide-resistant soybean aphid populations [29,30].
RNA sequencing (RNA-Seq) is a widely used approach for both qualitative and quantitative gene expression profiling, enabling detailed insights into transcript abundance and regulatory dynamics [31,32]. In this study, we analyzed RNA-Seq datasets resulted from interaction experiments using two soybean genotypes SCN-susceptible Williams 82 (PI 518671) and SCN-resistant MN1806CN—infested with SBA (biotype 1) and SCN (HG Type 0). Whole-root samples yielded over 1.1 billion reads (61.4 GB) from 47 RNA-Seq libraries. These data provide a strong foundation for dissecting the molecular basis of soybean–SBA–SCN interactions and identifying candidate genes for durable resistance.

2. Results

2.1. Greenhouse Experiment Reveals Asymmetric Above–Belowground Interactions

We quantified SCN reproduction (egg counts at 30 dpi) and SBA population growth (5, 15, and 30 dpi) across SCN-resistant (MN1806CN) and SCN-susceptible (Williams 82; PI 518671) cultivars under four treatment conditions (control, SBA, SCN, and combined SCN:SBA). SCN reproduction differed strongly by cultivar, with substantially greater egg production on the susceptible genotype. As shown in Figure 1, SCN egg counts differed among treatments (one-way ANOVA: F = 87.44, df = 3, P < 0.001). For the SCN-resistant cultivar, the egg numbers for the SCN-only vs. SCN+SBA treatments at 30 dpi were not significantly different, whereas in the susceptible cultivar, SCN egg numbers were significantly higher when SBA was present (Figure 1a). Across both cultivars combined, SCN egg density and SBA abundance showed a strong negative relationship (linear regression: F = 143.5, P < 0.0001, R² = 0.91; Figure 1b), and SCN infestation reduced 30 dpi aphid counts by ~25% (resistant) and ~90% (susceptible; Figure 1c). Together, these greenhouse outcomes indicate that the direction and magnitude of above–belowground interactions depend on host genotype and the stage of infestation, motivating the time-resolved transcriptome analysis below.

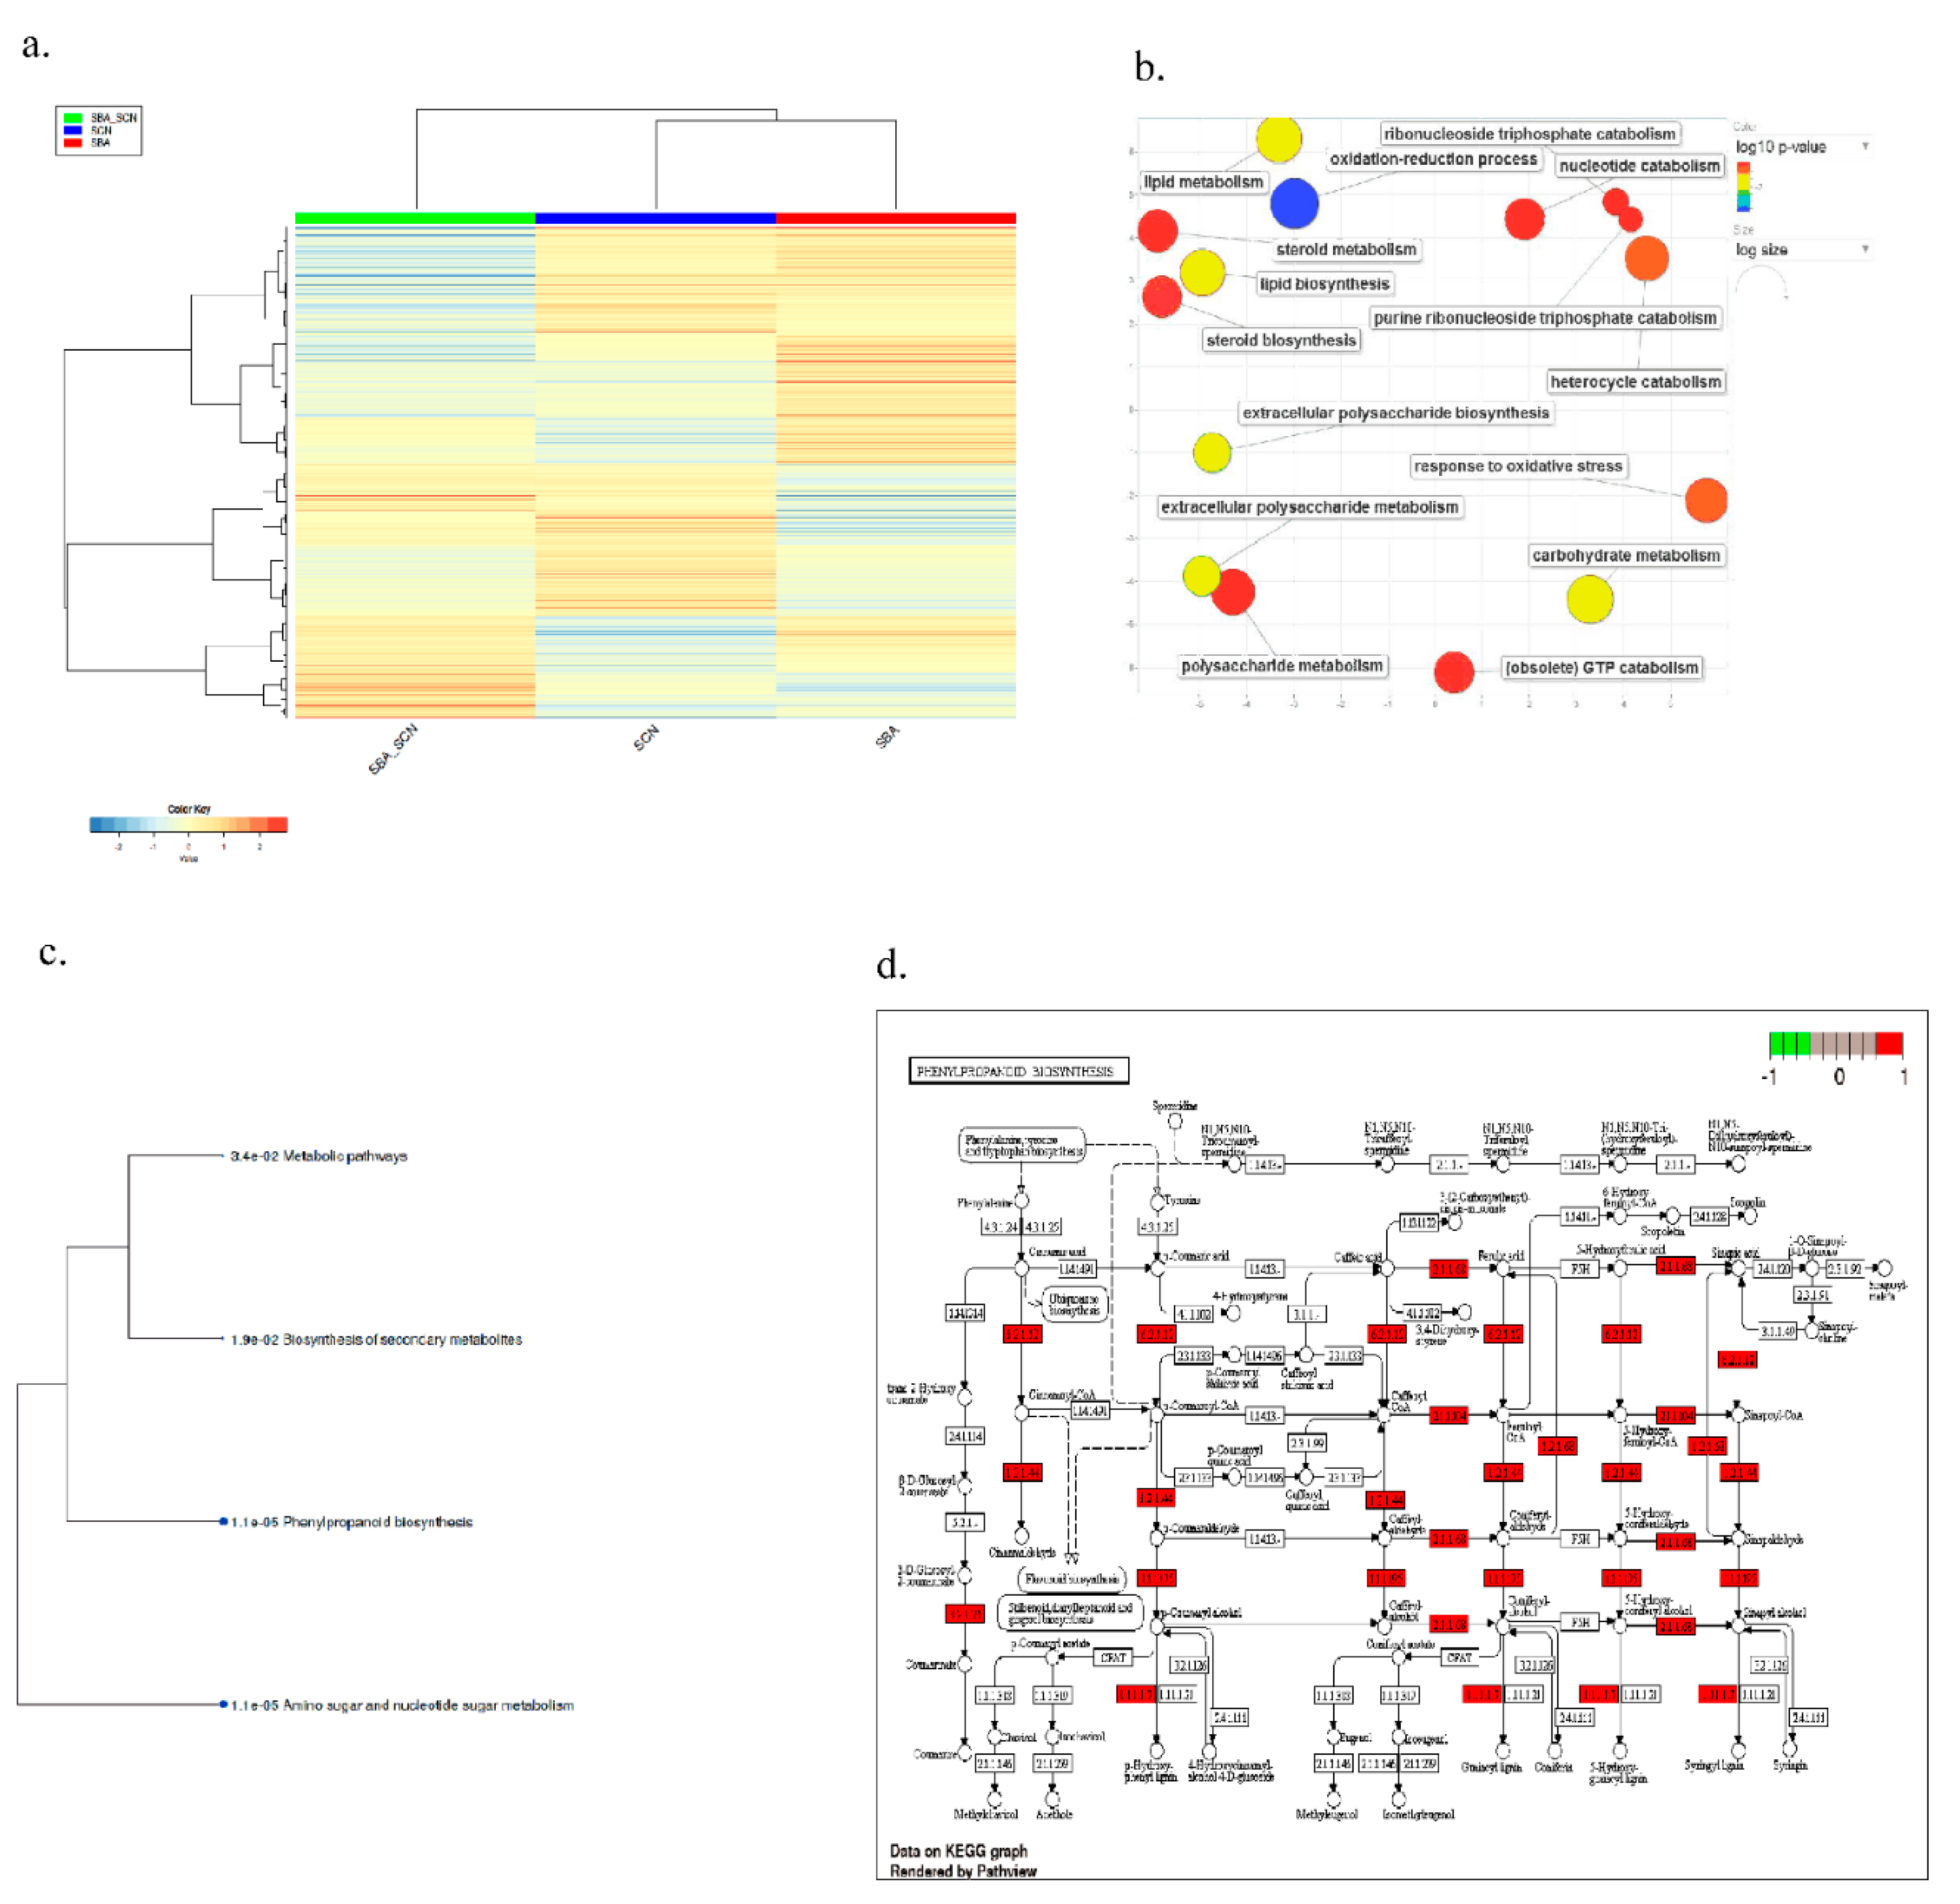
2.2. RNA-seq Dataset Quality and Overall Structure of the Transcriptome Signal

Experimental design, library construction, sequencing, and primary read-processing (including trimming and read-mapping/quantification) were previously described and quality-validated in our Scientific Data paper [33]: root RNA-seq generated >1.1 billion reads across 48 libraries (5 and 30 dpi), with high base quality (Phred > 30), GC content ~43–45%, >99% reads retained after trimming, and strong alignment performance (mapped ~73.8–94.3%; uniquely mapped ~67.1–87.6%). After filtering, 43,122 genes were retained and variance-stabilized counts supported robust clustering and ordination; PCA indicated time as the dominant driver of expression variation (PC1 = 28%; p = 1.16 × 10⁻⁶) with treatment also contributing (PC2 = 15%; p = 2.02 × 10⁻⁸). Differential expression analysis across SBA, SCN, and SCN+SBA treatments identified 4,637 DEGs at 5 dpi and 19,032 DEGs at 30 dpi (FDR < 0.01; fold-change > 2), including 242 DEGs shared across treatments at 5 dpi and 1,535 shared at 30 dpi, indicating a large common response that shifts markedly over time.

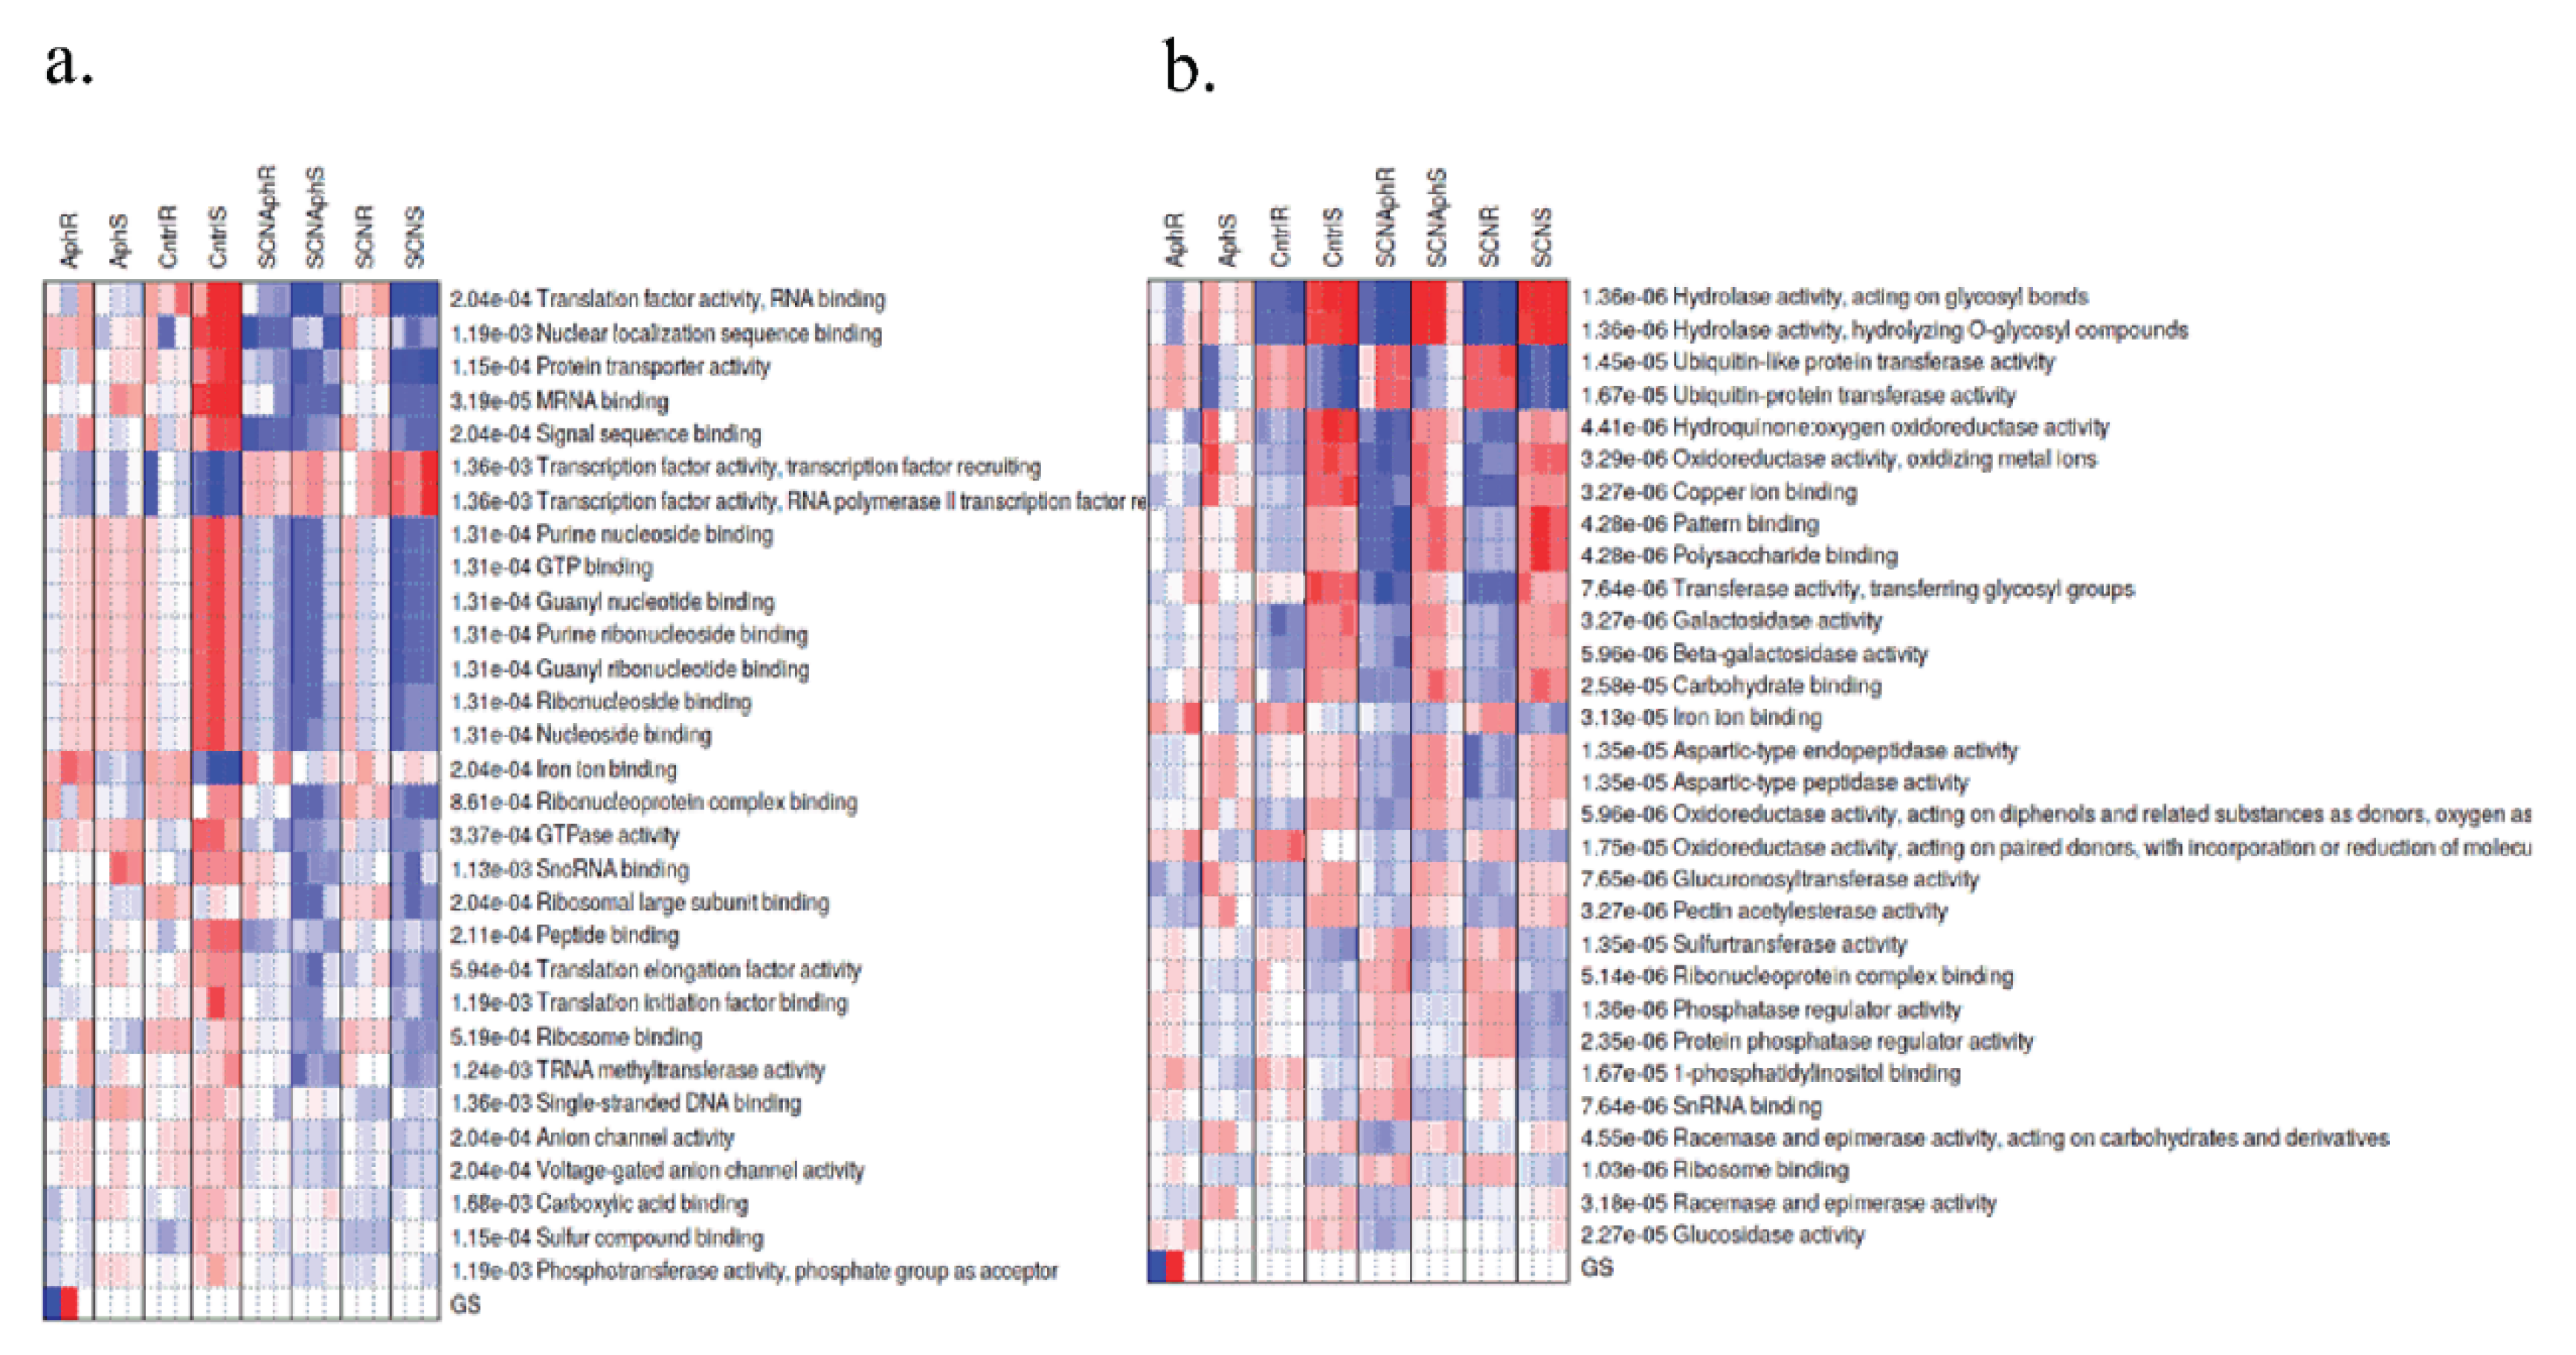
2.3. Co-Expression Network Analysis Highlights Late Oxidative-Stress Programs

To compare early (5 dpi) and late (30 dpi) responses while reducing model complexity, we constructed weighted gene co-expression network analyses (WGCNA) separately for each time point. WGCNA identified seven co-expression modules at 5 dpi (2,000-gene network) and nine modules at 30 dpi (1,994-gene network) (Figure 2). Notably, hydrogen peroxide metabolic process and reactive oxygen species metabolic process were enriched only at 30 dpi (not at 5 dpi), consistent with stronger oxidative-stress signatures later in the interaction, pointing to stronger late-stage oxidative/ROS engagement under sustained herbivore/parasite pressure.

2.4. Large, Time-Dependent Cultivar Contrasts Reveal Shared Core Responses to SCN, SBA, and Their Combination

We compared resistant vs. susceptible cultivars within each treatment at 5 dpi and 30 dpi. Using stringent thresholds (FDR < 0.01; fold change > 2), we identified 4,637 differentially expressed genes (DEGs) at 5 dpi and 19,032 DEGs at 30 dpi across SCN, SBA, and SCN: SBA contrasts. Despite this extensive divergence, a substantial subset of genes behaved consistently across all three pest contexts within each time point (Figure 3). Specifically, 242 DEGs overlapped among all treatments at 5 dpi, and 1,535 DEGs overlapped among all treatments at 30 dpi (Figure 3). At 5 dpi, the shared 242-gene set was enriched for molecular functions associated with acyl-transfer chemistry and nucleotide/ADP binding, and for pathways including circadian rhythm and flavonoid-related metabolism (Figure 4). Promoter motif enrichment suggested involvement of homeodomain and MYB-related regulatory families (Supplementary File 10). At 30 dpi, the shared 1,535-gene set was enriched for oxidation–reduction functions and broad primary/secondary metabolism, including amino sugar/nucleotide sugar metabolism and phenylpropanoid biosynthesis (Figure 5), with promoter motifs implicating AP2, bHLH, bZIP, MYB and additional plant regulatory families (Supplementary File 11). Collectively, these results define (i) an early shared signature with signaling/biosynthetic features and (ii) a later shared signature dominated by redox and metabolic remodeling.

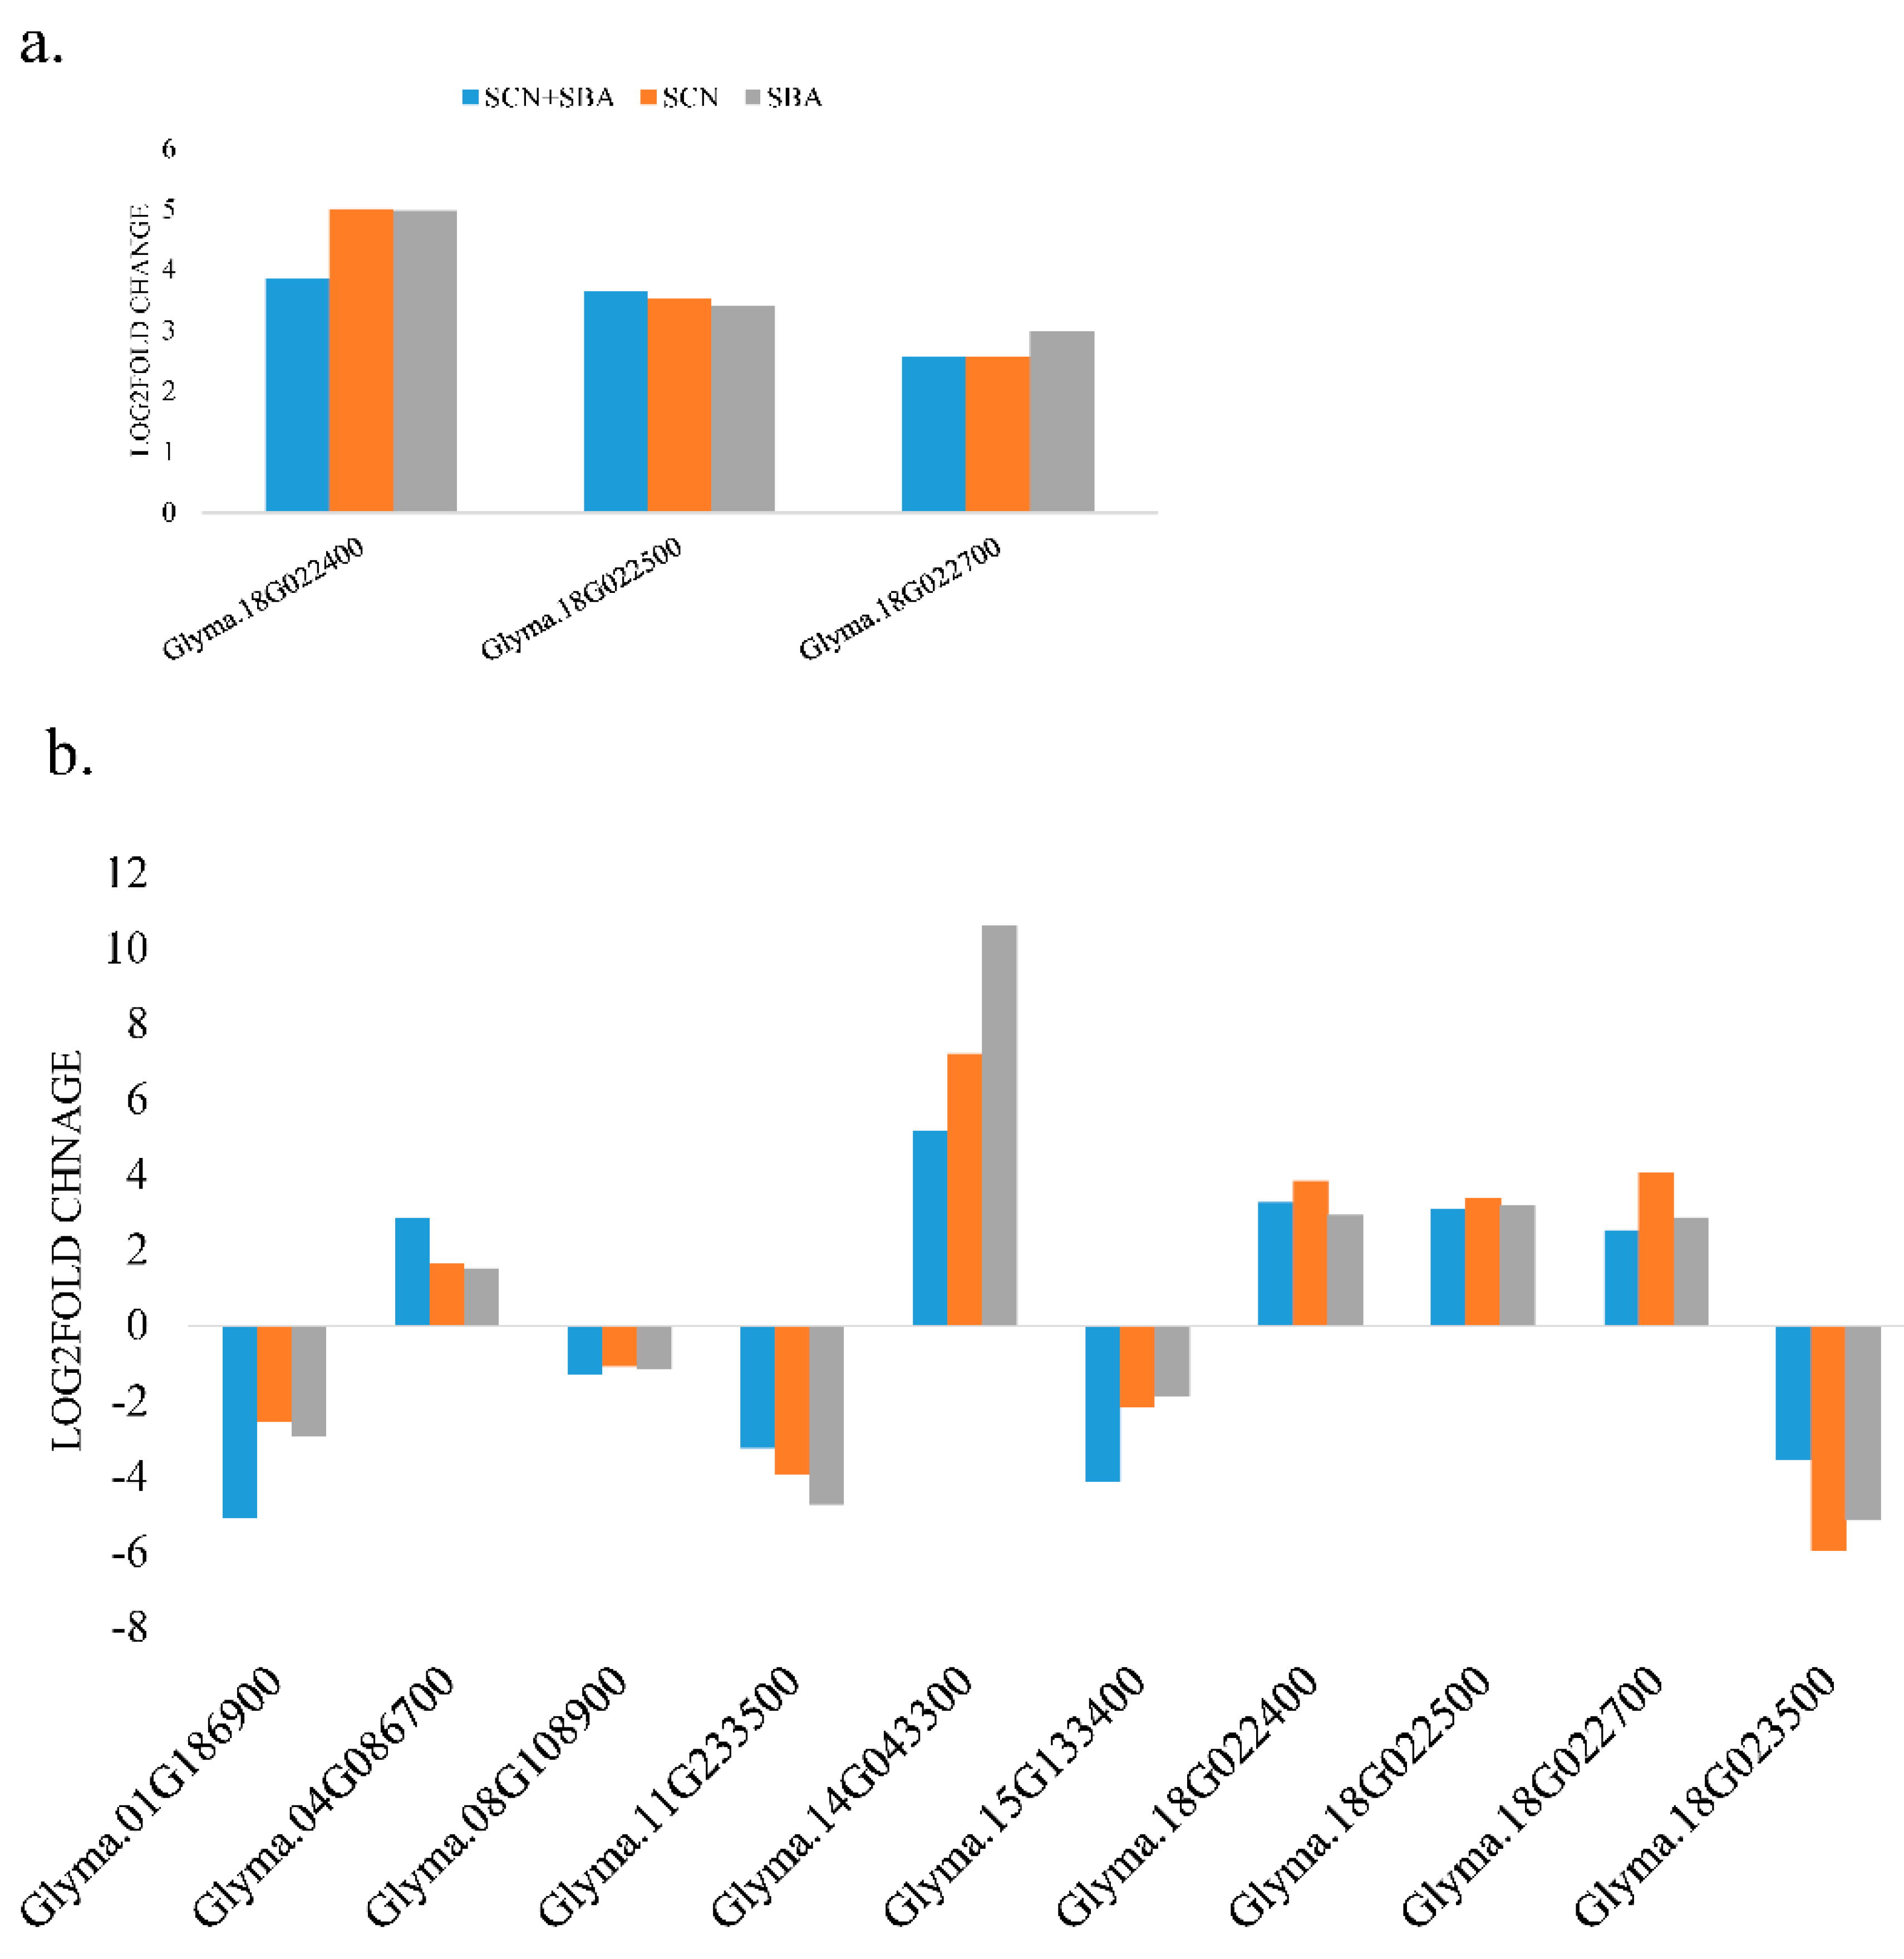
2.5. A Subset of DEGs Coincide with Known SCN Resistance QTL Regions (QTL-Coincident Signals)

To connect expression signatures to prior genetic mapping, we intersected DEGs with a curated set of SCN QTL-associated genes. Thirteen genes from the shared core sets localized to SCN QTL regions: three from the 5 dpi shared set and ten from the 30 dpi shared set (Figure 6). Among the most notable were Glyma.18G022400 (amino acid transporter-like), Glyma.18G022500 (GmSNAP18), and Glyma.18G022700 (wound-induced protein), which were consistently upregulated (reported range ~2.53 to 5.01 log2 fold change) in the resistant cultivar relative to the susceptible cultivar across time points and treatments. These genes co-localize with the rhg1 region implicated in durable SCN resistance mechanisms, supporting biological coherence between transcriptomic and genetic evidence.

2.6. Within-Cultivar Contrasts Show Fewer DEGs in the Resistant Genotype and Identify Interaction-focused Candidates

We examined treatment effects within each cultivar to identify genes responsive to pest challenge in SCN-resistant (MN1806CN) versus SCN-susceptible (Williams 82). Across contrasts, MN1806CN generally exhibited fewer DEGs than the susceptible genotype, consistent with a more buffered transcriptional response. In the resistant cultivar under SCN+SBA, only four DEGs were unique at 5 dpi—Glyma.03G044900 (dirigent-like), Glyma.13G147600 (2OG-Fe(II) oxygenase), Glyma.16G214400 (Exo70B1), and Glyma.20G089400 (proteasome component domain)—a compact, interpretable set consistent with defense signaling/trafficking and proteostasis (Table 1). At 30 dpi, 100 DEGs were uniquely expressed in the resistant cultivar, including Glyma.04G096400 (strong induction; cystatin/cysteine-type endopeptidase inhibitor activity), multiple cytochrome P450s, and a prominent UDP-glucosyltransferase theme, consistent with hormone/JA-related turnover and specialized-metabolite modification (Table 1; Table 2).

2.7. Transcription Factor Motif Enrichment Suggests Distinct Regulatory Regimes in Early vs. Late Responses

Promoter motif enrichment analyses (300 bp upstream) of DEGs supported a time-structured regulatory architecture. In MN1806CN under combined infestation, the early response showed enrichment for motifs linked to homeodomain and WRKY-related families among induced genes, whereas late responses showed strong WRKY/TBP/bHLH signatures among repressed genes and TBP/bZIP/MYB/AT-hook/bHLH signatures among induced genes (Table 3). These patterns are consistent with layered defense regulation where early recognition and signaling cascades transition into longer-term metabolic and redox remodeling.

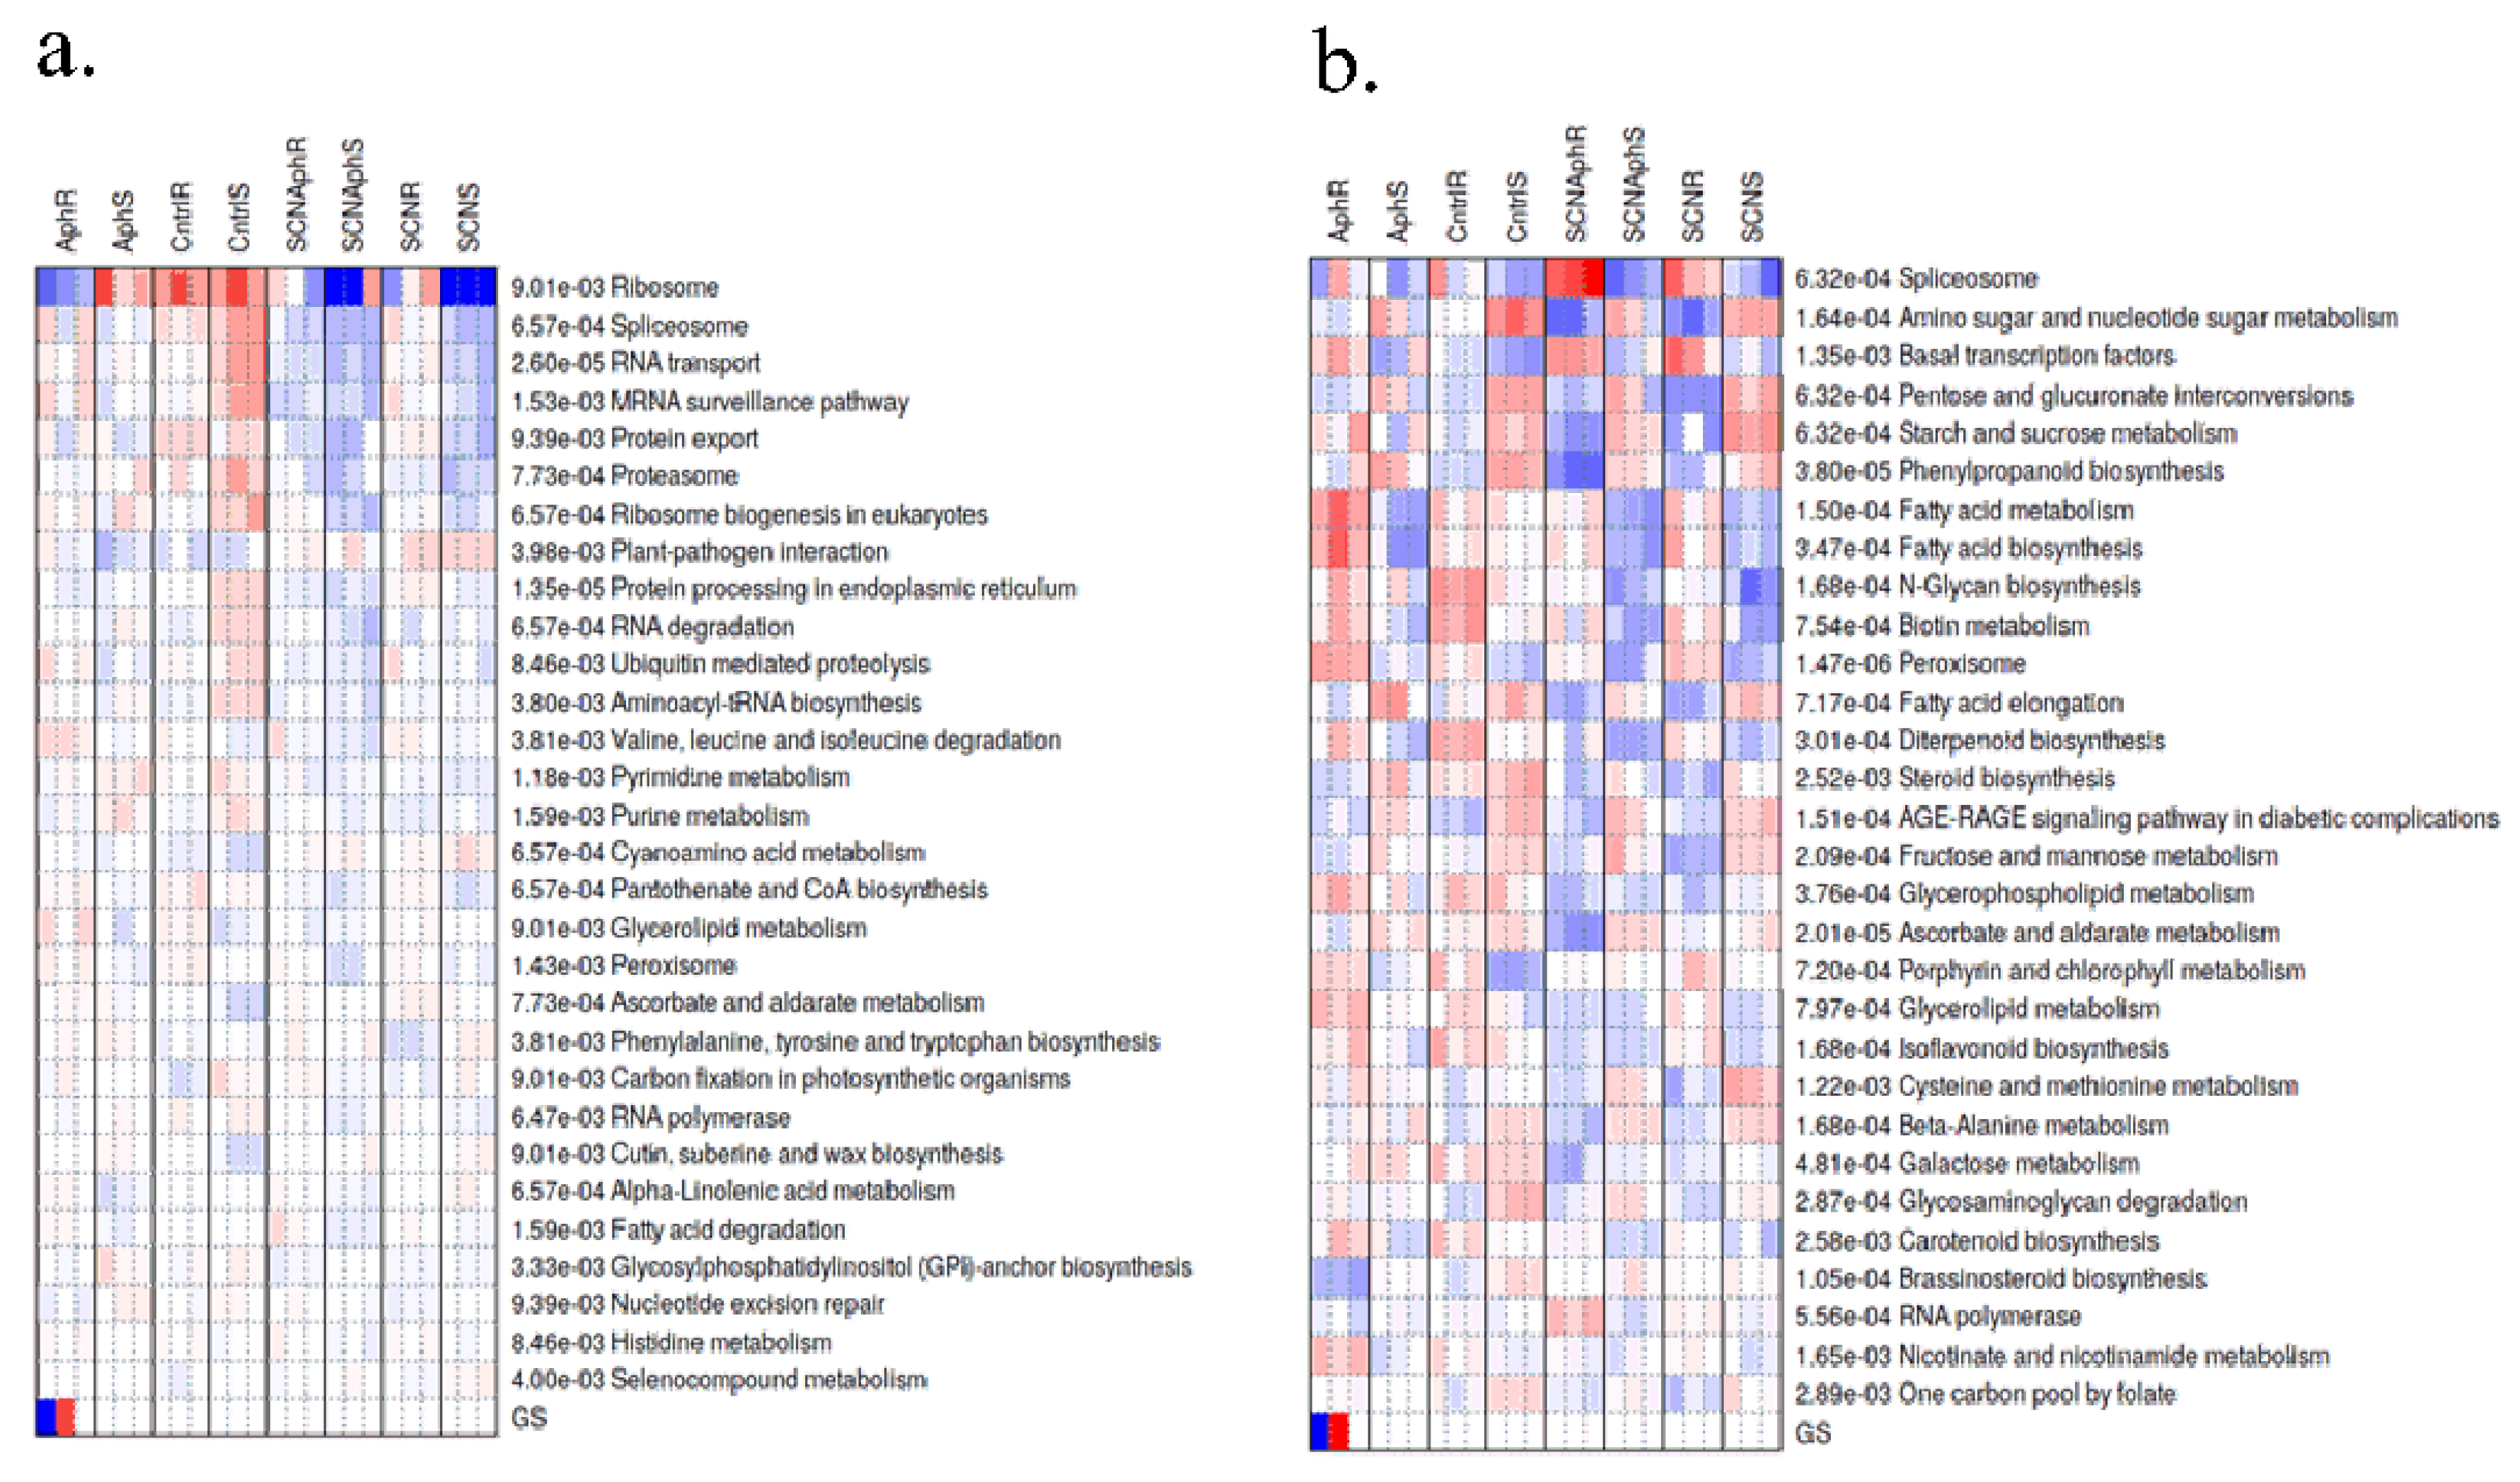
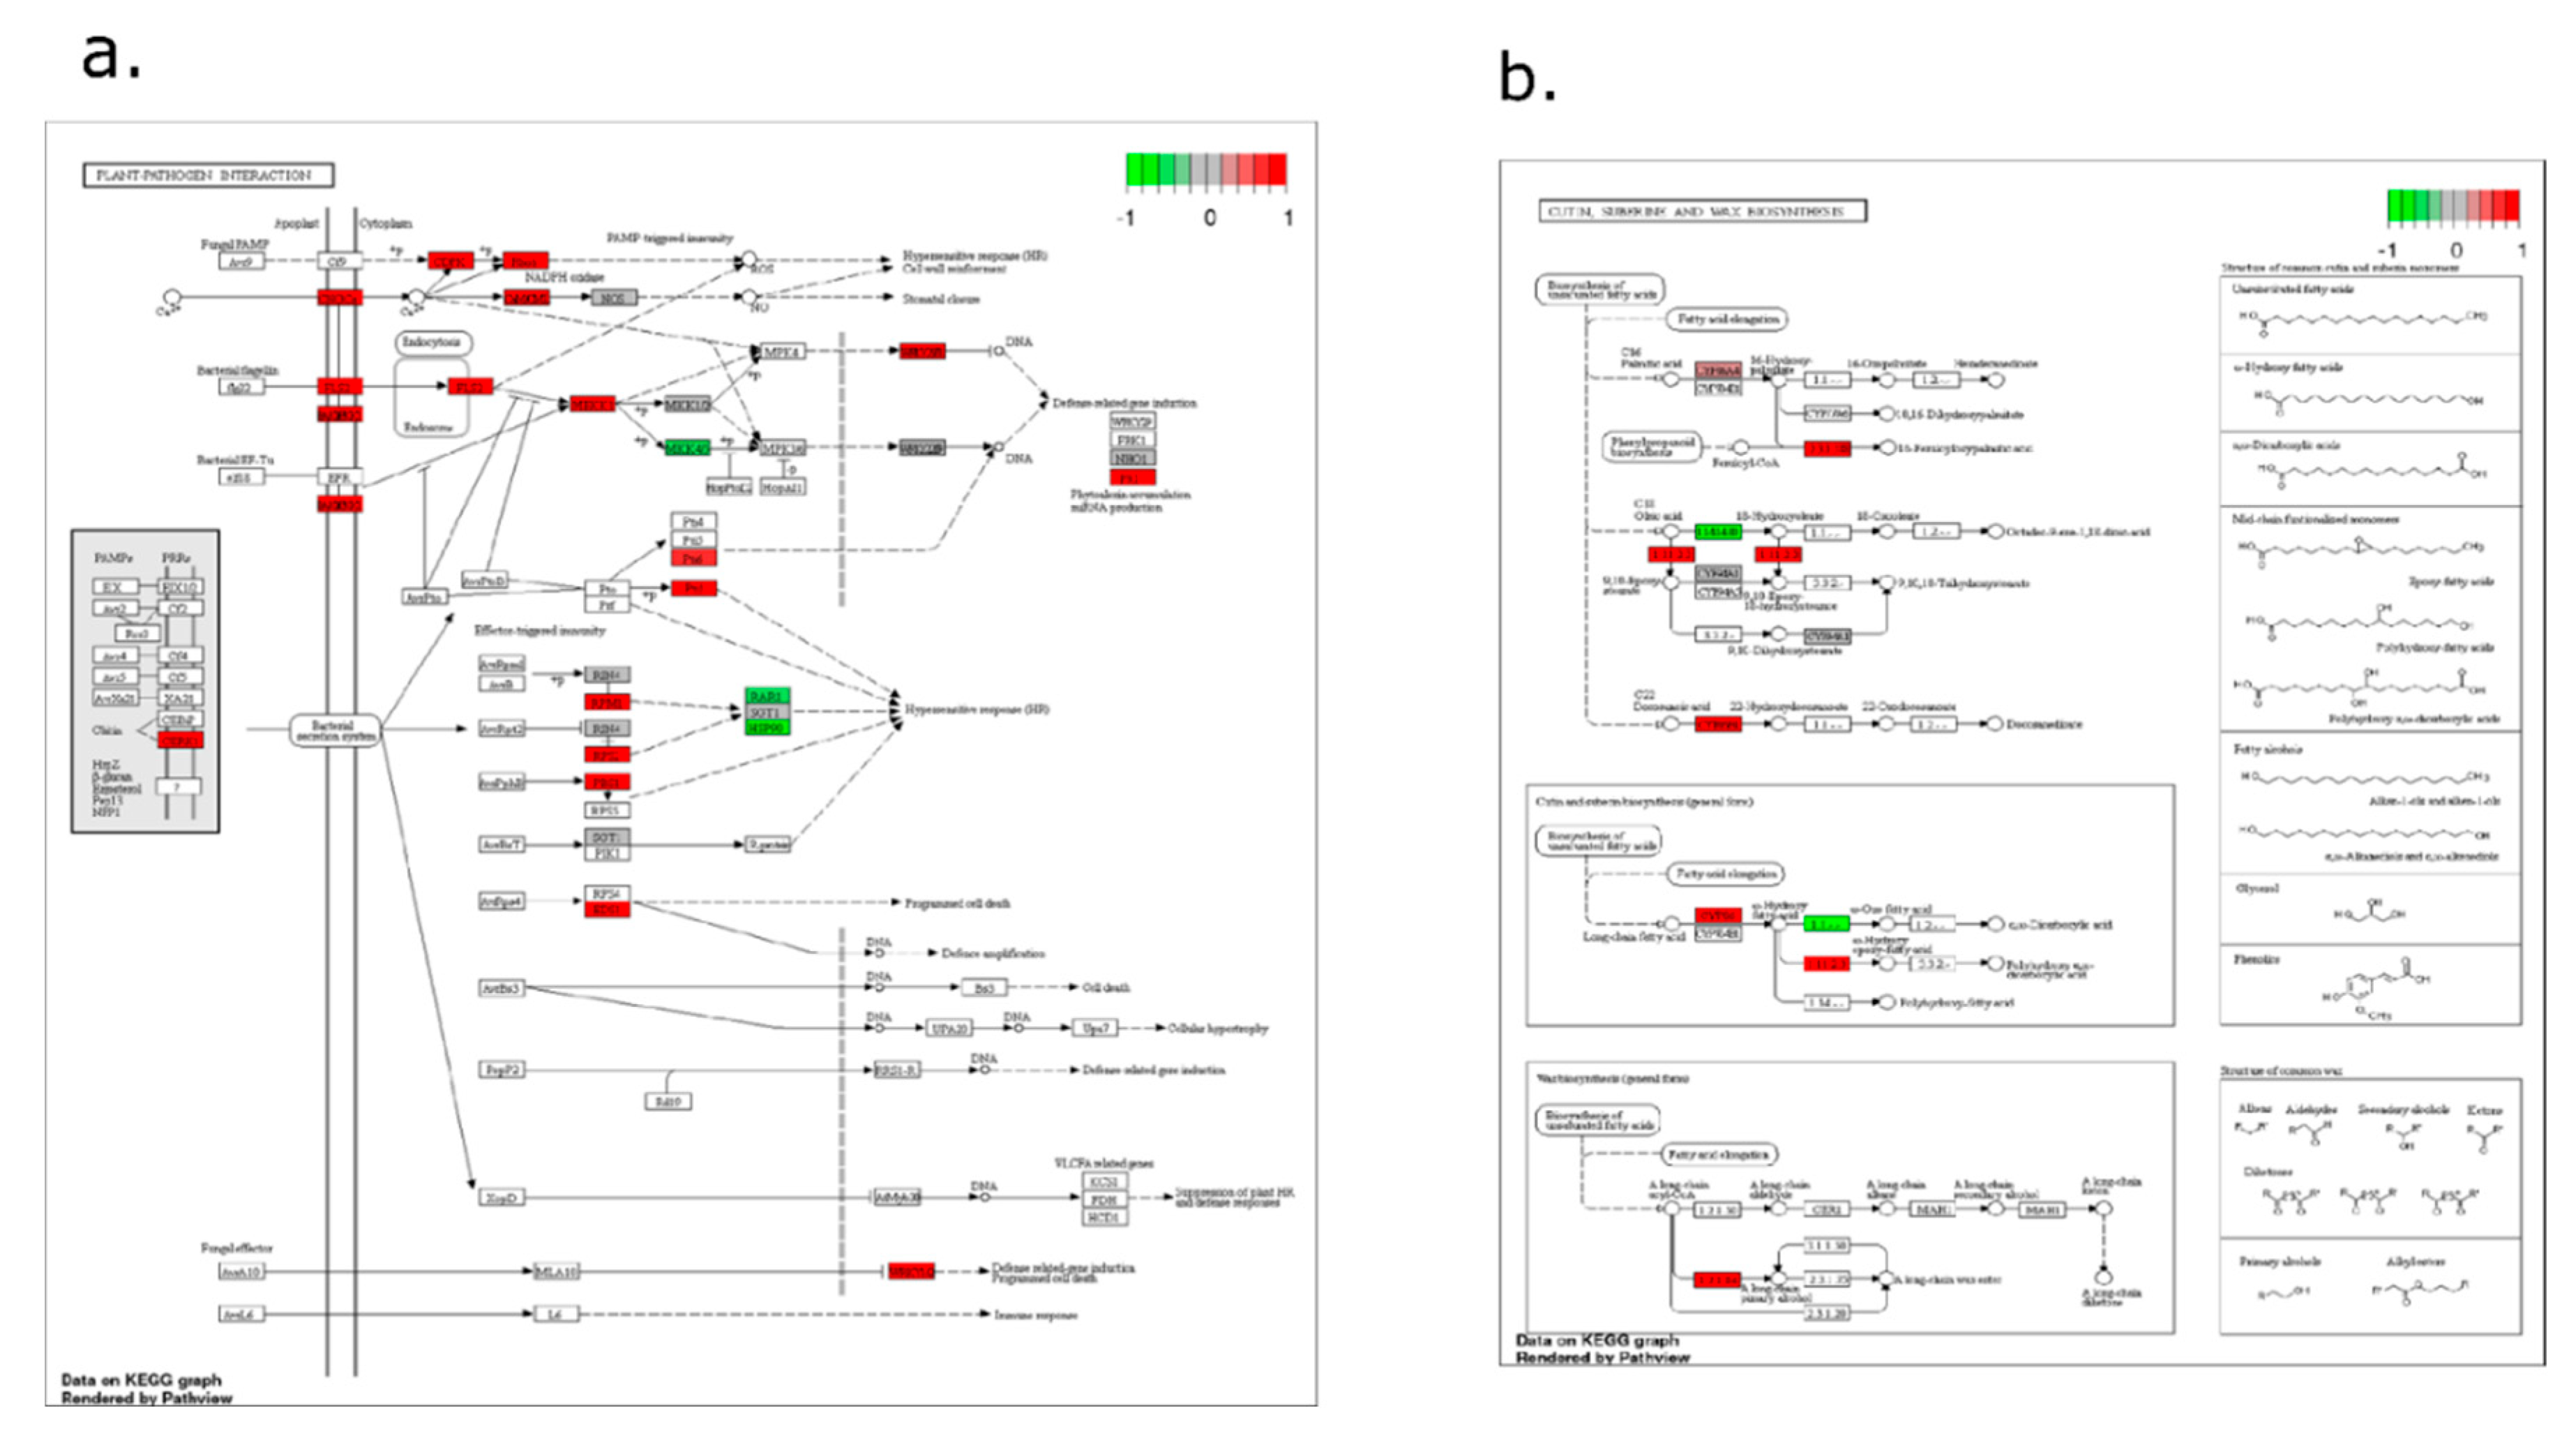
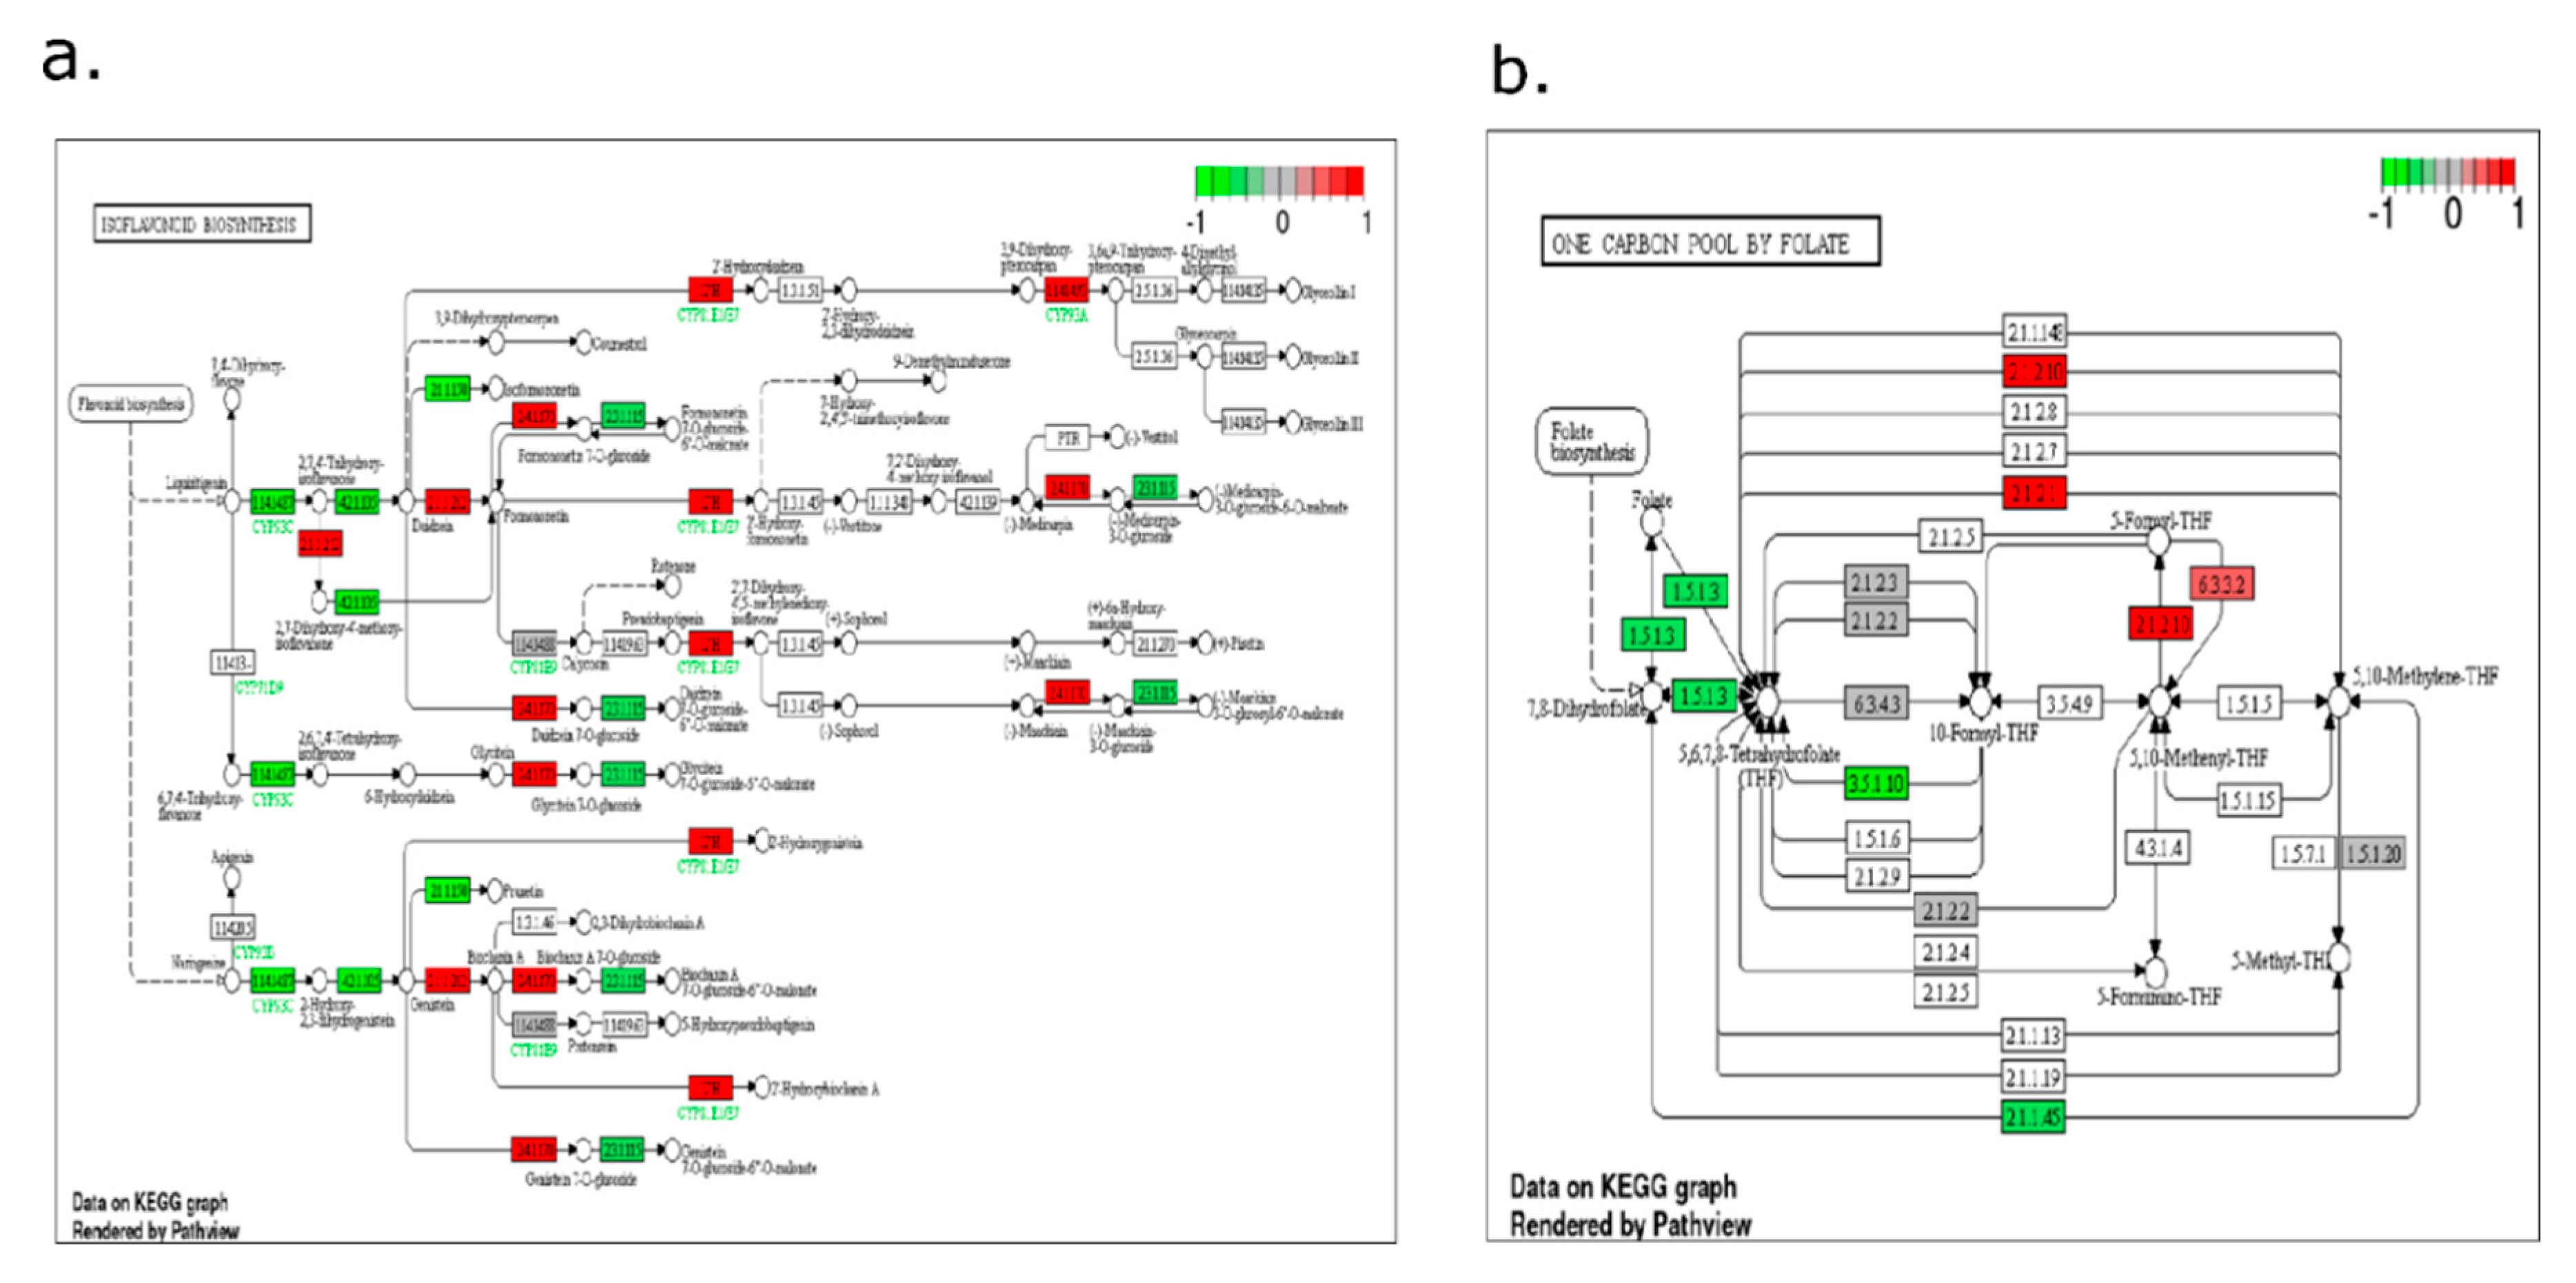
2.4. Pathway-Level Analysis Separates Early Lipid/Defense Signaling from Late Carbohydrate and Specialized Metabolism—

PGSEA/KEGG analyses of the most variable genes showed clear temporal partitioning of pathway activity. At 5 dpi, enriched pathways were dominated by immune signaling and wound-associated lipid processes, including plant–pathogen interaction, ubiquitin-mediated proteolysis, cutin/suberin/wax biosynthesis, α-linolenic acid metabolism, and fatty acid degradation (Figure 7, Figure 8 and Figure 9). By 30 dpi, pathway enrichment shifted toward primary metabolism (multiple carbohydrate pathways), fatty acid biosynthesis/elongation, phenylpropanoid and isoflavonoid biosynthesis, and one-carbon metabolism by folate (Figure 7, Figure 8, Figure 9 and Figure 10). This temporal progression suggests that early defense emphasizes signaling and barrier/wound chemistry, whereas late defense involves extensive resource reallocation and secondary metabolite deployment.

3. Discussion

3.1. Host Genotype Shapes the Direction of SCN–SBA Interactions

This study is among the first to couple demographic outcomes with root transcriptomics to examine interaction effects of SCN and SBA on soybean using SCN-resistant cultivar MN1806CN and the SCN-susceptible cultivar Williams 82 (PI 518671). MN1806CN carries the Rps1k gene for resistance to Phytopthera root rot making it resistant to races 1, 4, and 17 and is susceptible to the SBA. Our greenhouse design followed the general approach of McCarville, Soh, Tylka and O’Neal [6], but differed in key parameters (cultivars, aphid density, and sampling schedule). Specifically, we used MN1806CN and Williams 82 (PI 518671), infested plants with 15 biotype 1 SBA (rather than zero, five, or ten biotype 1 SBA), and collected aphid data at 5 and 30 dpi (rather than focusing on a 30-day-after-planting). McCarville et al. (2014)[6] showed both SCN eggs and the number of females increased by 33% in SCN-resistant cultivar and reduced by 50% in the SCN-susceptible cultivar in 30 days after planting. In our greenhouse experiment, at 30 dpi, SBA feeding significantly affected the reproduction of SCN depending on the cultivars. We observed a significant difference in SCN egg counts in susceptible cultivars and no effect in resistant cultivars in the presence of SBA. This suggests the application of aphid increases the reproduction of the belowground SCN in the susceptible plants and no effects in the resistant plants. However, if we consider each treatment, the final SCN eggs counts have increased from the approximate initial counts of 2,000 eggs in both resistant and susceptible cultivars.
Previously, Heeren et al. (2012)[22] utilized resistant and susceptible lines with respect to both soybean aphid and SCN to study the interaction effect of soybean aphid and SCN in the field conditions. The effect of soybean aphid feeding on soybeans on the SCN reproduction was not observed in any of the soybean cultivars as the SCN eggs and aphid densities, less than 100 SCN eggs per 100 cc of soil and less than 10 aphids per plant for <10 days, respectively, were too low in some of the cultivars. We analyzed our data with respect to the aphid counts at 5 dpi, 15 dpi, and 30 dpi to see the trend on the SBA populations. At 5 dpi and 15 dpi, we could not observe a significant difference on the SBA counts between all types of treatments. However, at 30 dpi we observed a significant difference in the SBA counts between all types of treatments. The facilitation at lower herbivore densities and competition at higher herbivore densities might be the reason for differences in the population densities of aphids depending on the length of experiment [34,35]. Particularly, we observed 90% decrease in susceptible plants and 25% decrease in aphid counts receiving SCN in resistant plants. The decline in the SBA populations compared to the plants that did not receive SCN might be due to competition for food resources as both herbivores absorb nutrient assimilates via phloem and affect each other [34,36]. A similar pattern was also observed in a study by McCarville et al. (2014)[6] as SBA populations declined at 30 d and 60 d experiments when infested with five and ten SBA.
The negative association between SCN reproduction and SBA abundance at 30 dpi aligns with broader evidence that root herbivores/parasites can suppress aboveground phloem feeders via plant-mediated changes. For example, Pratylenchus penetrans infection in Brassica nigra reduced infestation by Pieris rapae [37]. Nematode infection reduced aphid fertility in grasses, attributed to altered phloem amino acids [38], and reduced offspring performance in Myzus persicae on Plantago lanceolata infected with P. penetrans [39]. Detrimental effects of nematodes on aphids have also been reported in Brassica systems [40] and in Ammophila arenaria with multiple nematode taxa [41]. Mechanistically, nematode-induced changes in leaf traits (e.g., cuticle waxes, leaf toughness, or water content) may reduce aphid suitability[42], and water stress can disproportionately affect phloem-feeding insects [43]. In addition, increased phenolics and related defense chemistry can contribute to reduced shoot herbivory [37,44,45]. Together, these studies support the interpretation that SCN infection can decrease SBA performance through systemic physiological and defensive shifts, while SBA effects on SCN depend strongly on host genotype and experimental context.

3.2. Time-Resolved Transcriptomes Reveal an Early Signaling Phase and a Late Metabolic/Redox Phase

We leveraged RNA-seq to characterize root transcriptional responses to SBA, SCN, and co-infestation at two time points (5 dpi and 30 dpi). RNA-seq provides sensitive and reproducible transcript measurements across broad dynamic ranges relative to conventional approaches [46]. To reduce analytical complexity and better capture temporal dynamics [47], 5 dpi and 30 dpi datasets were analyzed separately. Across analyses, early responses (5 dpi) were dominated by defense signaling and biosynthetic activities consistent with rapid recognition and response programs, whereas late responses (30 dpi) showed large-scale transcriptional reprogramming involving redox processes, carbohydrate metabolism, and secondary metabolism. The enrichment of hydrogen peroxide and reactive oxygen species-related processes specifically at 30 dpi is consistent with a shift toward oxidative stress and redox remodeling during sustained infestation, potentially reflecting longer-term defense activation and altered root physiology under chronic pest pressure.

3.3. Candidate Mechanisms for MN1806CN Resilience Under Combined SCN: SBA Pressure

In this study, identification of DEGs in resistant and susceptible cultivars was of prime importance particularly with the treatment that both SCN and SBA received to study the genes that are differentially expressed during the interaction. We did a comparison between and within the cultivars. Upon comparison, the discordant expression of genes particularly in resistant cultivar was considered important. In total, we found 4 and 100 discordantly expressed DEGs in resistant cultivar at 5dpi and 30 dpi, respectively. At 5dpi, Dirigent-like protein, 2OG-Fe (II) oxygenase superfamily), Exo70 exocyst complex subunit, and Proteasome component domain protein were differentially expressed in the resistant cultivar that received both SCN and SBA. Dirigent (DIR) -like protein are particularly induced in different kinds of biotic such as wounding and abiotic stresses ranging from drought, cold, abscisic acid (ABA), H2O2, salinity, and osmotic stress [48,49,50]. These proteins play a crucial role in plant defenses against pathogens and lignin and lignan formation [51]. A Dirigent-like protein (Glyma.03G044900) was upregulated by 8.04 log2foldchange at 5dpi. DIR-like proteins were also upregulated during feeding of spruce (Picea spp.) stem-by boring insects (i.e., white pine weevil, Pissodes strobi) in bark tissue and defoliating insects (i.e., western spruce budworm, Choristoneura occidentalis) in green apical shoots [48].
In soybean, GmDIR22 conferred resistance to Phytophthora sojae regulating lignan biosynthesis [52]. Another gene, Glyma.16g214400 that belonged to exocyst subunit exo70 family protein B1 was upregulated by 7.50 log2fold change. The exocyst subunit Exo70B1 interacts with soluble N-ethylmaleimide–sensitive factor attachment protein receptor (SNARE) complex protein SNAP in the process of vesicular trafficking which mediates the exocytosis [53,54]. Previously, the role of α-SNAP which is one of the important genes in Rhg1 mediated SCN resistance has been uncovered in SCN resistance in many studies [55,56,57,58]. SNAP protein involves in vesicle trafficking that affects the exocytosis of food in syncytium which in turn affects the nematode physiology[55]. Another important DEG is Glyma.13G147600 (2OG-Fe (II) oxygenase superfamily) which is down regulated by 3.59 log2fold change. 2OG-Fe(II) oxygenase superfamily that constitutes flavone synthase I (FNS I), flavonol synthase (FLS), anthocyanidin synthase (ANS) and flavanone 3β-hydroxylase (FHT) which play important role in flavonoid biosynthesis [59,60]. The remaining DEG, Glyma.20G089400 (Proteasome component domain protein) was also downregulated by 1.04 log2fold change. Plant proteasomes play important role in the auxin signaling pathway, oxidative stress and hypersensitive responses which are an important component of plant defenses[61,62].
At 30 dpi, we found 100 DEGs that were uniquely expressed in the resistant cultivar of which only 21 genes were upregulated. Particularly, Glyma.04G096400 showed high expression (20 log2fold change) which shows cysteine-type endopeptidase inhibitor activity and possess cystatin domain. The cystatins are basically low molecular weight proteins that inhibit various exogenous proteases or digestive enzymes of invasive pests and pathogens [63,64]. It has been demonstrated that the serine protease activity of H. glycines has been inhibited by cowpea trypsin Inhibitor (CpTI)[65]. Numerous studies on the expression of both native and transgenic cystatins have shown resistance to phytonematodes in a wide range of hosts [66]. The transgenic expression of rice cystatin in eggplant improved nematode resistance in eggplant against root knot nematode, Meloidoyne incognita [66]. Three DEGs belonged to cytochrome P450s [Glyma.03G160100 (CYP94B1), Glyma.10G115900 (CYP71B34), and Glyma.12G239100 (CYP712A1)]. CYP94-genes play important role in Jasmonic Acid signaling pathway via catalyzing the sequential ω-oxidation of JA-Ile [67]. Whereas CYP71 is involved in flavonoid biosynthesis in producing isoflavone and pterocarpan derivatives such as glyceollin in soybean in pathogen-infected tissues [68]. RNA-seq analysis of two Glycine soja genotypes, PI 424093 and PI 468396B, upon infestation by HG type 2.5.7 revealed upregulation of JA, including SA, and ET pathway [69]. Upon pathway enrichment of 100 DEGs, six genes (Glyma.01G046300, Glyma.09G128300, Glyma.09G162400, Glyma.11G000500 Glyma.14G175400, and Glyma.16G158100) were enriched for glucosyltransferase activity and four genes (Glyma.06G079900, Glyma.12G089800, Glyma.03G157800, and Glyma.13G191200) were enriched for calcium binding activity. Previously, the role of glucosyltransferase has been shown in Mi-mediated nematode resistance in tomato [70] which play an important role in carbohydrate and cell wall biosynthesis [71]. The involvement of calcium/calmodulin-mediated signaling has been shown in responses to H. glycines infection in G. soja [69].

3.4. Expression Patterns at SCN QTL-Linked Genes Support Known Resistance Biology

We examined DEGs that coincided with the 251 genes that were assessed from the SCN QTLs. Remarkably, we found three genes at 5 dpi and ten genes at 30 dpi located in SCN QTLs among common genes in comparisons of resistant versus susceptible cultivars. The main purpose was to find if the resistant cultivar, MN1806CN provides rhg1 and Rhg4 mediated resistance. Three genes Glyma.18G022400 (Transmembrane amino acid transporter protein), Glyma.18G022500 [soluble N-ethylmelaimide sensitive factor (NSF) attachment protein (GmSNAP18)], and Glyma.18G022700 (Wound-induced protein WI12) that were upregulated at both 5 and 30 dpi on all treatments are important for rhg1 mediated SCN resistance [55,56,57,72] Grunwald et al., 2022; [73]. We could not find Rhg4 gene as DEG at 5 dpi and was downregulated at 30 dpi in all treatments. This informs that resistant cultivar, MN1806CN might possess rhg1 mediated SCN resistance [18].

3.5. Pathway Enrichment Supports a Working Model Integrating Defense Signaling and Resource Dynamics

To understand the biological functions of the genes, PSGEA analysis was carried out. PSGEA analysis showed distinct enriched pathways at 5 dpi and 30 dpi. We observed an enrichment of Plant-pathogen Interaction, Ubiquitin mediated proteolysis, Phenylalanine, tyrosine and tryptophan biosynthesis, Cutin, suberin and wax biosynthesis, Alpha-Linolenic acid metabolism, fatty acid degradation pathways were enriched at 5 dpi. Plant-pathogen Interaction and Ubiquitin mediated proteolysis play important role in plant immunity. The interaction of plant and pathogen involves pathogen-associated molecular patterns (PAMPs) of pathogens by pattern-recognition receptors (PRRs) of host and are regulated by E3 ubiquitin ligase[62,74]. E3 ubiquitin ligase has been previously reported in involvement in phytonematodes such as Heterodera schachtii [75] and Globodera rostochiensis [76]. Phenylalanine, tyrosine, and tryptophan biosynthesis pathway are related to the shikimate pathway. It is shown that the chorismite mutase enzyme present in root-knot nematode and potato cyst nematode alter the shikimate pathway of the host plant [77]. Other pathways such as Cutin, suberin and wax biosynthesis, Alpha-Linolenic acid metabolism, and fatty acid degradation are related to pathways related to plant lipids which are important for the production of JA, cutins, and suberins in plant defense via wounding [78,79]. At 30 dpi, most of the pathways were related to carbohydrate metabolism, fatty acid metabolism including fatty acid biosynthesis, fatty acid elongation, Phenylpropanoid biosynthesis, isofalvonoid biosynthesis, and one carbon pool by folate. Phenylpropanoid biosynthesis and isoflavonoid biosynthesis pathways are particularly related to the metabolism that produces various compounds such as flavonoids, anthocynanins, lignin, suberin, salicylic acid, coumarins and furanocoumarins [60,80]. It has been shown that phloem-feeding-insect, whitefly Bemisia tabaci, when infested in Nicotiana tabacum activates the phenylpropanoid pathway [81]. We expect pathway for carbohydrate metabolism to be enriched at 30 dpi as SBA and SCN might be competing for the limited food resources of the plant [35,82,83]. The pathway one carbon pool by folate is related to folate-mediated one-carbon metabolism. It has been shown that the SHMT (GmSHMT08) gene was confirmed as the resistance gene at the Rhg4 locus that catalyzes methylene carbon of glycine to tetrahydrofolate (THF)[84,85]. GmSHMT08 changes its enzymatic properties in the resistant allele that negatively affects the folate homeostasis in the syncytium resulting in hypersensitive responses (HR) leading to programmed cell death (PCD) [26,84,86].

3.6. Practical Implications and Limitations

In summary, we presented several DEGs that were changed in the days after SCN and SBA infection during SCN susceptible and resistant soybean interactions. Many genes revealed various pathways and networks involved in the interaction effects of SCN and SBA on soybeans. Although a high number of genes were differentially expressed when compared between resistant and susceptible cultivars, however, the comparison within the cultivars exhibited the fewer DEGs conferring resistance against both SBA and SCN in resistant cultivar. One limitation of the experiment was the cultivar which was resistant to SCN was susceptible to SBA. Various GO enrichment and KEGG pathways identified several molecular mechanisms involved in SCN SBA interaction. The role of transcription factors in the SBA SCN interaction in several comparisons has been identified which can be used for future research and breeding for SCN and SBA in soybean. Further work warrants functional validation of identified DEGs.

4. Materials and Methods

4.1. Plant Material and Pest Populations

Two soybean cultivars were used: Williams 82 (PI 518671; SCN-susceptible) and MN1806CN (SCN-resistant to Heterodera glycines HG type 0/race 3). Soybean aphid (Aphis glycines) biotype 1 colonies were obtained from The Ohio State University and maintained on a susceptible soybean line (LD12-15838R). The SCN population used was HG type 0, defined by <10% reproduction on indicator lines and avirulence to major SCN resistance sources.

4.2. Greenhouse Experimental Design and Inoculation/Infestation

Experimental design, infestations, sampling, RNA extraction, library preparation, and sequencing are elaborated in the first Authors PhD dissertation work [87] and published as Data Descriptor [33]; key parameters are summarized here. A randomized complete block design (RCBD) was implemented with six blocks and factorial treatments defined by soybean genotype, soybean aphid (SBA) infestation, and soybean cyst nematode (SCN) infestation. For each genotype, treatments included control (no pests), SBA only, SCN only, and SCN+SBA. Cone-tainers were filled with a soil:sand mixture (3:1) prepared using construction sand and SCN-infested clay soil. Approximately 125 cc of mixture was added per cone-tainer (1.5″ diameter; 8.25″ depth; 164 cc volume). For SCN treatments, each cone-tainer received ~2,000 SCN eggs at planting. Cone-tainers (three seeds each) were placed into 2.0-gallon buckets filled with construction sand and maintained in a water bath to keep soil temperature between 26.7–28.9 °C to support SCN development (~30 d). Plants were grown under a 16 h light/8 h dark cycle and thinned to one plant per cone-tainer at the V2 stage. For SBA treatments, V2 plants were infested with 15 mixed-age SBA (biotype 1) using a fine-tip brush applied to the abaxial surface of the first trifoliate. Buckets were covered with mesh netting to prevent aphid movement among experimental units.

4.3. Aphid Counts and SCN Egg Quantification

Soybean aphid populations were counted on each plant at 5, 15, and 30 days post-infestation (dpi). SCN eggs were quantified at 30 dpi. For egg extraction, soil and roots were washed and the suspension was passed through an 850 µm sieve and retained on a 250 µm sieve. Females/cysts collected on the 250 µm sieve were macerated using a motorized rubber stopper to release eggs; eggs were recovered on a 25 µm sieve after passing through a 75 µm sieve. Eggs were suspended in 50 mL water and counted under a compound microscope using a 1 mL aliquot as a representative sub-sample.

4.4. Root Sampling, RNA Extraction, Library Preparation, and Sequencing

Whole-root tissue was collected at 5 and 30 dpi by snap-freezing in liquid nitrogen and storing at −80 °C. Frozen roots were ground to a fine powder in liquid nitrogen and total RNA extracted using the PureLink RNA Mini Kit (Invitrogen). RNA was DNase-treated (TURBO DNase, Invitrogen), integrity assessed by 1% agarose gel electrophoresis, and concentration measured using a NanoDrop 2000 (Thermo Fisher Scientific). cDNA libraries were prepared with the NEBNext Ultra II RNA Library Prep Kit (96 single index) and sequenced on an Illumina HiSeq 3000 platform (single-end, 100 bp) at the Iowa State University Sequencing Facility.

4.5. RNA-Seq Preprocessing, Mapping, Quantification, and Normalization

Raw read quality was assessed using FastQC (v0.11.3) and summarized with MultiQC (v1.3). Low-quality bases were removed with Btrim64 (v0.2.0) (quality threshold >20; 5-bp sliding window). High-quality reads were quantified by mapping to soybean primary coding sequences (Wm82.a2.v1; Phytozome) using Salmon (v0.9.1). Downstream analyses were conducted in iDEP (v0.81). Genes were filtered at ≥0.5 counts per million (CPM) in at least one sample, normalized using DESeq2, and transformed using DESeq2’s regularized log (rlog) for clustering/ordination.

4.6. Differential Expression and Candidate-Gene Analyses

Differentially expressed genes (DEGs) were identified using DESeq2 with |fold change| ≥ 2 and FDR ≤ 0.01. Effects of cultivar, treatment, and their interaction were tested using the model: expression ~ cultivar + treatment + cultivar: treatment. DEG annotations were obtained from SoyBase.

4.7. Co-Expression Networks, Functional Enrichment, and Motif Analysis

To reduce analytical complexity, count matrices were analyzed by time point for network analyses. Weighted gene co-expression networks were constructed in WGCNA using the top 2,000 most variable genes with soft-threshold power = 5 and minimum module size = 20. Functional enrichment of DEGs (GO terms and KEGG pathways) was performed using ShinyGO, REVIGO, and iDEP. Promoter motif enrichment was assessed by scanning 300 bp upstream regions of DEGs for transcription factor binding motifs (ShinyGO and iDEP). Pathway-level patterns were visualized using MapMan, with functional binning assigned via Mercator. PGSEA was used for gene set enrichment analyses with an FDR-based significance cutoff.

4.8. Statistical Analyses for Phenotypes

Aphid and SCN counts were analyzed in GraphPad Prism (v8.0.2). SCN egg counts (30 dpi) were analyzed by one-way ANOVA followed by Tukey’s multiple comparisons test. Aphid counts (5, 15, and 30 dpi) were analyzed using two-way ANOVA with the Geisser–Greenhouse correction, followed by Tukey’s multiple comparisons. Linear regression was used to evaluate relationships between SBA density and SCN egg counts at 30 dpi.

Author Contributions

S.N. conducted the experiments, performed the data analyses, and drafted the original manuscript. M.P.N. and A.J.V. conceived the project, designed the experiments, and revised the manuscript. All authors read and approved the final version of the manuscript.

Funding

The greenhouse experiments and RNA sequencing were funded through South Dakota Soybean Research and Promotion Council (SDSRPC-SA1800238) and USDA-NIFA Hatch Projects (SD00H659-18 and SD00H800-23) to MPN.

Data Availability Statement

All raw sequencing reads have been archived in the NCBI Sequence Read Archive (SRA) under accession range SRR8427366–SRR8427408, associated with BioProject PRJNA514200 (SRA study/Project ID: SRP178193). Untransformed transcript abundance values for every sample are available through the NCBI Gene Expression Omnibus (GEO) as GSE125103. In addition, the processed/transformed transcript abundance matrix, along with the hierarchical clustering outputs, correlation matrices, and cluster assignments, are publicly hosted on Figshare (https://doi.org/10.6084/m9.figshare.7755152.v3).

Acknowledgments

We acknowledge Emmanuel Byamukama (South Dakota State University) for providing H. glycines HG Type 0 infested soil as a source of SCN for the experiment.

Conflicts of Interest

The authors declare no conflicts of interest. The funders had no role in the design of the study; in the collection, analyses, or interpretation of data; in the writing of the manuscript; or in the decision to publish the results.

References

  1. Yu, X.; Yuan, F.; Fu, X.; Zhu, D. Profiling and relationship of water-soluble sugar and protein compositions in soybean seeds. Food chemistry 2016, 196, 776–782.
  2. USDA-ERS. United States Department of Agriculture Economic Research Service. Soybeans and Oil Crops. Available online: https://www.ers.usda.gov/topics/crops/soybeans-and-oil-crops (accessed on 30 December 2025).
  3. Hartman, G.; Domier, L.; Wax, L.; Helm, C.; Onstad, D.; Shaw, J.; Solter, L.; Voegtlin, D.; d’Arcy, C.; Gray, M. Occurrence and distribution of Aphis glycines on soybeans in Illinois in 2000 and its potential control. Plant Health Progr. doi 2001, 10.
  4. Wrather, J.A.; Koenning, S.R. Estimates of disease effects on soybean yields in the United States 2003 to 2005. Journal of nematology 2006, 38, 173.
  5. McCarville, M.T.; O’Neal, M.; Tylka, G.L.; Kanobe, C.; MacIntosh, G.C. A nematode, fungus, and aphid interact via a shared host plant: implications for soybean management. Entomologia Experimentalis et Applicata 2012, 143, 55–66.
  6. McCarville, M.T.; Soh, D.H.; Tylka, G.L.; O’Neal, M.E. Aboveground feeding by soybean aphid, Aphis glycines, affects soybean cyst nematode, Heterodera glycines, reproduction belowground. PloS one 2014, 9.
  7. Hill, C.; Chirumamilla, A.; Hartman, G. Resistance and virulence in the soybean-Aphis glycines interaction. Euphytica 2012, 186, 635–646.
  8. Koenning, S.R.; Wrather, J.A. Suppression of soybean yield potential in the continental United States by plant diseases from 2006 to 2009. Plant Health Progress 2010, 10.
  9. Niblack, T.; Lambert, K.; Tylka, G. A model plant pathogen from the kingdom animalia: Heterodera glycines, the soybean cyst nematode. Annu. Rev. Phytopathol. 2006, 44, 283–303.
  10. Olson, K.D.; Badibanga, T.M.; DiFonzo, C. Farmers’ awareness and use of IPM for soybean aphid control: report of survey results for the 2004, 2005, 2006, and 2007 crop years; 2008.
  11. Niblack, T.J.P.d. Soybean cyst nematode management reconsidered. 2005, 89, 1020–1026.
  12. Ragsdale, D.W.; Landis, D.A.; Brodeur, J.; Heimpel, G.E.; Desneux, N. Ecology and management of the soybean aphid in North America. Annual review of entomology 2011, 56, 375–399.
  13. Koch, R.L.; Potter, B.D.; Glogoza, P.A.; Hodgson, E.W.; Krupke, C.H.; Tooker, J.F.; DiFonzo, C.D.; Michel, A.P.; Tilmon, K.J.; Prochaska, T.J. Biology and economics of recommendations for insecticide-based management of soybean aphid. Plant Health Progress 2016, 17, 265–269.
  14. Varenhorst, A.J.; O’Neal, M.E. The response of natural enemies to selective insecticides applied to soybean. Environmental entomology 2012, 41, 1565–1574.
  15. Tylka, G.L. Understanding soybean cyst nematode HG types and races. Plant Health Progress 2016, 17, 149–151.
  16. Mitchum, M.G.; Wrather, J.A.; Heinz, R.D.; Shannon, J.G.; Danekas, G. Variability in distribution and virulence phenotypes of Heterodera glycines in Missouri during 2005. Plant Dis 2007, 91, doi:10.1094/pdis-91-11-1473.
  17. Hesler, L.S.; Chiozza, M.V.; O’neal, M.E.; MacIntosh, G.C.; Tilmon, K.J.; Chandrasena, D.I.; Tinsley, N.A.; Cianzio, S.R.; Costamagna, A.C.; Cullen, E.M. Performance and prospects of R ag genes for management of soybean aphid. Entomologia Experimentalis et Applicata 2013, 147, 201–216.
  18. Mitchum, M.G. Soybean resistance to the soybean cyst nematode Heterodera glycines: an update. Phytopathology 2016, 106, 1444–1450.
  19. Megías, A.G.; Müller, C. Root herbivores and detritivores shape above-ground multitrophic assemblage through plant-mediated effects. Journal of Animal Ecology 2010, 79, 923–931.
  20. Hong, S.; Donaldson, J.; Gratton, C. Soybean cyst nematode effects on soybean aphid preference and performance in the laboratory. Environmental Entomology 2010, 39, 1561–1569.
  21. Hong, S.; MacGuidwin, A.; Gratton, C. Soybean aphid and soybean cyst nematode interactions in the field and effects on soybean yield. Journal of Economic Entomology 2011, 104, 1568–1574.
  22. Heeren, J.; Steffey, K.; Tinsley, N.; Estes, R.; Niblack, T.; Gray, M. The interaction of soybean aphids and soybean cyst nematodes on selected resistant and susceptible soybean lines. Journal of applied entomology 2012, 136, 646–655.
  23. Lewis, M.T.; Poelstra, J.W.; Michel, A.P. Host plant flooding stress in soybeans differentially impacts avirulent and virulent soybean aphid (Aphis glycines) biotypes. Scientific Reports 2025, 15, 4897, doi:10.1038/s41598-025-87561-z.
  24. Qiu, S.; Wu, N.; Sun, X.; Xue, Y.; Xia, J. Chromosome-level genome assembly of soybean aphid. Scientific Data 2025, 12, 386.
  25. Hesler, L.S.; Beckendorf, E.A. Soybean aphids per plant among soybean lines containing various Rag genes. Ag Data Commons 2020.
  26. Lakhssassi, N.; Chhapekar, S.S.; Devkar, V.; Knizia, D.; El Baze, A.; Ye, H.; Vuong, T.; Patil, G.B.; Nguyen, H.T.; Meksem, K. Discovery of two tightly linked soybean genes at the qSCN10 (O) locus conferring broad-spectrum resistance to soybean cyst nematode. Communications Biology 2025, 8, 259, doi:10.1038/s42003-025-07633-8.
  27. Wang, H.; Li, Y.; Wang, X.; Liu, S.; Fan, F.; Qi, S.; Wang, M.; Jia, Y.; Chen, Q.; Duan, Y.; et al. Cyclo (Pro-Tyr) upregulates GmPOD53L to enhance soybean resistance to cyst nematode (Heterodera glycines Ichinohe). Frontiers in Plant Science 2025, Volume 16 - 2025, doi:10.3389/fpls.2025.1628555.
  28. Ghavami, N.; Tenuta, M.; Tenuta, A.; Lange, D. Survey and first report of the soybean cyst nematode (Heterodera glycines Ichinohe) in soybean fields in the province of Manitoba, Canada. Canadian Journal of Plant Pathology 2025, 47, 183–198, doi:10.1080/07060661.2024.2429537.
  29. Extention, I.S.U. Integrated Crop Management, Iowa State University Extension. SCN-resistant soybean varieties for 2025, including expanded Peking resistance sources. Available online: https://crops.extension.iastate.edu/cropnews/2024/10/scn-resistant-soybeans-varieties-2025-including-200-peking-resistance (accessed on December 30 2025).
  30. USDA-NIFA. USDA National Institute of Food and Agriculture. Detecting insecticide-resistant soybean aphids before field failures cost farmers. Project Information, mid-2020s. Available online: https://portal.nifa.usda.gov/web/crisprojectpages/1024320-detecting-insecticide-resistant-aphids-before-field-failures-cost-farmers.html (accessed on December 30 2025).
  31. Griffith, M.; Walker, J.R.; Spies, N.C.; Ainscough, B.J.; Griffith, O.L. Informatics for RNA sequencing: a web resource for analysis on the cloud. PLoS computational biology 2015, 11, e1004393.
  32. Shan, X.; Li, Y.; Jiang, Y.; Jiang, Z.; Hao, W.; Yuan, Y. Transcriptome profile analysis of maize seedlings in response to high-salinity, drought and cold stresses by deep sequencing. Plant molecular biology reporter 2013, 31, 1485–1491.
  33. Neupane, S.; Varenhorst, A.J.; Nepal, M.P. Transcriptome profiling of induced susceptibility effects on soybean–soybean aphid (Hemiptera: Aphididae) interaction. BMC Research Notes 2019, 12, 325, doi:10.1186/s13104-019-4372-3.
  34. Soler, R.; Erb, M.; Kaplan, I. Long distance root–shoot signalling in plant–insect community interactions. Trends in Plant Science 2013, 18, 149–156.
  35. Thompson, M.N.; Grunseich, J.M.; Marmolejo, L.O.; Aguirre, N.M.; Bradicich, P.A.; Behmer, S.T.; Suh, C.P.-C.; Helms, A.M. Undercover operation: belowground insect herbivory modifies systemic plant defense and repels aboveground foraging insect herbivores. Frontiers in Ecology and Evolution 2022, 10, 1033730.
  36. Topalović, O.; Bak, F.; Santos, S.; Sikder, M.M.; Sapkota, R.; Ekelund, F.; Nicolaisen, M.H.; Vestergård, M. Activity of root-knot nematodes associated with composition of a nematode-attached microbiome and the surrounding soil microbiota. FEMS Microbiology Ecology 2023, 99, fiad091.
  37. Van Dam, N.M.; Raaijmakers, C.E.; Van Der Putten, W.H. Root herbivory reduces growth and survival of the shoot feeding specialist Pieris rapae on Brassica nigra. Entomologia Experimentalis et Applicata 2005, 115, 161–170.
  38. Bezemer, T.; De Deyn, G.; Bossinga, T.; Van Dam, N.; Harvey, J.; Van der Putten, W. Soil community composition drives aboveground plant–herbivore–parasitoid interactions. Ecology Letters 2005, 8, 652–661.
  39. Wurst, S.; van der Putten, W.H. Root herbivore identity matters in plant-mediated interactions between root and shoot herbivores. Basic and Applied Ecology 2007, 8, 491–499.
  40. Hol, W.G.; De Boer, W.; Termorshuizen, A.J.; Meyer, K.M.; Schneider, J.H.; Van Dam, N.M.; Van Veen, J.A.; Van Der Putten, W.H.J.E.l. Reduction of rare soil microbes modifies plant–herbivore interactions. 2010, 13, 292–301.
  41. Vandegehuchte, M.L.; De La Peña, E.; Bonte, D.J.O. Interactions between root and shoot herbivores of Ammophila arenaria in the laboratory do not translate into correlated abundances in the field. 2010, 119, 1011–1019.
  42. Kuhlmann, F.; Müller, C. UV-B impact on aphid performance mediated by plant quality and plant changes induced by aphids. Journal of Plant Biology 2010, 12, 676–684.
  43. Huberty, A.F.; Denno, R.F. Plant water stress and its consequences for herbivorous insects: a new synthesis. Ecology 2004, 85, 1383–1398.
  44. Kaplan, I.; Halitschke, R.; Kessler, A.; Rehill, B.J.; Sardanelli, S.; Denno, R.F. Physiological integration of roots and shoots in plant defense strategies links above-and belowground herbivory. Ecology Letters 2008, 11, 841–851.
  45. Kutty, N.N.; Mishra, M. Dynamic distress calls: volatile info chemicals induce and regulate defense responses during herbivory. Frontiers in Plant Science 2023, 14, 1135000.
  46. Jiang, L.; Romero-Carvajal, A.; Haug, J.S.; Seidel, C.W.; Piotrowski, T. Gene-expression analysis of hair cell regeneration in the zebrafish lateral line. Proceedings of the National Academy of Sciences of the United States of America 2014, 111, E1383–E1392.
  47. Nissan, N.; Puchacz, N.; Hooker, J.C.; Ste-Croix, D.T.; Zapata, G.; Lefebvre, F.; Charette, M.; Golshani, A.; Cober, E.; Mimee, B. Dynamic transcriptomic responses to soybean cyst nematode infection in soybean genotypes with contrasting resistance profiles. Frontiers in Plant Science 2025, 16, 1618387.
  48. Ralph, S.G.; Jancsik, S.; Bohlmann, J. Dirigent proteins in conifer defense II: Extended gene discovery, phylogeny, and constitutive and stress-induced gene expression in spruce (Picea spp.). Phytochemistry 2007, 68, 1975–1991.
  49. Moura, J.C.M.S.; Bonine, C.A.V.; de Oliveira Fernandes Viana, J.; Dornelas, M.C.; Mazzafera, P. Abiotic and biotic stresses and changes in the lignin content and composition in plants. Journal of integrative plant biology 2010, 52, 360–376.
  50. Wu, R.; Wang, L.; Wang, Z.; Shang, H.; Liu, X.; Zhu, Y.; Qi, D.; Deng, X. Cloning and expression analysis of a dirigent protein gene from the resurrection plant Boea hygrometrica. Progress in Natural Science 2009, 19, 347–352.
  51. Effenberger, I.; Zhang, B.; Li, L.; Wang, Q.; Liu, Y.; Klaiber, I.; Pfannstiel, J.; Wang, Q.; Schaller, A. Dirigent proteins from cotton (Gossypium sp.) for the atropselective synthesis of gossypol. Angewandte Chemie International Edition 2015, 54, 14660–14663.
  52. Li, N.; Zhao, M.; Liu, T.; Dong, L.; Cheng, Q.; Wu, J.; Wang, L.; Chen, X.; Zhang, C.; Lu, W.J.F.i.p.s. A novel soybean dirigent gene GmDIR22 contributes to promotion of lignan biosynthesis and enhances resistance to Phytophthora sojae. 2017, 8, 1185.
  53. He, B.; Guo, W. The exocyst complex in polarized exocytosis. Current opinion in cell biology 2009, 21, 537–542.
  54. Yun, H.S.; Sul, W.J.; Chung, H.S.; Lee, J.H.; Kwon, C. Secretory membrane traffic in plant–microbe interactions. New Phytologist 2023, 237, 53–59.
  55. Cook, D.E.; Lee, T.G.; Guo, X.; Melito, S.; Wang, K.; Bayless, A.M. Copy number variation of multiple genes at Rhg1 mediates nematode resistance in soybean. Science 2012, 338, doi:10.1126/science.1228746.
  56. Bayless, A.M.; Smith, J.M.; Song, J.; McMinn, P.H.; Teillet, A.; August, B.K.; Bent, A. Disease resistance through impairment of α-SNAP–NSF interaction and vesicular trafficking by soybean Rhg1. 2016, 113, E7375–E7382.
  57. Cook, D.; Bayless, A.; Wang, K.; Guo, X.; Song, Q.; Jiang, J.; Bent, A.J.P.p. Distinct copy number, coding sequence and locus methylation patterns underlie Rhg1-mediated soybean resistance to soybean cyst nematode. 2014, pp. 114.235952.
  58. Mahmood, A.; Bilyeu, K.D.; Škrabišová, M.; Biová, J.; De Meyer, E.J.; Meinhardt, C.G.; Usovsky, M.; Song, Q.; Lorenz, A.J.; Mitchum, M.G. Cataloging SCN resistance loci in North American public soybean breeding programs. Frontiers in Plant Science 2023, 14, 1270546.
  59. Cheng, A.-X.; Han, X.-J.; Wu, Y.-F.; Lou, H.-X. The Function and Catalysis of 2-Oxoglutarate-Dependent Oxygenases Involved in Plant Flavonoid Biosynthesis. International Journal of Molecular Sciences 2014, 15, 1080–1095.
  60. Yang, Q.; Wang, G. Isoflavonoid metabolism in leguminous plants: an update and perspectives. Frontiers in Plant Science 2024, 15, 1368870.
  61. Suty, L.; Lequeu, J.; Lançon, A.; Etienne, P.; Petitot, A.-S.; Blein, J.-P. Preferential induction of 20S proteasome subunits during elicitation of plant defense reactions: towards the characterization of “plant defense proteasomes”. International Journal of Biochemistry and Cell Biology 2003, 35, 637–650.
  62. Liu, Y.; Jackson, E.; Liu, X.; Huang, X.; van der Hoorn, R.A.; Zhang, Y.; Li, X. Proteolysis in plant immunity. The Plant Cell 2024, 36, 3099–3115.
  63. Martínez, M.; Cambra, I.; González-Melendi, P.; Santamaría, M.E.; Díaz, I. C1A cysteine-proteases and their inhibitors in plants. Physiologia Plantarum 2012, 145, 85–94, doi:doi:10.1111/j.1399-3054.2012.01569.x.
  64. Meresa, B.K.; Matthys, J.; Kyndt, T. Biochemical Defence of Plants against Parasitic Nematodes. Plants 2024, 13, 2813.
  65. Lilley, C.; Urwin, P.; McPherson, M.; Atkinson, H. Characterization of intestinally active proteinases of cystnematodes. Parasitology 1996, 113, 415–424.
  66. Papolu, P.K.; Dutta, T.K.; Tyagi, N.; Urwin, P.E.; Lilley, C.J.; Rao, U. Expression of a Cystatin Transgene in Eggplant Provides Resistance to Root-knot Nematode, Meloidogyne incognita. Frontiers in Plant Science 2016, 7, doi:10.3389/fpls.2016.01122.
  67. Bruckhoff, V.; Haroth, S.; Feussner, K.; König, S.; Brodhun, F.; Feussner, I. Functional Characterization of CYP94-Genes and Identification of a Novel Jasmonate Catabolite in Flowers. PLOS ONE 2016, 11, e0159875, doi:10.1371/journal.pone.0159875.
  68. Latunde-Dada, A.O.; Cabello-Hurtado, F.; Czittrich, N.; Didierjean, L.; Schopfer, C.; Hertkorn, N.; Werck-Reichhart, D.; Ebel, J. Flavonoid 6-Hydroxylase from Soybean (Glycine maxL.), a Novel Plant P-450 Monooxygenase. 2001, 276, 1688–1695, doi:10.1074/jbc.M006277200.
  69. Zhang, H.; Kjemtrup-Lovelace, S.; Li, C.; Luo, Y.; Chen, L.P.; Song, B.-H. Comparative RNA-Seq Analysis Uncovers a Complex Regulatory Network for Soybean Cyst Nematode Resistance in Wild Soybean (Glycine soja). Scientific Reports 2017, 7, 9699.
  70. Schaff, J.E.; Nielsen, D.M.; Smith, C.P.; Scholl, E.H.; Bird, D.M. Comprehensive Transcriptome Profiling in Tomato Reveals a Role for Glycosyltransferase in Mi-Mediated Nematode Resistance. Plant Physiol. 2007, 144, 1079–1092, doi:10.1104/pp.106.090241%J Plant Physiology.
  71. Egelund, J.; Skjøt, M.; Geshi, N.; Ulvskov, P.; Petersen, B.L. A Complementary Bioinformatics Approach to Identify Potential Plant Cell Wall Glycosyltransferase-Encoding Genes. 2004, 136, 2609–2620, doi:10.1104/pp.104.042978%J Plant Physiology.
  72. Liu, S.; Kandoth, P.K.; Lakhssassi, N.; Kang, J.; Colantonio, V.; Heinz, R.; Yeckel, G.; Zhou, Z.; Bekal, S.; Dapprich, J.J.N.c. The soybean GmSNAP18 gene underlies two types of resistance to soybean cyst nematode. 2017, 8, 14822.
  73. Usovsky, M.; Gamage, V.A.; Meinhardt, C.G.; Dietz, N.; Triller, M.; Basnet, P.; Gillman, J.D.; Bilyeu, K.D.; Song, Q.; Dhital, B.; et al. Loss-of-function of an α-SNAP gene confers resistance to soybean cyst nematode. Nature Communications 2023, 14, 7629, doi:10.1038/s41467-023-43295-y.
  74. Macho, A.P.; Zipfel, C. Plant PRRs and the activation of innate immune signaling. Molecular cell 2014, 54, 263–272.
  75. Hewezi, T.; Piya, S.; Qi, M.; Balasubramaniam, M.; Rice, J.H.; Baum, T.J. Arabidopsis miR827 mediates post-transcriptional gene silencing of its ubiquitin E3 ligase target gene in the syncytium of the cyst nematode Heterodera schachtii to enhance susceptibility. Plant J. 2016, 88, 179–192, doi:doi:10.1111/tpj.13238.
  76. Walter, A.J.; Willforss, J.; Lenman, M.; Alexandersson, E.; Andreasson, E.J.E.J.o.P.P. RNA seq analysis of potato cyst nematode interactions with resistant and susceptible potato roots. 2018, 152, 531–539.
  77. Davis, E.L.; Hussey, R.S.; Mitchum, M.G.; Baum, T.J. Parasitism proteins in nematode–plant interactions. Current opinion in plant biology 2008, 11, 360–366.
  78. Howe, G.A. Jasmonates as signals in the wound response. Journal of Plant Growth Regulation 2004, 23, 223–237.
  79. Li, Y.; Beisson, F.; Koo, A.J.; Molina, I.; Pollard, M.; Ohlrogge, J.J.P.o.t.N.A.o.S. Identification of acyltransferases required for cutin biosynthesis and production of cutin with suberin-like monomers. 2007, 104, 18339–18344.
  80. Dixon, R.A.; Achnine, L.; Kota, P.; Liu, C.-J.; Reddy, M.S.S.; Wang, L. The phenylpropanoid pathway and plant defence—a genomics perspective. 2002, 3, 371–390, doi:doi:10.1046/j.1364-3703.2002.00131.x.
  81. Alon, M.; Malka, O.; Eakteiman, G.; Elbaz, M.; Moyal Ben Zvi, M.; Vainstein, A.; Morin, S. Activation of the Phenylpropanoid Pathway in Nicotiana tabacum Improves the Performance of the Whitefly Bemisia tabaci via Reduced Jasmonate Signaling. PLOS ONE 2013, 8, e76619, doi:10.1371/journal.pone.0076619.
  82. Li, Y.; Zhen, S.; Shan, S.; Sun, B.; Li, J.; Hu, F.; Cui, Q.; Zhang, L.; Gu, X.; Cheng, W. Modulation of above-belowground plant-herbivore interactions by entomopathogenic nematodes. Applied Soil Ecology 2020, 148, 103479.
  83. Thompson, M.N.; Grunseich, J.M.; Marmolejo, L.O.; Aguirre, N.M.; Bradicich, P.A.; Behmer, S.T.; Suh, C.P.-C.; Helms, A.M. Undercover operation: Belowground insect herbivory modifies systemic plant defense and repels aboveground foraging insect herbivores. Frontiers in Ecology and Evolution 2022, Volume 10 - 2022, doi:10.3389/fevo.2022.1033730.
  84. Liu, S.; Kandoth, P.K.; Warren, S.D.; Yeckel, G.; Heinz, R.; Alden, J. A soybean cyst nematode resistance gene points to a new mechanism of plant resistance to pathogens. Nature 2012, 492, doi:10.1038/nature11651.
  85. Ros, R.; Muñoz-Bertomeu, J.; Krueger, S.J.T.i.p.s. Serine in plants: biosynthesis, metabolism, and functions. 2014, 19, 564–569.
  86. Wu, X.-Y.; Zhou, G.-C.; Chen, Y.-X.; Wu, P.; Liu, L.-W.; Ma, F.-F.; Wu, M.; Liu, C.-C.; Zeng, Y.-J.; Chu, A.E.J.F.i.p.s. Soybean cyst nematode resistance emerged via artificial selection of duplicated serine hydroxymethyltransferase genes. 2016, 7, 998.
  87. Neupane, S. Identification and Characterization of Stress Responsive Genes in Soybean and Sunflower. Electronic Theses and Dissertations., South Dakota State University, Brookings, South Dakota 2019.
Figure 1. Soybean aphid (SBA) and soybean cyst nematode (SCN) responses. (a) SCN egg counts at 30 dpi following inoculation with ~2,000 SCN eggs in susceptible Williams 82 (PI 518671) and resistant MN1806CN soybean. (b) Relationship between total SCN eggs and total SBA counts at 30 dpi. (c) SBA (biotype 1) population size at 30 dpi following infestation with 15 aphids on each cultivar. Error bars indicate mean ± SEM. Significance: ns, P > 0.05; *, P ≤ 0.05; **, P ≤ 0.01; ***, P ≤ 0.001; ****, P ≤ 0.0001.
Preprints 192814 g001
Figure 2. Weighted gene co-expression network analysis (WGCNA) identified a network of 2,000 genes divided into seven co-expression modules in (a) 5 dpi samples, and a network of 1,994 genes divided into nine co-expression modules in (b) 30 dpi samples.
Preprints 192814 g002
Figure 3. Visualization of DEGs using MA plots and Venn diagrams obtained from the comparison of the DEGs between susceptible and resistant cultivars. a 5 dpi, b 30 dpi.
Preprints 192814 g003
Figure 4. Assessment of 242 genes overlapped in treatments with soybean cyst nematode (SCN), soybean aphid (SBA), and both SBA and SCN at 5 dpi in comparison of the DEGs between susceptible and resistant cultivars. a. Heatmap based on log2foldchange b. Enriched GO molecular functions c. Hierarchical tree representing enriched KEGG pathways d. A KEGG pathway representing Flavonoid Biosynthesis pathway with genes overrepresented.
Preprints 192814 g004
Figure 5. Assessment of 1535 DEGs overlapped in treatments with soybean cyst nematode (SCN), soybean aphid (SBA) at 30 dpi in comparison of the DEGs between susceptible and resistant cultivars. a. Heatmap based on log2foldchange b. Enriched GO biological processes c. Hierarchical tree representing enriched KEGG pathways d. A KEGG pathway representing Phenylpropanoid Biosynthesis pathway with genes overrepresented.
Preprints 192814 g005
Figure 6. Log2fold change of the DEGs coincident with SCN QTLs upon a comparison of the DEGs between susceptible and resistant cultivars. a. 5dpi b. 30 dpi.
Preprints 192814 g006
Figure 7. Gene Ontology (GO) molecular annotations overrepresented at a. 5 dpi b. 30 dpi upon PGSEA analysis. Red and blue indicate, higher and lower pathway activities, respectively.
Preprints 192814 g007
Figure 8. KEGG pathways overrepresented at a. 5 dpi b. 30 dpi upon PGSEA analysis. Red and blue indicate, higher and lower pathway activities, respectively.
Preprints 192814 g008
Figure 9. Expression profiles of a. ‘Plant Pathogen Interaction’ and b. ‘Cutine, Suberine and Wax Biosynthesis Pathway’ visualized on a KEGG diagram for SCN + SBA in resistant cultivar at 5 dpi. Red and green indicate genes induced and suppressed, respectively.
Preprints 192814 g009
Figure 10. Expression profiles of a. ‘Isoflavonoid biosynthesis’ and b. ‘One carbon pool by folate’ pathway visualized on a KEGG diagram for SCN + SBA in resistant cultivar at 30 dpi. Red and green indicate genes induced and suppressed, respectively.
Preprints 192814 g010
Table 1. List of four DEGs uniquely expressed in the resistant cultivar treated with SBA and SCN at 5 dpi.
Gene ID log2foldchange p-value Top Arabidopsis Hit Gene Description Gene Ontology Biological Process
Glyma.03g044900 8.04 7.16E-03 AT5G49040.1 Disease resistance-responsive (dirigent-like protein) family protein GO:0006952, GO:0009807
Glyma.13g147600 -3.59 6.27E-03 AT2G36690.1 2-oxoglutarate (2OG) and Fe(II)-dependent oxygenase superfamily protein GO:0009058, GO:0055114
Glyma.16g214400 7.50 4.90E-03 AT5G58430.1; ATEXO70B1, EXO70B1 exocyst subunit exo70 family protein B1 GO:0006887, GO:0006904, GO:0009738, GO:0035556
Glyma.20g089400 -1.04 2.81E-04 AT5G15610.2 Proteasome component (PCI) domain protein GO:0006302, GO:0006312, GO:0007062, GO:0007129, GO:0007131, GO:0008150, GO:0009560, GO:0009909, GO:0034968, GO:0042138, GO:0045132
Table 2. Enriched KEGG pathways in 100 DEGs uniquely expressed at 30 dpi samples treated with both SBA and SCN at 30 dpi in a resistant cultivar.
Enrichment FDR Genes in list Total genes Functional Category Genes
0.000104666 6 236 Quercetin 3-O-glucosyltransferase activity Glyma.01G046300, Glyma.09G128300, Glyma.09G162400, Glyma.11G000500, Glyma.14G175400, Glyma.16G158100
0.000104666 6 236 Quercetin 7-O-glucosyltransferase activity Glyma.01G046300, Glyma.09G128300, Glyma.09G162400 Glyma.11G000500, Glyma.14G175400, Glyma.16G158100
0.000894105 6 371 UDP-glucosyltransferase activity Glyma.01G046300, Glyma.09G128300, Glyma.09G162400 Glyma.11G000500, Glyma.14G175400, Glyma.16G158100
0.002120752 6 458 Glucosyltransferase activity Glyma.01G046300, Glyma.09G128300, Glyma.09G162400 Glyma.11G000500, Glyma.14G175400, Glyma.16G158100
0.004252586 6 544 UDP-glycosyltransferase activity Glyma.01G046300, Glyma.09G128300, Glyma.09G162400 Glyma.11G000500, Glyma.14G175400, Glyma.16G158100
0.027351491 6 812 Transferase activity, transferring hexosyl groups Glyma.01G046300, Glyma.09G128300, Glyma.09G162400 Glyma.11G000500, Glyma.14G175400, Glyma.16G158100
0.029538121 7 1139 Transferase activity, transferring glycosyl groups Glyma.01G046300, Glyma.09G128300, Glyma.09G162400 Glyma.11G000500, Glyma.14G175400, Glyma.16G158100, Glyma.20G004900
0.037769863 2 63 Protein-disulfide reductase activity Glyma.08G295600, Glyma.18G127400
0.049127578 2 78 Thioredoxin-disulfide reductase activity Glyma.08G295600, Glyma.18G127400
0.049127578 2 81 Oxidoreductase activity, acting on a sulfur group of donors, disulfide as acceptor Glyma.08G295600, Glyma.18G127400
0.049282369 4 478 Calcium ion binding Glyma.06G079900, Glyma.12G089800, Glyma.03G157800, Glyma.13G191200
Table 3. Enriched transcription factor (TF) binding motifs of DEGs in resistant cultivar treated with both SCN and SBA at 5 dpi and at 30 dpi. Distinct TF-family signatures were identified: at 5 dpi (242 shared DEGs), Homeodomain and Myb/SANT signals were prominent; at 30 dpi (1,535 shared DEGs), enrichment broadened to include AP2, B3, bHLH, bZIP, Myb/SANT, SBP, and TCP families. For the 100 resistant-unique DEGs at 30 dpi, enriched motifs included WRKY and bZIP among others (Supplementary File 14).
TF Motif TF family FDR TF Motif TF family FDR
5 dpi (Upregulated) 30 dpi (upregulated)
Glyma0041s00360.1 GCTGTCA Homeodomain 2.50E-02 Glyma03g04500.1 ATA TBP 1.50E-08
Glyma01g42410.1 GTCA Homeodomain 2.50E-02 Glyma08g08220.1 ACACGTG bZIP 2.80E-06
Glyma01g03450.1 GTCA Homeodomain 2.50E-02 Glyma19g30680.1 GACGTG bZIP 4.30E-06
Glyma03g39040.1 TGACGGC Homeodomain 2.50E-02 Glyma01g01740.1 ACGTGG bZIP 4.30E-06
Glyma01g43420.1 GTCAAC WRKY 3.00E-02 Glyma01g00600.1 GGATAA Myb/SANT 1.30E-05
Glyma01g43130.1 GTCAA WRKY 3.00E-02 Glyma01g38380.1 ACGTGGC bZIP 1.30E-05
Glyma07g36640.1 GTCAA WRKY 3.10E-02 Glyma13g43120.1 GGATAA Myb/SANT 1.30E-05
Glyma15g37120.1 GTCAA WRKY 3.20E-02 Glyma04g04170.1 ACACGTG bZIP 1.30E-05
Glyma02g45530.1 GTCAA WRKY 3.20E-02 Glyma06g01700.1 ATATAATT AT hook 1.90E-05
Glyma10g13720.1 GGTCAA WRKY 3.20E-02 Glyma09g06770.1 CACGTGT bHLH 1.90E-05
Glyma03g37870.1 GTCAAC WRKY 3.20E-02 Glyma02g00980.1 CACGTG bHLH 1.90E-05
Glyma02g15920.1 GTCAAC WRKY 3.20E-02 Glyma01g04610.1 CACGTG bHLH 2.60E-05
Glyma01g39600.1 GTCAAC WRKY 3.80E-02 Glyma01g39450.1 CCACGTG bHLH 4.30E-05
Glyma07g05660.1 TTACGTAA NAC/NAM 3.80E-02 Glyma01g39360.1 CACGTG bHLH 4.80E-05
Glyma01g00510.1 TGTCGG B3 4.40E-02 Glyma08g41620.1 GCCACGTG bHLH 4.80E-05
Glyma09g06980.1 GTCAAC WRKY 5.60E-02 Glyma06g41620.1 CACGTG bHLH 6.20E-05
Glyma01g06150.1 GTCAA NAC/NAM 5.60E-02 Glyma01g02250.1 CACGTG bHLH 6.50E-05
Glyma01g21020.1 TGACGTCA bZIP 5.60E-02 Glyma03g04500.1 GGAT Myb/SANT 6.50E-05
Glyma06g17690.1 GTCAAC WRKY 6.00E-02 Glyma08g08220.1 CACGTG bHLH 8.80E-05
Glyma04g06470.1 GTCAA WRKY 6.70E-02 Glyma19g30680.1 CGCGT CG-1 8.80E-05
Glyma05g36290.1 ATA TBP 1.50E-08
Glyma03g32740.1 ACACGTG bZIP 2.80E-06
Glyma05g31190.1 GACGTG bZIP 4.30E-06
30 dpi (down regulated)
Glyma09g06980.1 GTCAAC WRKY 6.30E-08
Glyma04g08060.1 GTCAA WRKY 6.30E-08
Glyma01g06870.1 GTCAAC WRKY 6.30E-08
Glyma03g04500.1 ATA TBP 1.20E-07
Glyma02g15920.1 GTCAAC WRKY 1.20E-07
Glyma01g43420.1 GTCAAC WRKY 2.00E-07
Glyma09g39040.1 GTCAA WRKY 2.00E-07
Glyma01g09010.1 CACGTG bHLH 2.60E-07
Glyma03g37870.1 GTCAAC WRKY 2.60E-07
Glyma19g30680.1 GACGTG bZIP 3.00E-07
Glyma05g07490.1 CACGTG bHLH 3.00E-07
Glyma01g43130.1 GTCAA WRKY 3.10E-07
Glyma02g01420.1 AGTCAACG WRKY 3.20E-07
Glyma09g39000.1 AGTCAA WRKY 3.20E-07
Glyma01g39600.1 GTCAAC WRKY 3.70E-07
Glyma03g32740.1 CACGTG bHLH 4.50E-07
Glyma02g45530.1 GTCAA WRKY 4.50E-07
Glyma02g00980.1 CACGTG bHLH 4.50E-07
Glyma01g05050.1 GTCAACG WRKY 4.70E-07
Glyma06g17690.1 GTCAAC WRKY 4.80E-07
Disclaimer/Publisher’s Note: The statements, opinions and data contained in all publications are solely those of the individual author(s) and contributor(s) and not of MDPI and/or the editor(s). MDPI and/or the editor(s) disclaim responsibility for any injury to people or property resulting from any ideas, methods, instructions or products referred to in the content.
Copyright: This open access article is published under a Creative Commons CC BY 4.0 license, which permit the free download, distribution, and reuse, provided that the author and preprint are cited in any reuse.
Prerpints.org logo

Preprints.org is a free preprint server supported by MDPI in Basel, Switzerland.

Subscribe

Disclaimer

Terms of Use

Privacy Policy

Privacy Settings

© 2026 MDPI (Basel, Switzerland) unless otherwise stated