
Submitted:
31 December 2025
Posted:
01 January 2026
You are already at the latest version
Abstract
Decision-making relies on coordinated neural dynamics that integrate sensory evidence with top-down control. In this EEG study, we examined sensor (scalp) -level theta and alpha-band oscillations, as well as fronto-parietal network connectivity, during a tactile spatial discrimination task. Blindfolded participants judged the lateral offset of the central dot of a three-dot array delivered to the right index finger while EEG was recorded. Time–frequency analyses revealed that both theta and alpha power were greater for correct than incorrect decision trials during pre-stimulus and post-stimulus intervals, suggesting enhanced preparatory and mnemonic engagement during accurate decisions. Directional connectivity assessed using block (multivariate) Granger causality demonstrated significantly stronger frontal to parietal influence in the theta band during both pre- and post-stimulus periods for correct decisions, supporting the role for long-range theta communication for top-down control in guiding tactile judgment. These findings highlight theta-band fronto-parietal communication as a key mechanism supporting successful tactile decision-making.
Keywords:
tactile stimuli
; decision-making
; fronto-parietal network
; theta oscillations
; alpha oscillations
1. Introduction
Decision-making is a cognitive process that integrates prior knowledge, sensory evidence, and expected value to produce a definitive choice aimed at accomplishing specific objectives [1]. Decision-making is an integral part of our daily lives and the brain regions involved in this process have therefore become a key focus of interest in cognitive neuroscience [2,3,4]. Decision-making processes have long been studied by psychologists, and neuroscientists both in animals and humans. With the advancement of neuroimaging tools, researchers are leaning more towards understanding the neural underpinnings and sub-processes involved in such behavioral processes [5,6,7]. Decision-making process have been extensively studied using visual stimuli [8,9], and auditory stimuli [10,11,12], however, we implemented a tactile stimuli which has been explored a lot less. Understanding the neural dynamics underlying tactile decisions might help us comprehend somatosensory processing, sensory-motor integration, and cognitive control that translates sensory inputs into behavioral responses.
Electroencephalography (EEG) provides a noninvasive and cost-effective approach with excellent temporal resolution, making it well suited for investigating neural dynamics. It has been widely used for studying decision-making processes [13,14] in different aspects. We are most interested in looking at sensor-level activity which contains rich neural information. A substantial body of research has established that neural oscillations in specific frequency bands play critical roles in cognitive control and decision-making processes [15,16,17,18]. Theta band (4-7 Hz) oscillations have been implicated in top-down preparation, cognitive control, and decision-making [19,20]. Alpha band oscillations (8-12 Hz) constitute the dominant rhythm in the human brain. They have been extensively linked to attention, information processing, working memory maintenance [21,22,23]. Recent studies have also linked alpha oscillations with decision-making [24,25,26]. Building on these findings, the present study investigates the timing, spatial distribution and influence of theta and alpha oscillations during tactile perceptual decision-making. We hypothesize that both theta and alpha power will mediate successful decision-making, reflecting their roles in cognitive control and attentional engagement during successful task performance.
Neuroimaging studies have also revealed the presence of large-scale, organized brain networks that play a critical role in supporting a wide range of functions [27,28,29].The involvement of the fronto-parietal network in visuospatial working memory has been consistently demonstrated across multiple neuroimaging studies [30,31,32]. In addition, a study examining complex value-based decision making reported notable activations within this network [33]. Evidence from a meta-analysis of functional magnetic resonance imaging studies further supports the role of the fronto-parietal network in perceptual decision-making [34]. Based on these findings, we hypothesize that fronto-parietal network interactions will play a key role in tactile decision-making and mediate decision accuracy.
2. Materials and Methods
2.1. Participants
The experiment involved 15 healthy right-handed participants (12 males, 3 females). Their ages were in the range of 18 to 42 years (mean = 24.7 years, standard deviation: 5.7 years). Two subjects had to be excluded from the final analysis due to excessive noise and artifacts in their data. Informed consent was collected from the participants and the original study [5] was approved by the Institutional Review Boards of Emory University and Georgia state University. The current study is the reanalysis of these deidentified EEG data recordings.
2.2. Tactile Stimulation
The experimental configuration closely followed that used in a previous fMRI study [35], with modifications appropriate for EEG acquisition. Tactile stimulation was delivered to the right index fingerpad using a pneumatically driven stimulator (Figure 1A), with the long axis of the stimulus array aligned along the finger. The stimulus consisted of a raised three-dot array mounted on a square base plate measuring 20 mm × 20 mm. The two outer dots were separated by 4 mm, while the central dot was offset by 1.94 mm to either the left or right of the line connecting the outer dots. All dots protruded 0.64 mm above the surface of the plate. During stimulation, the participant’s right index finger was immobilized in a supine (palmar-up) orientation using a finger mold mounted on the base of the stimulator. Thick, double-sided adhesive tape was used to secure the finger in place and served as padding to ensure comfort. A rotating disk mounted on the stimulator allowed the stimulus plate to be rotated by 180°, enabling rapid switching between leftward and rightward offsets. Care was taken to ensure that the stimulus array was precisely centered on the base plate so that rotation resulted in symmetric positioning of the two stimulus configurations. Each tactile stimulus was applied to the fingerpad for 1 s. After stimulus offset, participants had 2 s to respond with a left- or right-mouse click with their left hand to indicate whether the central dot was offset to the left or right (Figure 1B). Stimulation timing and sequence were controlled using a computer program written in Presentation (Neurobehavioral Systems, Albany, CA), which also provided accurate timing records for synchronization with EEG data acquisition. Throughout the experiment, participants were blindfolded and did not visually observe the stimuli at any point during the study.
2.3. Data Acquisition and Preprocessing
Before EEG acquisition, participants completed a practice session designed to familiarize them with the task. Practice trials were organized into blocks of 20, with leftward and rightward offsets occurring with equal probability. The practice session consisted of two such blocks. After EEG setup, participants received a brief explanation of the basic principles of EEG recording and were instructed on how to minimize the introduction of artifacts into the ongoing EEG signals. Continuous EEG data were acquired using a Neuroscan recording system equipped with a 68-channel electrode cap, sintered AgCl electrodes, and SynAmps2 amplifiers, sampled at 1000 Hz per channel (Neuroscan Systems, Charlotte, NC, USA). Signals were digitized with a 24-bit analog-to-digital resolution. The electrode cap was positioned according to standard cranial landmarks, and recording electrodes were referenced to the right mastoid. Electrode impedances were maintained below 10 kΩ. Data were collected across 30 blocks for 7 participants, 20 blocks for 5 participants, and 10 blocks for 3 participants. EEG data was preprocessed as such: EEG signals were band-pass filtered between 1 and 100 Hz and notch filtered to eliminate 60 Hz line noise. Data from malfunctioning electrodes were excluded and, when appropriate, replaced through spatial interpolation using signals from neighboring electrodes.
2.4. Data Analysis
The analysis of the preprocessed data consisted of the these steps: i) computation of ERPs, ii) visualization of oscillatory dynamics, iii) Time frequency analysis of oscillatory power, iv) frequency band power extraction, v) statistical analysis of oscillatory power using linear mixed effects model, vi) computation of multivariate granger causality based on the nonparametric [36] wavelet based spectral method. Details are provided below.
2.5. Event-Related Potentials (ERPs)
To examine stimulus-locked neural responses, we computed event-related potentials (ERPs) by averaging EEG data across trials and subjects. For each subject, trials within each experimental condition (Correct, Incorrect, Left, Right) were concatenated and averaged to obtain single-subject ERPs, which were then averaged across all 13 subjects to produce grand average waveforms. The Correct condition combined Left and Right correct trials, enabling comparison of both performance accuracy (Correct vs. Incorrect) and cue laterality (Left vs. Right).
2.6. Spatiotemporal Visualization of Oscillatory Dynamics
To visualize the spatiotemporal evolution of alpha and theta power across the scalp, we created time-frequency heatmaps for each experimental condition. Power values were averaged across all subjects and displayed as channel by time matrices spanning from -500 ms to 1000 ms. Each heatmap represented one condition, with color intensity indicating the magnitude of z-scored power. These visualizations allowed us to identify when and where condition-specific differences in oscillatory activity emerged across the electrode array, revealing both the temporal dynamics and spatial topography of frequency-band-specific neural responses to the experimental manipulations. We also created topographic scalp maps to better visualize the spatial distribution across all 68 electrode locations for each experimental condition and time window.
2.7. Time Frequency Analysis of Oscillatory Power
We performed time-frequency decomposition of the EEG data using continuous wavelet transform (CWT) with complex Morlet wavelets. The analysis computed spectral power across frequencies from 1-50 Hz for each trial, electrode, and experimental condition, following established wavelet analysis methods [37]. The classical baseline normalization was used which assumes that stimulus-induced brain activity adds linearly to ongoing baseline activity [38]. For each frequency, we computed the mean and standard deviation of power during the pre-stimulus period, then subtracted the baseline mean from all the time points and divided by the baseline standard deviation. This approach expresses stimulus-related power changes in units of standard deviations from baseline, enabling direct comparison of oscillatory responses across different frequency bands [39].
2.8. Frequency Band Power Extraction
To quantify oscillatory activity in specific frequency bands, we extracted theta (4-7 Hz) and alpha (8-12 Hz) power from the time-frequency decompositions for each subject and experimental condition. We computed band-specific power separately for two temporal windows of interest: a pre-stimulus baseline period (-500 ms to 0 ms) and a post-stimulus period (0 ms to 500 ms). These time-averaged power values were extracted for each condition (correct vs. incorrect decisions; left vs. right cue presentations) and visualized using violin plots after applying a signed-log transformation to display the distribution of power values across subjects and channels. All statistical analyses were performed on the original z-scored data.
2.9. Statistical Analysis Using Linear Mixed-Effects Models
To test for statistically significant differences in theta and alpha power between experimental conditions we employed linear mixed-effects (LME) model. The model included Condition (e.g., Correct vs. Incorrect) as a fixed effect, with random intercepts for both Subject and Channel to account for baseline differences in power across individuals and electrode locations. This approach controls for non-independence in the data arising from repeated measures within subjects and across channels [40]. The statistical significance of condition effects was evaluated using the p-values associated with the fixed-effect coefficients, with α = 0.05 as the significance threshold. This modeling framework allowed us to make valid statistical inferences while appropriately accounting for the nested structure of EEG data.
2.10. Block Granger Causality and Coherence Analysis
For understanding the directional information flow between frontal and parietal regions for different conditions and neural oscillations, we performed block Granger causality [41,42,43] analysis on EEG signals from frontal (channels 11, 12, 13) and parietal (channels 50, 51, 52) electrode clusters. Spectral Granger causality measures the directional influence from one region to another [44,45], while block coherence between the two regions reflects frequency-specific inter-regional synchrony between oscillatory neuronal processes. We used the nonparametric method which avoids potential model misspecification issues. We analyzed connectivity patterns separately for pre-stimulus baseline (-500 to 0 ms) and post-stimulus response (0 to 500 ms) time windows, focusing on theta (4-7 Hz) and alpha (8-12 Hz) frequency bands that have been implicated in cognitive processing and decision-making. These analyses were performed independently for each experimental condition (Correct decisions, Incorrect decisions, Left cues, Right cues) to examine how long-range communication patterns differ across behavioral outcomes and stimulus types. This block-based approach captures coordinated activity across multiple channels within each region, providing a theoretically elegant estimate of long-range neural activity.
3. Results
3.1. Group-Level Average Event-Related Potentials (ERPs)
The grand-averaged ERP waveforms at a single electrode (FCz) for correct versus incorrect trials and for left versus right responses are representative of patterns observed across the scalp, with similar condition-dependent modulations (Supplementary Figure S1A,B). Both comparisons exhibit a similar overall waveform morphology, with clear stimulus-locked components following stimulus onset, with maximum activations around 200ms. In the correct–incorrect comparison, differences in waveform amplitude are evident in the post-stimulus interval, with the two conditions showing distinct temporal profiles. In contrast, the left–right comparison reveals largely overlapping ERP waveforms across the analyzed time window, with no pronounced separation in amplitude or timing.
3.2. Time-Frequency Analysis
The time–frequency representation of EEG activity at a single electrode (FCz), illustrates how spectral power evolves over time relative to stimulus onset (Supplementary Figure S1C). Increased power is primarily observed at lower frequencies (4-12 Hz) following stimulus presentation, while higher frequencies show comparatively weaker modulation across the time window.
3.3. Spatiotemporal Distribution of Oscillatory Power
Time-frequency analysis revealed distinct spatiotemporal patterns for both baseline corrected theta band (Figure 2A) and baseline corrected alpha band (Figure 2B) power across experimental conditions in the post-stimulus period
The Correct condition exhibited the strongest and most spatially widespread theta power, with peak activity concentrated around electrodes 38-42 immediately following stimulus onset, while the Incorrect condition showed comparatively weaker activation. Theta power distributions across all the electrodes for left correct and right correct conditions did not differ a lot.
Similarly, in the alpha band, the Correct condition exhibited the strongest alpha power, particularly around electrodes 25-35 during the 200 ms -500 ms window, while the Incorrect condition showed relatively weaker and more spatially restricted activation. Left and Right cue conditions displayed comparable alpha patterns. We also created topographic scalp maps (Figure 3) to better visualize the spatial distribution of theta and alpha power across all 68 electrode locations for each experimental condition and time window.
3.4. Baseline Spatiotemporal Power Distribution
We Analyzed the raw power for the ERPs which revealed distinct baseline spatiotemporal patterns for theta and alpha oscillations across all experimental conditions (Supplementary Figure S2). This approach is necessary since baseline normalization is done using the pre-stimulus window, thus z-scored power didn’t reveal any spatiotemporal dynamics in the pre-stimulus timeframe. In this case, theta band activity (4-7 Hz) showed more widespread baseline distribution across electrodes. Both alpha and theta power were elevated in Left and Right conditions. For alpha band activity (8-12 Hz), strong baseline power was evident in electrodes 60-68 (occipitoparietal regions) across all conditions, with Left and Right cue conditions showing particularly prominent activity during the pre-stimulus period (-500 to 0 ms). Topographic scalp maps (Supplementary Figure S3) were created for better visualization.
3.5. Statistical Analysis of Frequency-Band Power
To assess differences in theta and alpha power between experimental conditions, we employed linear mixed-effects (LME) models with spectral power as the dependent variable and Condition as a fixed effect. Random intercepts for both Subject and Channel were included to account for baseline differences in power across individuals and electrode locations. We tested comparisons between Correct vs. Incorrect decisions for theta band (Figure 4) and alpha band (Figure 5).We also tested Left vs. Right cue presentations for theta band (Supplementary Figure S4) and alpha band (Supplementary Figure S5). Statistical significance was evaluated at α = 0.05. This approach allowed us to test condition effects properly since observations from the same subject and same channel are not independent. Linear mixed-effects models revealed significant differences in oscillatory power between Correct and Incorrect decisions for both frequency bands and time windows. Pre-stimulus theta power was significantly higher for Correct compared to Incorrect trials ( p < 0.001), as was pre-stimulus alpha power (p < 0.05). Post-stimulus analysis showed even stronger effects, with Correct decisions exhibiting significantly greater theta power (p < 0.001) and alpha power (p < 0.001) than Incorrect decisions. In contrast, no significant differences were found between Left and Right cue presentations for either frequency band in pre-stimulus (theta: p = 0.842; alpha: p = 0.279) or post-stimulus (theta: p = 0.914; alpha: p = 0.861) windows, indicating that response accuracy was mediated by oscillatory activity rather than cue laterality. These findings suggest that enhanced theta and alpha power, both before and after stimulus onset, are associated with successful decision-making performance.
3.6. Analysis of Fronto-Parietal Network Activity
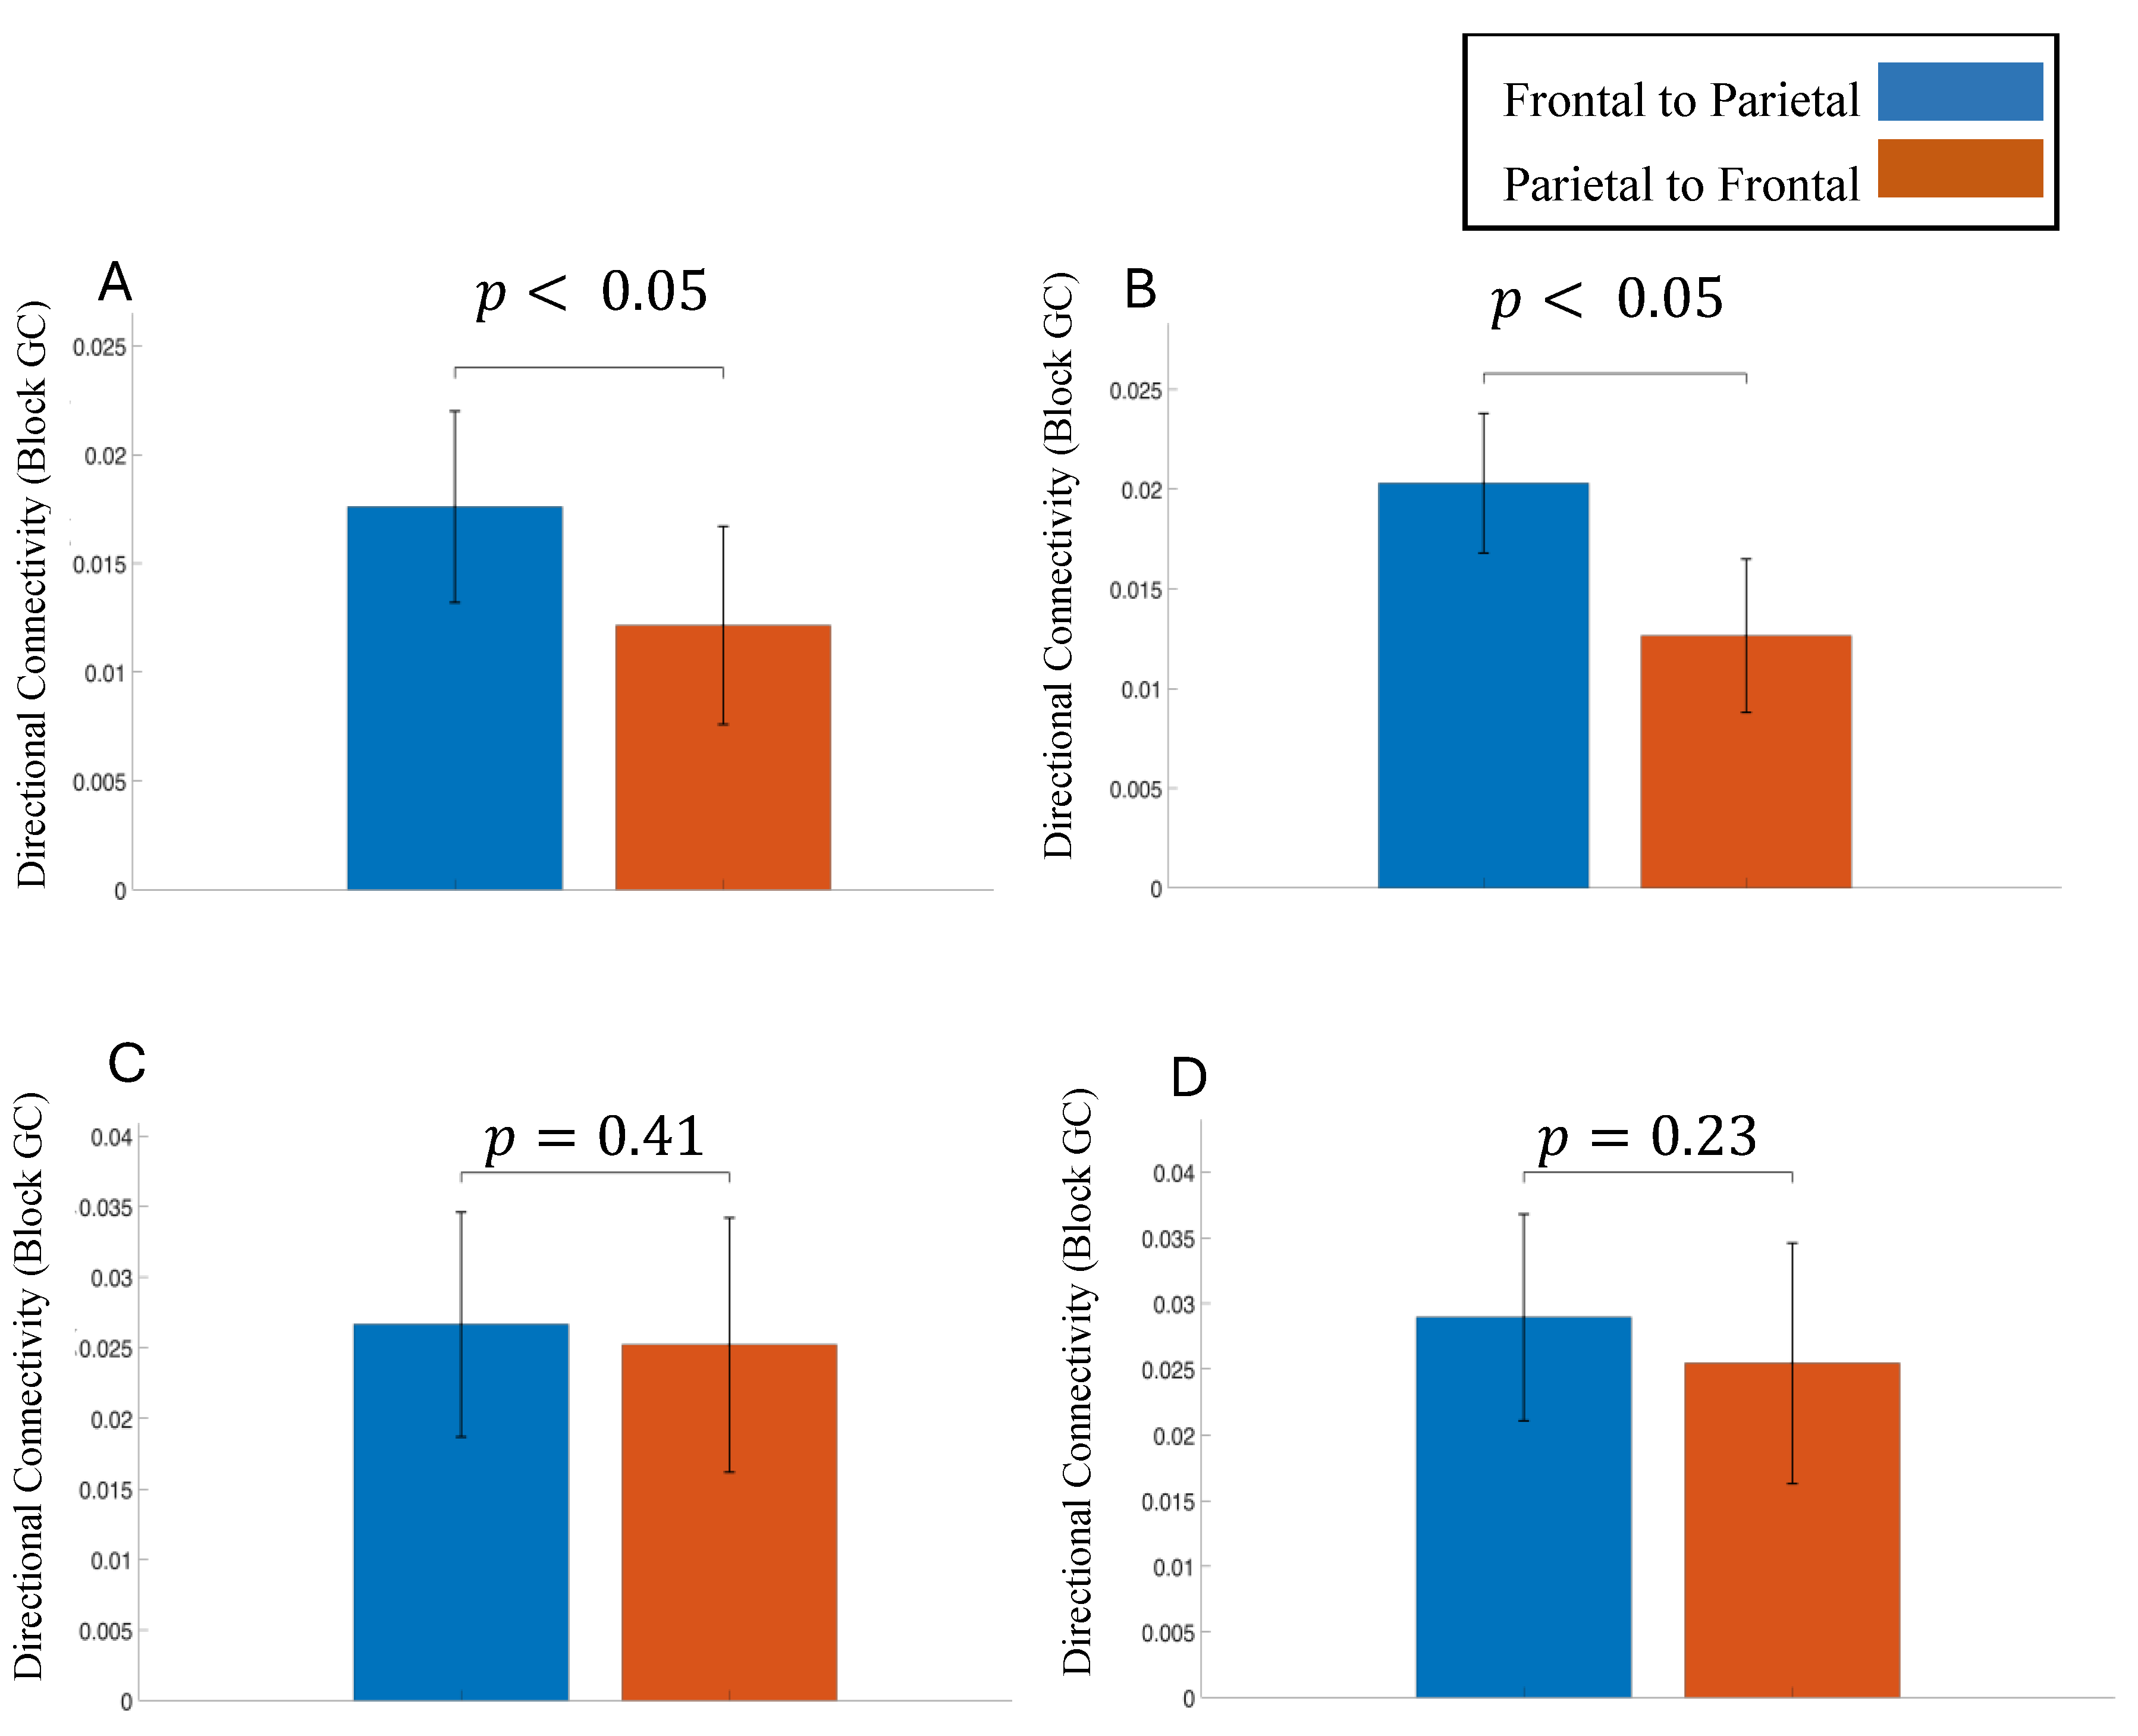
Block Granger causality analysis revealed systematic directional information flow between frontal and parietal cortical regions. In the theta band (4–7 Hz), directional flow was consistently stronger in the frontal to parietal direction compared with the parietal to frontal direction (Figure 6). This pattern was observed both before stimulus onset and during the post-stimulus decision period and was statistically significant for correct trials. A similar but weaker frontal-driven pattern was also present for incorrect trials in both time windows, although these differences did not reach statistical significance. In contrast, alpha-band (8–12 Hz) directional granger causality showed the opposite trend: parietal to frontal influence was greater than frontal to parietal influence during both pre- and post-stimulus intervals for correct and incorrect decisions (Supplementary Figure S6). However, these alpha-band directional differences were not statistically significant.
4. Discussion
We used a tactile discrimination task which provided us with a unique opportunity to study the neural oscillations and fronto-parietal network activity during tactile decision-making process. EEG data were analyzed using MATLAB-based wavelet spectral methods. Event-related potentials were first computed from –500 to 1000 ms, with 0 ms marking stimulus onset, and showed clear peaks around 200 ms. Time–frequency plots were then generated for each channel and condition, and they revealed maximum activity in the lower frequency bands. Neural activity was averaged across electrodes to quantify mean power per condition and identify regions showing maximal engagement during tactile discrimination. Theta and alpha power were assessed using violin plots and a linear mixed-effects model (LME). Comparisons included left-correct vs. right-correct trials and all-correct(combination of left correct and right correct trials) vs. all-incorrect trials for both pre-stimulus and post-stimulus windows.
Pre-stimulus theta power and alpha power was significantly higher for correct trials compared to incorrect trials. It is a well-established that alpha power tends to increase when a subject’s eyes are closed rather than open [46], and in our study this would make sense since the participants were blindfolded. Research has also shown that alpha power can increase when subjects are not engaged in a task and that led alpha oscillations to be termed as “idling” process of brain areas [47]. Other studies argue that alpha activity helps control information flow in the brain: higher alpha power is thought to suppress activity in areas that are not needed for the task, while lower alpha power reflects active processing [48,49,50]. However, some prior studies have found that pre-stimulus alpha activity has been shown to reflect a top-down preparatory state that shapes subsequent task performance and they also provide evidence for pre-stimulus theta band activity to have similar functionality [51,52,53,54,55,56]. Pre-stimulus theta power has also been linked to increased memory encoding [57]. A study that used the McGurk stimulus to understand the role of pre-stimulus aperiodic component combined with periodic power in shaping perceptual responses found that frontal periodic theta maybe linked enhanced cognitive control or a shift in sensory precision [58]. Based on our findings, we interpret the increased activity during correct trials in the theta and alpha band as enhanced readiness leading to more accurate tactile judgments. Time-frequency analysis clearly revealed alpha as the most dominant oscillation, which was expected, but the significant difference between correct and incorrect trials indicates a functional role for alpha oscillations during the decision-making process.
Post-stimulus theta and alpha were also higher for correct compared to incorrect trials. Previous studies have reported that alpha power during the working-memory retention period increases as working-memory load increases [59,60,61]. Because maintaining items in WM can support successful long-term memory formation, this suggests that alpha power during WM maintenance may be higher for items that are later remembered than for items that are later forgotten. Likewise, several studies have shown that theta power also rises with increasing WM load [62,63], and theta activity during encoding has been linked to later memory performance [64,65,66,67]. In our task, the elevated post-stimulus theta and alpha may reflect greater effort to build haptic memory of the stimulus, which in turn supported more accurate left/right decisions. Both theta and alpha power for left-correct and right-correct conditions did not differ significantly for any of the time windows.
We examined fronto-parietal network activity during correct and incorrect decisions, focusing on directional connectivity between frontal and parietal regions in the theta and alpha frequency bands. Previous studies have found that long-distance neuronal communication between brain regions during top-down control tasks—such as preparatory attention, cognitive control is mediated by theta-band activity [68,69,70]. Moreover, an fMRI study using a willed attention paradigm found that, attentional focus decisions made in frontal regions need to be relayed to parietal control areas to be carried out [71]. In our study , information flow was significantly stronger in the frontal to parietal direction compared with the parietal to frontal direction in both the pre-stimulus and post-stimulus intervals for correct decisions in the theta band. In line with previous studies, this stronger frontal to parietal interaction in the theta band indicates better long-range communication between the regions which led to correct choices. Frontal to parietal interaction was slightly higher than parietal to frontal interactions for incorrect decisions as well, but the difference was not statistically significant. Thus, long-range theta activity in the fronto-parietal network seems to be a mediator of successful tactile decision-making.
In the alpha band, we notice the opposite pattern, where parietal to frontal activity seems to be marginally stronger than frontal to parietal activity although not statistically different for either of the conditions or time-windows. Long-range alpha activity in the parietal to frontal direction did not play a crucial role in successful decision-making choices.
5. Conclusions
This study demonstrates that theta and alpha oscillations play critical roles in tactile perceptual decision-making. Elevated pre-stimulus theta and alpha power for correct trials suggests enhanced preparatory attentional states, while increased post-stimulus theta and alpha activity likely reflects working memory processes supporting accurate judgments. Crucially, we identified stronger frontal-to-parietal theta connectivity during correct decisions, indicating that top-down cognitive control from frontal regions to parietal areas mediates successful tactile discrimination. A key strength of this study is the integration of spectral power analysis with directional connectivity measures, providing insight into both local oscillatory dynamics and large-scale network communication during tactile decision-making. However, the relatively small sample size and use of a single tactile discrimination task may limit generalizability. Future research should examine whether these neural signatures extend to more complex tactile decisions involving multiple stimulus dimensions, explore beta and gamma band contributions to somatosensory decision processes, and investigate how individual differences in tactile sensitivity relate to oscillatory patterns and network dynamics.
Supplementary Materials
The following supporting information can be downloaded at: https://www.mdpi.com/article/doi/s1, Figure S1: Grand-averaged ERPs for an electrode, FCz. (A) correct (green) and incorrect (red) decision ERPs, (B) left correct (blue) and right correct (pink) decision trial ERPs. (C) Time–frequency representation of EEG activity at a single electrode FCz. Time–frequency map showing changes in spectral power for correct decisions as a function of time (ms) and frequency (Hz), time-locked to stimulus onset (0 ms), Figure S2: Raw oscillatory power of ERPs. (A) Theta band (4-7 Hz) power for all the 4 conditions: Correct, Incorrect, Left correct, Right correct; (B) Alpha band (8-12 Hz) power for all the 4 conditions: Correct, Incorrect, Left correct, Right correct; across all the electrodes (1-68), Figure S3: (A) Topographic Distribution of Raw Theta Power. Scalp topographies showing normalized theta band power for pre-stimulus (-500 ms to 0 ms) time window across experimental conditions. (B) Topographic Distribution of Raw Alpha Power. Scalp topographies showing normalized alpha band power for pre-stimulus (-500 ms to 0 ms) time window across experimental conditions, Figure S4: Baseline normalized average theta power of the pre-stimulus time-period (-500 ms to 0 ms) and post-stimulus time-period (0 ms to 500 ms) for left correct decisions vs right correct decision. The p-values represent the significance between condition pairs. The conditions are not significantly different from each other, Figure S5: Baseline normalized average alpha power of the pre-stimulus time-period (-500 ms to 0 ms) and post-stimulus time-period (0 ms to 500 ms) for left correct decisions vs right correct decision. The p-values represent the significance between condition pairs. The conditions are not significantly different from each other, Figure S6: Directional information flow between frontal and parietal cortical regions for alpha band. (A) Correct decisions pre-stimulus period, (B) Correct decisions post-stimulus period, (C) Incorrect decisions pre-stimulus period, (D) Incorrect decisions post-stimulus period.
Author Contributions
Conceptualization, P.M., S.A. and M.D. ; Methodology, P.M., S.A. and M.D. ; Validation, P.M. and M.D. ; Formal analysis, P.M. and S.A. ; Investigation, P.M. and S.A. ; Writing—original draft preparation, P.M. ; Writing—review and editing, P.M. and M.D. ; Visualization, P.M. and S.A. ; Supervision, M.D. ; Project administration, M.D. ; All authors have read and agreed to the published version of the manuscript.
Funding
This research received no external funding.
Institutional Review Board Statement
This study was approved by the Institutional Review Boards of Georgia state University and Emory University.
Informed Consent Statement
Informed consent was obtained from all subjects involved in the study.
Data Availability Statement
Data will be made available upon reasonable request.
Acknowledgments
We would like to acknowledge Dr. Bhim Adhikari for collecting the data and completing the initial preprocessing steps. We would like to thank Daniel Howard for his analytical guidance.
Conflicts of Interest
The authors declare no conflicts of interest.
References
- Gold, J.I.; Shadlen, M.N. The neural basis of decision making. Annu. Rev. Neurosci. 2007, 30, 535–574. [Google Scholar] [CrossRef]
- Schall, J.D. Neural basis of deciding, choosing and acting. Nature Reviews Neuroscience 2001, 2, 33–42. [Google Scholar] [CrossRef] [PubMed]
- Platt, M.L. Neural correlates of decisions. Current opinion in neurobiology 2002, 12, 141–148. [Google Scholar] [CrossRef] [PubMed]
- Ding, L.; Gold, J.I. The basal ganglia’s contributions to perceptual decision making. Neuron 2013, 79, 640–649. [Google Scholar] [CrossRef] [PubMed]
- Adhikari, B.M.; Sathian, K.; Epstein, C.M.; Lamichhane, B.; Dhamala, M. Oscillatory activity in neocortical networks during tactile discrimination near the limit of spatial acuity. NeuroImage 2014, 91, 300–310. [Google Scholar] [CrossRef]
- Diekhof, E.K.; Falkai, P.; Gruber, O. Functional neuroimaging of reward processing and decision-making: a review of aberrant motivational and affective processing in addiction and mood disorders. Brain research reviews 2008, 59, 164–184. [Google Scholar] [CrossRef]
- Dom, G.; Sabbe, B.; Hulstijn, W.; Van Den Brink, W. Substance use disorders and the orbitofrontal cortex: systematic review of behavioural decision-making and neuroimaging studies. The British Journal of Psychiatry 2005, 187, 209–220. [Google Scholar] [CrossRef]
- DeSalvo, M.N.; Douw, L.; Takaya, S.; Liu, H.; Stufflebeam, S.M. Task-dependent reorganization of functional connectivity networks during visual semantic decision making. Brain and behavior 2014, 4, 877–885. [Google Scholar] [CrossRef]
- Li, X.; Lu, Z.L.; D'Argembeau, A.; Ng, M.; Bechara, A. The Iowa gambling task in fMRI images. Human brain mapping 2010, 31, 410–423. [Google Scholar] [CrossRef]
- Kaiser, J.; Lennert, T.; Lutzenberger, W. Dynamics of oscillatory activity during auditory decision making. Cerebral cortex 2007, 17, 2258–2267. [Google Scholar] [CrossRef]
- Napoli, J.L.; Camalier, C.R.; Brown, A.-L.; Jacobs, J.; Mishkin, M.M.; Averbeck, B.B. Correlates of auditory decision-making in prefrontal, auditory, and basal lateral amygdala cortical areas. Journal of Neuroscience 2021, 41, 1301–1316. [Google Scholar] [CrossRef] [PubMed]
- Hein, G.; Alink, A.; Kleinschmidt, A.; Müller, N.G. Competing neural responses for auditory and visual decisions. PLoS One 2007, 2, e320. [Google Scholar] [CrossRef] [PubMed]
- Si, Y.; Li, F.; Duan, K.; Tao, Q.; Li, C.; Cao, Z.; Zhang, Y.; Biswal, B.; Li, P.; Yao, D. Predicting individual decision-making responses based on single-trial EEG. NeuroImage 2020, 206, 116333. [Google Scholar] [CrossRef] [PubMed]
- Cortes, P.M.; García-Hernández, J.P.; Iribe-Burgos, F.A.; Hernández-González, M.; Sotelo-Tapia, C.; Guevara, M.A. Temporal division of the decision-making process: An EEG study. Brain Research 2021, 1769, 147592. [Google Scholar] [CrossRef]
- Cohen, M.X.; Elger, C.E.; Fell, J. Oscillatory activity and phase–amplitude coupling in the human medial frontal cortex during decision making. Journal of cognitive neuroscience 2008, 21, 390–402. [Google Scholar] [CrossRef]
- Nácher, V.; Ledberg, A.; Deco, G.; Romo, R. Coherent delta-band oscillations between cortical areas correlate with decision making. Proceedings of the National Academy of Sciences 2013, 110, 15085–15090. [Google Scholar] [CrossRef]
- Siegel, M.; Engel, A.K.; Donner, T.H. Cortical network dynamics of perceptual decision-making in the human brain. Frontiers in human neuroscience 2011, 5, 21. [Google Scholar] [CrossRef]
- Sadaghiani, S.; Kleinschmidt, A. Brain networks and α-oscillations: structural and functional foundations of cognitive control. Trends in cognitive sciences 2016, 20, 805–817. [Google Scholar] [CrossRef]
- Cavanagh, J.F.; Frank, M.J. Frontal theta as a mechanism for cognitive control. Trends in cognitive sciences 2014, 18, 414–421. [Google Scholar] [CrossRef]
- Belchior, H.; Lopes-dos-Santos, V.; Tort, A.B.; Ribeiro, S. Increase in hippocampal theta oscillations during spatial decision making. Hippocampus 2014, 24, 693–702. [Google Scholar] [CrossRef]
- Klimesch, W. Alpha-band oscillations, attention, and controlled access to stored information. Trends in cognitive sciences 2012, 16, 606–617. [Google Scholar] [CrossRef] [PubMed]
- Cruz, G.; Melcón, M.; Sutandi, L.; Palva, J.M.; Palva, S.; Thut, G. Oscillatory brain activity in the canonical alpha-band conceals distinct mechanisms in attention. Journal of Neuroscience 2025, 45. [Google Scholar] [CrossRef]
- Wianda, E.; Ross, B. The roles of alpha oscillation in working memory retention. Brain and behavior 2019, 9, e01263. [Google Scholar] [CrossRef] [PubMed]
- Haegens, S.; Pathak, Y.J.; Smith, E.H.; Mikell, C.B.; Banks, G.P.; Yates, M.; Bijanki, K.R.; Schevon, C.A.; McKhann, G.M.; Schroeder, C.E. Alpha and broadband high-frequency activity track task dynamics and predict performance in controlled decision-making. Psychophysiology 2022, 59, e13901. [Google Scholar] [CrossRef] [PubMed]
- Lou, B.; Li, Y.; Philiastides, M.G.; Sajda, P. Prestimulus alpha power predicts fidelity of sensory encoding in perceptual decision making. Neuroimage 2014, 87, 242–251. [Google Scholar] [CrossRef]
- Wolff, A.; Gomez-Pilar, J.; Nakao, T.; Northoff, G. Interindividual neural differences in moral decision-making are mediated by alpha power and delta/theta phase coherence. Scientific reports 2019, 9, 4432. [Google Scholar] [CrossRef]
- Becerra, L.; Pendse, G.; Chang, P.-C.; Bishop, J.; Borsook, D. Robust reproducible resting state networks in the awake rodent brain. PloS one 2011, 6, e25701. [Google Scholar] [CrossRef]
- Power, J.D.; Cohen, A.L.; Nelson, S.M.; Wig, G.S.; Barnes, K.A.; Church, J.A.; Vogel, A.C.; Laumann, T.O.; Miezin, F.M.; Schlaggar, B.L. Functional network organization of the human brain. Neuron 2011, 72, 665–678. [Google Scholar] [CrossRef]
- Deco, G.; Jirsa, V.K.; McIntosh, A.R. Emerging concepts for the dynamical organization of resting-state activity in the brain. Nature reviews neuroscience 2011, 12, 43–56. [Google Scholar] [CrossRef]
- McEvoy, L.K.; Pellouchoud, E.; Smith, M.E.; Gevins, A. Neurophysiological signals of working memory in normal aging. Cognitive Brain Research 2001, 11, 363–376. [Google Scholar] [CrossRef]
- Sauseng, P.; Klimesch, W.; Doppelmayr, M.; Hanslmayr, S.; Schabus, M.; Gruber, W.R. Theta coupling in the human electroencephalogram during a working memory task. Neuroscience letters 2004, 354, 123–126. [Google Scholar] [CrossRef] [PubMed]
- Diwadkar, V.A.; Carpenter, P.A.; Just, M.A. Collaborative activity between parietal and dorso-lateral prefrontal cortex in dynamic spatial working memory revealed by fMRI. Neuroimage 2000, 12, 85–99. [Google Scholar] [CrossRef] [PubMed]
- Matsui, T.; Hattori, Y.; Tsumura, K.; Aoki, R.; Takeda, M.; Nakahara, K.; Jimura, K. Executive control by fronto-parietal activity explains counterintuitive decision behavior in complex value-based decision-making. NeuroImage 2022, 249, 118892. [Google Scholar] [CrossRef]
- Keuken, M.C.; Müller-Axt, C.; Langner, R.; Eickhoff, S.B.; Forstmann, B.U.; Neumann, J. Brain networks of perceptual decision-making: an fMRI ALE meta-analysis. Frontiers in human neuroscience 2014, 8, 445. [Google Scholar] [CrossRef] [PubMed]
- Stilla, R.; Deshpande, G.; LaConte, S.; Hu, X.; Sathian, K. Posteromedial Parietal Cortical Activity and Inputs Predict Tactile Spatial Acuity. The Journal of Neuroscience 2007, 27, 11091–11102. [Google Scholar] [CrossRef]
- Dhamala, M.; Rangarajan, G.; Ding, M. Analyzing information flow in brain networks with nonparametric Granger causality. NeuroImage 2008, 41, 354–362. [Google Scholar] [CrossRef]
- Torrence, C.; Compo, G.P. A Practical Guide to Wavelet Analysis. Bulletin of the American Meteorological Society 1998, 79, 61–78. [Google Scholar] [CrossRef]
- Tallon-Baudry, C.; Bertrand, O.; Wienbruch, C.; Ross, B.; Pantev, C. Combined EEG and MEG recordings of visual 40 Hz responses to illusory triangles in human. Neuroreport 1997, 8, 1103–1107. [Google Scholar] [CrossRef]
- Grandchamp, R.; Delorme, A. Single-trial normalization for event-related spectral decomposition reduces sensitivity to noisy trials. Frontiers in psychology 2011, 2, 236. [Google Scholar] [CrossRef]
- Barr, D.J.; Levy, R.; Scheepers, C.; Tily, H.J. Random effects structure for confirmatory hypothesis testing: Keep it maximal. Journal of Memory and Language 2013, 68, 255–278. [Google Scholar] [CrossRef]
- Nedungadi, A.G.; Ding, M.; Rangarajan, G. Block coherence: a method for measuring the interdependence between two blocks of neurobiological time series. Biological cybernetics 2011, 104, 197–207. [Google Scholar] [CrossRef] [PubMed]
- Rajagovindan, R.; Ding, M. Decomposing neural synchrony: toward an explanation for near-zero phase-lag in cortical oscillatory networks. Plos one 2008, 3, e3649. [Google Scholar] [CrossRef]
- Wang, X.; Chen, Y.; Bressler, S.L.; Ding, M. Granger causality between multiple interdependent neurobiological time series: blockwise versus pairwise methods. International journal of neural systems 2007, 17, 71–78. [Google Scholar] [CrossRef] [PubMed]
- Ding, M.; Chen, Y.; Bressler, S.L. Granger causality: basic theory and application to neuroscience. Handbook of time series analysis: recent theoretical developments and applications 2006, 437–460. [Google Scholar]
- Geweke, J. Measurement of linear dependence and feedback between multiple time series. Journal of the American statistical association 1982, 77, 304–313. [Google Scholar] [CrossRef]
- Berger, H. Über das elektroenkephalogramm des menschen. Archiv für psychiatrie und nervenkrankheiten 1929, 87, 527–570. [Google Scholar] [CrossRef]
- Pfurtscheller, G.; Stancak, A., Jr.; Neuper, C. Event-related synchronization (ERS) in the alpha band—an electrophysiological correlate of cortical idling: a review. International journal of psychophysiology 1996, 24, 39–46. [Google Scholar] [CrossRef]
- Klimesch, W.; Sauseng, P.; Hanslmayr, S. EEG alpha oscillations: the inhibition–timing hypothesis. Brain research reviews 2007, 53, 63–88. [Google Scholar] [CrossRef]
- Jensen, O.; Mazaheri, A. Shaping functional architecture by oscillatory alpha activity: gating by inhibition. Frontiers in human neuroscience 2010, 4, 186. [Google Scholar] [CrossRef]
- Jensen, O.; Bonnefond, M.; VanRullen, R. An oscillatory mechanism for prioritizing salient unattended stimuli. Trends in cognitive sciences 2012, 16, 200–206. [Google Scholar] [CrossRef]
- Min, B.-K.; Herrmann, C.S. Prestimulus EEG alpha activity reflects prestimulus top-down processing. Neuroscience letters 2007, 422, 131–135. [Google Scholar] [CrossRef] [PubMed]
- Angelakis, E.; Lubar, J.F.; Stathopoulou, S.; Kounios, J. Peak alpha frequency: an electroencephalographic measure of cognitive preparedness. Clinical Neurophysiology 2004, 115, 887–897. [Google Scholar] [CrossRef] [PubMed]
- Foxe, J.; Simpson, G.; Ahlfors, S. Parieto-occipital–10 Hz activity reflects anticipatory state of visual attention mechanisms; An International Journal for the Rapid Communication of Research in Neuroscience: Neuroreport, 1998; Volume 9, 17, pp. 3929–3933. [Google Scholar]
- Pfurtscheller, G. Event-related synchronization (ERS): an electrophysiological correlate of cortical areas at rest. Electroencephalography and clinical neurophysiology 1992, 83, 62–69. [Google Scholar] [CrossRef] [PubMed]
- Min, B.-K.; Park, J.Y.; Kim, E.J.; Kim, J.I.; Kim, J.-J.; Park, H.-J. Prestimulus EEG alpha activity reflects temporal expectancy. Neuroscience letters 2008, 438, 270–274. [Google Scholar] [CrossRef]
- Min, B.-K.; Park, H.-J. Task-related modulation of anterior theta and posterior alpha EEG reflects top-down preparation. BMC neuroscience 2010, 11, 79. [Google Scholar] [CrossRef]
- Guderian, S.; Schott, B.H.; Richardson-Klavehn, A.; Düzel, E. Medial temporal theta state before an event predicts episodic encoding success in humans. Proceedings of the National Academy of Sciences 2009, 106, 5365–5370. [Google Scholar] [CrossRef]
- Singh, V.A.V.; Kumar, V.G.; Banerjee, A.; Roy, D. Prestimulus Periodic and Aperiodic Neural Activity Shapes McGurk Perception. eneuro 2025, 12, ENEURO.0431-0424.2025. [Google Scholar] [CrossRef]
- Jensen, O.; Gelfand, J.; Kounios, J.; Lisman, J.E. Oscillations in the alpha band (9–12 Hz) increase with memory load during retention in a short-term memory task. Cerebral cortex 2002, 12, 877–882. [Google Scholar] [CrossRef]
- Klimesch, W.; Doppelmayr, M.; Schwaiger, J.; Auinger, P.; Winkler, T. Paradoxical'alpha synchronization in a memory task. Cognitive Brain Research 1999, 7, 493–501. [Google Scholar] [CrossRef]
- Schack, B.; Klimesch, W. Frequency characteristics of evoked and oscillatory electroencephalic activity in a human memory scanning task. Neuroscience letters 2002, 331, 107–110. [Google Scholar] [CrossRef]
- Gevins, A.; Smith, M.E.; McEvoy, L.; Yu, D. High-resolution EEG mapping of cortical activation related to working memory: effects of task difficulty, type of processing, and practice. Cerebral cortex (New York, NY: 1991) 1997, 7, 374–385. [Google Scholar]
- Jensen, O.; Tesche, C.D. Frontal theta activity in humans increases with memory load in a working memory task. European journal of Neuroscience 2002, 15, 1395–1399. [Google Scholar] [CrossRef] [PubMed]
- Klimesch, W.; Doppelmayr, M.; Russegger, H.; Pachinger, T. Encoding of new. Neuroreport 1996, 7, 1235–1240. [Google Scholar] [CrossRef] [PubMed]
- Klimesch, W.; Doppelmayr, M.; Schimke, H.; Ripper, B. Theta synchronization and alpha desynchronization in a memory task. Psychophysiology 1997, 34, 169–176. [Google Scholar] [CrossRef] [PubMed]
- Sederberg, P.B.; Kahana, M.J.; Howard, M.W.; Donner, E.J.; Madsen, J.R. Theta and gamma oscillations during encoding predict subsequent recall. Journal of Neuroscience 2003, 23, 10809–10814. [Google Scholar] [CrossRef]
- Nyhus, E.; Curran, T. Functional role of gamma and theta oscillations in episodic memory. Neuroscience & Biobehavioral Reviews 2010, 34, 1023–1035. [Google Scholar] [CrossRef]
- Von Stein, A.; Sarnthein, J. Different frequencies for different scales of cortical integration: from local gamma to long range alpha/theta synchronization. International journal of psychophysiology 2000, 38, 301–313. [Google Scholar] [CrossRef]
- Gulbinaite, R.; van Rijn, H.; Cohen, M.X. Fronto-parietal network oscillations reveal relationship between working memory capacity and cognitive control. Frontiers in human neuroscience 2014, 8, 761. [Google Scholar] [CrossRef]
- Sauseng, P.; Klimesch, W.; Gruber, W.R.; Birbaumer, N. Cross-frequency phase synchronization: a brain mechanism of memory matching and attention. Neuroimage 2008, 40, 308–317. [Google Scholar] [CrossRef]
- Liu, Y.; Hong, X.; Bengson, J.J.; Kelley, T.A.; Ding, M.; Mangun, G.R. Deciding where to attend: Large-scale network mechanisms underlying attention and intention revealed by graph-theoretic analysis. Neuroimage 2017, 157, 45–60. [Google Scholar] [CrossRef]
Figure 1.
Stimuli and Task Paradigm. (A) Stimuli: an MRI/EEG-compatible pneumatic stimulator. Stimuli were mounted face-down on the square stage at the bottom of the drive shaft. The finger mold used to immobilize the finger was mounted on the base of the device. (B) Task Paradigm: the central dot of a raised three-dot array was displaced either leftward or rightward. Tactile stimuli were delivered to the right index fingerpad using a pneumatically actuated stimulator for a duration of 1 s (on interval), after which participants provided their responses during a subsequent 2 s period (off interval).
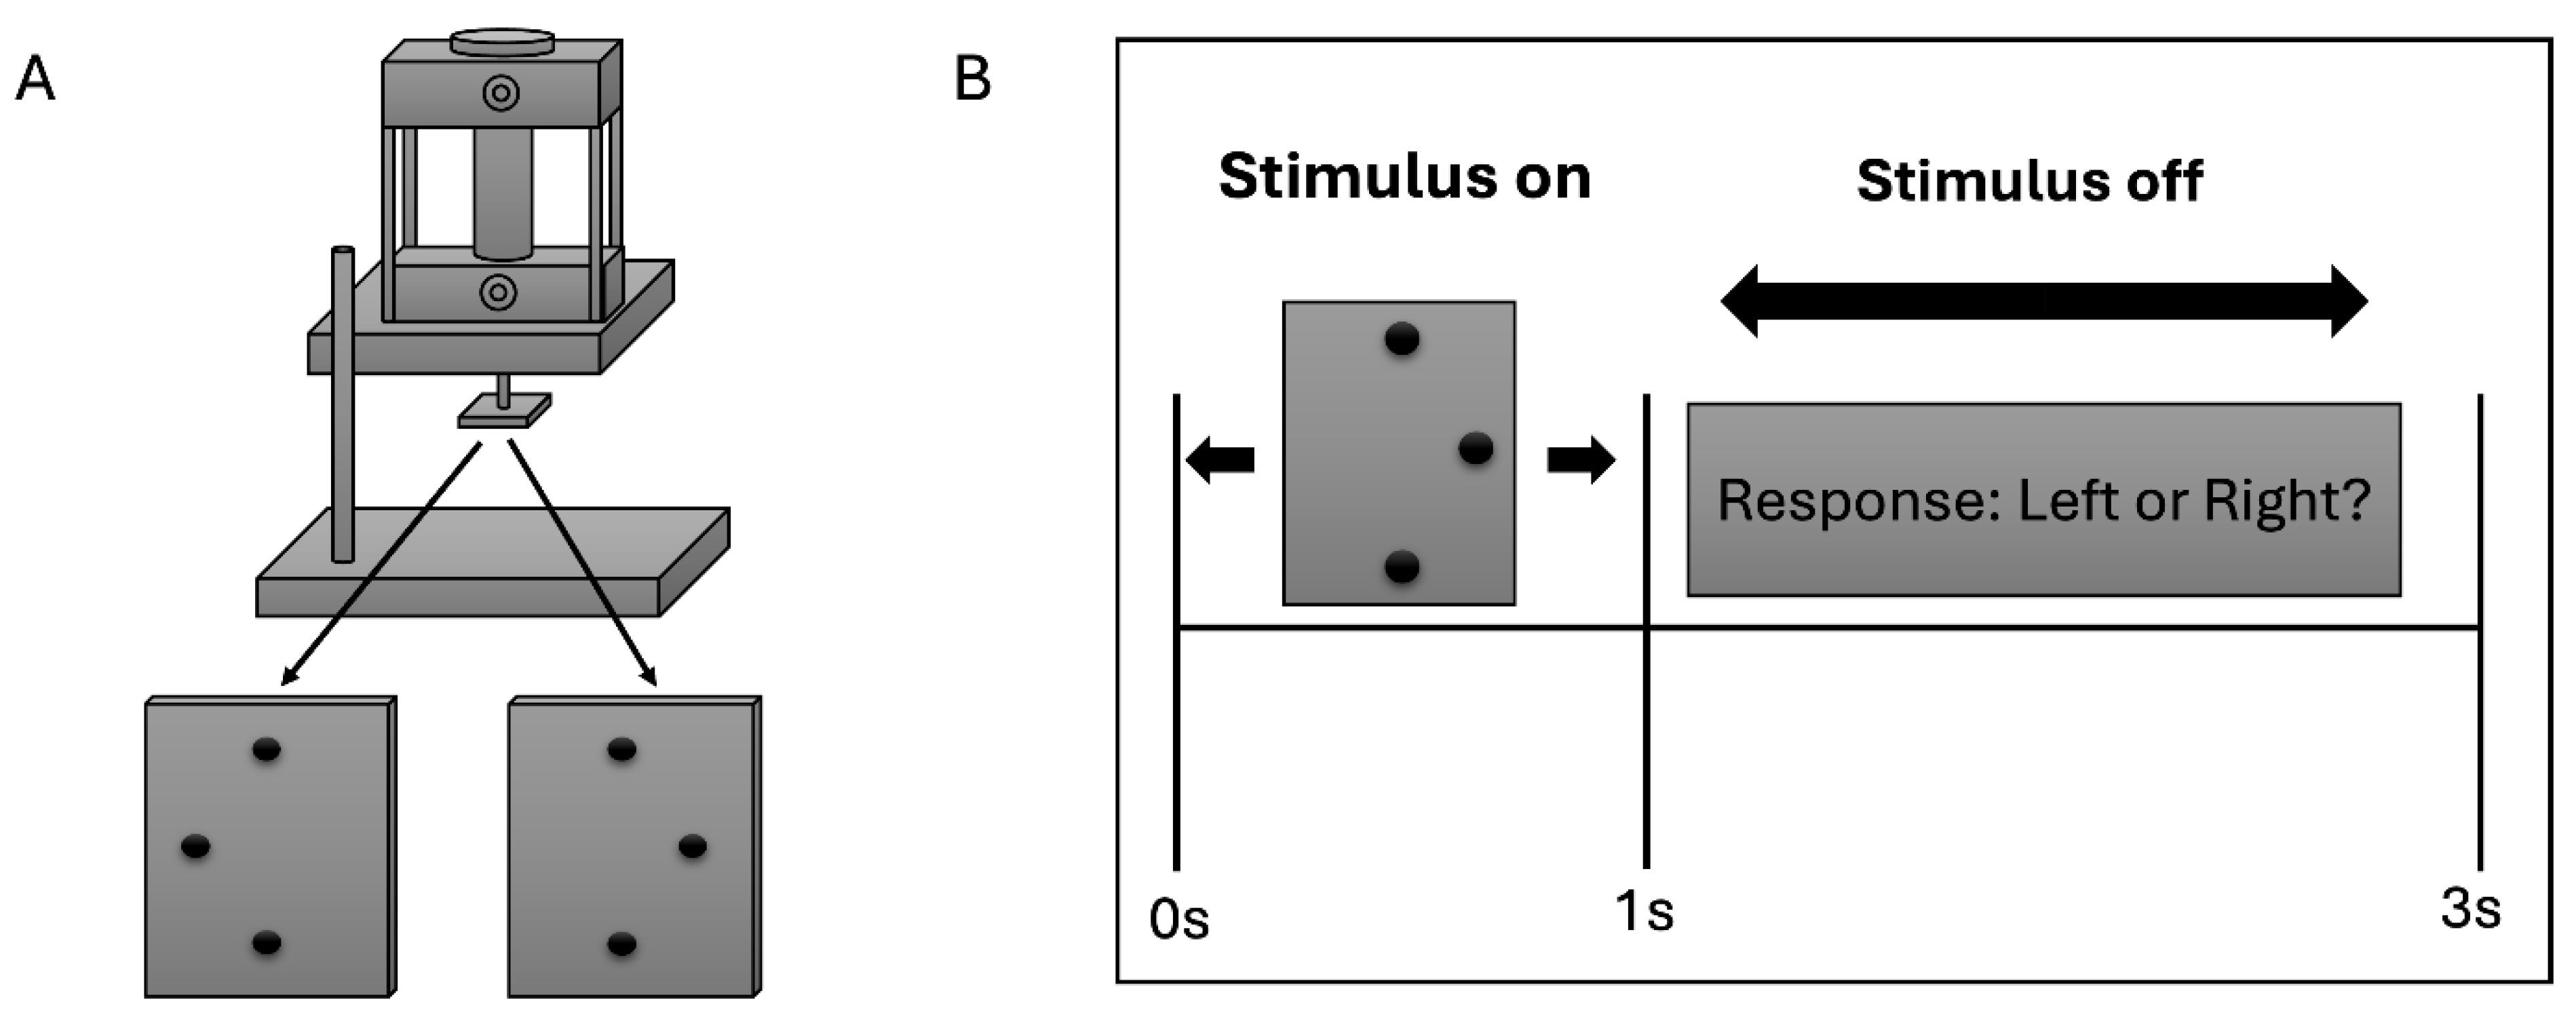
Figure 2.
Baseline normalized oscillatory power of ERPs. (A) Theta band (4-7 hz) power for all the 4 conditions: Correct, Incorrect, Left correct, Right correct; across all the electrodes (1-68); (B) Alpha band (8-12 hz) power for all the 4 conditions: Correct, Incorrect, Left correct, Right correct; across all the electrodes (1-68).
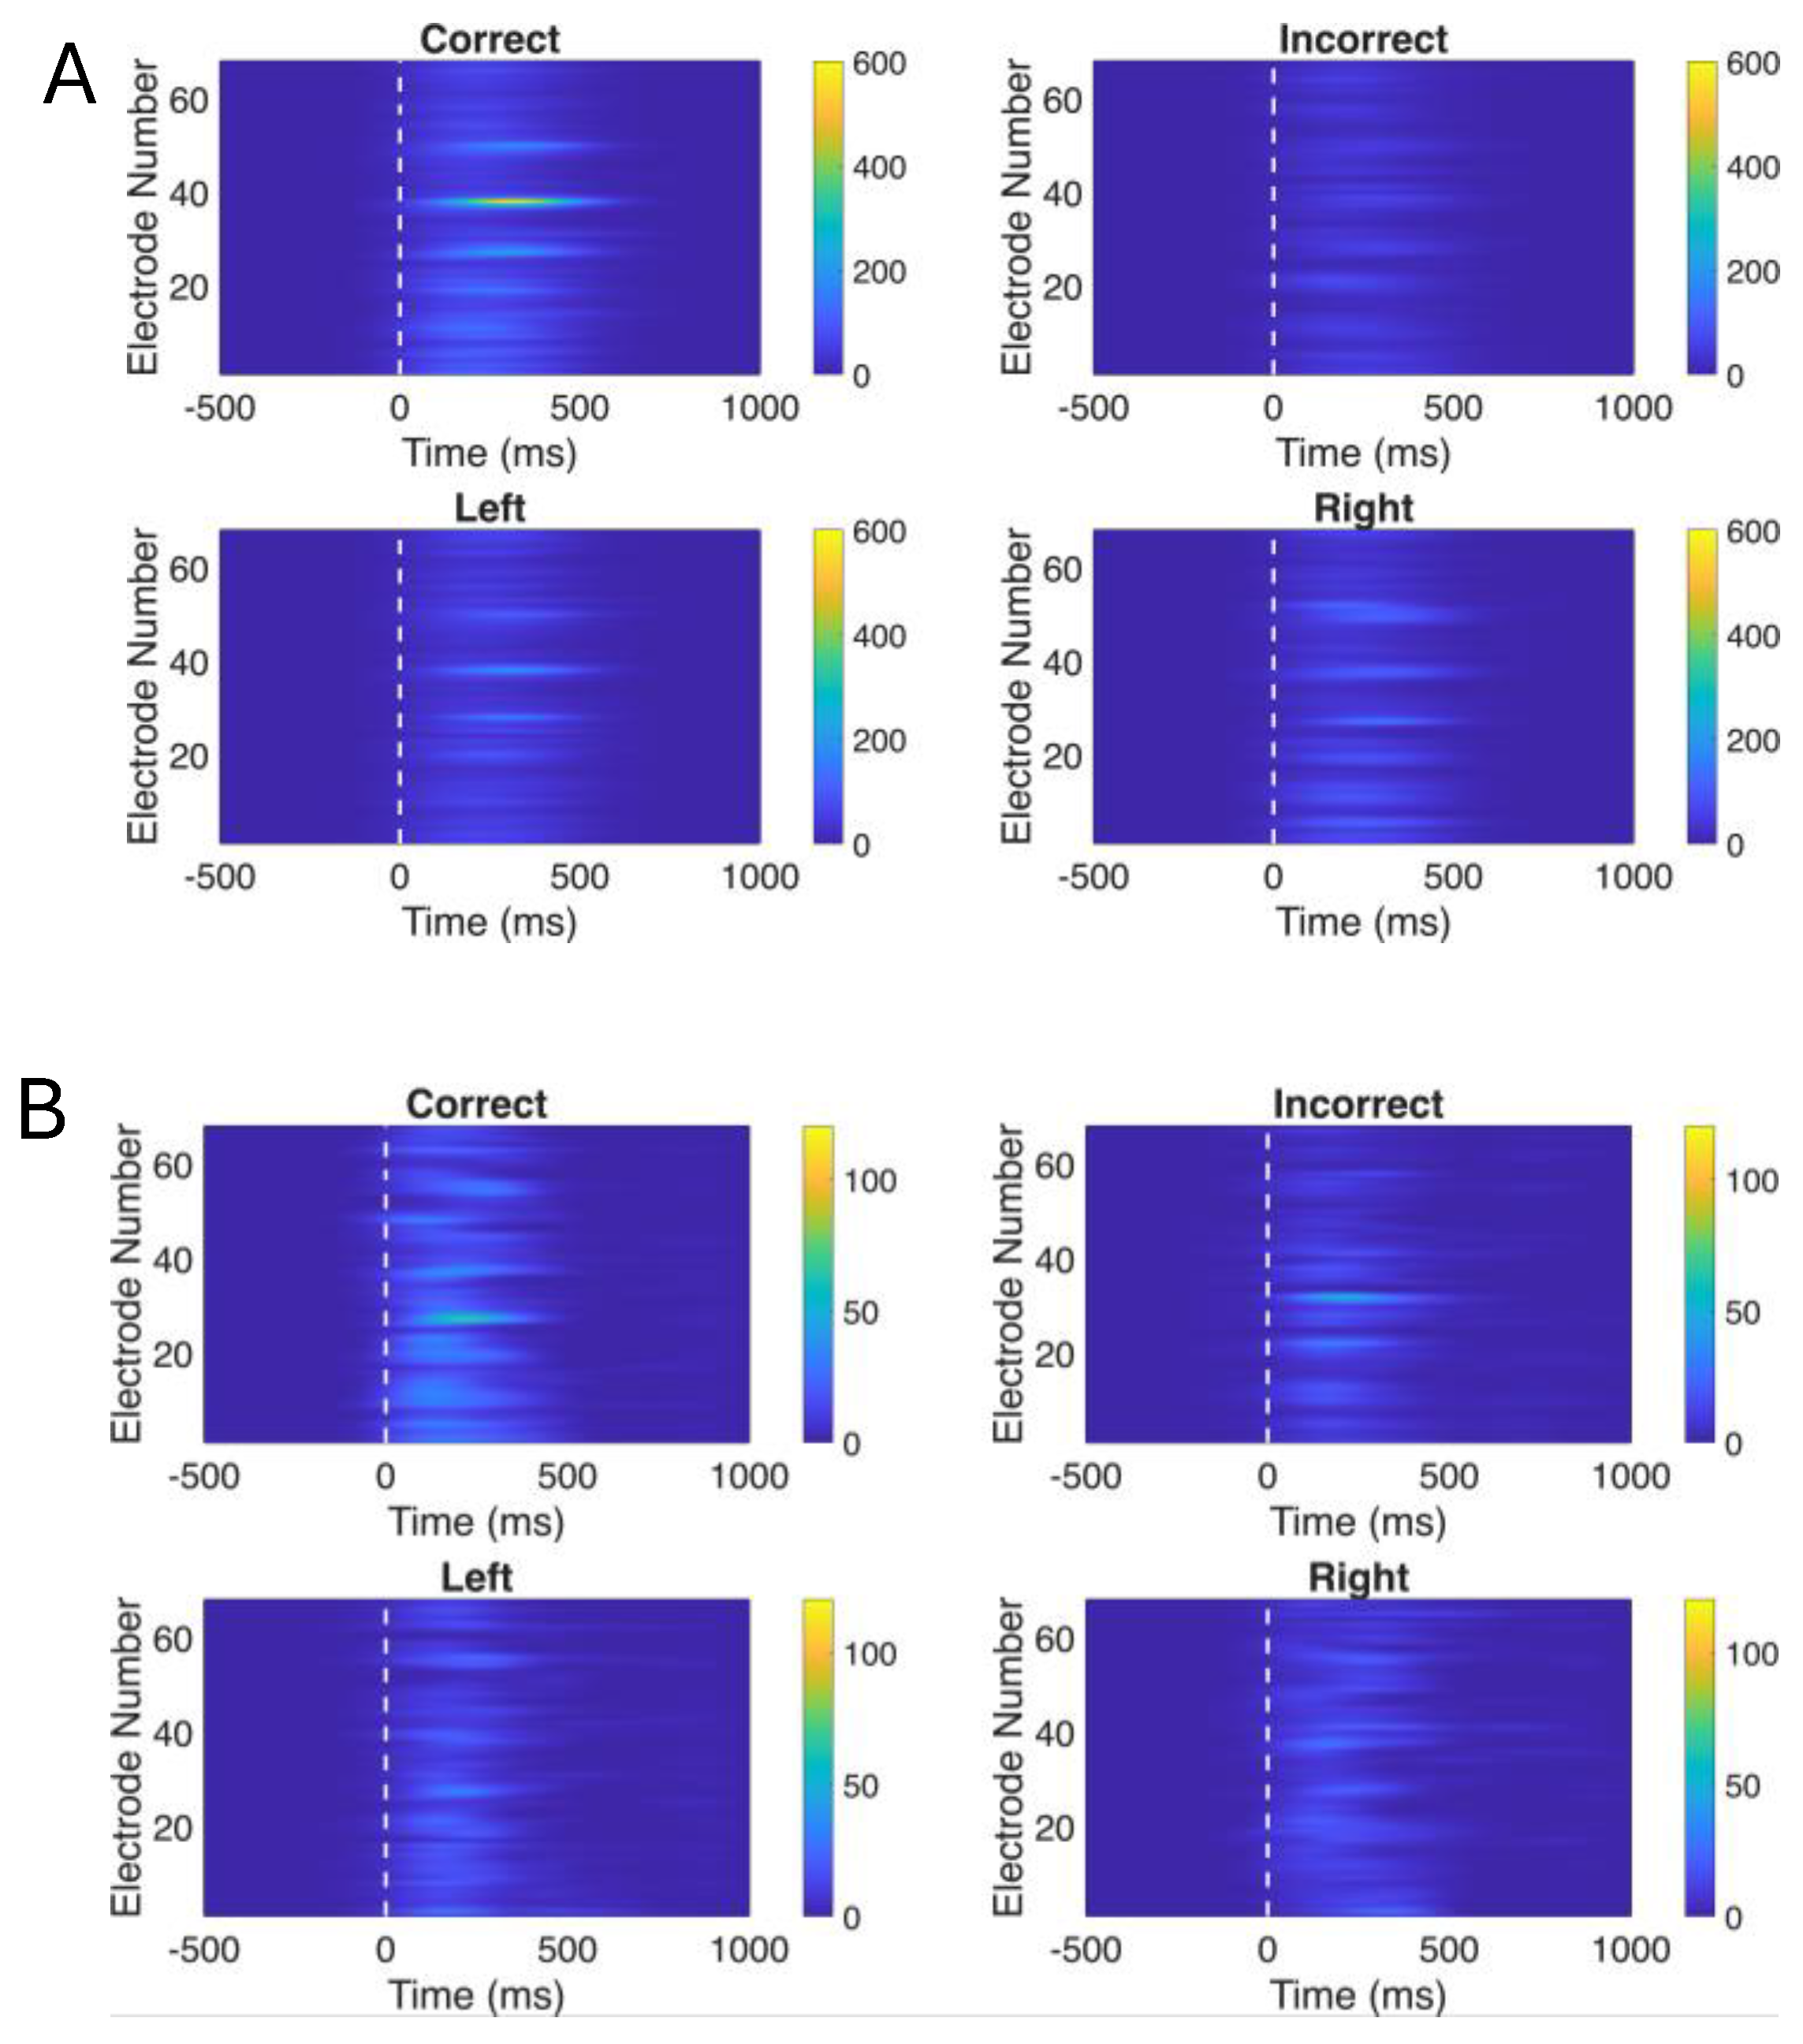
Figure 3.
(A)Topographic Distribution of Theta Power. Scalp topographies showing normalized theta band power for post-stimulus (0 ms to 500 ms) time window across experimental conditions. (B) Topographic Distribution of Alpha Power. Scalp topographies showing normalized alpha band power for post-stimulus (0 ms to 500 ms) time window across experimental conditions.
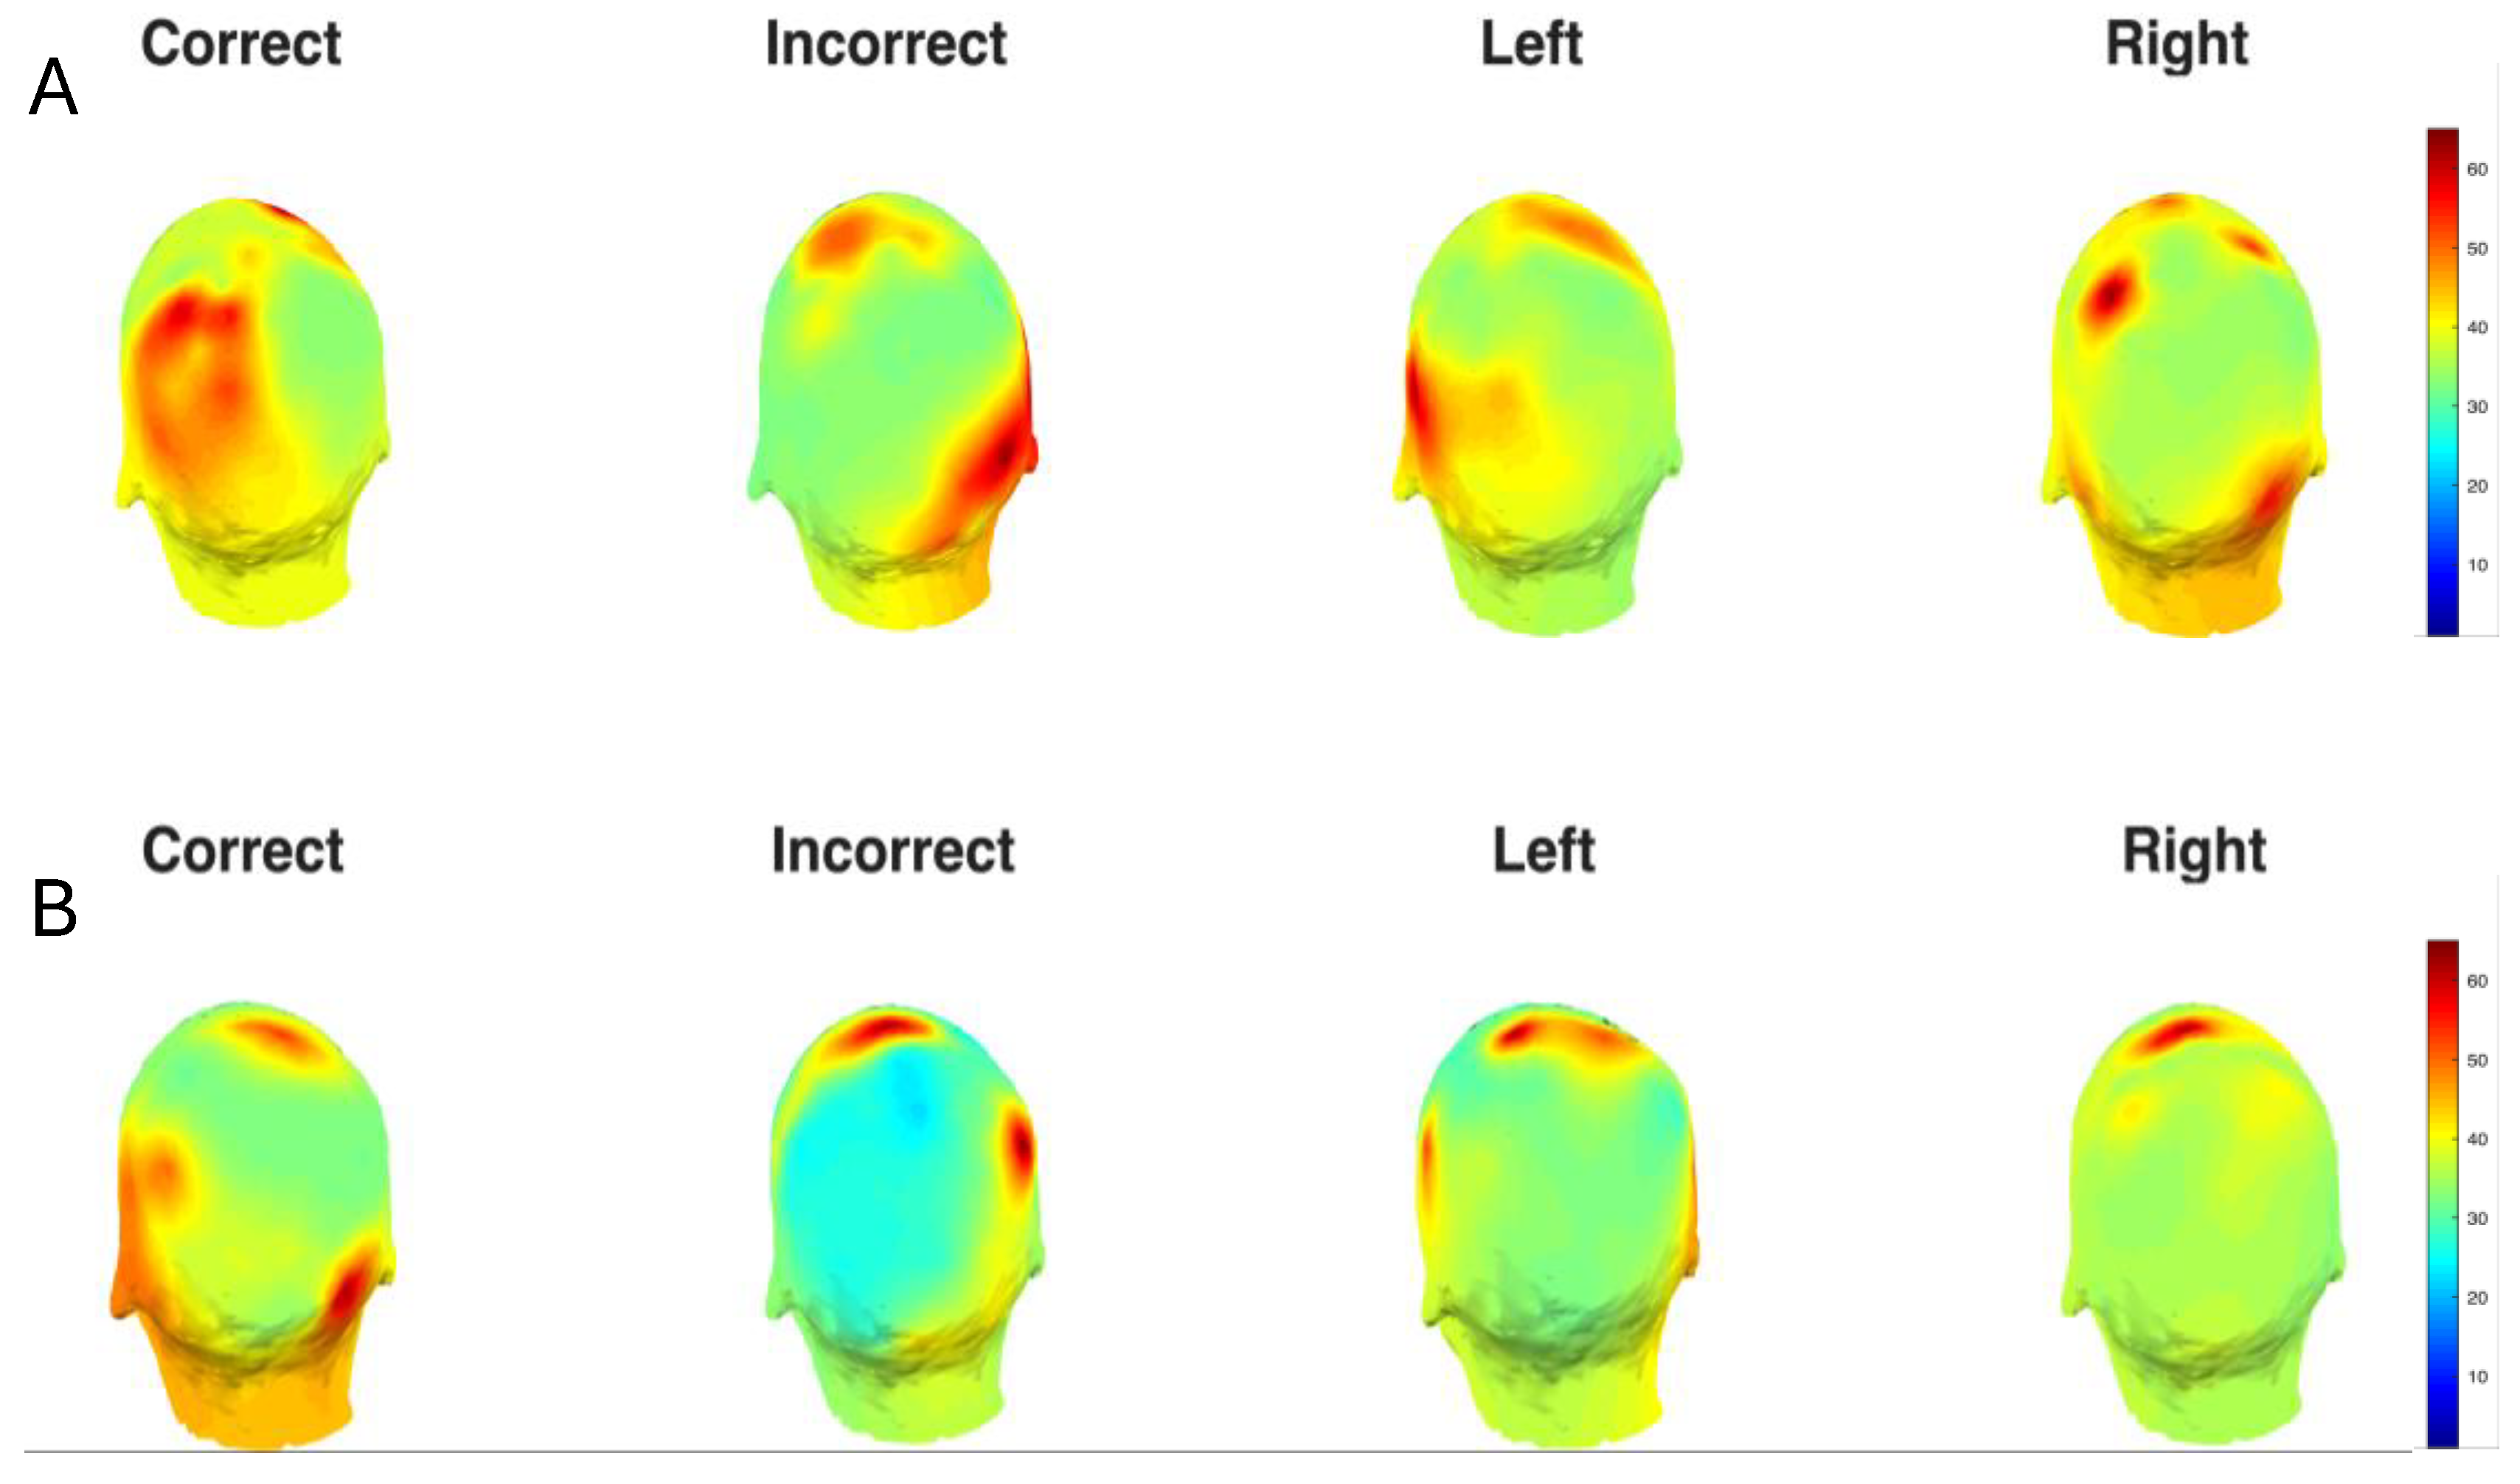
Figure 4.
Baseline normalized average theta power of the pre-stimulus time-period (-500 ms to 0 ms) and post-stimulus time-period (0 ms to 500 ms) for correct decisions vs incorrect decisions. The p-values represent the significance between condition pairs. Correct theta power is higher in both time-periods than incorrect theta power.
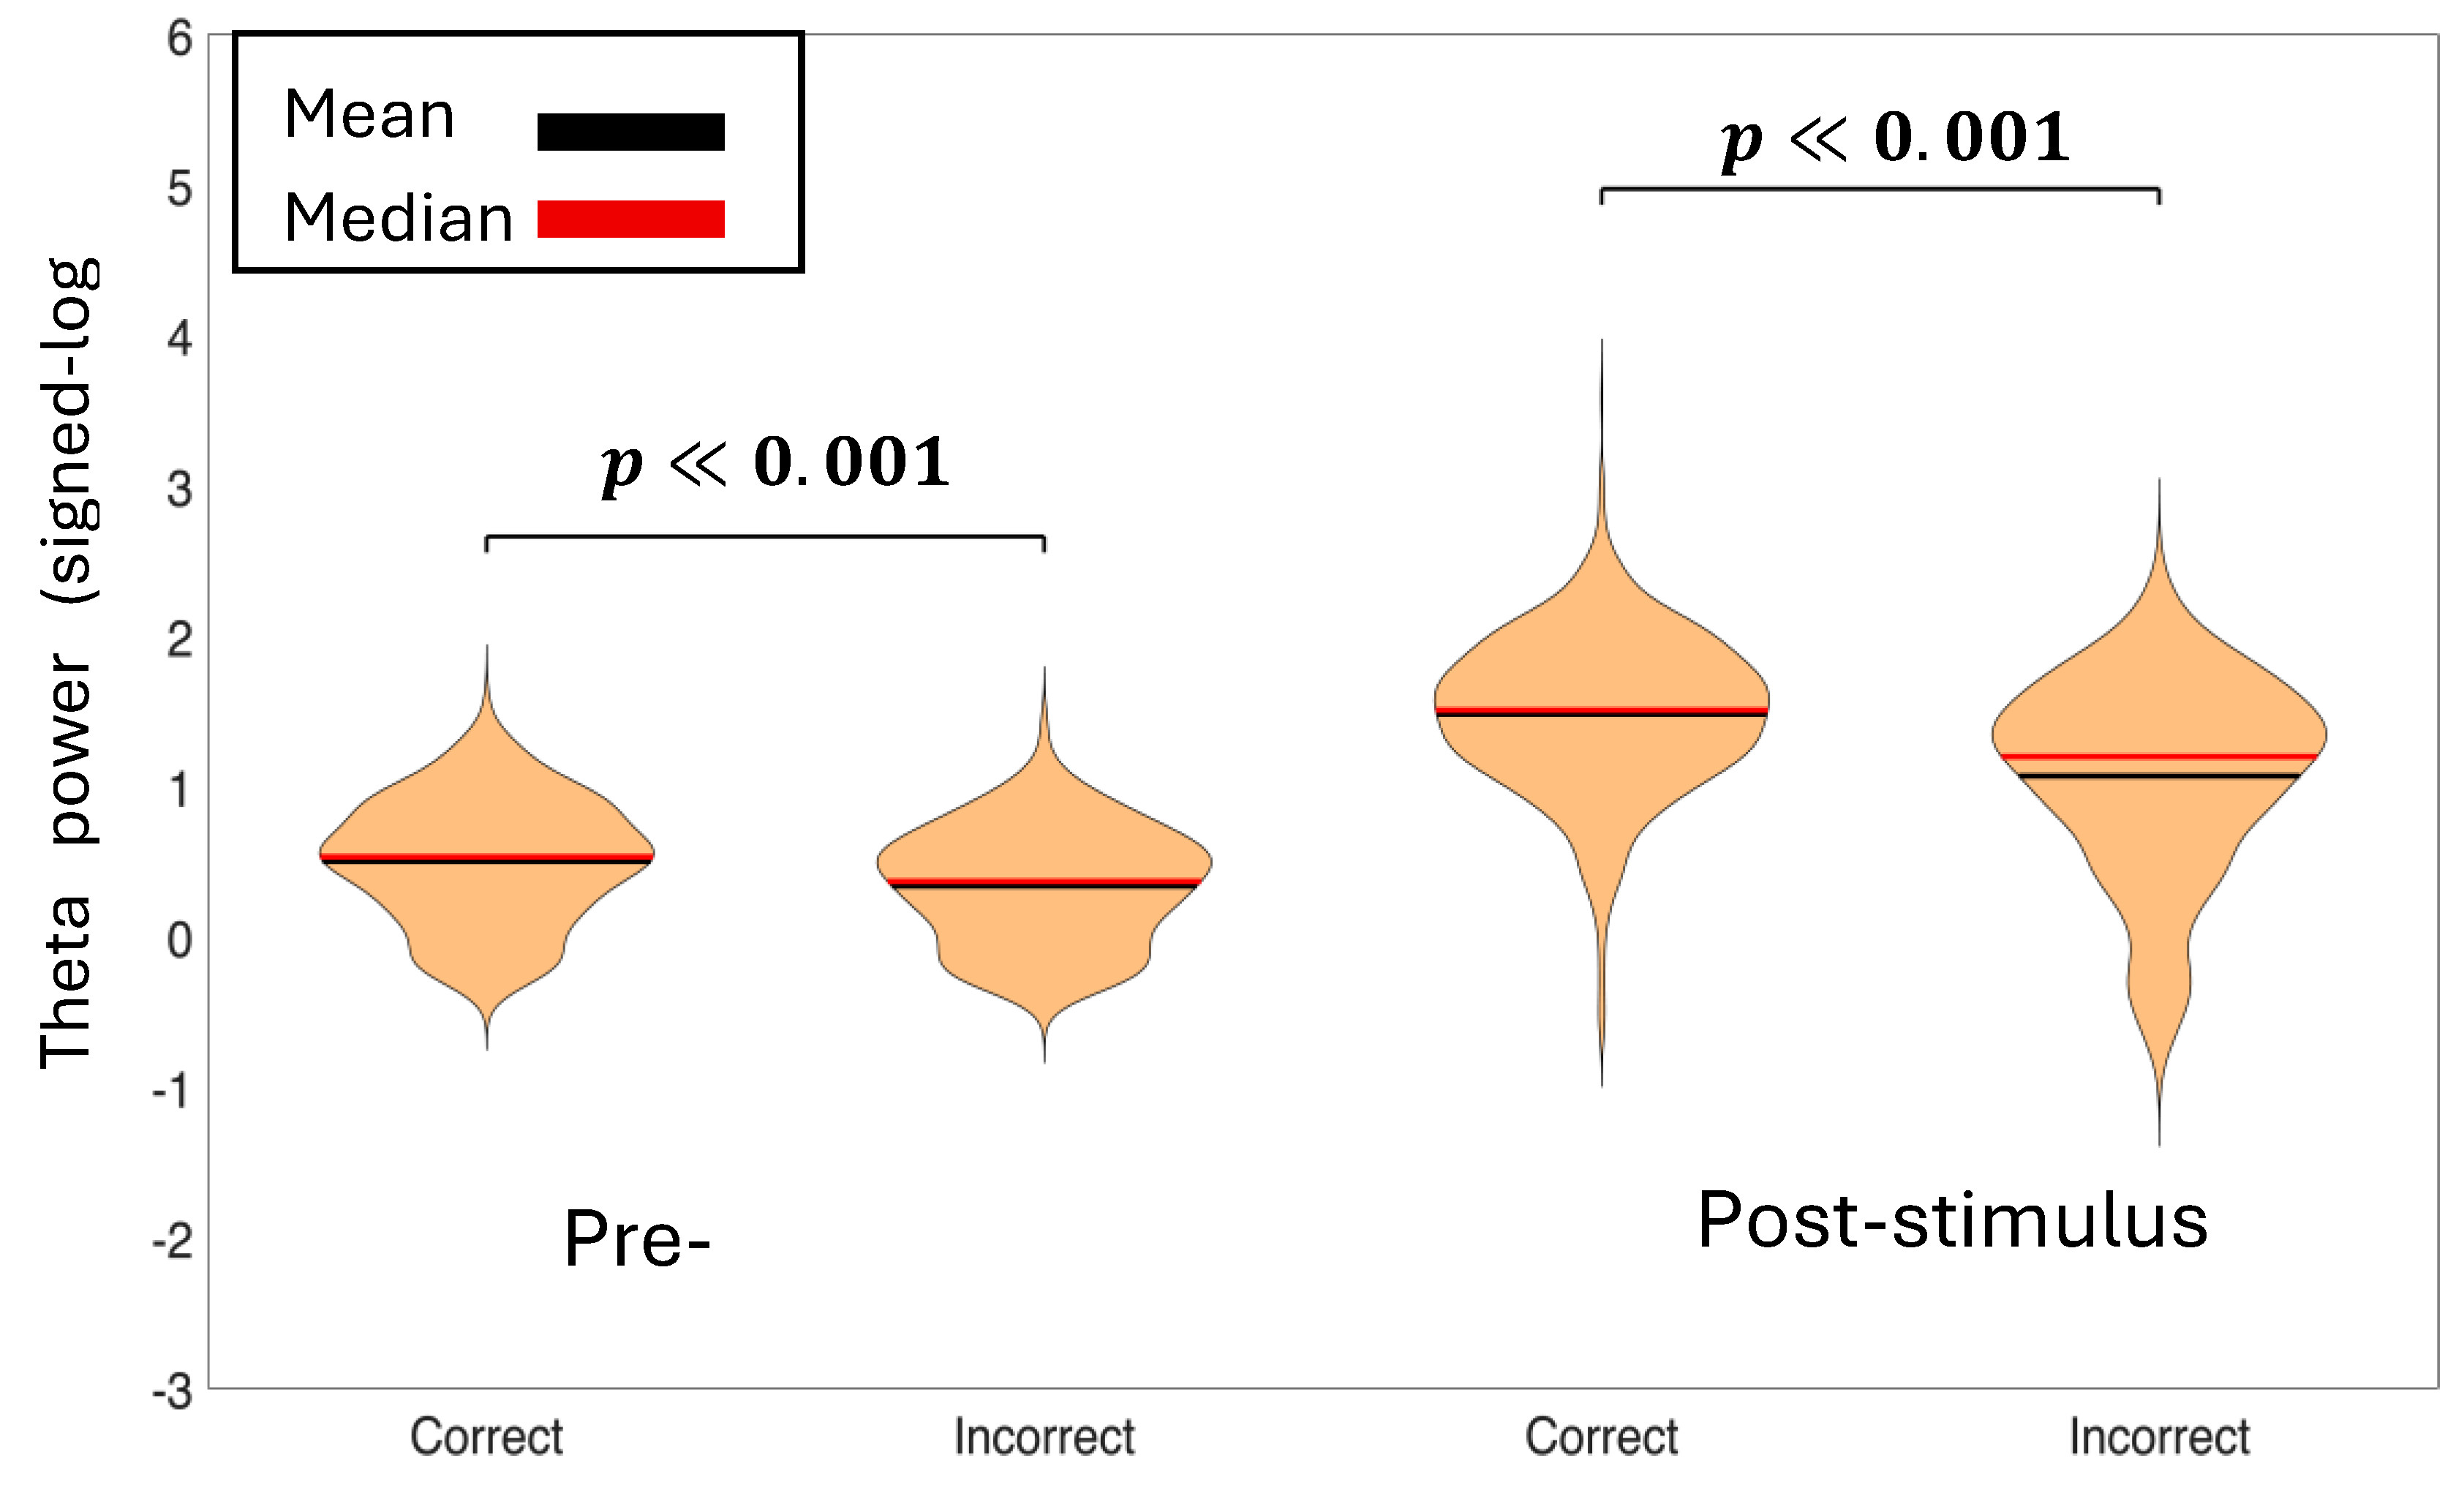
Figure 5.
Baseline normalized average alpha power of the pre-stimulus time-period (-500ms to 0ms) and post-stimulus time-period (0ms to 500ms) for correct decisions vs incorrect decisions. The p-values represent the significance between condition pairs. Correct alpha power is higher in both time-periods than incorrect alpha power.
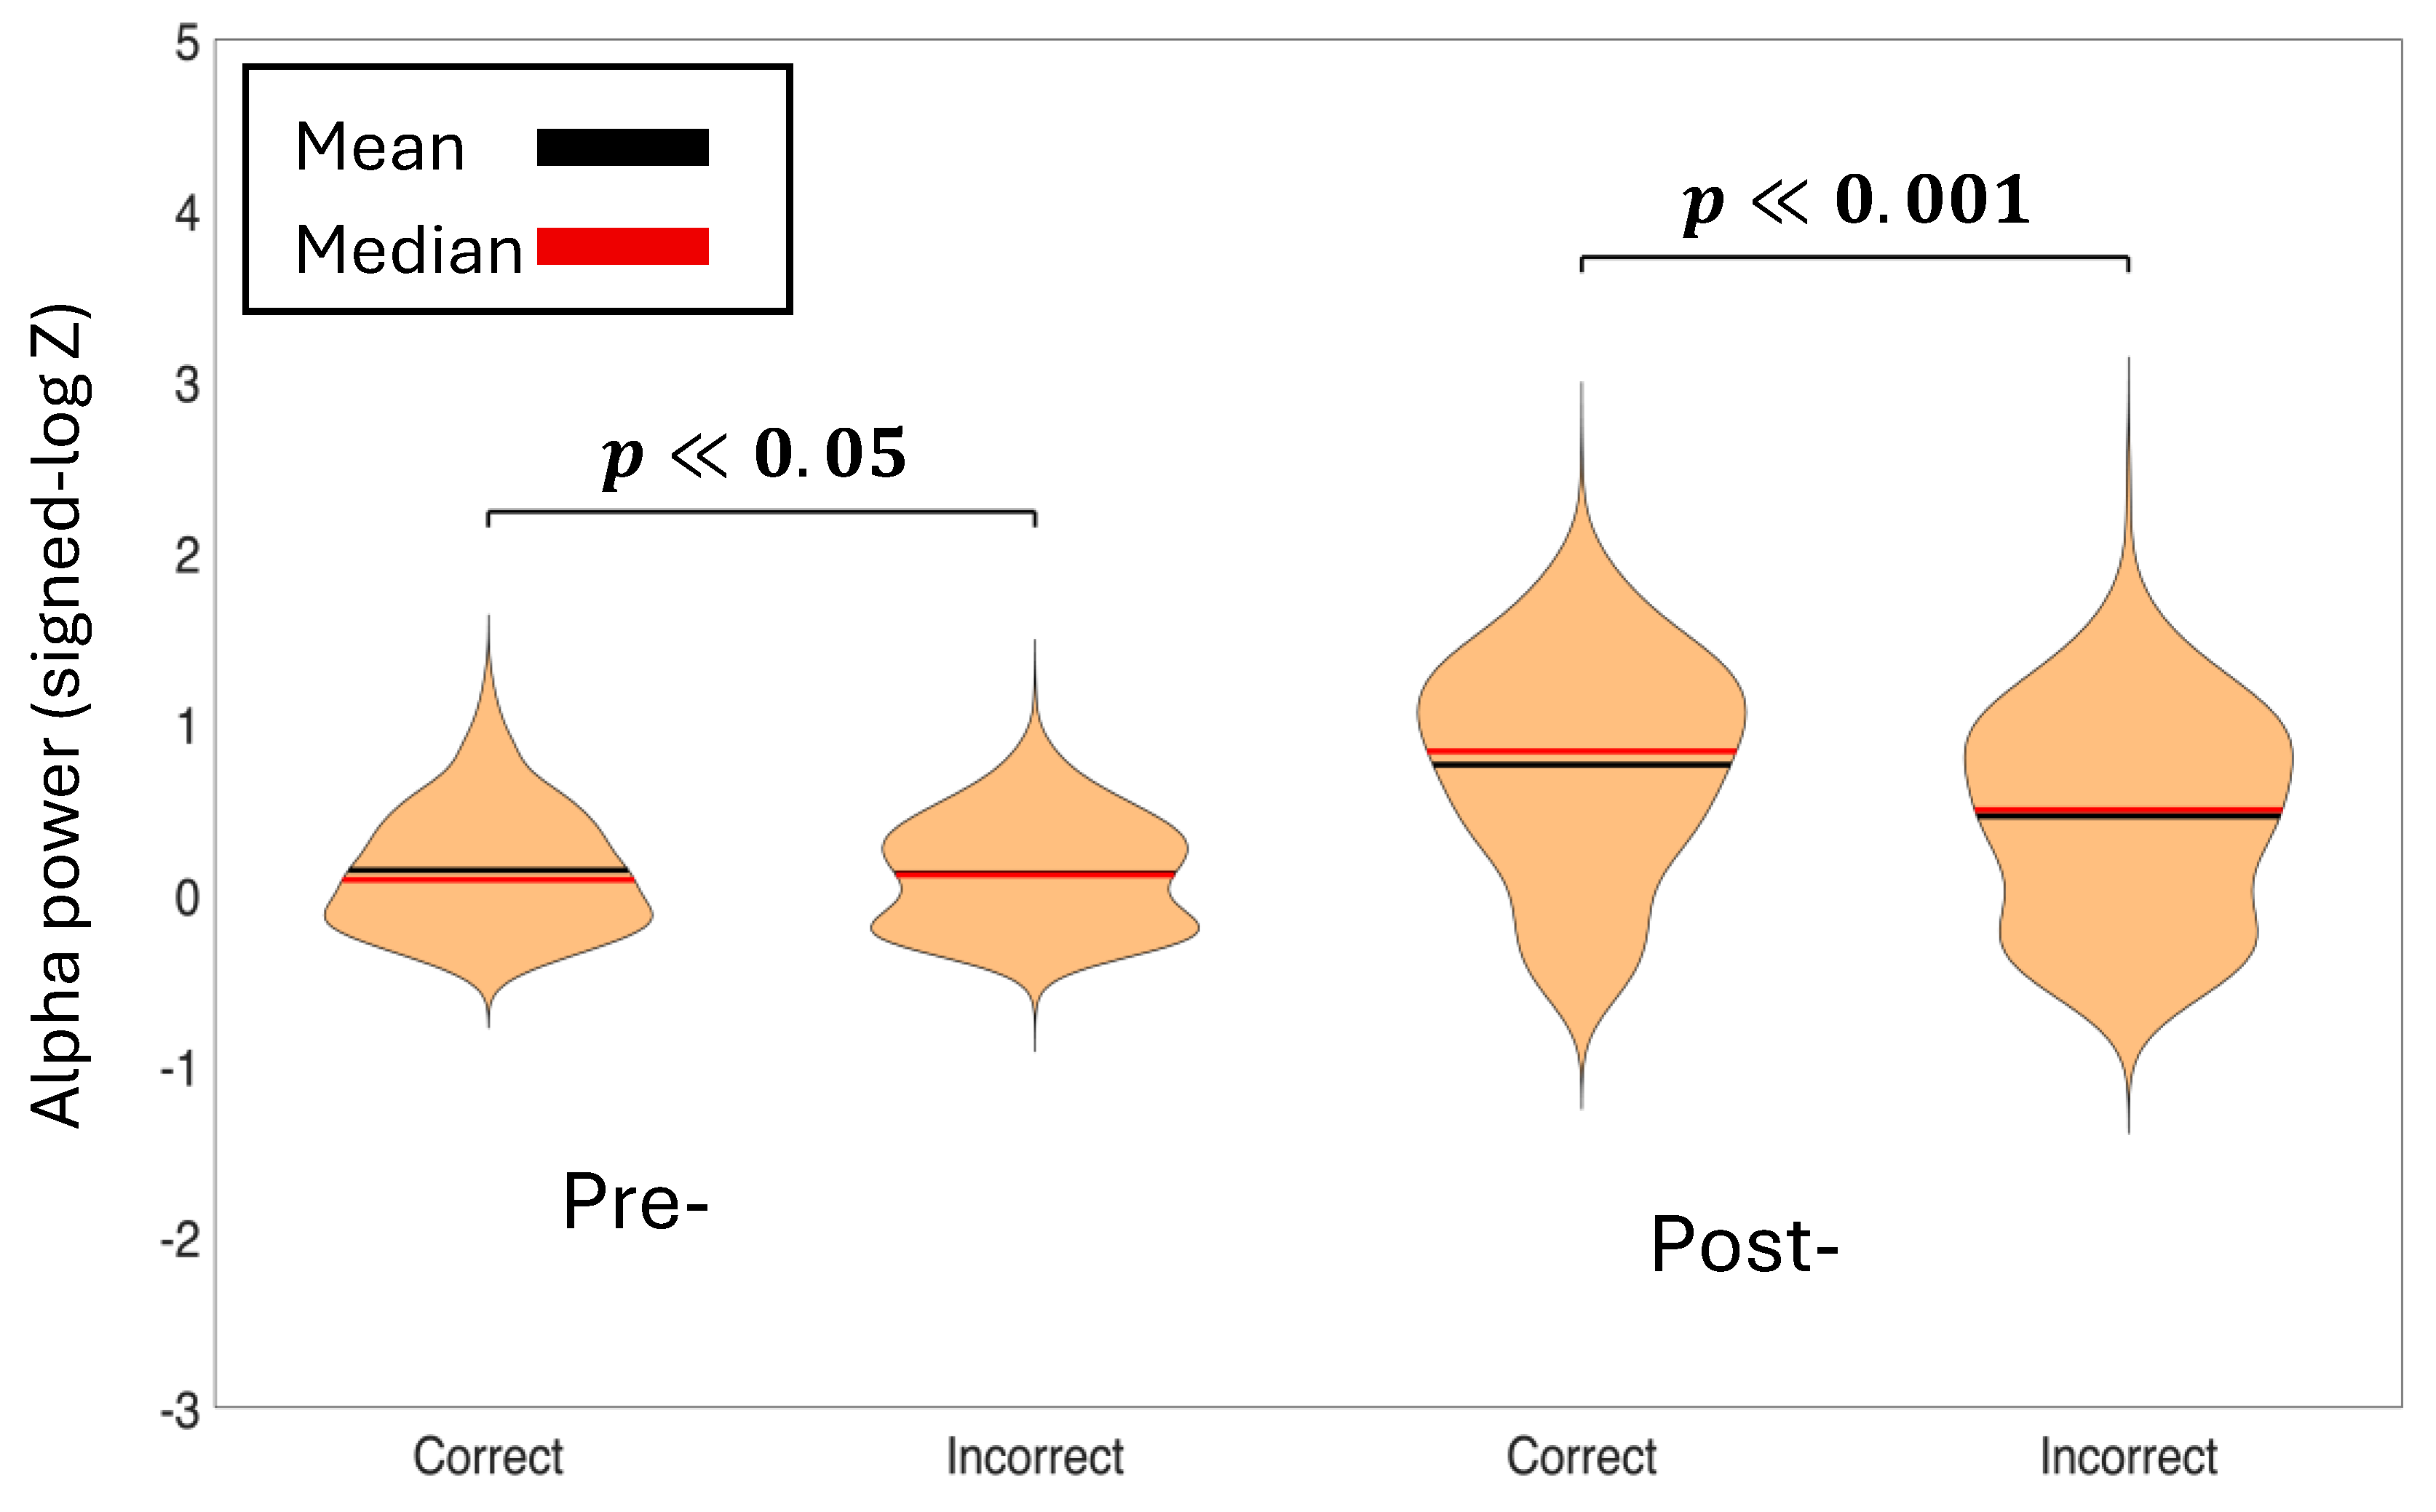
Figure 6.
Directional information flow between frontal and parietal cortical regions for theta band. (A) Correct decisions pre-stimulus period, (B) Correct decisions post-stimulus period, (C) Incorrect decisions pre-stimulus period, (D) Incorrect decisions post-stimulus period.
Figure 6.
Directional information flow between frontal and parietal cortical regions for theta band. (A) Correct decisions pre-stimulus period, (B) Correct decisions post-stimulus period, (C) Incorrect decisions pre-stimulus period, (D) Incorrect decisions post-stimulus period.
Disclaimer/Publisher’s Note: The statements, opinions and data contained in all publications are solely those of the individual author(s) and contributor(s) and not of MDPI and/or the editor(s). MDPI and/or the editor(s) disclaim responsibility for any injury to people or property resulting from any ideas, methods, instructions or products referred to in the content. |
© 2026 by the authors. Licensee MDPI, Basel, Switzerland. This article is an open access article distributed under the terms and conditions of the Creative Commons Attribution (CC BY) license (http://creativecommons.org/licenses/by/4.0/).
Copyright: This open access article is published under a Creative Commons CC BY 4.0 license, which permit the free download, distribution, and reuse, provided that the author and preprint are cited in any reuse.


