
Submitted:
12 February 2025
Posted:
13 February 2025
You are already at the latest version
Abstract
In prior studies, desynchronization of the induced alpha band (non-phase-locked but time-locked) has been observed across various cognitive tasks. Proposed hypotheses for the cognitive role of this alpha decrement include neural activation, an inhibition/timing mechanism, or a reduction of "neural noise." This study aimed to examine the effect of cognitive load on induced alpha activity using two versions of a go/no-go visual task: a single-target (ST) version with one target and one distractor, and a double-target (DT) version with two targets and two distractors. EEG was recorded from 58 electrodes, and Temporal Spectral Evolution (TSE) was used for time-frequency analysis. Behavioral results revealed faster reaction times in the ST task compared to the DT task. The P3 component displayed delayed latency and reduced amplitude under increased cognitive load, consistent with prior findings. However, the latencies and amplitudes of evoked and induced alpha responses were unaffected by cognitive load. This suggests that increased alpha desynchronization in subjects with cognitive impairment should not be interpreted as enhanced neural resource recruitment due to task difficulty. Instead, it may reflect other mechanisms unrelated to cognitive load differences in task performance.
Keywords:
alpha
; cognitive load
; evoked
; induced
; Go/No go
; P3
; reaction time
1. Introduction
Previous studies have broadly focused on the effects of cognitive load on behavior and brain activity [1,2,3].In this sense, various authors have suggested that cognitive load modulates stimulus processing, recruiting different cognitive mechanisms depending on the demands of the tasks [4,5].Some psychophysiological modulations related to cognitive load have been principally described in event-related potentials (ERPs) either in prestimulus [6,7] or in poststimulus time intervals [4,8].However, there are very few studies that have analyzed EEG frequency modulations related to cognitive load in visual tasks.
Since the 1970s, various techniques termed “time-frequency” have been developed that allow the modulations of spectral EEG bands to be studied with a resolution of milliseconds (ms) [9,10,11,12].One of these procedures is temporal spectral evolution (TSE)[13,14].The TSE allows obtaining information about phase (evoked) and nonphase (induced) activity [15,16].Although TSE has scarcely been applied, it has been demonstrated to be good enough to show cognitive mechanisms hidden for traditional “evoked” analysis [16,17,18,19,20,21]. In addition, TSE has also been performed in clinical populations, providing interesting results about altered or compensatory mechanisms [16,17,18,19,20,21].
A remarkable aspect of alpha modulations is that all the main properties (latency, amplitude or topographical distribution) of both evoked and induced responses are reliable for longitudinal studies [16,19].Moreover, the consistency of poststimulus alpha desynchronization has been confirmed across different paradigms [22,23], other frequency methods (power spectral density)[24] or different time-frequency methods (event-related desynchronization or TSE) [20,25,26].
Independent of the type of analysis applied, authors have tried to associate alpha EEG activity with specific sensory and/or cognitive processes. First, the presence of the alpha band was considered an indicator of neural resting [27]. However, some authors proposed later that alpha activity participates in the inhibitory control and timing of sensory processing [25].Another way to put it is that an increase in synchronization of alpha activity in irrelevant areas for the task is the reflex of an inhibition process [15,28].On the other hand, other studies have proposed that the desynchronization of alpha activity is related to the decrease in cortical “neural noise” that competes with stimulus processing [20].
One of the possible functional roles for alpha desynchronization that has been proposed is that the amplitude of the decrement could be correlated with the behavioral responses (the higher the decrement, the better the performance). In fact, some studies have described a positive correlation between poorer behavioral performance and a lower desynchronization of alpha activity in different pathologies [20,22,29].Based on this assumption, some authors have suggested that when patients are cognitively impaired, an increase in alpha desynchronization is found, which could represent a special effort from the patient to compensate for the impairment, increasing the resources involved during information processing [15,23].
This line of reasoning in studies with pathological populations has been questioned in some cases because it permits to interpret both types of results. If a lower decrement of the alpha band is found in the patient group compared to healthy controls, the mechanism indexed by alpha is impaired, but if the decrement is higher, it means more recruitment of neural resources by the patients as a compensatory mechanism. If the hypothesis of “recruitment of neural resources” is correct, it is logical to think that a more demanding task would increase the decrement of the alpha desynchronization (or delay the latency of its valley) compared to an easier task. The present study investigates this possibility using two go/no go tasks with a different cognitive load level, while EEG signals are recorded in a 58-electrode setup in healthy subjects.
2. Materials and Methods
2.1. Participants
Twenty-six participants (16 women and 10 men) were enrolled in the study and completed the experiment in controlled conditions. The participants were between the ages of 20 and 52 years (mean 37.3, SD 11.3). Two subjects were left-handed.
2.2. Cognitive Tasks
Participants were seated in a sound-attenuated room in front of an LCD monitor. Stimuli were created by E-prime 2.0 (Psychology Software Tools, Inc., Pittsburgh, PA). The cognitive tasks were based on the go/no go paradigm in which the subject had to distinguish visual stimuli (target) (probability: 50%) intermixed with distractor stimuli.A cognitive load effect was achieved using two versions of this task. On the one hand, an easy version comprised one target and one distractor stimulus (single target (ST)), whereas a more demanding version used two targets and two distractors (double target (DT)). In both versions, a fixation cross was present when no stimuli were displayed to prevent changes in eye position during the experiment. In the ST version, the target stimuli consisted of a rectangle with a checkerboard pattern that was comprised of red and white squares. The distractor stimuli were equivalent in size with the same pattern but with black and white squares. On the other hand, in the DT version, the target stimuli consisted of the same rectangle/checkerboard pattern that was comprised of red and white squares or blue and white squares. The distractor stimuli were equivalent in size with the same pattern but with yellow and white squares or green and white squares. In all cases, stimuli subtended a 7.98° × 9.42° visual angle at a viewing distance of 70 cm. In addition, stimuli were displayed pseudorandomly and one at a time in the left or right visual fields (4.11 visual angle distance from the center of the screen to the inner border of the stimulus). Participants had to press left/right mouse buttons with the left/right thumb fingers when the target stimuli were displayed in the left/right visual field, respectively. Subjects must ignore the distractors stimuli. The time interval for the presentation of all stimuli lasted for 500 ms, and the interstimulus interval (ISI) was 1000 ms, during which the subject could respond. Each version consisted in a block with 140 trials. At the end of the experimental session, the reaction time and percentage accuracy were calculated. All participants were asked to respond to the stimuli as quickly and accurately as possible.
2.3. EEG Recording and Analysis
EEG data were recorded from 58 electrodes (Ag/AgCl) in standard locations of a 10-10 system (American Electroencephalographic Society, 1994) [30] and amplified with BrainAmp amplifiers (Brain Products GmbH, Germany). EEG signals were filtered during the recording with a bandpass of 0.01 to 100 Hz, analog-to-digital converted with a sampling rate of 500 Hz and stored using Brain Vision Recorder software (Brain Products GmbH, Germany). EEG signals were referenced online to the linked auricular lobes and offline to a common averaged reference. Impedance was maintained below 5 kOhm during the experiment. Vertical electrooculograms (VEOGs) and horizontal electrooculograms (HEOGs) were also recorded with bipolar montages. Trials with a HEOG signal outside the ±50 µV range were rejected. For blinking artifacts, ocular correction was performed in the scalp electrodes using the algorithm developed by [31].The continuous EEG signal was epoched in segments of -200 to 1000 ms with zero being the onset of the target. Segmentation was performed 200 ms prior to the onset of the stimuli to minimize the contribution of edge effects caused by the filtering [10].
After this initial processing, the following calculations were performed for EEG signals: 1) averaging for target stimuli in the time domain to obtain ERP modulations (in this study centered in the P3 component) for both tasks; 2) these averages were filtered for the alpha band (8-13 Hz) and rectified to obtain spectrally evoked activity, and finally, a baseline correction (-100 to 0 ms) [16]; 3) for the induced activity, the temporal spectral evolution (TSE) method was applied with the following steps: a) identical bandpass filtering in a previously defined alpha band was performed over the EEG epochs, b) the resulting signal was rectified, c) the target stimuli epochs were averaged, and d) a baseline correction (-100 to 0 ms) was also applied. After this procedure, spectral evoked activity was subtracted from the TSE to calculate the induced response (non-phase activity) [16].
Following the guidelines proposed by two authors [32], the latency measurement was performed at the electrode that recorded the maximum amplitude in the grand average of the target conditions. The latency peak for P3 and alpha modulations (evoked and induced) were determined individually for each participant (electrodes selected: Pz for P3 and PO6 for alpha modulations). To analyze the amplitude effects for P3, the mean amplitude value was exported in the interval of 350–410 ms that comprised peaks from both versions (ST and DT). On the other hand, the amplitude of spectral alpha modulations was analyzed at different intervals depending on the activity (evoked: 140-155 ms; induced: 165-200 ms), which included the latencies with the maximum amplitude for both tasks. In all analyses of the P3 component and alpha modulations, amplitude values were exported for a 6 x 7 matrix that can be seen in Figure 1.
2.4. Phase Analysis for Evoked and Induced Activity
A phase analysis was performed to discard a potential contribution of evoked activity over induced activity and demonstrate a truly non-phase modulation in our data. To achieve this goal, the evoked response was estimated by averaging over trials and then subtracting from each of the individual trials [33,34]. To do so, the trials were filtered in the analyzed band (alpha: 8-13 Hz, 48 dB/octave, Butterworth), and the Hilbert transform was applied to calculate the instantaneous phase. The phases of alpha activities (evoked and induced) were measured at the same intervals used for the amplitude analyses.
2.5. Statistical Analysis
2.5.1. Behavioral Responses
The Shapiro-Wilk test was used to assess the normality of reaction time and accuracy data. Nonparametric tests (Wilcoxon U test) were conducted to determine significant differences in reaction time and accuracy variables associated with cognitive load.
2.5.2. ERP Analysis
The Shapiro-Wilk test was used to check normality for P3 latency. A parametric test (Student’s t-test) was performed to analyze the differences between ST and DT tasks in the latency of P3. The amplitude was analyzed with ANOVA with the following factors: cognitive load factor (ST and DT); anterior-posterior position factor (levels: frontal, frontocentral, central, centroparietal, parietal and parietal-posterior) and lateral-medial position factor (levels: line 5, line 3, line 1, medial, line 2, line 4 and line 6) (see Figure 1).
2.5.3. Alpha Band Analysis
The Shapiro-Wilk test was used to check normality of alpha latency data (evoked and induced). ANOVA was performed to study the latency of both alpha activities with the following factors: cognitive load factor (levels: ST and DT) and activity factor (levels: evoked and induced). Regarding amplitude, evoked activity was analyzed with ANOVA with the following factors: cognitive load factor (ST and DT); anterior-posterior position factor (levels: frontal, frontocentral, central, centroparietal, parietal and parietal-posterior) and lateral-medial position factor (levels: line 5, line 3, line 1, medial, line 2, line 4 and line 6). The amplitude of the induced activity was analyzed with ANOVA with the same factors used for evoked activity.
In all the statistical analyses described, sphericity was corrected with Greenhouse-Geisser, and a statistically significant result was considered at p < 0.05. Post hoc analyses were performed using Bonferroni correction.
3. Results
3.1. Behavioral Data
The U-Wilcoxon test revealed differences between ST and DT tasks in reaction time (Z= 4,457, p < 0.001), with the ST task being faster than the DT task (see mean values in Table 1). Regarding accuracy, the U-Wilcoxon test did not find differences between ST and DT tasks (Z = 0.416, p = 0.678).
3.2. ERP Analysis
Regarding P3, a t-test showed that P3 latency reached the maximum amplitude earlier in the ST task than in the DT task (t25 = -6.043; p < 0.001) (see mean values in Table 1). On the other hand, there were differences in the P3 amplitude, which was lower in DT than in ST [F (1,25): 14.362; p < 0.001; ŋ2: 0.365] (Figure 2). The interaction between “cognitive load” x “anterior-posterior position” x “lateral-medial position” factors did not show a statistically significant difference between the two tasks due to a generalized increase in the amplitude in the ST task compared to that in the DT task in all homologous electrodes (p < 0.001) (Figure 2).
3.3. Alpha Band
The analysis of latency between alpha activities showed that evoked response was faster than induced modulation [F (1,25): 8.408; p = 0.007; ŋ2: 0.252] (evoked: 149 ms; induced: 183 ms) (Figure 3). On the other hand, the cognitive load factor was not statistically significant as a main factor or in combination with the activity factor. In the amplitude analyses, ANOVA did not show any statistically significant difference due to the cognitive load or the activity factors in interaction with localization of the electrode factors (antero-posterior position or medial-lateral position). Moreover, evoked and induced modulations showed a similar distribution in the scalp, mainly evident in the right hemisphere, but with a different latency. Regarding the phase analysis, a phase plot showed that no relation was found between evoked and induced activities in either version of the task (ST or DT) (Figure 4).
4. Discussion
Behavioral data have shown that the reaction time variable of the DT task was slower than that of the ST task. This result is in accordance with previous studies in which the cognitive load of the task produced delays in reaction time [4,8,35,36].Moreover, the percentage of accuracy showed almost a 100% value in both tasks, which indicates that no speed-accuracy trade-off was present in this study between tasks.
The cognitive load effect was not only relevant for the reaction time, but the P3 component showed a statistically significant delay in its latency for the more demanding experimental version (DT). This result supports previous studies where the delay of the P3 latency was modulated by the cognitive load of the task [1,2]. On the other hand, modulation of the P3 component by the cognitive load was not exclusively made over the latency, and amplitude was also significantly different with a decrease for the more demanding task (DT). Moreover, topographical analyses showed that there was no difference in P3 scalp distribution between both tasks. The difference observed here can be interpreted simply as a general reduction of the amplitude for all the derivations in the double-target task. Several authors have identified a similar result for this parameter in which the effect of the cognitive load was studied [2,35,37,38,39,40]. However, other studies have found no changes in P3 amplitude related to the cognitive load [4] or even an increase in the amplitude of this component related to cognitive load [36].
The effect of cognitive load on the amplitude of P3 has been interpreted in different ways. Several authors have proposed that the reduction in the amplitude is related to the amount of information transmitted during information processing. In other words, when the subject has a lower certainty about the stimuli (i.e., in a more demanding task), there is a reduction in the flow of information that is represented by a reduction in the amplitude of P3 [2]. Another interpretation has been formulated on the basis that if the task is repeated and becomes easier, mechanisms involved in the generation of P3 are more synchronized, and the amplitude becomes higher [41]. In any case, multiple processes have been related to the P3 component and not only related to resource allocation or working memory updating, as, for instance, referred to inhibition mechanisms [42]. Therefore, interpretation of the results for P3 has to be taken cautiously, and more research is needed to disentangle the precise meaning and relation of cognitive mechanisms involved in the P3 component.
Before analyzing the effect of the cognitive load over alpha modulations, it is relevant to highlight the delay of the induced activity in comparison to the evoked response. In previous studies, evoked and induced activity showed similar latencies (in some cases, almost identical), which led us to propose that both activities could represent linked mechanisms [16]. In particular, it was proposed in one of the studies that induced activity represents the reduction of “neural noise” in homologous areas where evoked responses took place [20]. This role could favor stimulus processing because of the reduction in potential competing alpha spectral content already present in the visual cortex. However, the confirmed delay in the current study for the induced activity suggests that this reduction does not seem critical to be in the same latency regarding the evoked response. Moreover, phase analyses have shown that induced activity in both tasks is randomly distributed in their polar values and suggest that no contribution between induced and evoked activities is present in the current study. This result has been observed in previous studies [19,20] and suggests that both activities (evoked and induced) are dissociable, although they could be partially related considering their similar topographical distribution.
Regarding the cognitive load effect on the evoked activity, statistical analysis did not show any modulation in the latency or amplitude parameters. A subtle increase in the amplitude was found in the DT task compared to that in the ST task (but the difference was not statistically significant).Considering that the evoked response could be considered the spectral signature of the P1/N1 components [16,43], the present data would reflect an absence of modulation for these components due to the demanding level of the task. Previous studies have shown an increase or decrease in N1 amplitude related to the difficulty of the task [44,45]. The potential reason for these contradictory results could be due to the participation of different cognitive variables, such as allocation of attention and habituation [46]. Future studies are required to precisely disentangle the contributions of these mechanisms to spectral evoked modulation.
In the case of the induced activity as in the evoked response, amplitude and latency were not modulated by cognitive load level of the tasks. In contrast to evoked activity, potential modulation of the induced response by cognitive load has not been studied before. In previous studies, some authors have demonstrated that cognitive load could take place in the early steps of stimulus processing (pP1 effect at 180 ms) [8,47]. However, with a similar latency for the induced alpha in the more demanding task (DT) (approximately 200 ms), no changes were seen with respect to the ST version.
A potential interpretation for the absence of modulation by cognitive load could be that the induced alpha decrement has reached the maximum value in both tasks (ground effect); therefore, no differences can be found between the two tasks. However, it seems reasonable that if the reaction time was shorter for the simple version of the task and P3 was also distinguished between both levels of cognitive load, alpha desynchronization could reflect some change related to this factor if it would be related to it.
In our proposal that induced activity is related to a reduction in “neural noise” present in the visual cortex, the current results suggest that this reduction is not particularly affected by the cognitive mechanisms involved in cognitive load processing. However, some authors have found a stronger beta desynchronization during complex relative to simple sequences of movement executions [48]. It is necessary to emphasize at this point that some time-frequency techniques do not concretely analyze the non-phase modulation, which could affect the results observed [16]. The observed absence of a cognitive load effect over the induced modulation suggests that alpha desynchronization does not represent (at least evidently) the need for a higher number of neural resources to perform a more demanding version of the task. In other words, the decrement of induced alpha seems to represent a mechanism at a more sensory level facilitating the information processing and not determined by cognitive variables defined by the stimulus set (i.e., cognitive load).
Last, if the induced alpha activity does not seem to be related to the recruitment of neural sources to address the cognitive load of the task, the proposed compensatory mechanism in patients does not seem appropriate to justify larger amplitudes in alpha desynchronization, as has been suggested by a variety of authors. However, a higher decrement for alpha desynchronization has been commonly found in various studies and with different populations [19,23,49,50]. An alternative proposal to explain these results is that the decrement in alpha desynchronization is modulated by the motivational status of the experimental subject or group. In the case of pathological studies, patients are usually more motivated during the performance of the task, which could be the reason for a larger decrement in the induced alpha activity. However, this reduction would not be related to the involvement of more neural sources; instead, this reduction could be based on a general increase in arousal that aims to optimally reduce “neural noise” in the visual cortex to facilitate stimulus processing. Future studies in which motivational status may be controlled are needed to confirm this proposal.
5. Conclusions
In summary, evoked and induced alpha activities do not seem to be involved in the cognitive mechanisms related to the cognitive load of the task. Moreover, different parameters (latency and phase values) have shown that evoked and induced alpha responses are dissociable; however, at the same time, the similar distributions of the parameters suggest some sort of relation between these responses. Finally, the lack of modulation due to the cognitive load of induced alpha desynchronization does not support that this modulation could reflect compensatory mechanisms in pathological conditions.
Author Contributions
Conceptualization: Vázquez-Marrufo, M.; Data adquisition: Sarrias-Arrabal, E. and Caballero-Diaz, R.; Data Curation: Vázquez-Marrufo, M., Caballero-Diaz, R and Martín-Clemente, R.; Investigation and results evaluation: Vázquez-Marrufo, M., Sarrias-Arrabal, E., Caballero-Diaz, R. and Martín-Clemente, R.; Writing: Vázquez-Marrufo, M.; Writing review and editing: Vázquez-Marrufo, M., Sarrias-Arrabal, E., Caballero-Diaz, R. and Martín-Clemente, R.; Funding adquisition: Vázquez-Marrufo, M.
Funding
This work was supported by the “Plan Nacional de Excelencia” (Ministerio de Economía y Competitividad, Government of Spain, PSI2010-16825) and a predoctoral PIF contract funded by the VII PPIT (Plan Propio de Investigación y Transferencia, 2022), University of Seville.
Institutional Review Board Statement
This study was performed in compliance with the Helsinki Declaration. All participants signed informed consent before their inclusion, and the protocol was approved by the Ethics Committee of the University of Seville (project code: PSI2010-16825).
Informed Consent Statement
Informed consent was obtained from all subjects involved in the study.
Data Availability Statement
The original data presented in the study are openly available in [Deposit in institutional repository requested and pending confirmation.
Acknowledgments
The authors acknowledge all the students and staff of the University who kindly agreed to take part in the study.
Conflicts of Interest
The authors declare that they have no competing interests.
References
- Polich, J. Task difficulty, probability, and inter-stimulus interval as determinants of P300 from auditory stimuli. Electroencephalogr. Clin. Neurophysiol. Potentials Sect. 1987, 68, 311–320. [Google Scholar] [CrossRef]
- Kok, A. On the utility of P3 amplitude as a measure of processing capacity. Psychophysiology 2001, 38, 557–577. [Google Scholar] [CrossRef] [PubMed]
- Mussini, E.; Berchicci, M.; Bianco, V.; Perri, R.; Quinzi, F.; Di Russo, F. Effect of task complexity on motor and cognitive preparatory brain activities. Int. J. Psychophysiol. 2020, 159, 11–16. [Google Scholar] [CrossRef]
- Gajewski, P.D.; Falkenstein, M. Effects of task complexity on ERP components in Go/Nogo tasks. Int. J. Psychophysiol. 2013, 87, 273–278. [Google Scholar] [CrossRef]
- Rueda-Delgado, L.; Solesio-Jofre, E.; Mantini, D.; Dupont, P.; Daffertshofer, A.; Swinnen, S. Coordinative task difficulty and behavioural errors are associated with increased long-range beta band synchronization. NeuroImage 2017, 146, 883–893. [Google Scholar] [CrossRef] [PubMed]
- Bianco, V.; Berchicci, M.; Perri, R.L.; Quinzi, F.; Mussini, E.; Spinelli, D.; Di Russo, F. Preparatory ERPs in visual, auditory, and somatosensory discriminative motor tasks. Psychophysiology 2020, 57, e13687. [Google Scholar] [CrossRef]
- Di Russo, F.; M, B.; V, B.; Rl, P.; S, P.; F, Q.; D, S. Normative event-related potentials from sensory and cognitive tasks reveal occipital and frontal activities prior and following visual events. NeuroImage 2019, 196, 173–187. [Google Scholar] [CrossRef]
- Mussini, E.; Berchicci, M.; Bianco, V.; Perri, R.L.; Quinzi, F.; Di Russo, F. The Role of Task Complexity on Frontal Event-related Potentials and Evidence in Favour of the Epiphenomenal Interpretation of the Go/No-Go N2 Effect. Neuroscience 2020, 449, 1–8. [Google Scholar] [CrossRef] [PubMed]
- B. Boashash, Time-Frequency signal analysis and processing: A comprehensive reference, 2nd ed., Academic Press, Amsterdam, 2016.
- M.X. Cohen, Analyzing Neural Time Series Data: Theory and Practice, Illustrated ed., MIT Press, London, 2014.
- Pfurtscheller, G.; Neuper, C.; Mohl, W. Event-related desynchronization (ERD) during visual processing. Int. J. Psychophysiol. 1994, 16, 147–153. [Google Scholar] [CrossRef]
- M. Vázquez-Marrufo, E. M. Vázquez-Marrufo, E. Vaquero-Casares, M.J. Cardoso-Moreno, C. Gómez González, Dinámica temporal de la frecuencia del electroencefalograma. Metodología y aplicaciones. Rev Neurol. 33(6) (2001a) 525-530.
- Lehtelä, L.; Salmelin, R.; Hari, R. Evidence for reactive magnetic 10-Hz rhythm in the human auditory cortex. Neurosci. Lett. 1997, 222, 111–114. [Google Scholar] [CrossRef]
- Salmelin, R.; Hari, R. Spatiotemporal characteristics of sensorimotor neuromagnetic rhythms related to thumb movement. Neuroscience 1994, 60, 537–550. [Google Scholar] [CrossRef] [PubMed]
- Vázquez-Marrufo, M.; Vaquero, E.; Cardoso, M.J.; Gómez, C.M. Temporal evolution of α and β bands during visual spatial attention. Cogn Brain Res. 2001, 12, 315–320. [Google Scholar] [CrossRef] [PubMed]
- Vázquez-Marrufo, M.; García-Valdecasas, M.; Caballero-Diaz, R.; Martin-Clemente, R.; Galvao-Carmona, A. Multiple evoked and induced alpha modulations in a visual attention task: Latency, amplitude and topographical profiles. PLOS ONE 2019, 14, e0223055. [Google Scholar] [CrossRef]
- Ciesielski, K.T.; Hämäläinen, M.S.; Geller, D.A.; Wilhelm, S.; Goldsmith, T.E.; Ahlfors, S.P. Dissociation between MEG alpha modulation and performance accuracy on visual working memory task in obsessive compulsive disorder. Hum. Brain Mapp. 2007, 28, 1401–1414. [Google Scholar] [CrossRef]
- Lasaponara, S.; Pinto, M.; Aiello, M.; Tomaiuolo, F.; Doricchi, F. The Hemispheric Distribution of α-Band EEG Activity During Orienting of Attention in Patients with Reduced Awareness of the Left Side of Space (Spatial Neglect). J. Neurosci. 2019, 39, 4332–4343. [Google Scholar] [CrossRef] [PubMed]
- Vázquez-Marrufo, M.; Caballero-Díaz, R.; Martín-Clemente, R.; Galvao-Carmona, A.; González-Rosa, J.J. Individual test-retest reliability of evoked and induced alpha activity in human EEG data. PLOS ONE 2020, 15, e0239612. [Google Scholar] [CrossRef]
- Vazquez-Marrufo, M.; Sarrias-Arrabal, E.; Martin-Clemente, R.; Galvao-Carmona, A.; Navarro, G.; Izquierdo, G. Altered phase and nonphase EEG activity expose impaired maintenance of a spatial-object attentional focus in multiple sclerosis patients. Sci. Rep. 2020, 10, 1–16. [Google Scholar] [CrossRef] [PubMed]
- Sarrias-Arrabal, E.; Eichau, S.; Galvao-Carmona, A.; Domínguez, E.; Izquierdo, G.; Vázquez-Marrufo, M. Deficits in Early Sensory and Cognitive Processing Are Related to Phase and Nonphase EEG Activity in Multiple Sclerosis Patients. Brain Sci. 2021, 11, 629. [Google Scholar] [CrossRef]
- Keune, P.M.; Hansen, S.; Weber, E.; Zapf, F.; Habich, J.; Muenssinger, J.; Wolf, S.; Schönenberg, M.; Oschmann, P. Exploring resting-state EEG brain oscillatory activity in relation to cognitive functioning in multiple sclerosis. Clin. Neurophysiol. 2017, 128, 1746–1754. [Google Scholar] [CrossRef]
- Kiiski, H.; Reilly, R.B.; Lonergan, R.; Kelly, S.; O'Brien, M.C.; Kinsella, K.; Bramham, J.; Burke, T.; Donnchadha, S.Ó.; Nolan, H.; et al. Only Low Frequency Event-Related EEG Activity Is Compromised in Multiple Sclerosis: Insights from an Independent Component Clustering Analysis. PLOS ONE 2012, 7, e45536. [Google Scholar] [CrossRef]
- Gómez, C.; Vaquero, E.; López-Mendoza, D.; González-Rosa, J.; Vázquez-Marrufo, M. Reduction of EEG power during expectancy periods in humans. Acta Neurobiol. Exp. 2004, 64, 143–151. [Google Scholar] [CrossRef]
- Klimesch, W.; Sauseng, P.; Hanslmayr, S. EEG alpha oscillations: The inhibition–timing hypothesis. Brain Res. Rev. 2007, 53, 63–88. [Google Scholar] [CrossRef]
- Peng, W.; Hu, Y.; Mao, Y.; Babiloni, C. Widespread cortical α-ERD accompanying visual oddball target stimuli is frequency but non-modality specific. Behav. Brain Res. 2015, 295, 71–77. [Google Scholar] [CrossRef] [PubMed]
- Pfurtscheller, G.; Maresch, H.; Schuy, S. Inter- and intrahemispheric differences in the peak frequency of rhythmic activity within the alpha band. Electroencephalogr. Clin. Neurophysiol. 1977, 42, 77–83. [Google Scholar] [CrossRef] [PubMed]
- M. S. Worden, J.J. Foxe, N. Wang, C.V. Simpson, Anticipatory biasing of visuospatial attention indexed by retinotopically specific alpha band electroencephalography increases over occipital cortex. J Neurosci. 2000, 20, 1–6. [Google Scholar]
- Fraga, F.J.; Mamani, G.Q.; Johns, E.; Tavares, G.; Falk, T.H.; Phillips, N.A. Early diagnosis of mild cognitive impairment and Alzheimer’s with event-related potentials and event-related desynchronization in N-back working memory tasks. Comput. Methods Programs Biomed. 2018, 164, 1–13. [Google Scholar] [CrossRef] [PubMed]
- American Electroencephalography Society. Guideline Thirteen. J Clin Neurophysiol. 1994, 11, 111–113. [Google Scholar] [CrossRef]
- Gratton, G.; Coles, M.G.H.; Donchin, E. A new method for off-line removal of ocular artifact. Electroencephalogr. Clin. Neurophysiol. 1983, 55, 468–484. [Google Scholar] [CrossRef]
- Keil, A.; Müller, M.M. Feature selection in the human brain: Electrophysiological correlates of sensory enhancement and feature integration. Brain Res. 2010, 1313, 172–184. [Google Scholar] [CrossRef]
- David, O.; Kilner, J.M.; Friston, K.J. Mechanisms of evoked and induced responses in MEG/EEG. NeuroImage 2006, 31, 1580–1591. [Google Scholar] [CrossRef]
- Truccolo, W.A.; Ding, M.; Knuth, K.H.; Nakamura, R.; Bressler, S.L. Trial-to-trial variability of cortical evoked responses: implications for the analysis of functional connectivity. Clin. Neurophysiol. 2002, 113, 206–226. [Google Scholar] [CrossRef]
- Padrón, I.; Fernández-Rey, J.; Acuña, C.; Pardo-Vazquez, J.L. Representing the consequences of our actions trial by trial: Complex and flexible encoding of feedback valence and magnitude. Neuroscience 2016, 333, 264–276. [Google Scholar] [CrossRef] [PubMed]
- Shitova, N.; Roelofs, A.; Coughler, C.; Schriefers, H. P3 event-related brain potential reflects allocation and use of central processing capacity in language production. Neuropsychologia 2017, 106, 138–145. [Google Scholar] [CrossRef] [PubMed]
- Jia, H.; Li, H.; Yu, D. The relationship between ERP components and EEG spatial complexity in a visual Go/Nogo task. J. Neurophysiol. 2017, 117, 275–283. [Google Scholar] [CrossRef]
- Nenna, F.; Do, C.T.; Protzak, J.; Gramann, K. Alteration of brain dynamics during dual-task overground walking. Eur. J. Neurosci. 2020, 54, 8158–8174. [Google Scholar] [CrossRef] [PubMed]
- Reiser, J.E.; Wascher, E.; Rinkenauer, G.; Arnau, S. Cognitive-motor interference in the wild: Assessing the effects of movement complexity on task switching using mobile EEG. Eur. J. Neurosci. 2020, 54, 8175–8195. [Google Scholar] [CrossRef]
- Verleger, R.; Hamann, L.M.; Asanowicz, D.; Śmigasiewicz, K. Testing the S–R link hypothesis of P3b: The oddball effect on S1-evoked P3 gets reduced by increased task relevance of S2. Biol. Psychol. 2015, 108, 25–35. [Google Scholar] [CrossRef]
- Vázquez-Marrufo, M.; González-Rosa, J.J.; Galvao-Carmona, A.; Hidalgo-Muñoz, A.; Borges, M.; Peña, J.L.R.; Izquierdo, G. Retest Reliability of Individual P3 Topography Assessed by High Density Electroencephalography. PLOS ONE 2013, 8, e62523. [Google Scholar] [CrossRef]
- Chatroudi, A.H.; Rostami, R.; Nasrabadi, A.M.; Yotsumoto, Y. Effect of inhibition indexed by auditory P300 on transmission of visual sensory information. PLOS ONE 2021, 16, e0247416. [Google Scholar] [CrossRef]
- Sabate, M.; Llanos, C.; Enriquez, E.; Gonzalez, B.; Rodriguez, M. Fast modulation of alpha activity during visual processing and motor control. 2011, 189, 236–249. [CrossRef]
- Volosin, M.; Horváth, J. Task difficulty modulates voluntary attention allocation, but not distraction in an auditory distraction paradigm. Brain Res. 2019, 1727, 146565. [Google Scholar] [CrossRef]
- Ghani, U.; Signal, N.; Niazi, I.K.; Taylor, D. A novel approach to validate the efficacy of single task ERP paradigms to measure cognitive workload. Int. J. Psychophysiol. 2020, 158, 9–15. [Google Scholar] [CrossRef] [PubMed]
- Kuehl, L.K.; Brandt, E.S.; Hahn, E.; Dettling, M.; Neuhaus, A.H. Exploring the time course of N170 repetition suppression: A preliminary study. Int. J. Psychophysiol. 2013, 87, 183–188. [Google Scholar] [CrossRef] [PubMed]
- Perri, R.L.; Berchicci, M.; Bianco, V.; Quinzi, F.; Spinelli, D.; Di Russo, F. Perceptual load in decision making: The role of anterior insula and visual areas. An ERP study. Neuropsychologia 2019, 129, 65–71. [Google Scholar] [CrossRef]
- Heinrichs-Graham, E.; Wilson, T.W. Coding complexity in the human motor circuit. Hum. Brain Mapp. 2015, 36, 5155–5167. [Google Scholar] [CrossRef] [PubMed]
- Toledo, D.R.; Barela, J.A.; Manzano, G.M.; Kohn, A.F. Age-related differences in EEG beta activity during an assessment of ankle proprioception. Neurosci. Lett. 2016, 622, 1–5. [Google Scholar] [CrossRef]
- Visani, E.; Mariotti, C.; Nanetti, L.; Mongelli, A.; Castaldo, A.; Panzica, F.; Sebastiano, D.R.; Nigri, A.; Grisoli, M.; Franceschetti, S.; et al. Cortical network dysfunction revealed by magnetoencephalography in carriers of spinocerebellar ataxia 1 or 2 mutation. Clin. Neurophysiol. 2020, 131, 1548–1555. [Google Scholar] [CrossRef]
Figure 1.
A 6x7 electrode matrix for analyses. Fifty-eight scalp derivations are shown. The red electrodes were used to analyze the amplitude differences in all measures between experimental conditions (higher and lower cognitive load). Abbreviations: F (frontal), FC (frontocentral), C (central), CP (central), P (parietal), PO (parietooccipital), L (line), z (zero or midline).
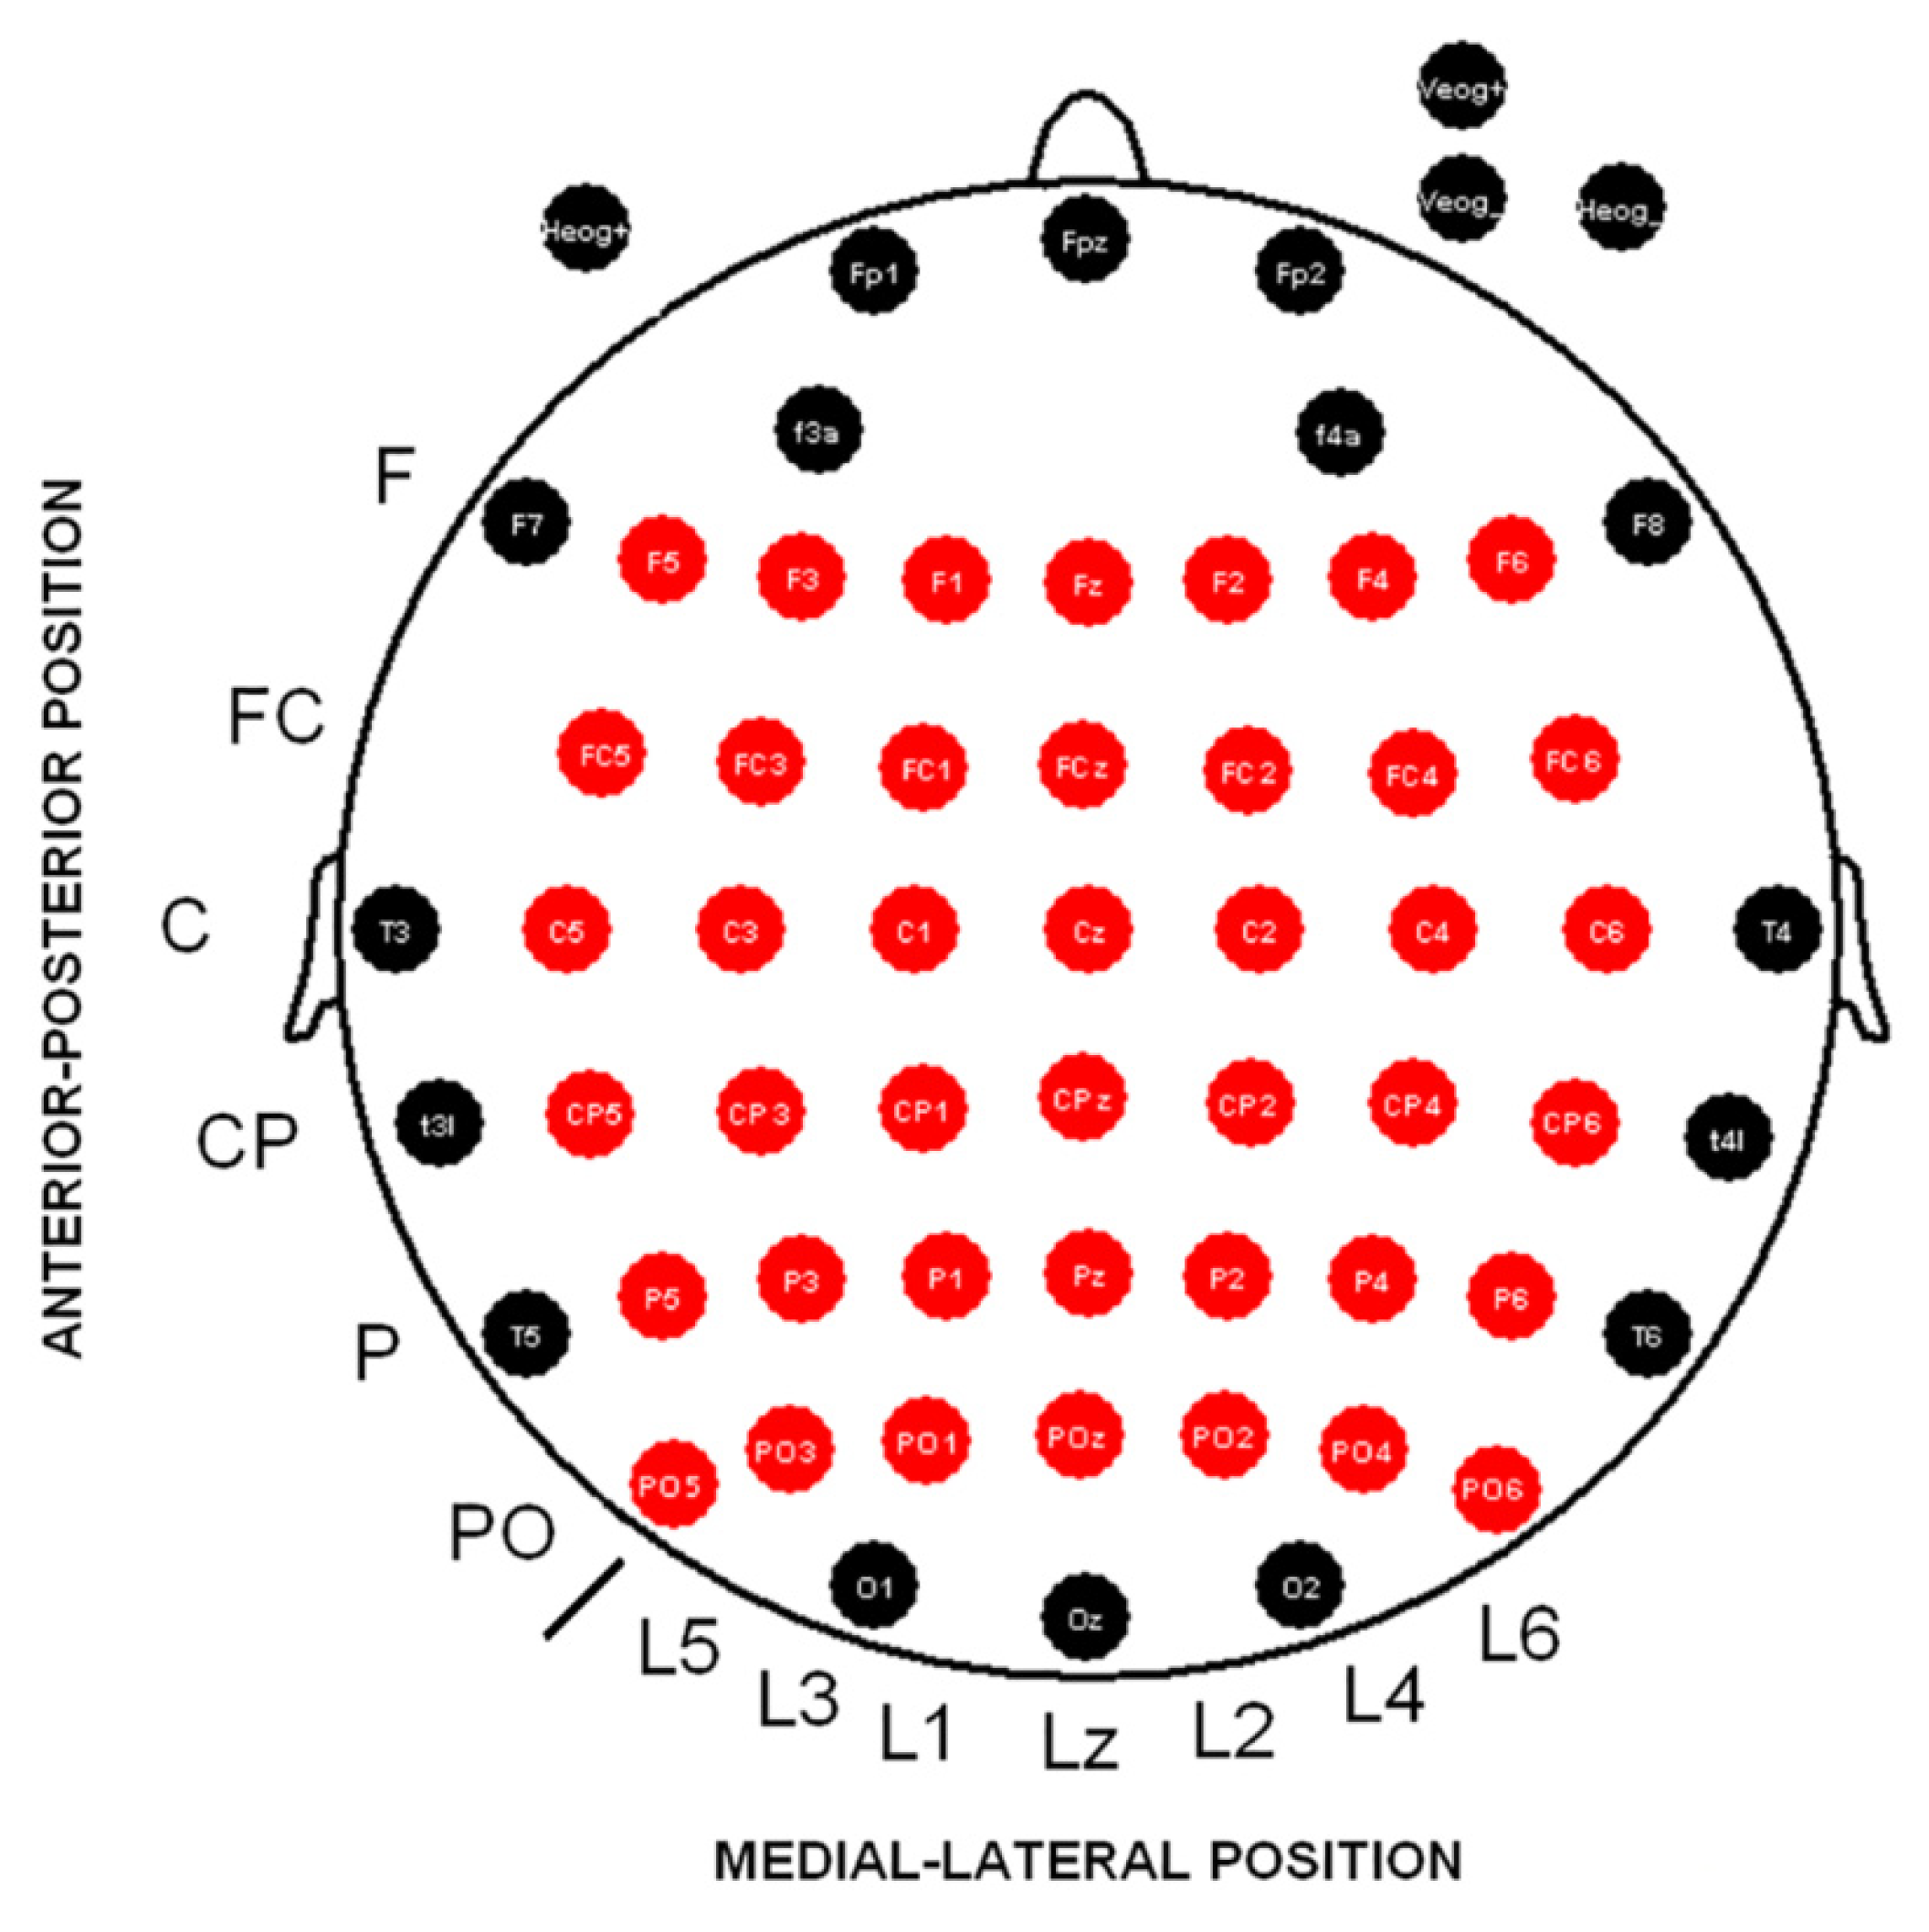
Figure 2.
P3 component (modulations and topographic maps).(a) ERP traces for both tasks (single target (ST) (black trace) and double target (DT) (red trace)). Note that the ST task shows a shorter latency and higher amplitude for the P3 component compared to the DT task. (b) Maps (top and back views) of the P3 component in both tasks. Abbreviations: ms: milliseconds; µV: microvolts.
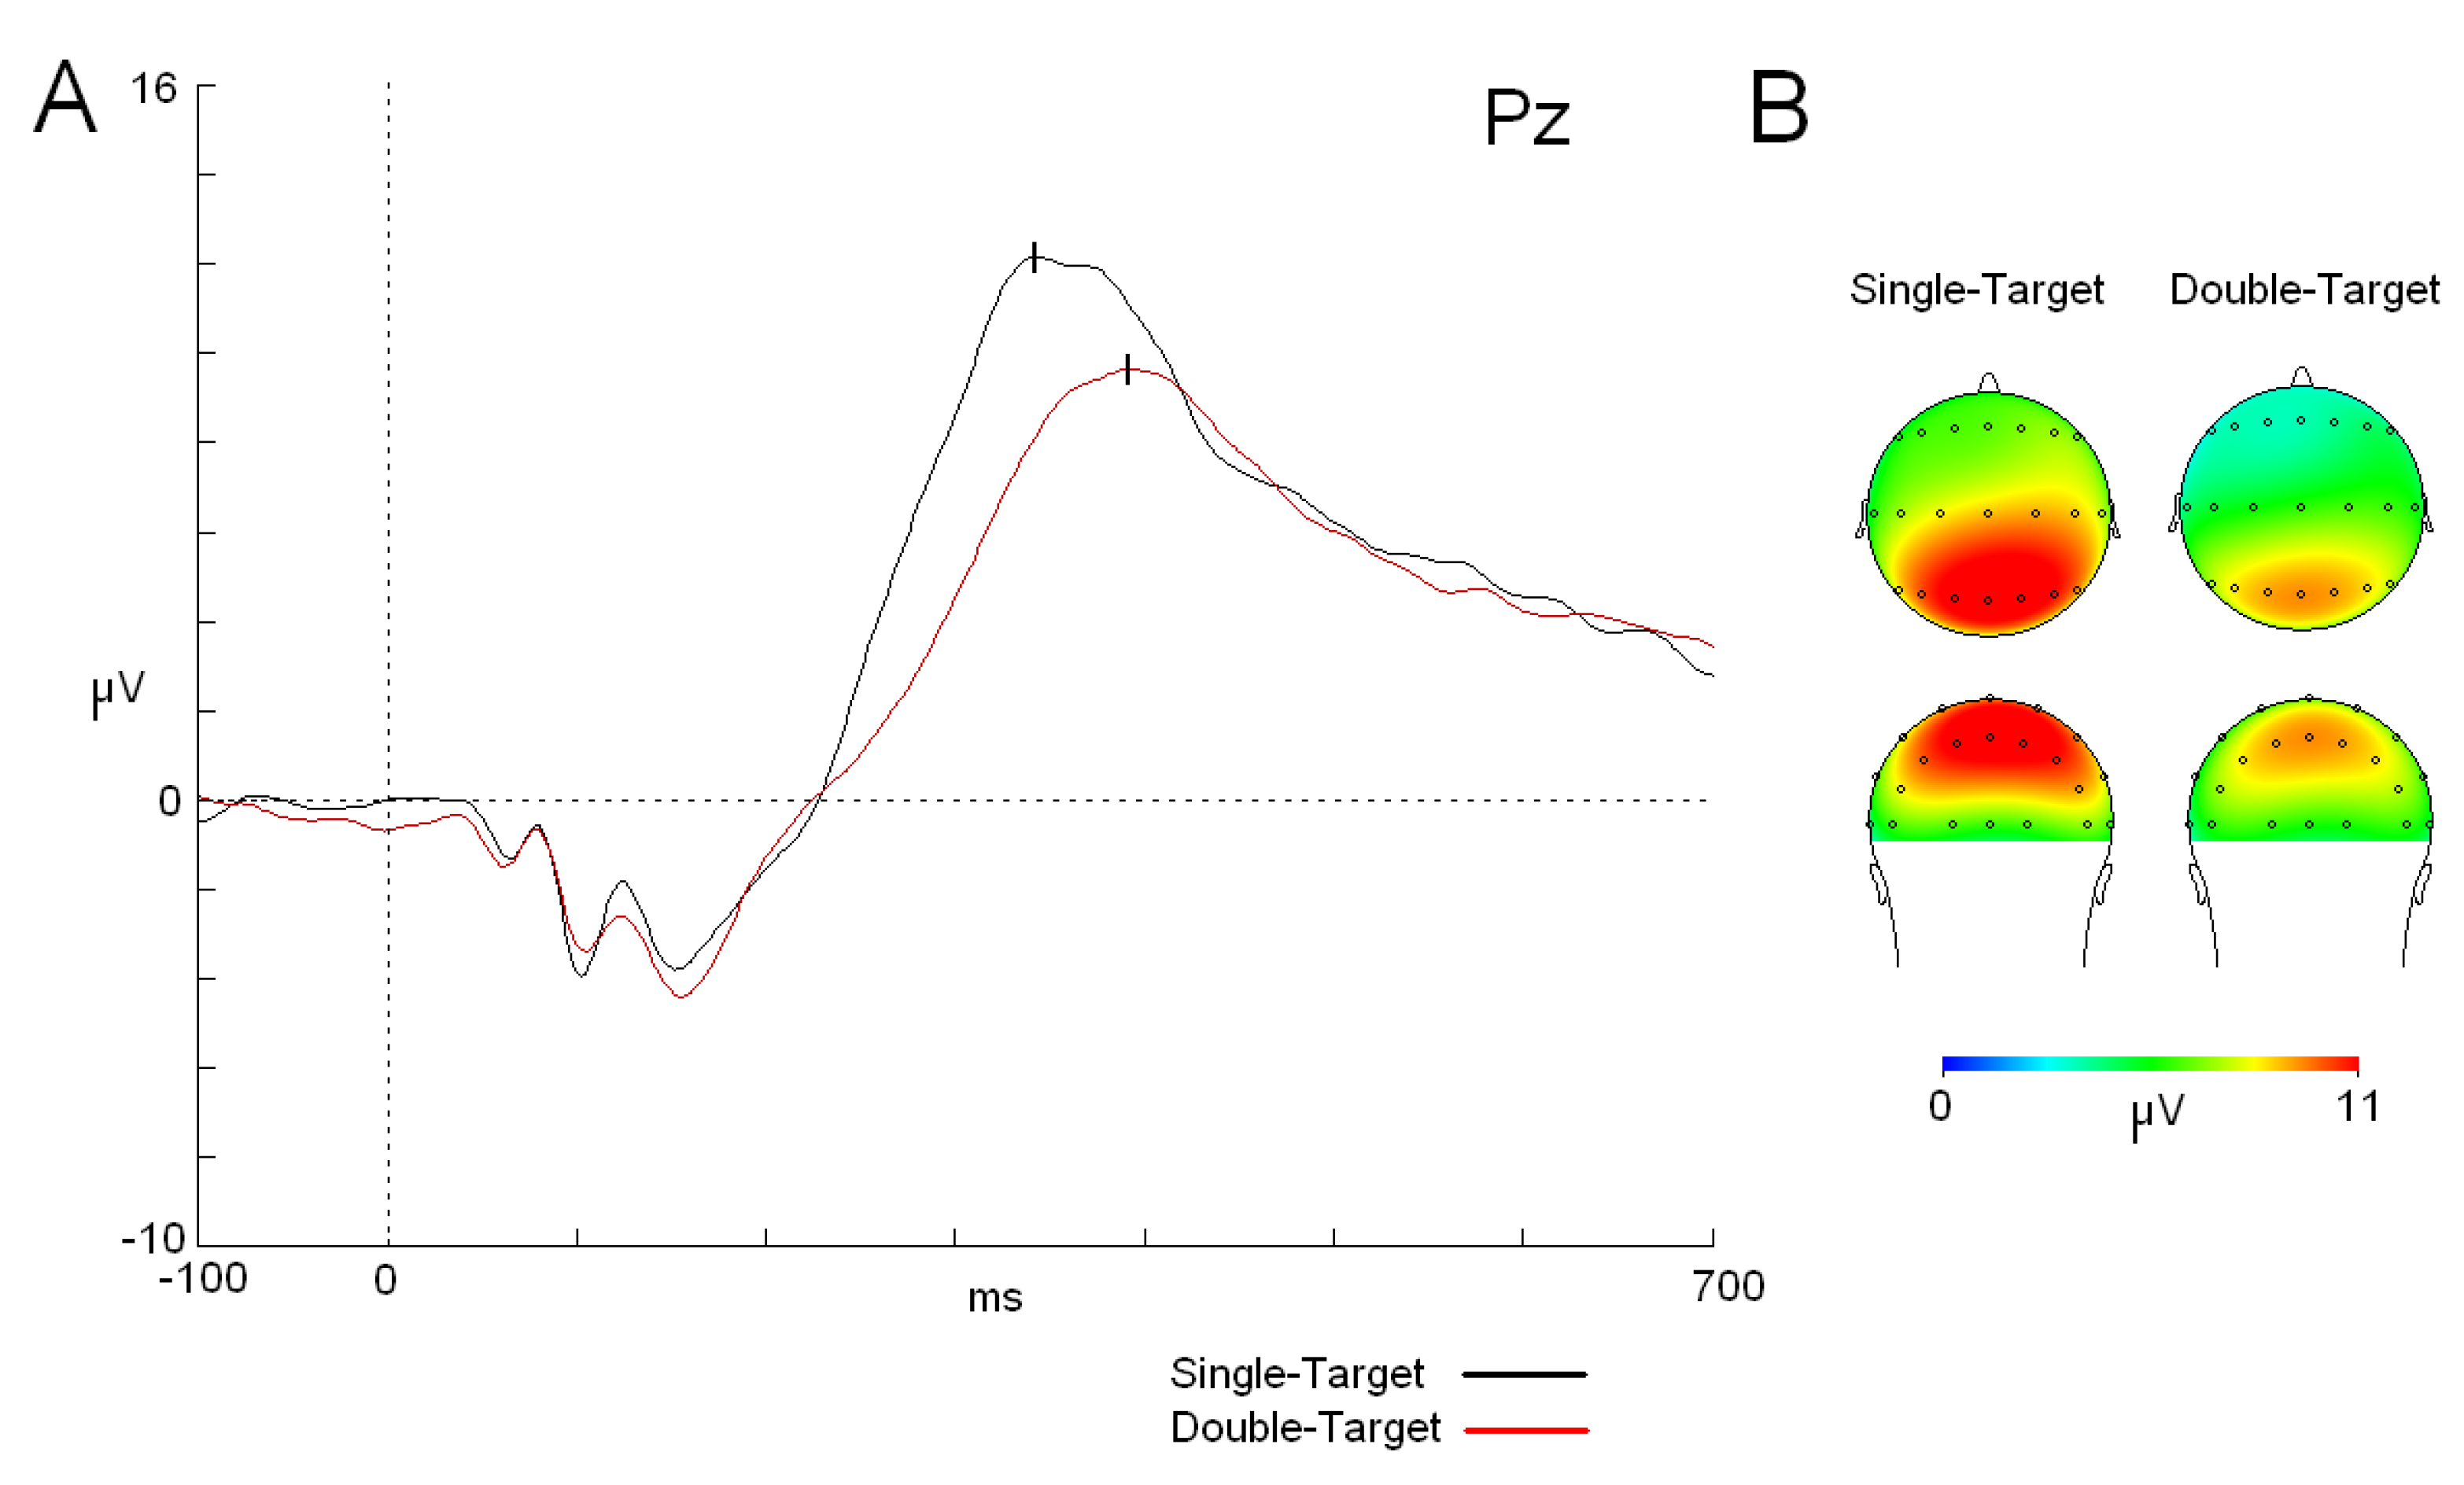
Figure 3.
Alpha waves (modulations and topographic maps). (a)Evoked alpha modulation for both tasks (single target (ST) (black trace) and double target (DT) (red trace) and induced alpha activity (single target (ST) (green trace) and double target (DT) (blue trace). (b) Maps (back view) of the alpha distribution in both tasks. Abbreviations: ms: milliseconds; µV: microvolts.
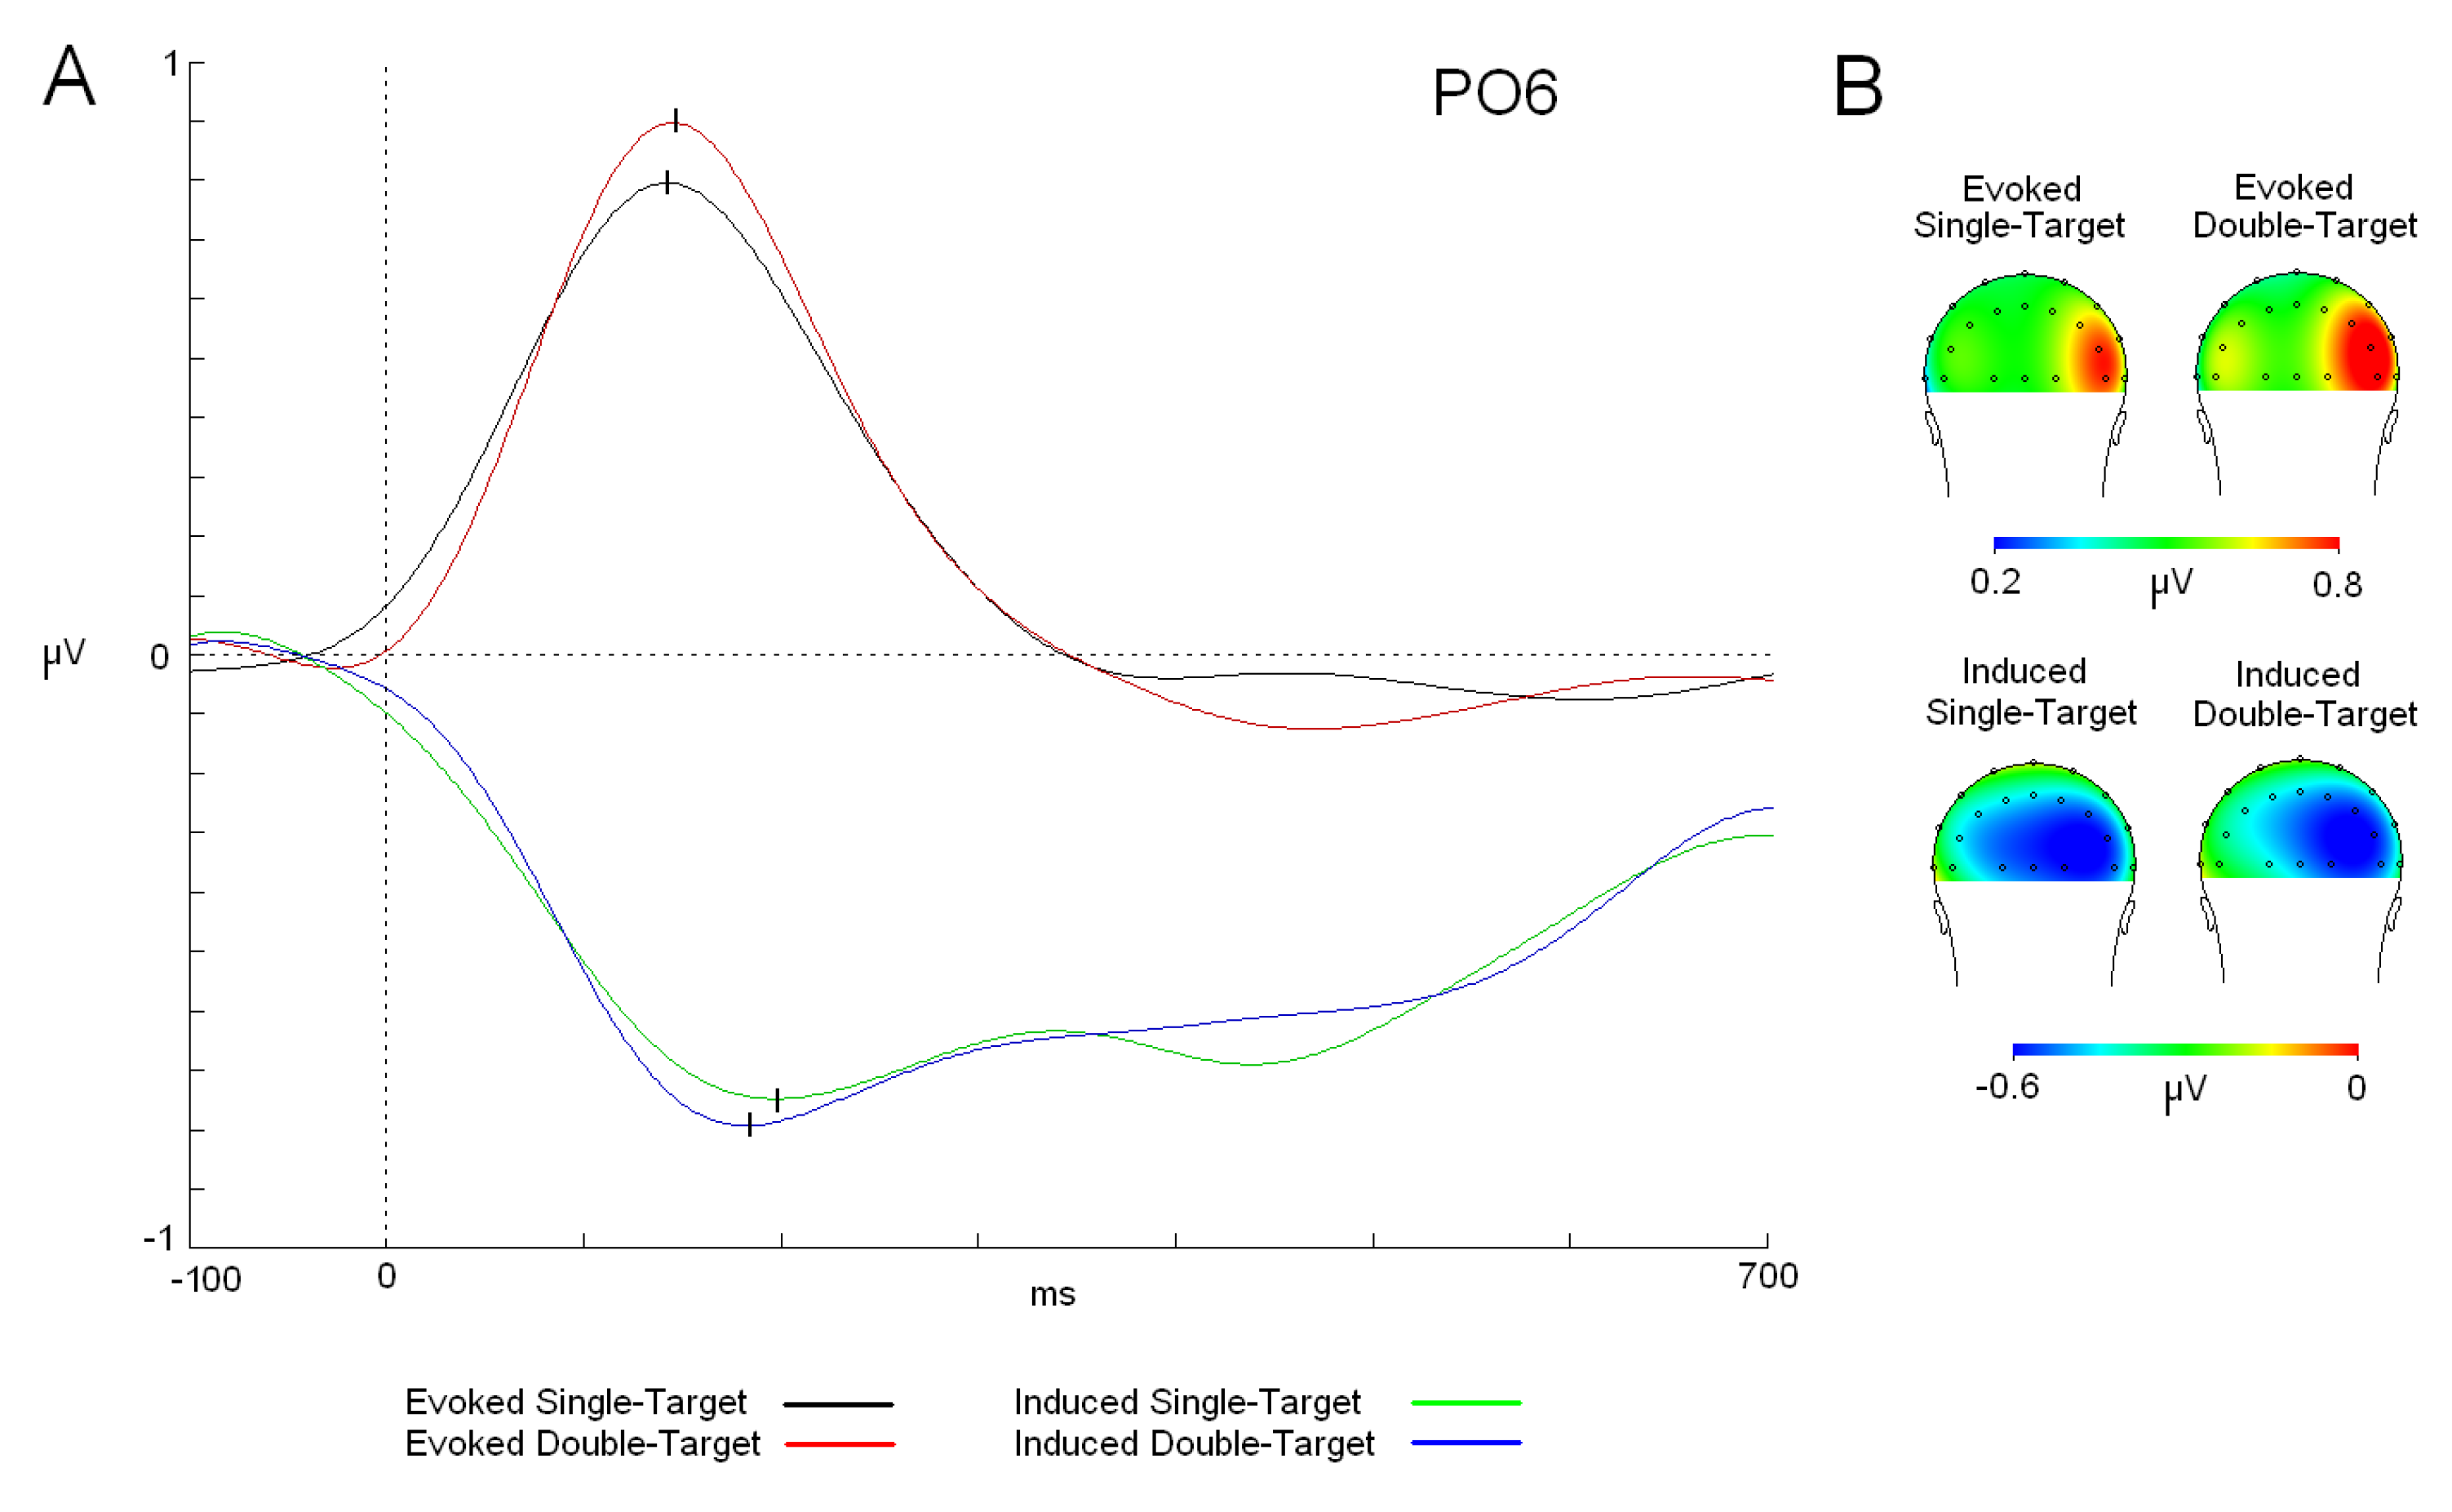
Figure 4.
Polar plotting of phase values for evoked and induced alpha (8–13 Hz) activities and in each subject. The inner circle represents values for the ST task (red dot (evoked) and blue crosses (induced)) and the outer circle values for the DT task (green dot (evoked) and red crosses (induced)).
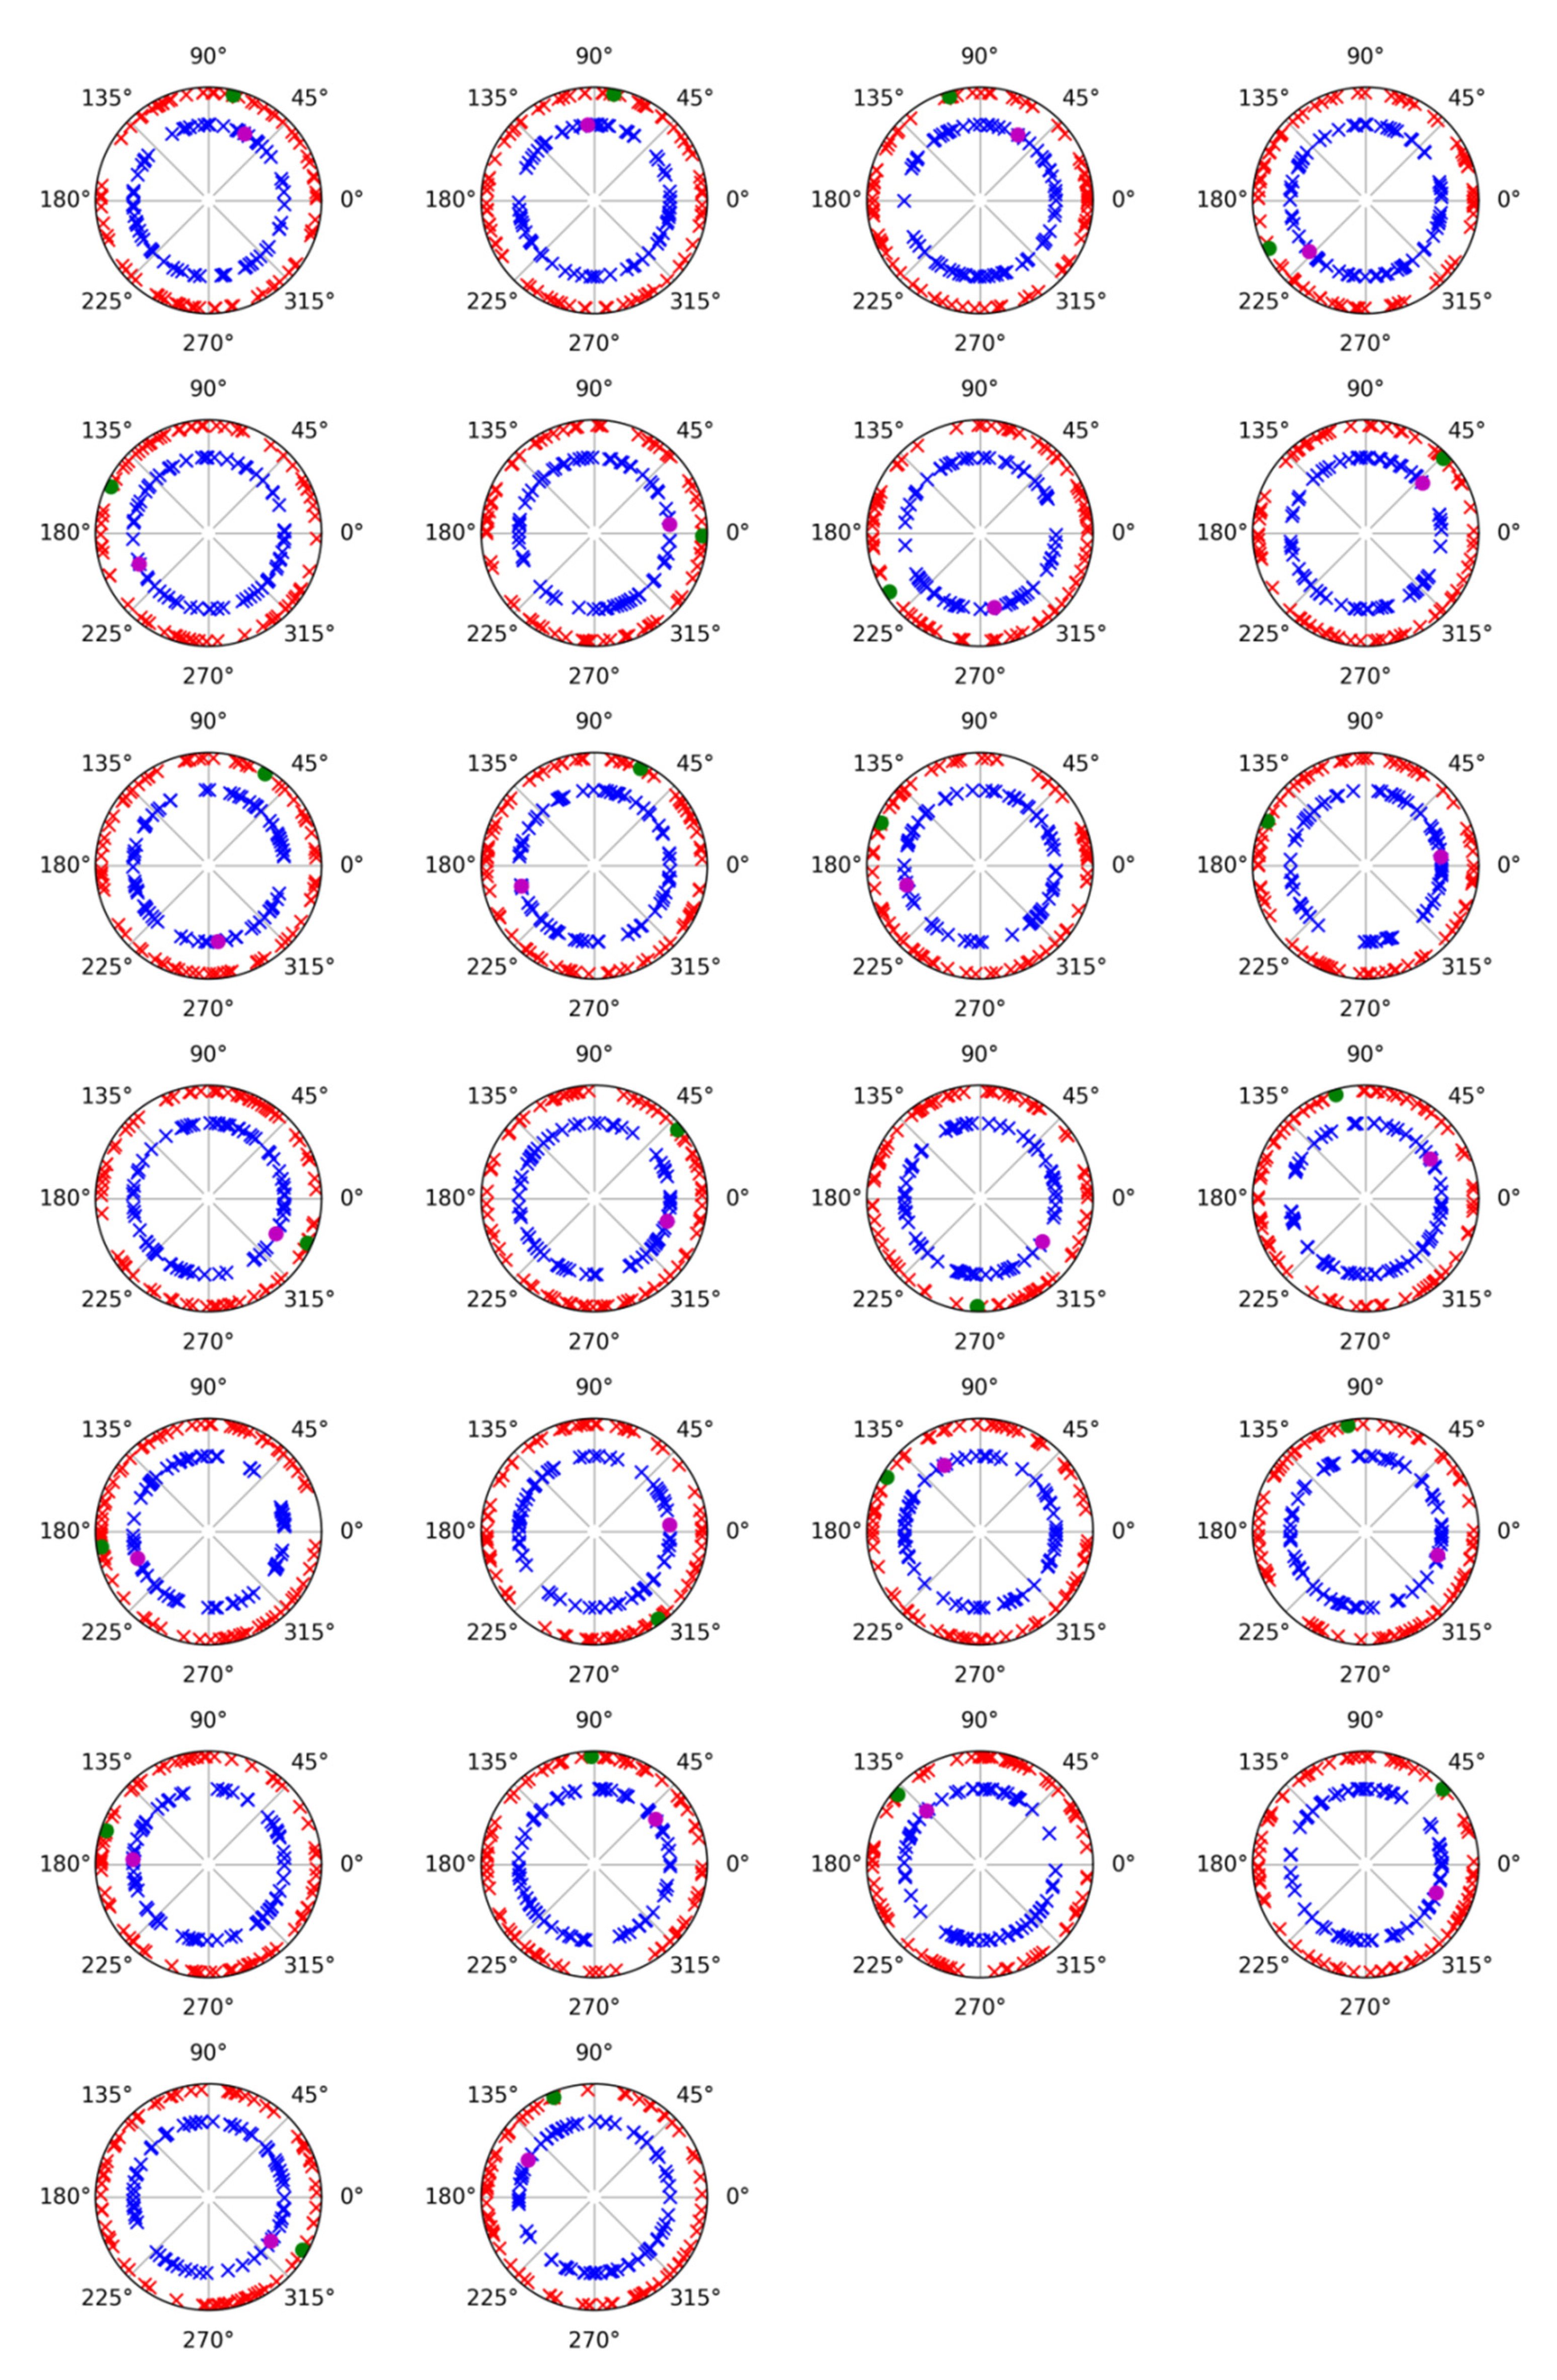

Table 1.
Mean and standard deviation values of behavioral, P3 and alpha band activities.
| Behavioral (mean ± standard deviation) | |||
|---|---|---|---|
| ST | DT | Wilcoxon | |
| Reaction Time | 384 ± 57.09 | 447 ± 73.10 | < 0.001 |
| Accuracy | 99.55 ± 1.21 | 99.51 ± 1.33 | 0.678 |
| ERP | |||
| Latency (mean ± standard deviation) | |||
| ST | DT | P-value | |
| P3 | 353 ± 44 | 405 ± 50 | < 0.001 |
| Alpha | |||
| Latency (mean ± standard deviation) | |||
| ST | DT | P-value | |
| Evoked | 146 ± 34 | 151 ± 28 | 1.000 |
| Induced | 168 ± 72 | 198 ± 95 | 0.197 |
* Abbreviations: ST: single target; DT: double target; ERP: event-related potentials.
Disclaimer/Publisher’s Note: The statements, opinions and data contained in all publications are solely those of the individual author(s) and contributor(s) and not of MDPI and/or the editor(s). MDPI and/or the editor(s) disclaim responsibility for any injury to people or property resulting from any ideas, methods, instructions or products referred to in the content. |
© 2025 by the authors. Licensee MDPI, Basel, Switzerland. This article is an open access article distributed under the terms and conditions of the Creative Commons Attribution (CC BY) license (http://creativecommons.org/licenses/by/4.0/).
Copyright: This open access article is published under a Creative Commons CC BY 4.0 license, which permit the free download, distribution, and reuse, provided that the author and preprint are cited in any reuse.


