
Submitted:
30 August 2024
Posted:
02 September 2024
You are already at the latest version
Abstract
This study addresses the gap in methodological guidelines for Neuroergonomic attention assessment in safety-critical tasks, focusing on validating EEG indices including the Engagement Index (EI) and Beta/Alpha ratio alongside subjective ratings. A novel task-embedded reaction time paradigm was developed to evaluate the sensitivity of these metrics to dynamic attentional demands in a more naturalistic multitasking context. By manipulating attention levels through varying secondary tasks in the NASA MATB-II task while maintaining a consistent primary reaction-time task, the study successfully demonstrated the effectiveness of the paradigm. Results indicate that both Beta/Alpha ratio and EI are sensitive to changes in attentional demands, with Beta/Alpha being more responsive to dynamic variations in attention, and EI reflecting more the overall effort required to sustain performance, especially in conditions where maintaining attention is challenging. The potential for predicting the attention lapses through integration of performance metrics, EEG measures, and subjective assessments was demonstrated, providing a more nuanced understanding of dynamic fluctuations of attention in multitasking scenarios, mimicking those in real-world safety-critical tasks. These findings provide a foundation for advancing methods to accurately monitor attention fluctuations and mitigate risks in critical scenarios, such as train-driving or automated vehicle operation, where maintaining high attention level is crucial.
Keywords:
attention
; neuroergonomics
; EEG
; engagement index
; beta/alpha ratio
; reaction time
; coefficient of variation
; attention ratings
; MATB-II
; safety-critical tasks
1. Introduction
Attention is “[…] a state [of] optimal level of activation that allows selecting the information we want to prioritize in order to control the course of our actions [1], p. 184. It is known to constantly fluctuate [2,3], which poses challenges to maintaining optimal performance. Suboptimal levels of attention are associated with many negative outcomes, particularly in safety-critical scenarios. For instance, it is considered the main cause of car accidents [4]. With the increase in automation in human-machine systems, sustaining attention to the task is becoming increasingly challenging [5]. To address this issue, Industry 5.0 is focused on implementing adaptive automation solutions, ensuring that systems can respond dynamically to operator’s fluctuating levels of engagement and attention. Feeding the adaptive automation solutions with the real-time information regarding operator’s attention level can mitigate issues of fatigue and excessive or suboptimal workload, leading to the improvement of safety and effectiveness in human-machine systems [6,7]. Therefore, defining accurate and valid indicators that reliably reflect these fluctuations in attention level in real-time is an essential task in Neuroergonomics, a science of human brain in relation to performance at work and everyday settings [8,9,10,11].
While the object of the current focus of attention can be readily detected using wearable eye-tracking technologies, detecting the level of attention allocated to the task poses greater challenges. Continuous innovations in the design of wearable electroencephalograms (EEGs) and Brain Computer Interface (BCI) technology offer a promising solution by providing continuous measurements of the fast-paced electrical activity of the brain on a millisecond timescale. Decreasingly cumbersome designs such as self-adhesive EEG tattoos [12], EEG-integrated headphones [13,14], elastic headbands [15], in-ear [16] and cap designs [17] are overcoming the obtrusiveness and enabling seamless integration with normal daily activities. These designs also eliminate the need for expert setup. In addition, the developments in computational intelligence and algorithms for online pre-processing and de-noising of the EEG signal such as Artifact Subspace Reconstruction (ASR) [18,19], are enabling its use in real-world and dynamical environments even while moving.
Despite the technological advancements equipping us with the tools for acquiring brain signals in real-world environments, the methodological guidelines on the use of EEG for tracking attention level ‘in the wild’ are lacking. One of the most commonly used methods for evaluating mental states in dynamic tasks and real-world scenarios are frequency-based metrics obtained by transforming the continuously recorded EEG signals (during specific task execution) from time- into frequency- domain. Typically, these signals are described in terms of frequency bands such as delta (0.2-3.5 Hz), theta (4 – 7.5 Hz), alpha (8 - 13), beta (14 – 30 Hz), and gamma (30 – 90 Hz) [20]. These bands were somewhat arbitrarily defined, but factor analysis of EEG spectrograms showed a substantial overlap with classically accepted frequency ranges [20]. In the equations below they are denoted as δ, θ, α, β, and γ, respectively.
EEG frequency bands are often combined into a ratio, indicating the relative power of specific bandwidths associated with particular mental states, and referred to as an index. Engagement Index is one such metric considered to reflect mental engagement [5,21], attention, vigilance, and/or alertness [22,23]. While different metrics can be found in the literature under the name of Engagement Index, referring to different means of computation, this study focuses on two variants most frequently used. The first variant, originally proposed by Pope et al. [5], is computed as the ratio between slower brain waves in the alpha and/or theta ranges (associated with lower alertness and attention) and faster ones in the beta range (associated with cognitive processing and higher mental engagement). Since the initial studies [5,24] compared different versions of this index and concluded that β/(α+θ) best reflected user’s engagement, we refer to this variant as the Engagement Index (EI). The second version, described by the same authors [24,25], omits the theta power from the equation, representing the ratio of beta to alpha power and is referred to as Beta/Alpha (or B/A for short in the present study).
Both of these indices have been used in a variety of contexts, ranging from lab-based to real-world tasks scenarios [21,26,27,28,29,30,31,32,33,34]. However, while the application of EEG-based indices in assessing attention and engagement levels in dynamic environments is a growing field of interest, the methodological rigor and empirical validation required for their reliable use remain underdeveloped. Although the Engagement Index (EI) has been used in various contexts as an indicator of focused attention and mental engagement, its sensitivity to dynamic changes in attentional demands and its effectiveness in predicting attention lapses in safety-critical environments remains under-explored.
1.1. Related Work
EEG indices including the Engagement Index (EI) and Beta/Alpha ratio (B/A) have been applied in various contexts and have been associated with somewhat related, yet distinct cognitive concepts. For instance, the EI, accompanied by certain proprietary algorithms, is used in NASA’s commercial neurofeedback device Narbis glasses designed to aid in controlling and increasing the wearer’s focus to the task (https://www.narbis.com/). Similarly, it has been used for detecting drops in engagement and vigilance in lab tasks, such as the Conners’ Continuous Performance Test (CPT) [28], as well as in educational contexts, where it was integrated as part of a real-time biofeedback device [34]. Namely, this device was constituted of EEG headset and a scarf that was supposed to deliver haptic feedback whenever a drop in engagement was detected. However, apart from focused and sustained attention, EI has been used in mental workload detection [35,36] and was found to be the best feature for neural network classification of workload during multitasking in NASA Multi-Attribute Task Battery (MATB-II) [36]. Additionally, it has been demonstrated to efficiently differentiate between two levels of engagement in real flight conditions, with increased EI in difficult flying conditions leading to a higher miss rate in detecting auditory probes [37].
While EI has been applied across various contexts, the Beta/Alpha (B/A) ratio is used in an equal, if not even more diverse fields of application. Namely, in addition to lab-based attention tasks such as CPT [21,28], B/A was used in cognitive tasks and Virtual Reality (VR) as a stress indicator. In particular, in the study by [33], the B/A values of 1.5 or above were considered to be indicative of stress during tasks such as reading, writing, and problem solving. Similarly, another study explored the effects of VR roller coaster ride as a method of stress induction on the inverse of B/A, i.e., the Alpha/Beta ratio, revealing negative correlations with stress level [32]. Furthermore, B/A has been used in clinical contexts for diagnostics of cognitive decline and dementia [31], as well as sustained attention performance in patients with traumatic brain injury [28]. Moreover, in neuromarketing research it has been found to be a useful indicator of banner preference and efficiency [30].
Few studies explicitly addressed the question of validity of EI and B/A as indicators of attention level. For instance, in the study by [34], where EI was used to detect the level of engagement in real-time, it was calibrated for each participant by considering the lowest values during relaxation periods and the highest during arithmetic problem-solving. While this approach has merit in determining the individual ranges of EI for real-time use in a specific contexts, its predictive validity and reliability were not examined within the same experimental conditions. Kamzanova et al. [27] conducted a study that addressed the adequacy of EI and other EEG indices for monitoring attention during a 40-minute vigilance task, for the purpose of early detection of vigilance loss. Importantly, they tested which index is most diagnostic of vigilance decrement under two levels of workload and found that lower-frequency alpha bands were more sensitive to changes in task parameters than the EI. However, the authors recommended further research to explore how the diagnosticity of EEG indices varies with task demands.
There is somewhat stronger evidence supporting the association between the Beta/Alpha ratio and attention levels. Specifically, B/A is considered as an index of degree of concentration by [31], as it seemed to successfully differentiate between healthy subjects and those with Mild Cognitive Impairment, and Alzheimer’s Dementia, serving as a promising tool for early detection of dementia. Additional support for B/A as an indicator of attention level comes from a lab-based sustained attention study [38], which demonstrated negative correlations between B/A and both mean reaction time and its variation in the CPT task, which are the most reliable objective proxies of attention [3,39,40].
However, these studies mainly involved static lab-tasks that do not reflect the dynamic nature of real-world environments. The lack of consistent validation across various contexts raises concerns about the generalizability and reliability of these indices in more complex, dynamic scenarios, which is crucial for their application in safety-critical environments. As underscored by [41], EEG indices should not be used blindly but must always be empirically validated with respect to their sensitivity, especially in automated systems designed to monitor the operator’s state. Furthermore, the lack of experimental manipulation of attention levels prevents stronger conclusions regarding the relationship between these indices and the level of attention.
In conclusion, while the EI and B/A ratio have shown promising results with respect to reflecting attention levels in controlled environments, their applicability in dynamic, safety-critical tasks remains underexplored and not fully established. This study aims to fill this gap by testing the sensitivity of these indices in a novel, task-embedded reaction time paradigm that allows for the validation of different measures by gradually manipulating the level of attention and continuously sampling the reaction times as an objective indicator. This approach more closely reflects real-world dynamic conditions while maintaining experimental control. By doing so, it seeks to provide a more nuanced understanding of attention and engagement in safety-critical contexts, contributing to the development of more reliable methods for dynamic attention assessment in real-world tasks.
1.2. Research Overview
This study addresses the dual goals of 1) developing and validating a dynamic, naturalistic paradigm for assessing attention and 2) evaluating the effectiveness of EEG Indices in reflecting attention levels in safety-critical scenarios. To achieve these, we followed the methodological steps outlined in Figure 1. The paper outline follows the same structure and is described below.
- We adapted the NASA Multi Attribute Task Battery (MATB-II), a commonly used computer-based task in Neuroergonomics studies, to gradually manipulate the level of attention required to successfully cope with the task. This was achieved by setting a simple reaction-time task as a primary task that participants had to engage with throughout the experiment, which provided a baseline level of attention to this task without any multi-tasking. Two secondary tasks were added incrementally to increase the required level of attention in order maintain task performance.
- By gradually adding the secondary tasks (each combined with the primary task only, and all 3 tasks combined), 4 distinct levels of attentional demands were created (low; medium 1; medium 2; high). To examine the impact of sequence of attentional demands on attention, the sample was divided into two groups, presented with either increasing or decreasing demands, while controlling for fatigue.
- We recorded the physiological signals (EEG, eye-tracking, and ECG; to maintain the text at a comprehensible length, only the EEG signals are discussed in the present paper), performance, and subjective measures of 60 participants while engaging with the task. The EEG data was pre-processed, and two versions of Engagement Index extracted: β/(α+θ) and β/α.
- The experimental paradigm, including the experimental manipulation and fatigue control, was tested and confirmed, establishing the groundwork for EEG indices evaluation.
- The EEG indices were statistically evaluated in their response to different attentional demands as well as to the dynamics of changes in those demands operationalized as increasing vs. decreasing demands.
- The relationship between EEG indices and performance-based measures was examined by testing their overall correlations, as well as within each experimental condition, to gain more nuanced insights into the patterns of their sensitivity.
-
Finally, several regression models combining all the measures (EEG, performance, and subjective ratings) were run to explore the differential contribution of each measure to predicting the attentional lapses. To this purpose we used both a modified Poisson regression, and a number of library models, whose hyperparameters were chosen using an AutoML procedure. Furthermore, we assessed the input feature importance using their Shapley Value.Our hypotheses were:
H1:
Engagement indices will increase with higher attentional demands (as reflected by experimental conditions).
H2:
Engagement indices will correlate with reaction times (RTs) or coefficient of variation (CV) of RTs across different task conditions.
H3:
EEG-based engagement indices will provide more predictive information regarding attention compared to subjective measures.
Our findings indicate differential sensitivity of the two Engagement Index variants to various aspects of attention. The β/α ratio appeared more sensitive to changes in attentional demand, while the EI including θ may reflect the effort to sustain attention and performance. In the context of regression of omissions, representing the attention lapses, on the other variables, the resulting Peason correlation coefficient between the true and the predicted variable from the best model was close to 0.96. In terms of the Shapley Value of the input features we found that the most impactful features were the average reaction time and its coefficient of variation.
To the best of our knowledge, this study is the first to evaluate and compare these two common variants of the Engagement Index in response to varying attentional demands and assess their validity by comparing them with objective and subjective attention indicators, bridging the gap between controlled experimental settings and real-world applications. Our results suggest that combining these two indices along with behavioural and subjective measures, as well as contextual information, can provide a more nuanced understanding of attention levels in safety-critical scenarios.
2. Materials and Methods
2.1. Participants
The study involved 60 participants (mean age = 30.49 years, SD = 7.53, 22 females), mostly postgraduate students. Participation was on a voluntary basis and non-incentivized. All participants signed an informed consent prior to the start of the experiment. The study was approved by The Research Ethics and Integrity Committee of the Technological University Dublin under the reference document REIC-21-48.
2.2. Experimental Paradigm: Task-Embedded Reaction Time
To validate a cognitive state measure, the following components are usually required, according to [42,43]:
a) experimental manipulation of task demands to evoke the change in cognitive state of interest;
b) objective measurements of performance metrics (reaction time, errors etc.)
c) subjective measures capturing participants’ perception of level of difficulty, effort, etc.
To achieve the first requirement, NASA Multi Attribute Task Battery (MATB-II) was selected. As described in detail in section 2.2.1., this task was specifically adapted to experimentally manipulate the level of attention needed to successfully perform the task. To obtain the objective performance indicator, reaction-time and omissions were measured. Embedding a reaction-time task into a multi-tasking scenario allows for continuous, real-time measurement of attention fluctuations. Finally, along with the EEG and performance metrics, subjective measures were recorded, as detailed in section 2.4.
Importantly, to ensure that observed effects of the task are indeed a consequence of different attentional demands, it is also essential to control for important confounds such as fatigue, mental workload, and attentional load sequence. With respect to the control of fatigue levels, the task duration was kept under 30 minutes. Time spent on task, in addition to the task demands, is known to be a contributing factor to performance fluctuation and decline including the increase in reaction time and decrease in accuracy, due to mental fatigue [44,45]. Furthermore, the baseline condition was repeated at the end, to measure if any fatigue effects occurred despite shorter task duration.
Mental workload is inextricably intertwined with engagement and attention in naturalistic tasks, as well as real-world scenarios (one such example is demonstrated in the study by [26]), making it difficult to disentangle their effects. However, attention levels can vary irrespective of workload levels, such as in sustained attention tasks and monotonous conditions. Since these two concepts reflect different aspects of cognitive functioning, efforts should be made to carefully differentiate between them as much as possible. According to [44], multitasking is one of the means through which mental workload or cognitive load can be modulated. In our task, this modulation of the load is mediated by attention, since switching between multiple tasks requires attention switching. As explained in section 2.2.2., describing the task adaptation, none of the subtasks is overly cognitively demanding. It is the requirement to multitask, i.e., to switch attention between them that is demanding. This poses a load on the attentional resources, or in other words, creates different levels of attentional demands. Regardless, to ensure that our paradigm is indeed valid for capturing the changes in attention level, we have extracted the EEG-based Mental Workload Index (MWI). This metric is considered a golden standard in Neuroergonomics and has been shown in numerous studies as a reliable indicator of mental workload [6,10,13,46]. If the MWI demonstrates greater sensitivity to the changes in experimental conditions, that could imply that our task is predominantly sensitive to variations in cognitive load, rather than the level of attention. Therefore, our hypotheses were: (1) that MWI will be less sensitive to the task conditions compared to the Engagement Index; (2) That MWI will not correlate significantly with reaction time to the primary task.
Finally, different dynamics or sequences of task demands were shown by previous studies to significantly impact the physiological, behavioural, and subjective indicators of cognitive constructs such as attention and workload [47]. Therefore, the sequence of task demands (increasing or decreasing) was incorporated as an independent variable into the study design.
2.2.1. Procedure
The experiment was conducted on an individual basis, in a quiet room, with no source of natural light and consistent luminance levels. Upon signing the informed consent, the participant was presented with a video containing detailed task instructions, followed by a short quiz and a practice session, to ensure that the task requirements are fully understood (Figure 2). This was followed by equipment setup and calibration. Before the start of the MATB task, as well as at the end of it, participants are asked to provide a self-assessment of their focus and tiredness levels, which they were previously informed of. This is repeated throughout the task, once per each condition, along with the subjective task difficulty assessment. The order of the questions was randomised, to avoid automatised responses. Depending on the group they were assigned to, they were presented with either an increasing (G1) or decreasing (G2) task demands, which they were not aware of.
2.2.2. MATB-II Task Adaptation
For the purpose of manipulating the attention level required to cope with the task, we adapted the NASA MATB-II task, originally devised for human performance and workload research (Santiago-Espada et al., 2011). The details of task adaptation are also presented in [48]. The main objective of this adaptation was to gradually vary the level of task demand as this is expected to evoke a corresponding degree of mental engagement and attention [5].
In essence, three subtasks were used and combined in such a way to create a gradient of attention demands (Figure 3). The task paradigm consisted of System Monitoring (SysMon; top left rectangle in Figure 3, panel A) set as a primary subtask to which other subtasks were added as secondary tasks. The goal of SysMon is to maintain the constantly oscillating scales in the centre of each of the four bars. The MATB-II includes a training mode which simplifies this subtask by showing a small indicator next to the scale that needs adjusting, which in turn is achieved by simple clicking on the scale in question with a computer mouse. By keeping the training mode throughout the task, the decision-making aspect was eliminated to allow for simple reaction time measurement. The appearance of indicator pointing to a particular scale is denoted here as an ‘event’ and was randomized both temporally (2 – 8 seconds) and spatially (across the four bars), and had a visually displayed lapse time of 10 seconds. There were 60 events presented in each condition, totaling 300 reaction time measurements. In the instances when the participant did not click on the required scale within the 10 seconds, this was marked as an omission.
Irrespective of the sequence of multitasking conditions (group 1: increasing demand; group 2: decreasing demand), both groups of participants were initially presented with condition A1 which was comprised solely of the primary (SysMon), to obtain the baseline reaction time of participants. The same condition was repeated at the end (labelled as A2, Figure 3, panel B) to allow for measuring the effects of fatigue. The multitasking conditions B, C, and D were comprised by adding either Communications subtask (Comm), Resource Management (ResMan), or both, respectively (Figure 3). The Comm subtask involves listening to audio messages and in the instances when the aircraft label is called out, tuning the required radio to the specified frequency. The participant need not engage with this task until an audio message starts, which makes this subtask a bottom-up type of distraction from the primary task. In addition, 5 out of 15 Comm messages were ‘false alarms’ which are not referring to the aircraft label and therefore not requiring any action from participant’s side. On the other hand, the ResMan subtask requires constant monitoring and engagement to maintain the fuel levels in the two main tanks at a required level by clicking on different pumps and transferring the fuel. To make this task more demanding, the pumps between the infinite-source tanks and the main tanks were disabled. Each condition lasted about 5.5 minutes therefore keeping the entire task duration under 30 minutes to avoid confounding effects of fatigue on attention decrements.
2.3. EEG Data Acquisition and Processing
For recording the brain activity during the task, a semi-dry wireless EEG (mBrainTrain) with 24 channels and sampling frequency of 500Hz was used. The Ag/AgCl electrodes are embedded in a cap adhering to the international 10-20 system of electrode placement (Howman, 1988). The cap utilizes sponges immersed in saline solution for conducting the brain signals. The electrodes were referenced online to the FCz electrode, and AFz served as the ground electrode. Online filters were applied for visualisation purposes only. The electrode impedance was set to below 10 kΩ during the preparation and setup.
The raw signals were bandpass filtered offline between 1 and 40 Hz, followed by the removal and interpolation of flat and/or poor signal quality channels (the mean number of such channels per participant was < 1). Artifact removal was achieved via Artifact Subspace Reconstruction (ASR) setting the ASR parameter to the value 13 [18,49]. Since the chosen parameter was not overly strict, residual blink artifacts, lateral eye movement artifacts, as well EMG- , ECG- , and specific channel- noise were eliminated using the infomax Independent Component Analysis [50] (ICA) algorithm (in the implementation provided by the EEGLAB pop_runica() function [51]). Prior to running the ICA, re-referencing to the average reference was done, as recommended in [52]. Since the number of interpolated channels as well as the average re-referencing cause an inevitable loss of unique information due to the linear dependency between certain data points, the number of computed Independent Components (ICs) was adjusted to align with the resulting reduction in the data rank [53]. The mean number of ICs removed per participant was 2.5, ranging from 1 to 7. In the analysis of EEG data, a sliding window of 2 s was used, with a 1 s step size.
2.4. Measures
Following the Neuroergonomics triangulation approach for measuring a specific cognitive function/state, we have collected subjective, behavioral, and physiological measures. Specific metrics are listed in the respective sections below.
2.4.1. Subjective Measures
Three subjective ratings were recorded during the experiment: (1) subjective level of focus (attention); (2) subjective level of tiredness (fatigue); and (3) subjective level of task difficulty. All three were recorded online, in response to an auditory prompt, similar to [42,47,54], and on a Likert scale from 1 to 10, avoiding a central indifference point [55]. The ratings were recorded once halfway through each condition, as well as before and after the start of the task for the subjective focus and fatigue.
2.4.2. Behavioral Measures
Participants’ performance in the MATB-II was recorded. The main variables of interest are (1) the reaction time (RT) to the events in the primary subtask (SysMon); (2) the coefficient of variation in reaction time (CVrt), and (3) the number of omissions made in the primary task.
2.4.3. Physiological Measures
Three groups of physiological measures were recorded: EEG, eye-tracking, and electrocardiographic (ECG). However, this paper focuses only on the EEG-based physiological measures for the sake of conciseness.
The frequency-based measures extracted from the EEG signal are:
(1) Engagement Index (EI) as defined originally by [5], calculated as a ratio between the power of faster brain waves represented by the beta (β) frequency range divided by the sum of powers of slower brain waves represented by the alpha (α) and theta (θ) frequency ranges, as shown in Table 1. Even though the beta band is commonly defined within the range 13-30 Hz, in our study we have limited it to the lower beta range (13 – 22 Hz), following (Pope et al., 1995 ), and since lower beta is more typically associated with attention [56].;
(2) Beta over Alpha Index (shorthand: B/A) defined as the ratio between beta and alpha powers () (also denoted as Engagement Index in some studies such as [38]). For the purpose of comparison, we have computed this index over the same EEG channels as the original EI.;
2.5. Statistical Analyses and Machine Learning Methods
The data analytics comprised a preprocessing phase of data cleaning and two kinds of analytics: analysis of variance (ANOVA) and regression. ANOVA was meant to ascertain whether the attentional demands (conditions) and their time-sequence had a significant impact on the subjective-, behavioral-, and EEG- based measures. Regression was used to understand how the combination of these different groups of measures could help predict and explain the occurrence of safety-critical relevant outcome – attentional lapses, defined as the errors of omission. Since the importance of a variable in prediction depends on the model adopted, we experimented with a considerable number of library models, as detailed below.
Initial inspection of the data revealed several cases of very large number of omissions in the primary task, indicating the neglect of the task. This disqualified 3 participants, since their number of omissions ranged from 47 to 132 SysMon events (16 - 45%), due to which they were excluded from all the analyses. Therefore, all the statistical analyses were conducted on 28 participants from group 1 (time-increasing demand), and 29 participants from group 2 (time-decreasing demand).
A series of mixed measures analysis of variance (ANOVA) were performed to test the impact of attentional demands (repeated factor) and sequence of demands (between-subject factor) on EEG indices, task performance and subjective measures, with Bonferroni correction applied for multiple comparisons. Different correlation coefficients (Pearson’s r, Spearman’s rho, and Kendall’s tau) were computed to examine the relationship between the EEG indices and behavioral (performance) measures.
Regression analysis was carried out with different methods, using a wide library of models provided by the python library pycaret, which implements an AutoML approach. Indeed, the performance of a model depends crucially on the value of its hyperparameters, and the hyperparameter space is huge, this makes the tuning of a model impossible to perform simply by trial and error and requires an automatic approach: pycaret makes such an automatic approach available through a simple API. The regression models made available by the library are the following: Extra Trees Regressor, Huber Regressor, Bayesian Ridge, Ridge Regression, Linear Regression, Least Angle Regression, Random Forest Regressor, Light Gradient Boosting Machine, Gradient Boosting Regressor, K Neighbors Regressor, Orthogonal Matching Pursuit, Extreme Gradient Boosting, AdaBoost Regressor, Lasso Regression, Elastic Net, Lasso Least Angle Regression, Dummy Regressor, Decision Tree Regressor, Passive Aggressive Regressor. All those were run on our data and tuned by Random Grid Search (typically more efficient than exhaustive grid search, which evaluates all possible combinations) then ranked based on typical performance metrics, such as Root Mean Square Error (RMSE) and R2 (Coefficient of Determination). The metrics used for regression performance evaluation were: Mean Absolute Error (MAE), Mean Squared Error (MSE), Root Mean Squared Error (RMSE), Coefficient of Determination (R2), Root Mean Squared Logarithmic Error (RMSLE), and Mean Absolute Percentage Error (MAPE). Their definitions are reported in Table 2.
We also investigated the importance of the input variables in predicting the target variable. To this purpose we adopted the Game Theory based methodology relying on the Shapley Value of the input features [57,58,59,60], which does not evaluate the predictive power of each feature in isolation but keeps into account the features interactivity by considering all the different features coalitions and taking the average of each feature added values. To this purpose we used the SHAP (SHapley Additive exPlanations) python library implementation of the algorithm (https://shap.readthedocs.io/).
Estimating the count of omissions is a problem that can be modelled using a generalized Poisson linear regression model [61]. This type of model is typically used for modeling count data, where the outcome variable is non-negative (e.g., number of events, occurrences, etc.) in this case occurrences of omissions in the primary task. In general, Poisson regression assumes that the mean and the variance of the target variable are equal, which is known as the equidispersion assumption. However, since the variance of omissions as the target variable is significantly higher than the mean (a condition known as overdispersion), using Poisson regression may not be appropriate because it can lead to poor model fit and underestimation standard errors. To avoid this issue the model adopted is a quasi-Poisson regression, which adjusts the standard errors to account for overdispersion. It keeps the Poisson structure but relaxes the equidispersion assumption by allowing the variance to be a linear function of the mean. Since Poisson Regression was not made available within pycaret, Poisson regression was run on the data independently, using R libraries.
3. Results
3.1. Experimental Paradigm Assessment
3.1.1. Experimental Manipulation: The Effect of Attentional Demands on Performance
The Reaction Times to the primary task increased with the increase in attentional demands, as shown in Figure 3. Namely, analysis of variance (F (2.72, 149.55) = 173.98, p < .001, η2 = .76) showed statistically significant differences between all the conditions except between the two baseline conditions (A1 and A2), and between the two dual-tasking conditions (B and C). The task load sequence and its interaction with the attentional demands did not show statistically significant effects (sequence: (F (1, 55) = .25, p = .62); interaction: F (2.72, 149.55) = 1.11, p = .34).
Figure 4.
Mean reaction times in seconds (y-axis) in each experimental condition (n.s. denotes non-significant differences).
Figure 4.
Mean reaction times in seconds (y-axis) in each experimental condition (n.s. denotes non-significant differences).
The Coefficient of Variation in Reaction Time (CVrt) was impacted both by attentional demands (F (2.67, 146.70) = 142.11, p < .001, η2 = .72) and the task load sequence (F (1, 55) = 19.81, p < .001, η2 = .26), while their interaction was not significant (F (2.67, 146.70) = 2.05, p = .12). In the increasing task load sequence (group 1), the differences in CVrt between all the attentional demands were significant, while in the decreasing task load sequence (group 2), the only non-significant difference was that between the two baseline conditions (A1 and A2) (Figure 5). Regardless of the task load sequence, the highest CVrt was observed in condition B (SysMon + Comm subtasks), followed by D (all three subtasks), and then C (SysMon + ResMan).
The average number of omissions in the primary task was relatively low, as shown in Table 3. The proportion of omissions was the highest in conditions B and D (Figure 6). Due to the low variability in the data, Box’s test of equality of covariance matrices could not be computed, and therefore the ANOVA results for the omissions are not reported here.
3.1.2. Fatigue Control
As evident from Figure 4, the RTs in A2 were not significantly different from those in A1. In the increasing load sequence (G1), CVrt increased in A2 compared to A1 (Figure 4, left graph), while no significant change was found for this measure in the decreasing load sequence (G2, right graph in Figure 4).
In terms of the subjectively experienced fatigue, a gradual increase was noted (Figure 7, left panel), peaking during and after the repeated baseline condition (A2). However, its values remained relatively low overall (highest average rating below 6 out of 10). A significant interaction of sequence of demands with the attentional demand conditions on fatigue ratings was found (F(3.80, 205.69) = 2.69, p = .04, η2 = .05), as a consequence of higher fatigue in group 1 during the highest attentional demand condition (D) (Figure 7, right panel).
3.1.3. Mental Workload and Reported Task Difficulty
Mental Workload Index (MWI) reflected only a significant increase in the most demanding condition (D) compared to the least demanding ones (A1 and A2), as shown in Figure 8 (F = 5.419, p = .014, partial η2 = .090). The sequence of the demands (increasing vs. decreasing) did not significantly impact MWI (F = 2.306, p = .135), nor did it interact with the level of attentional demands (F = 1.097, p = .319).
Subjective reports of task difficulty increased with the increase in attentional demands, differing significantly between all conditions (F =122.635, p < .001, partial η2 = .679). Participants’ perceived task difficulty matched the actual levels of attentional load, except that the monotasking condition A2 which was the same as the initial baseline A1, was experienced as more difficult. The subjective level of difficulty was not affected by the sequence of the demands and there was no interaction between them (F = .282, p = .597; F = 1.884, p = .127). The average ratings of task difficulty did not exceed 7/10 even in the most demanding condition.
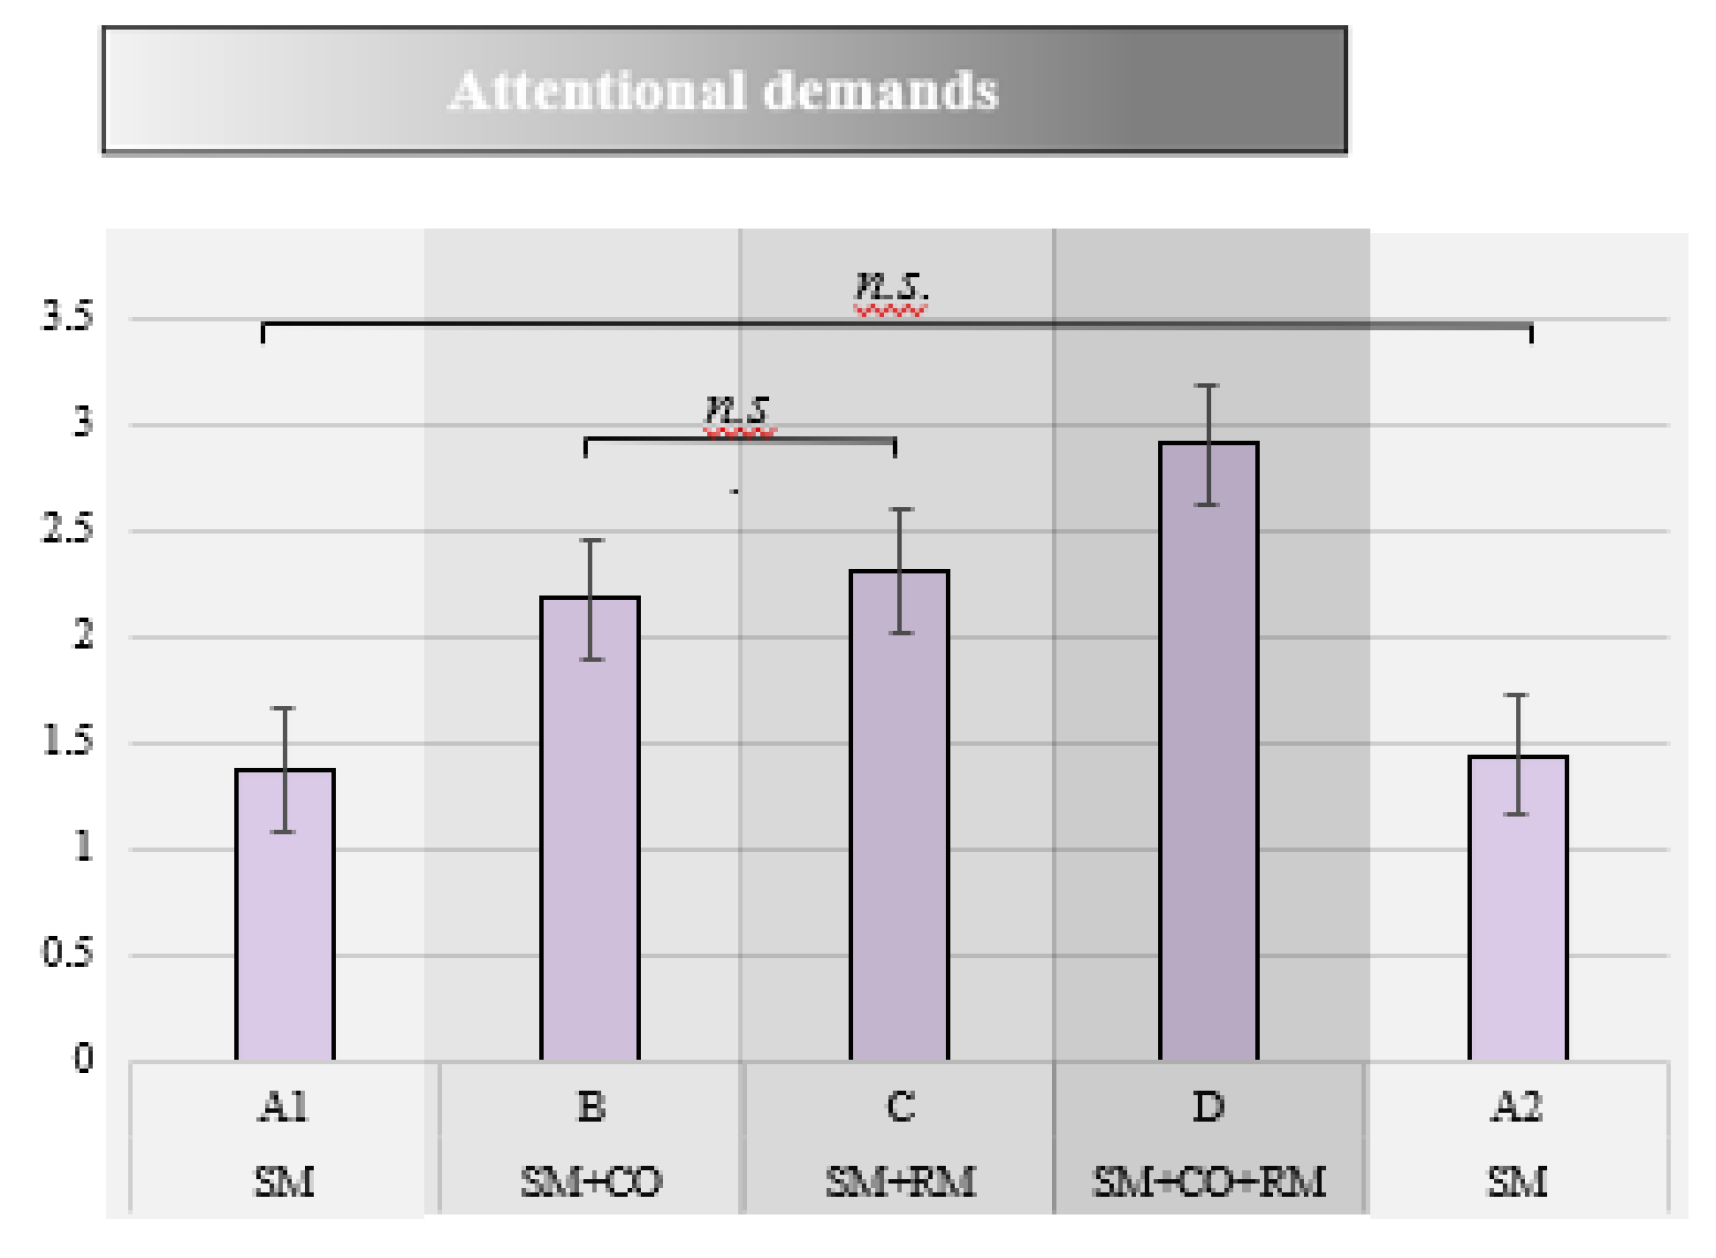
3.2. Sensitivity of Engagement Indices and Subjective Reports of Attention Level
The Engagement Index (EI) was significantly impacted by the changes in attentional demands (F = 4.968, p = .004, partial η2 = .083), but only to a limited extent. Namely, significant differences were found only between conditions A1 and A2, as well as between C and A2 (Figure 8, left side). No effect of interaction nor the sequence of demands was found (F = .136, p = .915; F = .164, p = .687; respectively).
The Beta/Alpha ratio revealed more significant differences between the varying attention demands compared to EI, as shown in Figure 9. Importantly, successive significant differences were found between the first four conditions. Similar to EI, while the effect of the demands on Beta/Alpha were significant (F = 6.248, p = .002, partial η2 = .102), no effect of sequence was found (F = 1.050, p = .310, ), nor its interaction with the level of demand (F = 1.119, p = .334).
Subjectively experienced level of attention also changed significantly in response to the varying attentional demands (F = 23.245, p < .001, partial η2 = .290), but not to their sequence nor interaction (F = .434, p = .513; F = .509, p = .746; respectively). The self-reported attention level was significantly higher in the first four conditions compared to the last condition (repeated baseline), as well as compared to that after the test. After slightly longer than 20 minutes spent on task, irrespective of whether the participants were exposed to a gradual (group 1) or steep (group 2) increase in attentional demands, the subjectively experienced level of attention marked a decline. This is presented visually as a transition between the lighter and darker shaded areas in Figure 10.
A summary comparison between the sensitivity of EEG indices, subjective-, and performance- measures is presented in Table 4. The rows correspond to (1) the effects of varying demands, (2) the direction of their change, and (3) the effect of fatigue onset.
3.3. Correlations between EEG Indices and Reaction Time Measures
Since the above presented ANOVA results indicated that the sequence of demands (group factor) was not a significant in explaining the variability of tested EEG indices between different experimental conditions, nor that of reaction times, the correlation analysis between those measures was conducted on the entire sample (N = 57). Positive correlations were found between average reaction time and both the EI and Beta/Alpha, but not with the Mental Workload Index, as shown in Table 5.
A more nuanced insight into the relationship between reaction time and these indices is offered by looking into the correlation patterns within each condition (Table 6). Both the EI and Beta/Alpha were positively correlated with reaction times; however, significant correlation was not found within all the conditions. The increase in RTs was associated with an increase in EI within the first four conditions, but not in the repeated baseline, as well as with an increase in Beta/Alpha, but only in conditions C and D. MWI did not correlate significantly with RTs in any of the attentional demand conditions.
Unlike all the other tested measures, CVrt was significantly impacted by the sequence of demands, and its correlation with EEG measures was hence examined separately for each group. However, CVrt did not correlate with any of the EEG indices in most of the attentional demand conditions. The only exception was the negative correlation between CVrt and Beta/Alpha within condition B, in the decreasing demands group (r = -.38, p < .05). Despite the absence of significant average correlations, the average trend of CVrt corresponded with that of Beta/Alpha index, while this was not the case with the EI (Figure 11).
3.4. Triangulation of Reaction Time-, EEG-, and Subjective- Measures for Predicting the Lapses in Attention
Finally, the combined contribution of different metrics to predicting attentional lapses was examined. As mentioned earlier, the number of omissions in SysMon was taken as an indicator of lapses in attention. The regression analyses were not intended as a predictive model per se, but as a method to understand how subjective indicators and EEG-related metrics can provide a comprehensive overview of factors influencing performance in attention-related tasks.
The correlation heat map was generated to inspect the intercorrelations among all the variables (Figure 12). Not surprisingly, the average Beta/Alpha and the average Engagement Index were highly correlated (r = .86). Therefore, to avoid multicollinearity issues in a generalized linear regression model, it is advisable to exclude one of these variables when constructing the model. In the presented results, Beta/Alpha ratio was retained as it showed slightly better results.
When considering prediction of omission in different conditions, it is important to note that conditions A1 and A2 (both containing only a single, primary task) were assigned value 1 to numerically indicate the level of attentional demand. Similarly, condition B was assigned value 2, C – value 3, and condition D – value 4. Performing the quasi-Poisson regression on the omissions resulted in the following Equation (1) with its corresponding coefficients and statistical significance presented in Table 7. The model obtained the equivalent of an R² = 0.419, RMSE = 1.707, MAE = 0.844.
Equation 1: Quasi-Poisson regression equation for modeling the number of omissions.
Based on the model and the parameters shown in Table 7, the most predictive variable was average Reaction Time (avg_RT) (z = 11.44, p < 2e-16), followed by the average Coefficient of Variation for the reaction time (avg_CV_RT) (z = 8.04, p = 2.59e-14), and then the Subjective difficulty (SubDiff) (z = 2.973, p = 0.0032), while the other predictors had not reached statistical significance.
To further explore whether other models might integrate EEG indices as meaningful predictors while avoiding the multicollinearity issue, we employed AutoML techniques, thus providing a more comprehensive comparison within the same framework. AutoML, as implemented by pycaret, examined the cross-validated performance of a number of regression models, by searching the hyperparameter space and optimizing the parameters of the model for each set of hyperparameters. The best-performing models were then ranked according to the Coefficient of Determination R2 (representing the proportion of the variance in the dependent variable that is predictable from the independent variables). The Extra Tree Regressor (etr) turned out to be the best performing, not only in terms of R2, but also in terms of the average distances MSE, RMSE, RMSLE (metrics definitions in Table 2); the Pearson correlation coefficient between actual and predicted output value was ρ = 0.9568. Not far from the etr model were ranked a set of typically well performing regressors: Huber’s, Bayesian, Ridge, Linear Least Angle and Random Forest. The results are shown in Table 9.
We also investigated the relative importance of the input features in determining the prediction of the model, using the approximation of the Shapley Value of the features provided by the SHAP python library. For the best model the most influential feature was the average Reaction Time (avgRT), followed by its Coefficient in Variation (avg_CV_RT), then by experimental condition (condition). The results are shown in Figure 13, where features are ranked by mean absolute value of the SHAP values. As shown in the graph, the comparatively higher values of average RT and average CVrt contribute positively to the accuracy of the prediction (helping predict higher values of omissions); analogous considerations hold for subjective ratings of task difficulty (subDiff) and average Beta/Alpha (avg_Beta/Alpha); on the contrary for condition, the lower values are those that improve the accuracy.
4. Discussion
4.1. Experimental Paradigm Assessment
The proposed task-embedded reaction time paradigm involved the MATB-II task adaptation to facilitate the study of attention level changes in a naturalistic setting while still maintaining experimental control and manipulation of variables. The results demonstrated the effectiveness of the experimental manipulation: reaction times indeed increased with the rising attentional demands. While no significant differences were observed between conditions B and C in terms of reaction times, significant differences were found between them in the coefficient of variation in reaction time. Namely, a significantly higher variation in reaction times was found in condition B compared to condition C, which was further supported by a higher number of omissions in the former, indicating that these two conditions indeed pose different attentional demands.
Fatigue was successfully controlled, confirmed both by objective and subjective metrics. With respect to reaction times, no significant difference was found between the baseline condition (A1) containing only the reaction-time task, and the exact same condition repeated at the end of the task (A2), indicating a successful control of fatigue on attention and related performance. As a more sensitive measure of attentional fluctuations, coefficient of reaction time revealed a decrease in the average performance consistency of participants that underwent the increasing demands condition (group 1). Arguably, this could indicate the very onset of fatigue effects, or transient fatigue due to the high attentional demands posed by preceding condition D. However, this effect did not contribute to a significant decrease in performance judging by the reaction time results, nor to an increase in attention lapses, judging by the comparable number of omissions in the two baseline conditions. Subjective experience of fatigue gradually increased during the experiment, showing greater sensitivity to the time on task than to the variations in attentional demands. This is evident from the only significant interaction effect observed between the demands and their sequence: fatigue ratings during the most demanding condition (D) were higher in the increasing demands group (G1) compared to the decreasing one (G2). This was due to the order of conditions – condition D was presented later in G1 compared to G2.
Finally, the task difficulty and mental workload were managed effectively. Subjective ratings of task difficulty almost perfectly reflected the experimentally designed levels of attentional demands. Interestingly, the repeated baseline condition at the end (A2) was experienced as more difficult than the first one (A2). This might also be taken as a sign of slight fatigue onset. Importantly, it indicates the susceptibility of subjective judgement to current mental state, underscoring the importance of not relying solely on subjective indicators in cognitive state assessment. Nevertheless, the average task difficulty ratings did not exceed 7/10 even in the most demanding condition, confirming that the task appeared manageable to the participants. The mental workload index proved sensitive only to the most extreme differences between the least and most demanding conditions, aligning with the task’s design to manipulate attention levels while controlling for fatigue and workload.
4.2. Sensitivity of Engagement Indices and Subjective Reports of Attention Level
The two EEG-based variations of Engagement Index, namely, the Beta/Alpha and the originally proposed Engagement Index (EI), including Theta power in the denominator, demonstrated differential sensitivity to the changes in attention levels. As shown in Table 4, which summarizes the comparative sensitivity of relevant EEG indices, performance, and subjective measures, the Beta/Alpha results supported higher sensitivity to dynamic variations in attention demands. Compared to EI, as well as to MWI, it captured the highest number of significant differences, explaining a greater proportion of variance in the results compared to the other two.
The EI displayed a very limited sensitivity to the variations in attentional demands. Surprisingly, it significantly increased in the repeated baseline condition (A2) compared to the first (A1) and was unexpectedly high relative to other conditions. Since A2 was the last condition in the experiment for all participants, and was rather monotonous and repetitive, containing only the reaction-time task, this seemed unusual. However, this increase could indicate the effort to sustain attention and performance. A similar unexpected pattern of results regarding EI were found in the study by Kamzanova et al. [27], who also found the EI to increase towards the end of the vigilance task. Both findings seem to contradict the assumption that EI “may be more a measure of generalised alertness than of what is usually meant by engagement – a state of active task orientation” [62].
An interesting and important observation is that the significant differences between different attention demands found in the EI are complementary to those found in Beta/Alpha ratio. This appears to indicate that the two indices, although similar, capture different phenomena, suggesting that they should not be used interchangeably, but rather in combination, to provide a more nuanced understanding of attention in the dynamic multitasking environments.
No effects of demands sequence on the two indices were found. This finding holds relevance for practical applications: whether there is a more demanding multitasking condition preceding a more monotonous task or vice versa, does not affect the response of the indices. They are more sensitive to the change in the load, irrespective of the direction of change (increasing or decreasing).
4.3. Correlations between EEG Indices and Reaction Time Measures
The hypothesis regarding the relationship between the Mental Workload Index and reaction times was confirmed. Namely, no significant correlations were found, as the task was designed to be more sensitive to the fluctuations in attention rather than that of mental workload. However, the correlations between the EEG indices and reaction time measures displayed a somewhat unexpected pattern: both the EI and Beta/Alpha correlated positively with reaction times. While the initial expectation was that the increase in EI would lead to faster RTs, the opposite was found. Nevertheless, this could be due to the fact that EI captures the overall level of engagement with the task at a particular moment, while the RTs were indicating the level of attention specifically to the primary task. Therefore, the more engaged participants were with the other tasks, the longer it took them to react to the events in the primary task, yielding a positive correlation. This is supported by the finding of more significant correlations of EI and RT in the multitasking conditions compared to the single-tasking baseline conditions (A1 and A2).
Beta/Alpha correlated with RT only in conditions C and D. As a reminder, both of these contained Resource Managing (ResMan) task, which required constant vigilance from participants, requiring top-down attentional control, unlike the Communications (Comm) task that was activated sporadically and drew the participants’ attention away from the primary task in more of a bottom-up fashion. In the light of this observation, it seems reasonable to expect that the increase in Beta over Alpha power required to deal with ResMan task would be associated with the increase in reaction times to the primary task.
While no correlations were found between the EEG indices and coefficient of variation in reaction time, a similar trend in CVrt and Beta/Alpha was found, as shown in Figure 11. However, it is important to note that these correlations were computed on the average values across each condition (5.5mins approx.) and averaged across the entire sample or across the two groups of participants. Further examination is needed to explore how these measures relate in individual cases.
4.4. Triangulation of Performance-, EEG-, and Subjective- Measures for Predicting the Lapses in Attention
Finally, the overall combination of metrics’ contribution to the prediction of attentional lapses was examined, to test their importance in predicting real world related outcomes. Regression analysis was not primarily used as a prediction model but to explore how subjective indicators and EEG-related metrics might combine to provide a more holistic view of factors influencing performance in attention-related tasks.
The results from the quasi-Poisson regression model revealed important insights into the factors influencing attentional lapses, as measured by omissions. The model demonstrates that average Reaction Time (RT) and the average Coefficient of Variation of Reaction Time (CVrt) are the most significant predictors of the frequency of attentional lapses. Both variables show strong statistical significance, with RT having the highest predictive value, indicating that slower reaction times are strongly associated with increased omissions. Similarly, a higher variability in reaction times as indicated by CVrt also contributes significantly to predicting attentional lapses, underscoring the role of consistency in task performance as an important indicator of attention. While the instantaneous subjective ratings of attention and fatigue did not reach significance in this model, the subjective difficulty did show a statistically significant relationship with the frequency of omissions, although, admittedly, somewhat less pronounced compared to the reaction time metrics. Due to multicollinearity issues, the two EEG indices had to be examined separately within the quasi-Poisson model, and neither showed significant contributions to the prediction. However, it is important to note that in the present study only the average values of these indices over the period of 5.5 minutes were considered equating to the length of the entire condition. Undoubtedly, this underexploits the richness of EEG data and the variations of the indices occurring within those periods. Furthermore, in the present study the variance of omissions was relatively low and only the prediction of their frequency was considered. Future studies should focus on investigating the potential of these indices in predicting the omissions in real-time, as a next important step towards exploring the utility of EEG based attention related indices in safety-critical scenarios.
As a further exploration of the triangulation of all the measures in understanding the occurrence of lapses in attention, AutoML was conducted identifying the Extra Tree Regressor (ETR) as the best-performing model, with a high Pearson correlation coefficient (ρ = 0.9568) between actual and predicted values, indicating strong predictive power for attention lapses. Similarly to the Quasi-Poisson model, among the key features, average reaction time was strongly correlated with attention lapses, suggesting that slower reaction times predict a higher occurrence of lapses. Also, the Coefficient of Variation in Reaction Time was a significant contributor, emphasizing the importance of consistency in performance. Additionally, the experimental condition also played a crucial role, with lower condition values (e.g., A1 & A2, B) leading to better prediction accuracy. However, in conditions A1 and A2, where omissions were nearly absent, the model likely learned to predict this absence of lapses, a pattern not observed in condition B, which had a higher omission rate. This suggests that information about attentional demands can enhance the prediction of lapses, an important consideration for safety-critical contexts such as driving. For example, monitoring the number of driver inputs per minute could serve as an indicator of attentional demands, complementing physiological measures.
The ETR, as the best-performing AutoML model, revealed that the average Beta/Alpha ratio was positively correlated with predicting attention lapses, but not in the expected way. Typically associated with greater focus, higher Beta/Alpha values in this study might have indicated engagement with secondary tasks, which acted as distractors from the primary task, increasing the likelihood of lapses. This finding, coupled with Beta/Alpha ratio’s sensitivity to changes in performance consistency, indicates that it might be more suitable than the Engagement Index (EI) for predicting moment-to-moment fluctuations in attention, which calls for further testing.
Subjective ratings of task difficulty were also found to be associated with increased lapses, underscoring the importance of including subjective measures in predictive models. Similar to the Quasi-Poisson model, the task difficulty was the only significant feature for model’s prediction among the subjective ratings. This might be due to lesser impact of biases when judging an external quality such as task difficulty, compared to self-reflections, like in estimating one’s own level of attention and fatigue.
Overall, the combination of performance metrics (RT and CVrt), EEG measures (Beta/Alpha ratio), and subjective assessments (task difficulty) provided a robust framework for understanding attention dynamics in multitasking scenarios, supporting the value of multi-modal approaches. Incorporating information about attentional demands alongside these measures further improves the prediction of the frequency of attentional lapses, emphasizing the need for a comprehensive, integrated approach in understanding attention-related tasks.
5. Conclusions
This study addressed the lack of methodological guidelines in Neuroergonomic attention assessment in safety critical tasks. Specifically, it sought to validate whether commonly used EEG indices like the Engagement Index (EI) and Beta/Alpha ratio, as well as subjective ratings accurately reflect attention levels, particularly in scenarios where attention lapses can lead to significant safety risks. For that purpose, a novel task-embedded reaction time paradigm was proposed and implemented for validating different metrics’ sensitivity to dynamical variations in attention level. By embedding a reaction-time task into a multi-tasking scenario, the proposed paradigm allows for continuous, real-time measurement of attention fluctuations in a more naturalistic type of task, bridging the gap between lab and real-world studies.
The paradigm successfully manipulated attention levels by gradually altering the number and type of secondary tasks while maintaining a consistent primary reaction-time task. The effectiveness of this manipulation was confirmed through reaction time data. By keeping task duration short and workload manageable, the study controlled for fatigue and overload effects, as verified by both objective and subjective measures. This is crucial for safety-critical applications: developing the methodology to detect the fluctuations in attention in real-time can forestall fatigue or disengagement, potentially preventing accidents—especially in monotonous, vigilance-based tasks like train driving or highly automated scenarios where underload is a significant concern.
The study evaluated EEG-based measures (EI and Beta/Alpha ratio) and instantaneous self-assessments of attention levels in terms of: 1) sensitivity to varying attentional demands, both increasing and decreasing; 2) their relationship with reaction time as an objective proxy for attention levels; and 3) their contribution to predicting omissions, which indicate lapses in attention. While subjective focus ratings did not distinguish between different levels of attentional demand, they significantly dropped after 20 minutes, reinforcing the need for objective indicators.
Both the Beta/Alpha ratio and EI were sensitive to changes in attentional demands, regardless of whether these demands increased or decreased, although to varying extents. The Beta/Alpha ratio proved to be more sensitive to dynamic variations in attention demands, whereas the EI appeared to be more sensitive to the effort required to sustain performance. This implies that measuring EI might be more useful in situations where cognitive load remains constant, but underload is a concern, such as in monotonous driving. While Mental Workload Index is more important in conditions of cognitive overload, the EI is valuable for detecting when attentional effort begins to increase despite a lower or stable load. Understanding these distinctions enhances the interpretability and generalizability of these indices in monitoring task performance in complex, dynamic, and safety-critical real-world environments.
Interestingly, positive correlations were observed between both EI and Beta/Alpha and reaction times, highlighting the importance of combining performance metrics with EEG measures. Further analysis revealed that EI correlated with reaction times primarily in multitasking conditions, while Beta/Alpha correlated with RTs only in conditions requiring more of a top-down control of attention and constant vigilance. However, these findings warrant further investigation.
The combination of performance metrics (reaction time and its coefficient of variation), EEG measures (Beta/Alpha ratio), and subjective assessments (task difficulty) proved significant in predicting the frequency of attentional lapses, demonstrating a potential framework for integrating multiple measures to better understand attention in real-world tasks. Incorporating information about attentional demands alongside these measures further enhances the prediction of lapses, underscoring the need for a comprehensive, holistic approach to attention assessment in safety-critical tasks. Since certain instantaneous self-assessment measures (task difficulty ratings) also contribute to predictions, they should be collected whenever possible, provided it can be done safely and unobtrusively.
While the Beta/Alpha ratio demonstrated greater sensitivity to changes in performance consistency and predicting lapses compared to EI, the EI remains a useful indicator of motivation and effort. The Beta/Alpha ratio may be more suitable for predicting moment-to-moment performance fluctuations and potential attention lapses that could lead to undesirable outcomes. However, further studies focusing on real-time lapse prediction using Beta/Alpha are needed to confirm this. Combining these metrics offers a comprehensive understanding of different aspects of attention related to specific tasks.
The proposed approach has demonstrated its utility and potential for refinement in future studies. It is essential for testing attention-related measures before applying them to simulated or real-world tasks, as it reveals the nuanced sensitivity of different metrics to dynamic variations in attention demands. This study lays the groundwork for further research in specific safety-critical tasks, such as train driving or semi-autonomous vehicle operation, where rapid responses to alerts (like vigilance alarms or takeover requests) are crucial.
Author Contributions
Conceptualization, B.B., M.C.L., and S.C.; methodology, B.B., M.C.L., and S.C; software, B.B. and M.P.; validation, B.B.; formal analysis, B.B., M.P., M.C.L., and G.G.; investigation, B.B.; resources, M.C.L., S.C., and I.G.; data curation, B.B.; writing—original draft preparation, B.B; writing—review and editing, B.B., G.G., I.G., S.C, and M.C.L; visualization, B.B., M.C.L., and G.G; supervision, M.C.L., S.C.; project administration, B.B. and M.C.L.; funding acquisition, M.C.L. All authors have read and agreed to the published version of the manuscript.
Funding
This research was funded by Science Foundation Ireland Centre for Research Training in Digitally-Enhanced Reality (d-real), grant number 18/CRT/6224. The work was also partially supported by the NextGenerationEU program through the project MUSA (National Recovery and Resilience Plan Mission 4 Component 2 Investment Line 1.5 CUPG43C22001370007, CodeECS00000037), and through the project FAIR (Future Artificial Intelligence Research – Spoke 4 - PE00000013 - D53C22002380006) and by the Italian University and Research Ministry, within the Excellence Departments program 2023-2027 (law 232/2016) through the ReGAInS project 2023-NAZ-0207. For the purpose of Open Access, the author has applied a CC BY public copyright license to any Author Accepted Manuscript version arising from this submission.
Institutional Review Board Statement
The study was conducted in accordance with the Declaration of Helsinki, and approved by The Research Ethics and Integrity Committee of the Technological University Dublin (REIC-21-48; 07/04/2022).
Informed Consent Statement
Informed consent was obtained from all subjects involved in the study.
Data Availability Statement
Acknowledgments
We acknowledge Rino Di Chiara for his assistance in the data collection; Dr Bogdan Mijović, Dr Pavle Mijović, and Jelena Jovanović for their guidance and support in EEG data pre-processing; Dr Valeria Villani and Dr Nora Balfe for their support in this work; as well as all the participants for volunteering to take part in the experiment.
Conflicts of Interest
The authors declare no conflicts of interest. The funders had no role in the design of the study; in the collection, analyses, or interpretation of data; in the writing of the manuscript; or in the decision to publish the results.
References
- M. R. Rueda, J. P. Pozuelos, and L. M. Cómbita, “Cognitive neuroscience of attention,” 2015, AIMS Press. [CrossRef]
- M. Esterman and D. Rothlein, “Models of sustained attention ScienceDirect,” Curr Opin Psychol, vol. 29, pp. 174–180, 2019. [CrossRef]
- A. Yamashita et al., “Variable rather than extreme slow reaction times distinguish brain states during sustained attention,” Sci Rep, vol. 11, no. 1, p. 14883, Jul. 2021. [CrossRef]
- Z. Wan, J. He, and A. Voisine, “An Attention Level Monitoring and Alarming System for the Driver Fatigue in the Pervasive Environment,” 2013, pp. 287–296. [CrossRef]
- A. T. Pope, E. H. Bogart, and D. S. Bartolome, “Biocybernetic system evaluates indices of operator engagement in automated task,” Biol Psychol, vol. 40, no. 1–2, pp. 187–195, 1995. [CrossRef]
- P. Aricò et al., “Adaptive Automation Triggered by EEG-Based Mental Workload Index: A Passive Brain-Computer Interface Application in Realistic Air Traffic Control Environment,” Front Hum Neurosci, vol. 10, Oct. 2016. [CrossRef]
- M. Pušica et al., “Mental Workload Classification and Tasks Detection in Multitasking: Deep Learning Insights from EEG Study,” Brain Sci, vol. 14, no. 2, p. 149, Jan. 2024. [CrossRef]
- R. Parasuraman, “Neuroergonomics: Research and practice,” Theor Issues Ergon Sci, vol. 4, no. 1–2, pp. 5–20, 2003. [CrossRef]
- R. K. Mehta and R. Parasuraman, “Neuroergonomics: A review of applications to physical and cognitive work,” Dec. 23, 2013, Frontiers Media S. A. https://doi.org/. [CrossRef]
- H. Ayaz and F. Dehais, Neuroergonomics : the Brain at Work and in Everyday Life. 2019.
- H. Ayaz and F. Dehais, “NEUROERGONOMICS,” in HANDBOOK OF HUMAN FACTORS AND ERGONOMICS, 5th ed., Wiley, 2021, pp. 816–841. [CrossRef]
- A. Mascia, R. Collu, A. Spanu, M. Fraschini, M. Barbaro, and P. Cosseddu, “Wearable System Based on Ultra-Thin Parylene C Tattoo Electrodes for EEG Recording,” Sensors, vol. 23, no. 2, p. 766, Jan. 2023. [CrossRef]
- A. Kartali, M. M. Janković, I. Gligorijević, P. Mijović, B. Mijović, and M. C. Leva, “Real-Time Mental Workload Estimation Using EEG,” 2019, pp. 20–34. [CrossRef]
- S. Ladouce, M. Pietzker, D. Manzey, and F. Dehais, “Evaluation of a headphones-fitted EEG system for the recording of auditory evoked potentials and mental workload assessment,” Behavioural Brain Research, vol. 460, p. 114827, Mar. 2024. [CrossRef]
- D. M. Millstine et al., “Use of a Wearable EEG Headband as a Meditation Device for Women With Newly Diagnosed Breast Cancer: A Randomized Controlled Trial,” Integr Cancer Ther, vol. 18, p. 153473541987877, Jan. 2019. [CrossRef]
- D.-H. Jeong and J. Jeong, “In-Ear EEG Based Attention State Classification Using Echo State Network,” Brain Sci, vol. 10, no. 6, p. 321, May 2020. [CrossRef]
- X. Zhang et al., “Design of a Fatigue Detection System for High-Speed Trains Based on Driver Vigilance Using a Wireless Wearable EEG,” 2017. [CrossRef]
- C.-Y. Chang, S.-H. Hsu, L. Pion-Tonachini, and T.-P. Jung, “Evaluation of Artifact Subspace Reconstruction for Automatic Artifact Components Removal in Multi-Channel EEG Recordings,” IEEE Trans Biomed Eng, vol. 67, no. 4, 2020. [CrossRef]
- M. Plechawska-Wojcik, M. Kaczorowska, and D. Zapala, “The Artifact Subspace Reconstruction (ASR) for EEG Signal Correction. A Comparative Study,” 2019, pp. 125–135. [CrossRef]
- F. Lopes da Silva, “EEG and MEG: Relevance to Neuroscience,” Neuron, vol. 80, no. 5, pp. 1112–1128, Dec. 2013. [CrossRef]
- S. Coelli, R. Sclocco, R. Barbieri, G. Reni, C. Zucca, and A. M. Bianchi, “EEG-based index for engagement level monitoring during sustained attention,” Conf Proc IEEE Eng Med Biol Soc, vol. 2015, pp. 1512–1515, 2015. [CrossRef]
- J. Prinsen, E. Pruss, A. Vrins, C. Ceccato, and M. Alimardani, “A Passive Brain-Computer Interface for Monitoring Engagement during Robot-Assisted Language Learning”. [CrossRef]
- N. Kosmyna and P. Maes, “Attentivu: An EEG-based closed-loop biofeedback system for real-time monitoring and improvement of engagement for personalized learning,” Sensors (Switzerland), vol. 19, no. 23, Dec. 2019. [CrossRef]
- F. Freeman, P. Mikulka, L. Prinzel, M. S.-B. psychology, and undefined 1999, “Evaluation of an adaptive automation system using three EEG indices with a visual tracking task,” Elsevier, Accessed: Aug. 21, 2024. [Online]. Available: https://www.sciencedirect.com/science/article/pii/S0301051199000022?casa_token=Y-ekBZYMI_8AAAAA:9ZDX-67DcZWqQVr6_QT5CLnf8Cl0A5dm5Y3SHSUp37rHohUMjO2PSUSi4lm2jaCIoiCebibb0oU.
- A. T. Pope, E. H. Bogart, and D. S. Bartolome, “Biocybernetic system evaluates indices of operator engagement in automated task,” Biol Psychol, vol. 40, no. 1–2, pp. 187–195, 1995. [CrossRef]
- F. Dehais, R. N. Roy, G. Durantin, T. Gateau, and D. Callan, “EEG-Engagement Index and Auditory Alarm Misperception: An Inattentional Deafness Study in Actual Flight Condition,” 2018, pp. 227–234. [CrossRef]
- A. T. Kamzanova, A. M. Kustubayeva, and G. Matthews, “Use of EEG Workload Indices for Diagnostic Monitoring of Vigilance Decrement,” Human Factors: The Journal of the Human Factors and Ergonomics Society, vol. 56, no. 6, pp. 1136–1149, Sep. 2014. [CrossRef]
- S. Coelli, R. Barbieri, G. Reni, C. Zucca, and A. M. Bianchi, “EEG indices correlate with sustained attention performance in patients affected by diffuse axonal injury,” Med Biol Eng Comput 56, pp. 991–1001, 2018. [CrossRef]
- A. Natalizio et al., “Real-time estimation of EEG-based engagement in different tasks,” J Neural Eng, vol. 21, no. 1, p. 016014, Feb. 2024. [CrossRef]
- A. Kislov, A. Gorin, N. Konstantinovsky, V. Klyuchnikov, B. Bazanov, and V. Klucharev, “Central EEG Beta/Alpha Ratio Predicts the Population-Wide Efficiency of Advertisements,” Brain Sciences 2023, Vol. 13, Page 57, vol. 13, no. 1, p. 57, Dec. 2022. [CrossRef]
- Y. Nishizawa, H. Tanaka, R. Fukasawa, K. Hirao, A. Tsugawa, and S. Shimizu, “Evaluation of Cognitive Decline Using Electroencephalograph Beta/Alpha Ratio During Brain-Computer Interface Tasks,” in International Symposium on Affective Science and Engineering, 2021.
- T. Yi Wen and S. A. Mohd Aris, “Electroencephalogram (EEG) stress analysis on alpha/beta ratio and theta/beta ratio,” Indonesian Journal of Electrical Engineering and Computer Science, vol. 17, no. 1, p. 175, Jan. 2020. [CrossRef]
- M. Salah, U. Yusuf, M. Islam, and S. Roy, “Stress Identification during Sustained Mental Task and Brain Relaxation Modeling with ⁄ Band Power Ratio,” in 4th International Conference on Electrical Information and Communication Technology (EICT), Khulna, Bangladesh, 2019, pp. 1–5. Accessed: Jul. 30, 2024. [Online]. Available: https://ieeexplore.ieee.org/stampPDF/getPDF.jsp?tp=&arnumber=9068748&ref=.
- N. Kosmyna and P. Maes, “Attentivu: An EEG-based closed-loop biofeedback system for real-time monitoring and improvement of engagement for personalized learning,” Sensors (Switzerland), vol. 19, no. 23, Dec. 2019. [CrossRef]
- L. E. Ismail and W. Karwowski, “Applications of EEG indices for the quantification of human cognitive performance: A systematic review and bibliometric analysis,” PLoS One, vol. 15, no. 12, p. e0242857, Dec. 2020. [CrossRef]
- S. Chandra, K. Lal Verma, G. Sharma, A. Mittal, and D. Jha, “EEG BASED COGNITIVE WORKLOAD CLASSIFICATION DURING NASA MATB-II MULTITASKING,” International Journal of Cognitive Research in Science, Engineering and Education, vol. 3, no. 1, pp. 35–41, Jun. 2015. [CrossRef]
- F. Dehais, R. N. Roy, G. Durantin, T. Gateau, and D. Callan, “EEG-Engagement Index and Auditory Alarm Misperception: An Inattentional Deafness Study in Actual Flight Condition,” 2018, pp. 227–234. [CrossRef]
- S. Coelli, R. Sclocco, R. Barbieri, G. Reni, C. Zucca, and A. M. Bianchi, “EEG-based index for engagement level monitoring during sustained attention,” in Proceedings of the Annual International Conference of the IEEE Engineering in Medicine and Biology Society, EMBS, Institute of Electrical and Electronics Engineers Inc., Nov. 2015, pp. 1512–1515. [CrossRef]
- J. Yamashita, H. Terashima, M. Yoneya, K. Maruya, H. Oishi, and T. Kumada, “Pupillary fluctuation amplitude preceding target presentation is linked to the variable foreperiod effect on reaction time in Psychomotor Vigilance Tasks,” PLoS One, vol. 17, no. 10, p. e0276205, Oct. 2022. [CrossRef]
- A. H. Flehmig, M. Steinborn, R. Langner, A. Scholz, and K. Westhoff, “Assessing intraindividual variability in sustained attention: Reliability, relation to speed and accuracy, and practice effects,” Psychology Science, Volume 49. Accessed: Jan. 27, 2024. [Online]. Available: https://www.researchgate.net/publication/26514529_Assessing_intraindividual_variability_in_sustained_attention_Reliability_relation_to_speed_and_accuracy_and_practice_effects.
- A. Hamann and N. Carstengerdes, “Don’t Think Twice, It’s All Right? – An Examination of Commonly Used EEG Indices and Their Sensitivity to Mental Workload,” 2023, pp. 65–78. [CrossRef]
- C. Berka et al., “EEG Correlates of Task Engagement and Mental Workload in Vigilance, Learning and Memory tasks,” Aviat Space Environ Med, vol. 78, no. 5, pp. B231–B244, 2007, Accessed: Feb. 21, 2023. [Online]. Available: https://www.creact.co.jp/wp-content/uploads/2017/10/Publication-ASEM-2007-B-Alert-Cognitive-Workload-Metric-Development.pdf.
- A.-M. Brouwer, T. O. Zander, J. B. F van Erp, J. E. Korteling, and A. W. Bronkhorst, “Using neurophysiological signals that reflect cognitive or affective state: six recommendations to avoid common pitfalls,” Frontiers in Neuroscience | www.frontiersin.org, vol. 9, p. 136, 2015. [CrossRef]
- R. N. Roy, N. Drougard, T. Gateau, F. Dehais, and C. P. C. Chanel, “How Can Physiological Computing Benefit Human-Robot Interaction?,” Robotics, vol. 9, no. 4, p. 100, Nov. 2020. [CrossRef]
- J. F. Mackworth, “PERFORMANCE DECREMENT IN VIGILANCE, THRESHOLD, AND HIGH-SPEED PERCEPTUAL MOTOR TASKS 1,” no. 3, p. 18, 1964.
- G. Borghini et al., “Avionic technology testing by using a cognitive neurometric index: A study with professional helicopter pilots,” in 2015 37th Annual International Conference of the IEEE Engineering in Medicine and Biology Society (EMBC), IEEE, Aug. 2015, pp. 6182–6185. [CrossRef]
- E. Muñoz-de-Escalona, J. J. Cañas, C. Leva, and L. Longo, “Task Demand Transition Peak Point Effects on Mental Workload Measures Divergence,” Communications in Computer and Information Science, vol. 1318, pp. 207–226, 2020.
- B. Bjegojevic, M. C. Leva, S. Cromie, and N. Balfe, “Physiological Indicators for Real-Time Detection of Operator’s Attention,” in Book of Extended Abstracts for the 32nd European Safety and Reliability Conference, Singapore: Research Publishing Services, 2022, pp. 3309–3316. [CrossRef]
- M. Plechawska-Wojcik, M. Kaczorowska, and D. Zapala, “The Artifact Subspace Reconstruction (ASR) for EEG Signal Correction. A Comparative Study,” 2019, pp. 125–135. [CrossRef]
- S. Makeig, T.-P. Jung, A. J. Bell, and T. J. Sejnowski, “Independent Component Analysis of Electroencephalographic Data,” Adv Neural Inf Process Syst, vol. 8, 1995.
- A. Delorme and S. Makeig, “EEGLAB: An open source toolbox for analysis of single-trial EEG dynamics including independent component analysis,” J Neurosci Methods, vol. 134, no. 1, pp. 9–21, Mar. 2004. [CrossRef]
- N. Sanders, S. Choo, and C. S. Nam, “The EEG Cookbook: A Practical Guide to Neuroergonomics Research,” 2020, pp. 33–51. [CrossRef]
- A. Delorme and S. Makeig, “This is no ‘ICA bug’: response to the article, ‘ICA’s bug: how ghost ICs emerge from effective rank deficiency caused by EEG electrode interpolation and incorrect re-referencing,’” Frontiers in Neuroimaging, vol. 2, Dec. 2023. [CrossRef]
- E. Teh, S. Jamson, O. Carsten, and H. Jamson, “Temporal fluctuations in driving demand: The effect of traffic complexity on subjective measures of workload and driving performance,” Transp Res Part F Traffic Psychol Behav, vol. 22, pp. 207–217, Jan. 2014. [CrossRef]
- J. Annett, “Subjective rating scales: science or art?,” Ergonomics, vol. 45, no. 14, pp. 966–987, Nov. 2002. [CrossRef]
- W. J. Ray and H. W. Cole, “EEG activity during cognitive processing: Influence of attentional factors,” International Journal of Psychophysiology, vol. 3, no. 1, pp. 43–48, Jul. 1985. [CrossRef]
- J. Stier, G. Gianini, M. Granitzer, and K. Ziegler, “Analysing Neural Network Topologies: a Game Theoretic Approach,” Procedia Comput Sci, vol. 126, pp. 234–243, Jan. 2018. [CrossRef]
- G. Gianini, L. Ghemmogne Fossi, C. Mio, O. Caelen, L. Brunie, and E. Damiani, “Managing a pool of rules for credit card fraud detection by a Game Theory based approach,” Future Generation Computer Systems, vol. 102, pp. 549–561, Jan. 2020. [CrossRef]
- S. M. Lundberg et al., “From Local Explanations to Global Understanding with Explainable AI for Trees HHS Public Access,” vol. 2, no. 1, pp. 56–67, 2020. [CrossRef]
- S. M. Lundberg, P. G. Allen, and S.-I. Lee, “A Unified Approach to Interpreting Model Predictions,” 2017. Accessed: Aug. 21, 2024. [Online]. Available: https://github.com/slundberg/shap.
- M. Chiara Leva, M. Demichela, L. Comberti, and A. Caimo, “Human performance in manufacturing tasks: Optimization and assessment of required workload and capabilities,” Saf Sci, vol. 154, p. 105838, Oct. 2022. [CrossRef]
- G. R. J. Hockey, P. Nickel, A. C. Roberts, and M. H. Roberts, “Sensitivity of candidate markers of psychophysiological strain to cyclical changes in manual control load during simulated process control,” Appl Ergon, vol. 40, no. 6, pp. 1011–1018, Nov. 2009. [CrossRef]
Figure 1.
Methodological steps followed in the study.
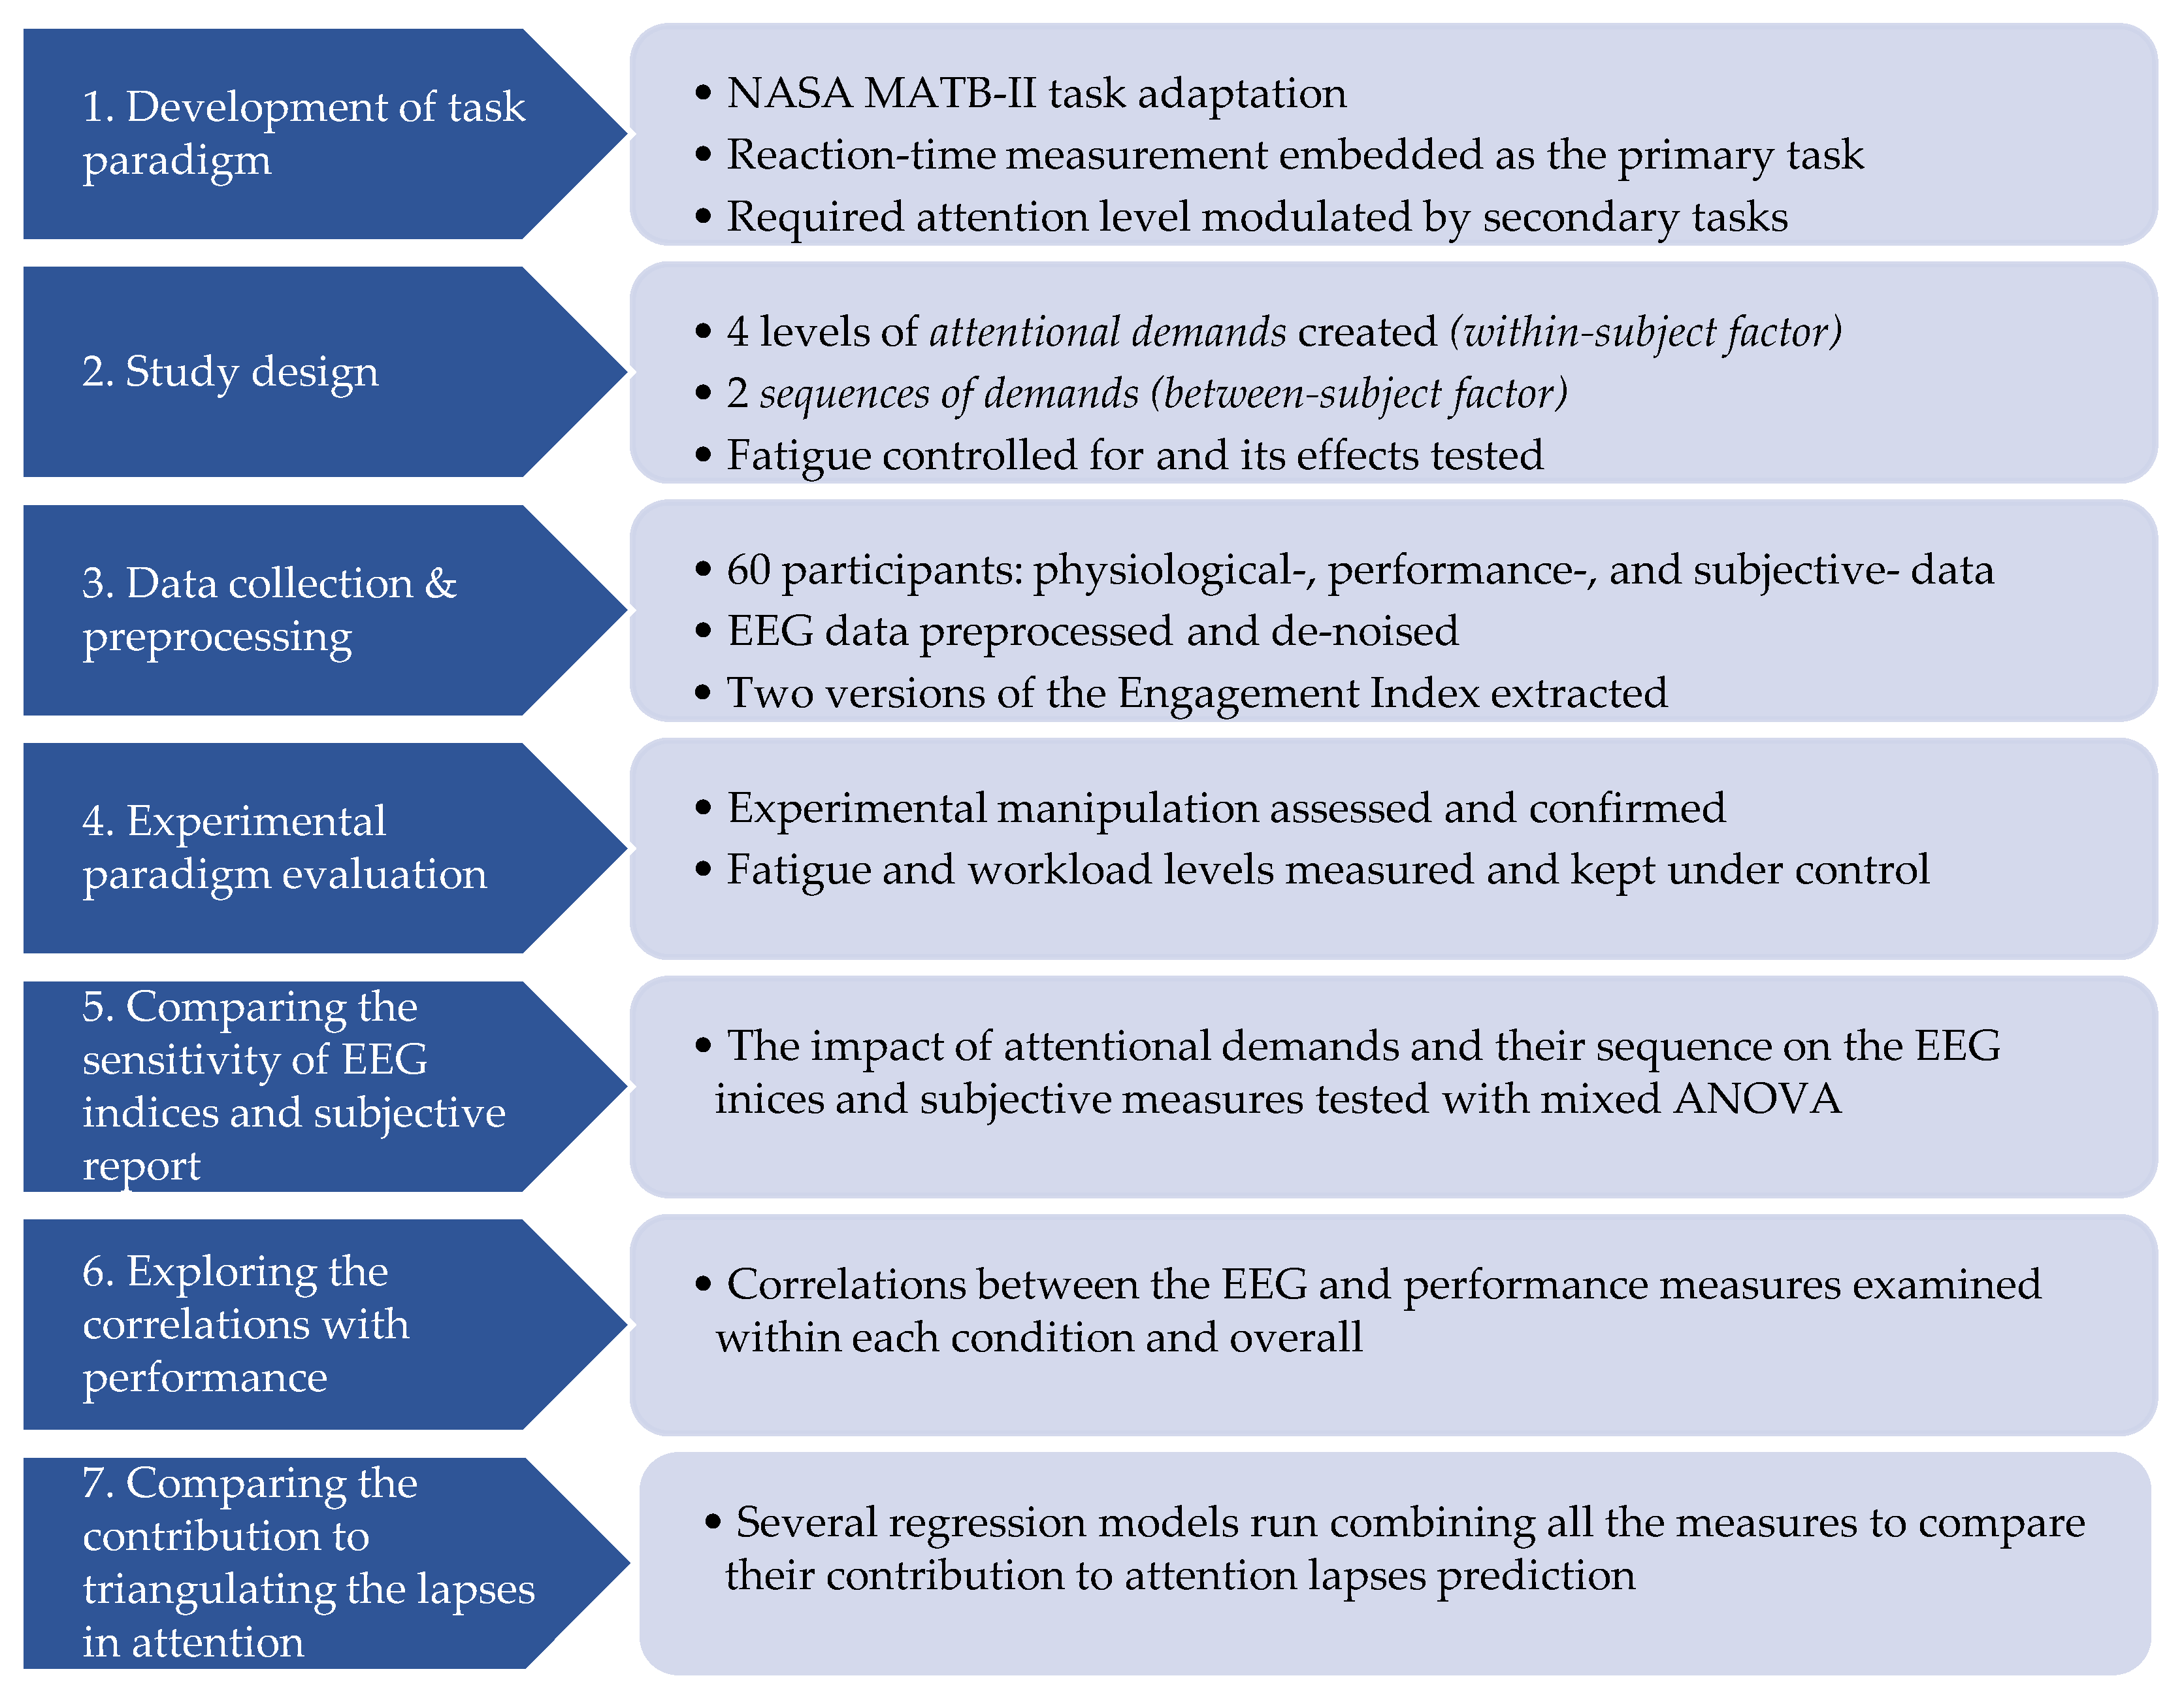
Figure 2.
Experimental protocol and timeline.
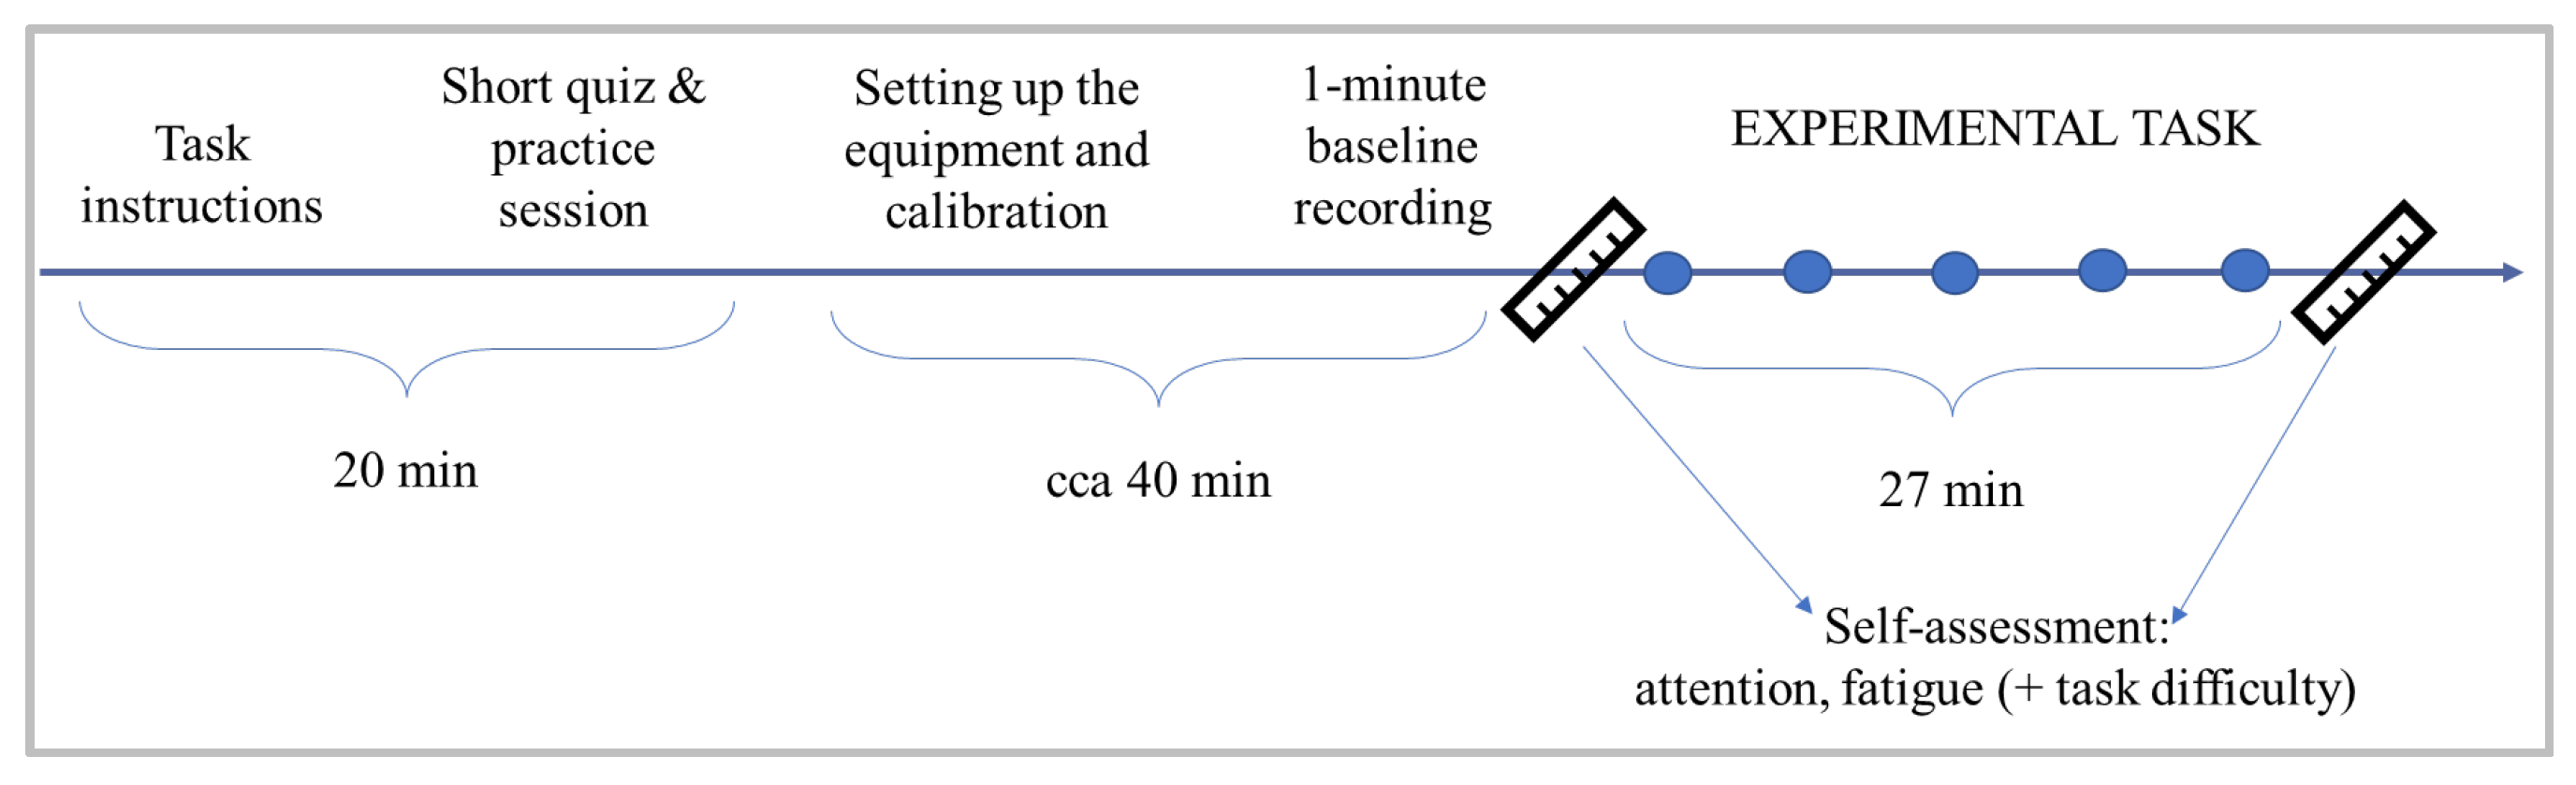
Figure 3.
MATB-II subtasks used in this study (panel A), task conditions representing the level of attention demanded to cope with the task, and their sequences of presentation to the two groups of participants (panel B).
Figure 3.
MATB-II subtasks used in this study (panel A), task conditions representing the level of attention demanded to cope with the task, and their sequences of presentation to the two groups of participants (panel B).
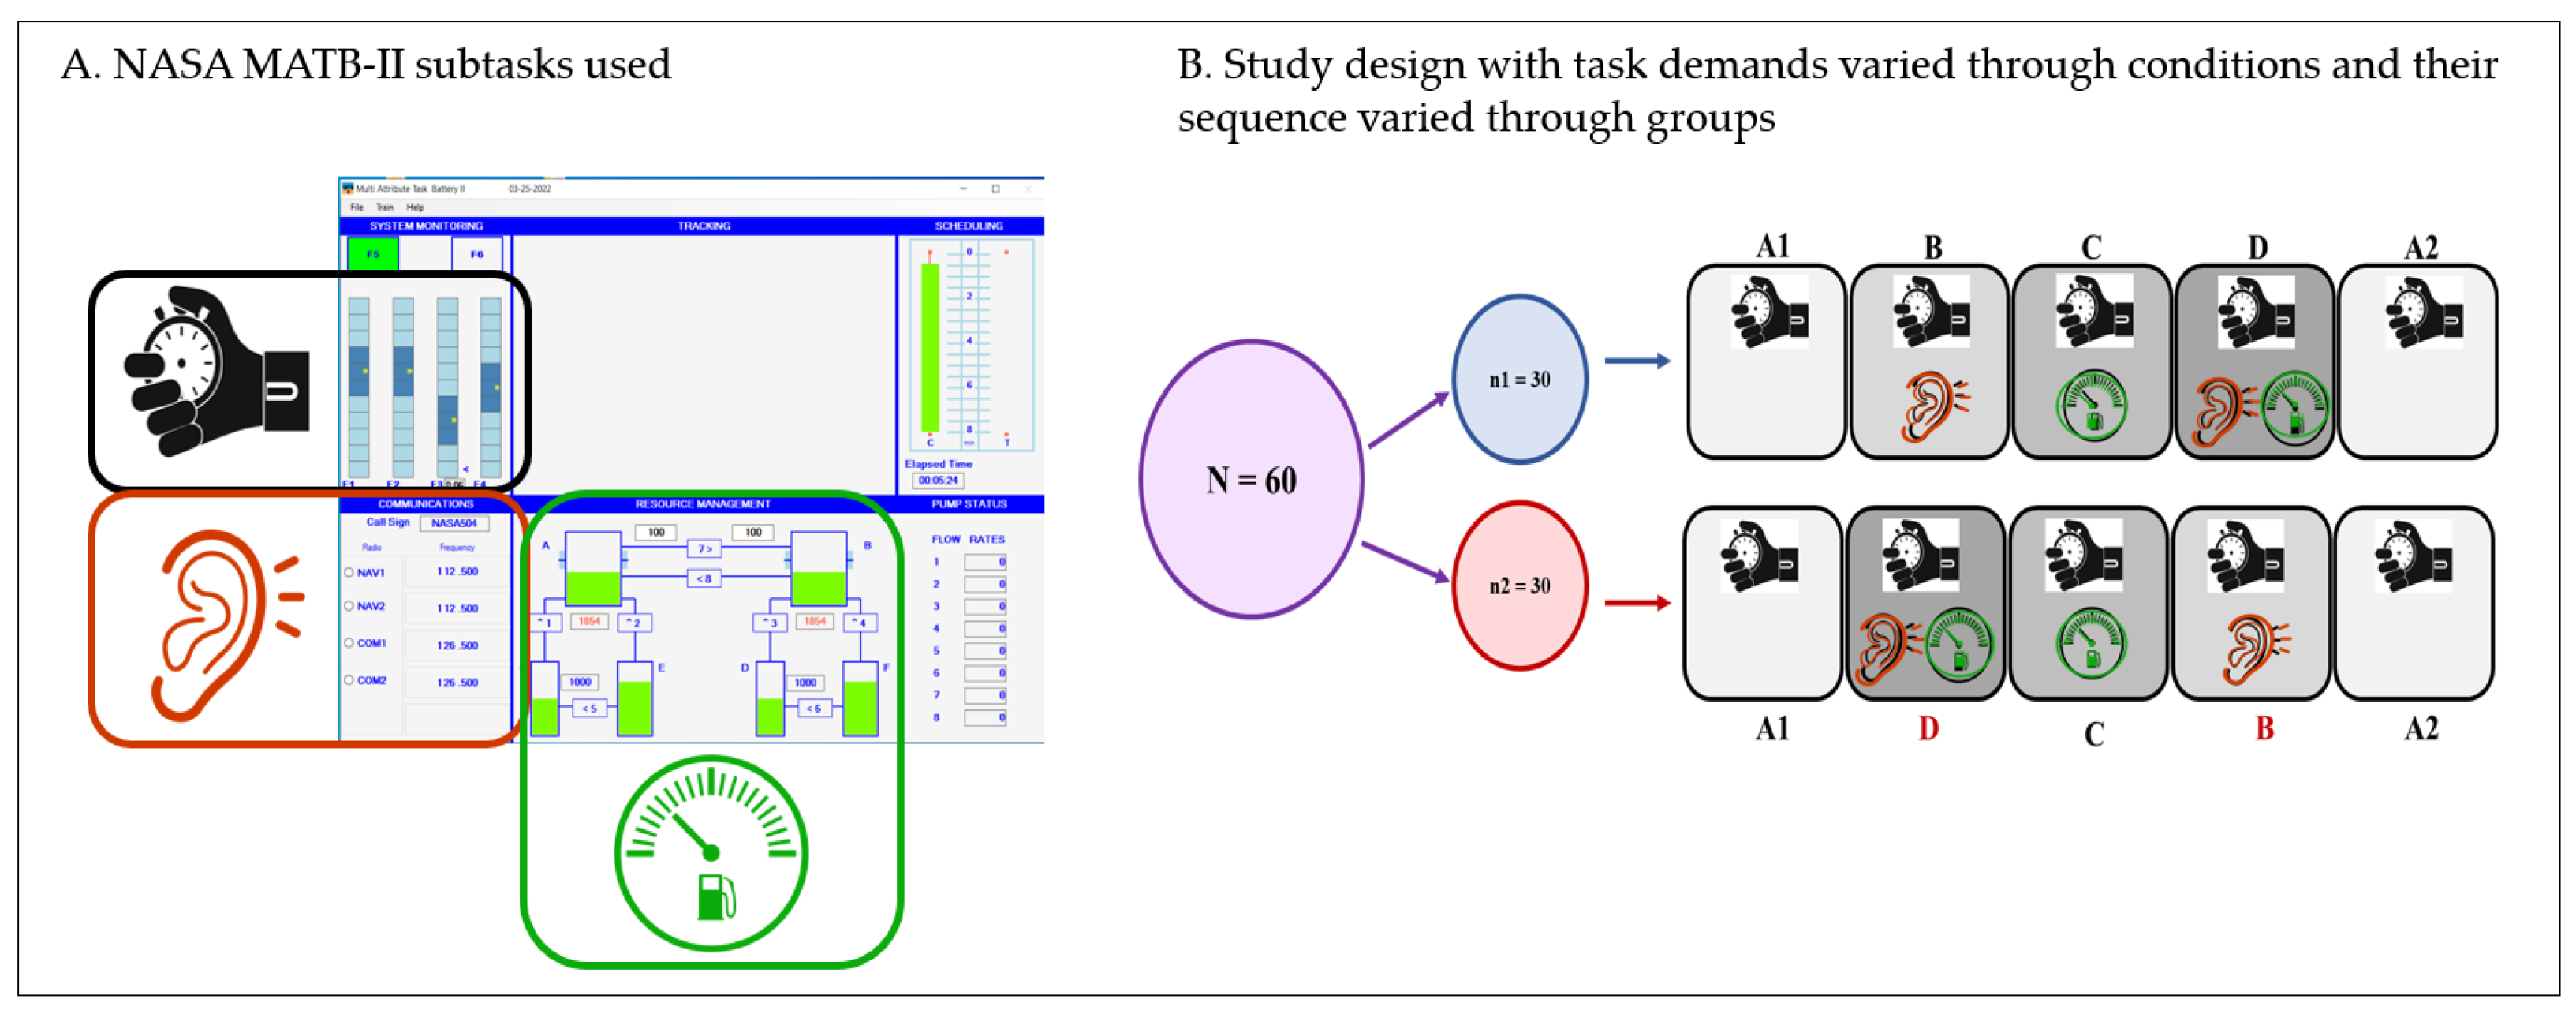
Figure 5.
Mean coefficient of variation in reaction times across different levels of attentional demands in increasing (left) and decreasing (right) load group. Only the non-significant differences are marked.
Figure 5.
Mean coefficient of variation in reaction times across different levels of attentional demands in increasing (left) and decreasing (right) load group. Only the non-significant differences are marked.
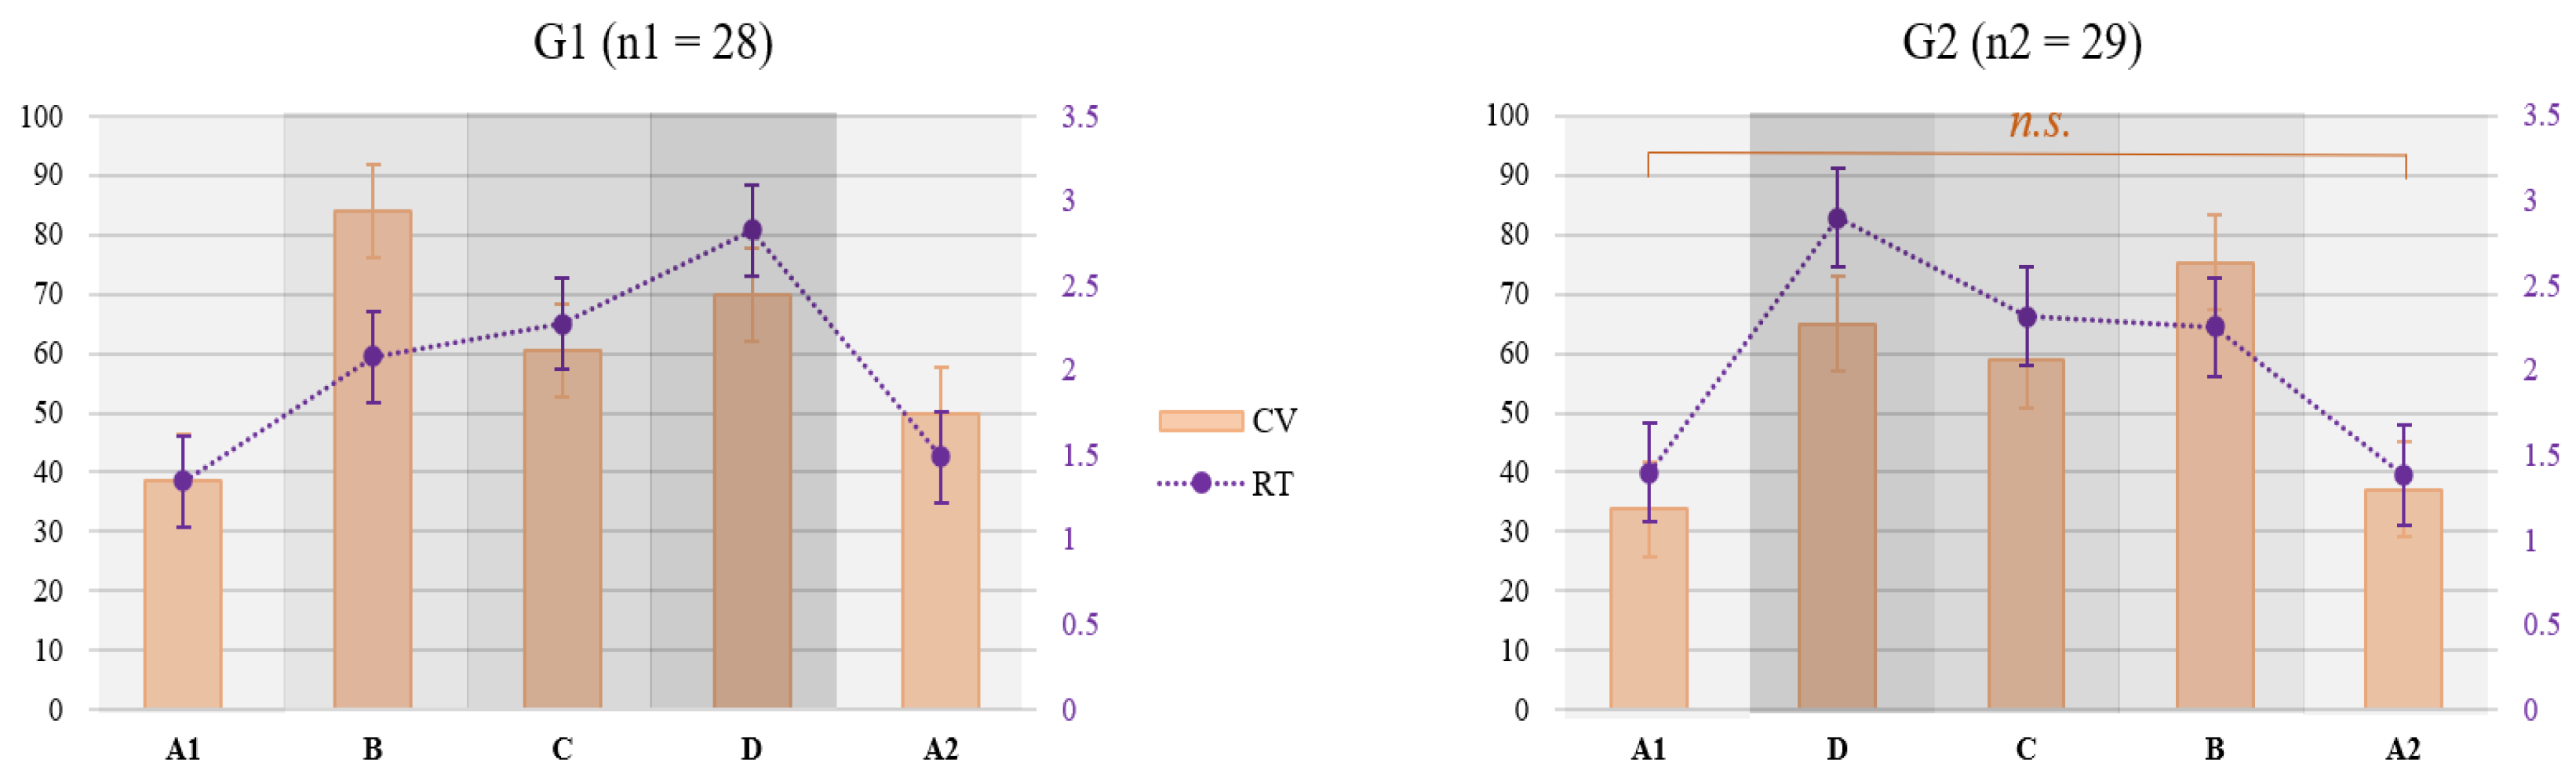
Figure 7.
Left panel: Subjective fatigue ratings; Differences within each shaded block are non-significant, while those between the blocks are statistically significant. Right panel: Subjective fatigue as a function of time on task.
Figure 7.
Left panel: Subjective fatigue ratings; Differences within each shaded block are non-significant, while those between the blocks are statistically significant. Right panel: Subjective fatigue as a function of time on task.
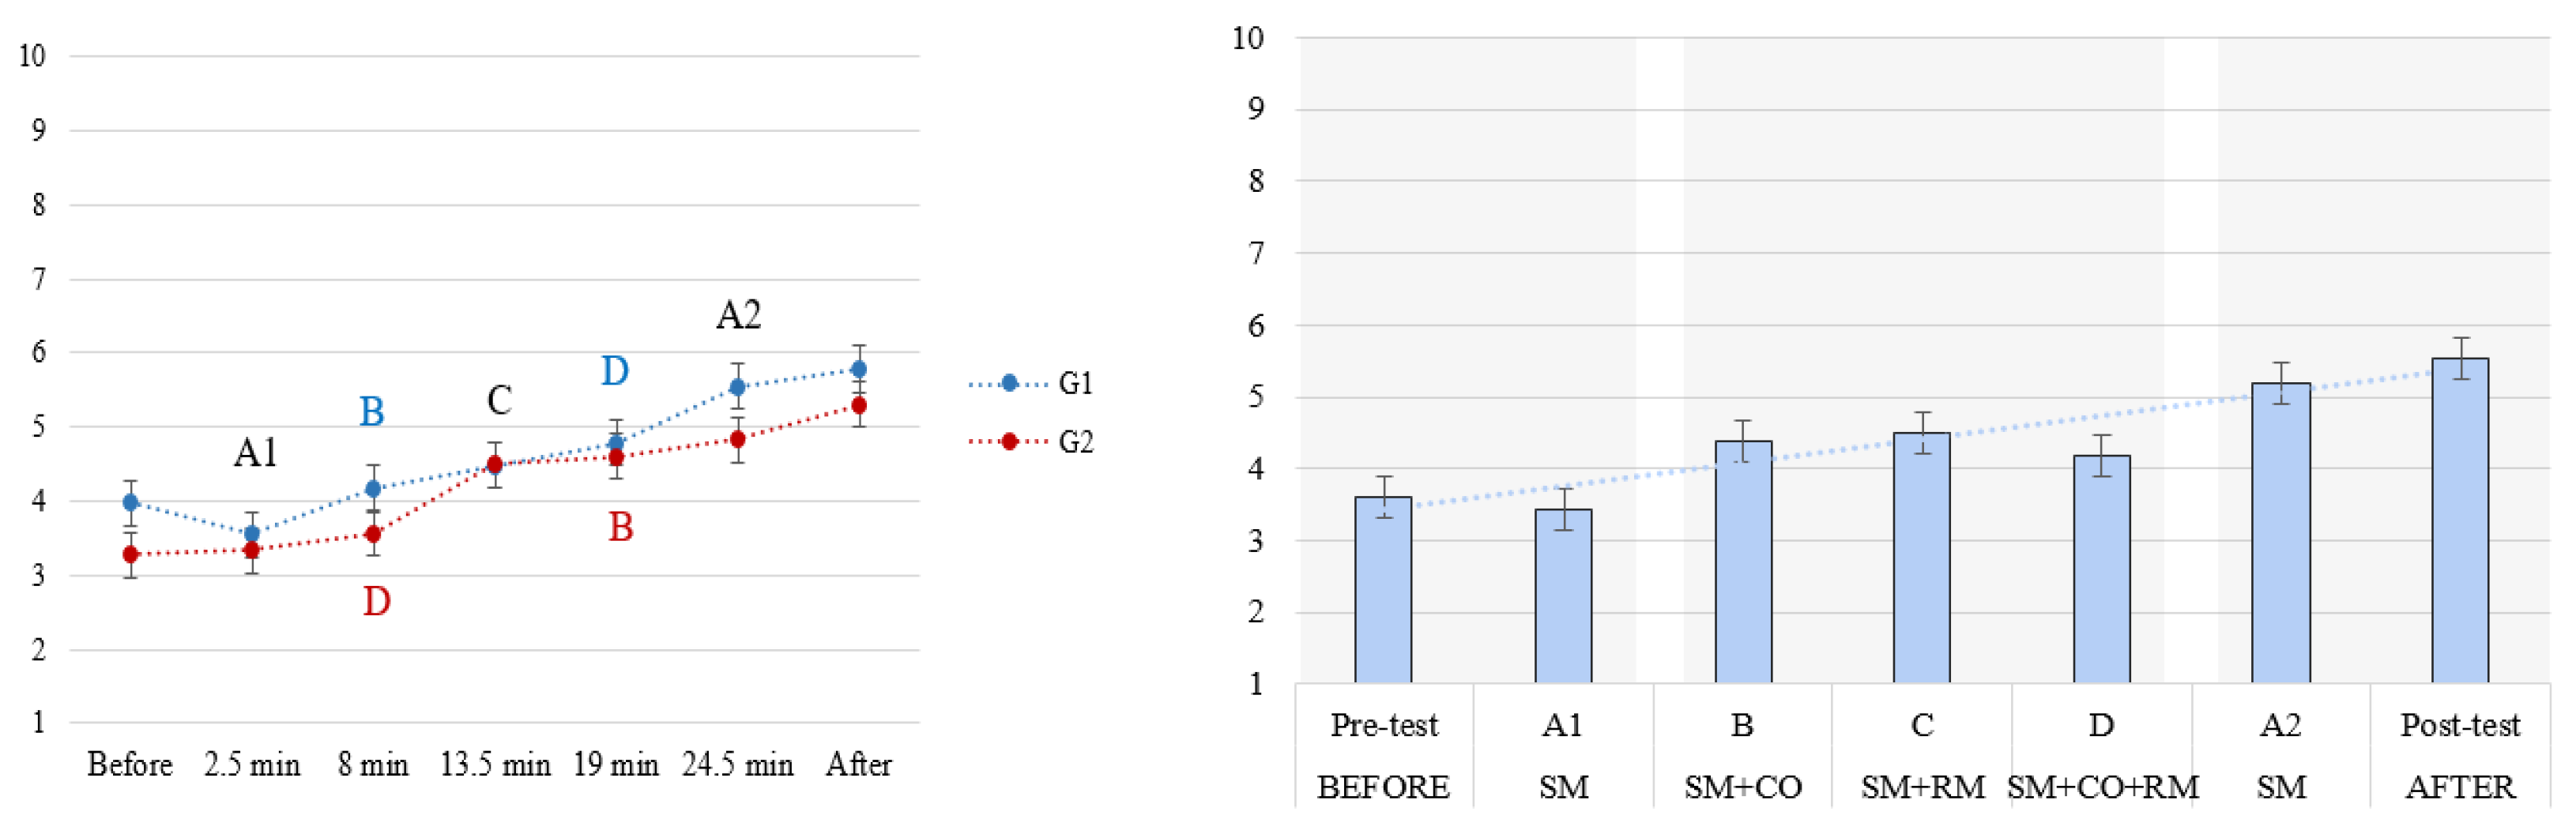
Figure 8.
Mean Mental Workload Index (A) and reported task difficulty (B) across the varying attentional demands.
Figure 8.
Mean Mental Workload Index (A) and reported task difficulty (B) across the varying attentional demands.
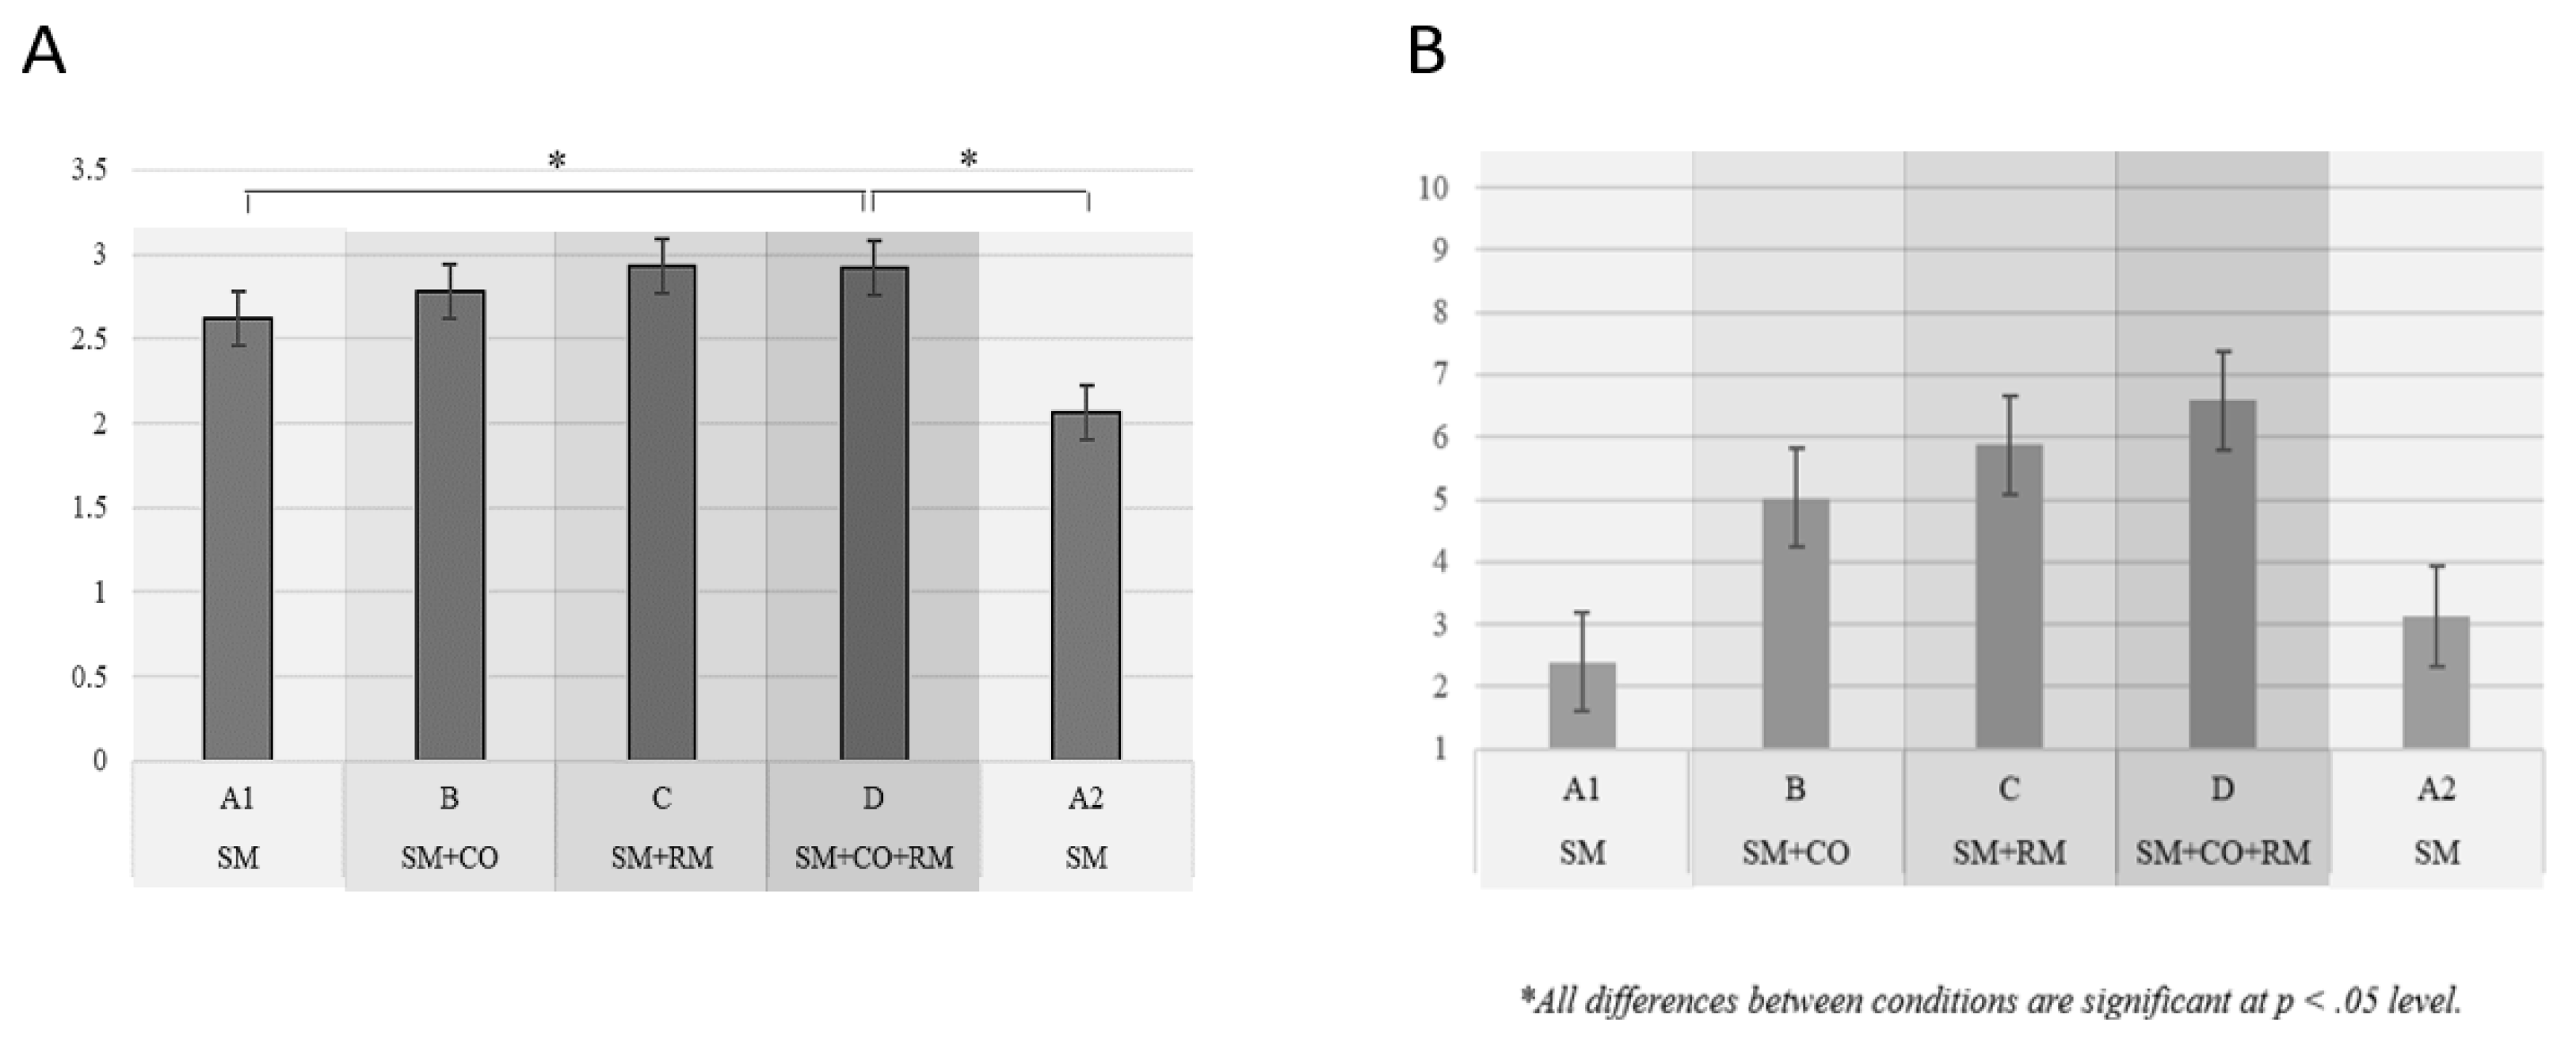
Figure 9.
Mean Engagement (left) and Beta/Alpha indeices (right) in response to varying attentional demands. Significant differences (p < .05) are marked with an asterisk.
Figure 9.
Mean Engagement (left) and Beta/Alpha indeices (right) in response to varying attentional demands. Significant differences (p < .05) are marked with an asterisk.
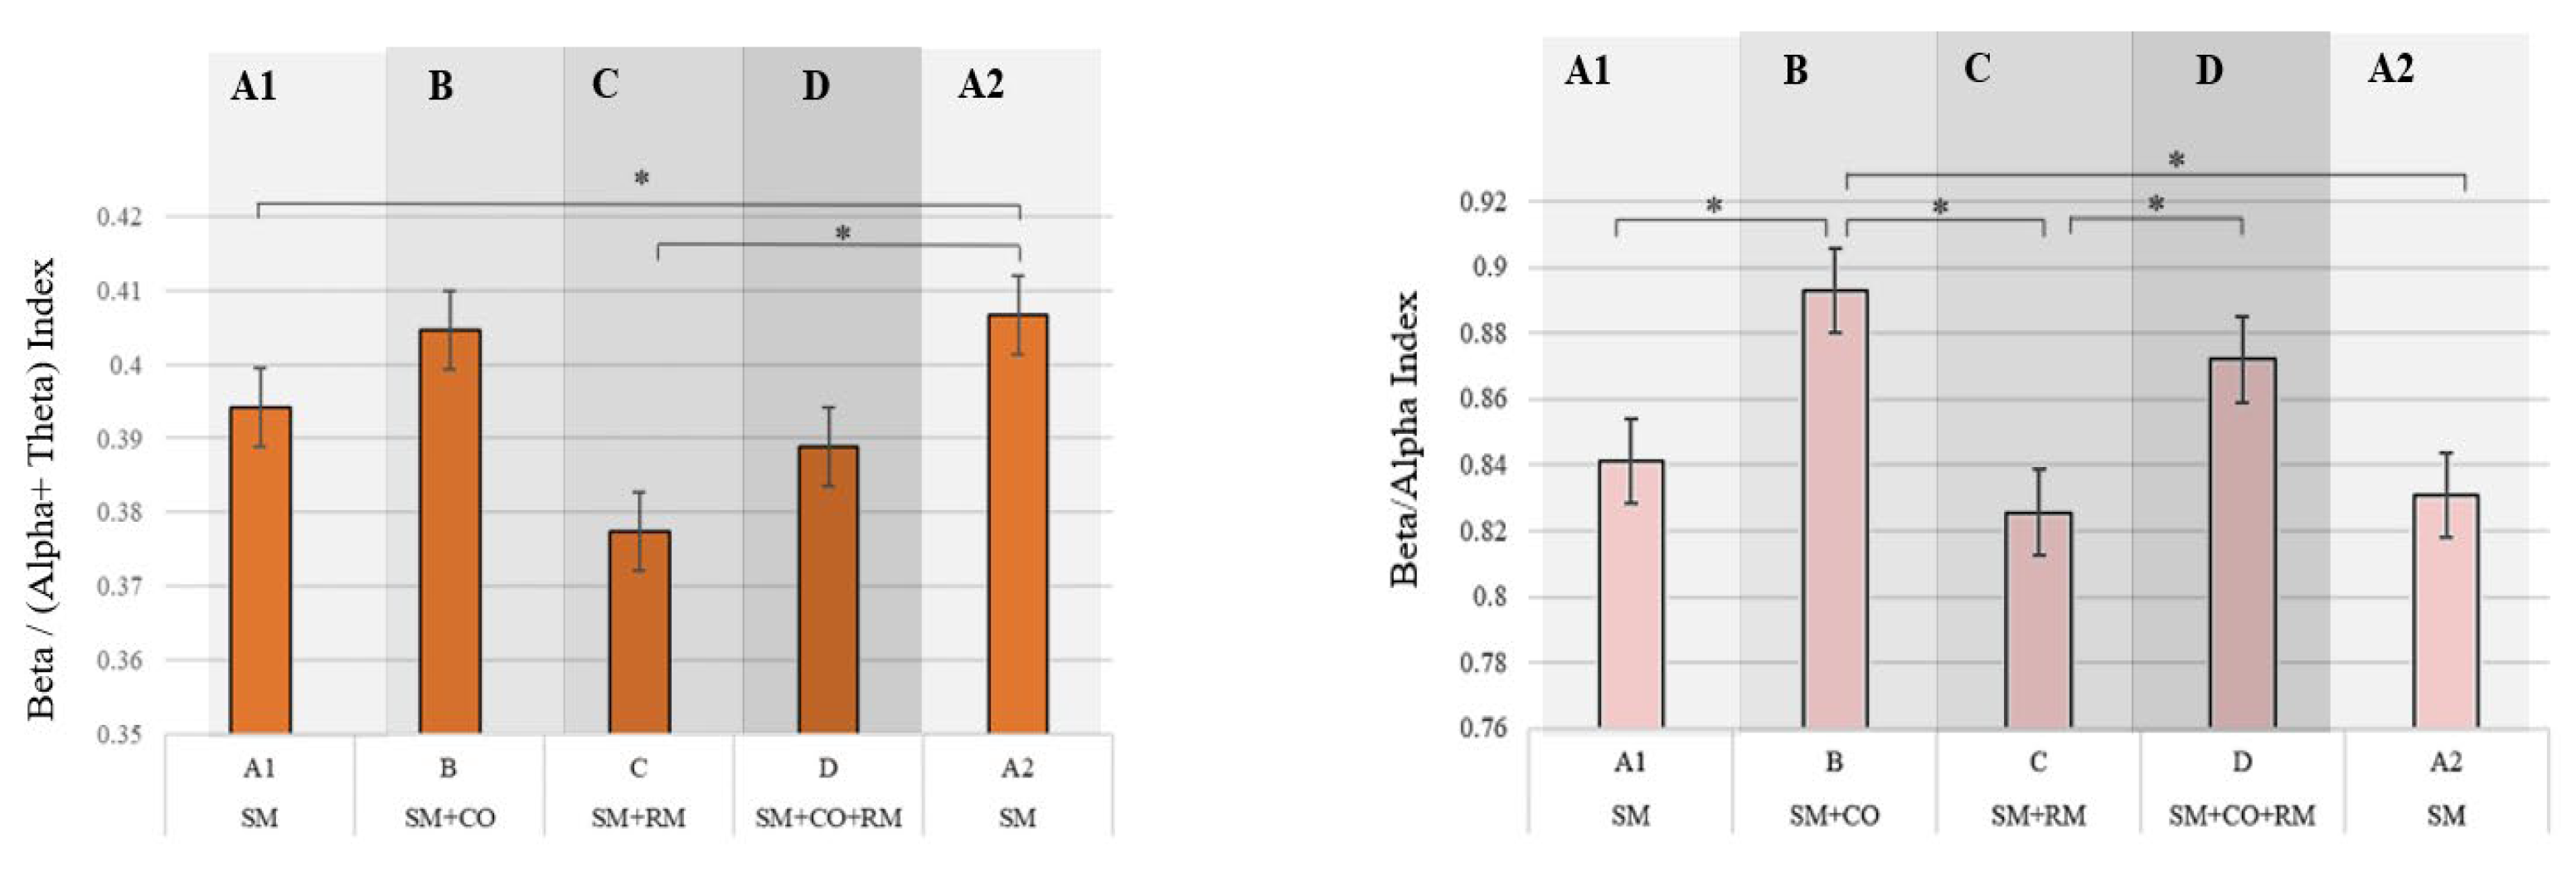
Figure 10.
Subjective level of attention as a function of approximate time on task. The transition to darker shaded area of the graph denotes the significant decrease in ratings.
Figure 10.
Subjective level of attention as a function of approximate time on task. The transition to darker shaded area of the graph denotes the significant decrease in ratings.
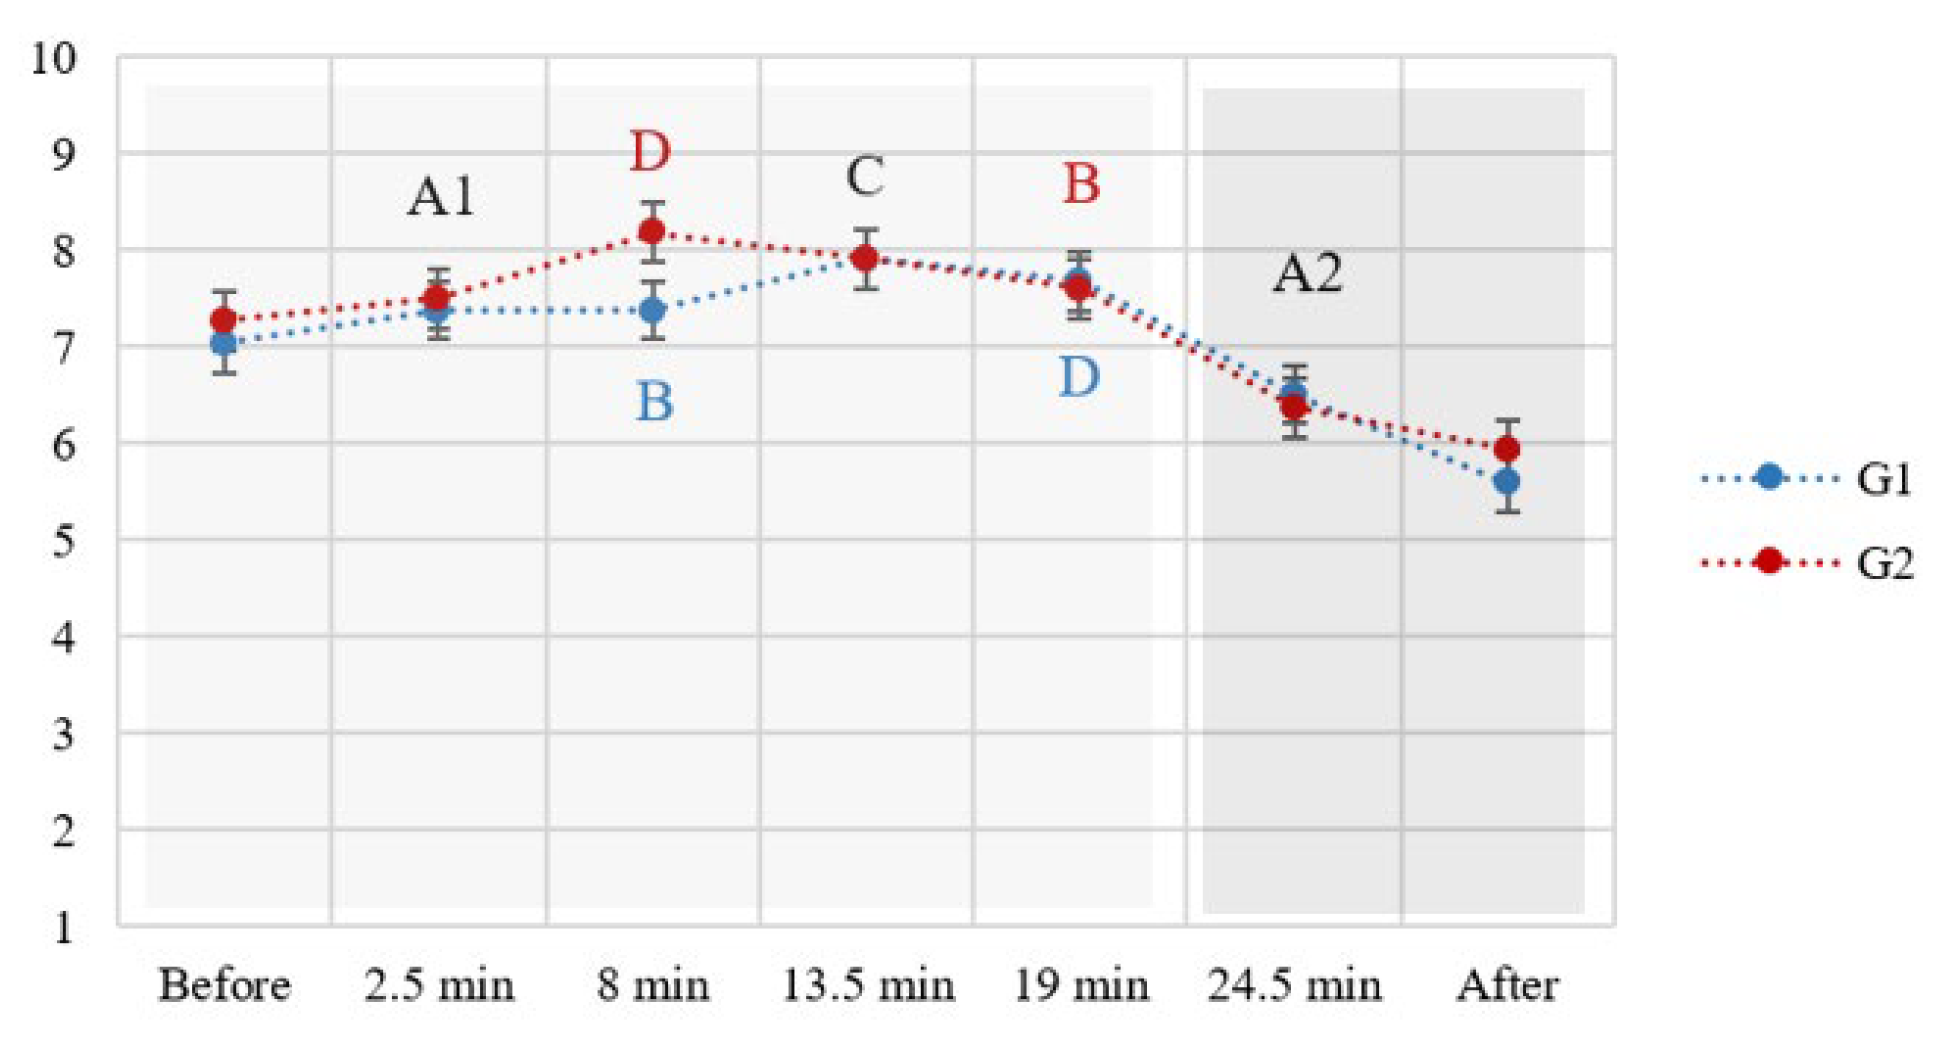
Figure 11.
Comparison of trends in Coefficient of Variation in Reaction Time (CVrt) with Beta/Alpha (above) and EI (below).
Figure 11.
Comparison of trends in Coefficient of Variation in Reaction Time (CVrt) with Beta/Alpha (above) and EI (below).
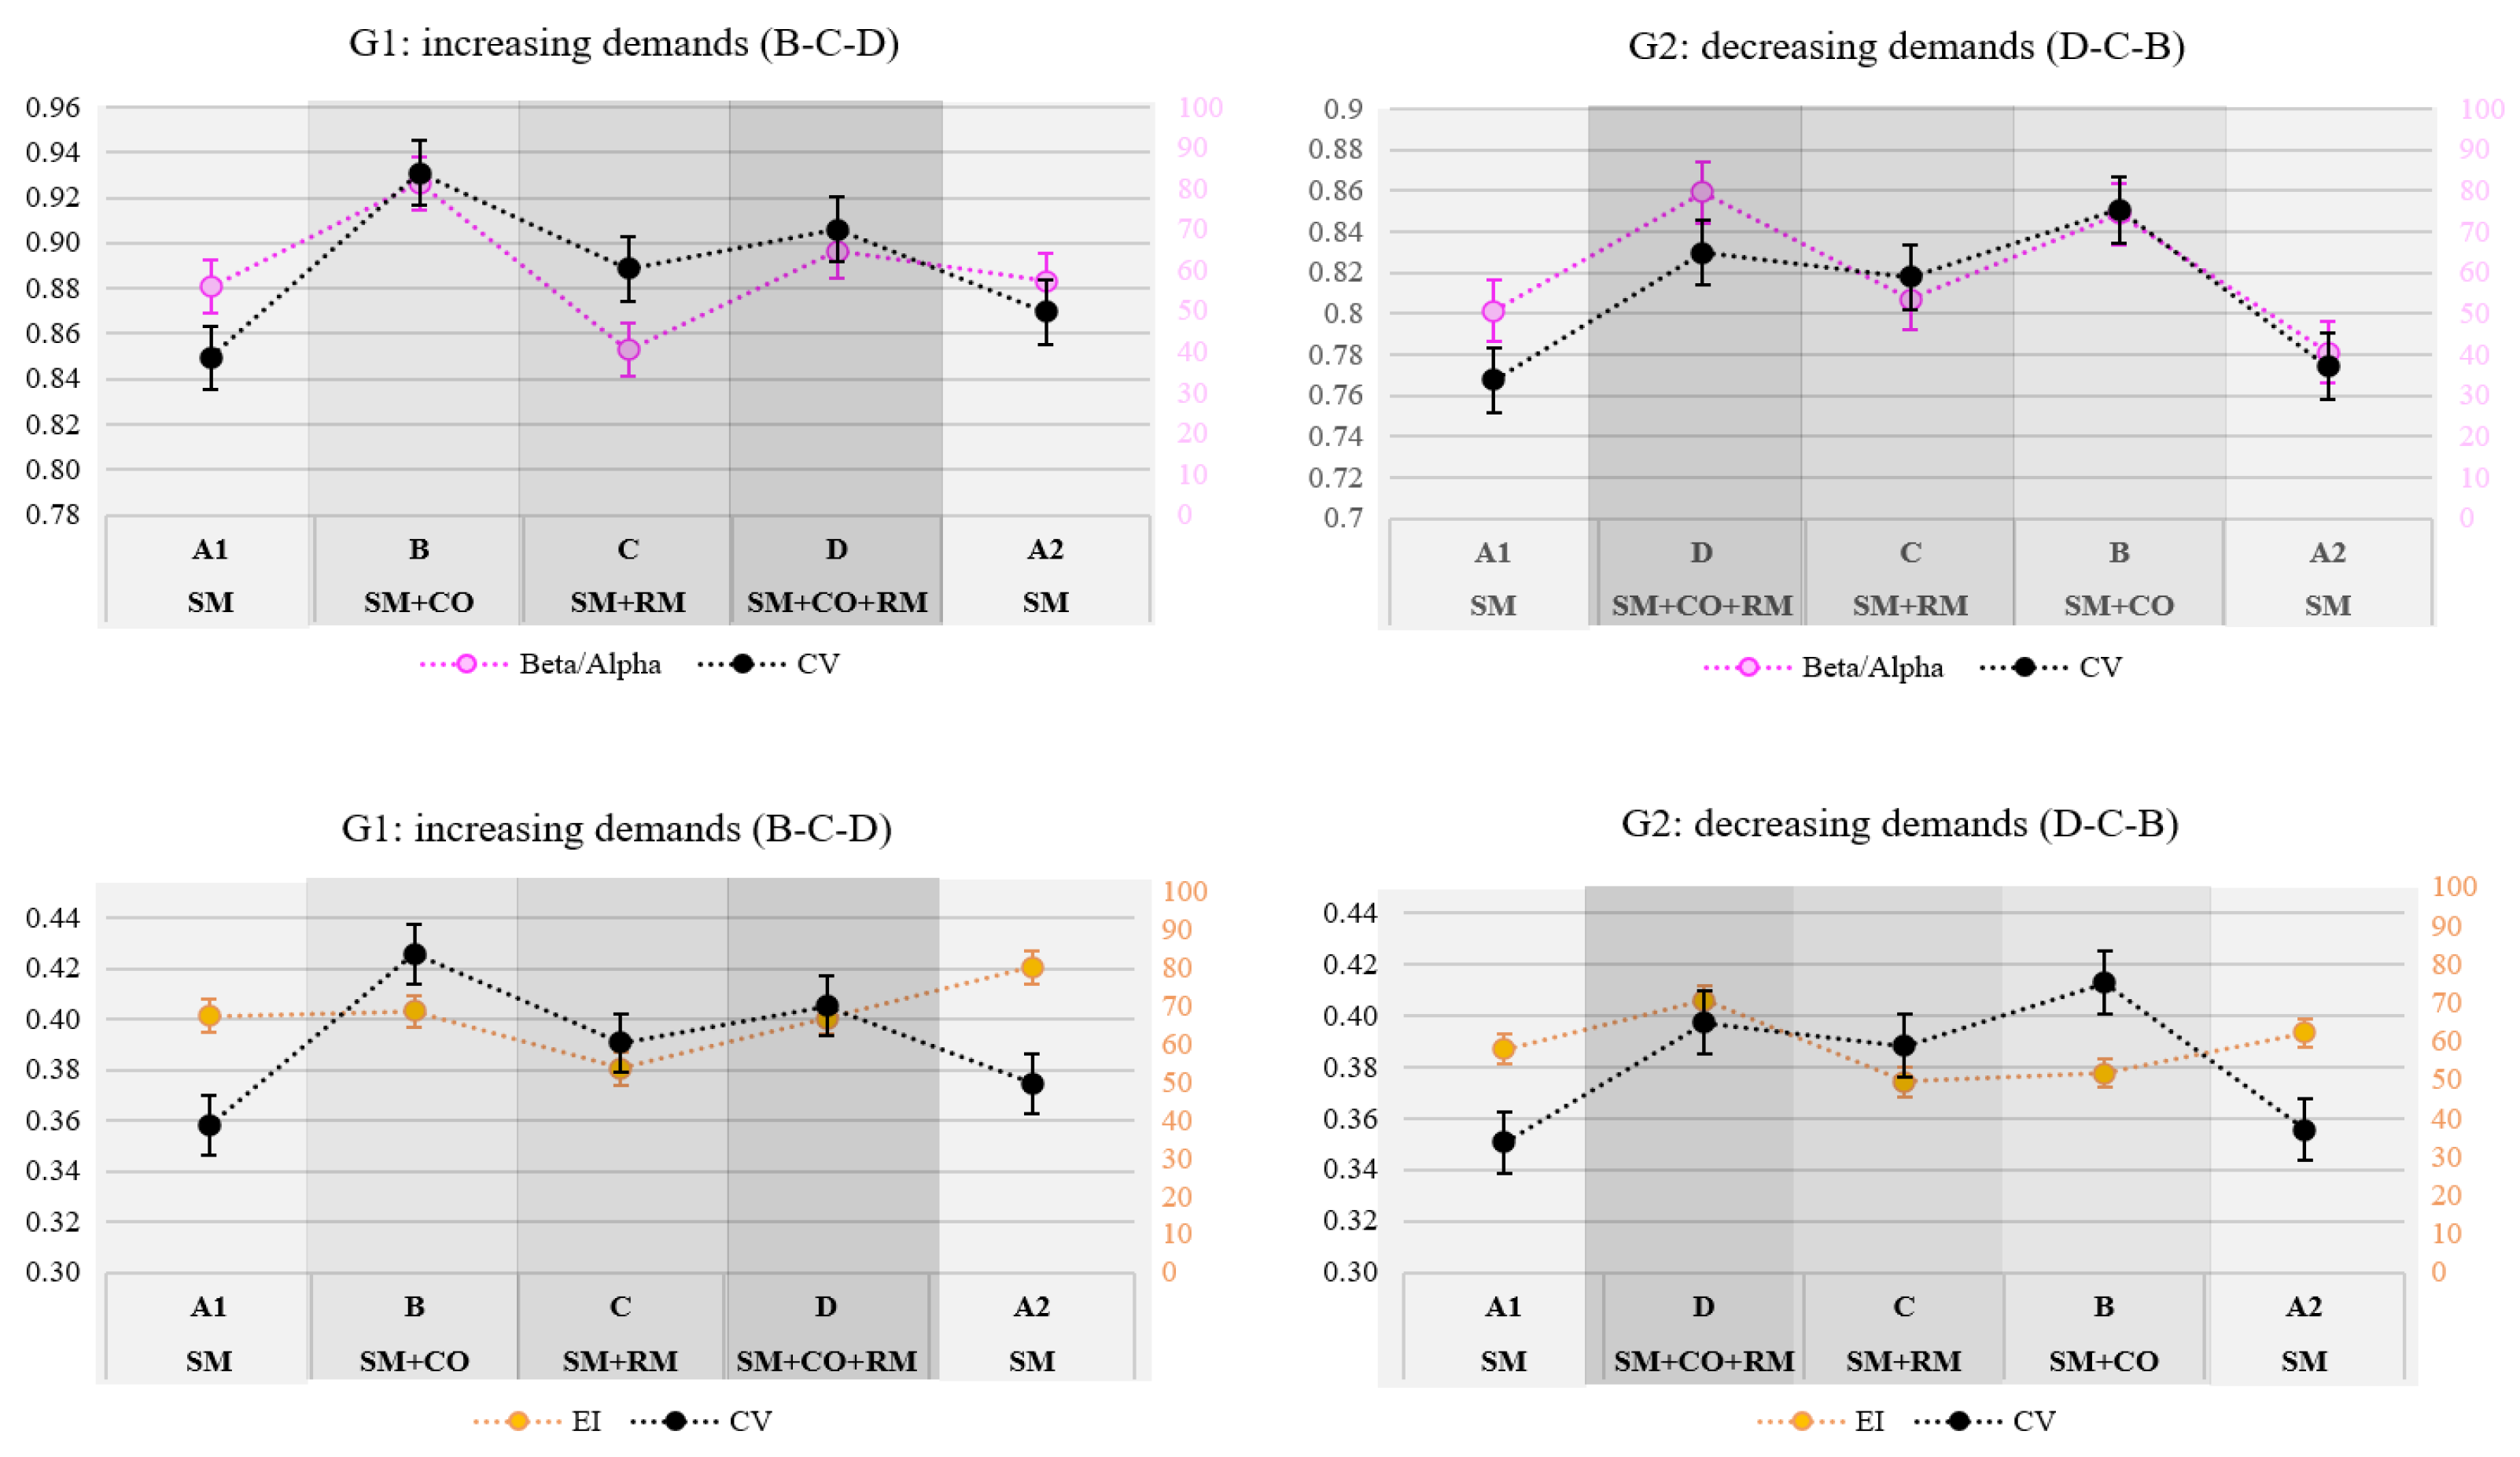
Figure 12.
Correlation heatmap of the variables considered for the regression model.
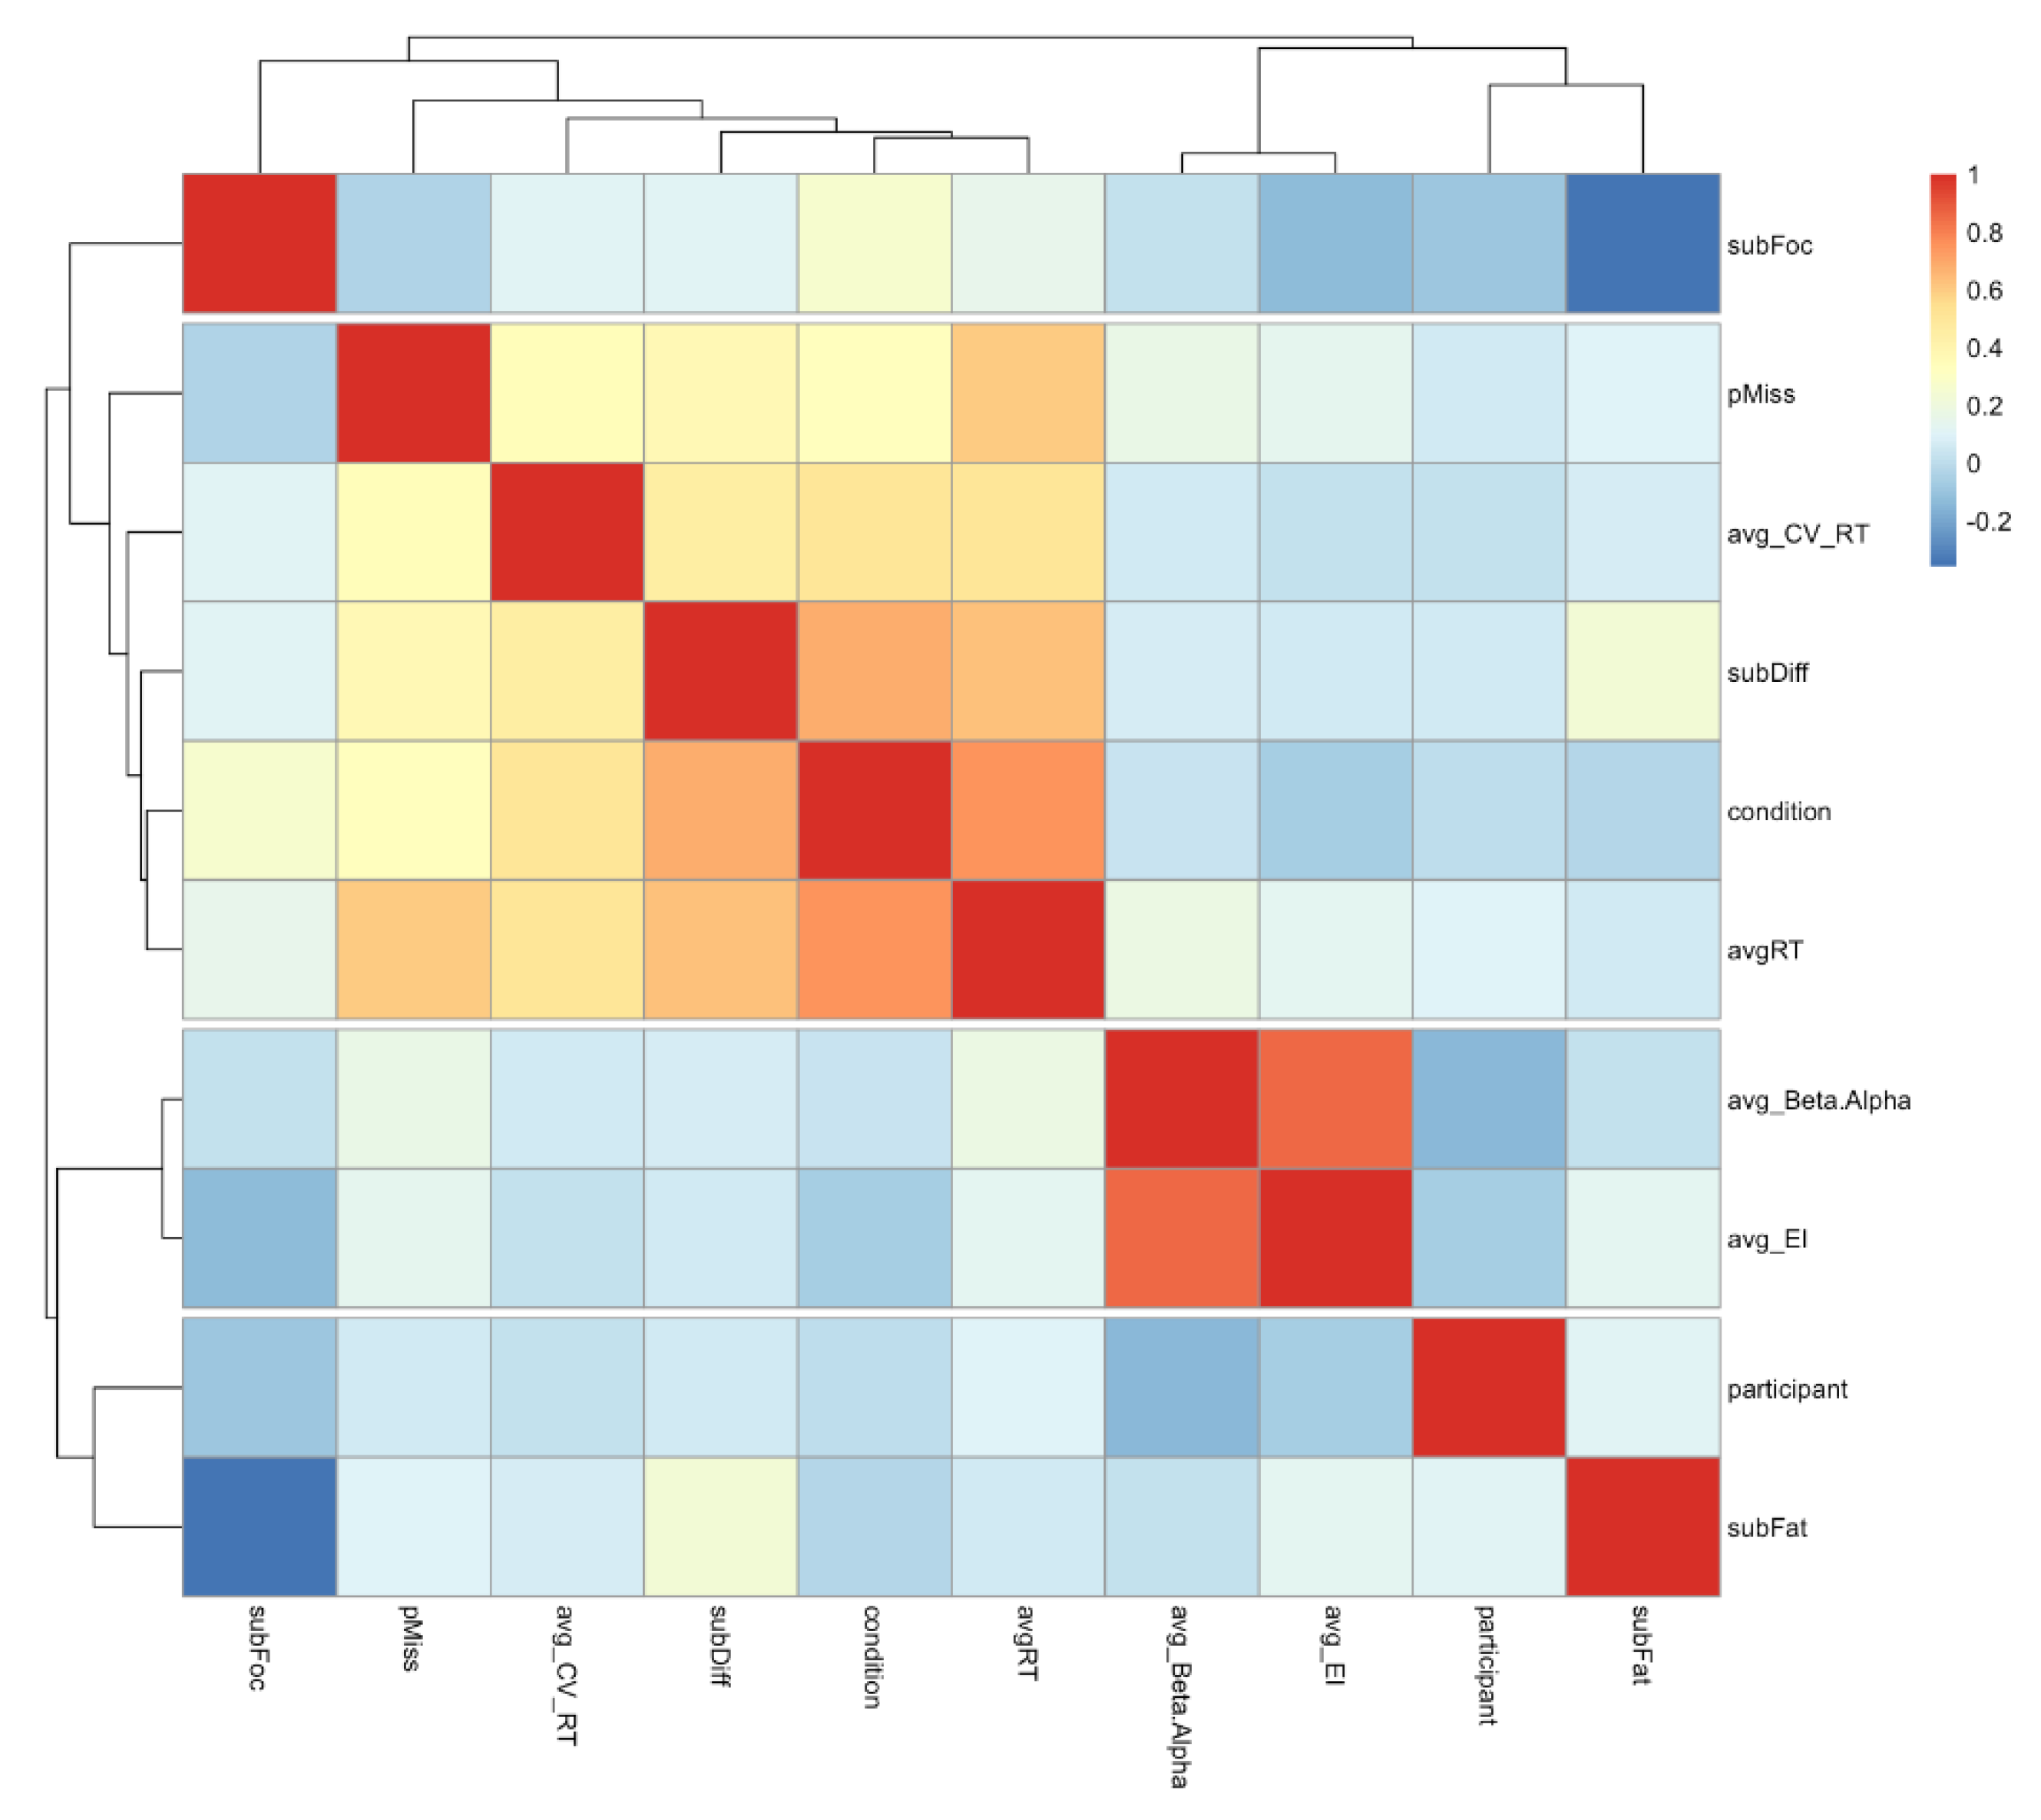
Figure 13.
Shapley value of the input features in the task of predicting the output value through the model ert (the best of the models considered by the pycaret AutoML library). Each dot corresponds to an instance of the dataset. The color ranges from blue to red: the redder the color the higher the value of the input feature. The impact of that feature value in improving the prediction of the model in correspondence to the specific record is represented along the x axis.
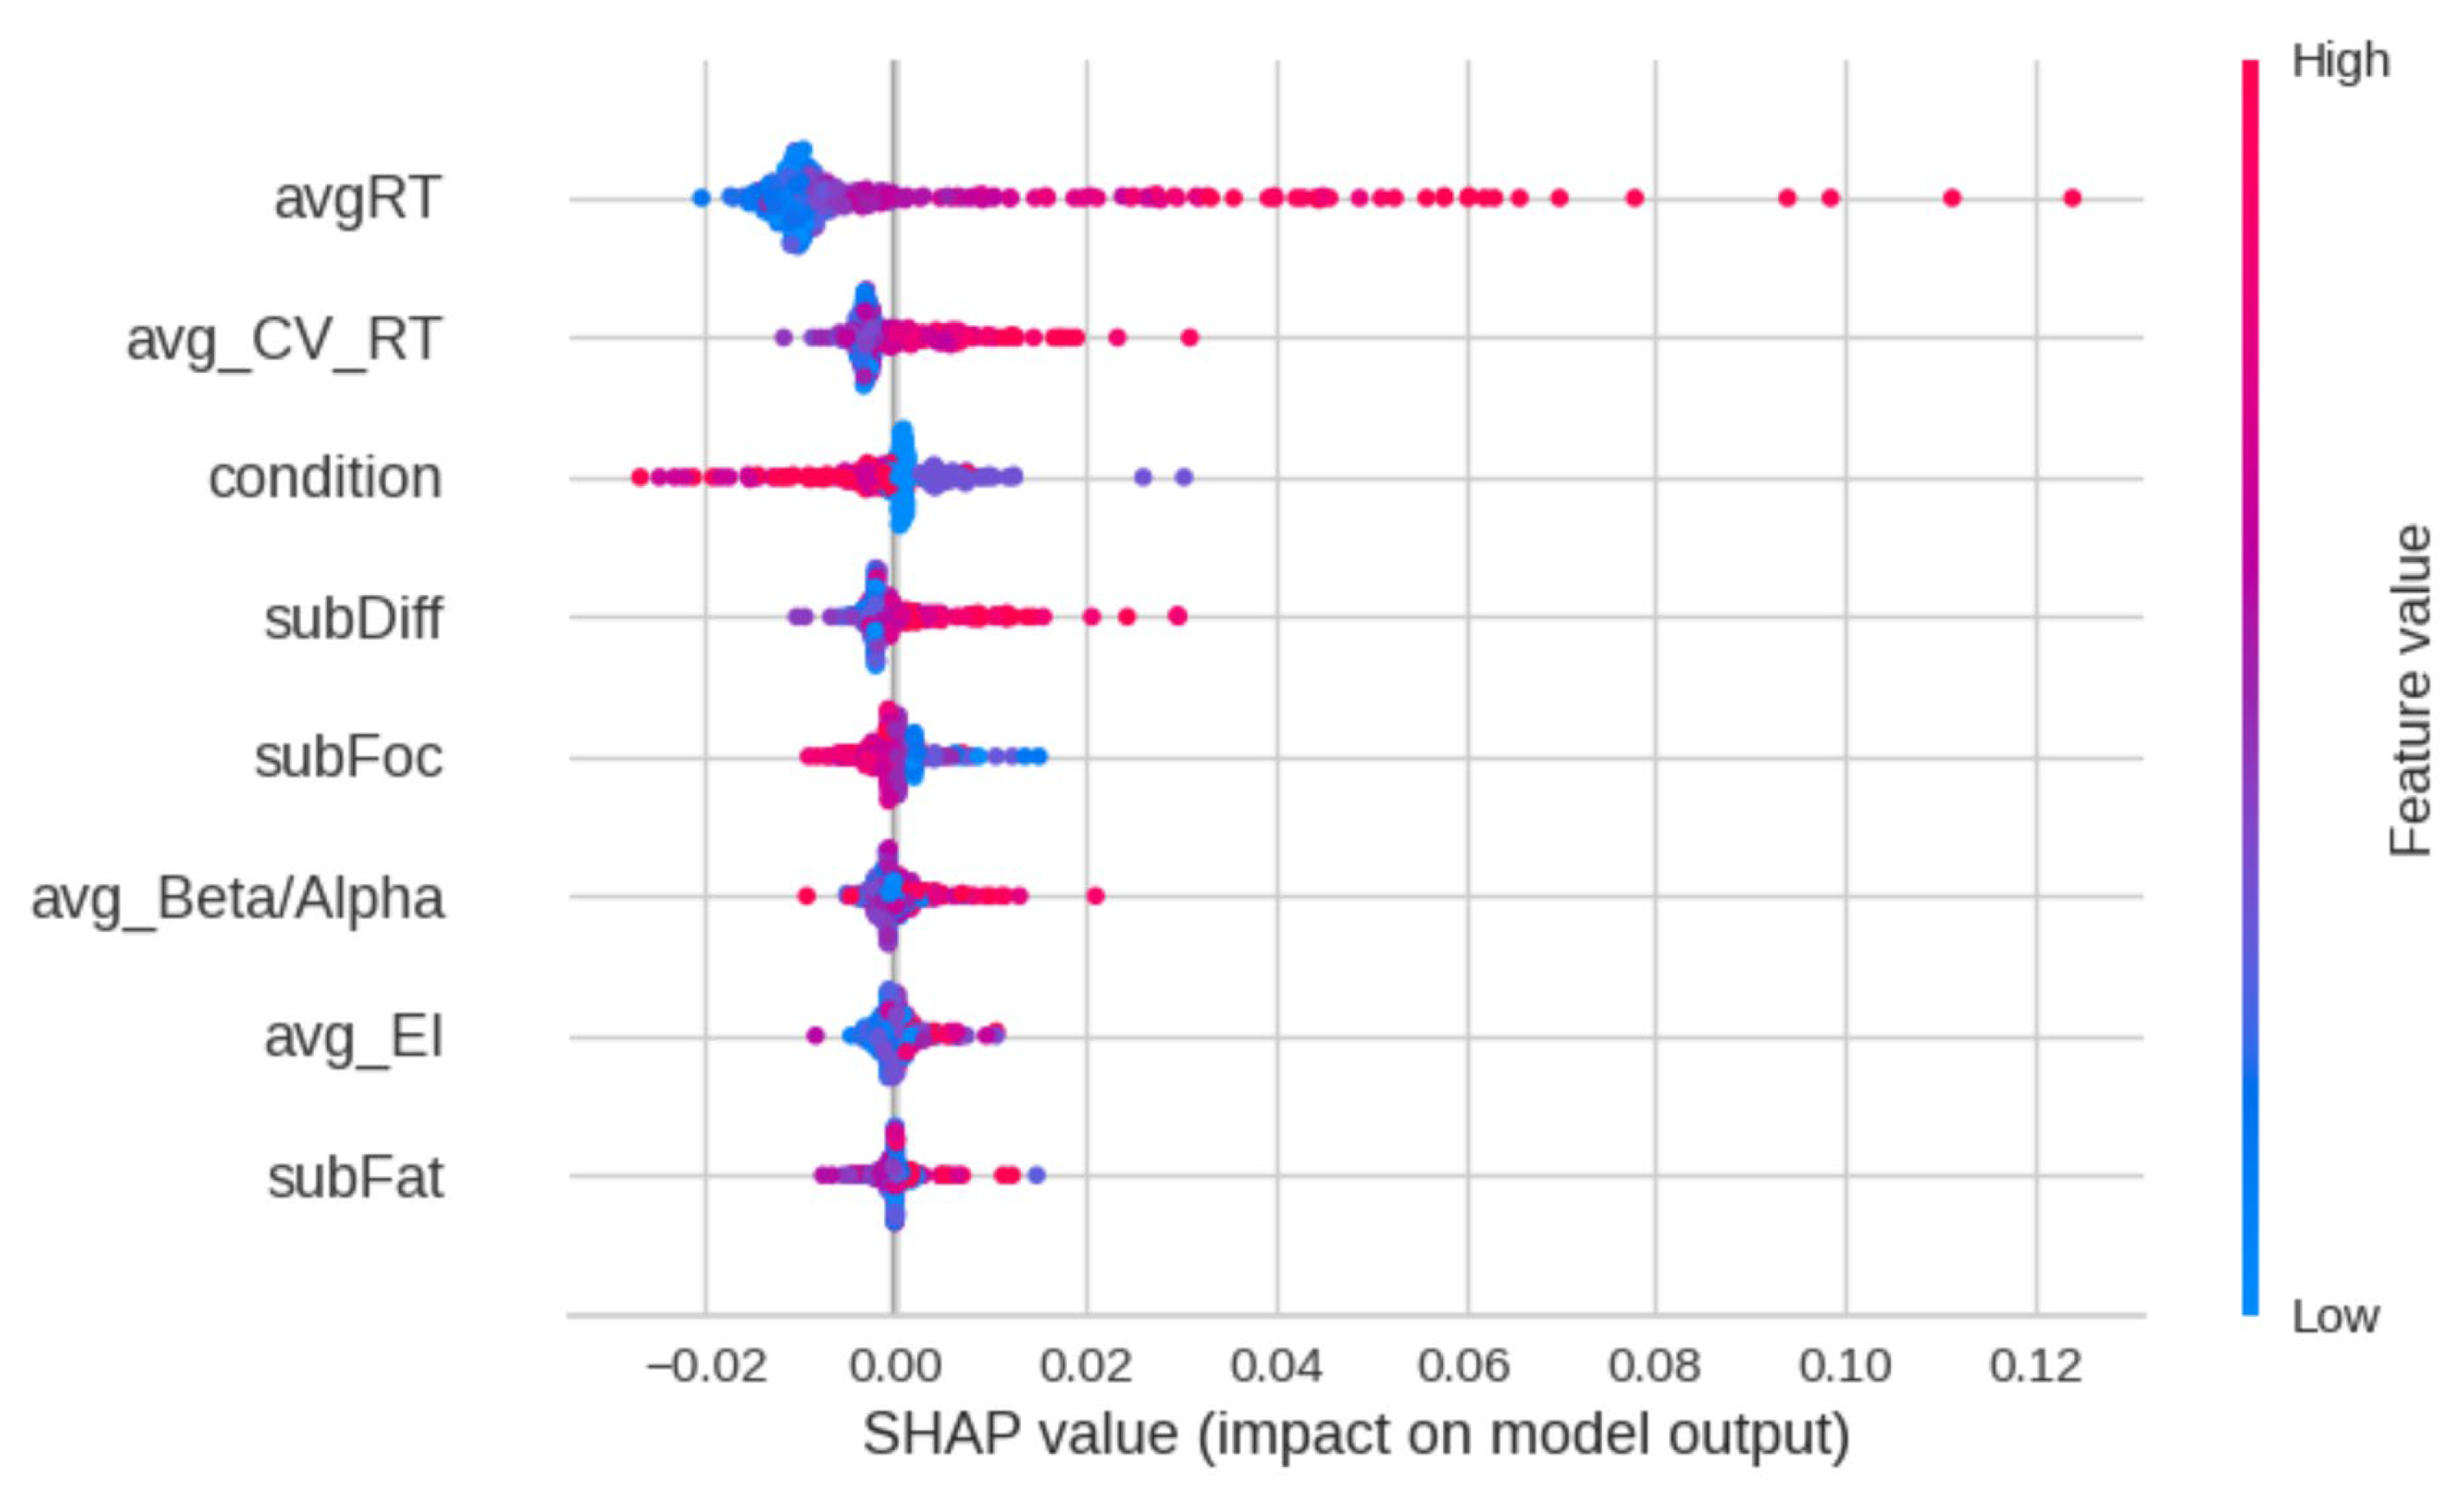

Table 1.
EEG indices calculation.
| EEG feature name (notion) | Formula | EEG frequency band ranges (channels) |
|---|---|---|
| Engagement Index (EI) | β / (α + θ) | θ: 4 – 8 Hz (Cz, Pz, P3, and P4) α: 8 – 13 Hz (Cz, Pz, P3, and P4) β: 13 – 22 Hz (Cz, Pz, P3, and P4) |
| Beta over Alpha Index (B/A) | β / α | θ: 4 – 8 Hz (Cz, Pz, P3, and P4) α: 8 – 13 Hz (Cz, Pz, P3, and P4) β: 13 – 22 Hz (Cz, Pz, P3, and P4) |
| Mental Workload Index (MWL) | θ / α | θ: 4 – 7 Hz (Fz) α: 8 – 12 Hz (Pz) |
Table 2.
Regression performance metrics definitions: yi denotes the true output value, the predicted output value of the i-th point; n is the number of records.
Table 2.
Regression performance metrics definitions: yi denotes the true output value, the predicted output value of the i-th point; n is the number of records.
| Metrics | Definitions |
|---|---|
| Mean Absolute Error | MAE = |
| Mean Squared Error | MSE = |
| Root Mean Square Error | RMSE = |
| Coefficient of Determination | |
| Root Mean Squared Logarithmic Error | RMSLE = |
| Mean Absolute Percentage Error | MAPE = |
Table 3.
The number of omissions per condition.
| Condition | Min | Max | Mean | SD |
|---|---|---|---|---|
| A1 | .00 | 1.00 | .0175 | .13245 |
| B | .00 | 13.00 | 1.7895 | 2.67753 |
| C | .00 | 5.00 | .5263 | 1.24076 |
| D | .00 | 12.00 | 2.1404 | 2.62160 |
| A2 | .00 | 2.00 | .0702 | .31958 |
Table 4.
Comparative sensitivity of EEG indices, performance, and subjective measures.
| Reaction time measures | EEG measures | Subjective measure | |||||
|---|---|---|---|---|---|---|---|
| CVrt | RT | β / α | EI | MWI | Self-reported focus level | ||
| Sensitivity to attentional demands | Number of significant differences between conditions | G1: 10 / 10 G2: 9 / 10 |
8 / 10 | 4 / 10 | 2 / 10 | 2 / 10 | 9 / 21 |
|
Effect size (partial η2) |
.72 | .75 | .10 | .08 | .09 | .29 | |
| Sensitivity to direction of changes in demands | Significant difference between increasing (G1) and decreasing loads (G2) | Yes | No | No | No | No | No |
|
Effect size (partial η2) |
.27 | - | - | - | - | - | |
| Sensitivity to fatigue onset | Significant difference between A1 and A2 | Yes, in G1 | No | No | Yes | No | Yes |
| Direction of difference | A1 < A2 | - | - | A1 < A2 | - |
A1 > A2 |
|
Table 5.
Pearson’s, Spearman’s, and Kendall’s correlation coefficient between the EEG indices and reaction time measures.
Table 5.
Pearson’s, Spearman’s, and Kendall’s correlation coefficient between the EEG indices and reaction time measures.
| Engagement Index (EI) | Beta / Alpha Index | Mental Workload Index (MWI) | |
|---|---|---|---|
| Reaction time (RT) | r = .37** rho = .39** tau-b = .27** |
r = .31* rho = .34* tau-b = .22* |
n.s. n.s. n.s. |
* and ** denote significant correlations at .05 and .01 level (two-tailed), respectively; n.s. denotes statistically non-significant results.
Table 6.
Average correlations between reaction times and EEG indices within each condition.
| A1 SysMon |
B SysMon + Comm |
C SysMon + ResMan |
D SysMon + Comm + Resman |
A2 SysMon |
|
|---|---|---|---|---|---|
| EI | r = n.s. τ = .22* ρ = .29* |
r = .35** τ = .22* ρ = .32* |
r = .32* τ = .22* ρ = .33* |
r = .39** τ = .24** ρ = .37** |
r = n.s. τ = n.s. ρ = n.s. |
| Beta / Alpha | r = n.s. τ = n.s. ρ = n.s. |
r = n.s. τ = n.s. ρ = n.s. |
r = .41** τ = .23* ρ = .36** |
r = .32* τ = .22* ρ = .33* |
r = n.s. τ = n.s. ρ = n.s. |
| MWI | r = n.s. τ = n.s. ρ = n.s. |
r = n.s. τ = n.s. ρ = n.s. |
r = n.s. τ = n.s. ρ = n.s. |
r = n.s. τ = n.s. ρ = n.s. |
r = n.s. τ = n.s. ρ = n.s. |
* and ** denote significant correlations at .05 and .01 level (two-tailed), respectively; n.s. denotes statistically non-significant results.
Table 7.
Coefficients and statistical significance for the Quasi-Poisson Regression Model predicting the number of omissions.
Table 7.
Coefficients and statistical significance for the Quasi-Poisson Regression Model predicting the number of omissions.
| Coefficients: | Estimate | Std. Error | z | value Pr (>|z|) |
|---|---|---|---|---|
| (Intercept) | -7.237976 | 0.846933 | -8.546 | 8.68e-16 *** |
| a =condition | -0.162389 | 0.096252 | 1.687 | 0.0927 |
| b = avg_RT | 1.431375 | 0.125078 | 11.44 | < 2e-16 *** |
| c =avg_CV_RT | 0.049976 | 0.006214 | 8.042 | 2.59e-14 *** |
| d = avg_Beta/Alpha | 0.247277 | 0.282468 | 0.875 | 0.3821 |
| e = subFoc | -0.086203 | 0.051583 | -1.671 | 0.0958 |
| f = subFat | 0.034946 | 0.037516 | 0.932 | 0.3524 |
| g = subDiff | 0.145577 | 0.048960 | 2.973 | 0.0032 ** |
Table 9.
Regression models and their performance metrics. The models are ranked according to their R2. The best model turns out to be the Extra tree Regressor, also in terms of MSE, RMSE and RMSLE.
Table 9.
Regression models and their performance metrics. The models are ranked according to their R2. The best model turns out to be the Extra tree Regressor, also in terms of MSE, RMSE and RMSLE.
| Model | MAE | MSE | RMSE | R2 | RMSLE | MAPE | |
|---|---|---|---|---|---|---|---|
| et | Extra Trees Regressor | 0.0159 | 0.0008 | 0.0276 | 0.3170 | 0.0256 | 0.6836 |
| huber | Huber Regressor | 0.0163 | 0.0010 | 0.0293 | 0.2990 | 0.0272 | 0.5451 |
| br | Bayesian Ridge | 0.0186 | 0.0009 | 0.0284 | 0.2894 | 0.0266 | 0.5392 |
| ridge | Ridge Regression | 0.0187 | 0.0009 | 0.0285 | 0.2770 | 0.0267 | 0.5528 |
| lr | Linear Regression | 0.0188 | 0.0009 | 0.0287 | 0.2690 | 0.0267 | 0.5569 |
| lar | Least Angle Regression | 0.0199 | 0.0010 | 0.0298 | 0.1978 | 0.0279 | 0.6135 |
| rf | Random Forest Regressor | 0.0158 | 0.0009 | 0.0289 | 0.1903 | 0.0267 | 0.7250 |
| lightgbm | Light Gradient Boosting Machine | 0.0180 | 0.0011 | 0.0313 | 0.1259 | 0.0290 | 0.8398 |
| gbr | Gradient Boosting Regressor | 0.0179 | 0.0011 | 0.0305 | 0.0925 | 0.0283 | 0.8216 |
| knn | K Neighbors Regressor | 0.0190 | 0.0013 | 0.0335 | 0.0700 | 0.0314 | 0.6365 |
| omp | Orthogonal Matching Pursuit | 0.0216 | 0.0013 | 0.0340 | 0.0458 | 0.0319 | 0.5312 |
| xgboost | Extreme Gradient Boosting | 0.0168 | 0.0012 | 0.0322 | -0.0044 | 0.0296 | 0.8507 |
| ada | AdaBoost Regressor | 0.0222 | 0.0013 | 0.0330 | -0.0680 | 0.0306 | 0.6729 |
| lasso | Lasso Regression | 0.0248 | 0.0015 | 0.0361 | -0.0851 | 0.0339 | 0.5078 |
| en | Elastic Net | 0.0248 | 0.0015 | 0.0361 | -0.0851 | 0.0339 | 0.5078 |
| llar | Lasso Least Angle Regression | 0.0248 | 0.0015 | 0.0361 | -0.0851 | 0.0339 | 0.5078 |
| dummy | Dummy Regressor | 0.0248 | 0.0015 | 0.0361 | -0.0851 | 0.0339 | 0.5078 |
| dt | Decision Tree Regressor | 0.0211 | 0.0018 | 0.0394 | -0.5858 | 0.0363 | 1.0473 |
| par | Passive Aggressive Regressor | 0.0540 | 0.0036 | 0.0593 | -2.9409 | 0.0566 | 1.3479 |
Disclaimer/Publisher’s Note: The statements, opinions and data contained in all publications are solely those of the individual author(s) and contributor(s) and not of MDPI and/or the editor(s). MDPI and/or the editor(s) disclaim responsibility for any injury to people or property resulting from any ideas, methods, instructions or products referred to in the content. |
© 2024 by the authors. Licensee MDPI, Basel, Switzerland. This article is an open access article distributed under the terms and conditions of the Creative Commons Attribution (CC BY) license (http://creativecommons.org/licenses/by/4.0/).
Copyright: This open access article is published under a Creative Commons CC BY 4.0 license, which permit the free download, distribution, and reuse, provided that the author and preprint are cited in any reuse.


