
Submitted:
03 October 2025
Posted:
06 October 2025
You are already at the latest version
Abstract
Monitoring pilot cognitive state in real time is becoming increasingly important as au-tomation plays a larger role in aviation. Traditional workload assessments, such as questionnaires or task-based performance metrics, provide useful insights but can be limited in rapidly changing flight environments. Physiological measures including heart rate, respiration, and electroencephalogram (EEG) offer continuous data streams, yet their variability and complexity present challenges for analysis. This study explores the use of a hierarchical Bayesian framework to quantify patterns from physiological signals rec-orded during high-fidelity flight simulations. Five certified pilots flew scenarios that varied in automation level and working memory demand while heart rate, respiration rate, and EEG-derived workload estimates were monitored. The model generated indi-vidualized and condition-specific estimates, quantified uncertainty, and remained stable with a small participant pool. Heart rate appeared to be the most consistent indicator, followed by EEG-derived workload, while respiration rate was less reliable across con-ditions. These results suggest that Bayesian inference may provide a promising way to interpret physiological data in aviation settings and could support the development of adaptive automation that responds to pilot workload. The approach emphasizes trans-parency and efficiency, offering complementary value to existing modeling techniques for aerospace human factors and flight deck applications.
Keywords:
Bayesian Modeling
; Physiological Measurements
; Human-Automation Interaction
; Aviation Human Factors
; Adaptive Systems
1. Introduction
In modern technological systems, humans are exposed to more information than ever before, shifting system limitations from computational power to human capacity [1]. Research in human factors has shown that task-induced workload can substantially impair performance and cognitive resource allocation [2,3,4]. Automation is often introduced in these information-heavy systems to reduce workload, but ironically it often ends up generating more complex technical challenges than the ones it was intended to solve [2,4,5,6]. With the shift from whether to how much automation to implement, careful consideration of human factors has become more crucial than ever for system designers [7].
Aviation exemplifies a domain where technological advancements have expanded the operator’s access to in-formation, yet this abundance more often leads to information overload than to information dominance [8]. Automation has been implemented in 5th gen aircraft that reduces information overload through information fusion and automated sensor management, which allows the pilot to focus on tactical decision-making. However, automating tasks previously performed by humans has been shown to have negative effects such as reducing the situational awareness of the operator [9,10,11]. The implications of transitioning between autonomous and manual systems introduce the potential for degraded operator states either in cognitive overload (e.g., fully manual operations) or cognitive underload (e.g., fully autonomous operations), and it is important to design systems such that human agents and automated agents can collaborate optimally to achieve decision making superiority [7,12]. Since neither full automation nor full manual control is universally practical, the path toward adaptive hybrid systems begins with understanding and quantifying the operator’s cognitive state.
Traditional methods of assessing cognitive workload often rely on subjective self-report tools such as the NASA-TLX [13], which capture an individual’s perceived workload during specific experimental periods. However, these active assessments are not only time-consuming and intrusive for participants but also pose challenges for experimental validity, particularly in studies with small sample sizes. Subjective measures are prone to bias, as workload ratings have been shown to increase non-linearly with actual cognitive demand [14]. Although some other performance-based measures have been used (e.g. reaction time, response time, task completion time, time to transition between operating modes or between tasks, etc.), these measures lack in validity when performance is shared by the operator and automation.
Physiological measures such as heart rate, respiration, and brain activity provide continuous, objective insights into workload and arousal [15,16,17]. Unlike subjective ratings or task-based measures, they capture high-frequency dynamics but are noisy and individualized, posing statistical challenges. Physiological monitoring is a promising approach to gathering more data in real time for human factors studies, especially in specialized environments such as aviation where access to qualified participants is limited and simulations are resource intensive. Recent research has examined the relationships between physiological indicators and traditional subjective measures, such as cor-relations between NASA-TLX scores and heart rate variability. These studies have revealed complex, nonlinear patterns [18] and strong inter-correlations among subjective scales, yet often report weak or no associations with physiological measures [19], highlighting the nuanced challenges in aligning self-reported and physiological data.
Deterministic approaches often fall short in complex man-made systems, where intra- and inter-individual differences render behavioral data fundamentally statistical in nature [20,21]. Traditional frequentist approaches commonly assume that repeated observations across individuals follow the same distribution, often removing outliers to preserve population-level assumptions. However, in the context of physiological data where responses are highly individualized and inherently complex, this “one-size-fits-all” strategy loses power. What looks like noise at the population level may reflect meaningful signal. To produce robust and reliable predictions, statistical methods must account for individual variability rather than obscure and smooth it away. Rather, statistical methods used to analyze physiological data should be tailored to the individual to ensure robust and reliable predictions. Bayesian statistics offer a compelling alternative, providing a more ecologically valid framework for analyzing physiological data.
Unlike frequentist approaches, which focus on point estimates and often overlook uncertainty, Bayesian methods explicitly model uncertainty and differ in conceptualization, calculations, and functionality from traditional statistical approaches [22]. By incorporating prior knowledge and updating beliefs as new data becomes available, Bayesian inference naturally accommodates both intra- and inter-subject variability [23]. Epistemic uncertainty is quantified and reduced through posterior distributions as more evidence accumulates [24]. This probabilistic foundation enables researchers to analyze complex, individualized, and often sparse psychophysiological datasets without overfitting or oversimplifying the underlying patterns. Recent publications in human factors have used Bayesian analyses for modeling driver response times during automated vehicle takeovers [25,26,27], the effects of distraction and vigilance [28,29], and human automation interaction [30,31,32]. Bayesian analyses of small-sample-size factorial design has been explored in applications involving pilot incapacitation and flight trajectory predictions, and Bayesian methods were shown to increase the reliability and validity of results [33,34].
Despite growing interest in using physiology to assess cognitive states, most studies either treat psychophysiological signals as windowed features for classification or simple regression or apply Bayesian methods to discrete outcomes or small factorial designs. What is largely missing are probabilistic, time-sensitive models that operate directly on continuous multivariate physiological streams and capture both inter- and intra-subject variability. This gap is especially apparent in aviation contexts where sample sizes are small, performance is shared with automation, and subjective ratings are sparse and biased. Methods that exploit longitudinal, continuous time series per participant while borrowing strength across subjects are rare. As a result, current approaches provide limited individualized inference, weak uncertainty quantification, and little guidance for closing the loop between physiology and system design.
This study develops a hierarchical Bayesian model to analyze continuous physiological data from pilots in a flight simulator, addressing small-sample challenges and individual variability. By modeling heart rate, respiration, and EEG-derived workload, we evaluate the potential of Bayesian methods for real-time cognitive state estimation in aviation. Despite the conceptual alignment between Bayesian inference and biological signal variability, there is limited work in applying Bayesian techniques to continuous physiological time series data in human factors research. To address this gap, physiological data was collected from experienced pilots performing flight tasks under varying levels of automation and task difficulty within a high-fidelity flight simulator. A hierarchical Bayesian model was constructed to examine the psychophysiological correlates of these dynamic flight environments and to evaluate the utility of Bayesian methods in an applied small-sample aviation use case. This work explicitly models individual differences, reducing the need to discard “outliers” that may be meaningful signal. Ultimately, this work seeks to advance real-time physiological state estimation by evaluating continuous physiological variables well-suited for Bayesian modeling, and developing an adaptable, data-efficient framework capable of producing robust and generalizable predictions across shifting environmental demands, limited sample sizes, and varying cognitive states.
2. Materials and Methods
Five pilots participated in the study approved by Oklahoma State University’s IRB (IRB-24-229-ATRC), and the inclusion criteria were pilot certification, a current instrument rating, and experience in a Cessna 172 or similar aircraft. All five participants were male with ages ranging from 21 to 39 years (M = 27.60, SD = 9.10) and experience ranging from 253 and 1,450 flight hours (M = 706, SD = 572). An auditory n-back task was used to manipulate workload throughout the experiment with n = 1 corresponding to low workload and n = 2 for high workload. In an n-back task, temporal sequences of stimuli are presented, and participants must decide if the stimulus is the same as the stimuli they heard “n” steps ago. A total of four 15-minute flight task scenarios were flown per participant, creating a 2 (Automation on or off) x 2 (Workload high or low) within-subjects factorial design.
Figure 1 displays the flight path for one participant. The outbound portion from KSWO RWY 17 to ACOKO did not include n-back activity. After completion of the turn-around maneuver the n-back task was started and consequently concluded after landing back at KSWO. Boxcar functions were generated for automation status and workload level throughout the continuous physiological data recordings and used to segment the data into conditions based on the experimental context.
Physiological sensor hardware included an Advanced Brain Monitoring (ABM) B-Alert X10 EEG headset and an Equivital eq02+ Lifemonitor. The EEG headset collected raw brain activity at 256 Hz which was cleaned using 50, 60, 100, and 120 Hz notch filters as well as a 0.05 Hz high pass filter and median filter of order 56. Raw EEG signals were further processed using the headset’s proprietary artifact decontamination algorithm. After signal processing, probabilistic cognitive state estimates were generated at 1 Hz using the manufacturer’s classification algorithm [35,36,37]. The Lifemonitor collected ECG signals at 256 Hz which was used to calculate heart rate using R wave detection with a 30 second rolling average and was reported every 5 seconds [38,39]. Heart rate values were cleaned by removing extreme outliers less than 30 BPM or greater than 200 BPM and removing values outside of 3 standard deviations from an individual’s average heart rate [38]. Respiration rate was collected using the Lifemonitor’s expansion sensor which recorded values every 15 seconds. The final dataset was up sampled via linear interpolation into 1 second epochs which included heart rate (HR; beats per minute), respiration rate (RR; breaths per minute) and workload brain state estimates (WL; percent probability). While ECG-based signals are more practical for real-time analysis in aviation contexts, an EEG-based metric was included alongside ECG-derived measures to address the initial objective of identifying the most promising physiological indicators. In total, over 64 million database records of raw physiological time series data were collected from the sensors, and the final data frame used for analysis was a 19571 x 3 matrix.
2.1. Bayesian Modeling Methodology
We analyzed the physiological data at two levels: the group (experimental condition) level and the participant level. This hierarchical structure is warranted as physiological responses exhibit substantial between-subjects heterogeneity, are sampled at high frequencies (small-N, large-T), and partial pooling allows for the borrowing of strength across participants and conditions to stabilize individual estimates while preserving person-specific effects. The hierarchy also yields calibrated uncertainty at both levels, which is essential for aviation studies with noisy, autocorrelated signals and limited sample sizes.
A univariate approach was used as the foundation for the overall Bayesian modeling, and the HR, RR, and WL data were subset to illustrate the univariate Bayesian approach for each variable of interest separately. Using heart rate as an example, it was assumed that the observed heart rate data is described in discrete observations. HR was sampled at 0.2 Hz throughout an experiment and is well approximated as a continuous variable that typically follows a bell-shaped distribution in healthy populations [40]. The normal distribution often appears in physiological measurements due to the Central Limit Theorem, which states that the sum of many small, independent factors tends to form a normal distribution [41]. Therefore, the heart rate data can be quantitatively described by a normal distribution where µ represents the sample mean HR and σ the sample standard deviation.
When applying a Bayesian approach, the goal is ultimately to obtain a posterior distribution of the parameter of interest [42]. Although normality assumptions must be statistically verified in frequentist statistics, Bayesian statistical approaches do not require strict adherence to distributional assumptions such as normality for valid inference. This is because Bayesian inference is grounded in the likelihood function and the prior distribution, rather than relying on sampling distributions or asymptotic properties of estimators. As a result, the posterior distribution inherently reflects the observed data and the specified functional model, regardless of whether the data conforms to a standard normal distribution. This flexibility allows Bayesian models to accommodate skewed, heavy-tailed, or otherwise non-normal data, making them particularly well-suited for analyzing physiological time series.
In Bayesian statistics, conjugacy refers to a model where the prior and posterior distributions belong to the same family of probability distributions. For example, both the prior knowledge and observed likelihoods for heart rate data follow a normal distribution; therefore, the posterior is also a normal distribution due to conjugacy. The posterior probability is given by Bayes’ theorem, in which the posterior distribution is proportional to the prior distribution multiplied by the likelihood function of the data. Since both are normal, the product of the two normal densities is proportional to another normal density [43]. This allows us to identify the posterior distribution that updates from the observed data by combining it with the prior distribution. More information about conjugacy derivations used in the work can be found in the Appendix (A1).
The Bayesian model was constructed hierarchically to account for both within- and between-subject variability in physiological responses arising from changes in primary and secondary task demands. This hierarchical framework supports robust inference at both group and individual levels, accommodates sparse or unbalanced datasets, and removes the need for manual transformation of physiological time series, making it especially well-suited for cognitive workload research in dynamic environments [45]. More information about the hierarchical form and mathematics can be found in the Appendix (A2).
To visualize the results of a Bayesian approach to analyzing physiological data, 95% credible intervals were constructed by calculating a highest posterior density (HPD) interval that captures 95% of the posterior probability density function. These credible intervals were plotted alongside the posterior means over the observed physiological density curve for each participant and condition. To evaluate the fit of the model, several diagnostics were compared for each participant. Predictive performance is assessed with an 80/20 train-test split (Automation On/Workload Low scenario for comparability). We report the Coverage Probability Index (CPI), Mean Absolute Percentage Error (MAPE), and Concordance Correlation Coefficient (CCC) on held-out data. The CPI was estimated by calculating the probability that the observed heart rate values fall within the predicted 95% credible interval [46]. The MAPE was calculated for the results of the overall prediction error [47]. CCC was found for each set of predictions using the epiR package in R [48].
The hierarchical Bayesian model was developed in R (Version 2023.12.1+402) that uses each physiological time series with associated contextual characteristics to model the pilot’s behavior throughout the experiment. HR, RR, and WL were modeled separately with the same hierarchical structure; differences lay only in their priors and measurement models (e.g. WL bounded in [0,1]). Prior knowledge from biomedical literature can inform the selection of appropriate prior distributions for physiological variables. For instance, studies have shown that heart rate in healthy adult males typically follows a normal distribution centered around 75 beats per minute (bpm) with a standard deviation of approximately 7.7 bpm [49]. This prior information can be further refined using individual-specific data, such as baseline resting heart rates, to create more informative and personalized priors. However, to preserve generalizability and facilitate comparisons across individuals, noninformative (or weakly informative) priors were applied uniformly in this study.
To assess the robustness of the model to prior assumptions, a prior sensitivity analysis was conducted. This involved re-running the model with a range of alternative priors—varying in both informativeness and distributional form—to evaluate the impact on posterior estimates. The goal was to ensure that key inferences were driven by the data rather than overly influenced by the choice of prior. Results of this analysis supported the stability of model outcomes, indicating that the primary conclusions held consistently across different prior specifications. The probabilistic nature of ABM’s brain state estimates quantifies workload between 0 and 1; thus, a weakly uninformative prior belief was set to 0.50 probability with a standard deviation of 0.1. Therefore, the prior distributions used for each variable of interest were:
3. Results
The group level results of this hierarchical Bayesian model for HR, RR, and WL brain state estimates can be seen in Table 1. The hierarchical nature of the model allows for between-subjects comparisons in mean and standard deviations of each physiological variable. Participants exhibited the highest HR in the condition where Automation was on and workload was high (i.e., 2-back task). RR was the lowest in the Automation On/Workload High condition and highest in the Automation Off/Workload Low condition. WL estimates were higher while the n-back level was high, which reflects the efficacy of the secondary task working memory manipulation. In Table 1, n indicates the number of observations for the experimental condition, which may vary due to the participant variability in completing the simulated flight.
The participant level results for heart rate can be seen below in Table 2. The number of per-trial observations across participants ranges from 623 to 1433. The posterior means and standard deviations are reasonable for each physiological variable. In general, participants 2 and 3 have a higher heart rate than average. Participant 2 also exhibits the highest respiration rate on average. WL estimates from participant 5 are observed to be higher than the other participants. These results highlight the vast individual differences in physiology present in the data collected.
The HR, RR, and WL estimates are shown visually with 95% credible intervals in Figure 2. The participants’ physiological responses varied noticeably throughout the experiment. Some participants demonstrated substantial differences across conditions, for instance participant 5’s WL estimates, while others showed more minimal changes, such as in participant 1’s HR across conditions. Overall, there was more variation present for all three physiological variables during the Automation Off/Workload High condition, as shown in the bottom left plot in each set of plots.
The diagnostic results of the Bayesian models for each participant can be seen in Table 3 for HR, RR, and WL. Prediction diagnostics revealed clear differences in model accuracy across physiological measures. HR predictions were consistently accurate across participants, with low MAPE values (ranging from 8.15% to 10.1%) and strong agreement between predicted and observed values, as reflected in relatively high CCCs (0.766–0.904) and moderate to high CPIs (0.660–0.853). In contrast, RR predictions showed greater variability and generally poorer performance. MAPE values for RR were markedly higher (10.9% to 50.8%), and CCCs were notably lower (0.181–0.681), suggesting weaker concordance. CPIs for RR were also inconsistent, with values ranging from 0.363 to 0.853. WL predictions exhibited the highest overall MAPE (24.5% to 37.7%), yet CCCs ranged more favorably (0.610–0.853), indicating moderate agreement for some participants. CPI values for WL also varied widely (0.323–0.807), pointing to mixed coverage quality. These results suggest that predictive models performed best for HR, followed by WL, and were least reliable for RR.
To understand the implications of this Bayesian approach, the results of this model in the form of posterior estimates for mean and standard deviation can be visualized in conjunction with the observed physiological data collected throughout the experiment. Posterior density plots with corresponding 95% credible intervals (CIs) were generated for each participant for HR, RR, and WL to assess model calibration and predictive uncertainty. Figure 3, Figure 4 and Figure 5 demonstrate the distribution of physiological data by participant. The colored bars on the plots correspond to the experimental conditions (Red represents the Automation Off/Workload Low condition, Green represents the Automation Off/Workload High condition, Orange represents Automation On/Workload Low condition, and Blue represents Automation On/Workload High condition).
With the complete posterior distribution over all experimental conditions, several pieces of information can be gathered from the model. For HR, observed values for all participants generally fell within the high-density regions of the posterior distributions and were encompassed by the 95% CIs, suggesting well-calibrated and reliable estimates. Participants 1 and 5 exhibited particularly tight HR posterior distributions with close alignment between predicted and observed values. In contrast, RR predictions showed greater variability across participants. Several posterior distributions—most notably for participants 3, 4, and 5—were skewed or multimodal, and observed values occasionally fell near the tails of the distributions, indicating increased uncertainty and reduced precision for RR. Workload predictions showed more consistent performance. The posterior distributions for WL were relatively symmetric and narrow, with observed values frequently aligning with the posterior modes for all participants. WL posterior credible intervals were more centered in the observed distributions, failing to capture densities on the tails of the workload estimate distributions. Overall, model performance appeared strongest for HR and WL, with greater variability and lower confidence in RR estimates—consistent with trends observed in the quantitative prediction diagnostics.
4. Discussion
A Bayesian approach was adopted to quantify and predict participants’ physiological states in a flight simulator study examining the effects of automation level and task workload. The model successfully captured variation in physiological responses across experimental conditions by leveraging contextual information to segment and interpret the continuous time series data. This enabled meaningful comparisons between levels of automation and cognitive demand. A hierarchical modeling structure facilitated both within- and between-subject analyses. At the group level, heart rate was consistently elevated under high workload conditions with automation. While most participants followed this trend, one outlier underscored the value of individualized modeling, highlighting how Bayesian methods accommodate variability without discarding data as “noise.”
Heart rate was the most reliable measure, followed by workload estimates from EEG, while respiration rate proved least consistent. As anticipated, EEG-based WL estimates were higher during the 2-back task compared to the 1-back task, confirming the effectiveness of the working memory manipulation. Additionally, respiration rates were generally lower when automation was disengaged, potentially reflecting the increased cognitive and physical demands associated with manual flight control. These findings highlight the promise of Bayesian approaches for interpreting small-sample, high-frequency physiological data in aviation.
A key advantage of this framework is its ability to accommodate individual variability without discarding it as statistical noise. For example, while most participants showed elevated heart rate under high workload with automation, one deviated from this trend: an effect that traditional averaging methods would obscure. By modeling posterior distributions rather than single point estimates, the Bayesian approach offers nuanced, data-efficient predictions. For instance, participant 5 exhibited a distinct local heart rate maximum near 82 BPM under the Automation On/Workload High condition, yet their overall mean heart rate more closely aligned with the Automation Off/Workload High condition, which produced a global maximum near 75 BPM. These observations suggest the presence of semi-stationary elevated workload states that manifest differently across task contexts, with extended periods of physiologically distinct responses.
This individualized modeling approach enables the comparison of overall trends without compromising data integrity or inflating Type I error due to repeated measures. As additional data becomes available, the model naturally converges toward more precise estimates, improving both robustness and predictive accuracy. Notably, posterior estimates from one iteration of the model can be reused as informed priors in subsequent analyses, enabling longitudinal or within-subject modeling across multiple experimental sessions. Repeated sessions from a single participant could be analyzed using their personalized posterior distribution as a prior, yielding more accurate and context-specific predictions of physiological state. This iterative capability offers broad applicability across experimental designs and time-varying datasets, underscoring the flexibility and power of Bayesian inference in psychophysiological research.
Collectively, these findings highlight the utility of Bayesian modeling in capturing individual-specific and context-dependent physiological patterns, offering a powerful tool for real-time assessment of cognitive workload in complex, dynamic environments. Bayesian approaches allow researchers to explicitly model uncertainty and tailor likelihoods to the characteristics of the data, improving robustness and ecological validity in real-world applications. Physiological signals are influenced by multiple intrinsic and extrinsic factors and often shift over time, making them non-stationary. Bayesian approaches are well suited for such data because they quantify uncertainty and adapt as evidence accumulates. This combination provides the repetition and granularity needed for highly confident, data-efficient predictions.
While recent advances in noninvasive physiological and neurological sensing have significantly improved our ability to observe the human state in real time, there remains a considerable gap in understanding the complex dynamics, interdependencies, and feedback mechanisms within these signals—particularly in the context of brain activity. Although physiological metrics such as heart rate, respiration, and EEG have been quantitatively linked to constructs like workload, fatigue, and engagement [50,51,52], the majority of existing work analyzes these signals in isolated snapshots. Very little research has focused on modeling physiological data longitudinally, limiting our understanding of how these metrics evolve over time and interact with cognitive processes. Without temporally sensitive models, researchers risk drawing incomplete or misleading conclusions from highly individualized, non-stationary data. Furthermore, while multimodal sensing approaches have shown promise for workload prediction in simulation and surgical settings [53,54], these methods typically rely on machine learning classifiers that require large training datasets and offer limited transparency.
These results carry important implications for aviation. Real-time Bayesian monitoring could inform adaptive automation, enabling systems to respond dynamically to operator state by adjusting task allocation or interface complexity. Unlike black-box machine learning classifiers, Bayesian models are lightweight, interpretable, and provide quantified uncertainty - qualities essential for aerospace applications where transparency and robustness are critical. Given its relatively non-invasive nature compared to EEG-based metrics, heart rate demonstrates strong potential for future modeling efforts in similar contexts. The current model provides discrete, condition-specific predictions for heart rate using a hierarchical Bayesian structure, yet its framework can be extended to incorporate time as an explicit variable allowing for true time-series prediction rather than random posterior sampling on static conditions. Future work should also explore posterior updating using segmented time windows of varying lengths to evaluate signal stability, noise sensitivity, and time-dependent patterns in physiological state.
In addition, a key direction for future research is the integration of multiple physiological signals within a unified Bayesian framework. While this study used a parallel univariate approach via Normal-Normal conjugacy, future modeling efforts could explore multivariate extensions, such as the Multivariate Normal-Wishart conjugate structure, to jointly model heart rate, respiration, and other physiological variables. Prior work has successfully applied classifiers, including neural networks and multiresolution fusion frameworks, to multivariate physiological data for real-time emotion recognition and mental workload assessment [55,56]. However, these approaches often prioritize prediction accuracy over interpretability and lack mechanisms for uncertainty quantification or integration of prior knowledge—limitations that the Bayesian modeling framework used in the present study is designed to address.
5. Conclusions
This study applied a hierarchical Bayesian modeling framework to physiological data collected from experienced pilots in a flight simulator—an environment that by nature presents challenges in terms of small sample sizes. Within the aviation research community, concerns about generalizability and statistical power are common, particularly when using traditional frequentist approaches that rely heavily on large samples and repeated trials. Bayesian statistics offer a compelling alternative: they naturally accommodate small-n, high-resolution datasets through the integration of prior knowledge and the probabilistic modeling of uncertainty. This makes Bayesian inference particularly well-suited for flight-based human factors research, where within-subjects data are rich but participant pools are often limited.
As flight systems become increasingly automated, physiological monitoring has gained importance as a real-time source of insight into pilot cognitive state. Bayesian models provide a principled framework for interpreting such data by contextualizing it within prior knowledge such as normative resting heart rates or baseline workload levels, and by treating individual variability as meaningful information rather than noise. Unlike point-estimate methods that oversimplify complex human states, Bayesian approaches quantify uncertainty directly, offering a more nuanced and transparent interpretation of operator state across changing task demands and environments.
Looking ahead, the continued development of this Bayesian framework may enable implementation directly within flight systems. A real-time Bayesian model could continuously update posterior beliefs about a pilot’s physiological condition and adapt automated systems accordingly, allowing the level of automation to be dynamically calibrated to cognitive state. Compared to computationally intensive models such as neural networks or black-box classification algorithms, the Bayesian approach is lightweight, interpretable, and data-efficient, making it more feasible for real-time deployment in operational settings. Finally, by enabling continuous, individualized modeling of cognition and physiology, this method offers a more ecologically valid alternative to standardized questionnaires and discrete behavioral metrics. It represents a promising paradigm for advancing human-automation interaction and suggests that Bayesian inference may be the key analytical lens through which to understand and model the dynamic, complex nature of human physiological data in high-stakes environments.
Author Contributions
Conceptualization, A.K. and K.J.; methodology, A.K.; software, B.R.; validation, A.K., B.R. and K.J.; formal analysis, A.K..; investigation, A.K..; resources, R.P..; data curation, B.R.; writing—original draft preparation, A.K..; writing—review and editing, A.K. and K.J.; visualization, B.R.; supervision, K.J. and R.P.; project administration, R.P.; funding acquisition, K.J. and R.P. All authors have read and agreed to the published version of the manuscript.
Funding
This research did not receive any specific grant from funding agencies in the public, commercial, or not-for-profit sectors.
Data Availability Statement
The data presented in this study are available on request from the corresponding author due to privacy restrictions.
Conflicts of Interest
The authors declare no competing interests.
Abbreviations
The following abbreviations are used in this manuscript:
| HR | Heart rate |
| RR | Respiration rate |
| HRV | Heart rate variability |
| EEG-WL | Electroencephalogram based workload estimates |
Appendix A
Appendix A.1: Normal-Normal Conjugacy Derivations
Consider a segment with n observations and sample mean With known measurement variance and a Normal prior , the posterior distribution can be described as:
To find the posterior distribution form, we expand the quadratic in μ and complete the square in Equation (1) to expose the Normal kernel. This allows us to identify the posterior distribution that “learns” from the observed data by combining it with the prior belief µ, weighted by their respective precisions. Thus, the Normal-Normal conjugate update is for the posterior mean and posterior variance is quantified respectively in Equations (2) and (3):
Appendix A.2: Hierarchical Pooling Methodology
Let denote the number of samples for participant p and the number of samples for condition group g, with and their respective means. Each group-level mean is assigned a Normal prior and updated to a Normal posterior , as described in the previous section. These group-level estimates are then used to inform individual participant-level posteriors, enabling the model to borrow strength across conditions and individuals. The explicit partial pooling equations can be found in Table A1.
A prior variance regularization parameter τ governs the relative influence of the prior group mean versus the observed data. Larger values of τ yield more conservative posteriors (i.e., less sensitive to new data), whereas smaller values allow the model to adapt more readily to incoming observations. As data accumulates—either within a participant (increasing ) or across participants (increasing )—the influence of τ diminishes, allowing the posterior to become increasingly data-driven. Additionally, a hyperparameter δ is introduced to capture between-group variability, facilitating flexible modeling of condition-level effects.

Table A1.
Formulas used for Group Level and Individual Level Posterior Estimates.
| Parameter | Group Level Posterior Estimates | Individual Level Posterior Estimates |
|---|---|---|
| Posterior form | ||
| Mean | ||
| Variance | ||
| Hyperparameter for between-group variability | ||
| Hyperparameter for within-group variability |
Notation key: p participant, g condition, t time index; prior mean/variance; within-person variance; between-person variance.
References
- Parnell KJ 1, Banks VA 1, Allison CK 2, Plant KL 1, Beecroft P 3, Stanton NA 1 1 U of S, et al. Designing flight deck applications: combining insight from end-users and ergonomists. 2021 May;353–65.
- Kahneman, D. Attention and effort. Englewood Cliffs, New Jersey: Prentice-Hall, Inc; 1973. 246 p. (Prentice-Hall series in experimental psychology).
- Robert, J. Hockey G. Compensatory control in the regulation of human performance under stress and high workload: A cognitive-energetical framework. Biol Psychol. 1997 Mar 21;45(1):73–93.
- Szalma JL, Claypoole VL. Vigilance and Workload in Automated Systems: Patterns of Association, Dissociation, and Insensitivity. In: Human Performance in Automated and Autonomous Systems. CRC Press; 2019.
- Bainbridge, L. Ironies of automation. Automatica. 1983 Nov 1;19(6):775–9.
- Hancke, T. Ironies of Automation 4.0. IFAC-Pap. 2020 Jan 1;53(2):17463–8.
- Parasuraman R, Sheridan TB, Wickens CD. A model for types and levels of human interaction with automation. IEEE Trans Syst Man Cybern - Part Syst Hum. 2000 May;30(3):286–97.
- Svoboda A, Boril J, Bauer M, Costa PCG, Blasch E. Information Overload in Tactical Aircraft. In: 2019 IEEE/AIAA 38th Digital Avionics Systems Conference (DASC) [Internet]. 2019 [cited 2024 Aug 2]. p. 1–5. Available from: https://ieeexplore.ieee.org/abstract/document/9081763.
- Edwards T, Homola J, Mercer J, Claudatos L. Multifactor interactions and the air traffic controller: The interaction of situation awareness and workload in association with automation. IFAC-Pap. 2016 Jan 1;49(19):597–602.
- Endsley MR, Kiris EO. The Out-of-the-Loop Performance Problem and Level of Control in Automation. Hum Factors. 1995 June 1;37(2):381–94.
- Naranji E, Sarkani S, Mazzuchi T. Reducing Human/Pilot Errors in Aviation Using Augmented Cognition and Automation Systems in Aircraft Cockpit. AIS Trans Hum-Comput Interact. 2015 Jan;7(2):71–96.
- Chen JYC, Barnes MJ, Harper-Sciarini M. Supervisory Control of Multiple Robots: Human-Performance Issues and User-Interface Design. IEEE Trans Syst Man Cybern Part C Appl Rev. 2011 July;41(4):435–54.
- Hart SG, Staveland LE. Development of NASA-TLX (Task Load Index): Results of Empirical and Theoretical Research. In: Hancock PA, Meshkati N, editors. Advances in Psychology [Internet]. North-Holland; 1988 [cited 2024 July 23]. p. 139–83. (Human Mental Workload; vol. 52). Available from: https://www.sciencedirect.com/science/article/pii/S0166411508623869.
- Estes, S. The Workload Curve: Subjective Mental Workload. Hum Factors. 2015 Nov 1;57(7):1174–87.
- Dehais F, Lafont A, Roy R, Fairclough S. A Neuroergonomics Approach to Mental Workload, Engagement and Human Performance. Front Neurosci [Internet]. 2020 Apr 7 [cited 2024 July 22];14. Available from: https://www.frontiersin.org/journals/neuroscience/articles/10.3389/fnins.2020.00268/full.
- Orphanidou, C. A review of big data applications of physiological signal data. Biophys Rev. 2019 Feb 1;11(1):83–7.
- Zhang T, Yang J, Liang N, Pitts BJ, Prakah-Asante K, Curry R, et al. Physiological Measurements of Situation Awareness: A Systematic Review. Hum Factors. 2023 Aug 1;65(5):737–58.
- Alaimo A, Esposito A, Orlando C, Simoncini A. Aircraft Pilots Workload Analysis: Heart Rate Variability Objective Measures and NASA-Task Load Index Subjective Evaluation. Aerospace. 2020 Sept;7(9):137.
- Mansikka H, Virtanen K, Harris D. Comparison of NASA-TLX scale, modified Cooper-Harper scale and mean inter-beat interval as measures of pilot mental workload during simulated flight tasks. Ergonomics. 2019 Feb;62(2):246–54.
- Adams JA, Webber CE. Monte Carlo Model of Tracking Behavior. Hum Factors. 1963 Feb 1;5(1):81–102.
- Johannsen G, Rouse WB. Mathematical Concepts for Modeling Human Behavior in Complex Man-Machine Systems. Hum Factors. 1979 Dec 1;21(6):733–47.
- Jurewicz KA, Neyens DM. Bayesian Approach to Multimodal Data in Human Factors Engineering. In: Gaw N, Pardalos PM, Gahrooei MR, editors. Multimodal and Tensor Data Analytics for Industrial Systems Improvement [Internet]. Cham: Springer International Publishing; 2024 [cited 2025 Mar 11]. p. 357–71. [CrossRef]
- Hoff PD. A First Course in Bayesian Statistical Methods [Internet]. New York, NY: Springer; 2009 [cited 2025 May 16]. (Springer Texts in Statistics). Available from: http://link.springer.com/10.1007/978-0-387-92407-6.
- Cowles, MK. Applied Bayesian Statistics: With R and OpenBUGS Examples. Springer Science & Business Media; 2013. 238 p.
- Alambeigi H, McDonald AD. A Bayesian Regression Analysis of the Effects of Alert Presence and Scenario Criticality on Automated Vehicle Takeover Performance. Hum Factors. 2023 Mar 1;65(2):288–305.
- DinparastDjadid A, Lee JD, Domeyer J, Schwarz C, Brown TL, Gunaratne P. Designing for the Extremes: Modeling Drivers’ Response Time to Take Back Control From Automation Using Bayesian Quantile Regression. Hum Factors. 2021 May 1;63(3):519–30.
- Wei R, McDonald AD, Mehta RK, Garcia A. Active Inference Models of AV Takeovers: Relating Model Parameters to Trust, Situation Awareness, and Fatigue. Hum Factors. 2024 Nov 1;00187208241295932.
- Biondi FN, McDonnell AS, Mahmoodzadeh M, Jajo N, Balasingam B, Strayer DL. Vigilance Decrement During On-Road Partially Automated Driving Across Four Systems. Hum Factors. 2024 Sept 1;66(9):2179–90.
- Neyens DM, Boyle LN, Schultheis MT. The Effects of Driver Distraction for Individuals With Traumatic Brain Injuries. Hum Factors. 2015 Dec 1;57(8):1472–88.
- Boskemper MM, Bartlett ML, McCarley JS. Measuring the Efficiency of Automation-Aided Performance in a Simulated Baggage Screening Task. Hum Factors. 2022 Sept 1;64(6):945–61.
- Driggs J, Vangsness L. Judgments of Difficulty (JODs) While Observing an Automated System Support the Media Equation and Unique Agent Hypotheses. Hum Factors. 2025 Apr 1;67(4):347–66.
- Huang J, Choo S, Pugh ZH, Nam CS. Evaluating Effective Connectivity of Trust in Human–Automation Interaction: A Dynamic Causal Modeling (DCM) Study. Hum Factors. 2022 Sept 1;64(6):1051–69.
- Schmid D, Stanton NA. Exploring Bayesian analyses of a small-sample-size factorial design in human systems integration: the effects of pilot incapacitation. Hum-Intell Syst Integr. 2019 Dec;1(2–4):71–88.
- Zhang X, Mahadevan S. Bayesian neural networks for flight trajectory prediction and safety assessment. Decis Support Syst. 2020 Apr 1;131:113246.
- Berka C, Levendowski ,Daniel J., Cvetinovic ,Milenko M., Petrovic ,Miroslav M., Davis ,Gene, Lumicao ,Michelle N., et al. Real-Time Analysis of EEG Indexes of Alertness, Cognition, and Memory Acquired With a Wireless EEG Headset. Int J Human–Computer Interact. 2004 June 1;17(2):151–70.
- Berka C, Johnson R, Whitmoyer M, Behneman A, Popovic D, Davis G. Biomarkers for Effects of Fatigue and Stress on Performance: EEG, P300 and Heart Rate Variability. Proc Hum Factors Ergon Soc Annu Meet. 2008 Sept 1;52(3):192–6.
- Johnson RR, Popovic DP, Olmstead RE, Stikic M, Levendowski DJ, Berka C. Drowsiness/alertness algorithm development and validation using synchronized EEG and cognitive performance to individualize a generalized model. Biol Psychol. 2011 May 1;87(2):241–50.
- Akintola AA, van de Pol V, Bimmel D, Maan AC, van Heemst D. Comparative Analysis of the Equivital EQ02 Lifemonitor with Holter Ambulatory ECG Device for Continuous Measurement of ECG, Heart Rate, and Heart Rate Variability: A Validation Study for Precision and Accuracy. Front Physiol [Internet]. 2016 Sept 21 [cited 2025 May 19];7. Available from: https://www.frontiersin.org/journals/physiology/articles/10.3389/fphys.2016.00391/full.
- Liu Y, Zhu,Shai H., Wang,Guo H., Ye,Fei, and Li PZ. Validity and Reliability of Multiparameter Physiological Measurements Recorded by the Equivital Lifemonitor During Activities of Various Intensities. J Occup Environ Hyg. 2013 Feb 1;10(2):78–85.
- Celka P, Vesin J m., Vetter R, Grueter R, Thonet G, Pruvot E, et al. Parsimonious Modeling of Biomedical Signals and Systems: Applications to the Cardiovascular System. In: Nonlinear Biomedical Signal Processing [Internet]. John Wiley & Sons, Ltd; 2000 [cited 2025 Apr 3]. p. 92–132. Available from: https://onlinelibrary.wiley.com/doi/abs/10.1109/9780470545379.ch4.
- Dudley, RM. Central Limit Theorems for Empirical Measures. Ann Probab. 1978;6(6):899–929.
- Glickman ME, van Dyk DA. Basic Bayesian Methods. In: Ambrosius WT, editor. Topics in Biostatistics [Internet]. Totowa, NJ: Humana Press; 2007 [cited 2025 Apr 3]. p. 319–38. [CrossRef]
- Bernardo JM, Smith AFM. Bayesian Theory. John Wiley & Sons; 2009. 612 p.
- Gelman A, Carlin JB, Stern HS, Dunson DB, Vehtari A, Rubin DB. Bayesian Data Analysis. 3rd ed. New York: Chapman and Hall/CRC; 2013. 675 p.
- Lin L, Hedayat,A. S, Sinha,Bikas, and Yang M. Statistical Methods in Assessing Agreement: Models, Issues, and Tools. J Am Stat Assoc. 2002 Mar 1;97(457):257–70.
- Zhang B, Ren H, Huang G, Cheng Y, Hu C. Predicting blood pressure from physiological index data using the SVR algorithm. BMC Bioinformatics. 2019 Feb 28;20(1):109.
- Quer G, Gouda P, Galarnyk M, Topol EJ, Steinhubl SR. Inter- and intraindividual variability in daily resting heart rate and its associations with age, sex, sleep, BMI, and time of year: Retrospective, longitudinal cohort study of 92,457 adults. PLoS ONE. 2020 Feb 5;15(2):e0227709.
- Stevenson M, Sergeant E, Heuer C, Nunes T, Marshall J, Sanchez J, et al. epiR: Tools for the Analysis of Epidemiological Data. R package version 2.0.xx. 2025. Available from: https://CRAN.R-project.org/package=epiR.
- Borghini G, Vecchiato G, Toppi J, Astolfi L, Maglione A, Isabella R, et al. Assessment of mental fatigue during car driving by using high resolution EEG activity and neurophysiologic indices. In: 2012 Annual International Conference of the IEEE Engineering in Medicine and Biology Society [Internet]. 2012 [cited 2024 June 19]. p. 6442–5. Available from: https://ieeexplore.ieee.org/abstract/document/6347469.
- Gevins A, Smith ME. Neurophysiological measures of cognitive workload during human-computer interaction. Theor Issues Ergon Sci [Internet]. 2003 Jan 1 [cited 2024 June 19]; Available from: https://www.tandfonline.com/doi/abs/10.1080/14639220210159717.
- Hopstaken JF, van der Linden D, Bakker AB, Kompier MAJ. The window of my eyes: Task disengagement and mental fatigue covary with pupil dynamics. Biol Psychol. 2015 Sept 1;110:100–6.
- Lee YH, Liu BS. Inflight Workload Assessment: Comparison of Subjective and Physiological Measurements. Aviat Space Environ Med. 2003 Oct 1;74(10):1078–84.
- Harrivel AR, Stephens CL, Milletich RJ, Heinich CM, Last MC, Napoli NJ, et al. Prediction of Cognitive States during Flight Simulation using Multimodal Psychophysiological Sensing. In: AIAA Information Systems-AIAA Infotech @ Aerospace [Internet]. American Institute of Aeronautics and Astronautics; [cited 2025 May 28]. Available from: https://arc.aiaa.org/doi/abs/10.2514/6.2017-1135.
- Zhou T, Cha JS, Gonzalez G, Wachs JP, Sundaram CP, Yu D. Multimodal Physiological Signals for Workload Prediction in Robot-assisted Surgery. J Hum-Robot Interact. 2020 Jan 30;9(2):12:1-12:26.
- Verma GK, Tiwary US. Multimodal fusion framework: A multiresolution approach for emotion classification and recognition from physiological signals. NeuroImage. 2014 Nov 15;102:162–72.
- Wilson GF, Russell CA. Real-Time Assessment of Mental Workload Using Psychophysiological Measures and Artificial Neural Networks. Hum Factors. 2003 Dec 1;45(4):635–44.
Figure 1.
Participant flight path.
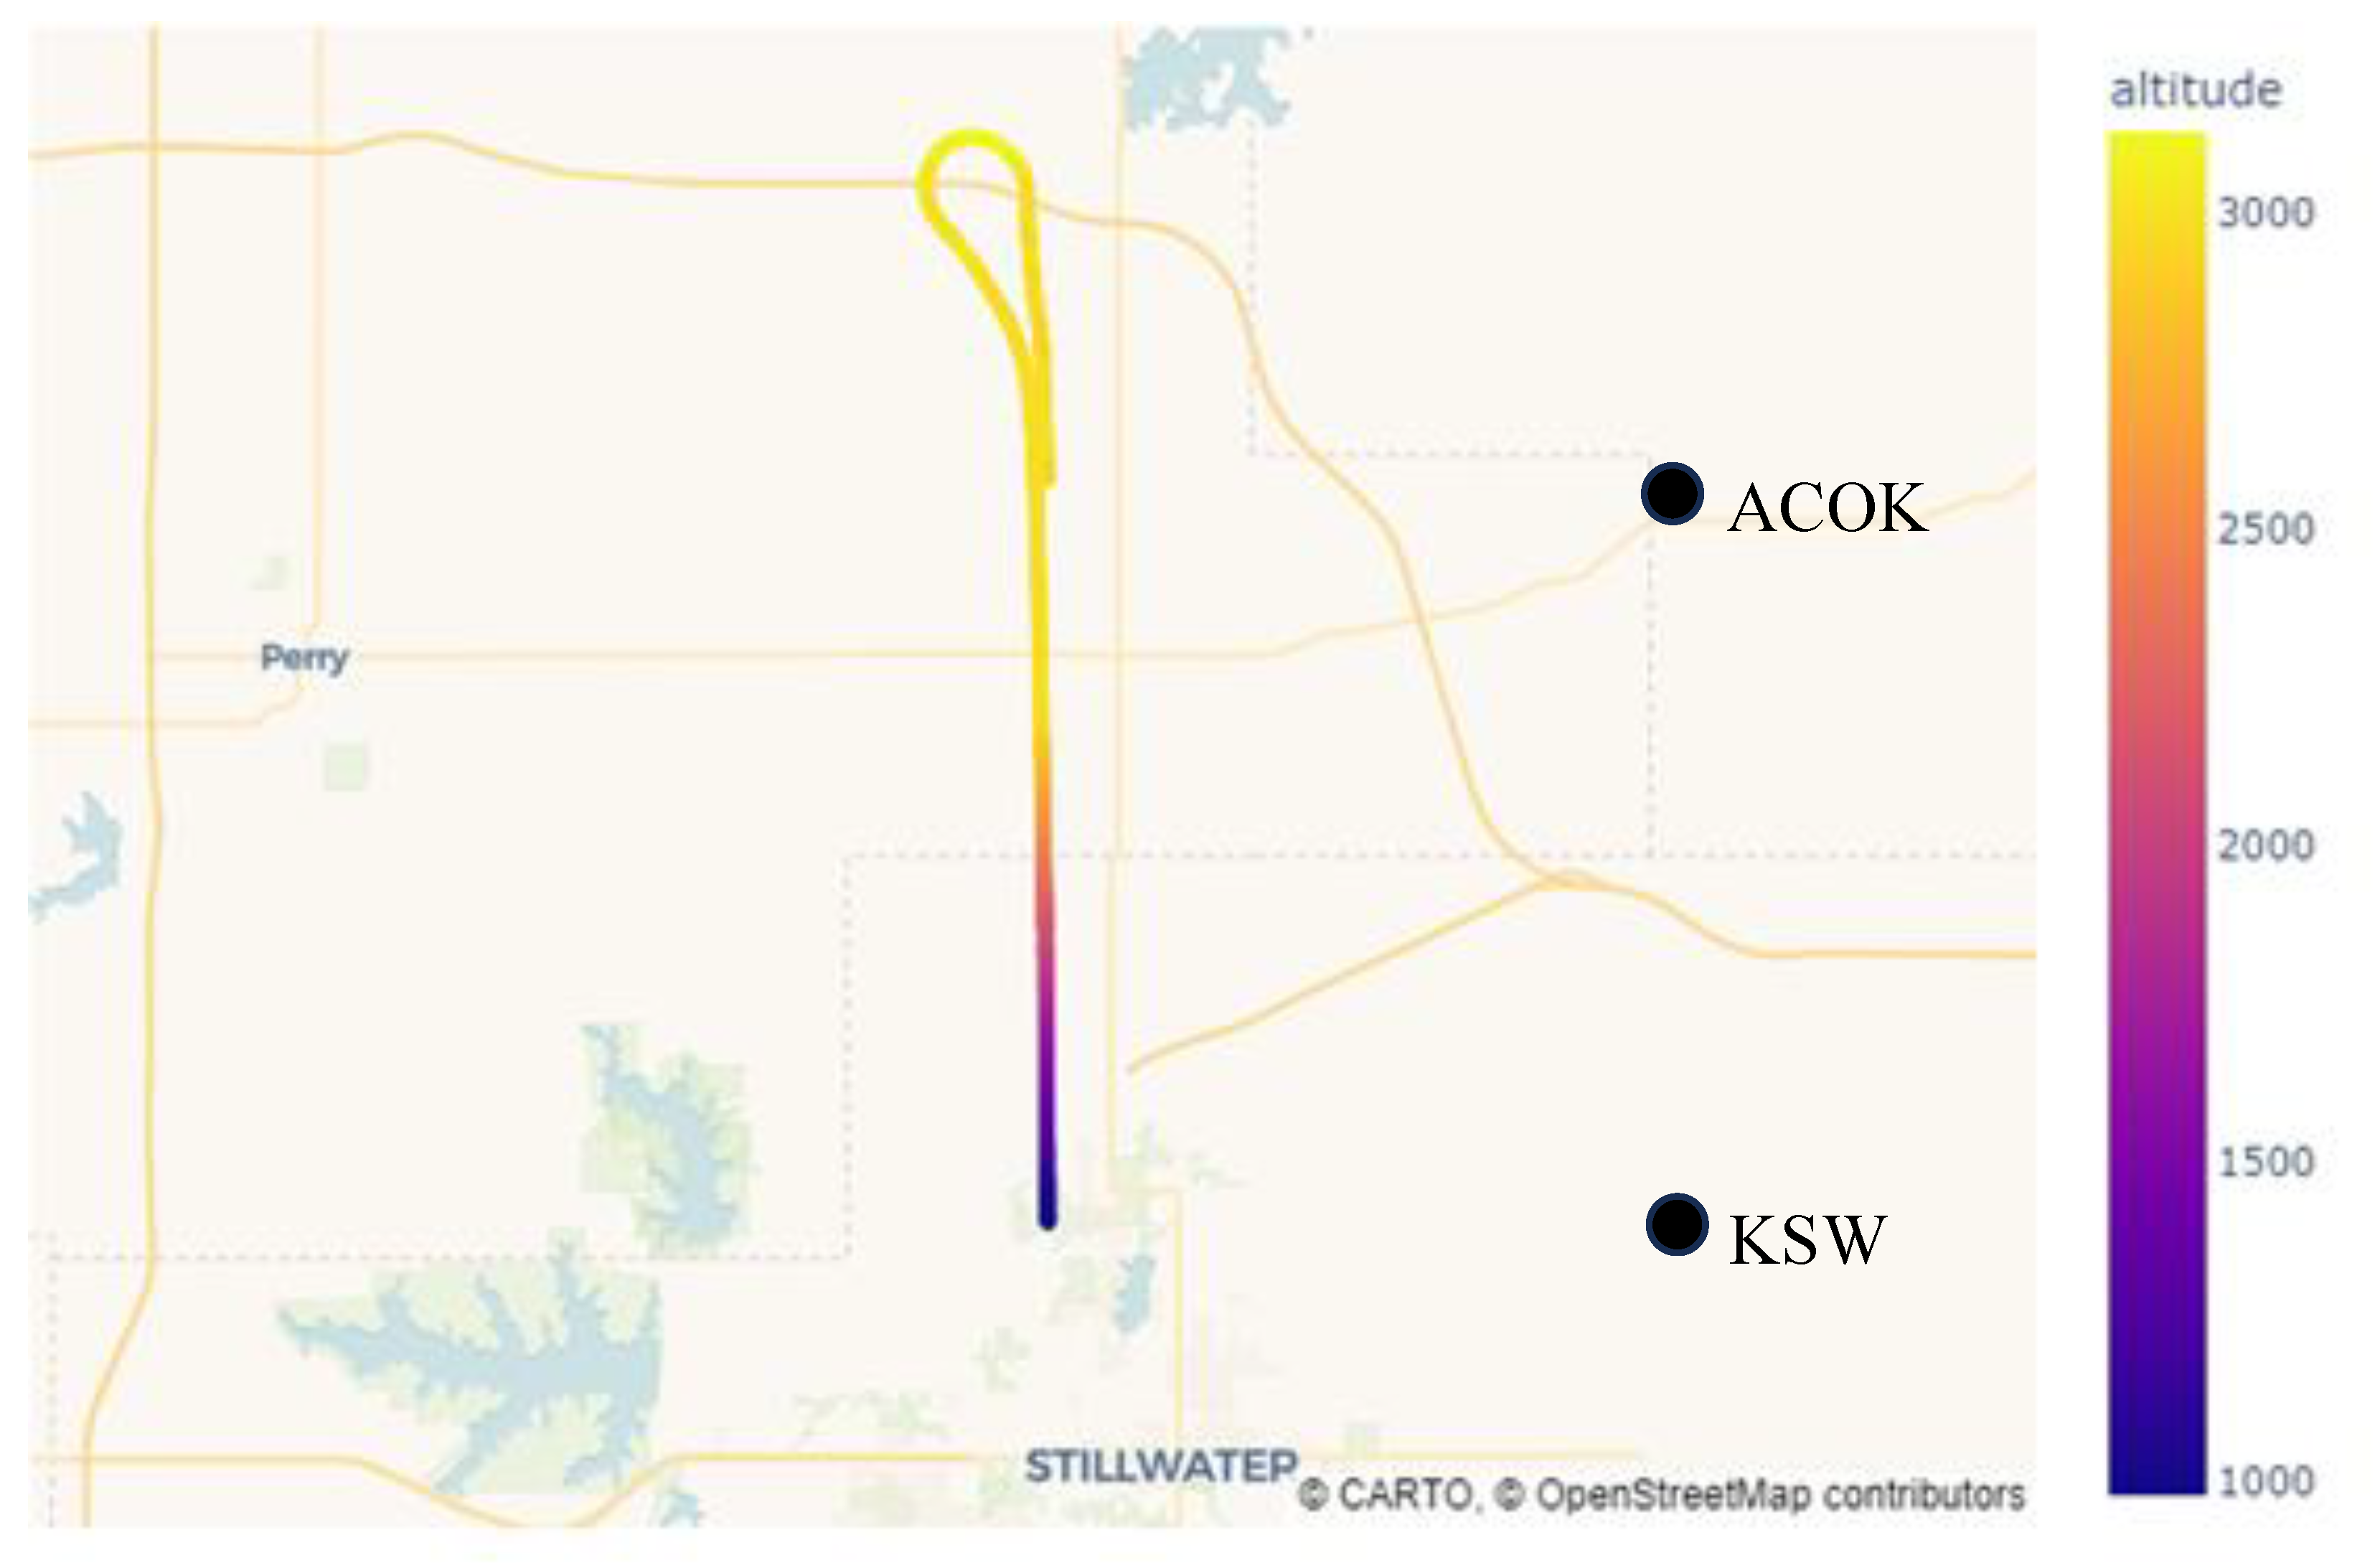
Figure 2.
Posterior credible intervals for HR (Top), RR (Middle), and WL (Bottom).
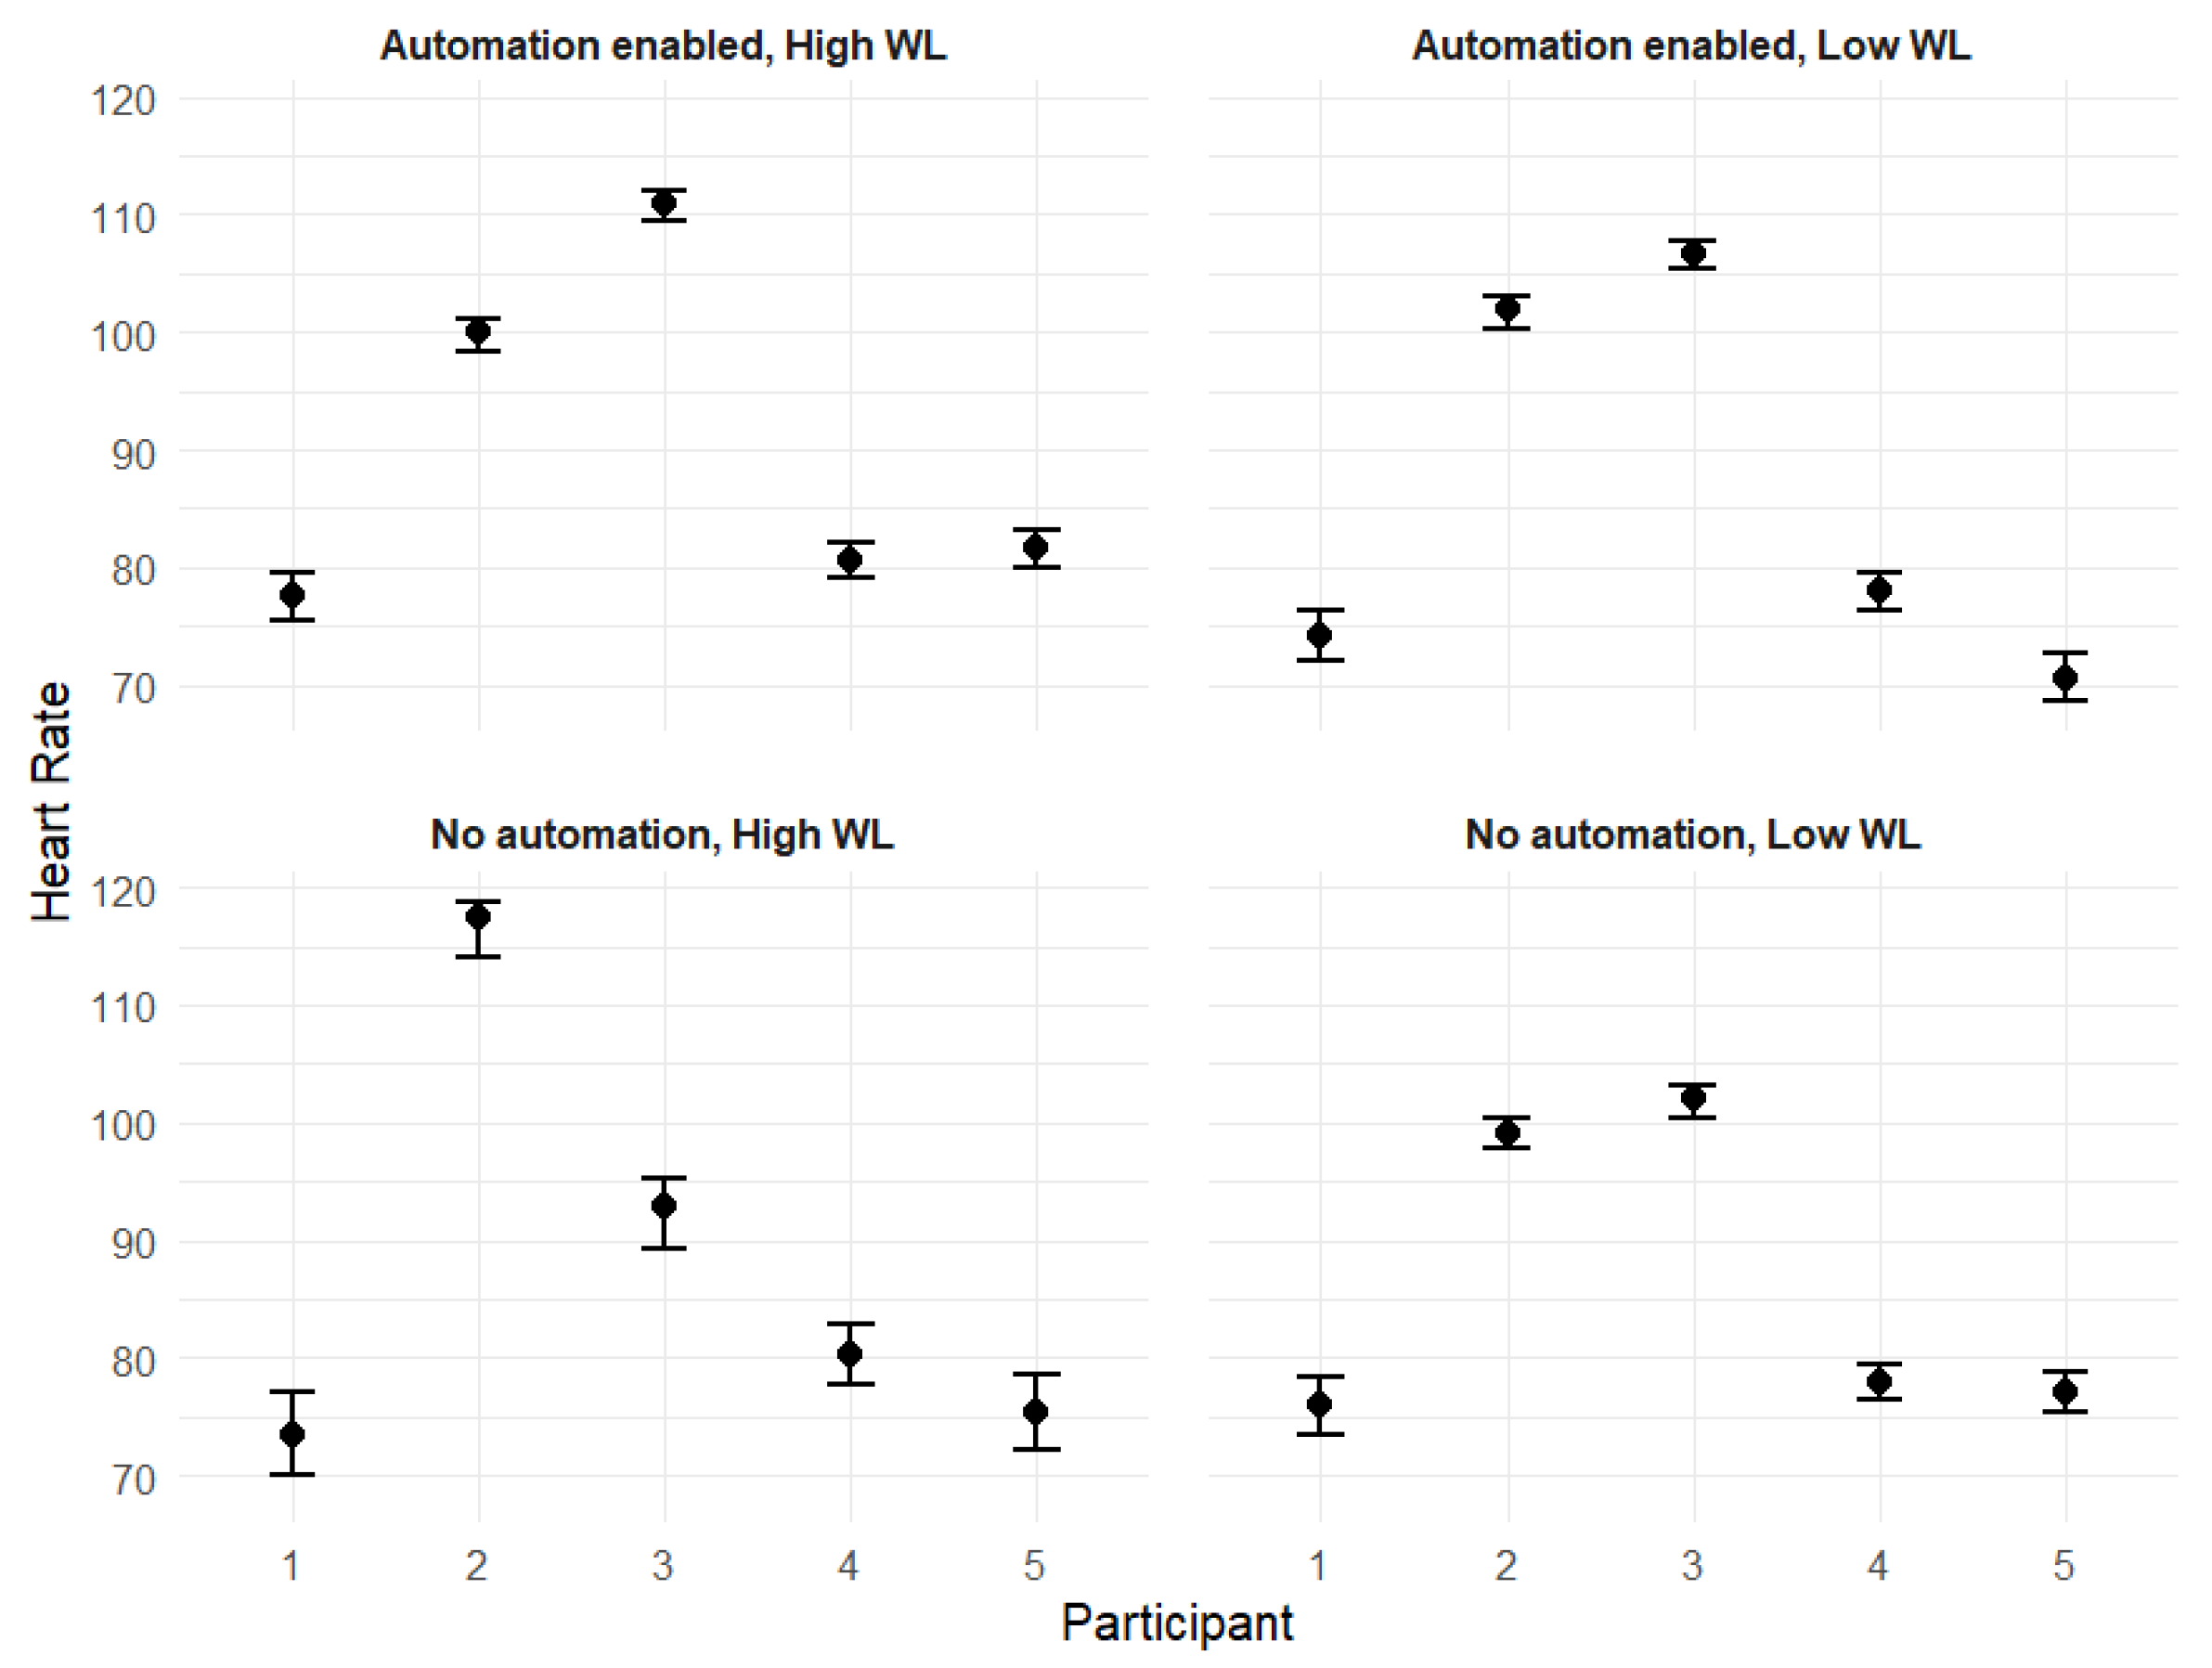
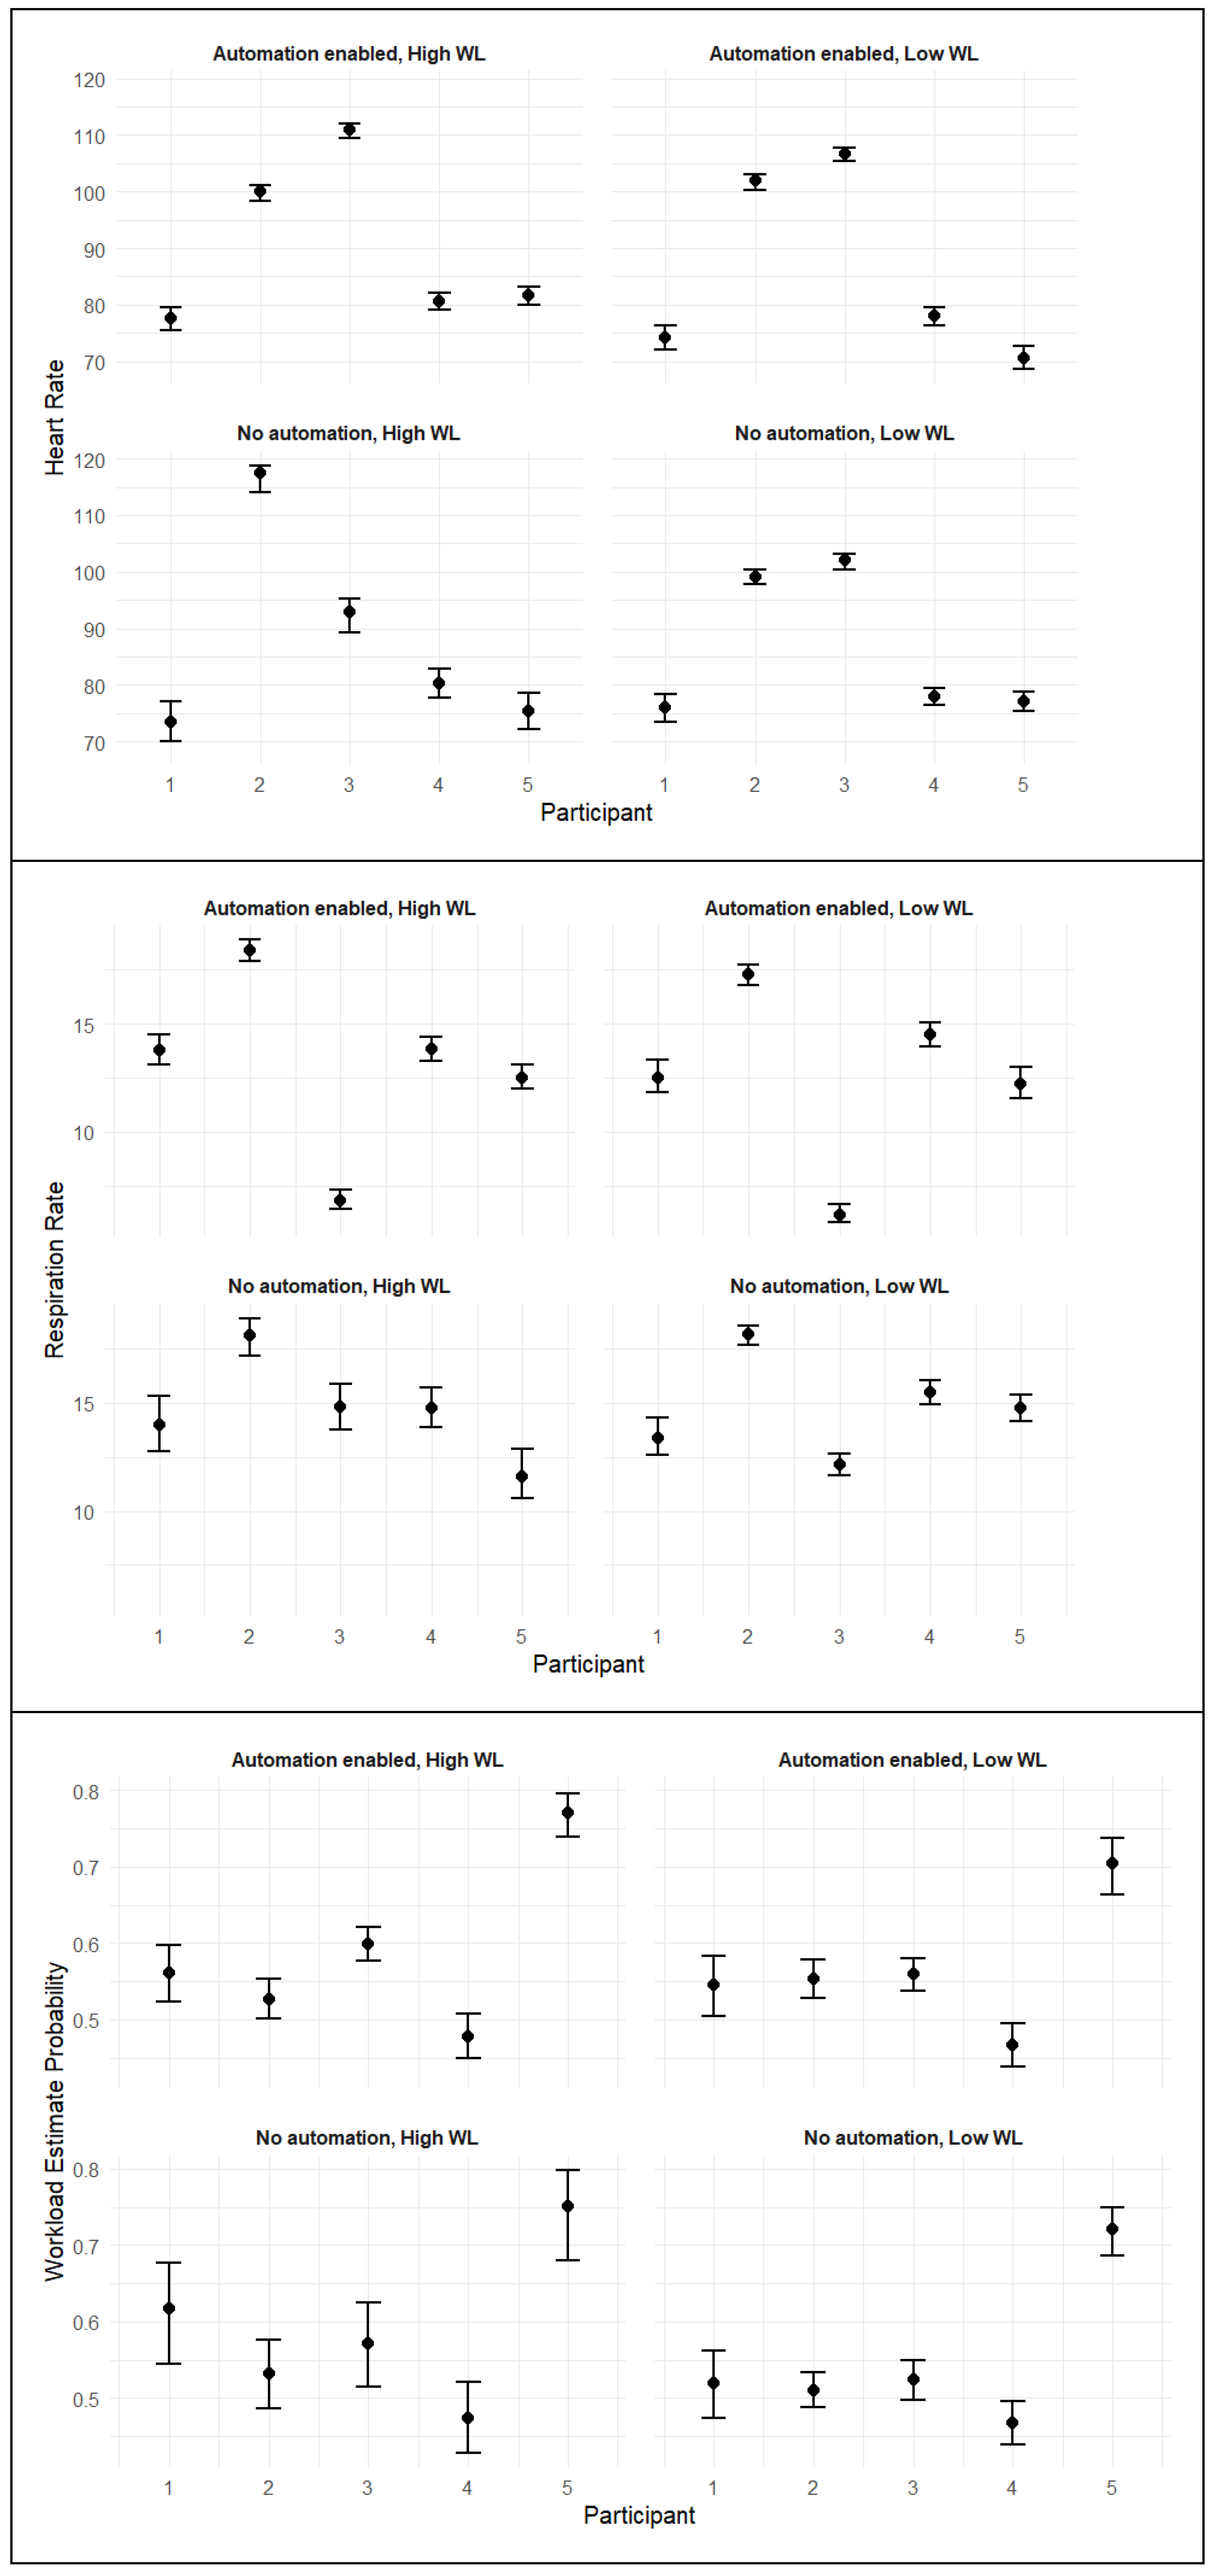
Figure 3.
Stacked Density Plots with Posterior Estimates for HR. (a) Participant 1, (b) Participant 2, (c) Participant 3, (d) Participant 4, (e) Participant 5.
Figure 3.
Stacked Density Plots with Posterior Estimates for HR. (a) Participant 1, (b) Participant 2, (c) Participant 3, (d) Participant 4, (e) Participant 5.
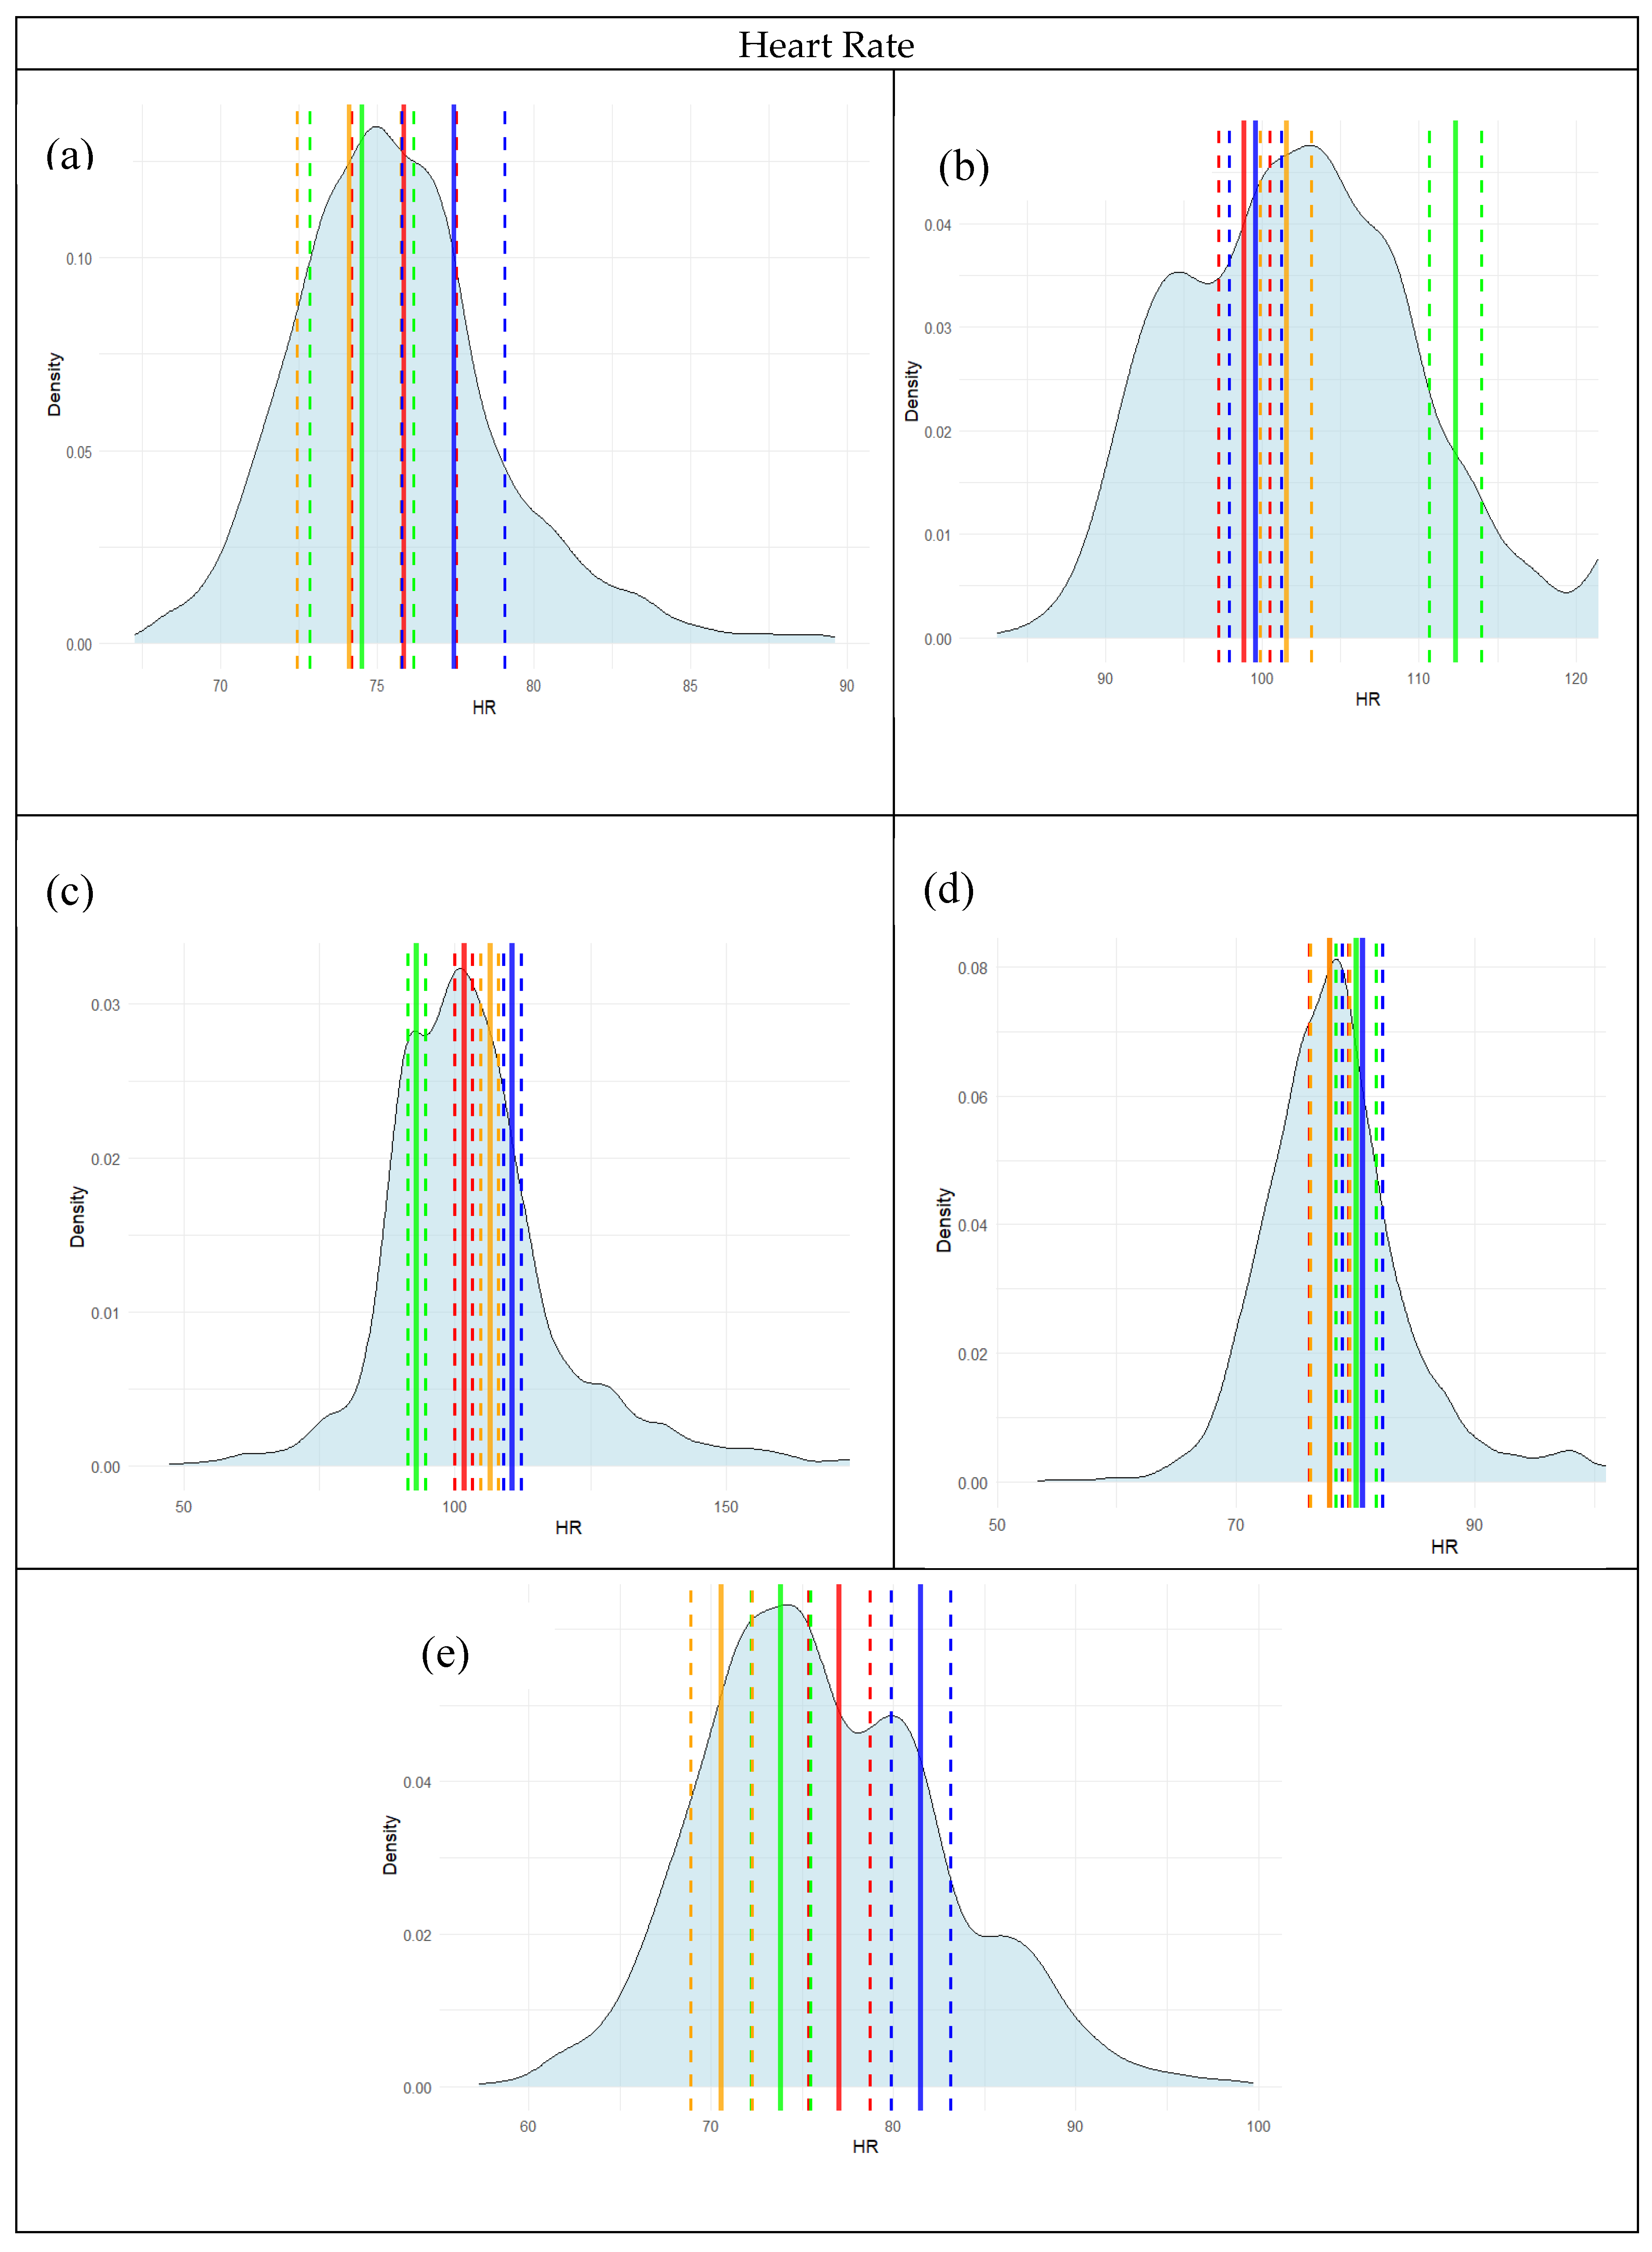
Figure 4.
Stacked Density Plots with Posterior Estimates for RR. (a) Participant 1, (b) Participant 2, (c) Participant 3, (d) Participant 4, (e) Participant 5.
Figure 4.
Stacked Density Plots with Posterior Estimates for RR. (a) Participant 1, (b) Participant 2, (c) Participant 3, (d) Participant 4, (e) Participant 5.
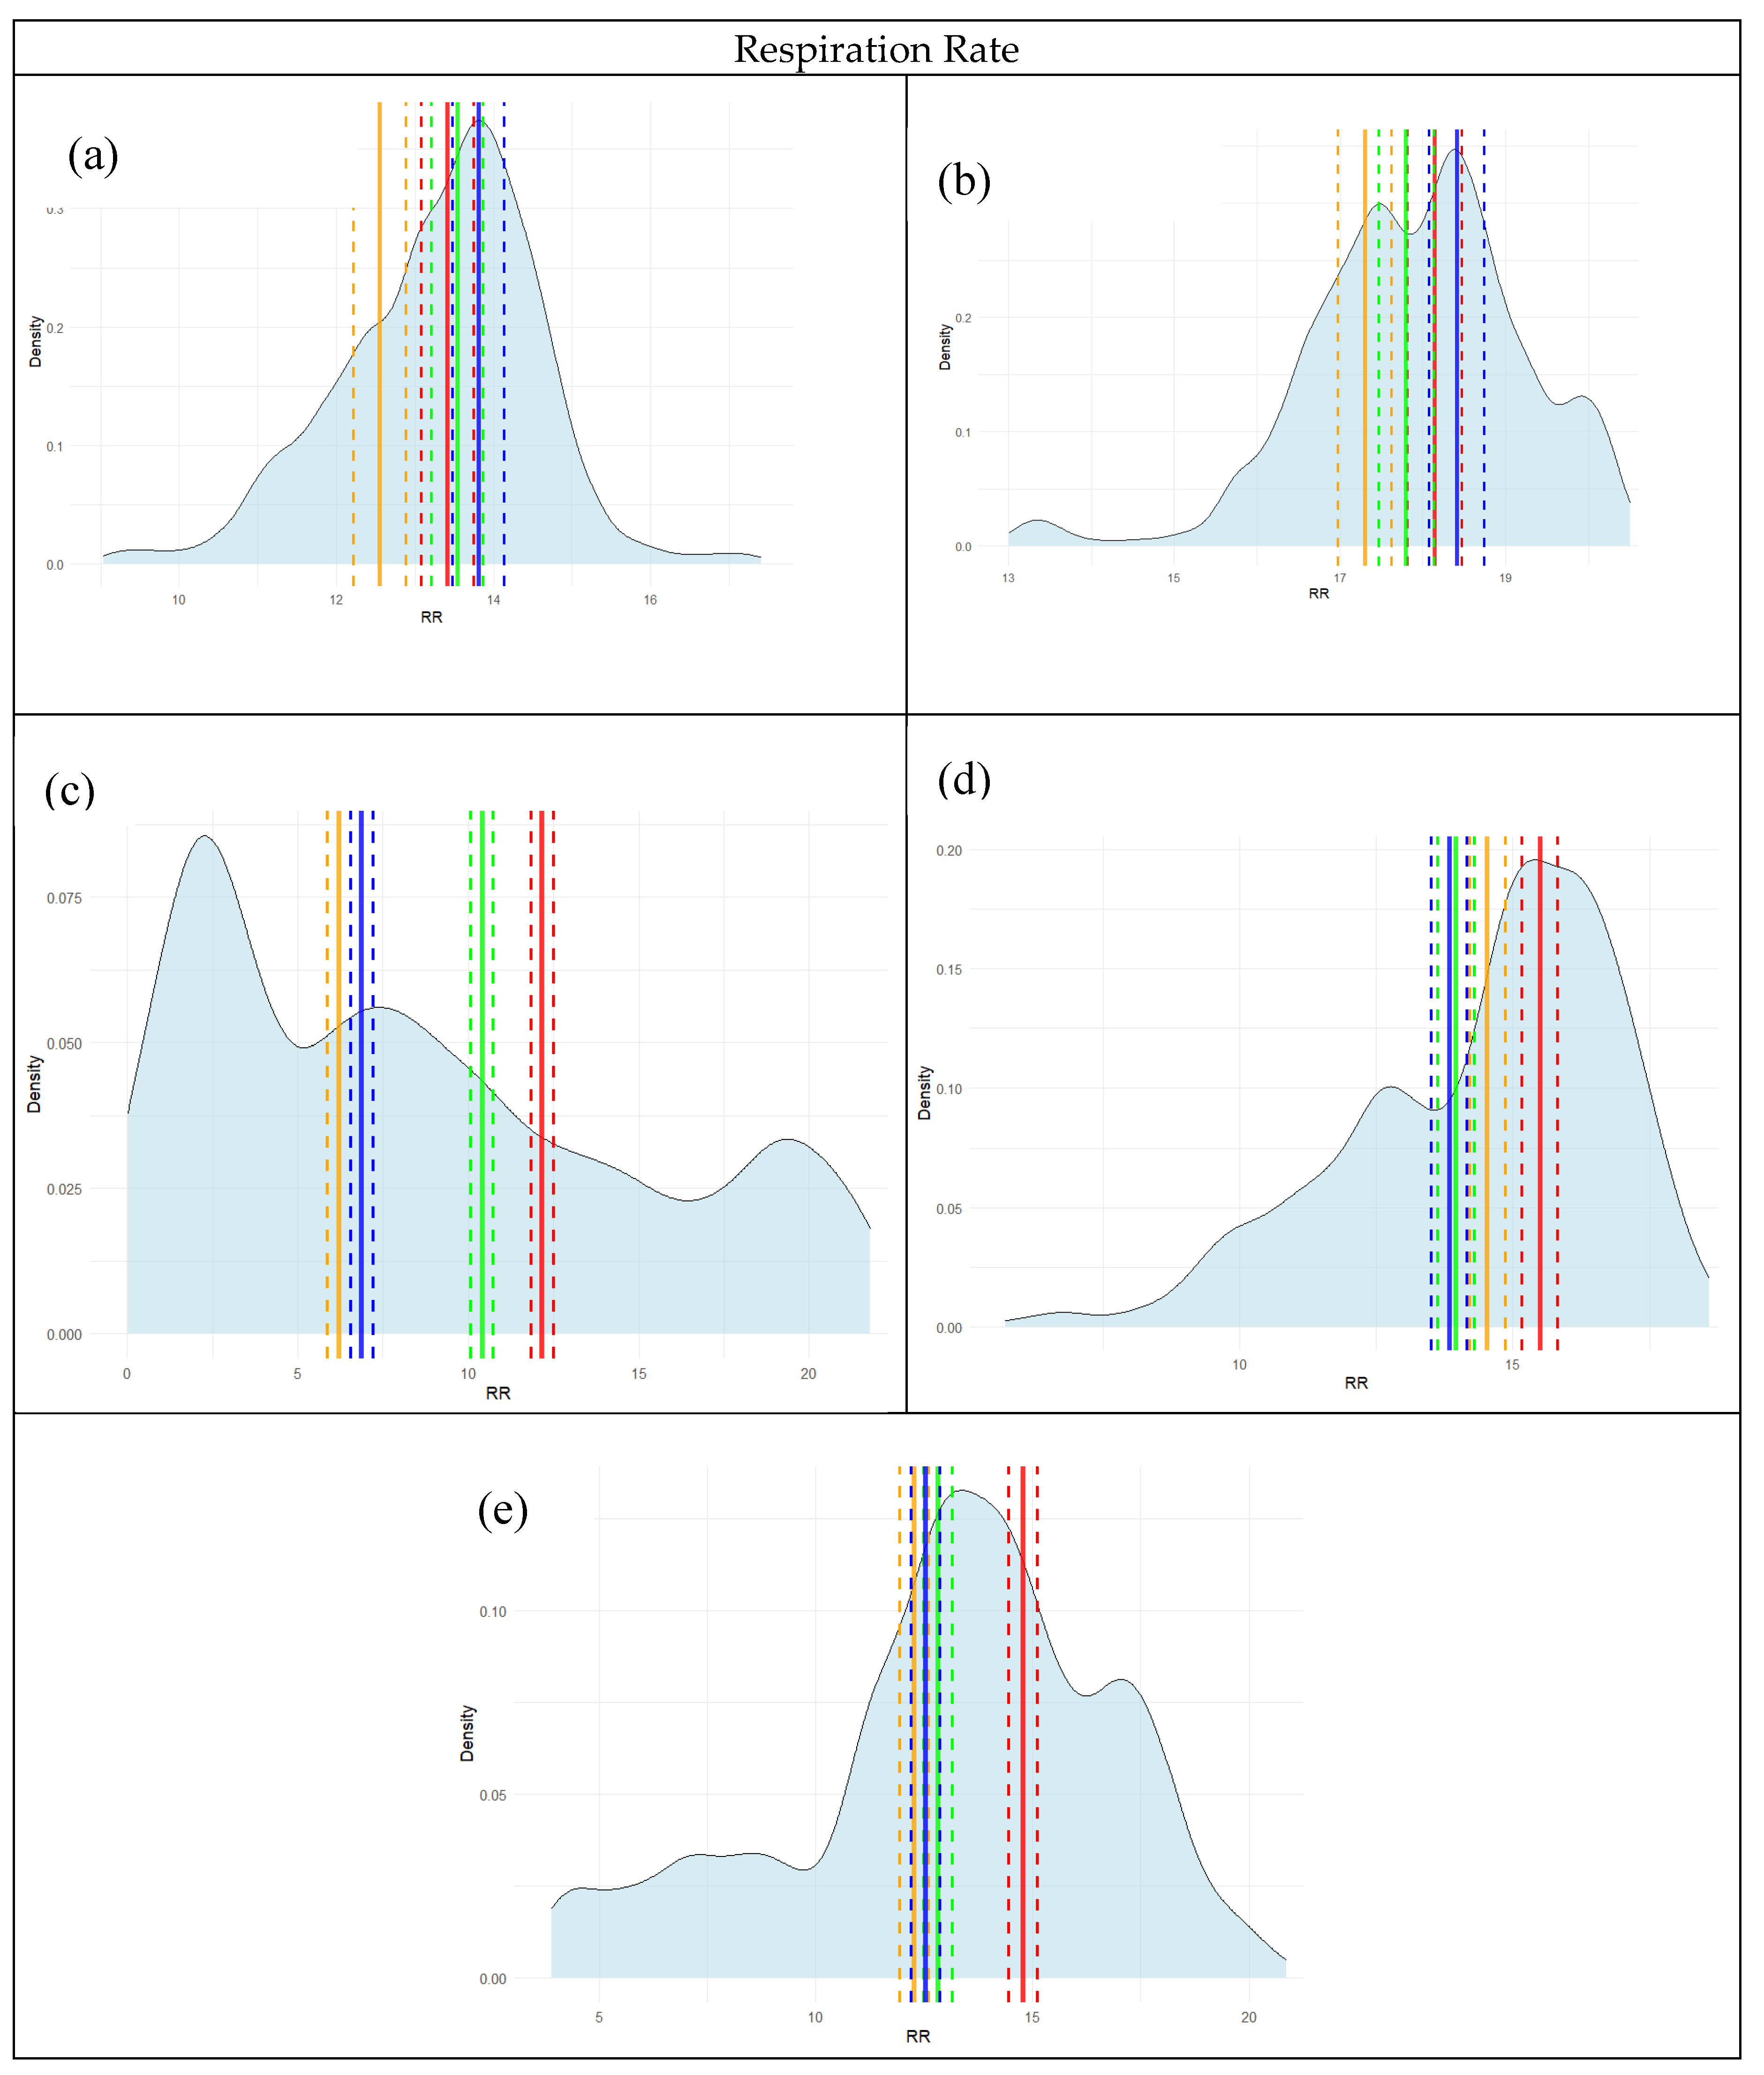
Figure 5.
Stacked Density Plots with Posterior Estimates for WL. (a) Participant 1, (b) Participant 2, (c) Participant 3, (d) Participant 4, (e) Participant 5.
Figure 5.
Stacked Density Plots with Posterior Estimates for WL. (a) Participant 1, (b) Participant 2, (c) Participant 3, (d) Participant 4, (e) Participant 5.
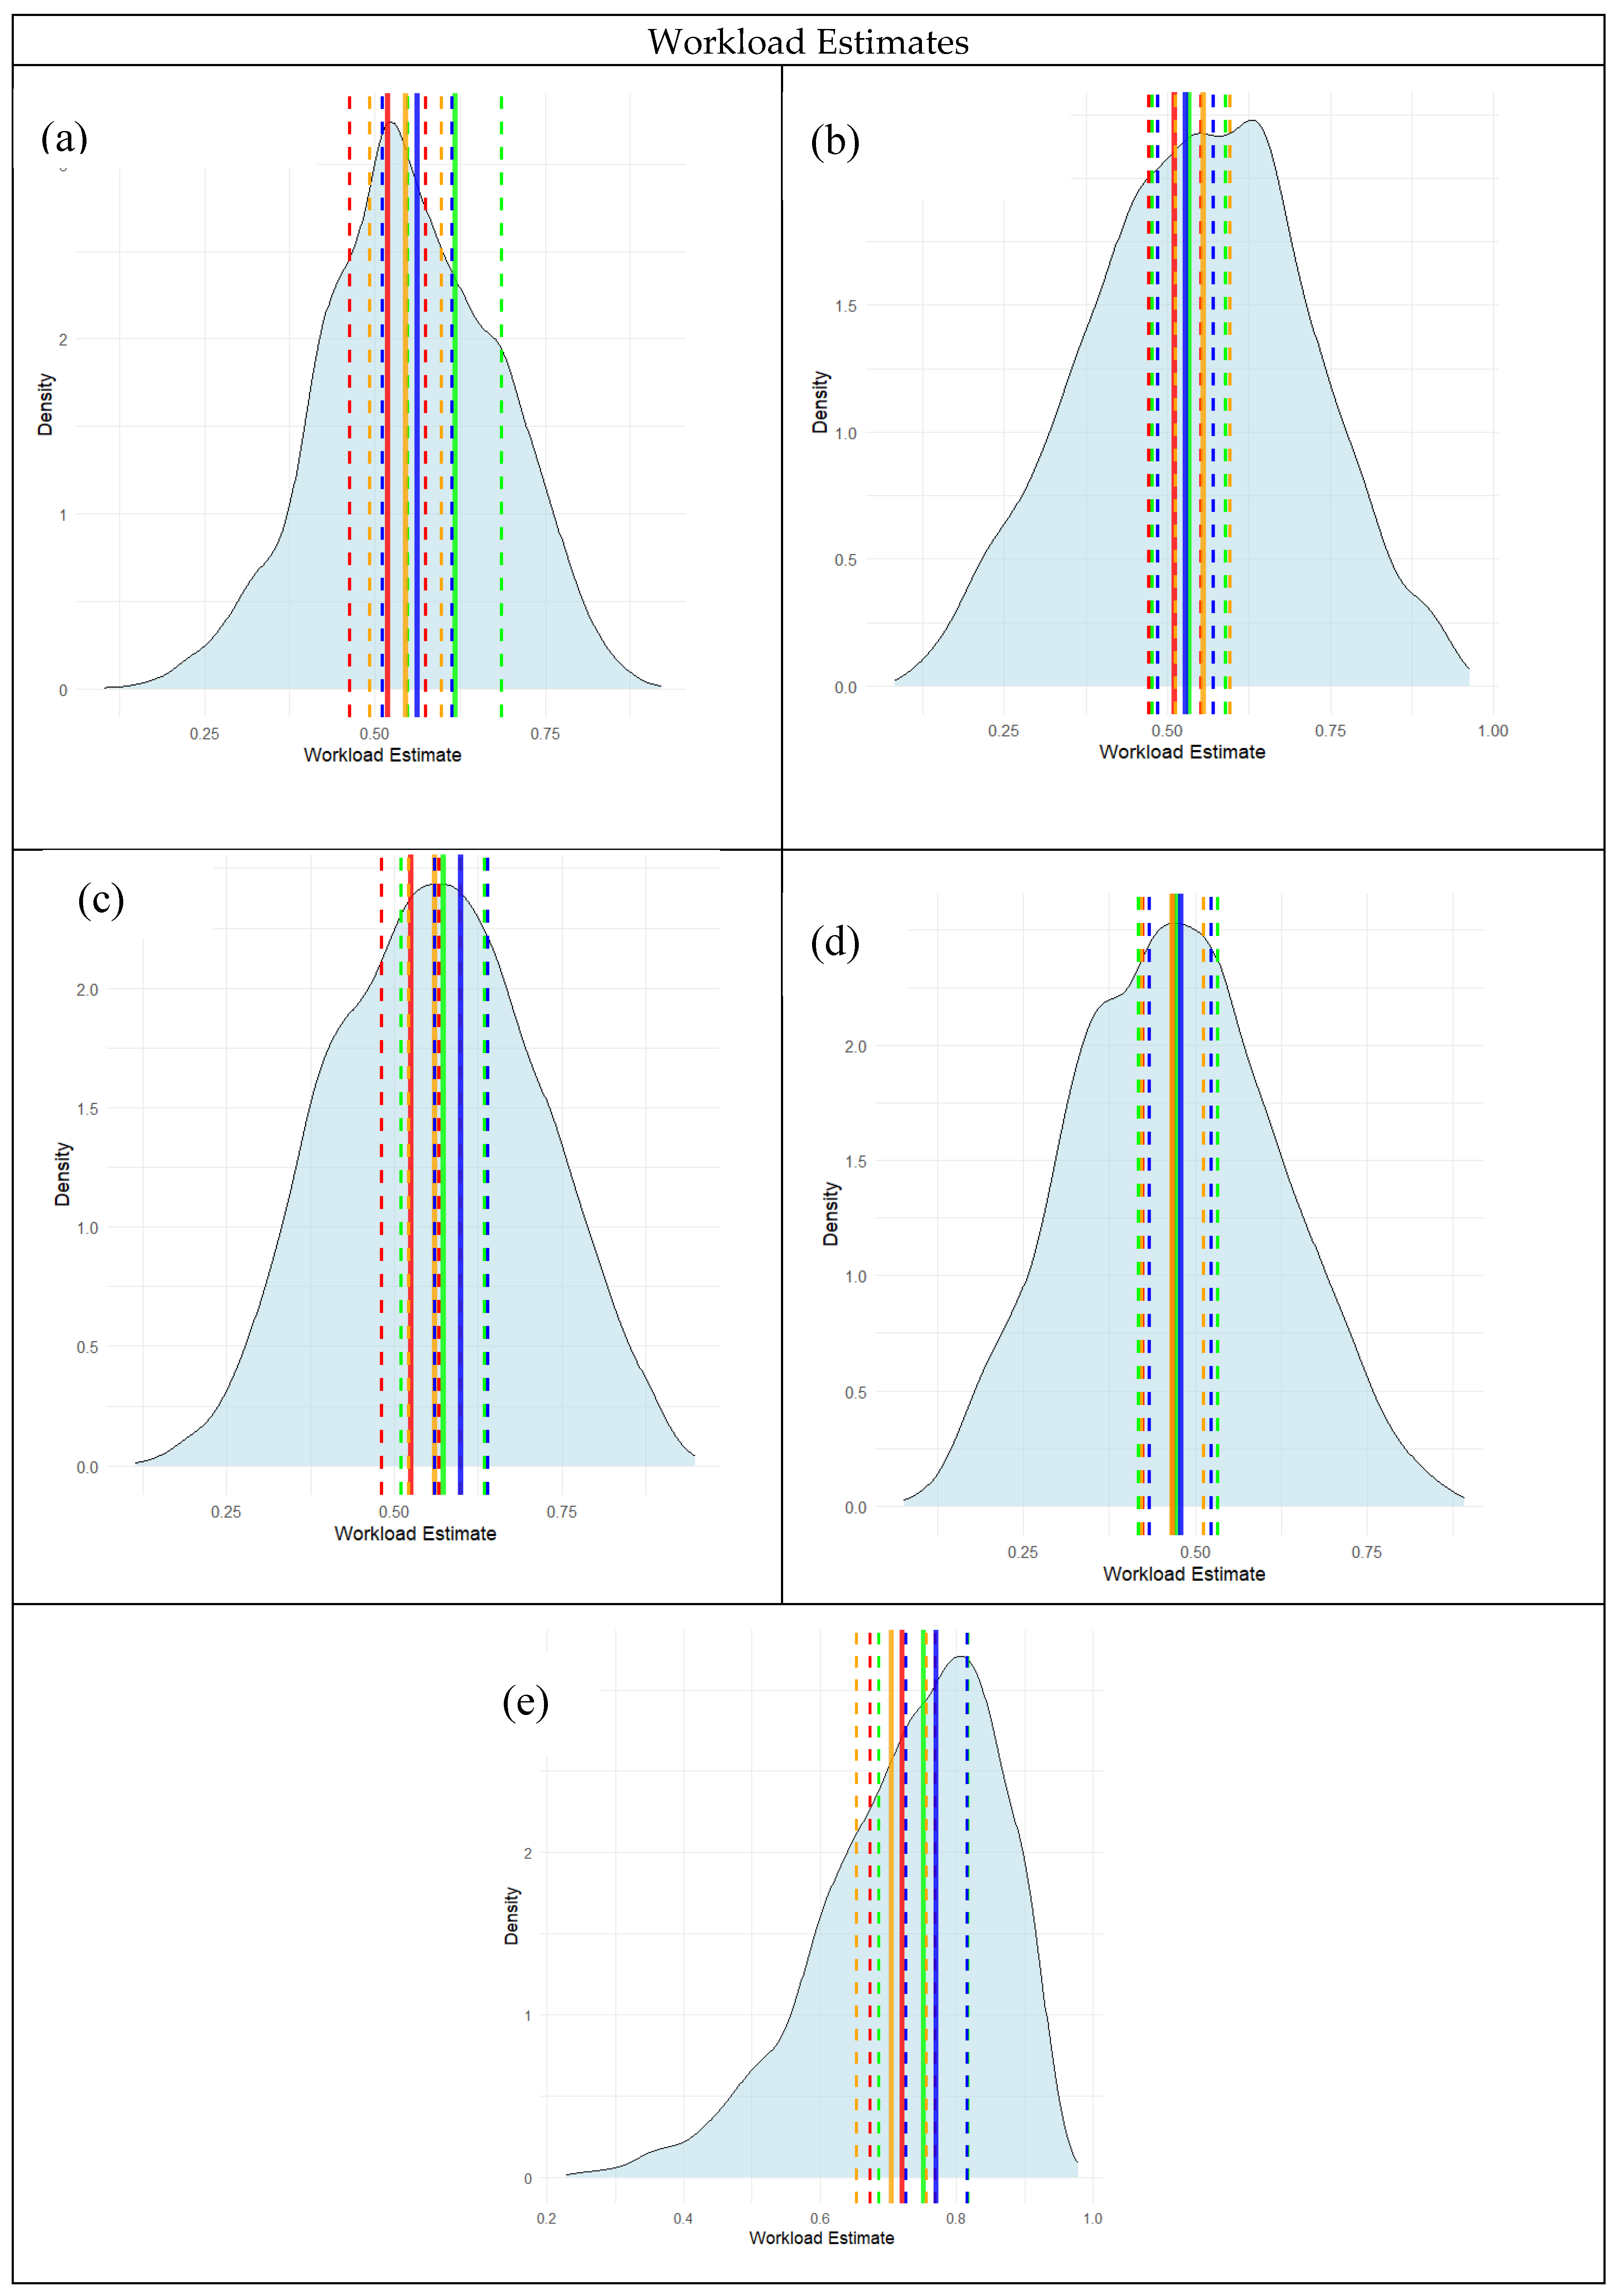
Table 1.
Bayesian Modeling Group Level Results.
| Automation Status | Workload | n | HR Posterior Mean | HR Posterior SD | RR Posterior Mean | RR Posterior SD |
WL Posterior Mean | WL Posterior SD |
|---|---|---|---|---|---|---|---|---|
| Off | Low | 4776 | 88.3 | 0.112 | 15.0 | 0.040 | 0.544 | 0.002 |
| Off | High | 4948 | 89.8 | 0.152 | 14.9 | 0.055 | 0.579 | 0.003 |
| On | Low | 4819 | 89.6 | 0.112 | 12.3 | 0.040 | 0.560 | 0.002 |
| On | High | 5027 | 92.1 | 0.109 | 12.8 | 0.039 | 0.588 | 0.002 |
Table 2.
Summary of Bayesian posterior means and standard deviations for HR, RR, and WL participant level results.
Table 2.
Summary of Bayesian posterior means and standard deviations for HR, RR, and WL participant level results.
| Participant | Automation Status | N-Back Level | n | HR Post Mean | HR Post SD | RR Post Mean | RR Post SD | WL Post Mean | WL Post SD |
|---|---|---|---|---|---|---|---|---|---|
| 1 | Off | Low | 623 | 76.0 | 3.10 | 13.4 | 1.89 | 0.519 | 0.057 |
| High | 714 | 73.6 | 3.81 | 14.0 | 1.36 | 0.617 | 0.041 | ||
| On | Low | 709 | 74.2 | 2.91 | 12.5 | 1.45 | 0.545 | 0.044 | |
| High | 756 | 77.5 | 2.81 | 13.8 | 1.49 | 0.561 | 0.045 | ||
| 2 | Off | Low | 1209 | 99.2 | 2.23 | 18.2 | 1.59 | 0.511 | 0.048 |
| High | 1433 | 118 | 3.11 | 18.1 | 2.32 | 0.532 | 0.070 | ||
| On | Low | 1124 | 102 | 2.31 | 17.3 | 1.89 | 0.554 | 0.057 | |
| High | 1072 | 99.6 | 2.36 | 18.4 | 2.11 | 0.527 | 0.064 | ||
| 3 | Off | Low | 1066 | 102 | 2.37 | 12.1 | 1.94 | 0.524 | 0.059 |
| High | 942 | 92.4 | 3.47 | 14.8 | 2.21 | 0.572 | 0.067 | ||
| On | Low | 1292 | 106 | 2.15 | 6.17 | 1.77 | 0.559 | 0.053 | |
| High | 1252 | 111 | 2.19 | 6.84 | 1.41 | 0.599 | 0.043 | ||
| 4 | Off | Low | 998 | 77.9 | 2.45 | 15.5 | 1.31 | 0.467 | 0.040 |
| High | 1007 | 80.3 | 3.18 | 14.8 | 1.52 | 0.474 | 0.046 | ||
| On | Low | 958 | 77.9 | 2.50 | 14.5 | 1.74 | 0.466 | 0.053 | |
| High | 967 | 80.6 | 2.49 | 13.8 | 1.72 | 0.478 | 0.052 | ||
| 5 | Off | Low | 881 | 77.1 | 2.61 | 14.8 | 1.44 | 0.720 | 0.044 |
| High | 852 | 75.5 | 3.62 | 11.6 | 1.33 | 0.751 | 0.040 | ||
| On | Low | 736 | 70.7 | 2.85 | 12.3 | 1.52 | 0.704 | 0.046 | |
| High | 980 | 81.6 | 2.47 | 12.5 | 1.51 | 0.770 | 0.046 |
Table 3.
Bayesian Model Diagnostics.
| Participant | MAPE | CCC | CPI | |
|---|---|---|---|---|
| HR | 1 | 8.24 | 0.766 | 0.660 |
| 2 | 8.15 | 0.897 | 0.853 | |
| 3 | 9.11 | 0.820 | 0.733 | |
| 4 | 9.25 | 0.904 | 0.806 | |
| 5 | 10.1 | 0.801 | 0.710 | |
| RR | 1 | 28.1 | 0.354 | 0.707 |
| 2 | 18.0 | 0.681 | 0.533 | |
| 3 | 10.9 | 0.181 | 0.853 | |
| 4 | 50.8 | 0.196 | 0.763 | |
| 5 | 28.4 | 0.651 | 0.363 | |
| WL | 1 | 37.4 | 0.648 | 0.807 |
| 2 | 24.5 | 0.610 | 0.323 | |
| 3 | 33.6 | 0.817 | 0.663 | |
| 4 | 37.7 | 0.853 | 0.567 | |
| 5 | 28.4 | 0.676 | 0.747 |
Disclaimer/Publisher’s Note: The statements, opinions and data contained in all publications are solely those of the individual author(s) and contributor(s) and not of MDPI and/or the editor(s). MDPI and/or the editor(s) disclaim responsibility for any injury to people or property resulting from any ideas, methods, instructions or products referred to in the content. |
© 2025 by the authors. Licensee MDPI, Basel, Switzerland. This article is an open access article distributed under the terms and conditions of the Creative Commons Attribution (CC BY) license (http://creativecommons.org/licenses/by/4.0/).
Copyright: This open access article is published under a Creative Commons CC BY 4.0 license, which permit the free download, distribution, and reuse, provided that the author and preprint are cited in any reuse.


