
Submitted:
21 April 2025
Posted:
22 April 2025
You are already at the latest version
Abstract
The article analyzes the effectiveness of selected electrodermal activity (EDA) signal features as indicators of cognitive load. The study involved 30 healthy participants performing tasks of varying cognitive load levels. Collected EDA data were statistically analyzed, comparing the effectiveness of twelve statistical signal measures in detecting stimulus-induced changes. Results indicated that amplitude-related measures—mean, median, maximum, and minimum—were most effective. It was also found that some signal features were highly correlated, suggesting the possibility of simplifying the analysis by choosing just one measure from each correlated pair. The results indicate that stronger emotional stimuli lead to more pronounced changes in electrodermal activity compared to stimuli with low emotional load. These findings may contribute to the standardization of EDA analysis in future research on cognitive load and emotional engagement.
Keywords:
electrodermal activity
; cognitive load
; signal processing
; signal analysis
; psychophysiology
1. Introduction
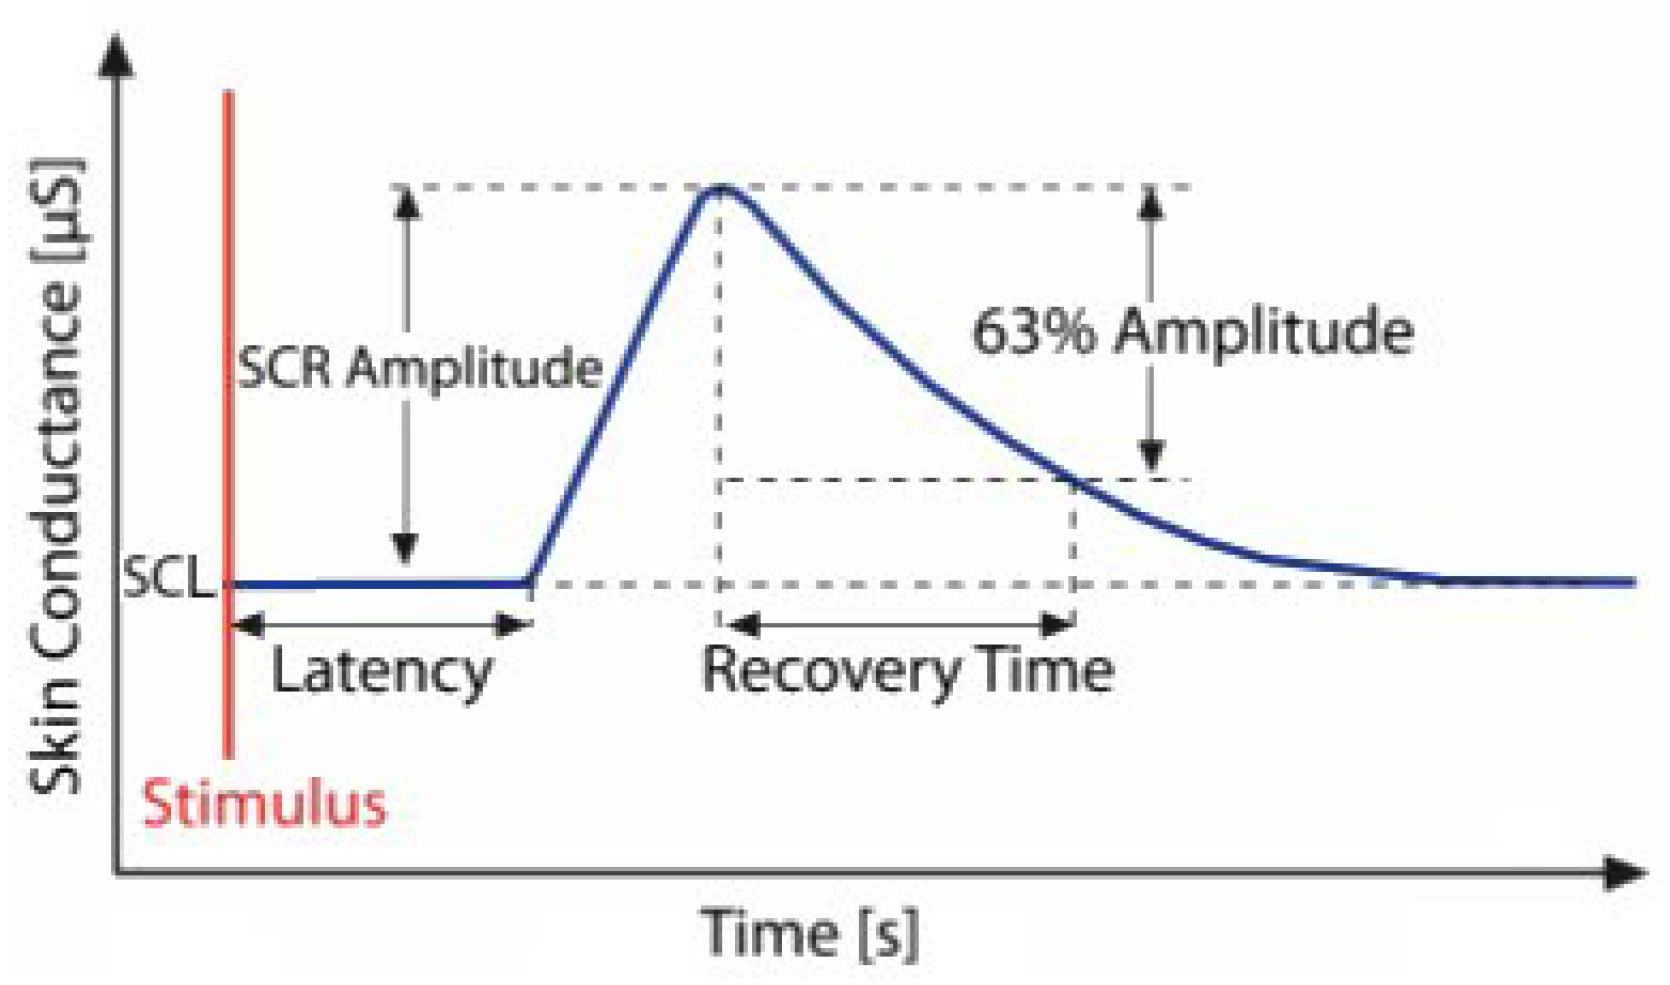
Electrodermal activity (EDA), also known as changes in the electrical properties of the skin, is associated with factors such as sweat gland activity. The term EDA was described in [1] as encompassing all electrical phenomena of the skin. The EDA signal consists of a tonic component representing slow-changing baseline skin conductance and a phasic component, which includes short-term electrodermal responses triggered by stimuli. The course of an electrodermal response is illustrated in Figure 1. EDA is widely used in psychophysiology due to the ease of eliciting reactions and the low cost of equipment [2].
Analyzing electrodermal activity (EDA) signals plays a significant role in studying cognitive load. EDA changes are linked to sympathetic nervous system activity, which increases in response to mental effort and cognitive demands [3]. Studies indicate that tasks with higher cognitive load lead to increased electrodermal activity [3]. An increase in electrodermal activity accompanies responses to stress, emotions, and cognitive load [4]. Studies [5] have shown that EDA levels rise under increased cognitive load, such as performing complex tasks. Cognitive load [6] is the level of effort involved in learning, thinking, and reasoning processes. It depends on individual cognitive abilities, the method of information presentation, and available attentional resources. EDA plays a significant role in objectively measuring cognitive load and is often used alongside participants’ subjective reports. It is worth noting that EDA appears to be more effective for measuring cognitive engagement than affective engagement [7].
Figure 1.
The figure illustrates the course of a single electrodermal activity event and its morphological features: baseline skin conductance level (SCL), skin conductance responses (SCR), amplitude, latency, and recovery time [8].
Figure 1.
The figure illustrates the course of a single electrodermal activity event and its morphological features: baseline skin conductance level (SCL), skin conductance responses (SCR), amplitude, latency, and recovery time [8].
The study [9] compared reported emotions with physiological responses to realistic stimuli. This research highlighted (among other findings) the absence of a standardized method for analyzing EDA signals, as different authors used various signal features (mean, variance, standard deviation, etc.) to determine the occurrence of a stimulus-response. The present study aims to address this gap by identifying which statistical measures of EDA most effectively differentiate responses to stimuli from resting states. In other words, the study seeks to determine which EDA signal characteristics best indicate stimulus-induced changes, potentially contributing to the standardization of EDA analysis in future cognitive load research.
To achieve this objective, an experiment was conducted measuring EDA during tasks of varying cognitive load levels. A set of signal features was then extracted, and their usefulness in detecting stimulus-driven EDA changes was analyzed. The methodology applied, results obtained, and their discussion in the context of existing literature are presented below.
2. Materials and Methods
The study was conducted on 30 healthy individuals (15 women, 15 men) aged between 20 and 43 years (mean = 23.63; SD = 5.6). Electrodermal activity was recorded using an exogenous (exosomatic) method with a constant galvanic current. Two nickel electrodes (Grove GSR Sensor V1.2), connected to an Arduino Mega device, were used to register signals at 20 Hz. Electrodes were placed on the inner sides of the index and middle fingers of the participant’s non-dominant hand (on the medial phalanges). This placement allowed for comfortable movement of the other hand during the task (a computer game). Before the experiment, participants washed and dried their hands to standardize skin conditions. Measurements were carried out in a room maintained at a constant temperature and under controlled environmental conditions, eliminating factors that could disrupt skin conductance (e.g., excessive sweating unrelated to stimuli). The signal was recorded using a Python 3.7 script that utilized NumPy and SciPy (for analysis and statistics) and the aseeg library (for signal filtering).
The procedure consisted of five consecutive stages, visually illustrated in Figure 2:
- Resting period 1: 1-minute relaxation during which nature sounds (forest, birdsong) were played to reduce participants’ arousal levels.
- Task 1: Controlled breathing exercise (1 minute). A pulsating green circle was displayed on-screen; participants performed deep inhalation when the circle expanded and exhalation when it contracted. The goal was maintaining calm, rhythmic breathing (low cognitive load task).
- Resting period 2: Another relaxation period (1 minute) featuring nature sounds again serves as a break before the next task.
- Task 2: Playing T-Rex Rush (approximately 5 minutes). Participants engaged in a simple computer game (T-Rex Rush, known from the Chrome browser), which involved controlling a running dinosaur to avoid obstacles (cacti, pterodactyls). Participants jumped using the space bar and ducked using the down arrow key. Each collision with an obstacle ended the game (a so-called “failure”), after which participants could restart, aiming for a better score. This task represented a condition of increased cognitive-emotional load, requiring concentration and evoking emotional engagement associated with avoiding failure.
- Resting period 3: Final calming phase (1 minute), following game completion.
The study participants received standardized instructions explaining the experimental procedure. They were advised to breathe naturally, relax during nature sounds, and remain engaged during gameplay while avoiding unnecessary movements (e.g., not supporting their faces with their hands). Participants knew they could withdraw from the study at any time (participation was voluntary).
The research team selected a set of 12 statistical measures of the EDA signal potentially valuable for detecting responses to stimuli, guided mainly by publication [10], which provides a comprehensive review of statistical measures used for detecting the P300 potential in electroencephalography. Measures suitable for EDA signals were chosen from this review. The final analyzed signal features (abbreviations in parentheses) included mean (mean), standard deviation (std), variance (var), latency (lat), the highest signal value in a given time window (max), the lowest signal value in a given time window (min), latency-to-amplitude ratio (lat/max), number of zero-crossings (zero, number of sign changes after subtracting the mean), amplitude, the positive area under the curve (area+), the negative area above baseline (area-), peak-to-peak value (p-t-p) and median (med).
The EDA signals underwent preprocessing (high pass filtering with a cutoff frequency of 0.05 Hz) and were divided into time segments. For further analysis, segments recorded during the T-Rex Rush game were selected, as this phase was expected to generate the most electrodermal reactions in response to stimuli. Two segments were identified (shown in Figure 3): a baseline fragment representing the resting state (4 seconds before stimulus onset until the stimulus) and a post-stimulus segment from 1 to 5 seconds after the stimulus, encompassing the expected EDA response. The choice of a 1 to 5-second window after the stimulus was deliberate, aligning with anticipated response timing. To avoid overlapping reactions, stimuli occurring within 10 seconds of another EDA-evoking stimulus were excluded. This prevented cumulative effects and ensured accurate baseline determination. Overall, several dozen signal segments (stimuli) from all participants were analyzed and categorized into two types generated during gameplay: participant button presses (jump or duck keys) and gameplay “failures” (collisions with obstacles resulting in the game’s termination).
The analysis was conducted on signal fragments recorded during the experiment. First, for each segment, the value of each statistical feature was calculated separately for the baseline period and the post-stimulus interval. The difference between the post-stimulus and baseline values was computed for each feature. To enable comparisons among features with different scales and units, all differences were normalized to the [0,1] range. Normalized differences were calculated separately for each participant and feature. The resulting normalized and averaged scores represent how each statistical measure differentiates the signal, reflecting the magnitude of stimulus-induced EDA changes.
In addition to difference analysis, a separate correlation analysis was conducted to investigate relationships among signal features. Spearman’s correlation coefficient was used to evaluate correlations due to its robustness against deviations from normality. The resulting correlation matrix helped identify which features provide redundant information (highly correlated) and which measure independent signal properties. The strength of correlations was interpreted using Guilford’s guidelines [11]: negligible (|r| ⩽ 0.2), low (0.2 < |r| ⩽ 0.4), moderate (0.4 < |r| ⩽ 0.6), high (0.6 < |r| ⩽ 0.8), very high (0.8 < |r| ⩽ 0.9), and nearly perfect (|r| > 0.9).
3. Results
The analysis revealed significant correlations between specific pairs of EDA features, as presented in Table 1. A nearly perfect correlation (r > 0.90) was observed for the following feature pairs: peak-to-peak value and standard deviation (r = 0.98), as well as mean and median (r > 0.90). These pairs measure similar signal properties and can be used interchangeably without losing information. In contrast, the feature representing the latency-to-amplitude ratio (lat/max) showed negligible correlation with all other features. This lack of correlation suggests that this measure may capture distinct aspects of the EDA signal or might have limited usefulness as an indicator of stimulus-induced responses. The remaining feature pairs demonstrated moderate or weak correlations; for example, the mean showed a moderate positive correlation with the maximum value. Additionally, complementary features such as positive and negative areas above or below the baseline exhibited expected moderate correlations, reflecting their interdependent nature.
The averaged percentage results illustrating changes in EDA features between the baseline state and responses to stimuli are presented separately for two stimulus types: game “failures” (moments of collision) and button presses. For failures (“game overs”), the most significant observed change occurred for maximum amplitude, which increased by approximately 61.8% compared to baseline (Figure 4). Significant differences (ranging from 50% to 57%) were also noted for mean, median, and standard deviation measures. These results indicate that in response to a strong emotional stimulus (sudden failure during a task), amplitude-related signal parameters (extreme values, mean) increase more prominently than temporal or shape-related parameters. In contrast, for button presses (jump or crouch actions), the average percentage changes in EDA signal features were generally lower than those observed for failures (Figure 5). The highest increases were noted for mean, median, maximum, and minimum amplitude, with values rising between 39% and 42%. Importantly, these changes were noticeably more minor than those observed during “failures.” Features such as variance, standard deviation, latency-to-amplitude ratio, and peak-to-peak value exhibited intermediate changes (approximately 20%–33%). The most minor increases were observed in latency and shape-related parameters, such as positive and negative areas and zero-crossings (7%–12%).
Summarizing the results: for both intensely emotional stimuli (“failures”) and simple actions (button presses), four features best differentiated the signal: mean, median, maximum, and minimum values—their post-stimulus values deviated significantly from the baseline (showing the highest differences). In contrast, the weakest indicators were latency, the number of zero-crossings, and the positive and negative areas, which produced the most minor changes in both conditions (nearly zero for low-emotion stimuli and approximately 30% for stronger ones). The remaining features (variance, standard deviation, latency-to-amplitude ratio, and peak-to-peak value) showed moderate differentiation, with an interesting pattern of greater effectiveness for more potent stimuli (e.g., the difference in the latency/amplitude ratio reached 56% for “failures” but only 20% for button presses).
4. Discussion
The results indicate which statistical EDA features are most and least helpful in detecting changes associated with cognitive load or emotional response. Mean, median, maximum, and minimum values proved to be the most sensitive to stimulus onset; these features consistently exhibited the highest differences between the baseline state and the response, regardless of stimulus type. They can be recommended as the primary indicators for detecting EDA changes. Moreover, the high redundancy between mean and median (r = 0.97) suggests that, in practice, including only one of them is sufficient. Similarly, the robust correlation between peak-to-peak value and standard deviation (r = 0.98) indicates that these two measures provide nearly overlapping information. Variance and standard deviation are also closely related (as expected mathematically), so in practice, one of them may represent both. Thus, EDA analyses can be streamlined by selecting only one feature from each highly correlated pair, simplifying modelling without significant loss of information.
The roles of latency and the response area are also noteworthy. The low effectiveness of latency (the delay in the response) as an indicator of change suggests that the time of EDA onset did not differ significantly between pre- and post-stimulus states in this task. In other words, regardless of stimulus intensity, responses occurred roughly simultaneously; hence, latency does not reflect the magnitude of arousal but rather a physiological property of the reflex. Similarly, the number of zero-crossings and the positive/negative areas of the signal were insensitive measures, probably because they capture subtler aspects of signal shape, which in our conditions proved less significant than amplitude changes. In other experimental configurations (e.g., with more extended responses or different types of EDA signals), their utility might be more important; however, in the context of brief skin reactions to simple stimuli, they were not very informative.
The comparison of the two stimulus types provides additional insights. More potent emotional stimuli associated with game failures (“failures”) produced a more pronounced EDA increase than routine actions (button presses). This is evidenced by the highest recorded difference of 61.8% (maximum) for failures compared to 41.6% (mean) for button presses. This finding can mean that a negative emotional stimulus (an unexpected failure) engages cognitive processes (attention shifting, potential frustration) and emotional processes, eliciting a stronger physiological response. In contrast, a button press—though indicative of a decision and some cognitive load (motor planning)—does not carry a high emotional burden, resulting in a weaker skin response. This outcome is consistent with the literature: EDA responses tend to be more significant when a task is accompanied by higher emotional or stress-related arousal. It is also worth noting that certain features, such as the latency-to-amplitude ratio or variance, differentiated the signal more effectively under emotional stimulus conditions (failures) than under neutral ones. For example, the latency/amplitude ratio change reached 56% for failures, compared to only 20% for button presses. This suggests that some EDA measures may be susceptible to the emotional component of a stimulus, with their diagnostic value manifesting primarily in the study of responses to stress or emotional stimuli.
Identifying four key features (mean, median, max, and min) as the best indicators of EDA response may facilitate planning future cognitive load studies. Researchers can focus on these measures in EDA analysis, increasing the likelihood of detecting subtle changes. In contrast, features that showed weak differentiation (latency, zero-crossings, and areas) may be omitted or treated as secondary, reducing complexity when analyzing many variables. The results of our analysis could be applied to the refinement of experimental protocols. For example, in designing studies, EDA might be used in place of questionnaires with the understanding of which signal parameters best indicate observer discomfort. In future research, employing stimuli with a more substantial emotional load (e.g., realistic, unsettling character animations) may be worthwhile to evoke more pronounced EDA responses. Our findings suggest that more potent stimuli yield more precise signals, facilitating their analysis. Additionally, by following the model of the present experiment, participants can be motivated to engage more fully (e.g., through incorporating an element of competition or symbolic rewards in the game), thereby increasing the likelihood of an emotional response and producing more discernible EDA data.
It is also important to consider external conditions affecting EDA measurement. As noted in the literature, ambient and body temperature influence the reactivity of sweat glands. Therefore, studies utilizing EDA should not be conducted in icy conditions, as skin cooling reduces response amplitude and may mask differences. Future experiments should maintain constant, comfortable environmental conditions and control factors that may affect the signal (humidity, participants’ hydration status, etc.).
5. Conclusions
The study aimed to determine which statistical measures of the EDA signal most effectively differentiate the signal, i.e., reveal the difference between the resting state and the response to a stimulus. This aim was achieved. The experiment involved tasks with varied cognitive loads and provided EDA data to analyze twelve selected signal features. It was demonstrated that four of these features—mean, median, maximum, and minimum values—effectively differentiate the signal regardless of the type of stimulus. The highest levels of post-stimulus EDA changes were observed for all these measures. In contrast, four other features—latency, the number of zero-crossings, positive area, and unfavourable area—differentiated the signal the least, as observed for both highly emotional and neutral stimuli. Additionally, it was found that there are nearly perfect correlations between pairs of features, such as mean–median and peak-to-peak value–standard deviation (correlation coefficient approximately 0.97). This indicates redundancy; one measure from each highly correlated pair can be used instead of both, simplifying the analysis without losing significant information.
The presented results may be applied in further research on cognitive load. They enable the informed selection of EDA indicators appropriate to the experimental objectives. For example, suppose maximum sensitivity to the stimulus effect is of interest. In that case, amplitude measures (max, min) and statistical measures (mean, median) should be considered. Conversely, if the study concerns specific aspects (e.g., the dynamics of the response), less sensitive temporal parameters might also be considered. However, their limited effectiveness must be noted. These findings are beneficial when designing experiments using EDA as an objective indicator of discomfort or cognitive engagement.
In conclusion, electrodermal activity is a valuable source of information on cognitive load and emotions. Based on the recommendations developed in this study, the appropriate selection and processing of EDA signal features increases the likelihood of reliably and sensitively detecting cognitive load based on physiological responses.
Author Contributions
Conceptualization, M.J.; methodology, M.J., J.M.; software, M.J.; validation, M.J.; formal analysis, J.M.; investigation, J.M.; resources, M.J.; data curation, X.X.; writing—original draft preparation, M.J.; writing—review and editing, M.J.; visualization, J.M.; supervision, M.J.; project administration, M.J.; funding acquisition, none declared. All authors have read and agreed to the published version of the manuscript.
Funding
This research received no external funding.
Institutional Review Board Statement
The study was conducted in accordance with the Declaration of Helsinki, and approved by the Research Ethics Committee in Institute of Psychology, Adam Mickiewicz University.
Informed Consent Statement
Informed consent was obtained from all subjects involved in the study.
Conflicts of Interest
The authors declare no conflicts of interest.
References
- Johnson, L.C.; Lubin, A. Spontaneous electrodermal activity during waking and sleeping. Psychophysiology 1966, 3, 8–17. [CrossRef]
- Dawson, M.E.; Schell, A.M.; Filion, D.L.; et al. The electrodermal system. Handbook of psychophysiology 2007, 2, 200–223.
- Boffet, A.; Arsac, L.M.; Ibanez, V.; Sauvet, F.; Deschodt-Arsac, V. Detection of Cognitive Load Modulation by EDA and HRV. Sensors 2025, 25. [CrossRef]
- Melis, C.; van Boxtel, A. Differences in autonomic physiological responses between good and poor inductive reasoners. Biological psychology 2001, 58, 121–146. [CrossRef]
- Buchwald, M.; Kupiński, S.; Bykowski, A.; Marcinkowska, J.; Ratajczyk, D.; Jukiewicz, M. Electrodermal activity as a measure of cognitive load: A methodological approach. In Proceedings of the 2019 Signal Processing: Algorithms, Architectures, Arrangements, and Applications (SPA). IEEE, 2019, pp. 175–179.
- Kalyuga, S. Cognitive load theory: How many types of load does it really need? Educational psychology review 2011, 23, 1–19. [CrossRef]
- Nandipati, K.K.; Pal, S.; Mitra, R. Electrodermal Activity (EDA) Morphologies and Prediction of Engagement with Simple Moving Average Crossover: A Mixed-Method Study. Sensors 2024, 24. [CrossRef]
- Guerreiro, J.; Lourenco, A.; Fred, A. A biosignal embedded system for physiological computing. Diss. Instituto Superior de Engenharia de Lisboa 2013.
- Ratajczyk, D.; Jukiewicz, M.; Lupkowski, P. Evaluation of the uncanny valley hypothesis based on declared emotional response and psychophysiological reaction. Bio-Algorithms and Med-Systems 2019, 15, 20190008. [CrossRef]
- Abootalebi, V.; Moradi, M.H.; Khalilzadeh, M.A. A new approach for EEG feature extraction in P300-based lie detection. Computer methods and programs in biomedicine 2009, 94, 48–57. [CrossRef]
- Durrheim, K.; Tredoux, C. Numbers, hypotheses & conclusions: A course in statistics for the social sciences; Juta and Company Ltd, 2004.
Figure 2.
Diagram illustrating the occurrence of individual stages of the experiment over time.
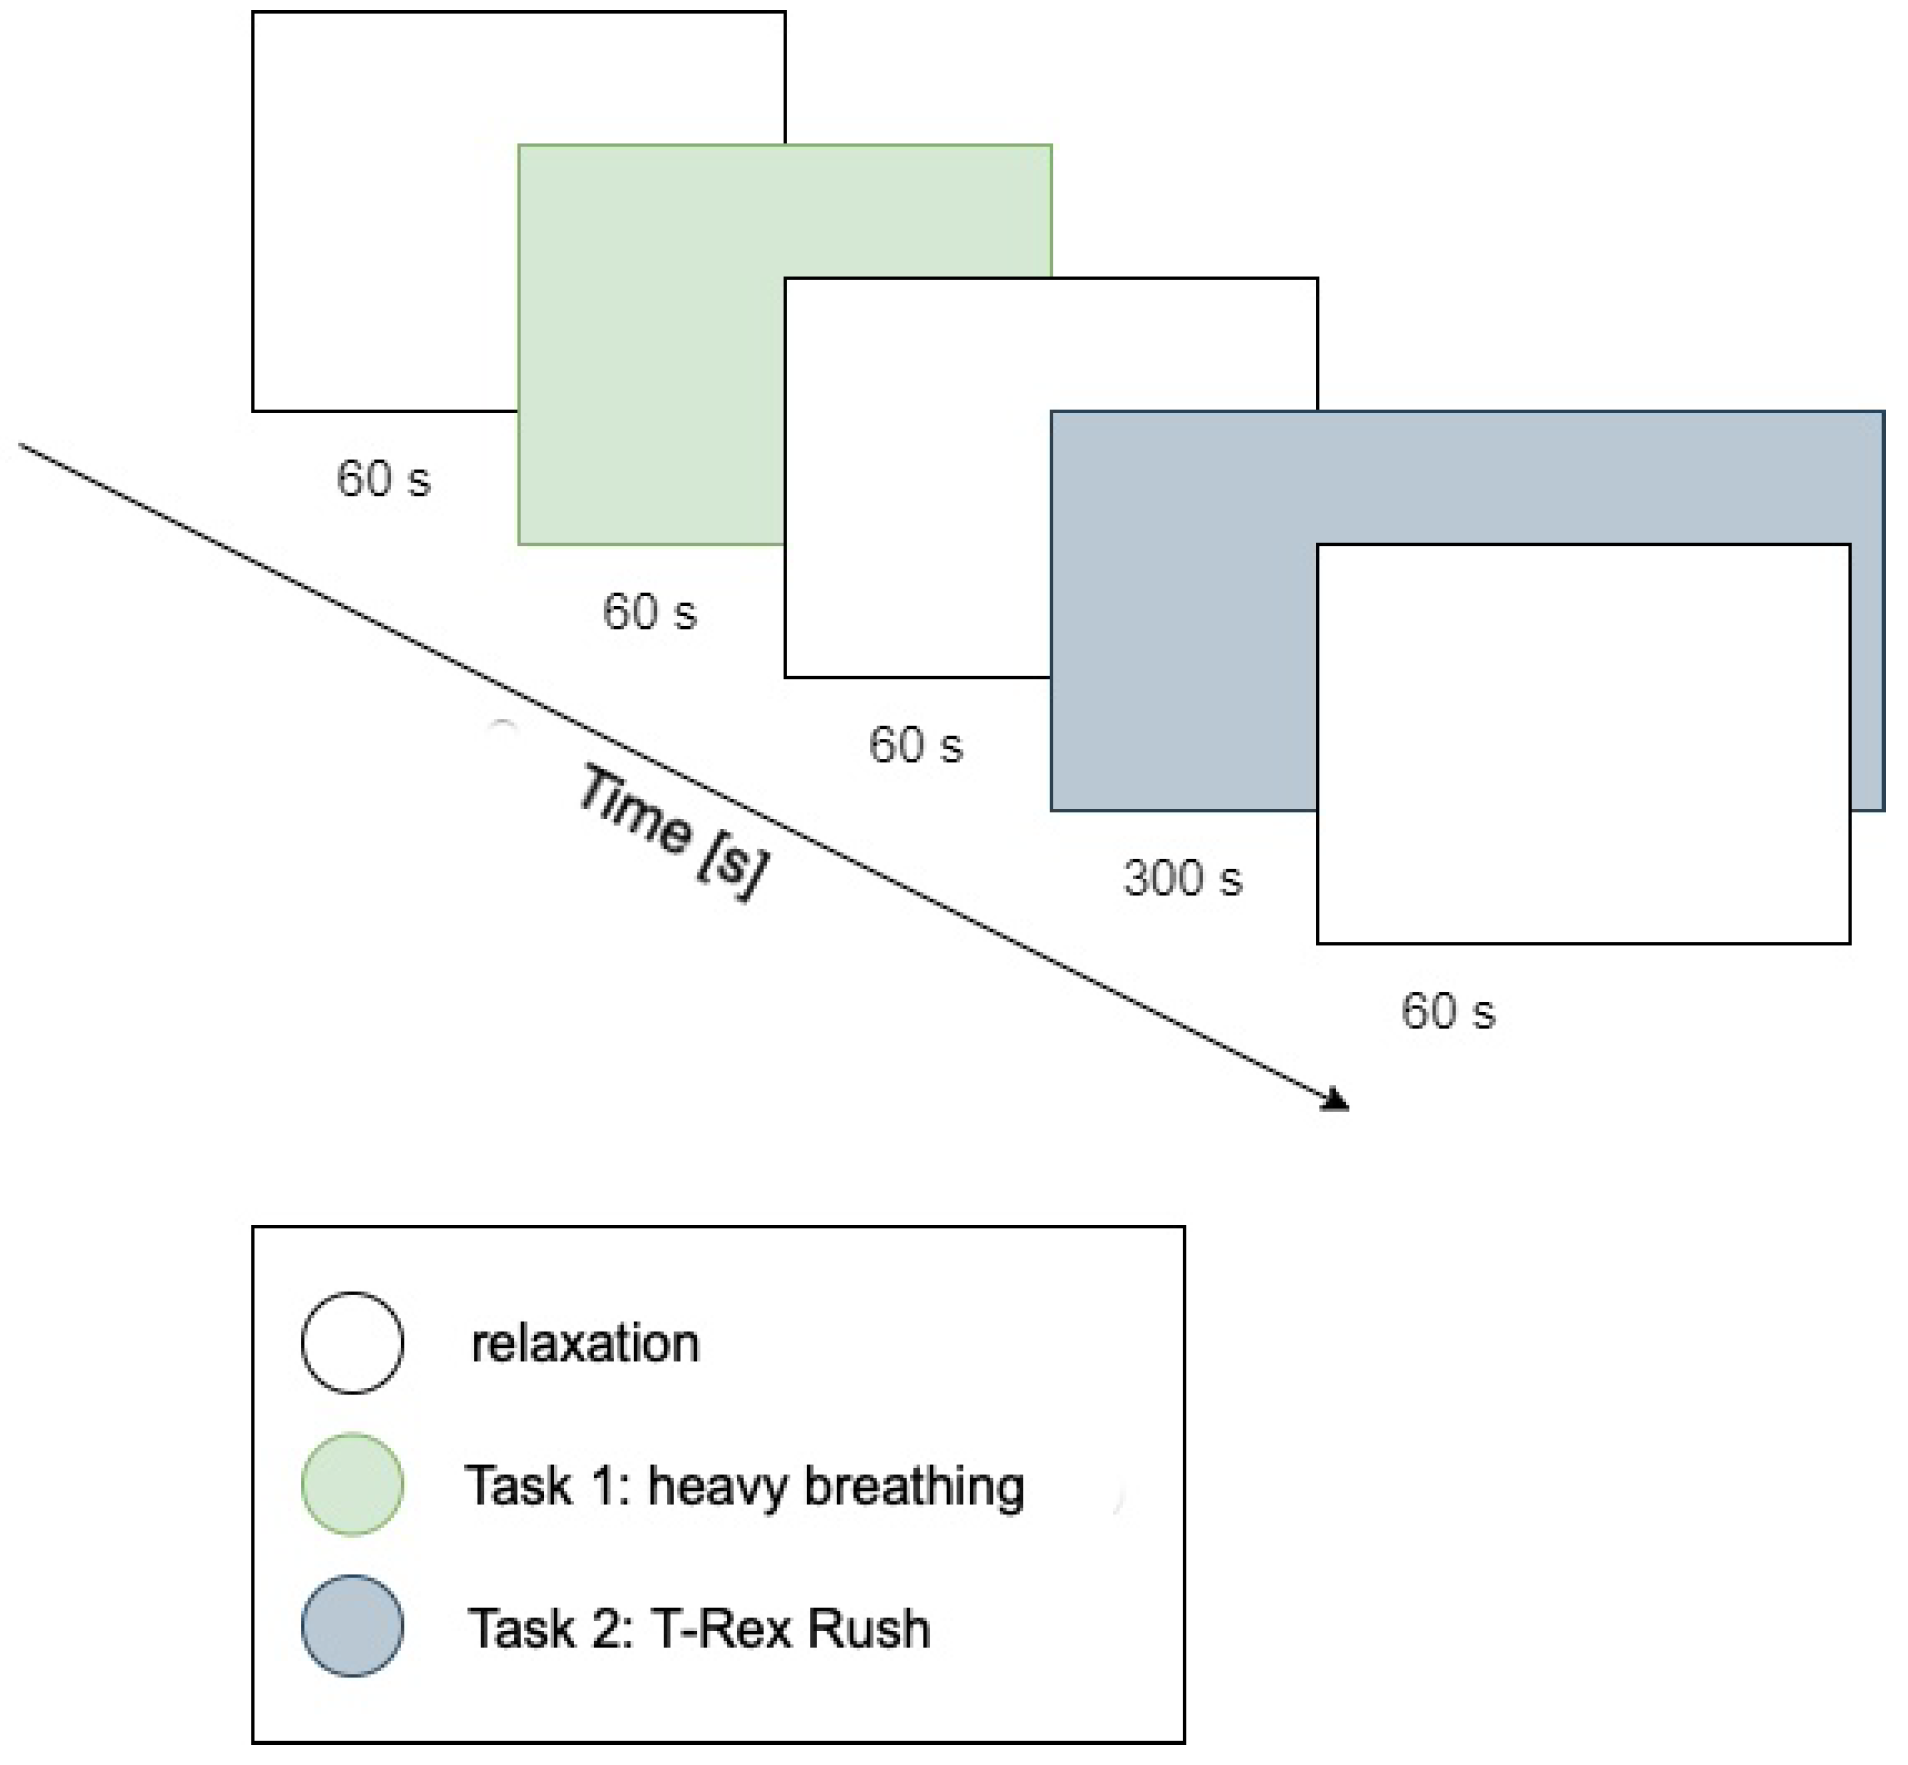
Figure 3.
Diagram illustrating signal fragments considered in the analysis: the letter B indicates the moment of stimulus onset.
Figure 3.
Diagram illustrating signal fragments considered in the analysis: the letter B indicates the moment of stimulus onset.
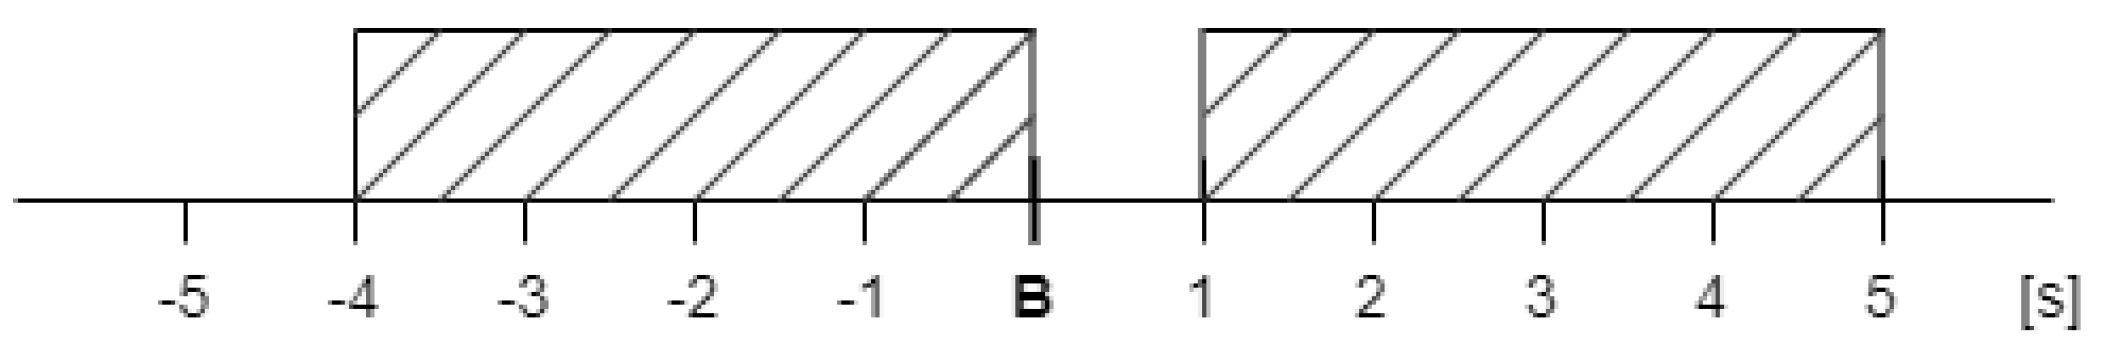
Figure 4.
Bar plot showing the averaged differences in signal feature values before and after a “failure.”, the differences are expressed as percentages
Figure 4.
Bar plot showing the averaged differences in signal feature values before and after a “failure.”, the differences are expressed as percentages
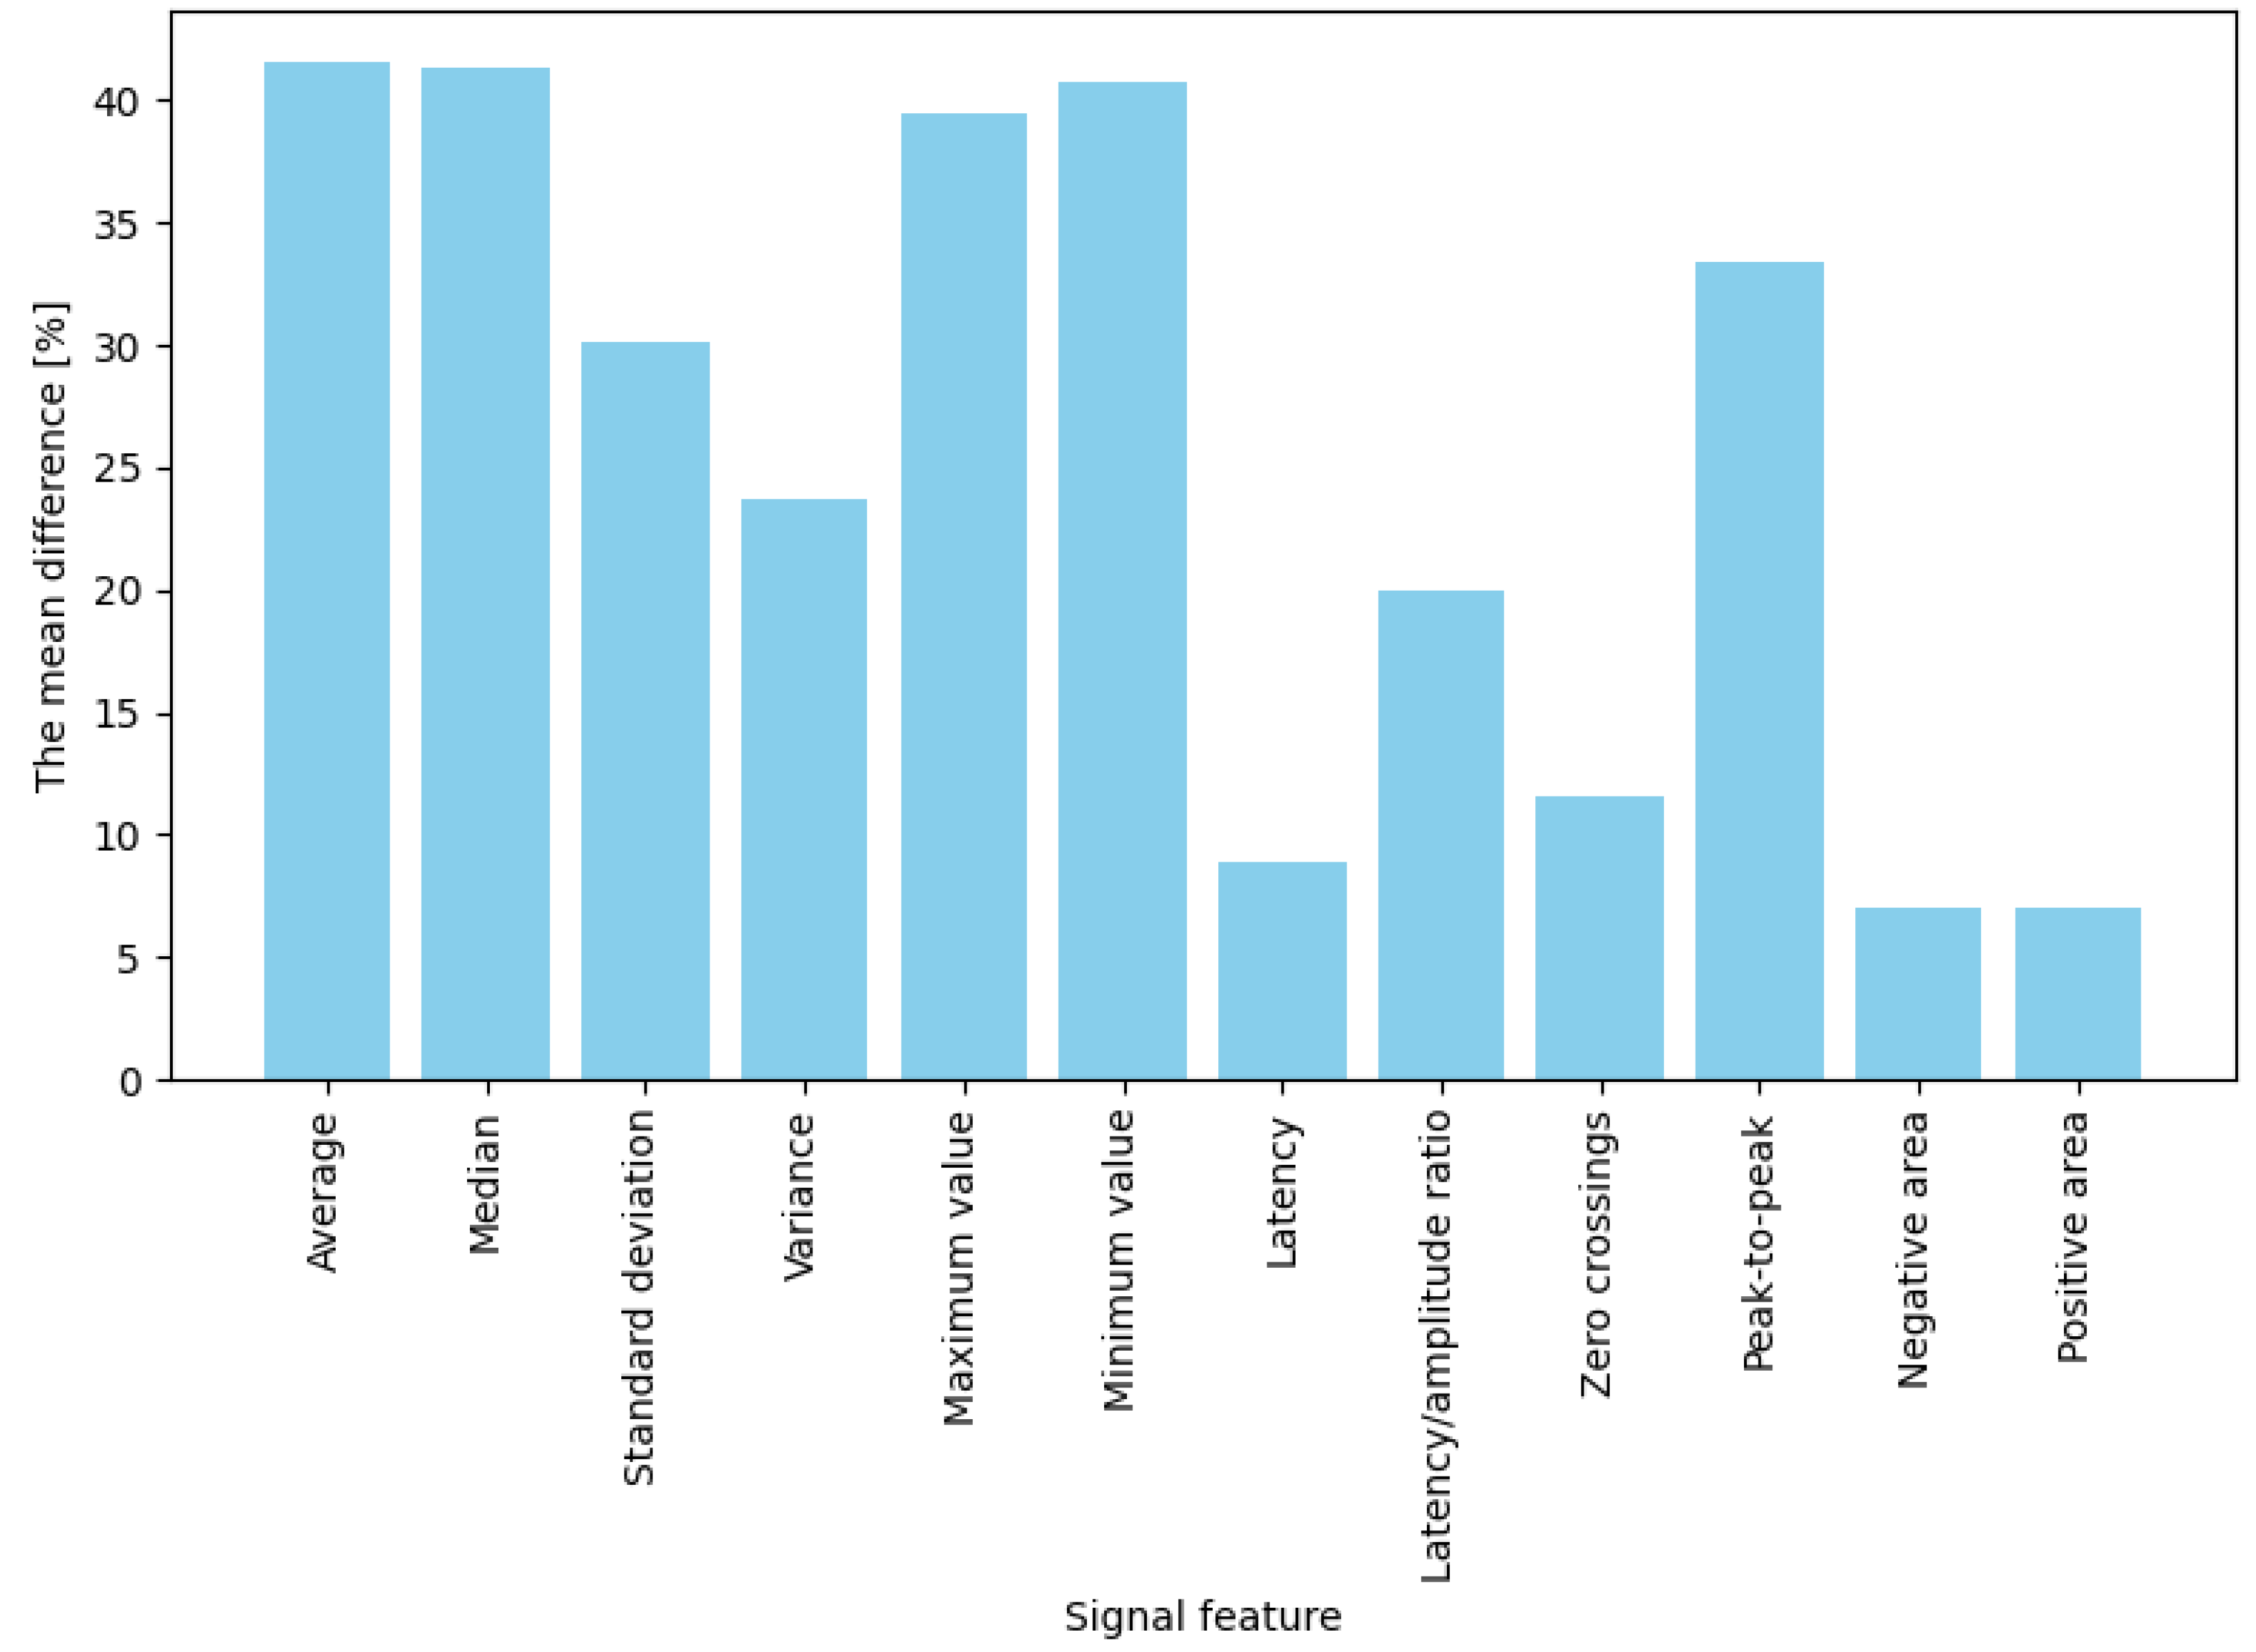
Figure 5.
Bar plot showing the averaged differences in signal feature values before and after a button press. The differences are expressed as percentages.
Figure 5.
Bar plot showing the averaged differences in signal feature values before and after a button press. The differences are expressed as percentages.
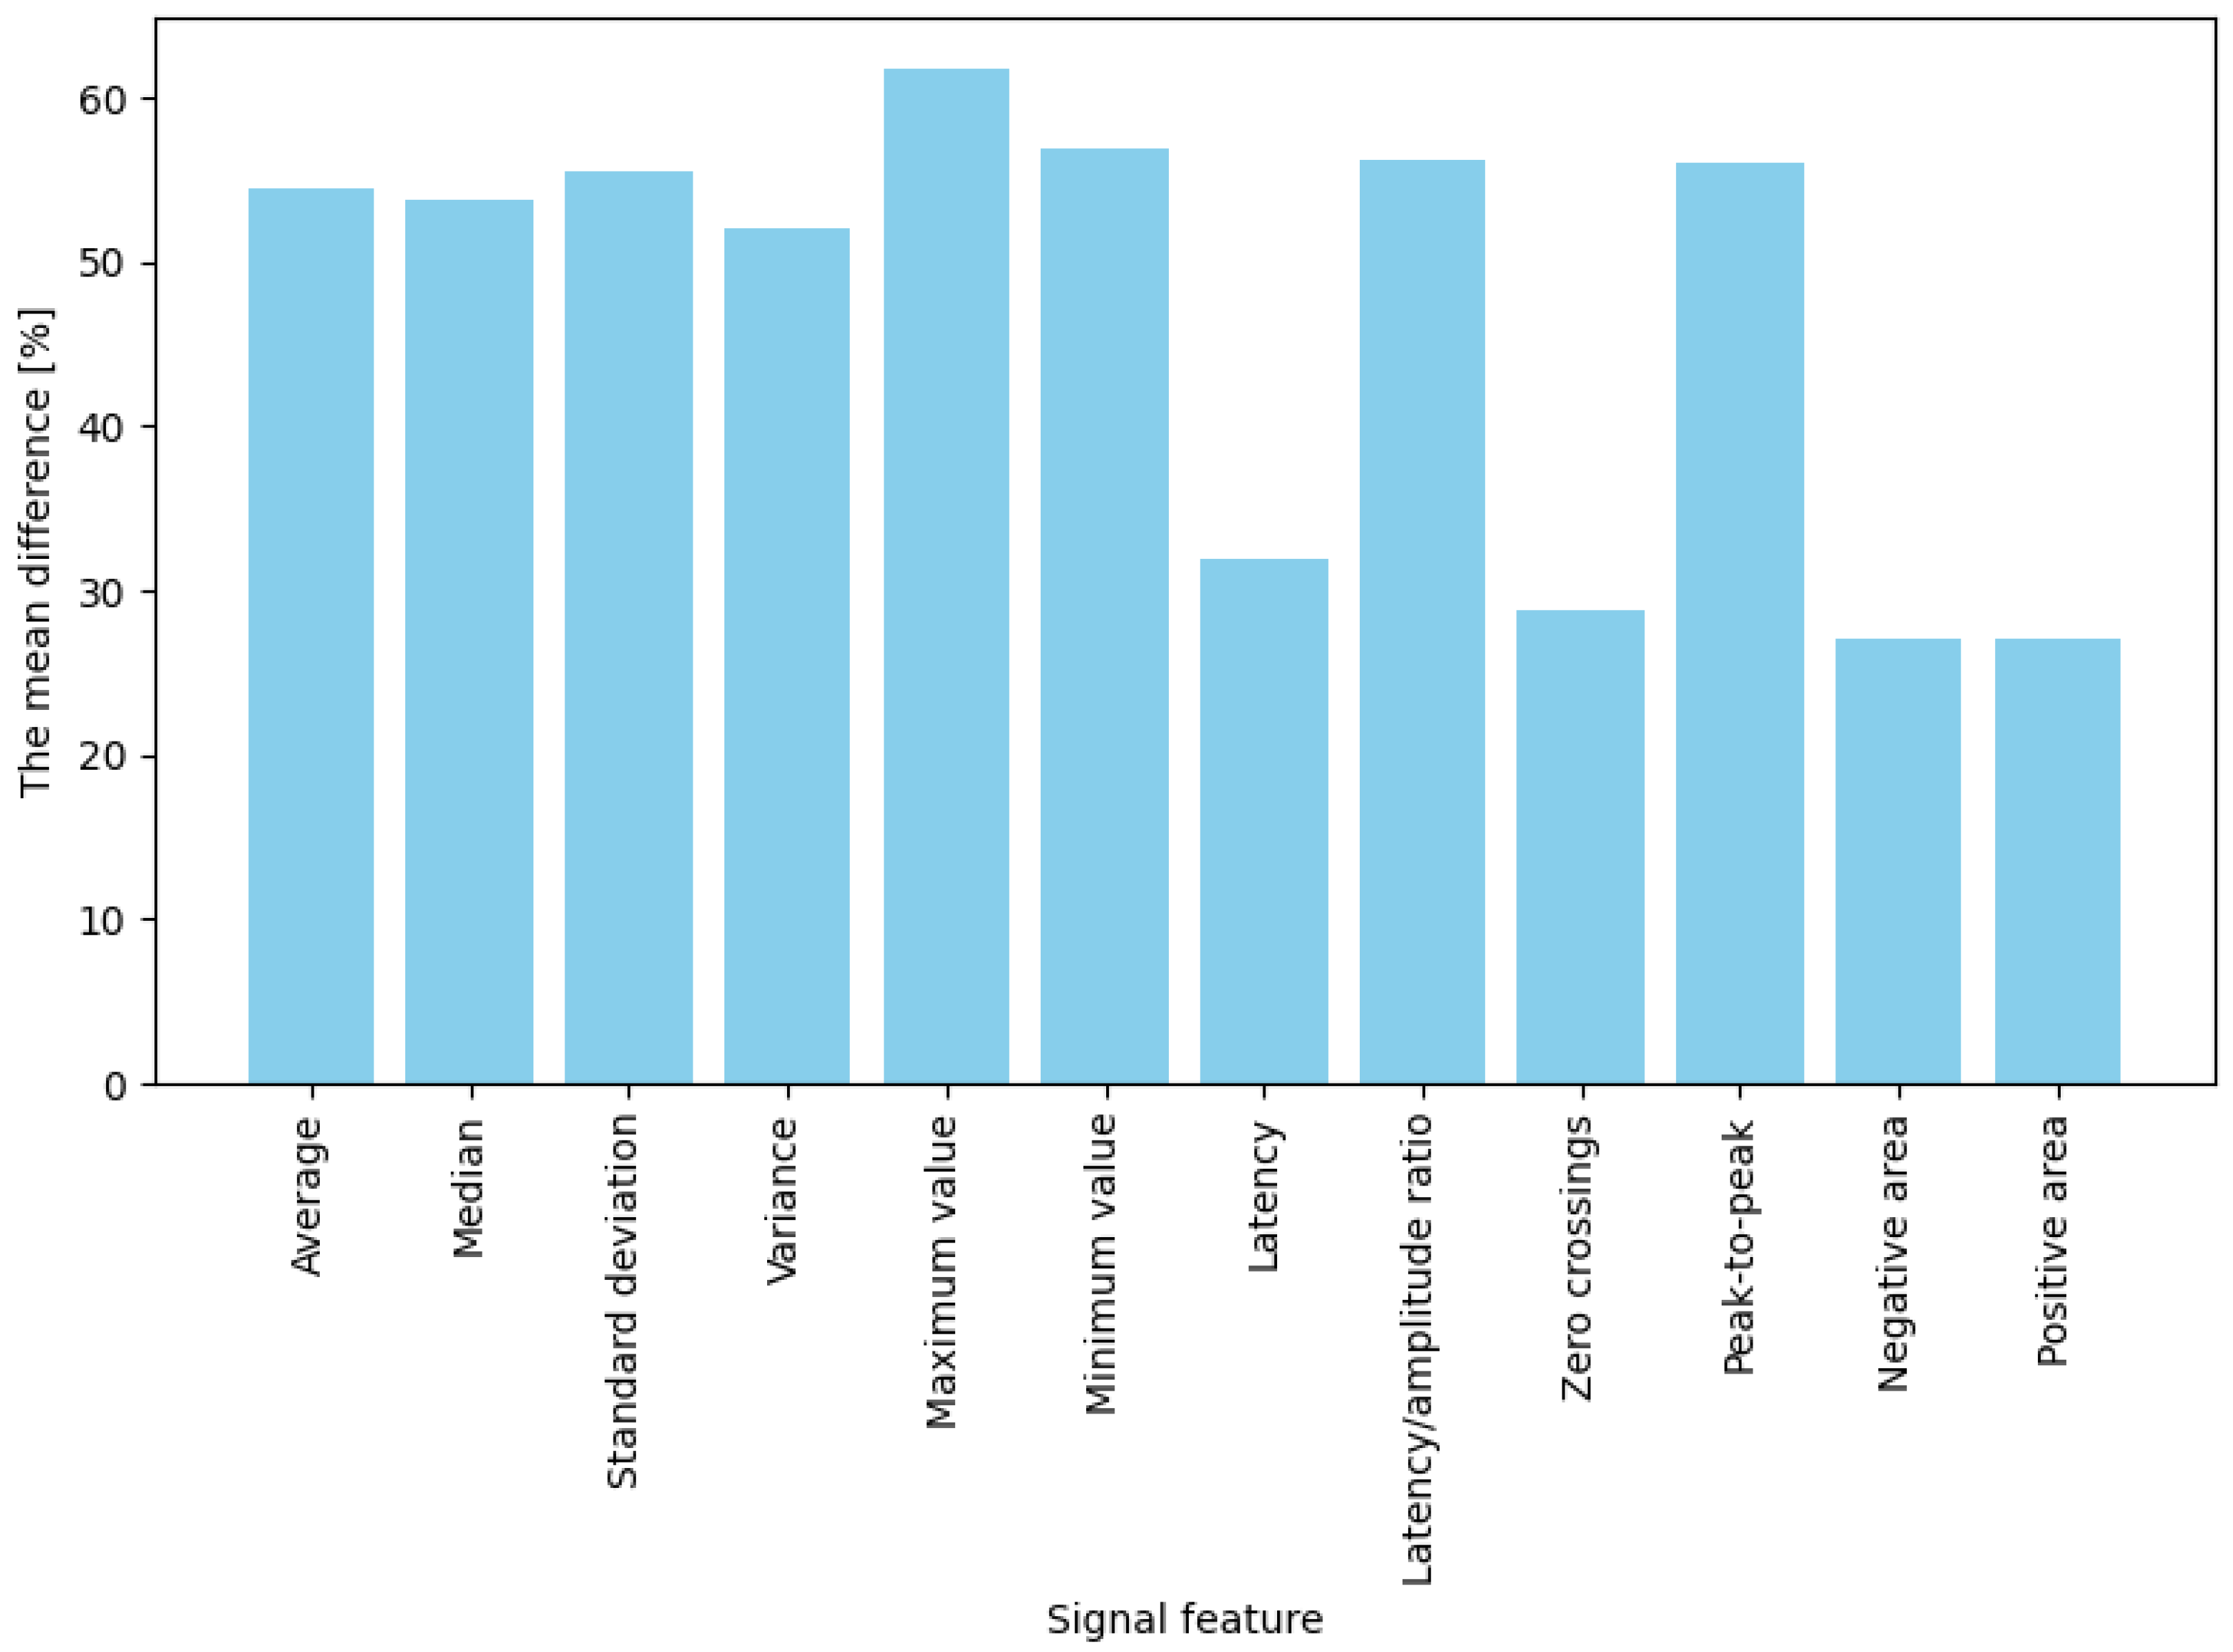

Table 1.
Correlation matrix presenting relationships between signal feature values for all participants.
Table 1.
Correlation matrix presenting relationships between signal feature values for all participants.
| mean | std | var | lat | max | min | lat/max | zero | area + | area - | p-t-p | med | |
|---|---|---|---|---|---|---|---|---|---|---|---|---|
| mean | 1.00 | -0.19 | -0.18 | 0.10 | 0.62 | 0.73 | -0.00 | -0.01 | 0.67 | -0.67 | -0.19 | 0.97 |
| std | -0.19 | 1.00 | 0.91 | -0.13 | 0.61 | -0.76 | 0.02 | -0.15 | -0.10 | 0.09 | 0.98 | -0.17 |
| var | -0.18 | 0.91 | 1.00 | -0.14 | 0.52 | -0.68 | 0.01 | -0.10 | -0.08 | 0.06 | 0.86 | -0.15 |
| lat | 0.10 | -0.13 | -0.14 | 1.00 | -0.03 | 0.10 | -0.03 | -0.05 | 0.09 | -0.08 | -0.10 | 0.12 |
| max | 0.62 | 0.61 | 0.52 | -0.03 | 1.00 | 0.02 | 0.02 | -0.13 | 0.43 | -0.45 | 0.62 | 0.56 |
| min | 0.73 | -0.76 | -0.68 | 0.10 | 0.02 | 1.00 | -0.01 | 0.10 | 0.47 | -0.47 | -0.78 | 0.66 |
| lat/max | -0.00 | 0.02 | 0.01 | -0.03 | 0.02 | -0.01 | 1.00 | 0.02 | 0.03 | -0.03 | 0.02 | -0.00 |
| zero | -0.01 | -0.15 | -0.10 | -0.05 | -0.13 | 0.10 | 0.02 | 1.00 | -0.02 | 0.06 | -0.16 | -0.01 |
| area + | 0.67 | -0.10 | -0.08 | 0.09 | 0.43 | 0.47 | 0.03 | -0.02 | 1.00 | -0.81 | -0.10 | 0.65 |
| area - | -0.67 | 0.09 | 0.06 | -0.08 | -0.45 | -0.47 | -0.03 | 0.06 | -0.81 | 1.00 | 0.08 | -0.65 |
| p-t-p | -0.19 | 0.98 | 0.86 | -0.10 | 0.62 | -0.78 | 0.02 | -0.16 | -0.10 | 0.08 | 1.00 | -0.16 |
| med | 0.97 | -0.17 | -0.15 | 0.12 | 0.56 | 0.66 | -0.00 | -0.01 | 0.65 | -0.65 | -0.16 | 1.00 |
Disclaimer/Publisher’s Note: The statements, opinions and data contained in all publications are solely those of the individual author(s) and contributor(s) and not of MDPI and/or the editor(s). MDPI and/or the editor(s) disclaim responsibility for any injury to people or property resulting from any ideas, methods, instructions or products referred to in the content. |
© 2025 by the authors. Licensee MDPI, Basel, Switzerland. This article is an open access article distributed under the terms and conditions of the Creative Commons Attribution (CC BY) license (http://creativecommons.org/licenses/by/4.0/).
Copyright: This open access article is published under a Creative Commons CC BY 4.0 license, which permit the free download, distribution, and reuse, provided that the author and preprint are cited in any reuse.


