Submitted:
11 July 2025
Posted:
14 July 2025
You are already at the latest version
Abstract
Background/Objectives: Quantifying emotions evoked by stimuli is a challenging task due to their subjective nature and the complexity of psychological states. Understanding how the brain processes emotions is critical, with applications in clinical, entertainment, and engineering fields. However, research on emotion processing in the brain is still in its infancy. This study focuses on quantifying emotions evoked by listening to slow-tempo musical stimuli (Raag Bhairavi), using Russell's circumplex model of emotion. The model utilizes the dimensions of valence and arousal to classify emotions. Frontal theta and gamma power asymmetry indices serve as key neurophysiological markers for emotion quantification, with participants categorized into Appreciators and Non-Appreciators based on their self-reported preferences for the musical stimulus. Methods: This empirical study employs Russell's 2D valence-arousal model to quantify evoked emotions. Electroencephalogram (EEG )data was recorded while participants listened to slow-tempo musical stimuli (Raag Bhairavi). Indices Used: Frontal theta and gamma power asymmetry indices were extracted to represent brain activity associated with emotional responses. Labelling: Participants provided self-reported responses to the stimulus, categorized as Appreciators (positive preference) or Non-Appreciators (negative/neutral preference). Model Development: Multiple models were created using frontal theta and gamma asymmetry indices. Classification: Support Vector Machine (SVM) was used for classification. Performance was validated using metrics such as accuracy and the Area Under the Curve (AUC). Results: The Total Gamma Theta (TGT) model achieved the best performance with a classification accuracy of 90.9% and an AUC of 90.74%. The Gamma Theta On 7 and 8 channel(GT78)model followed with an accuracy of 87.9% and an AUC of 89.28%. Conclusions: This study demonstrates the effectiveness of using EEG-based asymmetry indices for emotion quantification, providing a foundation for advancements in clinical, entertainment, and engineering applications.
Keywords:
EEG
; SVM
; Raag Bhairavi
1. Introduction
The present article based on literature review article [1]. In which author analysed various related articles and discussed various gaps of existing articles the main aim of this article to address those gaps.
There are many methods to arouse the emotion; music is the splendid thriller and elicitor of emotion during listening unique music the physiological responses of subjects like shivering, rushing heart, goosebumps, laughter, lump in throat, sensual arousal, and sweating [2].
Tuning in to the music combines different psychological processes such as, perception, focused attention, multisensory combination, reviewing memory, syntactic processing, and social cognition [3]. Thus, music is a strong stimulus for evoking the feelings and investigating the processing functions of the human brain.Using the musical stimulus.
Indian Classical music has great heritage the origin of Indian classical music can found in Vedas (1500BCE) [4]. An full-size body of ancient Indian scripts belonging to the early centuries A.D. Have documented the emotions associated with ragas [5,6] . There are many of folklore, but very few scientific research studies using EEG modality.
1.1. Research Question and Hypothesis
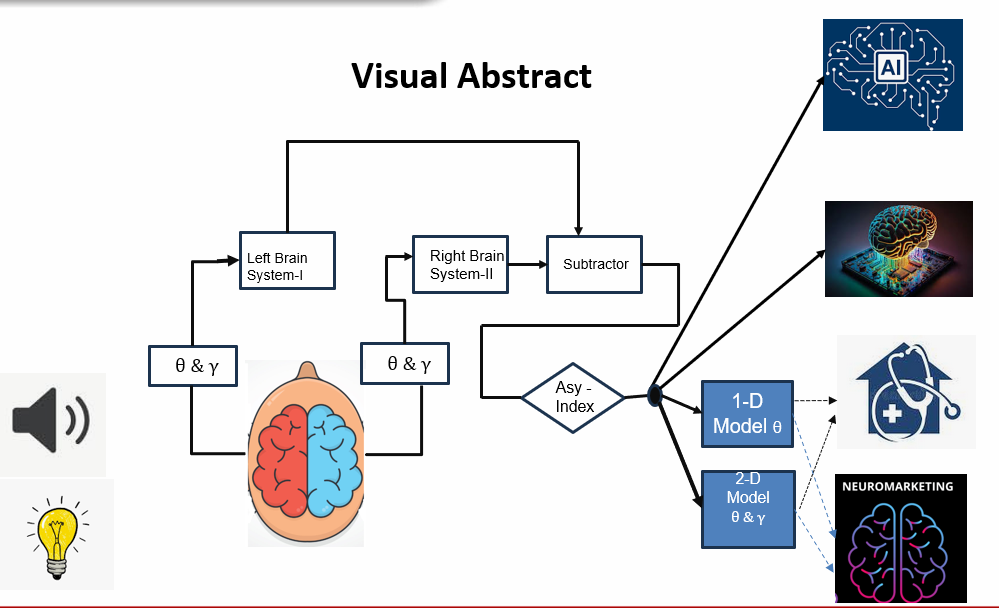
The frontal spectral asymmetry power index, which is generated in the frontal lobe due to the potential difference between the two hemispheres during the processing of the Raag Bhairavi musical stimulus, can be applied to quantify the emotion evoked by the stimulus.
To decipher the research question the variables exerted refer Figure 1 the independent variable were spectral powers of EEG bands on the left (system 1) and right (system 2) hemispheres of the participants and dependent as self-response given to musical stimulus by the participants.The null and alternative hypothesis formulated as below.
H0: There are NO changes in Power of and while listening InstrumentalRaag Bhairavi classical music on right and left hemisphere ( 0 = 1)
H1:There are changes in Power of in Power of and while listening InstrumentalRaag Bhairavi classical music on right and left hemisphere ( 0 ≠ 1)
The research is documented using Sec.-(Section 1.2). deals with challenges and recommendations of research.Sec.-(Section 2) covers theoretical frame work and proposed algorithm. Sec.-(Section 3) covers approach adopted to decipher research question. Sec.-(Section 4) deals with results analysis of proposed models. Sec.-(Section 5) deals with discussion of the results. Sec-(Section 6) conclude the research.
1.2. Challenges and Recommendations
The author [7] documented the pitfall of such kind of research. Designing of particularly interdisciplinary studies very difficult. The researcher needs expertise in EEG technology, signal processing, mathematical modelling, experimental psycho physiology, neurophysiology, and machine learning. It is an big challenge for scientists to oversee the state of the artwork in a majority of these areas of expertise, and to combine it efficaciously of their research, or correctly choose the quality of studies accomplished by others. Author recommends six recommendation shown in Figure 2 to avoid the pitfall in such experiments
- R1:Define your state of interest with ground truth
- R2:Connect your state of interest with neurophysiology
- R3:Reduce confounding factor
- R4:Stick to good classification practice
- R5:Reason for the causes of classification success
- R6:Insight of added value using neurophysiology
1.3. Brouwer Recommendation as Bench Mark
All the existing literature analysed considering Brouwer’s recommendations as a benchmarks [8] shown in Table 1.
The approach adopted to fulfil all recommendations
-
R1:
- (1)
- By involving music expert the music the stimulus selected which is unfamiliar as unfamiliar music suitable for the music recognition system [26].
- (2)
- The participant selected from the unlike the population of different age As the accuracy of the depend on on the age [23]
- (3)
- Clinical expert confirms the normalcy, handedness and psychometric tests to select the participant [29].
-
R2:
- (1)
- Models are created on the basis psycho-neurological findings. [1].
-
R3:
- (1)
- (2)
- EEG recorded in three sessions before the stimulus , during the stimulus and after stimulus.
- (3)
- Asymmetry checked on all four lobes.
-
R4:
- (1)
- (2)
- Various statistical test conducted and results confirmed using post-hoc tests.
-
R5:
- (1)
- Different models are created using the spectral feature as mentioned. in Sec.-Section 2.
-
R6:
- (1)
2. Theoretical Frame Work
After analyzing relevant and related articles mentioned in article [1].There is frontal asymmetrical EEG activity which modulated valence of emotion. An increased left frontal EEG activity for joyful music and more noticeable comparative right frontal EEG activity to unpleasant musical stimulus [9]. Intensity of asymmetry depends on as intensity of emotion [9]. The happy and sad emotions were evoked by pleasant and unpleasant musical stimulus [11]. Theta power modulate with evoked emotion [11]. , and low-frequency bands are associated with evoked emotions are found [13,28]. and band indicates arousal of emotion [17].
2.1. Proposed 2 D Models
Existing research shows that the frontal region is responsible for emotion processing when a subject evoked with positive emotion left hemisphere power high when a subject invoked with negative emotion subject is right hemisphere brain activity goes high to quantify the asymmetry frontal asymmetry models created. Theta power correlates the evoked valence of emotion frontal Some literature is suggesting high frequency gamma power correlates arousal of evoked emotion based on these findings 2-D model of emotion formatted using frontal theta power asymmetry index and gamma power asymmetry index and 2-D model of emotion based on theta and gamma asymmetry Table 2. TGT (Total Frontal channel Gamma and Theta asymmetry ) comprises of valence variable Total Asymmetry Emotion Valence Theta Index (TAEVI) and arousal variable total Asymmetry Emotion Valence Gamma Index (TAEVI). GT 7 8 ( Gamma and Theta on channel 7 and 8) comprises Asymmetry Emotion Valence on Frontal 7 8 Theta (AEVIF78). GT34( Gamma Theta on channel 3 and 4) comprises of valence variable Asymmetry Emotion Valence on Frontal 3,4 Theta (AEVIF34) and arousal variable Asymmetry Emotion Valence on Frontal 3 4 Gamma AEVIF34. GTFp12 ( Gamma and Theta Fronto-Partial on channel 1 and 2) valence variable Asymmetry Emotion Valence on Fronto-Parietal channel 1 and 2 Theta(AEVIFp12) and arousal variable Asymmetry Emotion Valence on Fronto-Parietal channel 1 and 2 Gamma (AEVIFp12).
3. Methodology
After having sufficient background about existing research, We have prepared methodology for our proposed study. The investigation proceeded after ethics committee approval from HBT Medical College and Dr R.N Cooper Hopital Total 33 right handed subjects participated in study 17 female and 16 males with average age 28.69± 11.69 all the subjects satisfied inclusion criteria all the participant most of the normal subjects were staff, faculty, doctors and relatives of patients of Dr Cooper Hospital and some are faculties of MPSTME. Handedness and normalcy of the subjects confirmed by an associated psychiatrist.
-
Inclusion Criteria
- (1)
- Right handed subjects
- (2)
- Age 18-63
- (3)
- No medical condition and history of mental depression
-
Exclusion Criteria
- (1)
- Subjects under medication for mental depression
- (2)
- Left-handed Subjects
- (3)
- Subjects with suffering from neurotic diseases
To evaluate brain activity electrode cap of 8 electrodes placed on the scalp of participants in International 10-20 system using a non-invasive 32-channel EEG machine (Medicaid System, India). Electrode Placed on scalp at various location using referential montage FP2-A2,F8-A2,F4-A2 ,FP1-A1,F7-A1,F3-A1 After recording; participants were asked to rate the musical piece on a specially designed visual Analog scale of zero to four. This range specially designed to understand emotions evoked by musical piece. Zero is extremely negative or unpleasant emotions and four being extremely positive or pleasant emotions.The subject who rated 4 and 3 are clubbed as Appreciator while 0, 1,2 called as Non-appreciator. The average spectral power computed for each electrode individually removing the artefact slots from recorded EEG using FFT in Nuromax software.Eq,-1 and Eq.-8 represent and power for all mentioned electrodes on right and left hemisphere of brain Eq-(4),Eq-(5),Eq-(6)and Eq-(7) represent valence variables and Eq-(11),Eq-(12),Eq-(13) and ,Eq-(14) represent arousal variable of model mentioned in the Table 2
x(n), n=0, 1, 2, 3…. N where is the raw sample of EEG signals at particular of frontal side power on left hemisphere and right hemisphere
4. Results and Analysis
Two-dimensional model created using Frontal Gamma asymmetry and theta asymmetry for the model total electrode F78, F34 and Fp12 created for the appreciator and non-appreciator. The scatter plots of all the models shown in the Figure 3. The scatter plot of Model Total Frontal Gamma and theta asymmetry and F78 gamma and theta asymmetry recognising appreciator and non-appreciator refer Figure 3 a) and b) whereas F34 and Fp12 model not recognising appreciator and non-appreciator Figure 3 c) and d).
4.1. Total Gamma Theta
This model proposed using total Frontal Asymmetry Emotion Arousal Index (AEAI ) on the Y-axis, total Frontal asymmetry emotion valence index (AEVI ) on the X-axis . The SVM classifier with various kernel tricks used for classification. The classification for different kernel shown in Figure 4 Confusion matrices of all the kernels computed refer Eq. (15),Eq.(16),Eq.(17) and Eq.(18).The default cost for all kernel was 1 and gamma 0.5.The polynomial kernel with degree 3. The support vectors for kernels linear 15(8 7), radial 19( 10,9), Polynomial 19(10,9) and sigmoid 16(8,8).
4.2. Gamma and Theta on Channel 7 8
This model proposed using total Frontal Asymmetry Emotion Arousal Index (AEAI F78) on the y-axis, total Frontal asymmetry emotion valence index ( AEVI F78) on the X-axis. The SVM classifier with various kernel tricks used for classification. The classification for different kernel shown in Figure 5. Confusion matrices of all the kernels computed refer Eq. (19), Eq.(20), Eq.(21) and Eq.(22).The default cost for all kernel was 1 and gamma 0.5.The polynomial kernel with degree 3. The support vectors for kernels linear 14(7 7), radial 20( 10,10), Polynomial 16(8,8) and sigmoid 16(8,8).
4.3. Gamma Theta on Channel 3 4
This model proposed using total Frontal Asymmetry Emotion Arousal Index (AEAI F34) on the y-axis, total Frontal asymmetry emotion valence index ( AEVI F34) on the X-axis. The SVM classifier with various kernel tricks used for classification. The classification for different kernel shown in Figure 6 Confusion matrices of all the kernels computed ref Eq. (23),Eq.(24),Eq.(25) and Eq.(26).The default cost for all kernel was 1 and gamma 0.5.The polynomial kernel with degree 3. The support vectors for kernels linear 26(14,12), radial 27( 15,12), Polynomial 19(10,9) and sigmoid 23(12,11)
4.4. Gamma Theta on Channel Fp12
This model proposed using total Frontal Asymmetry Emotion Arousal Index (AEAI Fp12) on the y-axis, total Frontal asymmetry emotion valence index ( AEVI Fp12) on the X-axis. The SVM classifier with various kernel tricks used for classification. The classification for different kernel shown in Figure 7 Confusion matrices of all the kernels computed refer Eq.(27), Eq.(28), Eq.(29) and Eq.(30).The default cost for all kernel was 1 and gamma 0.5.The polynomial kernel with degree 3. The support vectors for kernels linear 23(12,11), radial 25( 13,12), Polynomial 22(11,11) and sigmoid 24(12,12).
4.5. Best Performing Models
10-fold cross-validation of parameter tuning used to select the best model. The radial kernel was giving the best performance for all the models. For total Gamma and theta asymmetry model best performance achieved at the cost of 8 , gamma 0.5 and epsilon 0.1 with the number of support vector 14 (8,6) performance of SVM shown in Figure 8 a) The best model confusion matrix refer Eq.(31).
For F78 Gamma and Theta asymmetry model best performance achieved at the cost of 8 , gamma 0.5 and epsilon 0.1833 with the number of support vector 15 (8, 7) performance of SVM shown in Figure 8b) The best model confusion matrix refer Eq.(5)
4.6. ROC of Models
The Figure 9 shows the ROC curves of the all 2-D models. The AUC of the models TGT 90.74% GT78 89.28% GT34 55.56% and GTFp12 75.39 %. The AUC verifying The models TGT and GT 78 performing adequately whereas GT34 and GTFp12 performance is poor
4.7. 2-D Model Performance
4.7.1. Tuned Model Performance
The performance attributes computed from the confusion matrix derived after tuning the parameters. All the model give their best performance in the radial kernel. The model GT have a very high accuracy 93.41%, upper TPR(100%), TNR(83.3%), F1(95.4%), and very high value of MCC(0.87), YI(0.83)markedness(0.91). Followed by the model GTF78 have a very high accuracy 87.9%, upper TPR(100%), TNR(66.7%), F1(91.3%), and very high value of MCC(0.75), YI(0.67), markedness(0.84). Followed by the Whereas the model GTFp12 performs accuracy 87.9%, upper TPR(90.5%), TNR(83.3%), F1(90.5%), and very high value of MCC(0.87), YI(0.73), markedness(0.91).
5. Discussion
Investigating emotions is very quite challenging [34]. The affective expression has emerged as a growing area of studies in psychology, psychiatry [34] and computer science [35]. The emotions are adequately quantified using Russel’s circumplex model as shown Figure 10. This model put forward that emotions are disseminated in a two-dimensional circular space. Arousal represents the Y-axis and valence represents the X-axis, while the centre of the circle represents a neutral[33]. Emotions are mapped using angles like Pleasure(Like) (), Joy (), arousal (), distress(anger) (), displeasure(dislike) () Emotion is generated from triggering inside unique neural pathways of the central nervous system (CNS) and each emotion is autonomous of the others in its behavioural, psychological, and physiological manifestations [36]. In our study, neuronal oscillations low-frequency theta (4 to 8 Hz) and high-frequency Gamma( 30 to 99Hz) used as features. Theta asymmetry index and gamma asymmetry index incorporated for the valence and arousal of evoked emotion. The uniqueness of Raga Bhairavi musical stimulus its slow tempo and tonality [29]. The tonality modulate arousal of emotion [37]. As Raga Bhairavi is unfamiliar music its most appropriate for model creation [36] [26]. In Non-musician participant there is increased frontal gamma power [19]. In our study the participant were non-musician. Refer the Figure 11 which is proposed model TGT for mapping evoked emotion in Russell’s circumplex model. In All Appreciator evoked with happy emotion evoked whereas in Appreciator(A1) euphoric Appreciator(A8) excited emotion were evoked, whereas in Non-Appreciator was evoked with upset emotion.In one Non-Appreciator(N15) tense emotion was evoked.
The reason for the high accuracy of TGT model may be due to all feature clubbed in that model might lead to over-fitting. The model GT78 giving high accuracy and AUC, all the appreciator and non-appreciator mapped for evoked emotions using Russel’s model Appreciator are evoked with happy emotion the Appreciator (A1) evoked with serene emotion which evoked with excited emotion in TGT model whereas Non-Appreciators are evoked with upset emotions one of Non-Appreciator(N15) evoked with tense emotion refer the Figure 12. Neurological finding suggest that fronto anterior region is the epicentre for emotion processing [38].
Neurological acumen and machine learning performance attributes suggests model GT78 can be used for emotion as 2D emotion quantifier which give electrode reduced system for many clinical and non -clinical applications.
6. Conclusions
The article is dedicated to investigating the research question of whether the asymmetry index can be used to quantify the emotion evoked by the instrumental musical stimulus Raag Bhairavi. To address the research question, we proposed several 2-D classification models and evaluated their performance using various SVM-based metrics. Support Vector Machine (SVM) proved to be a suitable supervised machine learning algorithm for classifying the proposed models the central gap of the previous research addressed creating a 2-D model by using gamma asymmetry index along with the frontal theta asymmetry index. The 2-D model TGT and GT F78 performing well.The 2-D models are quantifying valence and arousal of evoked emotion due to Raag Bhairavi in Appreciator and Non-appreciator.
7. Patents
This research work is based on the innovations described in the Indian Patent Application titled "MUSICALLY EVOKED EMOTIONS QUANTIFIER SYSTEM", filed under application number 202021004106. The patent has been filed with the Office of the Controller General of Patents, Designs & Trademarks, Government of India.
Funding
This research is non-funded.
Institutional Review Board Statement
This study proceeded after ethics committee approval from HBT medical college and Dr R.N. Cooper Hospital Mumbai H/O1077/RNCH/14.
Conflicts of Interest
No author mentioned in the manuscript has any competing interest.
References
- Tandle, A.L.; Joshi, M.S.; Dharmadhikari, A.S.; Jaiswal, S.V. Mental state and emotion detection from musically stimulated EEG. Brain informatics 2018, 5, 1–13.
- Goldstein, A. Thrills in response to music and other stimuli. Physiological psychology 1980, 8, 126–129. [Google Scholar] [CrossRef]
- Koelsch, S. Brain and music; John Wiley & Sons, 2012.
- Gilbert, J. Everything We Do is Music, 2020. Accessed: 2025-07-03.
- Bhatkhande, V.N. A short historical survey of the music of upper India; Indian Musicological Society Baroda, 1974.
- Vatsyayan, K. Bharata The Natyasastra; Sahitya Akademi, 1996.
- Brouwer, A.M.; Zander, T.O.; Van Erp, J.B.; Korteling, J.E.; Bronkhorst, A.W. Using neurophysiological signals that reflect cognitive or affective state: six recommendations to avoid common pitfalls. Frontiers in neuroscience 2015, 9, 136. [Google Scholar] [CrossRef]
- Alarcao, S.M.; Fonseca, M.J. Emotions recognition using EEG signals: A survey. IEEE transactions on affective computing 2017, 10, 374–393. [Google Scholar] [CrossRef]
- Schmidt, L.A.; Trainor, L.J. Frontal brain electrical activity (EEG) distinguishes valence and intensity of musical emotions. Cognition & Emotion 2001, 15, 487–500. [Google Scholar]
- Altenmüller, E.; Schürmann, K.; Lim, V.K.; Parlitz, D. Hits to the left, flops to the right: different emotions during listening to music are reflected in cortical lateralisation patterns. Neuropsychologia 2002, 40, 2242–2256. [Google Scholar] [CrossRef]
- Sammler, D.; Grigutsch, M.; Fritz, T.; Koelsch, S. Music and emotion: electrophysiological correlates of the processing of pleasant and unpleasant music. Psychophysiology 2007, 44, 293–304. [Google Scholar] [CrossRef]
- Lin, Y.P.; Wang, C.H.; Wu, T.L.; Jeng, S.K.; Chen, J.H. Multilayer perceptron for EEG signal classification during listening to emotional music. In Proceedings of the TENCON 2007-2007 IEEE region 10 conference. IEEE, 2007, pp. 1–3.
- Lin, Y.P.; Wang, C.H.; Wu, T.L.; Jeng, S.K.; Chen, J.H. Support vector machine for EEG signal classification during listening to emotional music. In Proceedings of the 2008 IEEE 10th workshop on multimedia signal processing. IEEE, 2008, pp. 127–130.
- Lin, Y.P.; Jung, T.P.; Chen, J.H. EEG dynamics during music appreciation. In Proceedings of the 2009 Annual International Conference of the IEEE Engineering in Medicine and Biology Society. IEEE, 2009, pp. 5316–5319.
- Lin, Y.P.; Wang, C.H.; Jung, T.P.; Wu, T.L.; Jeng, S.K.; Duann, J.R.; Chen, J.H. EEG-based emotion recognition in music listening. IEEE Transactions on Biomedical Engineering 2010, 57, 1798–1806. [Google Scholar] [CrossRef]
- Fachner, J.; Gold, C.; Ala-Ruona, E.; Punkanen, M.; Erkkilä, J. Depression and music therapy treatment—clinical validity and reliability of EEG alpha asymmetry and frontal midline theta: three case studies. Music Therapy Icmpc 2010, 11, 11–18. [Google Scholar]
- Hadjidimitriou, S.K.; Hadjileontiadis, L.J. Toward an EEG-based recognition of music liking using time-frequency analysis. IEEE Transactions on Biomedical Engineering 2012, 59, 3498–3510. [Google Scholar] [CrossRef]
- Duan, R.N.; Wang, X.W.; Lu, B.L. EEG-based emotion recognition in listening music by using support vector machine and linear dynamic system. In Proceedings of the Neural Information Processing: 19th International Conference, ICONIP 2012, Doha, Qatar, November 12-15, 2012, Proceedings, Part IV 19. Springer, 2012, pp. 468–475.
- Urakami, Y.; Kawamura, K.; Washizawa, Y.; Cichocki, A. Electroencephalographic gamma-band activity and music perception in musicians and non-musicians. Act. Nerv. Super. Rediviva 2013, 55, 149–157. [Google Scholar]
- Hadjidimitriou, S.K.; Hadjileontiadis, L.J. EEG-based classification of music appraisal responses using time-frequency analysis and familiarity ratings. IEEE Transactions on Affective Computing 2013, 4, 161–172. [Google Scholar] [CrossRef]
- Leslie, G.; Ojeda, A.; Makeig, S. Towards an affective brain-computer interface monitoring musical engagement. In Proceedings of the 2013 Humaine Association Conference on Affective Computing and Intelligent Interaction. IEEE, 2013, pp. 871–875.
- Shahabi, H.; Moghimi, S. Toward automatic detection of brain responses to emotional music through analysis of EEG effective connectivity. Computers in Human Behavior 2016, 58, 231–239. [Google Scholar] [CrossRef]
- Bhatti, A.M.; Majid, M.; Anwar, S.M.; Khan, B. Human emotion recognition and analysis in response to audio music using brain signals. Computers in Human Behavior 2016, 65, 267–275. [Google Scholar] [CrossRef]
- Kaur, B.; Singh, D.; Roy, P.P. A novel framework of EEG-based user identification by analyzing music-listening behavior. Multimedia tools and applications 2017, 76, 25581–25602. [Google Scholar] [CrossRef]
- Sengupta, S.; Biswas, S.; Sanyal, S.; Banerjee, A.; Sengupta, R.; Ghosh, D. Quantification and categorization of emotion using cross cultural music: an EEG based fractal study. In Proceedings of the 2016 2nd International Conference on Next Generation Computing Technologies (NGCT). IEEE, 2016, pp. 759–764.
- Thammasan, N.; Moriyama, K.; Fukui, K.i.; Numao, M. Familiarity effects in EEG-based emotion recognition. Brain informatics 2017, 4, 39–50. [Google Scholar] [CrossRef] [PubMed]
- Lee, M.; Shin, G.H.; Lee, S.W. Frontal EEG asymmetry of emotion for the same auditory stimulus. IEEE Access 2020, 8, 107200–107213. [Google Scholar] [CrossRef]
- Valdés-Alemán, P.; Téllez-Alanís, B.; Zamudio-Gurrola, A. Brain electrical patterns associated with pleasure and emotion induced by tonal and atonal music. Behavioral Neuroscience 2024. [Google Scholar] [CrossRef]
- Dharmadhikari, A.; Tandle, A.; Jaiswal, S.; Sawant, V.; Vahia, V.; Jog, N. Frontal theta asymmetry as a biomarker of depression. East Asian archives of psychiatry 2018, 28, 17–22. [Google Scholar]
- Tandle, A.; Jog, N.; D’cunha, P.; Chheta, M. Classification of artefacts in EEG signal recordings and overview of removing techniques. International Journal of Computer Applications 2015, 975, 8887. [Google Scholar]
- Tandle, A.; Jog, N.; D’cunha, P.; Chheta, M. Classification of artefacts in EEG signal recordings and EOG artefact removal using EOG subtraction. Commun Appl Electron 2016, 4, 12–19. [Google Scholar] [CrossRef]
- Avinash, T.; Dikshant, L.; Seema, S. Methods of neuromarketing and implication of the frontal theta asymmetry induced due to musical stimulus as choice modeling. Procedia computer science 2018, 132, 55–67. [Google Scholar] [CrossRef]
- Russell, J.A. A circumplex model of affect. Journal of personality and social psychology 1980, 39, 1161. [Google Scholar] [CrossRef]
- Scherer, K.R. Speech and emotional states. Speech evaluation in psychiatry 1981, pp. 189–220.
- Cowie, R.; Douglas-Cowie, E.; Tsapatsoulis, N.; Votsis, G.; Kollias, S.; Fellenz, W.; Taylor, J.G. Emotion recognition in human-computer interaction. IEEE Signal processing magazine 2001, 18, 32–80. [Google Scholar] [CrossRef]
- Pizzagalli, D.A.; Oakes, T.R.; Davidson, R.J. Coupling of theta activity and glucose metabolism in the human rostral anterior cingulate cortex: an EEG/PET study of normal and depressed subjects. Psychophysiology 2003, 40, 939–949. [Google Scholar] [CrossRef]
- Mathur, A.; Vijayakumar, S.H.; Chakrabarti, B.; Singh, N.C. Emotional responses to Hindustani raga music: the role of musical structure. Frontiers in psychology 2015, 6, 513. [Google Scholar] [CrossRef]
Figure 1.
Asymmetry Index of evoked musical stimulus
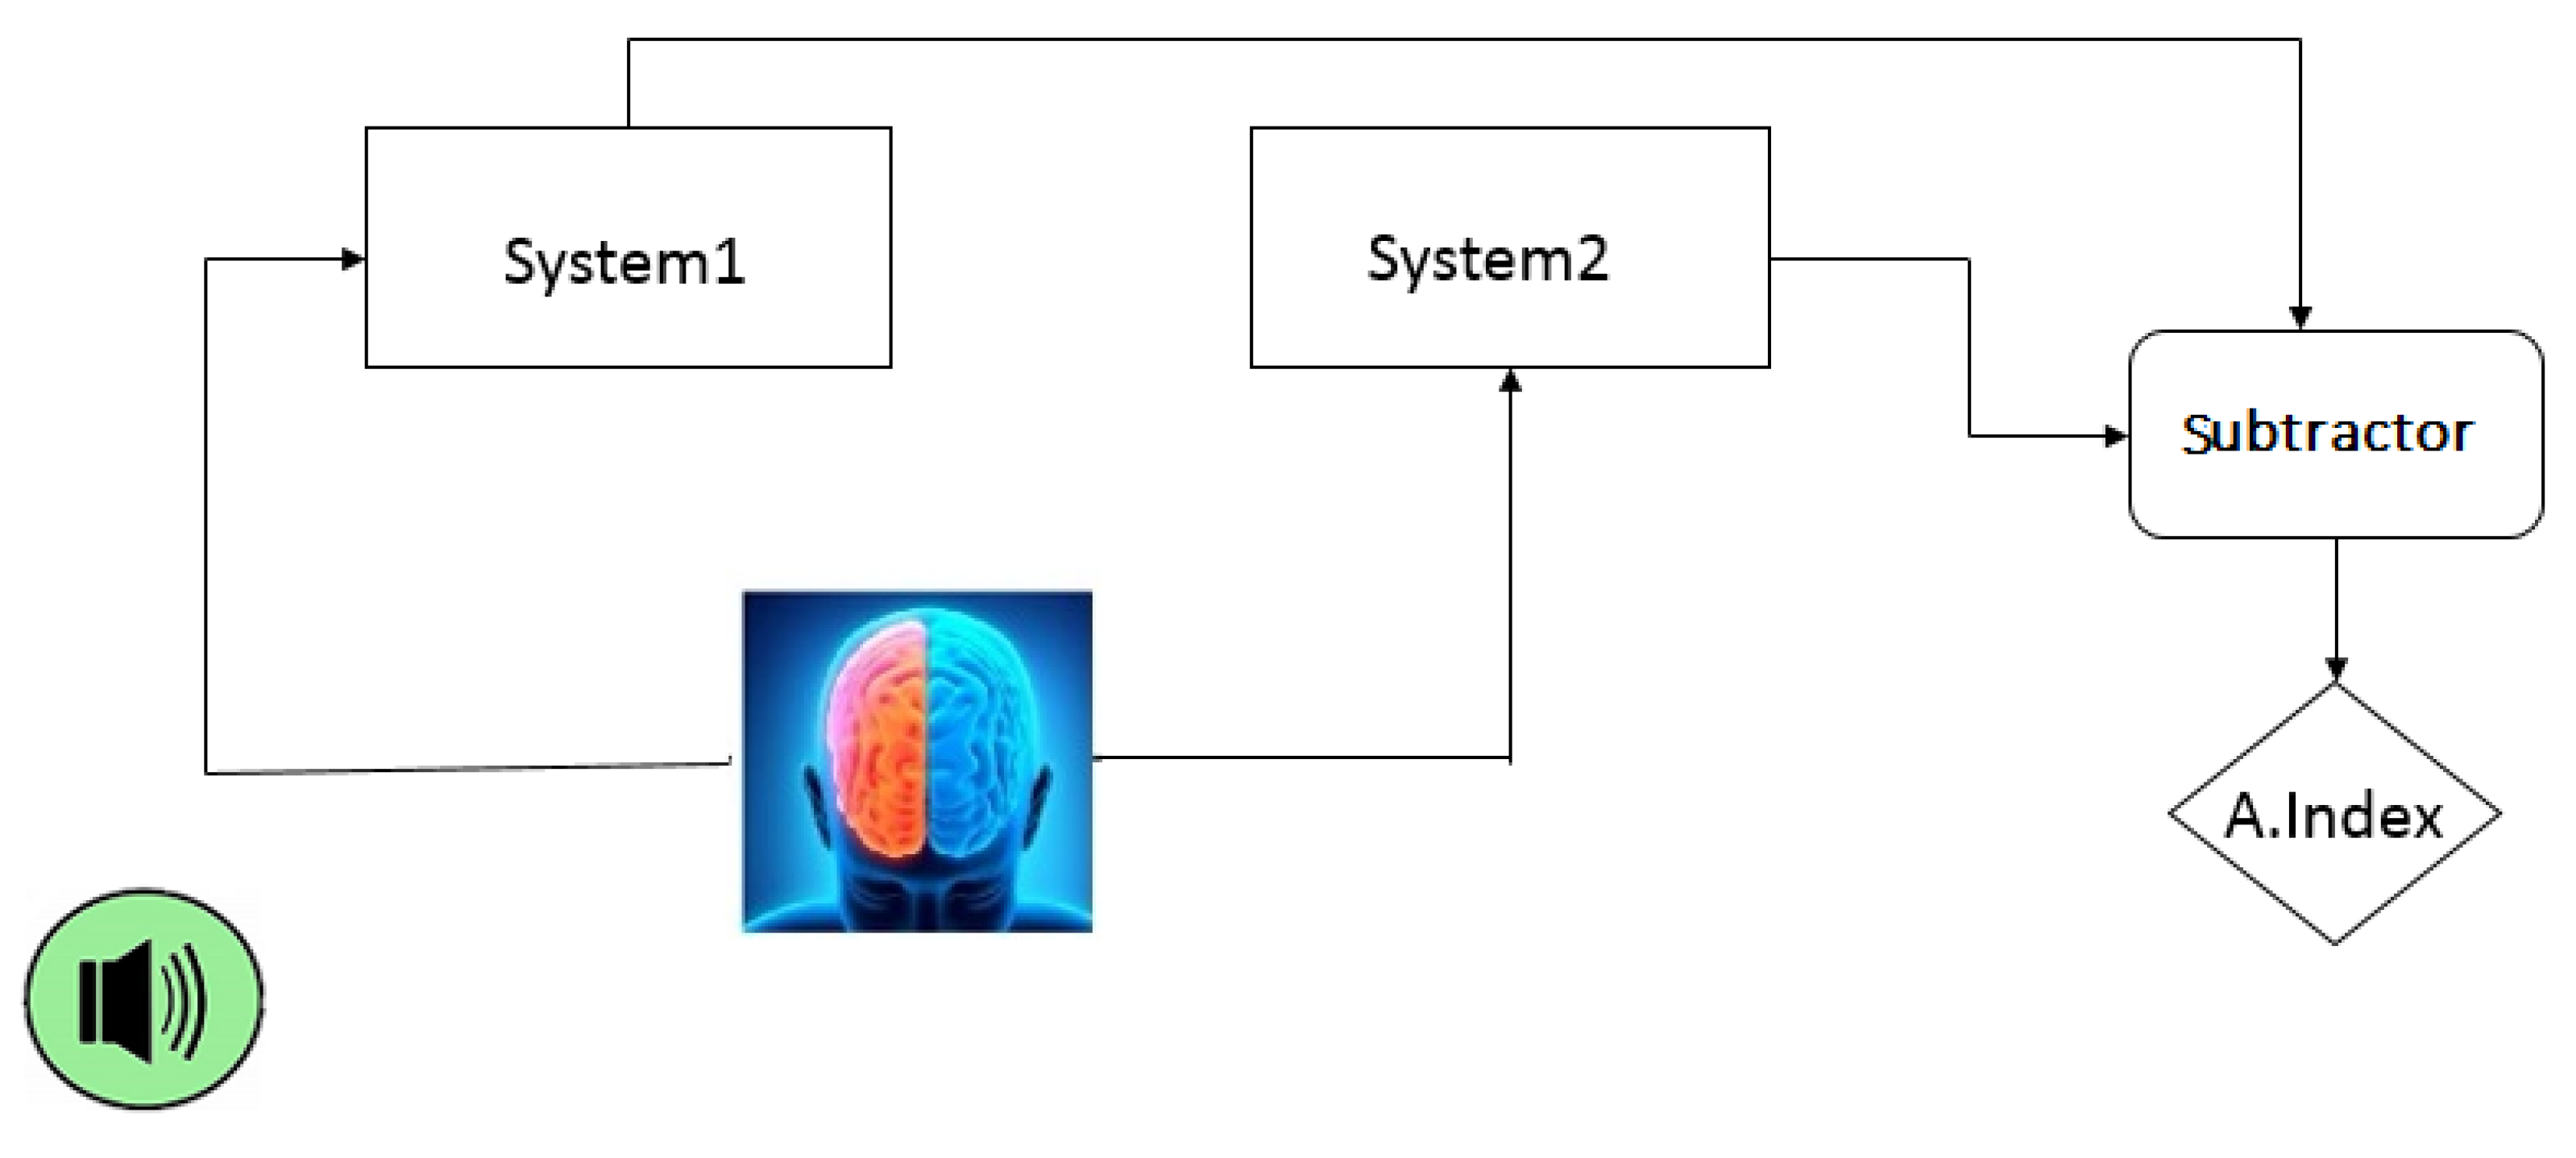
Figure 2.
Brouwer’s Recommendation R1-R6 adopted from [7]
Figure 2.
Brouwer’s Recommendation R1-R6 adopted from [7]
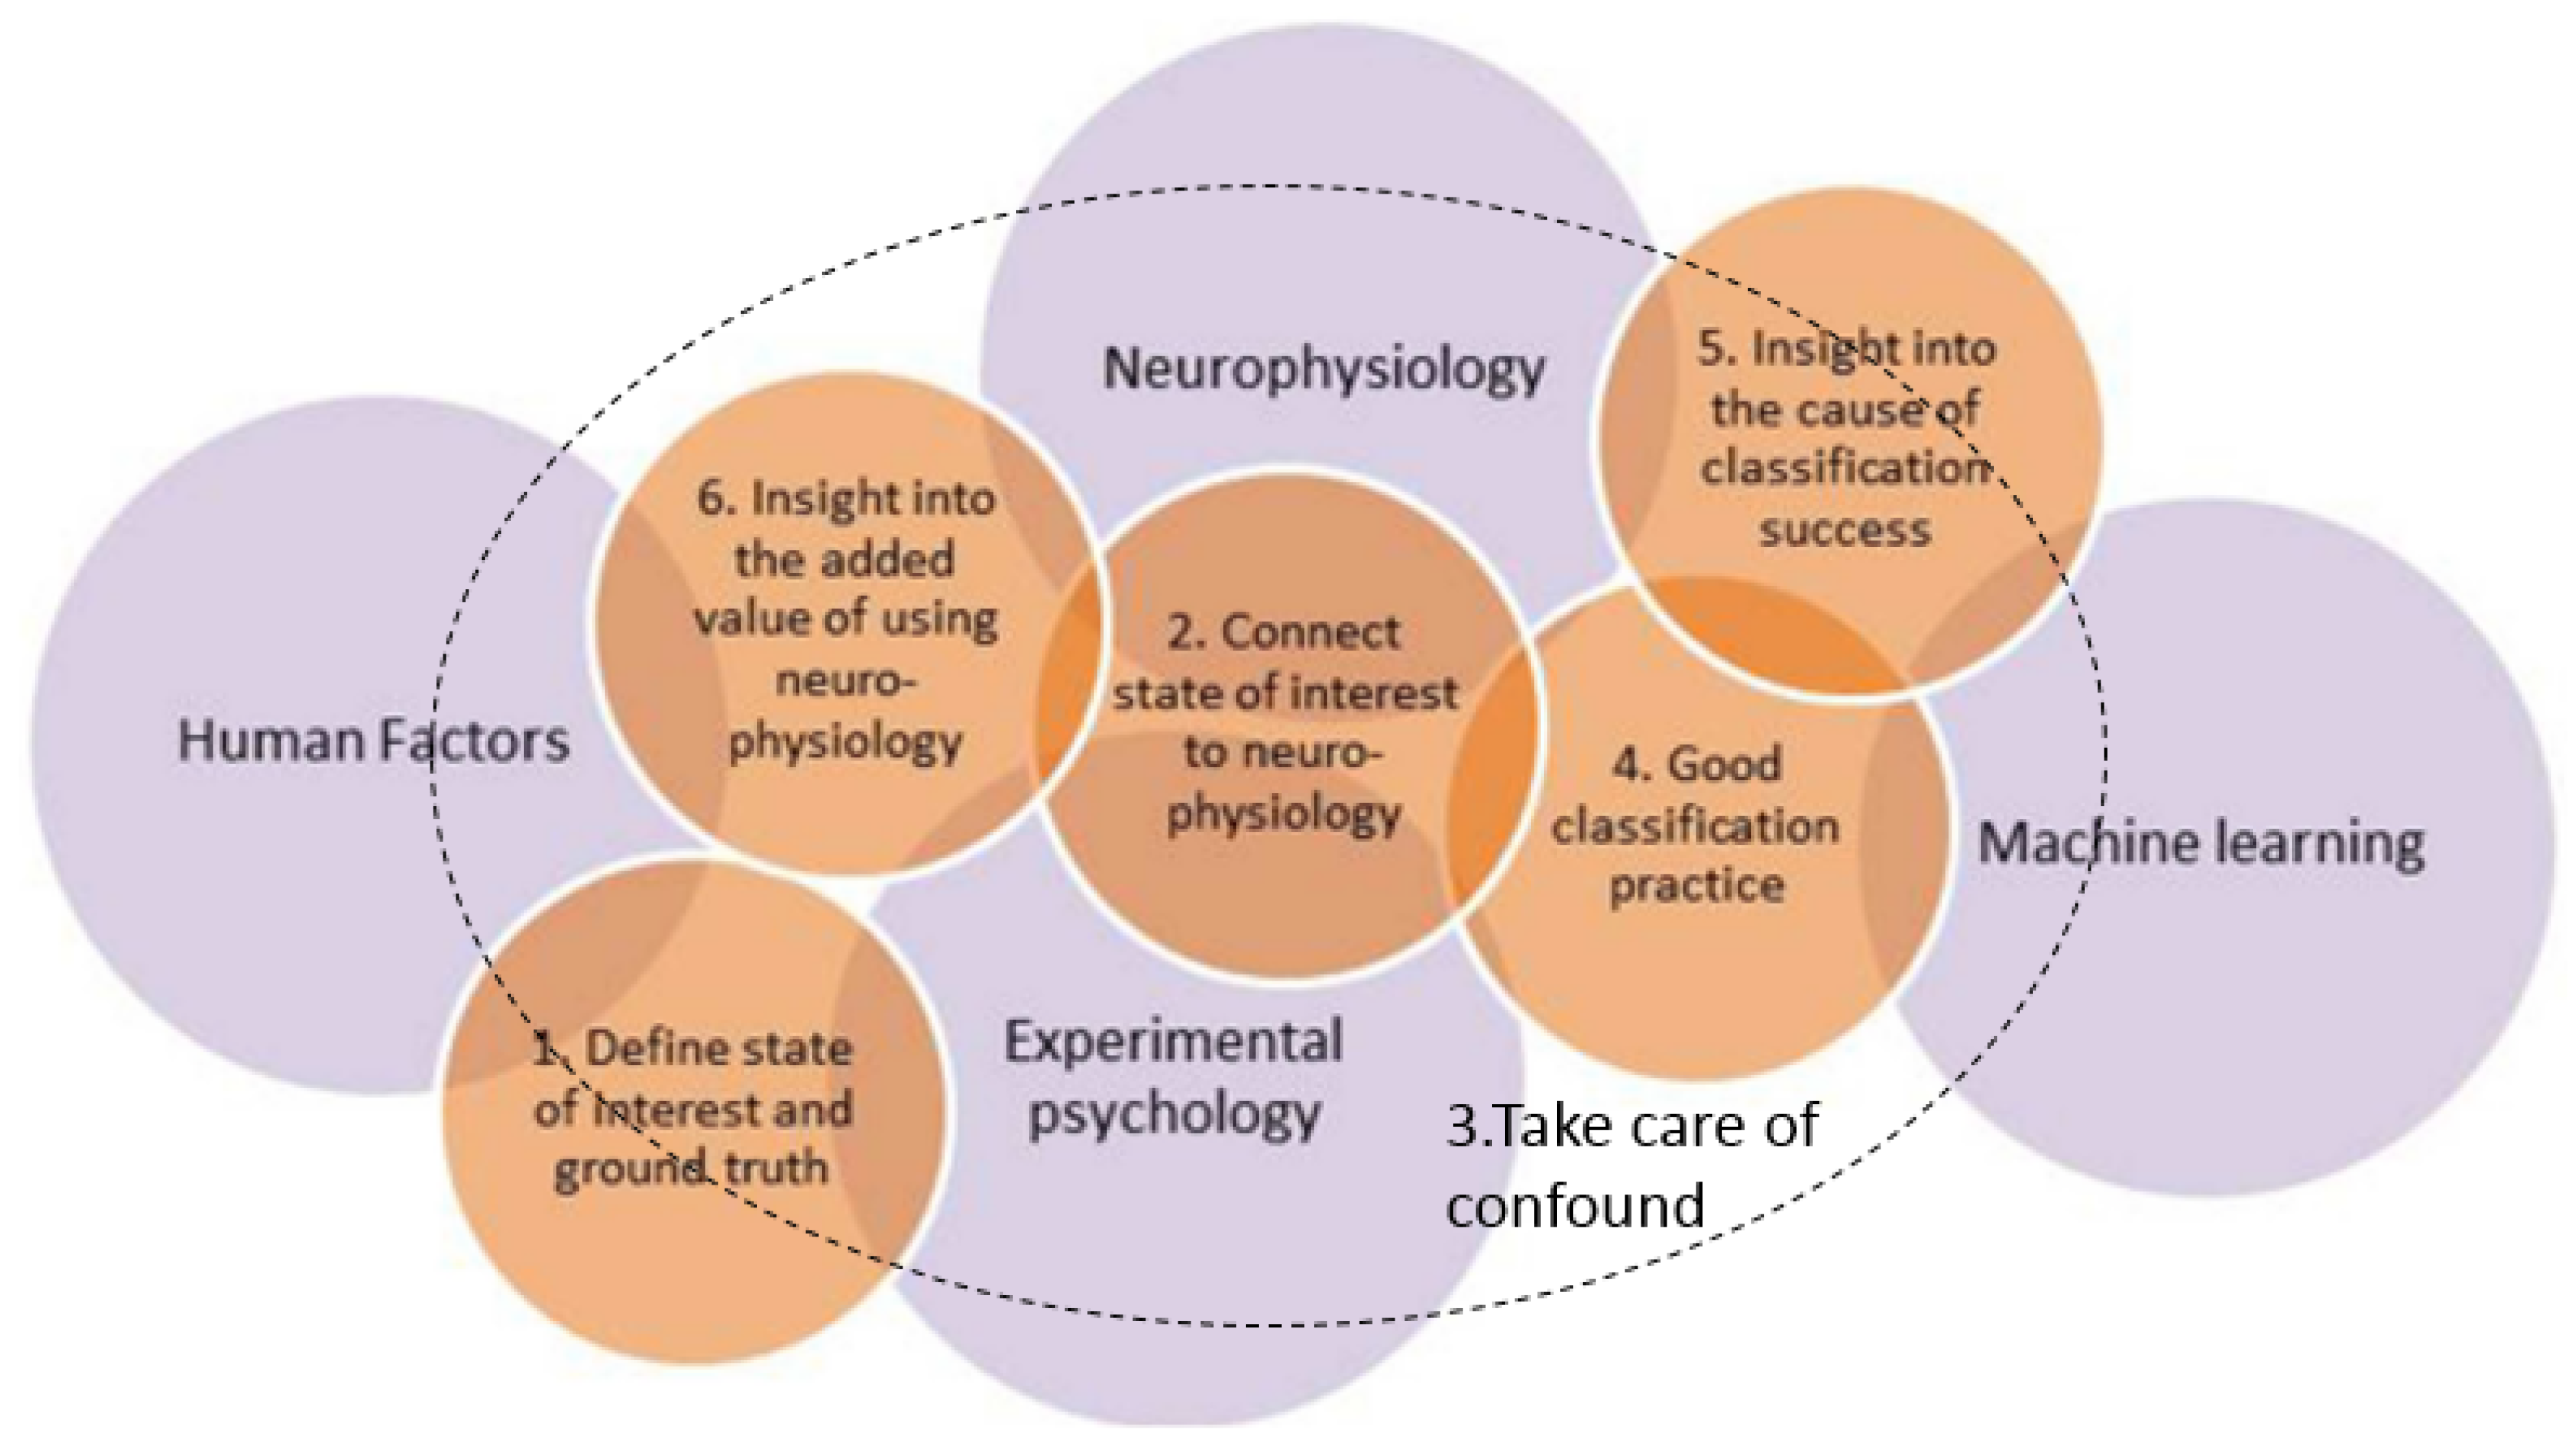
Figure 3.
Two dimensional emotion model.
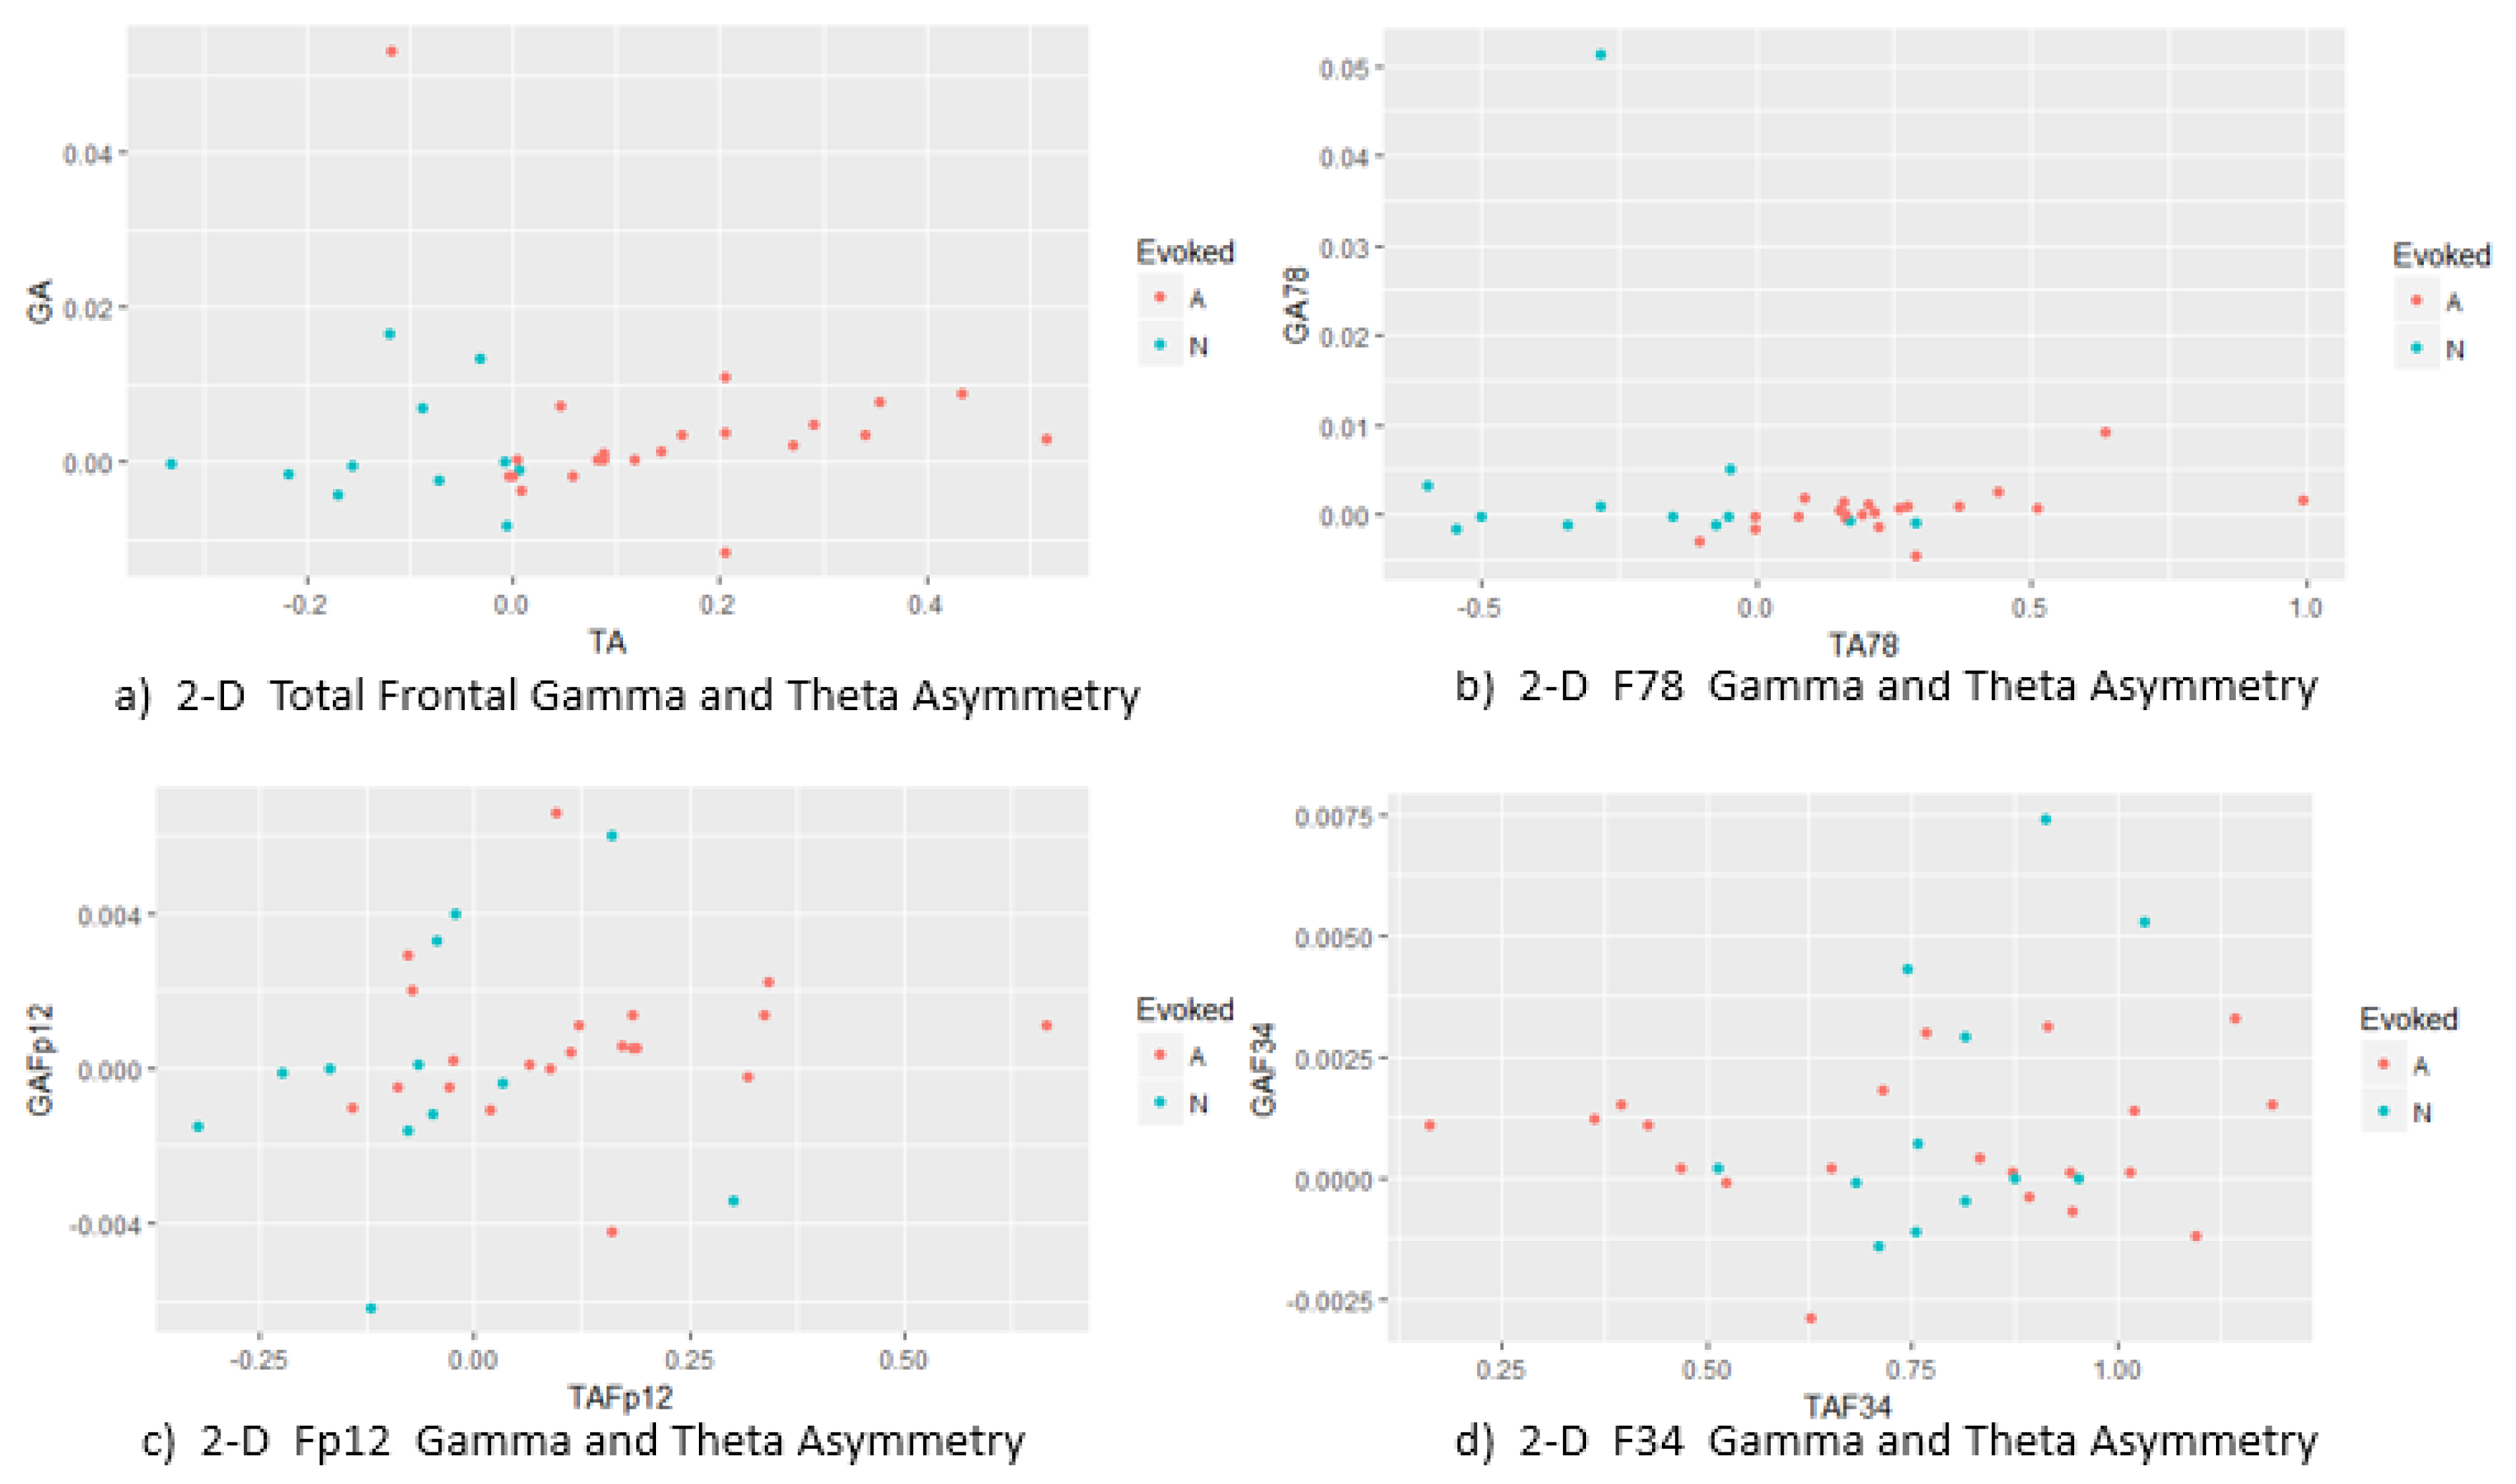
Figure 4.
classification using various kernel for total GT asymmetry.
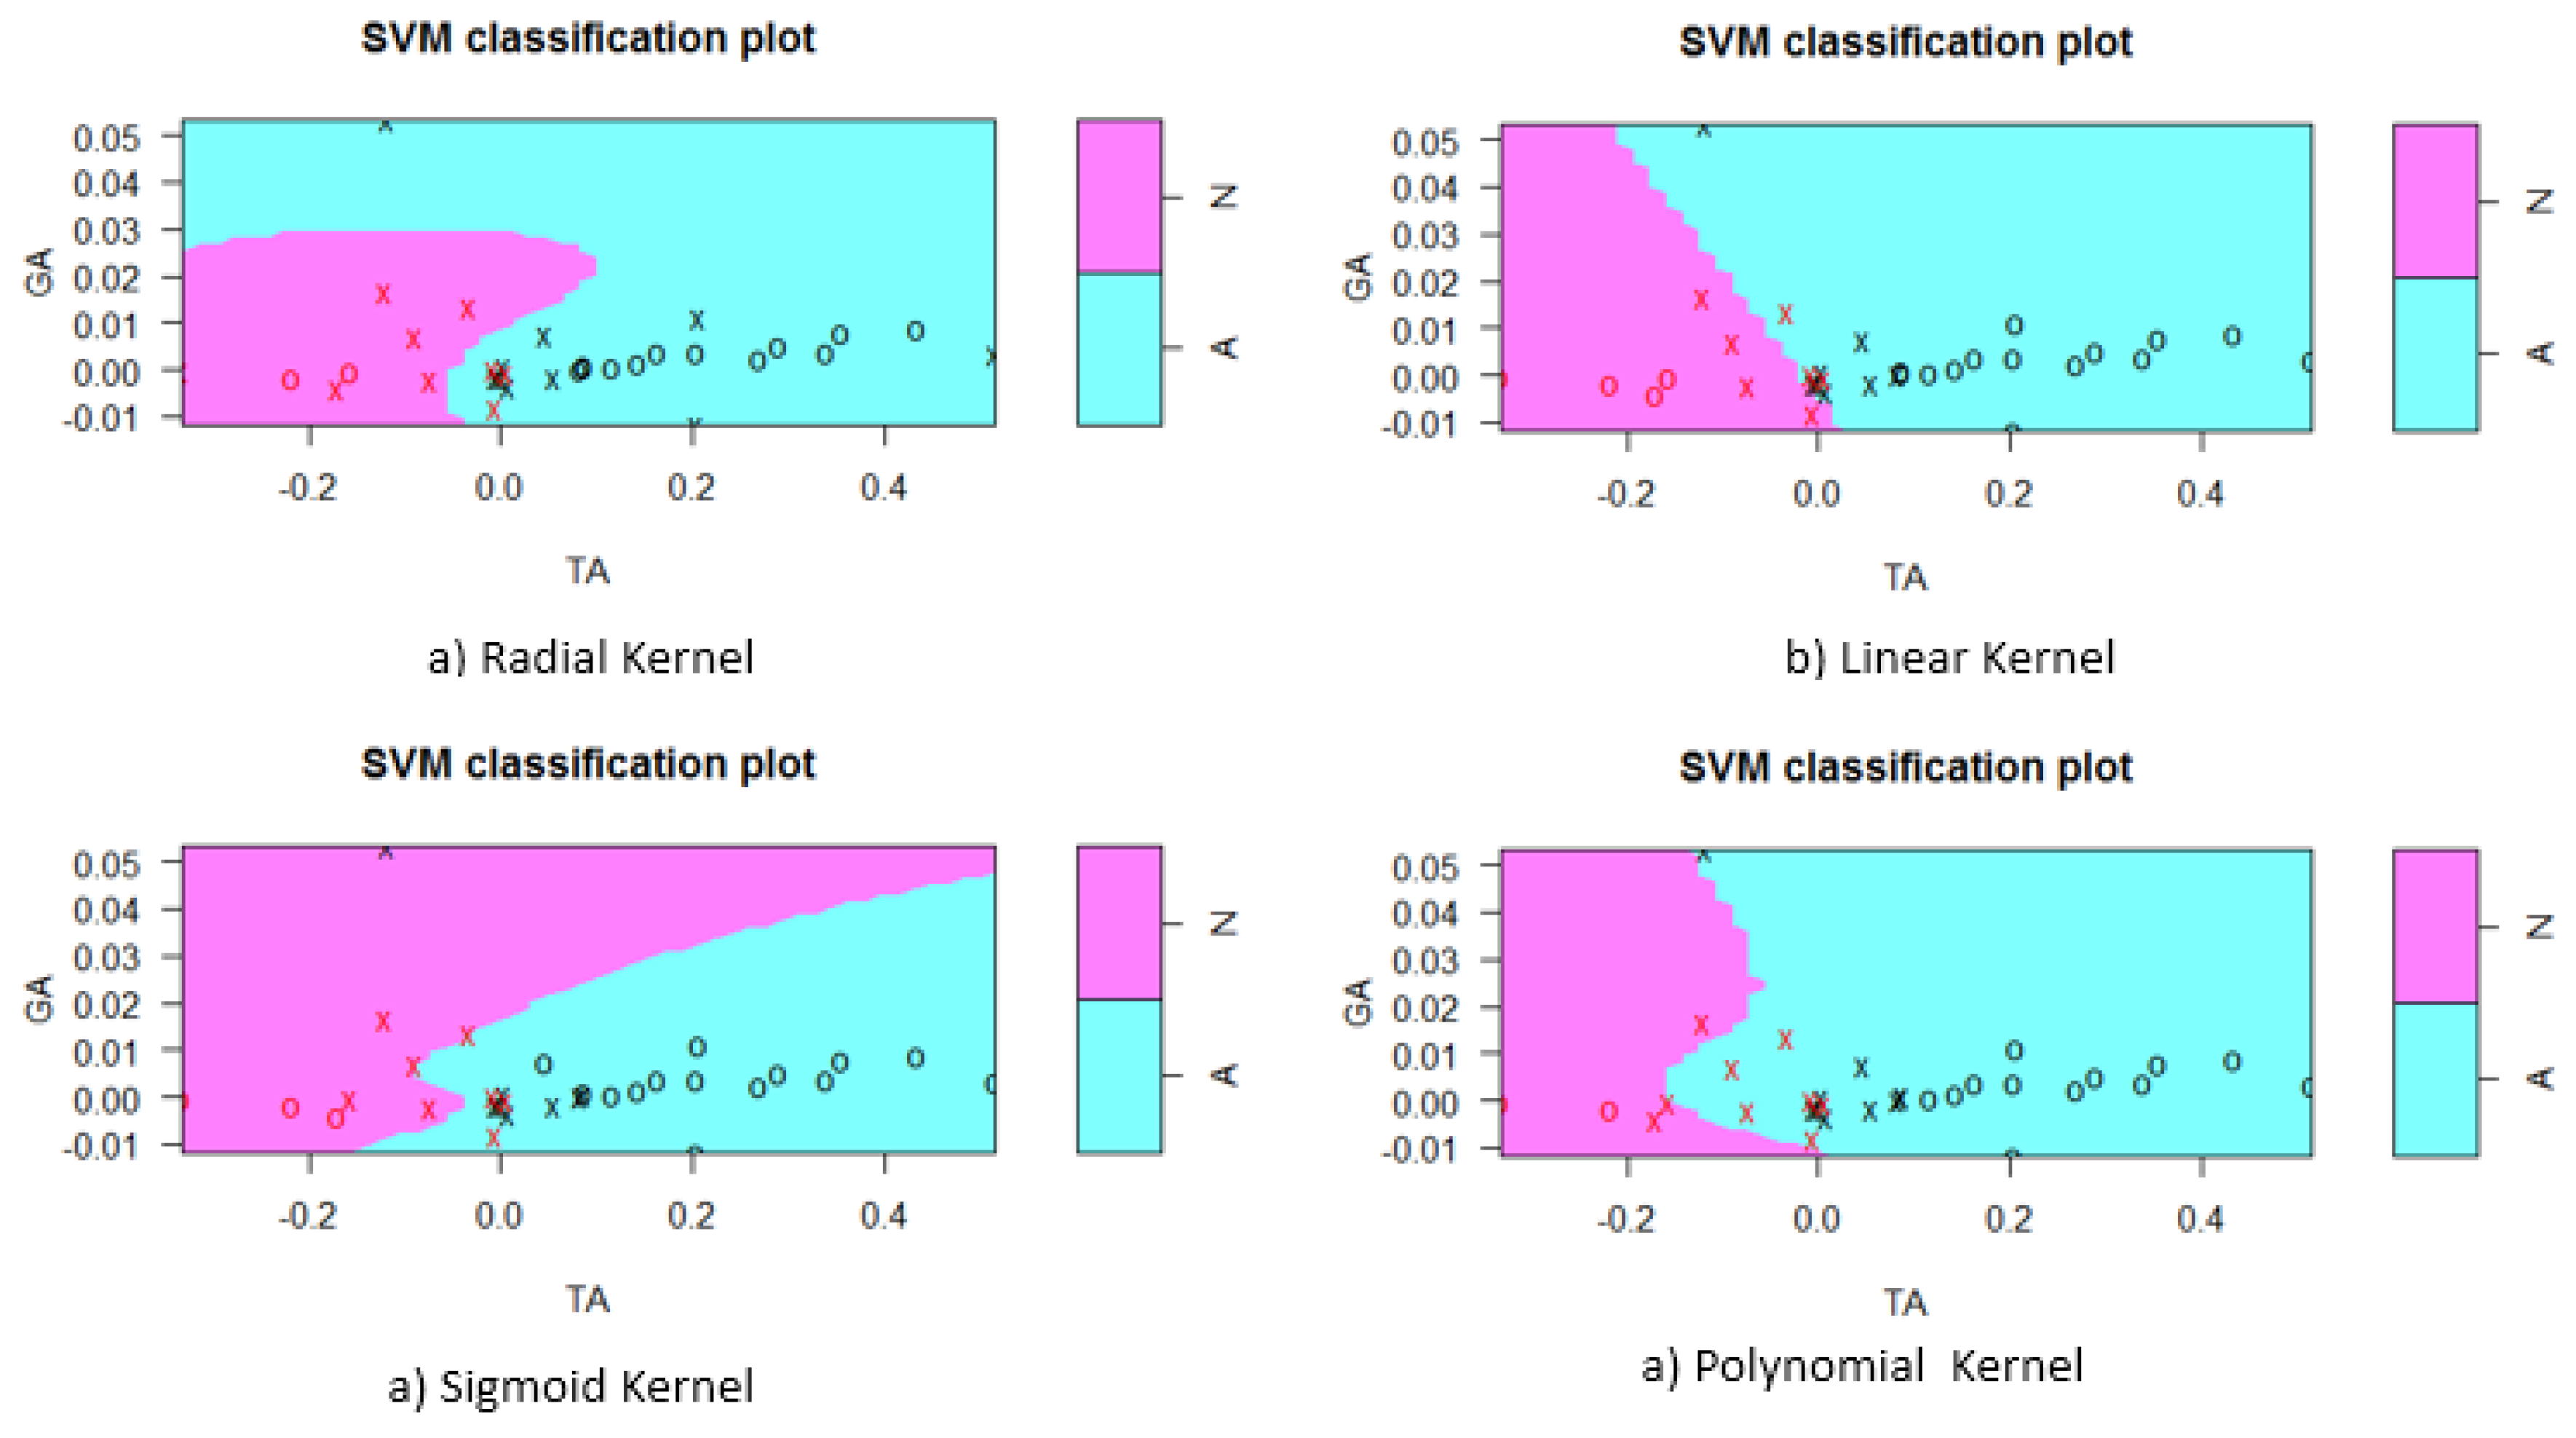
Figure 5.
classification using various kernel for total GT78 Asymmetry
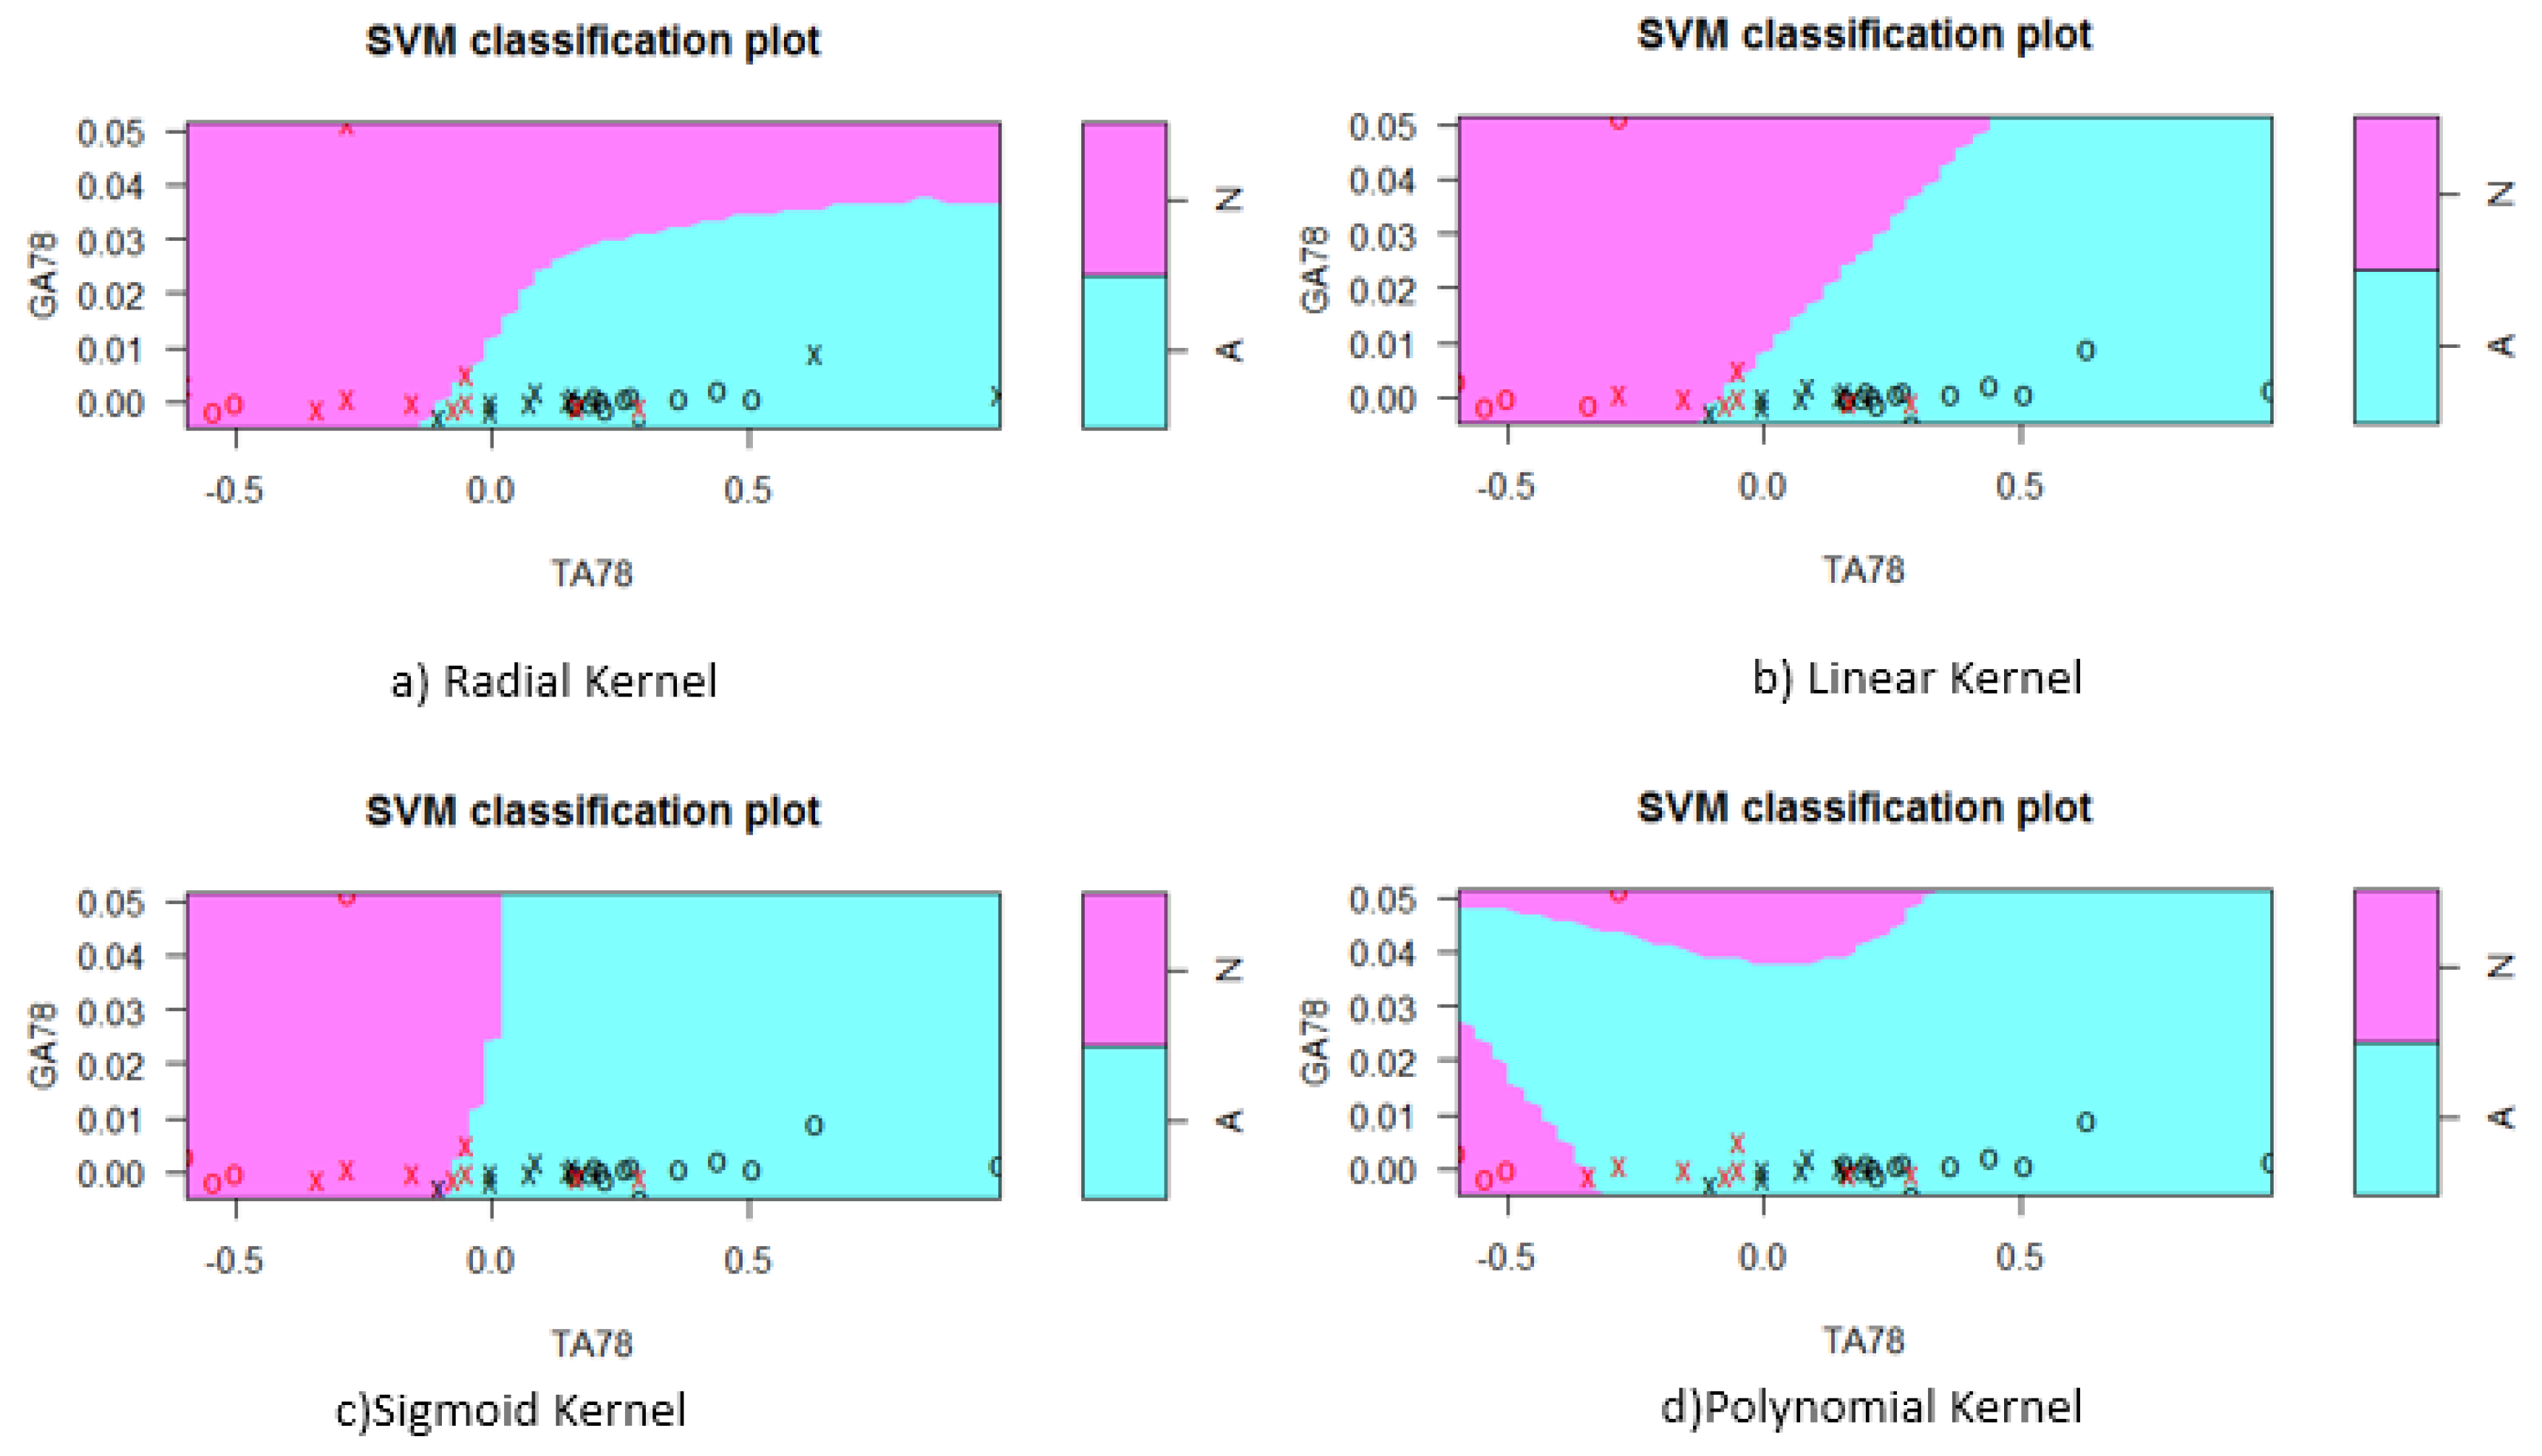
Figure 6.
classification using various kernel for GT34 Asymmetry
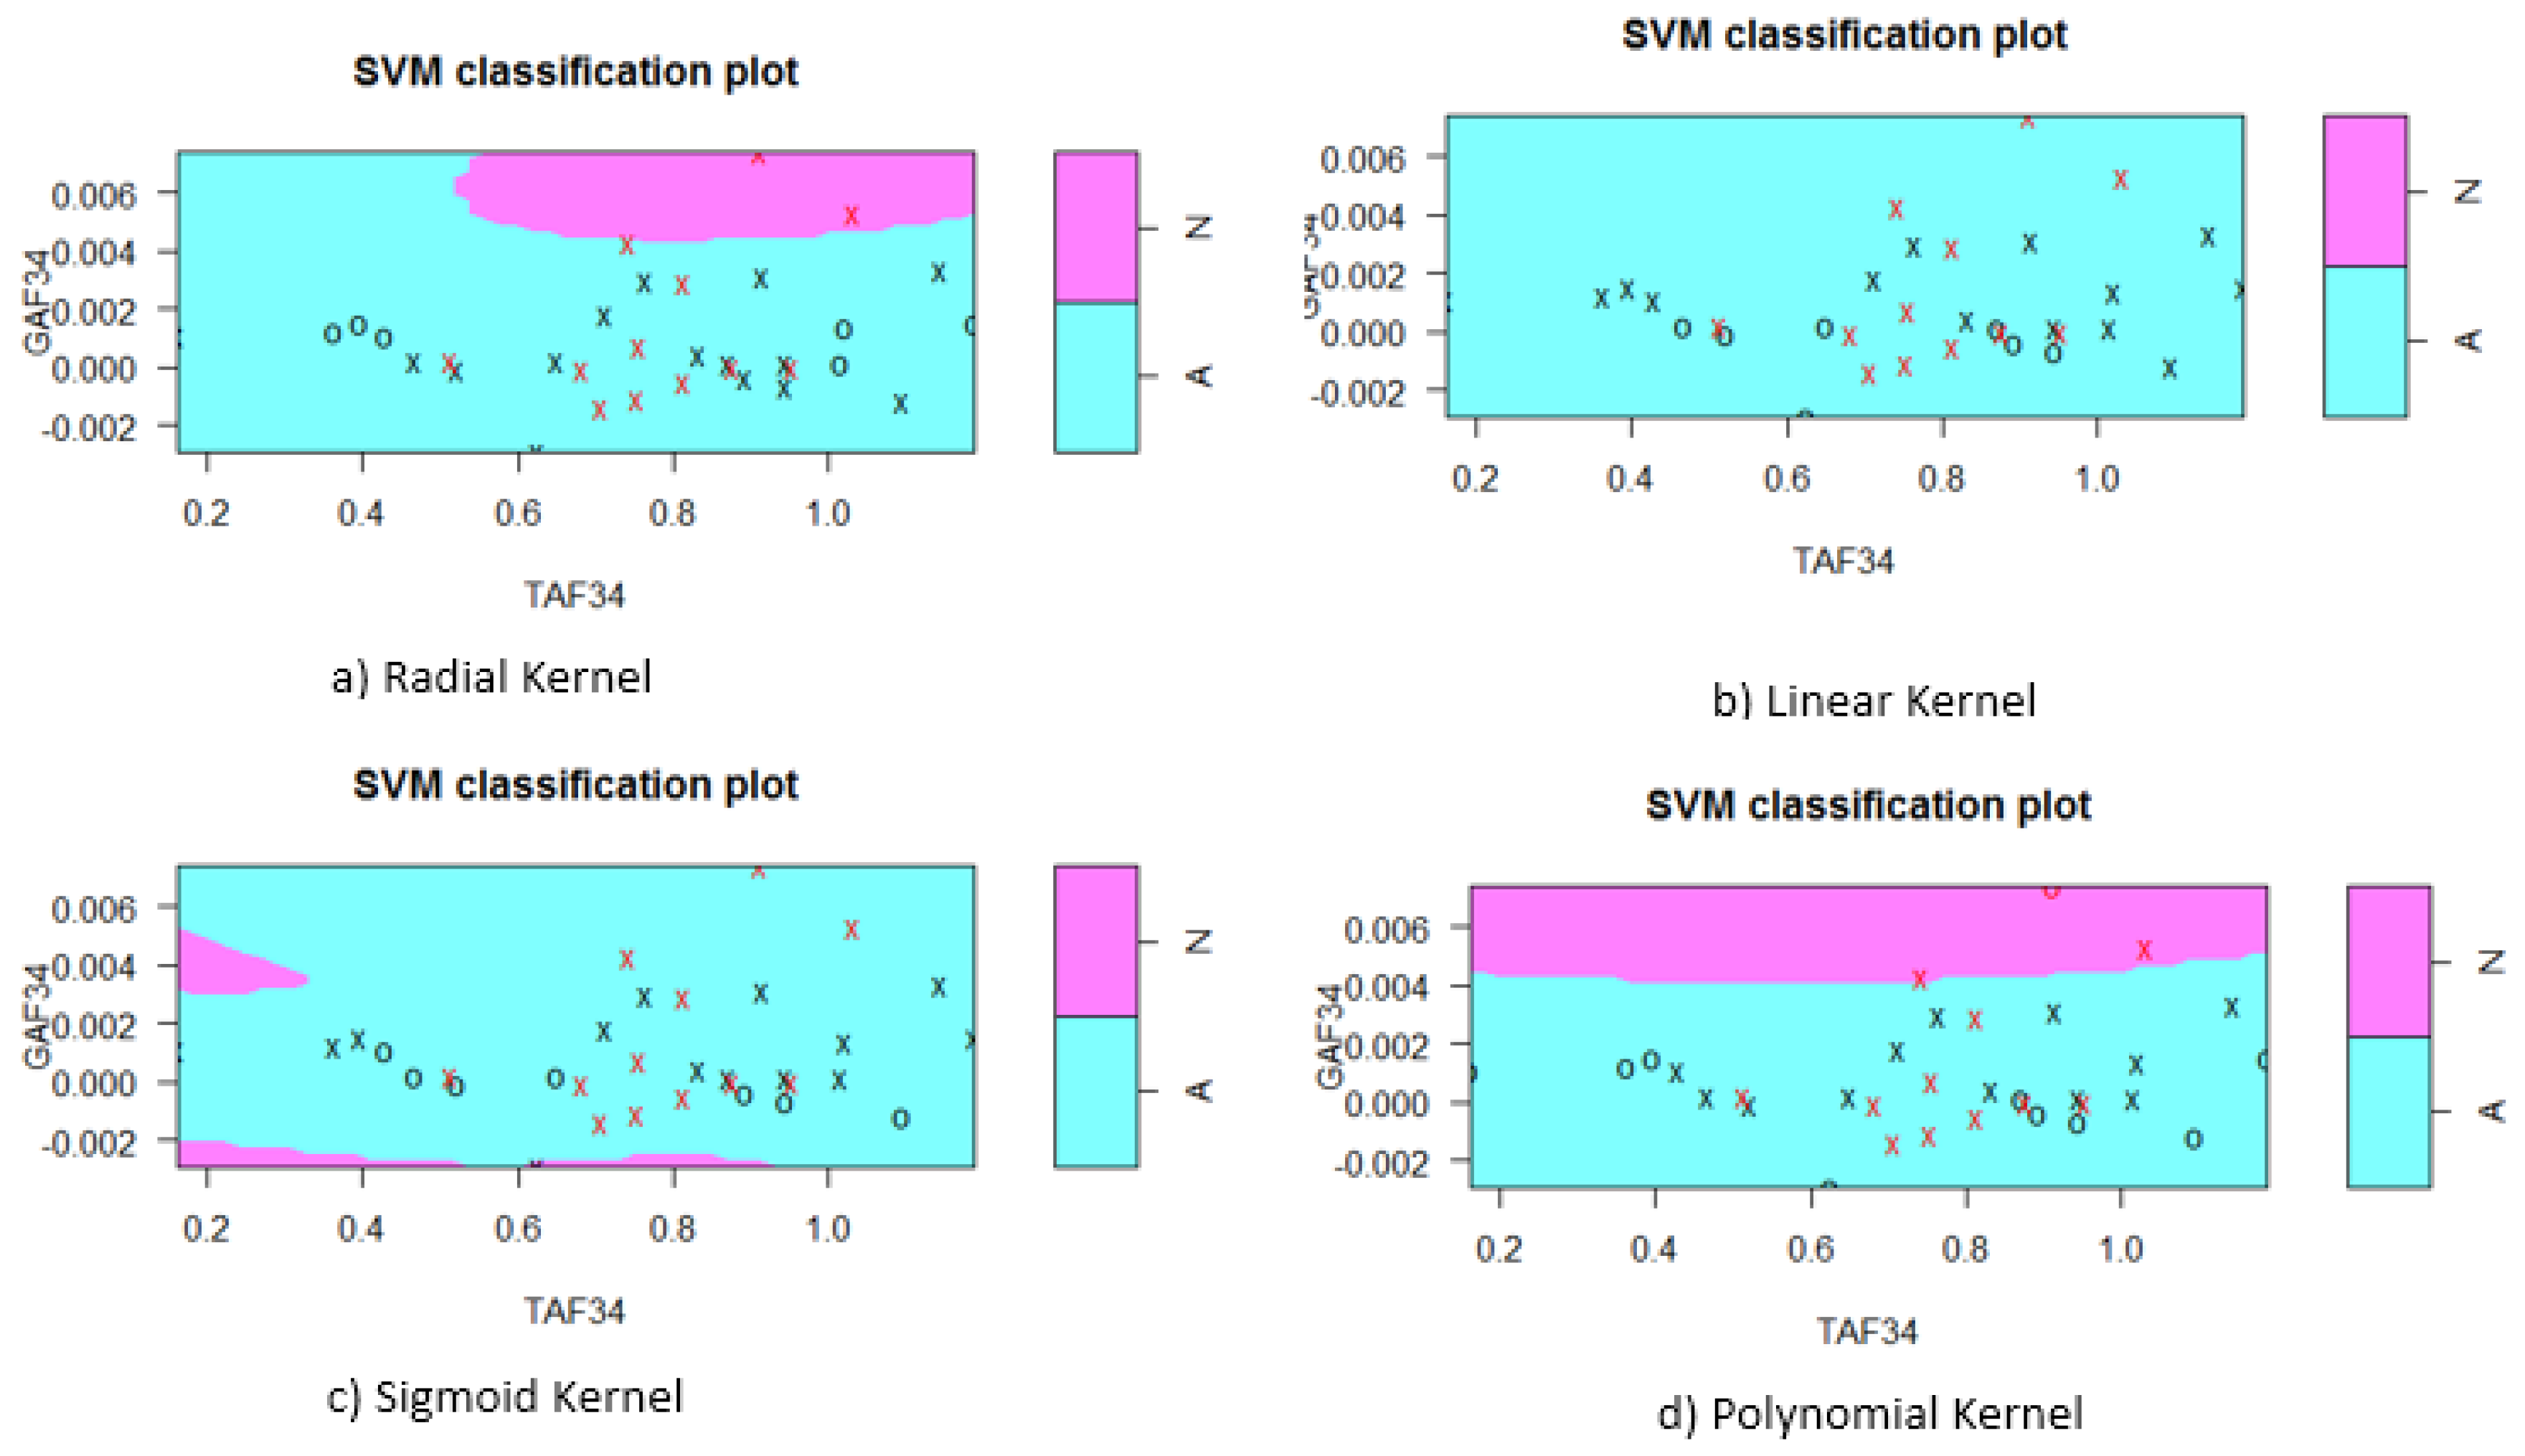
Figure 7.
Classification using various kernel for GTFp12 Asymmetry.
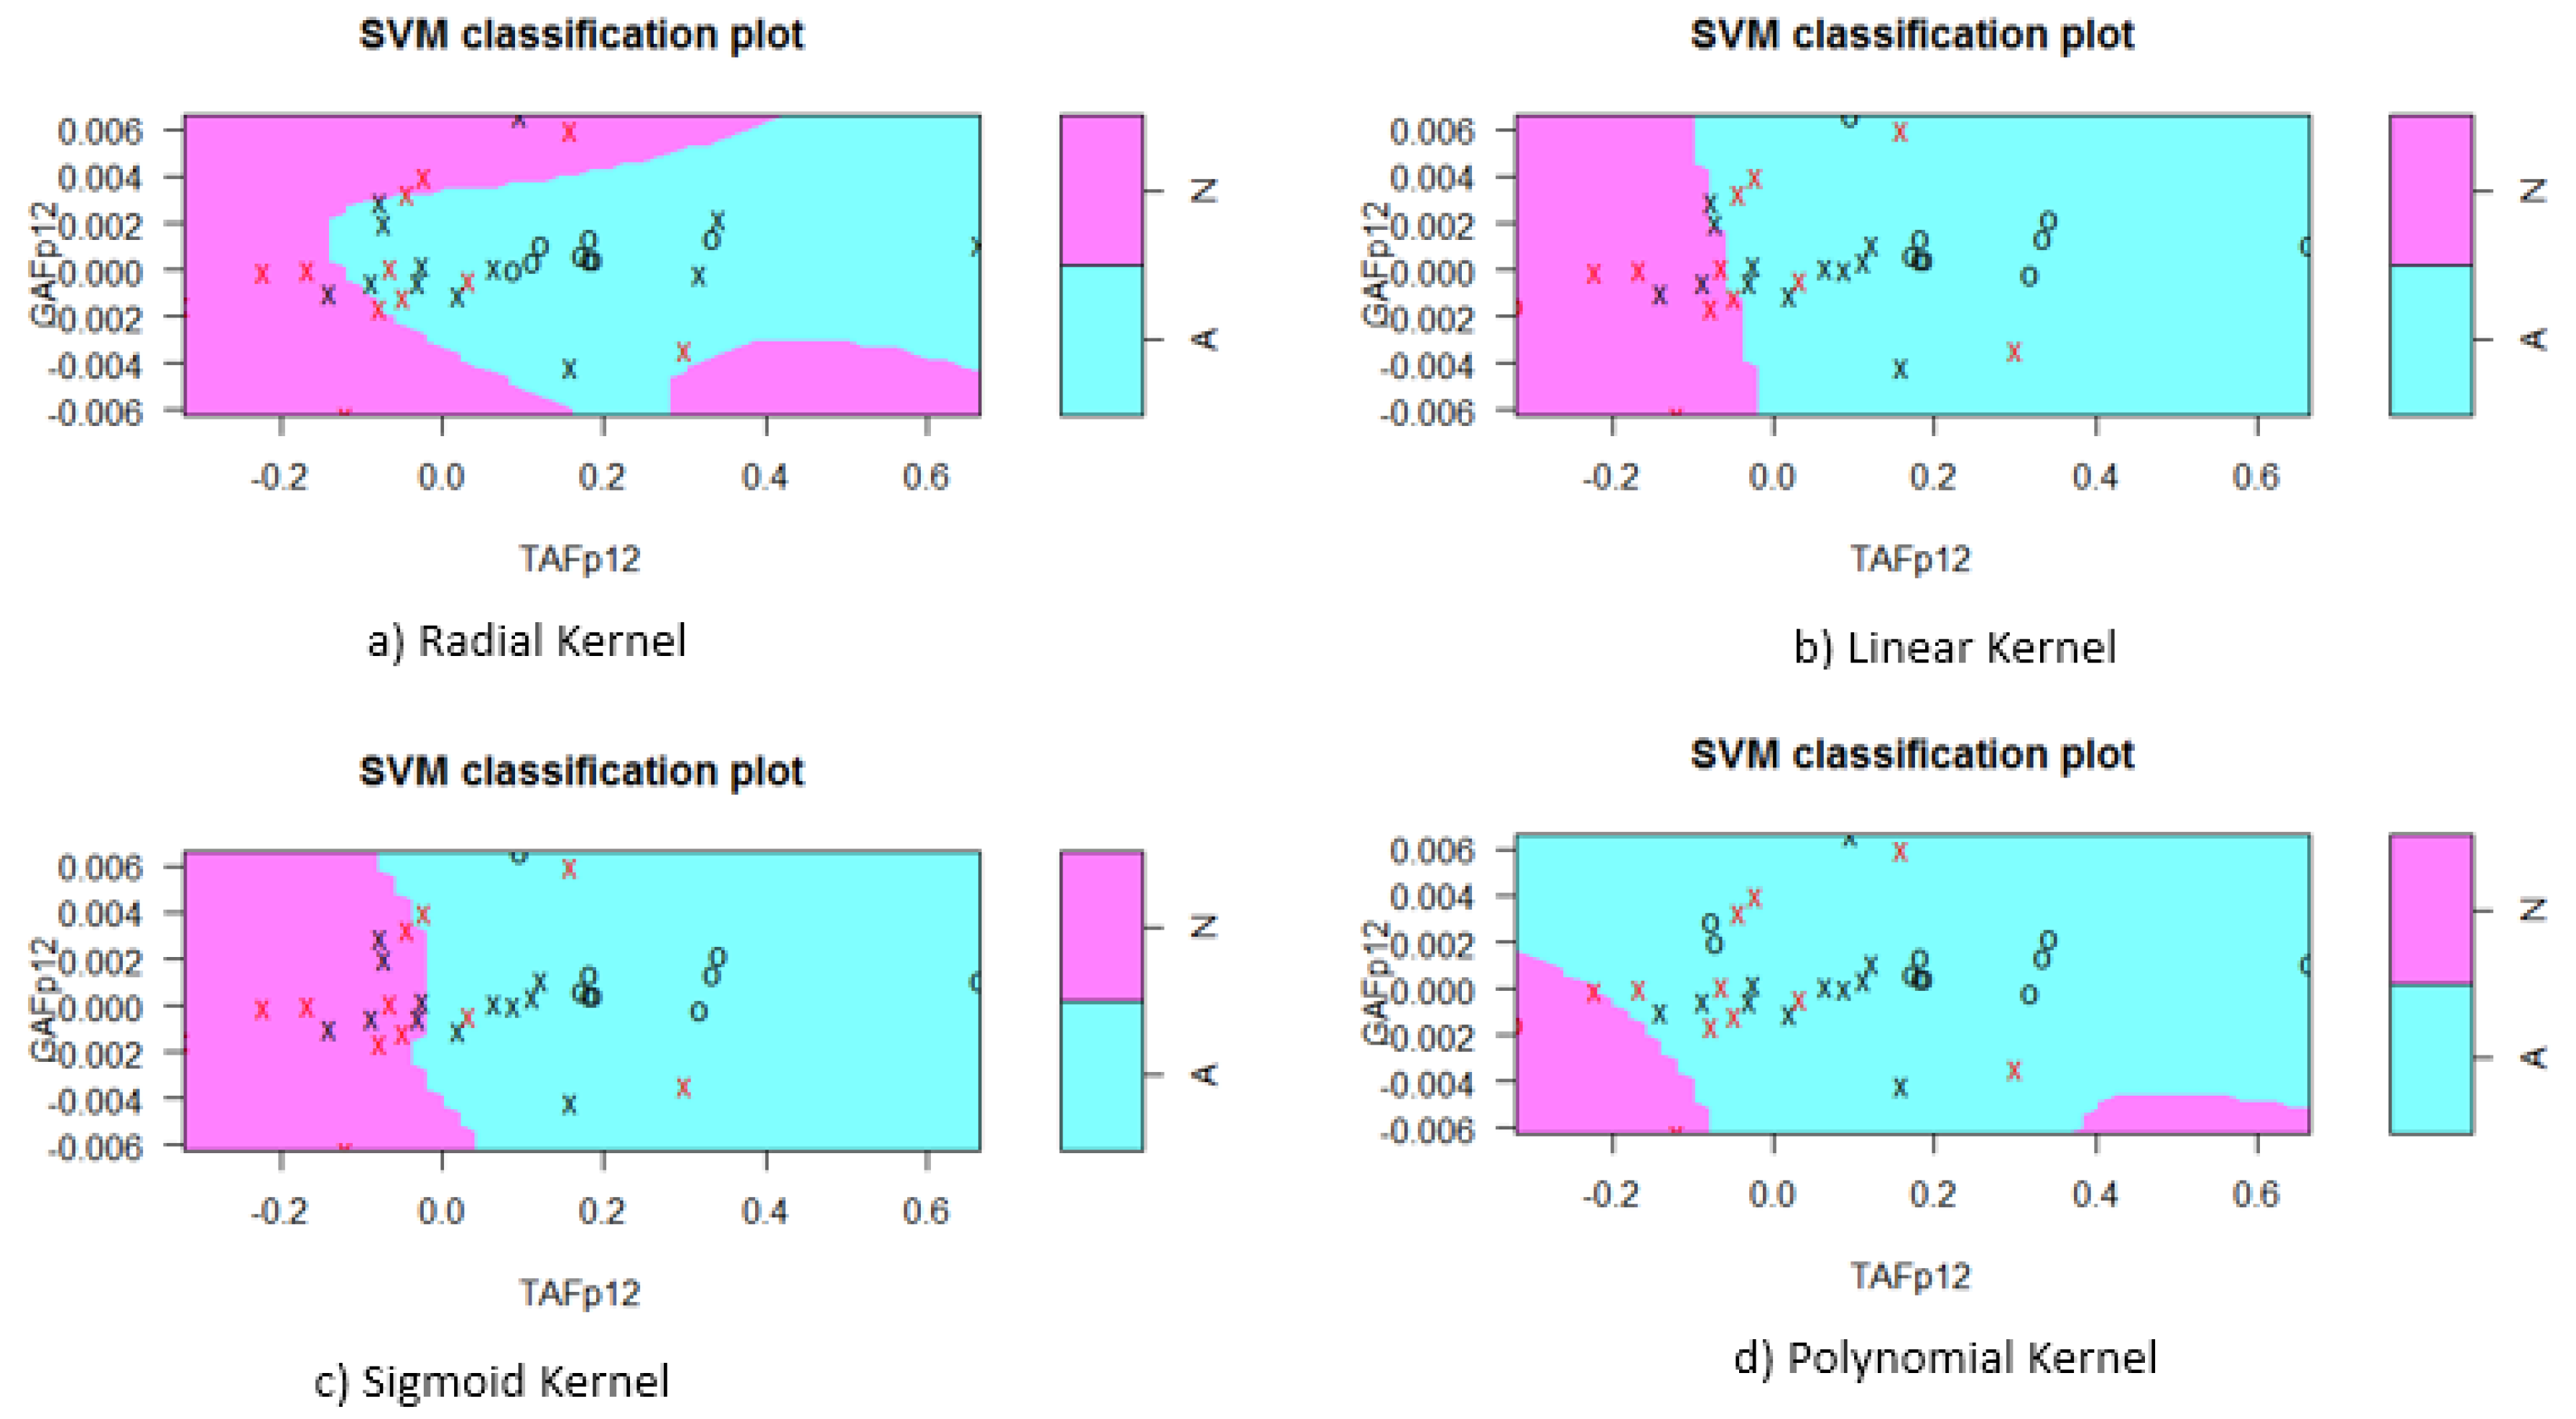
Figure 8.
Performance of Model.
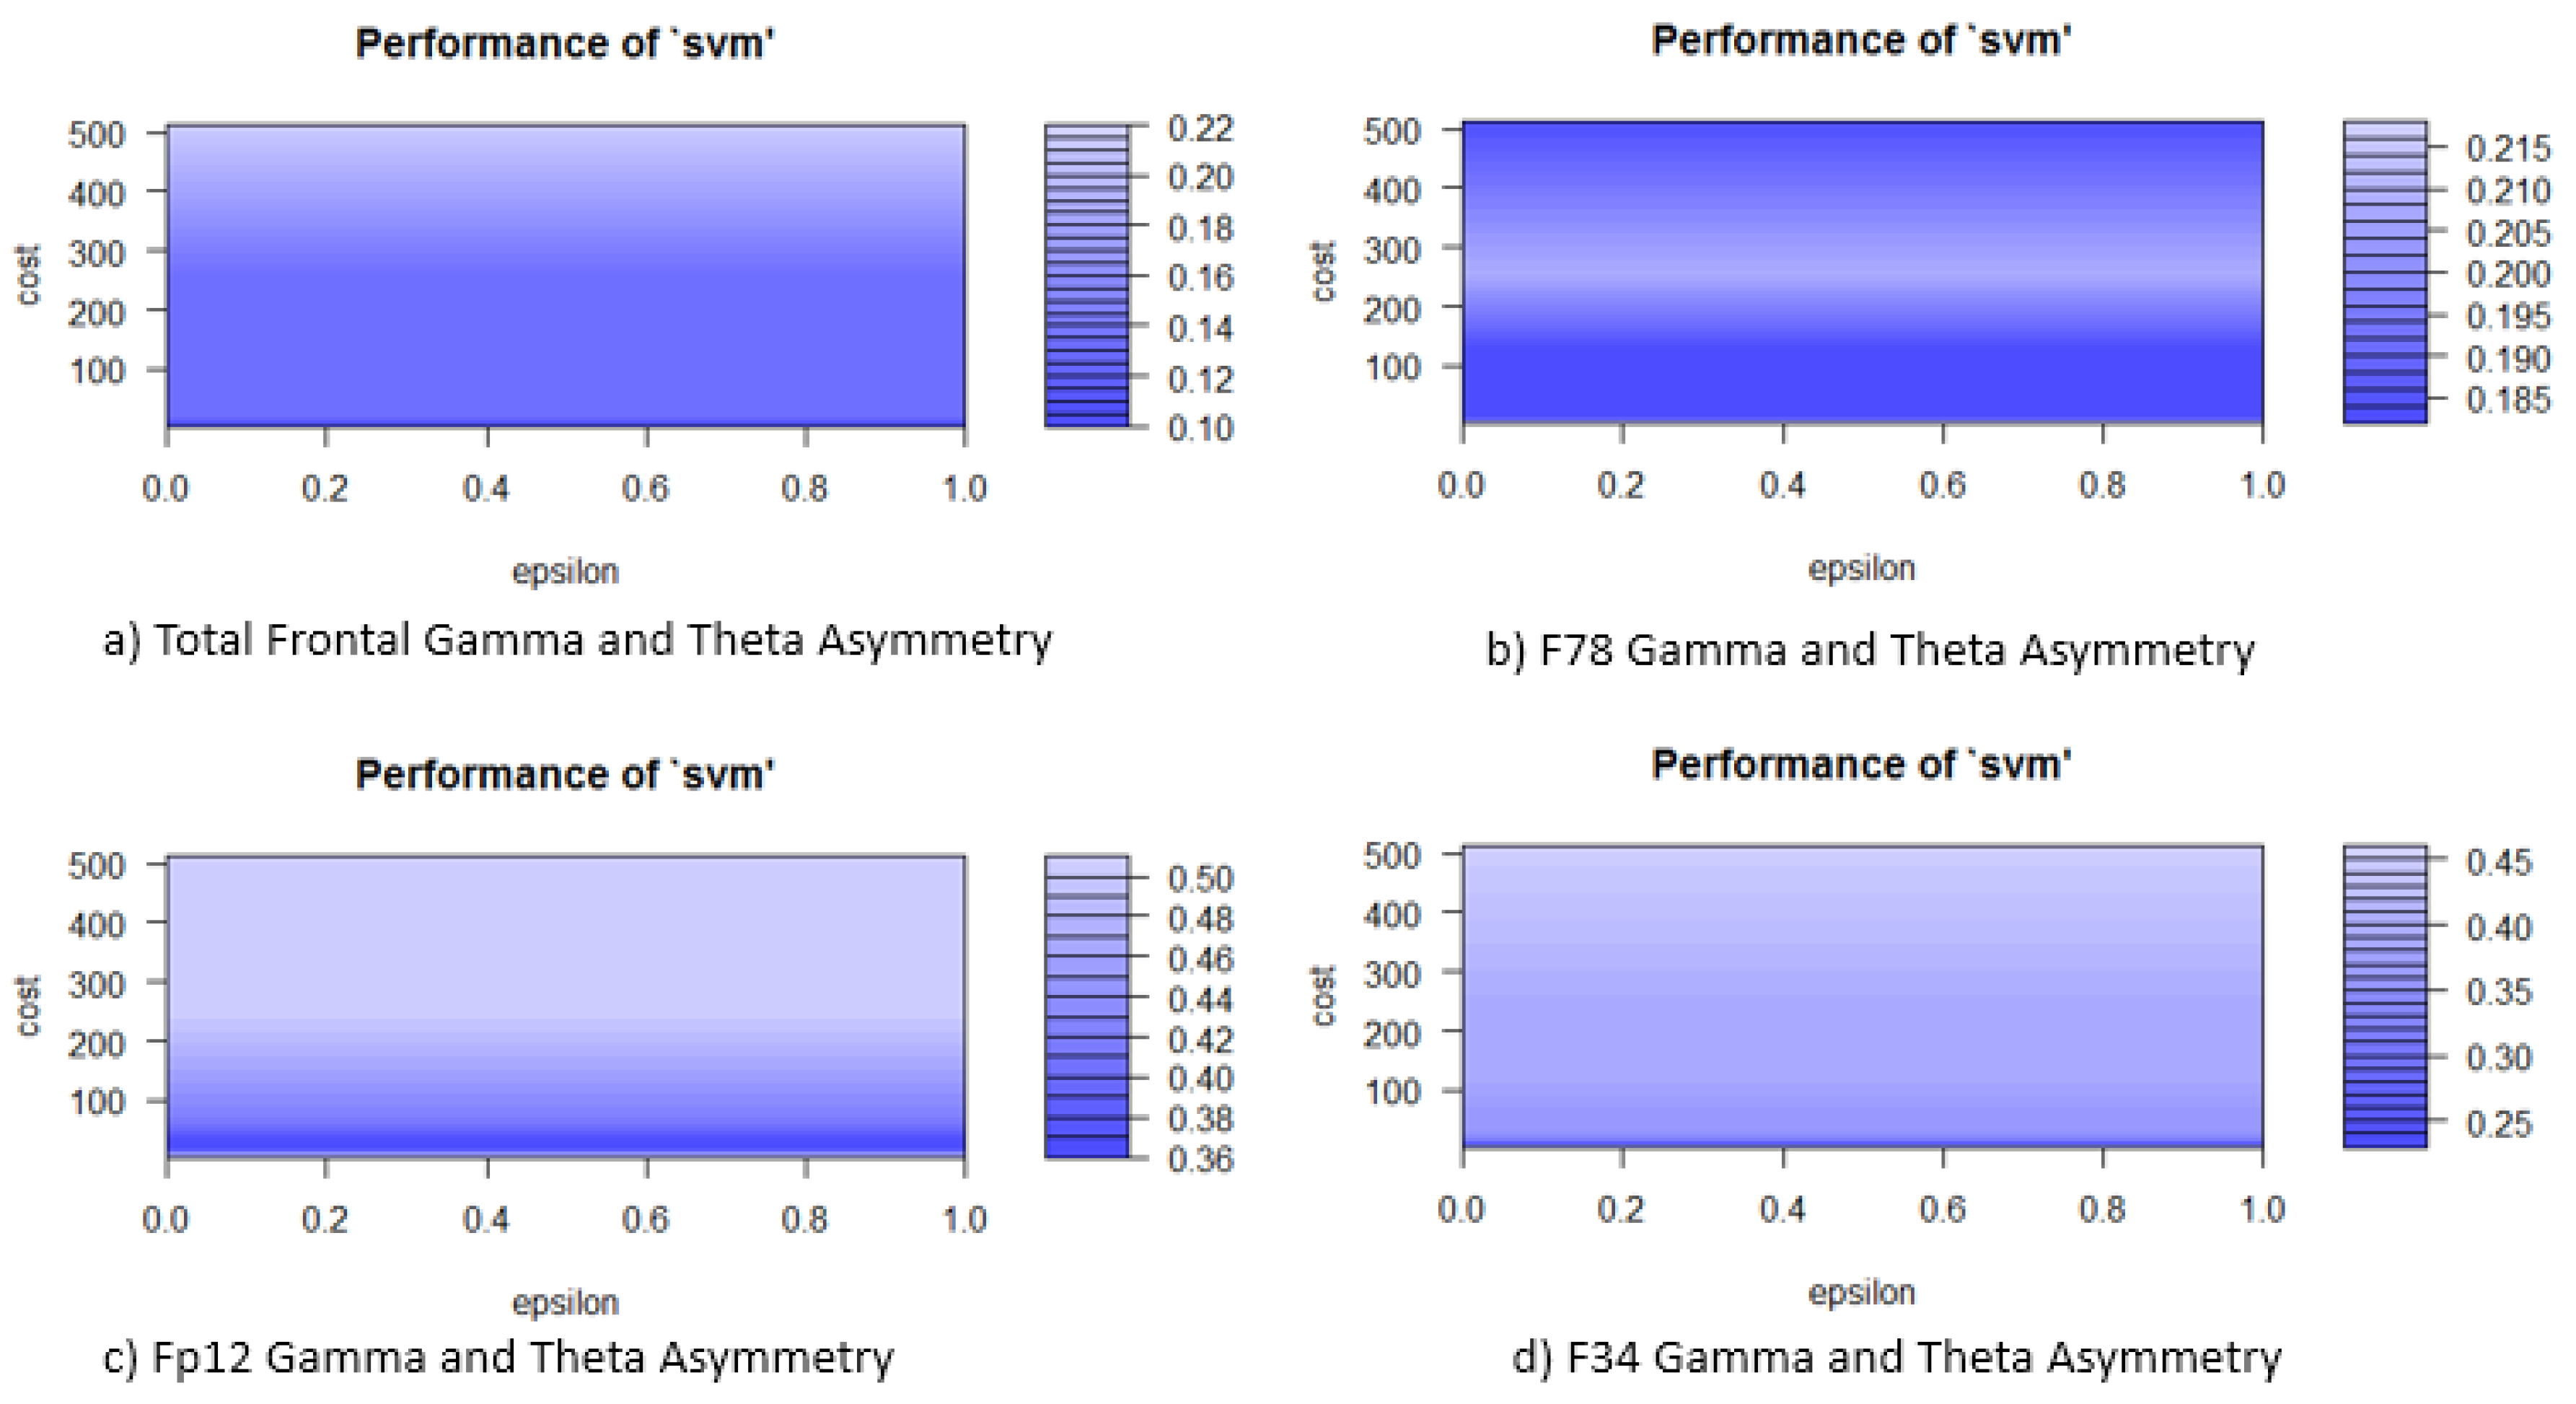
Figure 9.
ROC of Gamma Theta asymmetry a) Total b) GT78 c)GT34 d)GTFp12
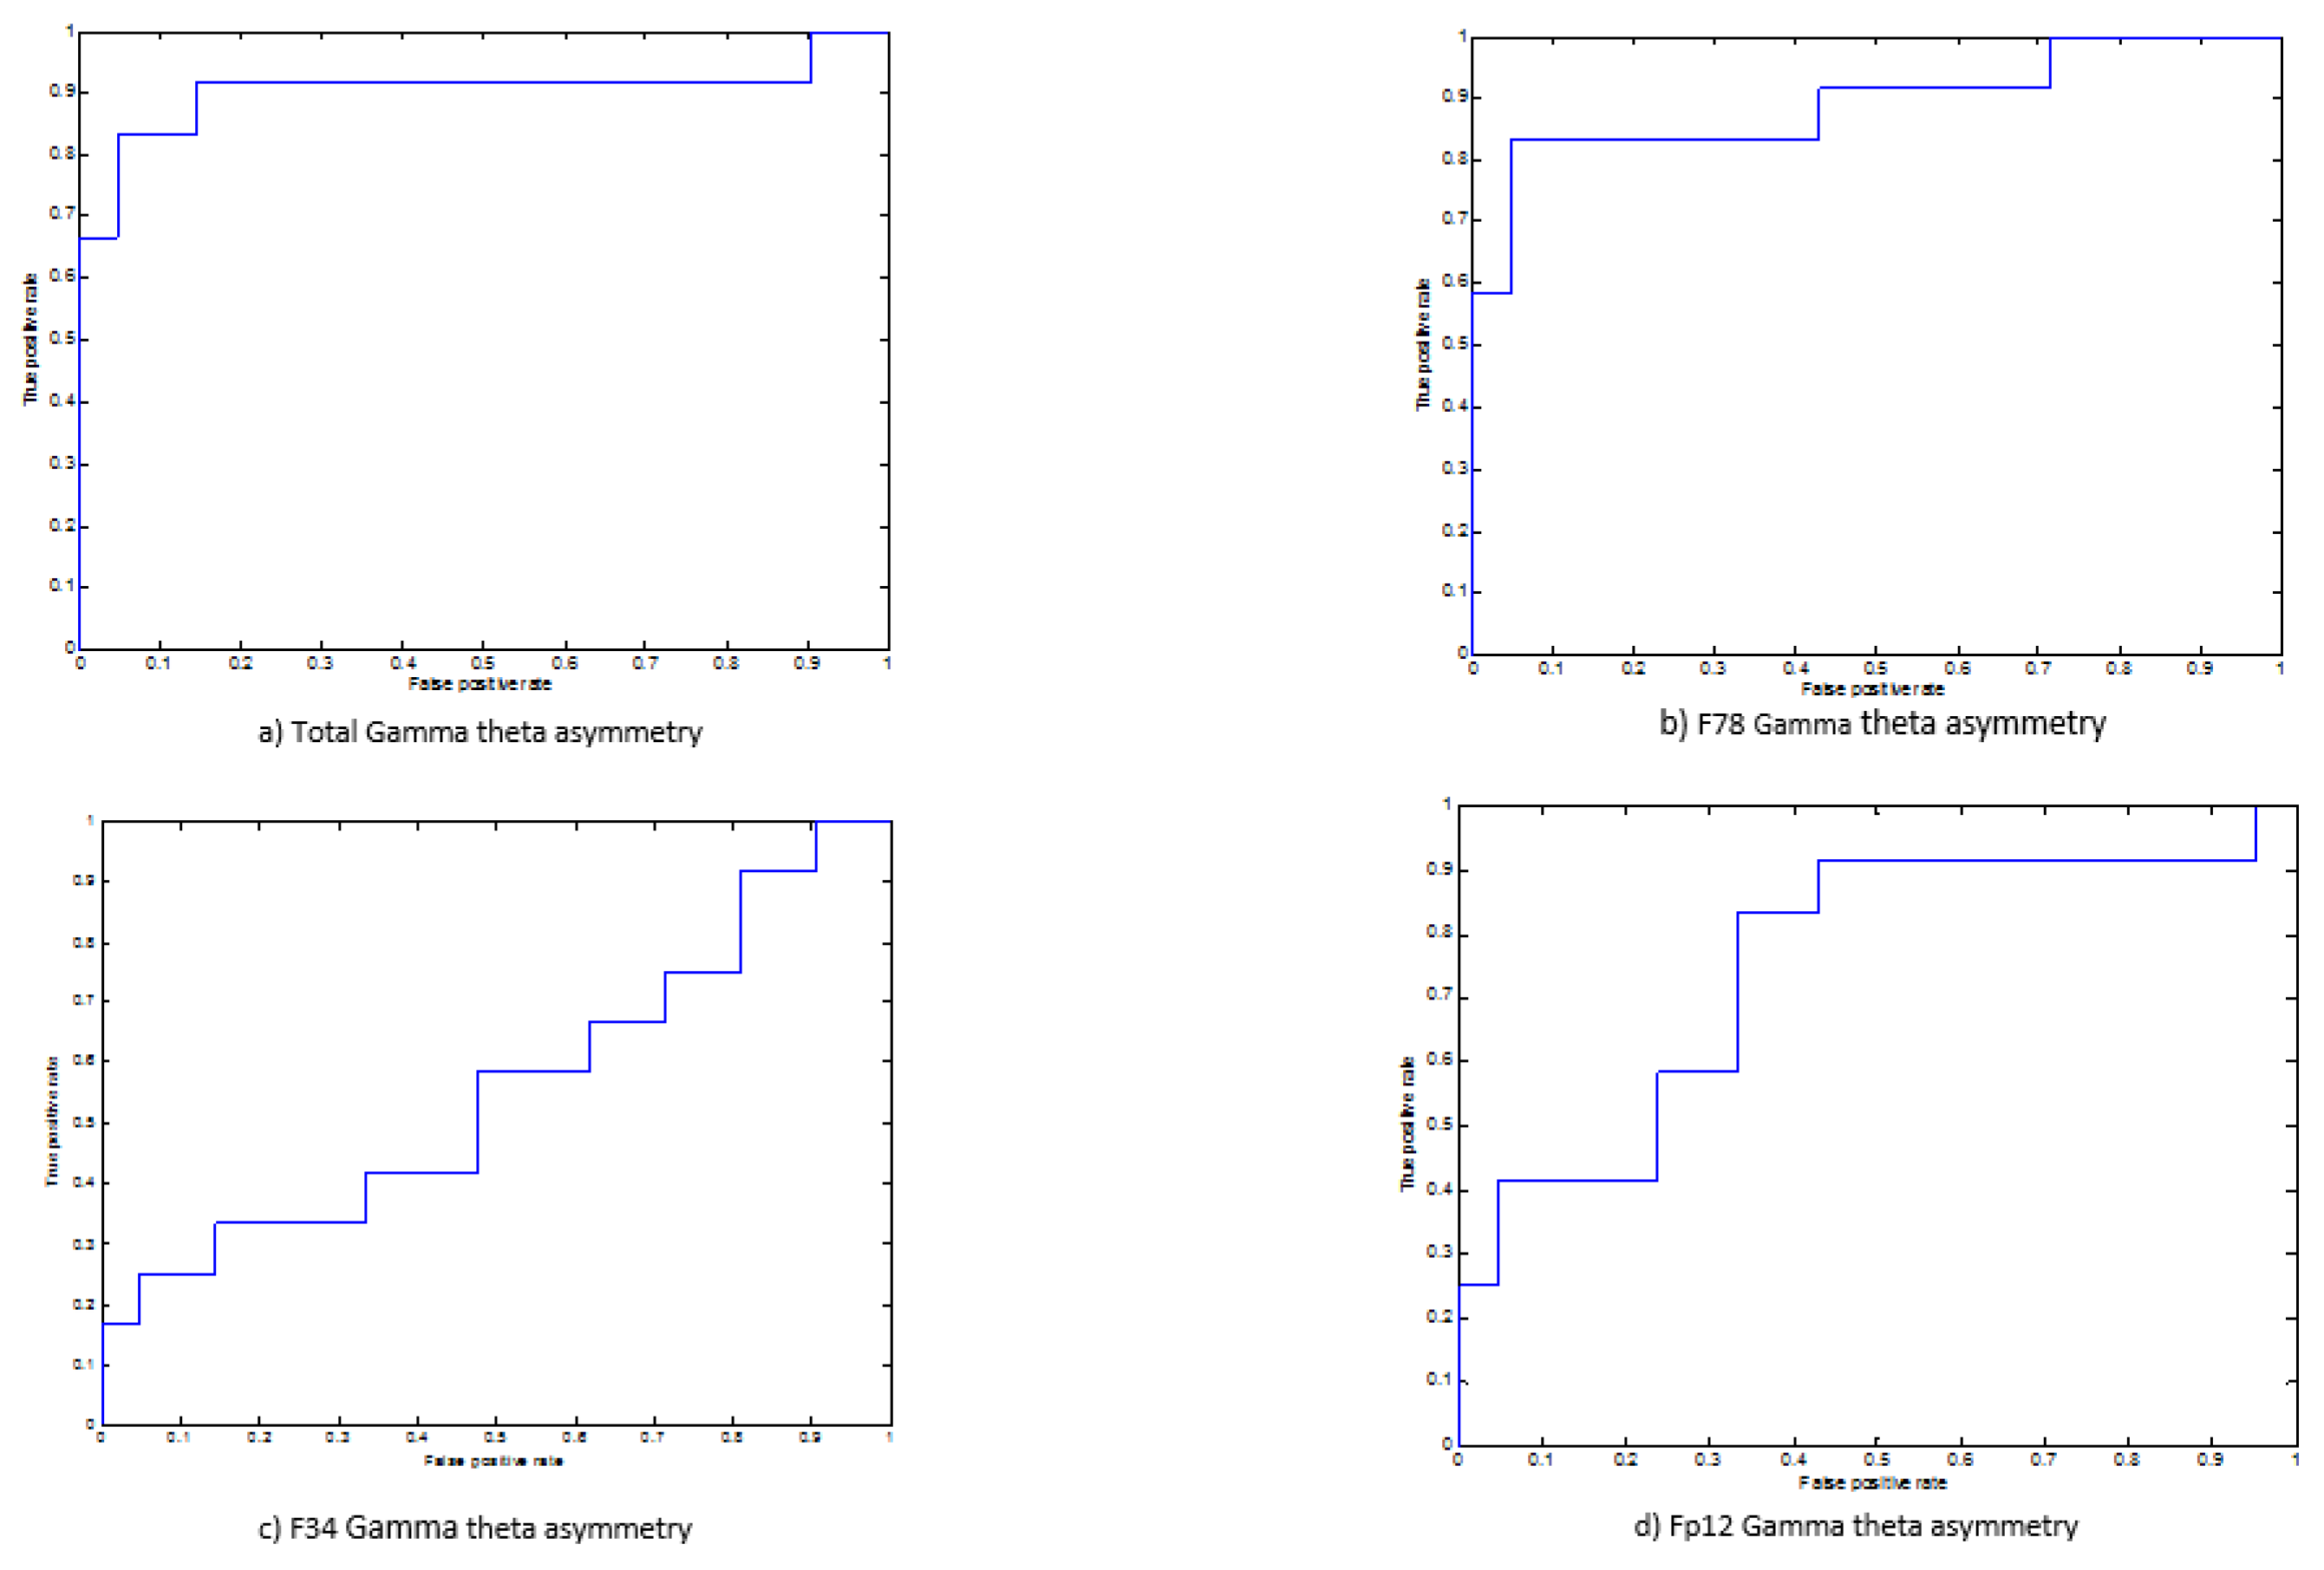
Figure 10.
Circumpex model adopted from [33].
Figure 10.
Circumpex model adopted from [33].
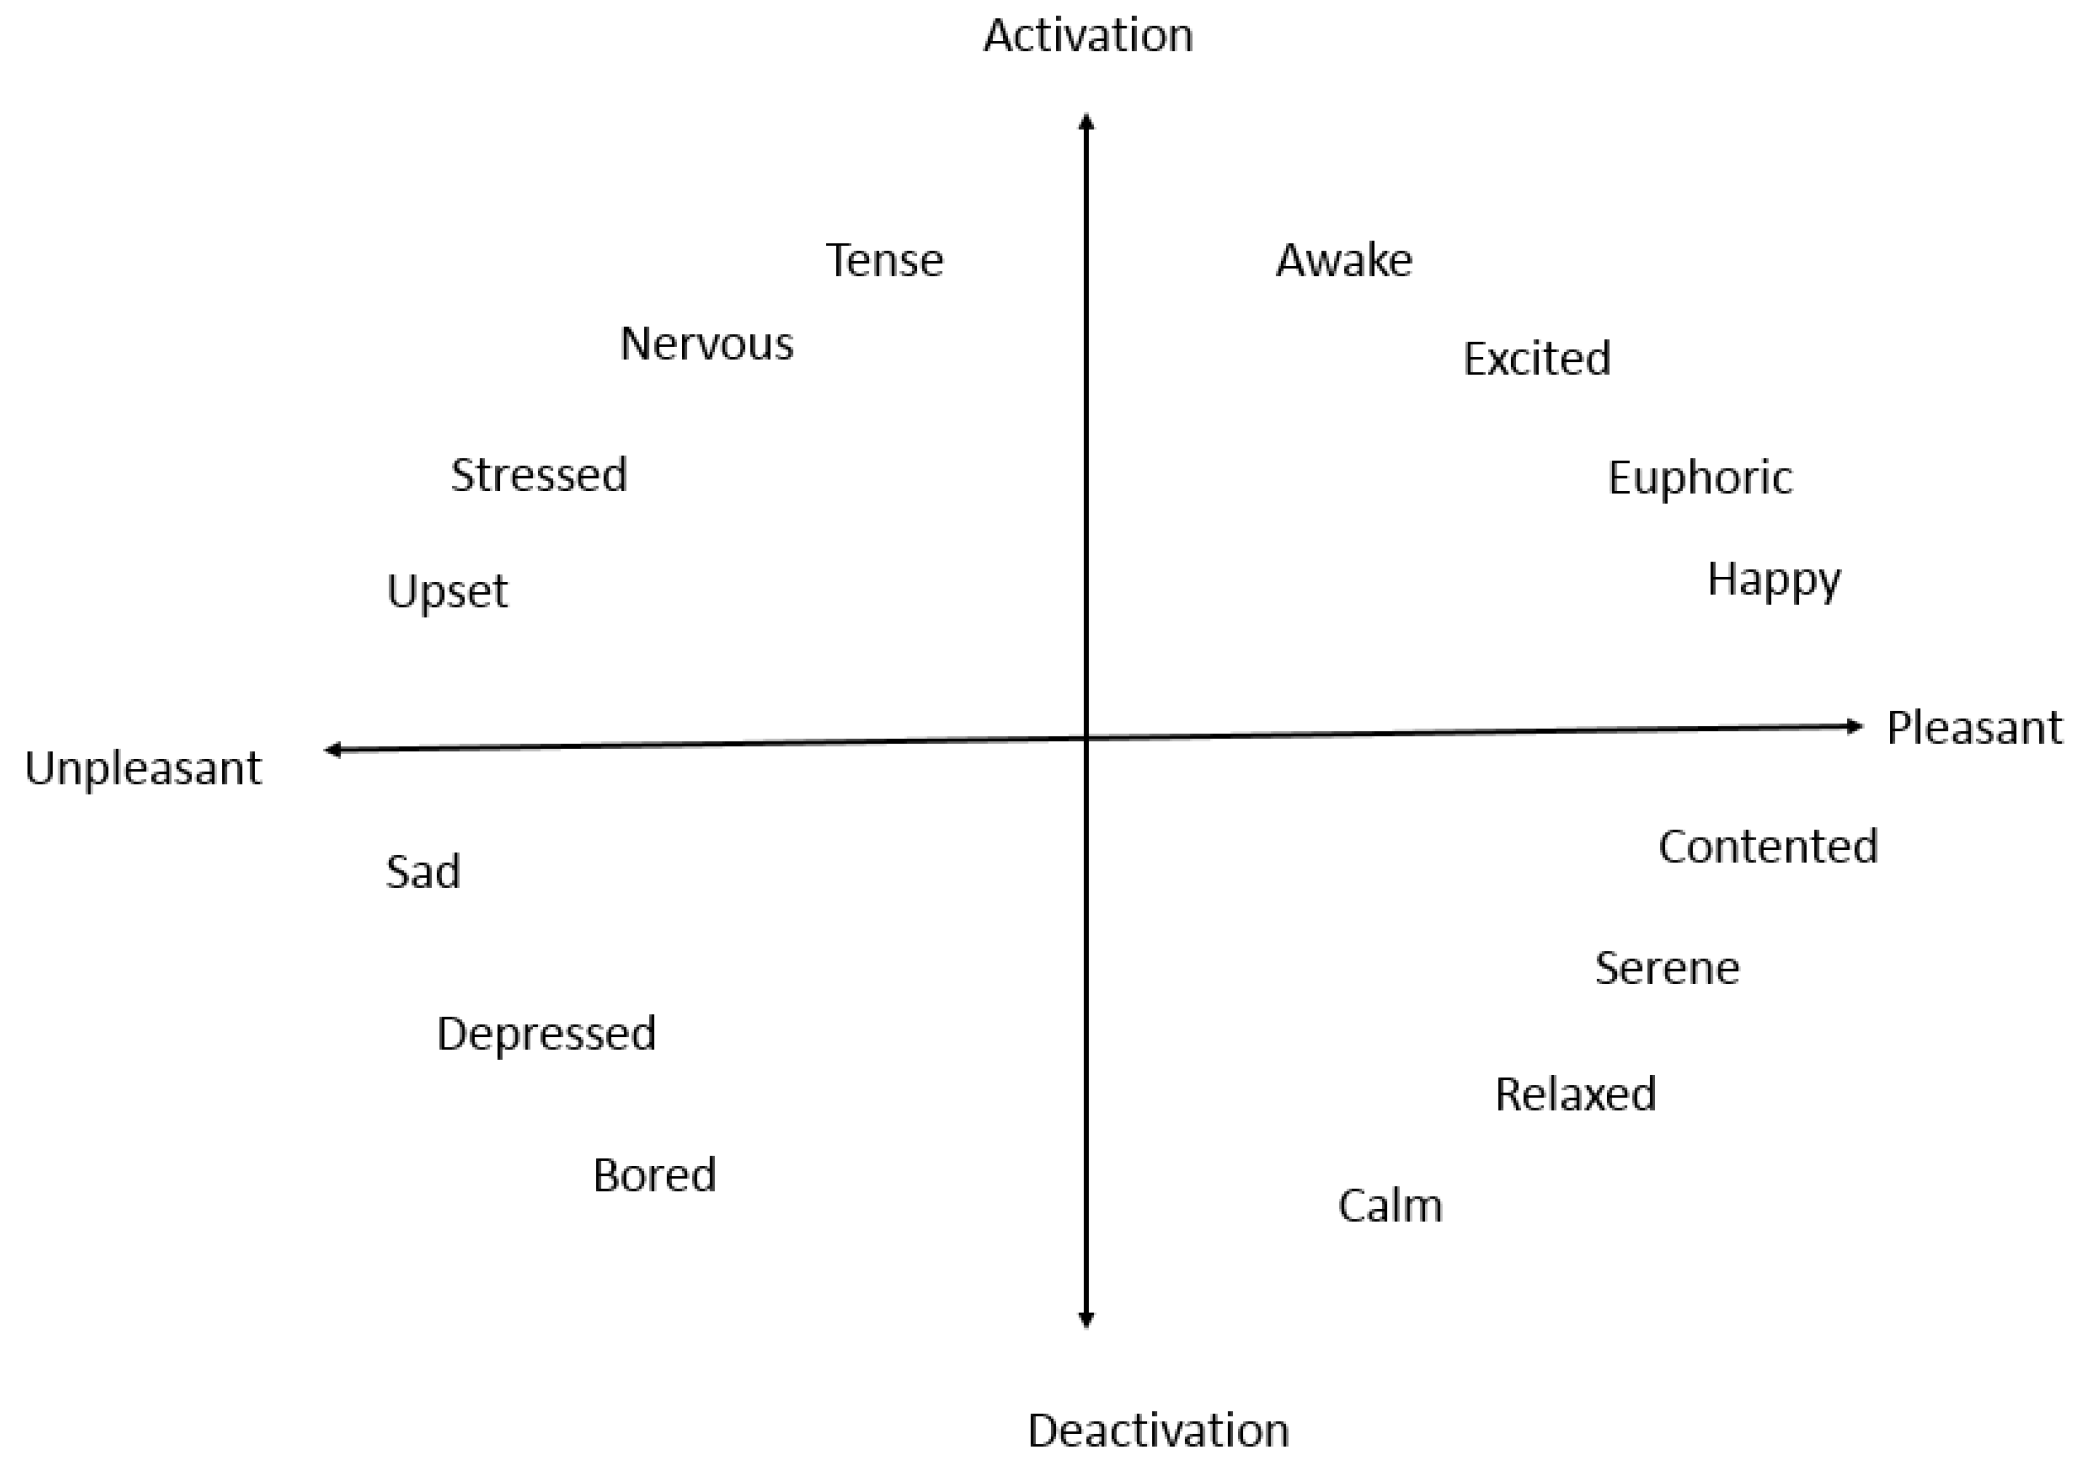
Figure 11.
Emotion Mapping using TGT model
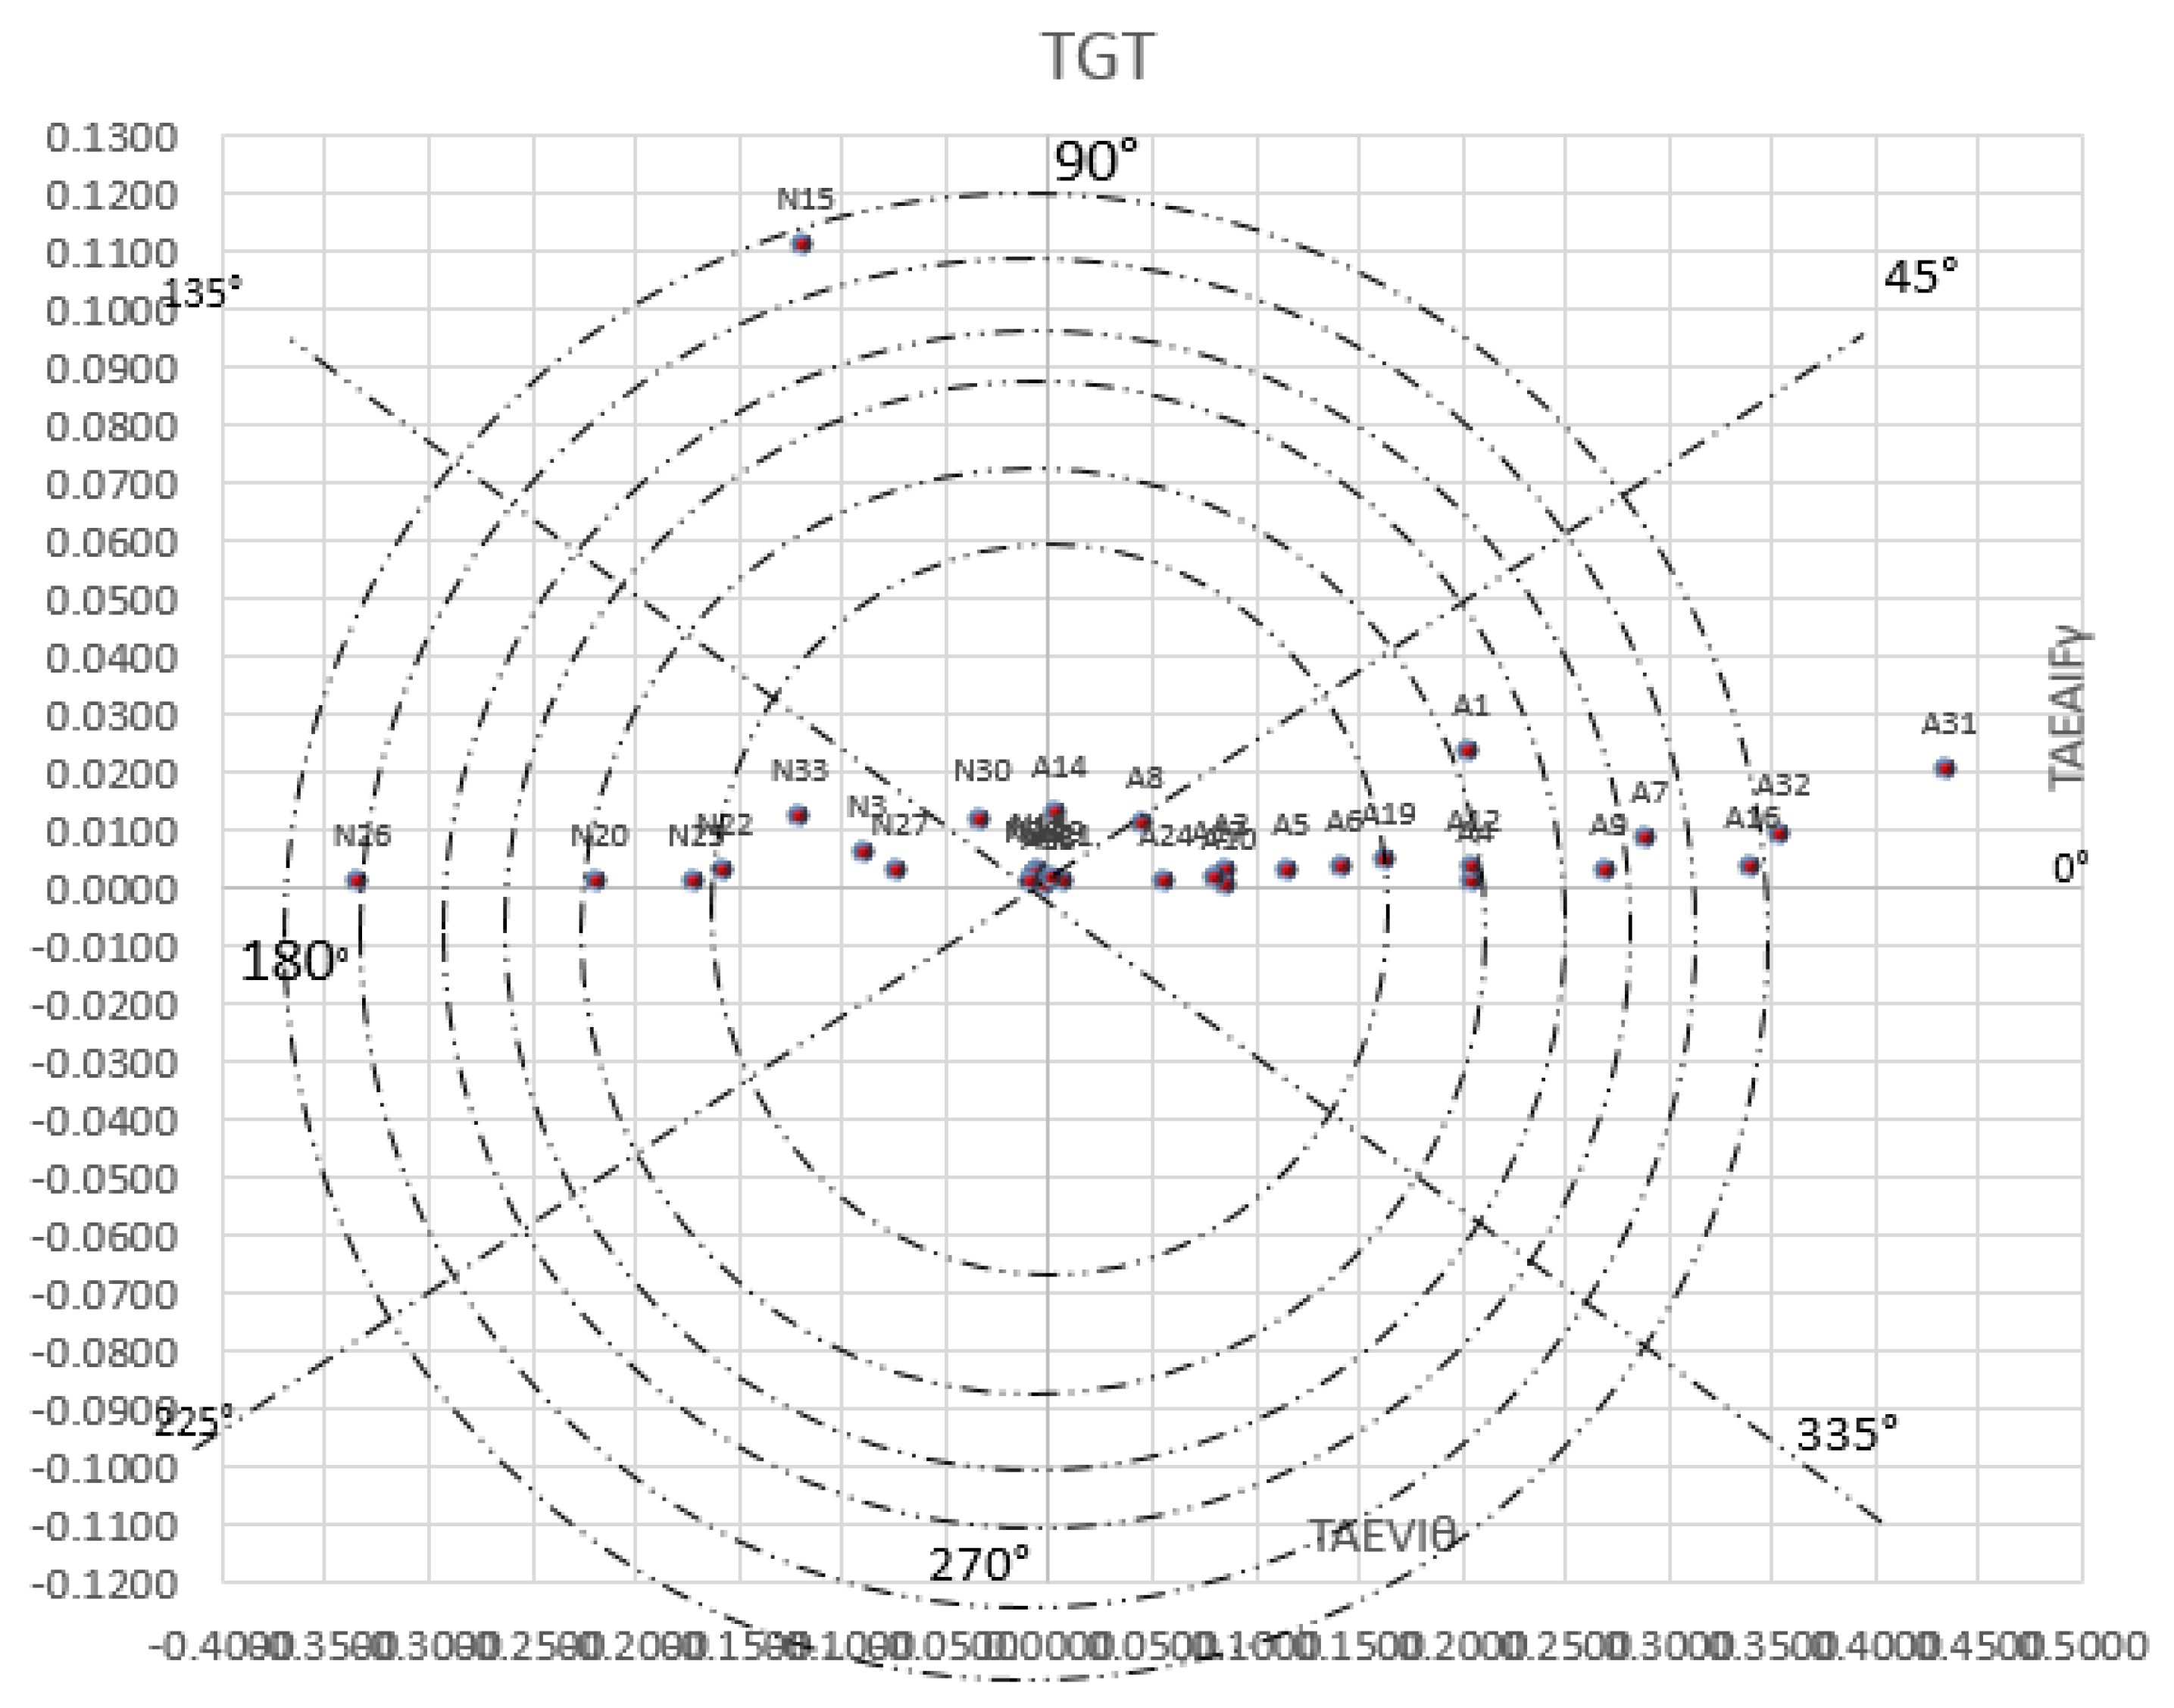
Figure 12.
Emotion Mapping using GT78 model
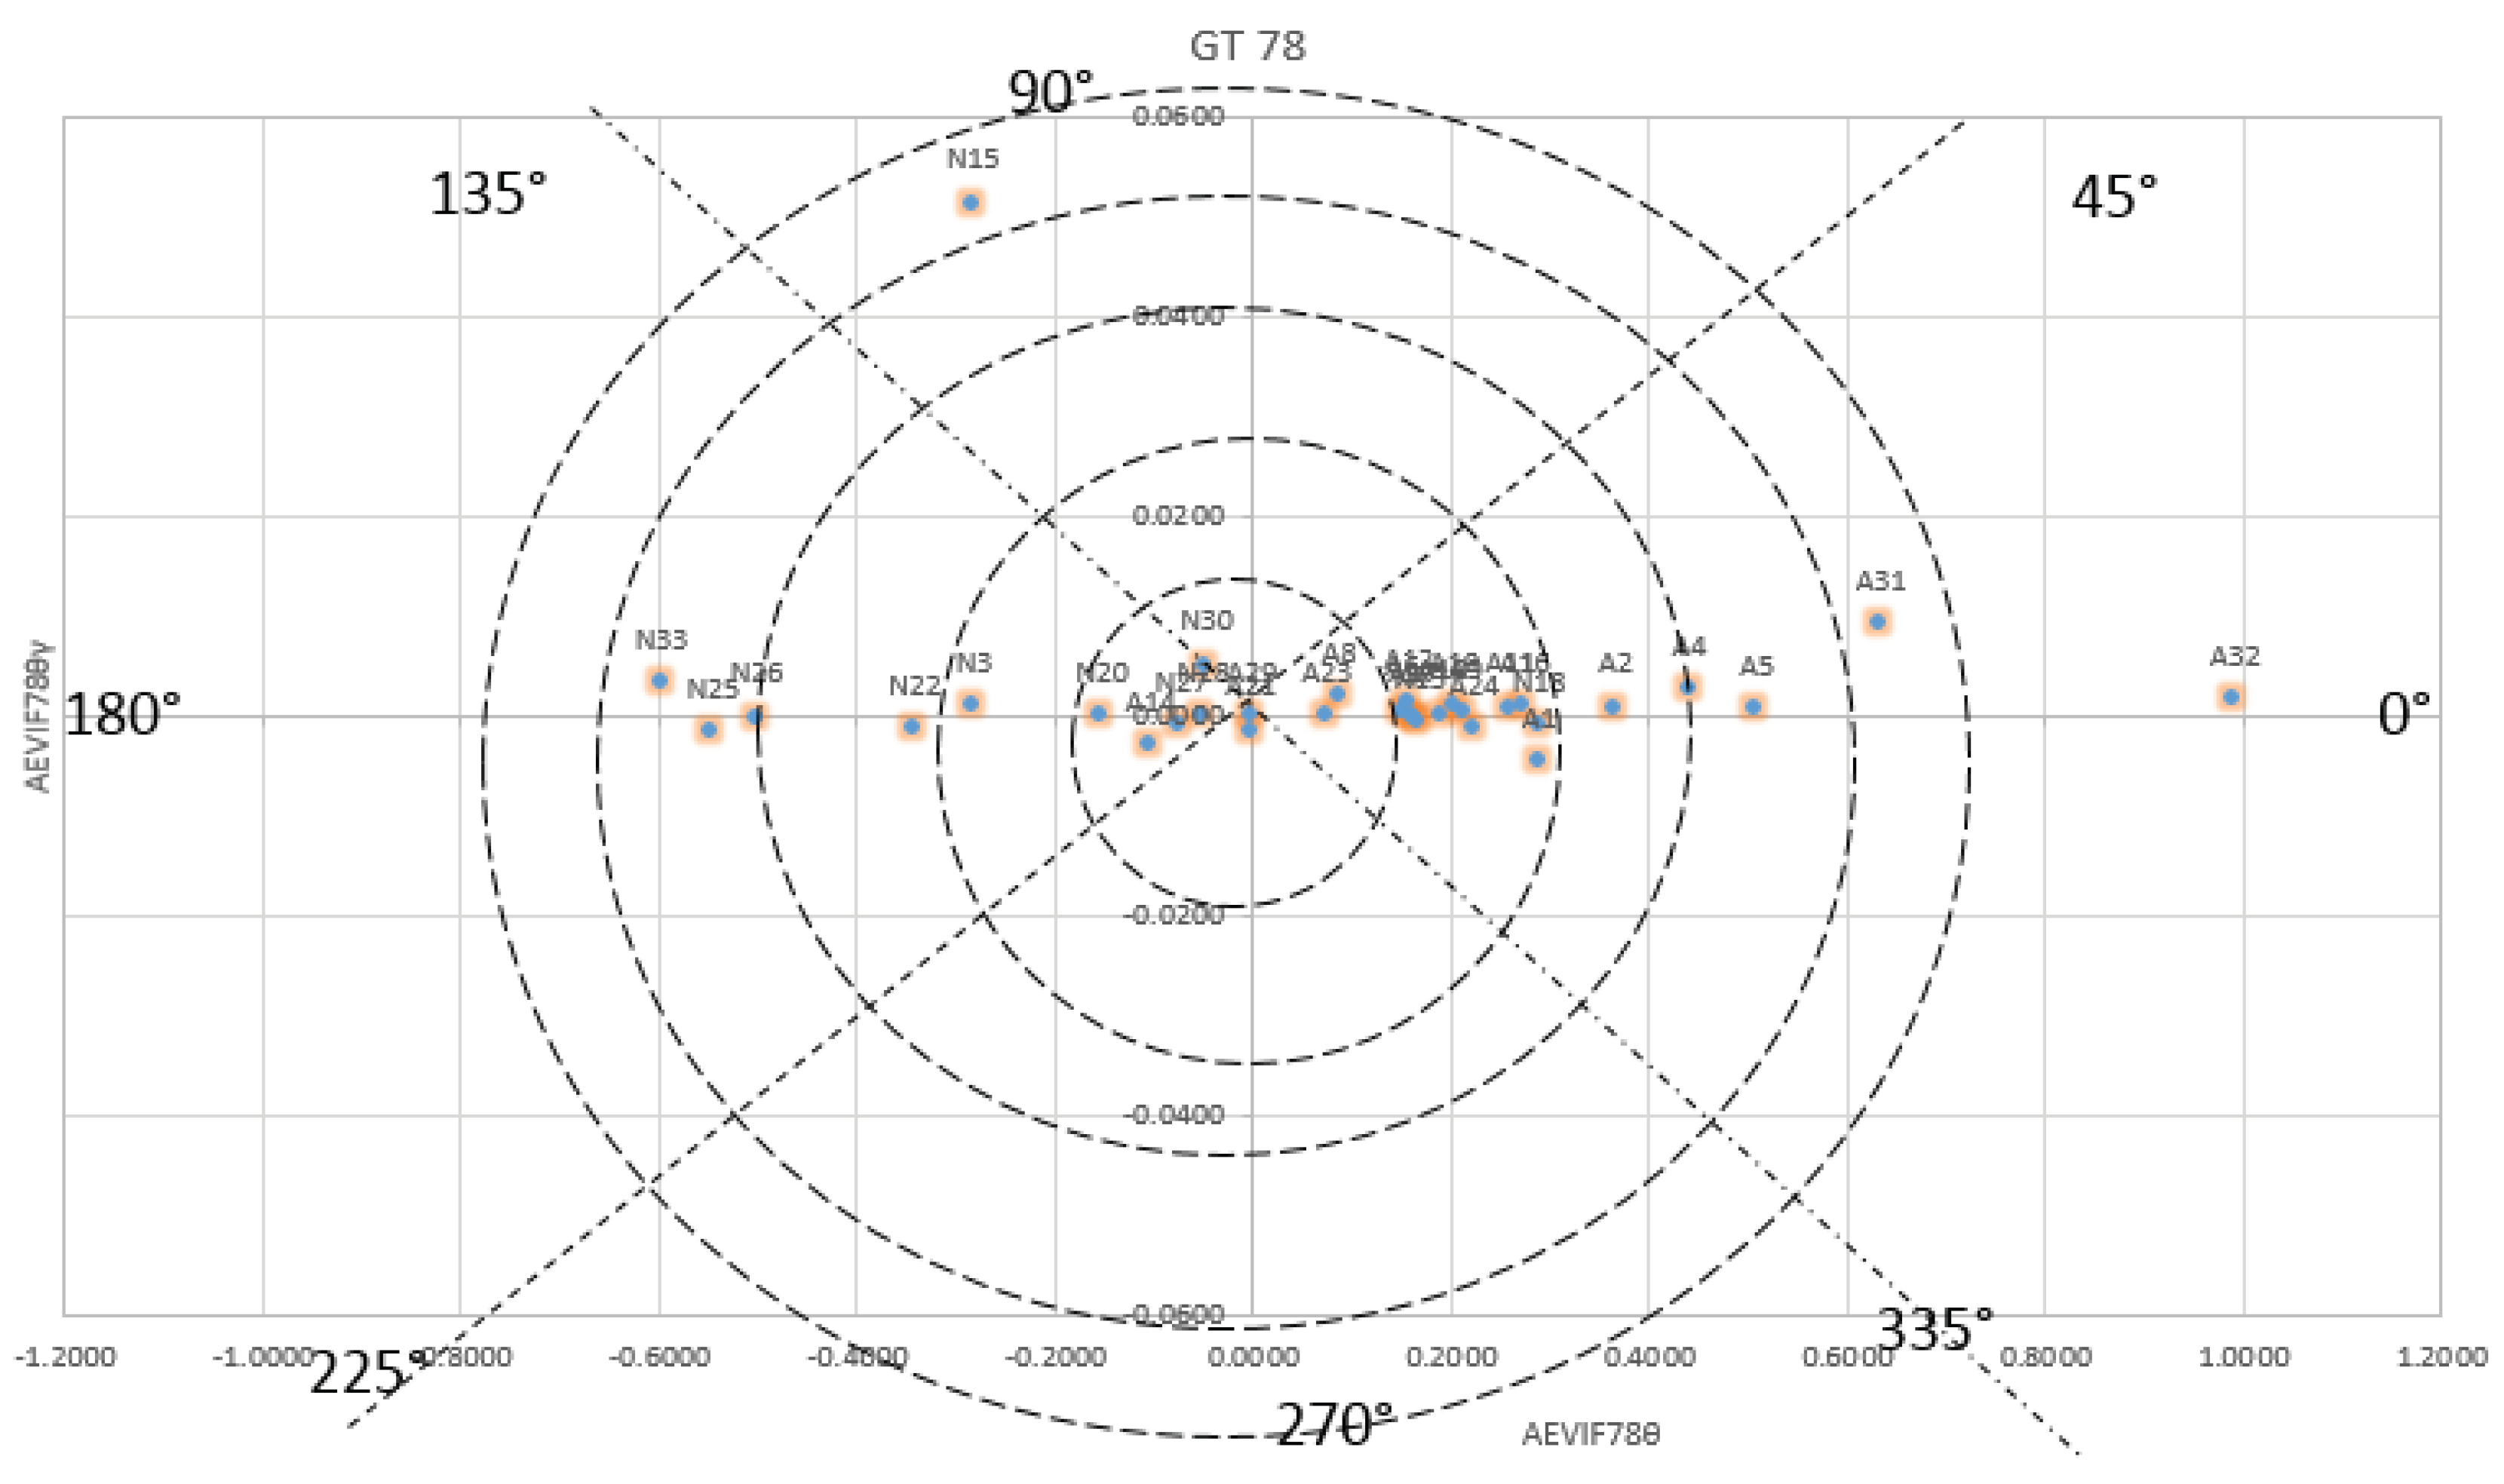

Table 1.
Analysis on the basis of Brouwer’s recommendations.
| Author | Year | R1 | R2 | R3 | R4 | R5 | R6 |
|---|---|---|---|---|---|---|---|
| Proposed | 2025 | ✔ | ✔ | ✔ | ✔ | ✔ | ✔ |
| [9] | 2001 | ✔ | ✔ | ✔ | × | ✔ | × |
| [10] | 2002 | ✔ | ✔ | ✔ | × | ✔ | × |
| [11] | 2007 | ✔ | ✔ | ✔ | ✔ | ✔ | × |
| [12] | 2007 | × | ✔ | × | × | × | ✔ |
| [13] | 2008 | × | ✔ | × | × | × | ✔ |
| [14] | 2009 | × | ✔ | × | × | × | ✔ |
| [15] | 2010 | × | ✔ | × | × | × | ✔ |
| [16] | 2010 | × | ✔ | × | × | ✔ | ✔ |
| [17] | 2012 | × | ✔ | × | ✔ | × | ✔ |
| [18] | 2012 | × | ✔ | × | × | ✔ | ✔ |
| [19] | 2013 | × | ✔ | × | ✔ | × | ✔ |
| [20] | 2013 | × | ✔ | × | ✔ | ✔ | ✔ |
| [21] | 2013 | × | ✔ | × | × | × | ✔ |
| [22] | 2016 | × | ✔ | ✔ | ✔ | ✔ | ✔ |
| [23] | 2016 | × | ✔ | × | × | × | ✔ |
| [24] | 2016 | ✔ | ✔ | ✔ | × | × | ✔ |
| [25] | 2016 | × | ✔ | × | × | × | × |
| [26] | 2017 | × | ✔ | ✔ | × | × | ✔ |
| [27] | 2020 | ✔ | ✔ | ✔ | × | × | ✔ |
| [28] | 2024 | ✔ | ✔ | ✔ | × | × | ✔ |
✔-Followed,×-Not Followed
Table 2.
Proposed valence-arousal 2-D Models
| Model | Valence Variable | Arousal Variable |
|---|---|---|
| TGT | TAEVI | TAEVI |
| GT78 | AEVIF78 | AEVIF78 |
| GT34 | AEVIF34 | AEVIF34 |
| GTFp12 | AEVIFp12 | AEVIFp12 |
Table 3.
Untuned Model Performance
| 1lKernel | Model | TPR | TNR | PPV | NPV | FDR | FNR | FPR | ACC | F1 | MCC | YI | Mark |
|---|---|---|---|---|---|---|---|---|---|---|---|---|---|
| Radial | GT | 100 | 72.7 | 88 | 100 | 12.5 | 27.27 | 27.2 | 90.9 | 93.6 | 0.8 | 0.72 | 0.88 |
| GTF78 | 100 | 66.7 | 84 | 100 | 16 | 0 | 33.3 | 87.9 | 91.3 | 0.74 | 67 | 0.84 | |
| GTF34 | 100 | 25 | 70 | 100 | 30 | 0 | 75 | 72.7 | 82.35 | 0.41 | 0.25 | 0.7 | |
| GTFp12 | 90.5 | 66.7 | 82.6 | 80 | 17.4 | 9.5 | 33.3 | 81.8 | 86.3 | 0.66 | 0.57 | 0.62 | |
| Linear | GT | 100 | 72.7 | 88 | 100 | 12.5 | 27.27 | 27.2 | 90.9 | 93.6 | 0.8 | 0.72 | 0.88 |
| GTF78 | 95.2 | 66.7 | 83.3 | 88.9 | 16.7 | 4.76 | 33.3 | 84.8 | 88.9 | 0.71 | 0.61 | 0.72 | |
| GTF34 | 100 | 0 | 63.6 | 0 | 36.36 | 0 | 100 | 63.63 | 0 | 0 | 0 | 0 | |
| GTFp12 | 80.9 | 58.3 | 77.7 | 63.6 | 22.7 | 19 | 41.6 | 72.7 | 79 | 0.5 | 0.39 | 0.41 | |
| Sigmoid | GT | 86.36 | 81.8 | 90.4 | 75 | 9.5 | 13.63 | 18.1 | 84.8 | 88.3 | 0.77 | 0.68 | 0.65 |
| GTF78 | 95.2 | 75 | 86.9 | 90 | 13 | 4.76 | 25 | 87.9 | 90.9 | 0.77 | 0.7 | 0.76 | |
| GTF34 | 95.2 | 0 | 62.5 | 0 | 37.5 | 4.7 | 100 | 60.6 | 75.47 | 0 | 0 | 0 | |
| GTFp12 | 71.4 | 66.7 | 78.9 | 57.1 | 21 | 0 | 75 | 69.6 | 75 | 0.49 | 0.38 | 0.36 | |
| Polynomial | GT | 100 | 41.6 | 75 | 100 | 25 | 0 | 58.3 | 78.7 | 85.7 | 0.55 | 0.41 | 0.75 |
| GTF78 | 100 | 41.7 | 75 | 100 | 25 | 0 | 58.3 | 78.8 | 85.7 | 0.55 | 0.41 | 0.75 | |
| GTF34 | 100 | 25 | 70 | 100 | 30 | 0 | 75 | 72.7 | 82.35 | 0.41 | 0.25 | 0.7 | |
| GTFp12 | 100 | 25 | 70 | 100 | 30 | 0 | 75 | 72.7 | 82.3 | 0.41 | 0.25 | 0.7 |
TPR(True Positive Rate), TNR(True Negative Rate), PPV(Precision) NPV(Negative Prediction Value), FDR(False Discovery Rate), F1score, FPR(False Positive Rate ), FNR(False Negative Rate) ACC( Accuracy), MCC(Mathew correlation coefficient) YI (informedness(Youden index)), Mark(markedness)
Disclaimer/Publisher’s Note: The statements, opinions and data contained in all publications are solely those of the individual author(s) and contributor(s) and not of MDPI and/or the editor(s). MDPI and/or the editor(s) disclaim responsibility for any injury to people or property resulting from any ideas, methods, instructions or products referred to in the content. |
© 2025 by the authors. Licensee MDPI, Basel, Switzerland. This article is an open access article distributed under the terms and conditions of the Creative Commons Attribution (CC BY) license (http://creativecommons.org/licenses/by/4.0/).
Copyright: This open access article is published under a Creative Commons CC BY 4.0 license, which permit the free download, distribution, and reuse, provided that the author and preprint are cited in any reuse.


