
Submitted:
12 February 2025
Posted:
13 February 2025
You are already at the latest version
Abstract
In high-risk mining environments, the emotional state of individuals can play a critical role in shaping decision-making during emergencies. To investigate this phenomenon, we adopted an event-related potential (ERP) approach within a within-subject experimental framework. Participants were first exposed to a series of emotionally evocative cues designed to elicit distinct affective states, immediately followed by decision-making tasks that simulate coal mine emergency scenarios. Behavioral indices—such as reaction speed and task engagement—were recorded concurrently with ERP signals, with a specific focus on components including N1, P2, N2, P300, and LPP. Our analysis revealed that both the valence and intensity of emotional cues substantially modulated the decision-making process, as reflected by significant variations in response times and ERP measures. These findings offer fresh insights into the neural mechanisms through which emotional factors influence critical decisions in crisis situations, highlighting implications for the development of enhanced safety strategies in coal mining operations.
Keywords:
Emotional Motivation
; Decision-Making
; Coal Mine Emergencies
; Neural Mechanisms
; ERP
; Mining Safety
1. Introduction
Coal mine emergencies are marked by their sudden onset, complexity, and high risk, making miners’ decision-making behavior critically important [1]. The coal mining industry has long grappled with safety hazards, and during disasters, the decisions made by miners can have life-or-death consequences [2]. The intense pressure inherent in these emergencies further influences decision-making processes [3]. Notably, emotional motivation is a key factor in shaping these decisions [4]. Both the direction (approach or avoidance) and the intensity (high or low) of emotional motivation exert a profound impact on miners’ behavioral choices [5]. Thus, investigating the effects of emotional motivation on miners’ decision-making is of considerable theoretical and practical significance [6].
Research on the influence of emotional motivation on decision-making indicates that emotions not only prompt individuals to take specific actions but also shape risk assessment and resource allocation during the decision-making process [7]. The effects of both approach and avoidance motivations on decision-making behavior have been widely discussed, particularly in high-risk environments where these effects are more pronounced [8]. Kuhnen and Knutson suggest that the directional aspect of emotional motivation—whether approach or avoidance—can significantly influence an individual’s responses in various decision-making scenarios, while the intensity of these emotions affects the speed and preferences underlying these decisions [9]. Furthermore, emotional states and regulation mechanisms play crucial roles in individual decision-making, especially under high-risk, stressful conditions, where emotional responses can markedly alter decision strategies [10].
In recent years, the interplay between emotion and decision-making has emerged as a central theme in cognitive neuroscience, with emotion regulation and cognitive control identified as critical factors for understanding complex decision behaviors [11]. For instance, research indicates that the degree of emotional activation—whether high or low—substantially influences the processing of information during decision-making, thereby affecting the final outcomes [12]. Moreover, the efficacy of an individual's emotional regulation can also shape their risk tolerance and subsequent reactions to the consequences of their decisions [13].
Event-related potential (ERP) technology is widely recognized as an ideal tool for investigating the interplay between emotions and decision-making, largely due to its high temporal resolution [14]. ERPs capture the brain's rapid neural responses to external stimuli, with distinct components reflecting different stages of psychological processing—thus offering valuable insights into the neural mechanisms underlying decision-making. Numerous studies have identified specific ERP components closely associated with cognitive functions; notably, the N1, P2, N2, P300, and LPP components have emerged as key indicators in the decision-making process. For instance, Luck et al. [15] demonstrated that the N1 component is linked to early perceptual processing and attention allocation. Gonzalez et al. [16] observed that the P2 component plays a role in processing stimulus characteristics, while Dien et al. [17] reported that the N2 component is closely related to conflict monitoring and cognitive control. Furthermore, Polich et al. [18] revealed that the P300 component is involved in the cognitive evaluation and resource allocation of target stimuli, and Schupp et al. [19] showed that the LPP component reflects the sustained processing and regulation of emotional stimuli.
These ERP components are intricately linked to decision-making behavior, capturing neural activity at distinct stages of the process and elucidating its underlying mechanisms [20]. In ERP analyses, the typical time window spans from 200 milliseconds before to 1000 milliseconds after the stimulus, with the initial 200 milliseconds serving as the baseline [21]. Within this window, the N1, P2, N2, P300, and LPP components collectively reflect the complexity of decision-making: while the N1 and P2 components are primarily associated with perceptual processing and attention, the N2, P300, and LPP components are indicative of cognitive conflict, attention allocation, and emotional regulation [22].
This study investigates the influence of emotional motivation on miners’ decision-making behavior during coal mine emergencies using ERP technology, with the goal of unveiling the underlying neural mechanisms—specifically, how variations in emotional motivation modulate ERP components throughout the decision-making process [23]. Existing literature suggests that emotional motivation not only triggers specific emotional responses but also further influences decision outcomes by altering individual cognitive processing [24].
The novelty of this study lies in its integration of emotional motivation with ERP analysis to examine decision-making in high-risk coal mine environments, thereby providing a theoretical foundation for enhancing both the efficiency and safety of miners' decisions in emergency situations.
2. Materials and Methods
2.1. Participants
Seventy-one front-line miners were recruited as experimental subjects. All participants shared a consistent gender and educational background, were right-handed, had normal vision (with no color deficiencies), and had no history of neurological or psychiatric disorders. Moreover, they refrained from consuming any stimulants or banned substances prior to the experiment. To ensure optimal performance, subjects were instructed to have a meal before the morning session and to take a nap before the afternoon session. Prior to the experiment, they were informed that the procedures would be painless and non-invasive, and each participant signed an informed consent form. Following the experiment, compensation was provided.
To control for potential confounding variables, the subjects’ emotional states were assessed before the experiment using the Beck Depression Inventory (BDI), the Beck Anxiety Inventory (BAI), and the Positive and Negative Affect Schedule (PANAS). The results indicated that the participants exhibited normal levels of anxiety (average BDI score=7.775±1.877; average BAI score = 25.850±3.798) and maintained stable emotional states (average PANAS positive affect score=30.625±3.941; average negative affect score=16.135±4.250). Based on these assessments, 60participants were ultimately selected for the study.
2.2. Experimental Materials and Experimental Equipment
The emotional stimuli materials consist of specific images categorized into four types based on the direction and intensity of emotional motivation: low motivation avoidance, high motivation avoidance, low motivation approach, and high motivation approach. Additionally, the event stimuli materials include 40 coal mine emergency images, each with a resolution of 1024×768 pixels.
Main Test Computer:
Utilized for experimental control and precise detection of brain electrical signals.
Subject Computer:
Used to display the experimental stimulus materials. This computer is equipped with a 19-inch LCD screen (85Hz refresh rate), loaded with E-prime stimulus software, and secured with a dongle to ensure data security.
Neuroscan ERP Brain Electrical Acquisition System:
This system includes a 64-channel electrode cap, a SynAmps2 amplifier, and Curry8 software for data acquisition and analysis. The system features encryption to ensure data accuracy and integrity. A partition separates the experimenter from the subject to minimize environmental interference.
Electrode Placement and Configuration:
Electrodes are positioned according to the international 10-20 system, with M1 and M2 serving as reference electrodes. Electrode impedance is maintained below 5 kΩ, the sampling frequency is set at 1024 Hz, and the filter bandwidth ranges from 0.05 Hz to 100 Hz.
Electrode Feedback System:
Integrated indicator lights provide real-time feedback on the contact status of the electrodes (green indicating good contact and red indicating poor contact), with impedance values displayed continuously. Stable contact must be maintained for 1.5 to 3 hours to ensure clear brain electrical signal acquisition.
2.3. Experimental Design
(1)experimental paradigm
The experiment selected the "Emotion-Arousal" paradigm, using emotional pictures to induce emotions combined with coal mine emergencies to study the impact of emotions on miners' decision-making[25,26]. This experiment employs a within-subjects design with two independent variables: emotional motivation intensity (high, low) and emotional motivation direction (approach, avoidance)[27]. The dependent variables are the miners' engagement in behavioral decision-making and response duration during coal mine emergency events[28]. The experiment consists of a practice phase and a formal phase, with the formal phase containing 160 trials, including 40 emotional pictures and 40 coal mine emergency event pictures. The experiment uses a Block design, with each Block consisting of one type of emotional picture, for a total of 4 Blocks, with the order randomized[29].
(2)Experimental Procedure
The experiment consisted of two phases: a practice stage and a formal testing stage. In the formal phase, participants completed 160 trials, each trial featuring 40 emotional images and 40 coal mine decision-making images. A block design was implemented, with each block presenting one type of emotional image; in total, there were four blocks, the order of which was randomized, and participants were allowed breaks between blocks.
Each trial began with the display of a fixation cross (“+”) for 500 ms, followed by a 500 ms blank screen. An emotional image was then shown for 3000 ms, during which participants were instructed to observe the image carefully. After this, a second fixation cross appeared for 500 ms, followed by another 500 ms blank screen. Next, a coal mine emergency image was presented; participants were required to read and comprehend the emergency scenario depicted before pressing a key to proceed. This reading phase simulated the emergency situation to engage the participant further. Following the emergency image, a 500 ms blank screen was displayed, after which the decision-making interface appeared. Participants were prompted to press “F” to indicate their choice to participate or“J”to decline participation. Each trial concluded with a 500 ms inter-trial interval ,as shown in Figure 1.
2.4. Data Processing
(1) Data Collection and Processing
Data for this experiment encompassed questionnaire responses, behavioral metrics, and ERP recordings. Behavioral data—including reaction times (RTs) and participation in coal mine emergency events (PICME)—were collected using E-Prime 3.0 software and subsequently analyzed with SPSS and E-Prime.
EEG signals were acquired following the international 10-20 system using a Neuroscan Quick-Cap fitted with 64 Ag/AgCl electrodes. The data were sampled at 1000 Hz, with a real-time bandpass filter set between 0.1 and 30 Hz. Preprocessing was conducted using EEGLAB 2020. Twelve electrodes were selected as regions of interest: frontal regions (F3, FZ, F4), central regions (C3, CZ, C4), parietal regions (P3, PZ, P4), and occipital regions (PO7, OZ, PO8). Artifact-contaminated segments were identified and removed based on ICA scalp maps and time waveform inspection. EEG preprocessing and subsequent analyses were performed using MATLAB in combination with EEGLAB. The ERP analysis focused primarily on changes in key components, particularly N1, P200, N2, P300, and LPP.
(2) Data Analysis
For the behavioral data, a two-factor repeated measures ANOVA was conducted with the following within-subject factors:
Emotional Motivation Intensity: High vs. Low
Emotional Motivation Direction: Approach vs. Avoidance
This analysis assessed how these two factors affected miners’ behavioral decision-making during coal mine emergencies, as measured by reaction times (RTs) and participation in coal mine emergency events (PICME).
For the ERP data, a three-factor repeated measures ANOVA was performed on both the average amplitude and latency of the extracted ERP components. The factors included:
Emotional Motivation Intensity: High vs. Low
Emotional Motivation Direction: Approach vs. Avoidance
Electrode Site: 12 electrodes (F3, Fz, F4, FC3, FCz, FC4, C3, Cz, C4, CP3, CPz, CP4)
This analysis aimed to determine how emotional motivation intensity and direction influence brain electrical activity and to explore how these effects vary across different electrode locations.
3. Experimental Results
3.1. Behavioral Decision Outcomes
Miners display significant variability in their decision-making engagement and response times under different emotional states. Specifically, under avoidance-motivated conditions, miners exhibit higher levels of engagement and longer response durations. In contrast, under approach-motivated emotions, their engagement is lower and response durations are shorter. Moreover, high motivational intensity is associated with significantly prolonged response durations compared to low motivational intensity.
3.1.1. Behavioral Decision-Making Engagement Statistics
The descriptive statistics for miners' decision-making participation during coal mine emergency events are shown in Table 1.
The statistical analysis revealed a significant main effect of emotional condition on miners' decision-making engagement, F(3,28) = 34.678, p < 0.05, η² = 0.788. Specifically, under high-motivation approach conditions, decision-making engagement was significantly lower than under low-motivation approach conditions, F(1,59) = 10.064, p < 0.05, η² = 0.251. Conversely, under high-motivation avoidance conditions, decision-making engagement was significantly higher than under low-motivation avoidance conditions, F(1,59) = 11.207, p < 0.05, η² = 0.272. The rates of decision-making engagement across the different emotional states are illustrated in Figure 2.
3.1.2. Behavioral Decision Response Time Statistics
Table 2 presents the descriptive statistics for the miners' reaction times during the behavioral decision-making stage.
Significant differences in behavioral decision-making reaction times (RTs) were observed across the four emotional conditions, as illustrated in Figure 3, F(3,28) = 72.715, p < 0.05, η² = 0.886. Further analyses revealed that the direction of emotional motivation significantly influenced reaction times, F(1,59) = 6.513, p = 0.013, η² = 0.096, with avoidance-motivated emotional states yielding significantly longer RTs than approach-motivated states. Additionally, the intensity of emotional motivation had a significant impact on RTs, F(1,59) = 71.212, p < 0.05, η² = 0.539. Post-hoc comparisons indicated that RTs under high motivational intensity conditions (1290.790 ± 192.509 ms) were significantly longer than those under low motivational intensity conditions (978.468 ± 193.825 ms).
3.2. ERP Component Analysis
3.2.1. N1 Component
(1) Average N1 Amplitude
A three-way repeated measures ANOVA was conducted on the mean amplitude of the N1 component, with emotional motivational intensity (high vs. low), emotional motivational direction (approach vs. avoidance), and 12 electrode positions (e.g., F3, Fz, F4, etc.) as within-subject factors. The analysis revealed a significant main effect of emotional motivational intensity on N1 amplitude, F(1,59) = 6.643, p < 0.05, η²= 0.231, indicating that this factor plays a crucial role in early perceptual processing and the allocation of attentional resources. Specifically, low emotional motivational intensity elicited a more pronounced (more negative) N1 amplitude compared to high intensity conditions.
In contrast, the main effect of emotional motivational direction on N1 amplitude was not significant, F(1,59) = 4.034, p > 0.05, η²= 0.175, suggesting that early neural responses may be less sensitive to the direction of motivational cues at this stage.
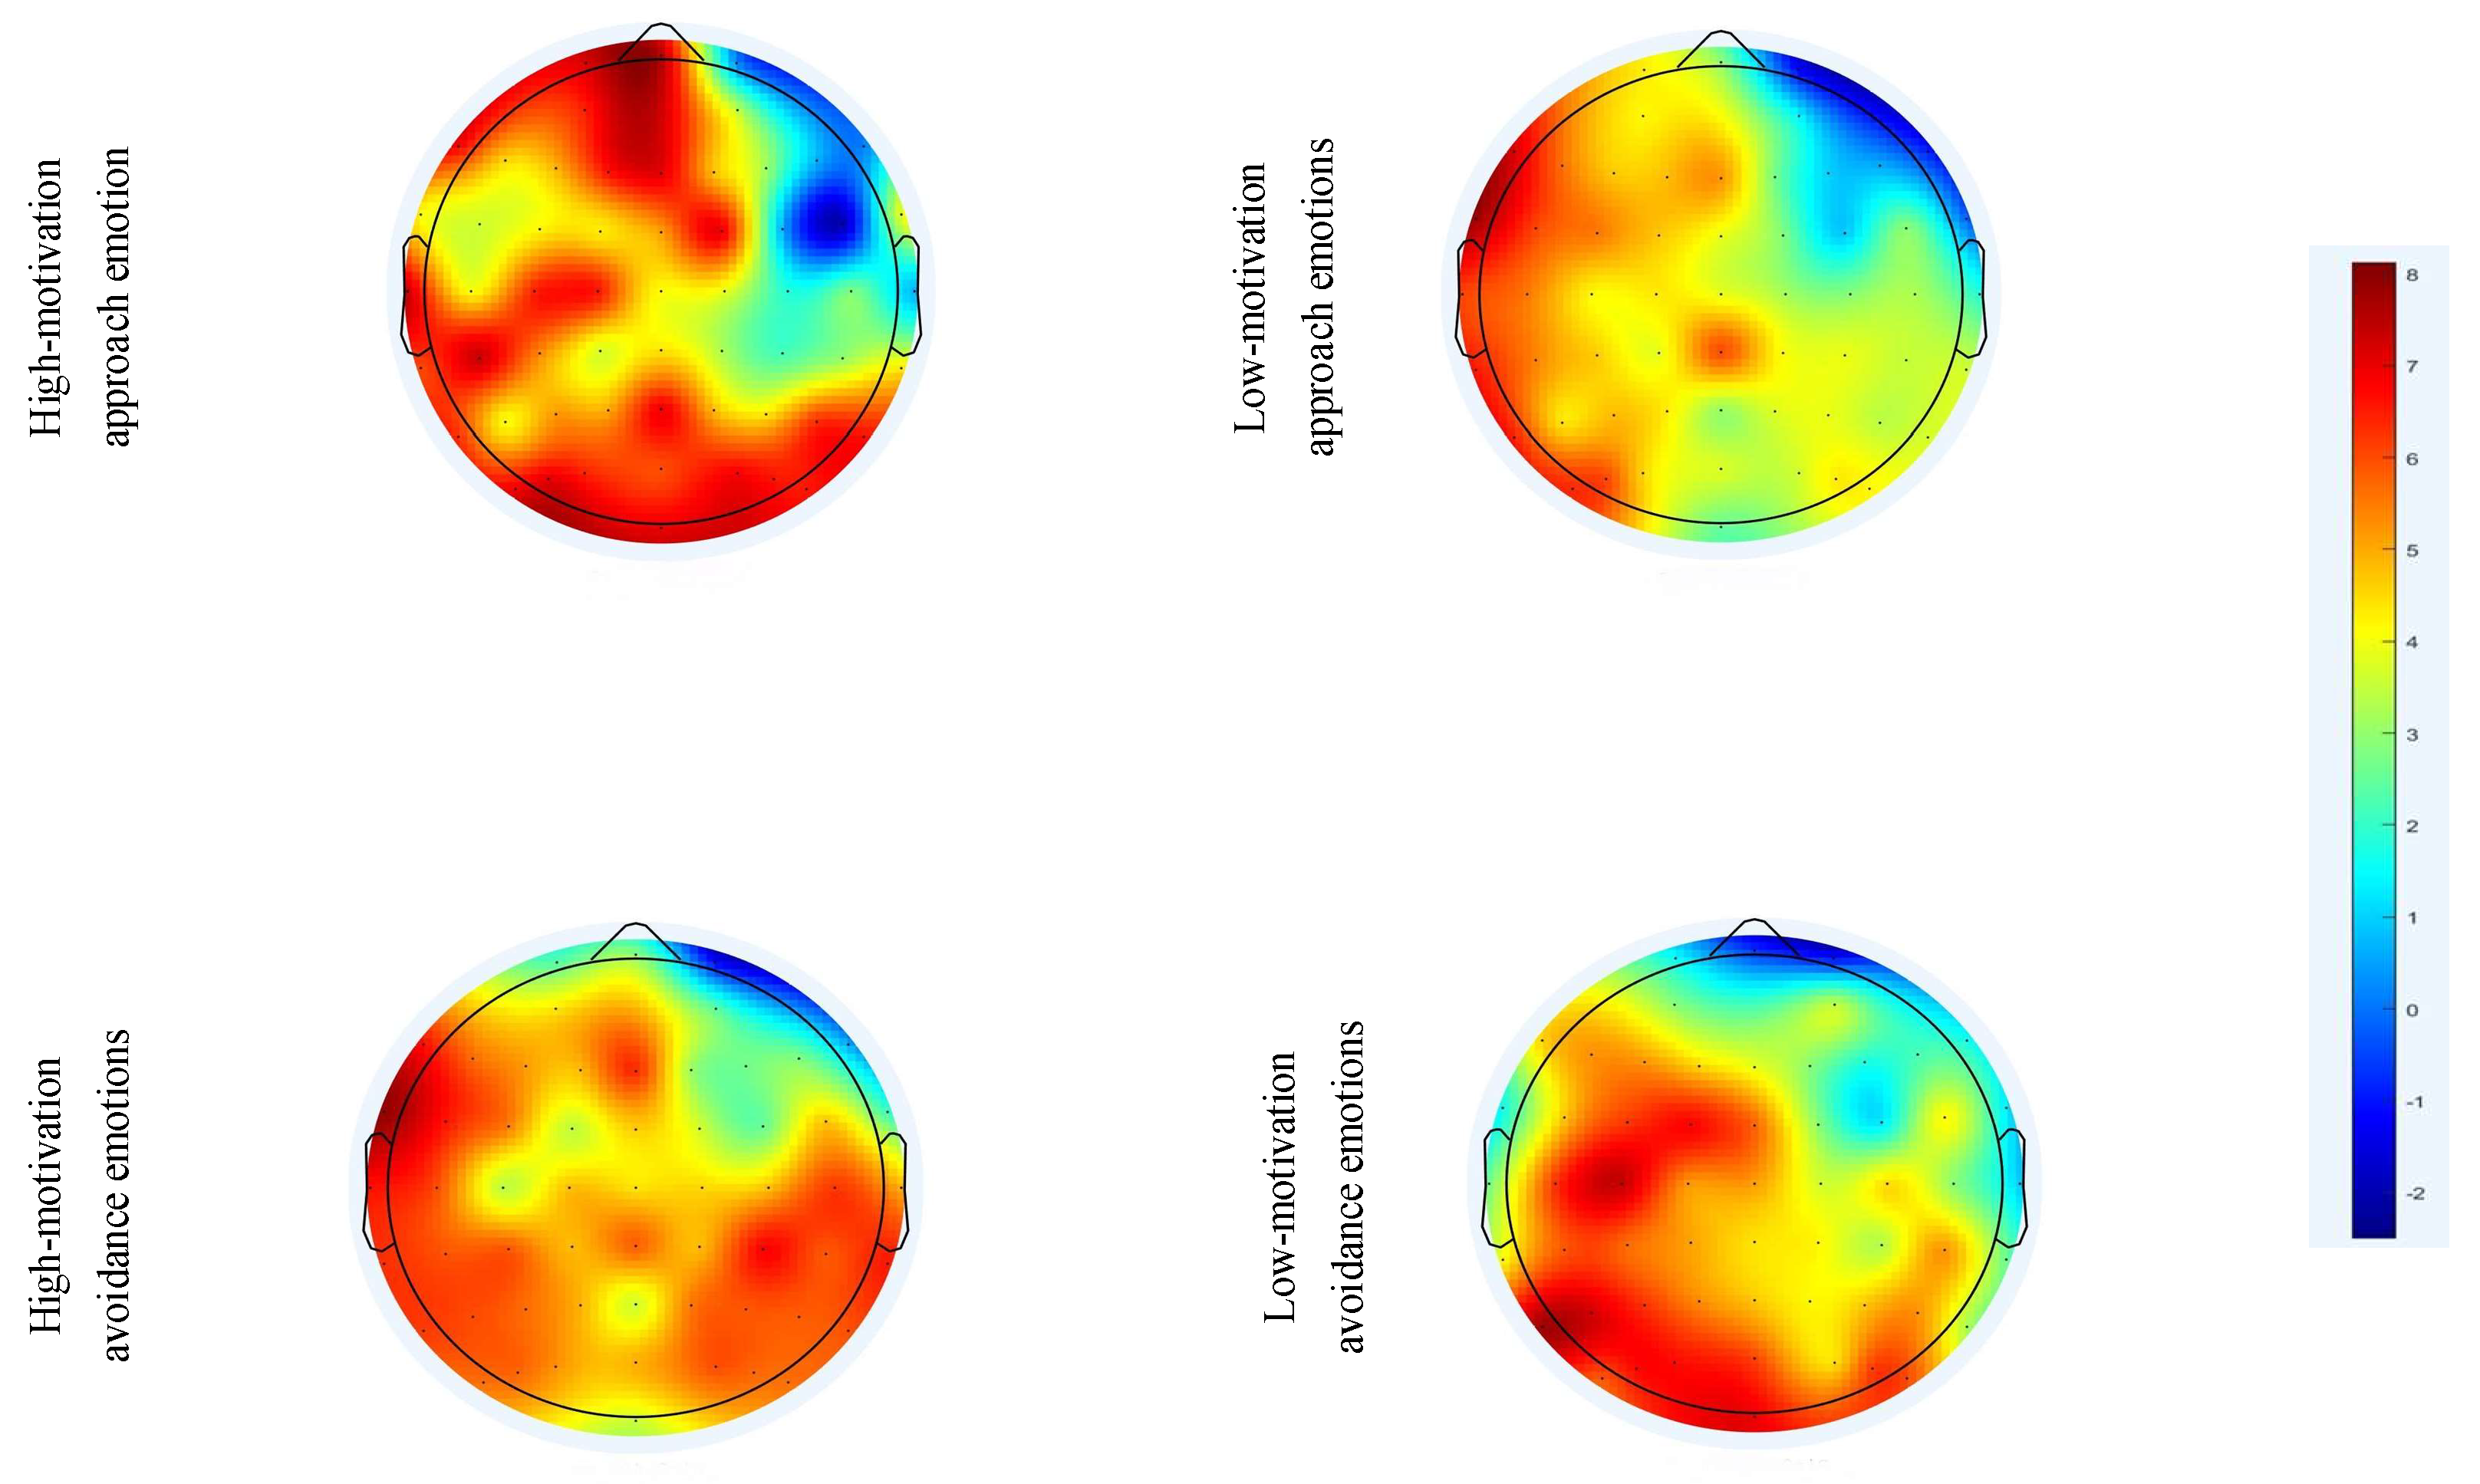
A significant main effect of electrode position was also observed, F(2.849,168.051) = 7.503, p < 0.05, η²= 0.723. Post-hoc tests indicated significant differences in N1 amplitude across various brain regions, with particularly pronounced activation in the right prefrontal area (see Figure 4). Under high motivational intensity, brain activity was concentrated in the frontal and parietal lobes and exhibited smaller negative amplitudes; under low motivational intensity, the activity was more dispersed, with larger negative amplitudes. Notably, the right frontal electrodes (F4, C4, FC4) showed significant N1 amplitude changes under all conditions.
No significant interactions were found between emotional motivational intensity and direction, electrode position (p > 0.05), nor was the three-way interaction significant (p > 0.05).
In summary, emotional motivational intensity significantly affects the amplitude of the N1 wave, with low intensity eliciting a more negative amplitude—indicative of increased attentional resource allocation. The direction of emotional motivation did not have a significant impact on N1 amplitude, and no significant interaction with electrode position was observed. These findings suggest that, at the early stages of attention, neural responses may not differ substantially based on the motivational direction, warranting further research into the underlying neural response mechanisms across different emotional states.
(2)N1 latency period
A three-way repeated measures ANOVA on N1 latency revealed that both emotional motivational intensity and emotional motivational direction significantly influenced N1 latency. Specifically, the results were F(1,59) = 8.213, p < 0.05, η²= 0.129 for intensity and F(1,59) = 7.431, p < 0.05, η²= 0.117 for direction. These findings indicate that variations in both the intensity and direction of emotional motivation significantly affect N1 latency during the early attention processing stage, reflecting differences in the underlying neural mechanisms.
Furthermore, a significant interaction between emotional motivational intensity and direction was observed, F(1,59) = 18.991, p < 0.05,η²= 0.250. In contrast, the interaction between emotional motivational direction and electrode location (F(5.419,319.663) = 0.639, p > 0.05,η²= 0.027), the interaction between emotional motivational intensity and electrode location (F(5.228,308.094) = 0.552, p > 0.05,η²= 0.022), and the three-way interaction among intensity, direction, and electrode location (F(5.187,305.975) = 0.318, p > 0.05,η²= 0.012) were not significant.
In summary, the significant interaction between emotional motivational intensity and direction on N1 latency underscores the complex effects of emotional motivation on attentional resource allocation and processing. However, no significant differences were observed across electrode locations, and the spatial distribution of the interaction between intensity and direction did not reach significance.
3.2.2. P2 Component
(1) Average P2 Amplitude
A three-way repeated measures ANOVA on the average amplitude of the P2 component revealed that the main effect of emotional motivational direction was not significant (F(1,59) = 2.735, p > 0.05). This finding may be attributed to the fact that the P2 component primarily reflects the allocation of attentional resources rather than being directly influenced by emotional motivational direction.
The main effect of emotional motivational intensity on the P2 amplitude was significant, F(1,59) = 3.821, p < 0.05, with the P2 amplitude being significantly higher under high motivational intensity emotions than under low motivational intensity emotions, indicating that high motivational intensity emotions require more cognitive resources.
The main effect of emotional motivational intensity on the P2 amplitude was statistically significant, F(1,59) = 3.821, p < 0.05. Specifically, high motivational intensity emotions elicited significantly higher P2 amplitudes than low motivational intensity emotions, suggesting that high motivational intensity requires a greater allocation of cognitive resources.
Figure 5.
Brain topography of P2 component.
In summary, emotional motivational intensity significantly affects the P2 amplitude, but the interactions with other factors were not significant.
(2) P2 Latency
A three-factor repeated measures ANOVA on P2 latency was conducted with emotional motivational intensity(high vs. low), emotional motivational direction (approach vs. avoidance), and electrode position as within-subject factors.
The analysis revealed a significant main effect of emotional motivational intensity, F(1,59) = 5.123, p < 0.05,η²= 0.162. Specifically, high motivational intensity emotions elicited significantly longer P2 latencies than low motivational intensity emotions, which is consistent with the cognitive resource allocation theory that posits stronger emotions require more cognitive resources, thereby delaying processing.
In contrast, the main effect of emotional motivational direction was not significant, F(1,59) = 1.137, p > 0.05,η² = 0.041, suggesting that the influence of approach versus avoidance on P2 latency is relatively weak. Additionally, a significant main effect of electrode position was found, F(3.456,203.728) = 4.012, p < 0.05,η²= 0.721, indicating that P2 latency was most pronounced at electrode positions over the central parietal area, underscoring the key role of these regions in processing emotional information.
No significant interaction effects were observed among emotional motivational intensity, direction, and electrode position, implying that their individual effects on P2 latency are largely independent. Consequently, future studies should prioritize examining the independent contributions of these factors rather than their interactions when investigating the P2 component.
3.2.3. N2 Component
(1) N2 Average Amplitude
A three-factor repeated measures ANOVA was conducted on the average amplitude of the N2 component to examine the effects of emotional motivational direction, intensity, and electrode site. The analysis revealed a significant main effect of emotional motivational direction, F(1,59) = 3.284, p < 0.05, indicating that the N2 amplitude elicited under approach motivation was significantly lower (i.e., more negative) than that under avoidance motivation. This suggests that approach motivation is associated with a stronger neural response during early attentional processing. In contrast, the main effect of emotional motivational intensity was not significant, F(1,59) = 2.591, p > 0.05, indicating that motivational intensity has a relatively minor impact on the N2 amplitude.
The main effect of electrode position was significant, F(3.174,203.728) = 4.762, p < 0.05,η²= 0.814, indicating that there are significant differences in the distribution of the N2 component across various brain regions, as illustrated in Figure 6. Specifically, the N2 amplitude was most pronounced in the right frontal area (F4, FC4, C4), consistent with previous research that highlights the key role of the right frontal region in processing emotional and motivational information. Additionally, the interaction effects between emotional motivational intensity, motivational direction, and electrode position were not significant (p > 0.05).
In summary, while emotional motivational direction significantly influenced the N2 amplitude when considered independently, its effect did not remain significant in interaction with other factors. Therefore, when investigating the N2 component, research should primarily focus on the independent effects of variables such as emotional motivational direction rather than on their interactions.
(2) N2 Latency
A three-factor repeated measures ANOVA on the N2 component latency revealed a significant main effect of emotional motivational direction, F(1,59) = 4.205, p < 0.05, η² = 0.158. Post-hoc tests indicated that the latency for emotions induced by avoidance motivation (314.849 ± 3.731 ms) was significantly longer than that for approach motivation (309.397 ± 3.898 ms). This suggests that miners require additional time for initial information processing when encountering avoidance emotions, which aligns with evolutionary psychology theories proposing that individuals allocate extra cognitive resources to process potential threats to ensure survival.
The main effect of emotional motivational intensity was not significant (F(1,59) = 0.065, p > 0.05), indicating that N2 latency is predominantly influenced by the direction of motivation rather than its intensity. In contrast, the main effect of electrode position was significant, F(4.703,276.487) = 7.795, p < 0.01,η²= 0.262. Post-hoc analyses revealed that the N2 latency was longest in the right frontal lobe area (specifically at FCz, C4, and FC3), underscoring the key role of this region in emotional processing.
The interaction effects between emotional motivational direction and intensity, as well as with electrode position, were not significant (p>0.05), and the three-way interaction was also not significant (p>0.05). Therefore, when studying the N2 component, the focus should be on the independent influence of emotional motivational direction rather than on its interaction effects.
3.2.4. P300 Component
(1) P300 Average Amplitude
A three-factor repeated measures ANOVA on the average amplitude of the P300 component revealed a significant main effect of emotional motivational direction, F(1,59) = 3.147, p<0.05,η²= 0.122. Specifically, avoidance-motivated emotions elicited higher P300 amplitudes than approach-motivated emotions, suggesting that individuals allocate more attentional resources to cope with potential threats under avoidance motivation.
The main effect of emotional motivational intensity was not significant, F(1,59) = 1.459, p>0.05. As illustrated in Figure 7, topographic map analysis revealed that the P300 amplitude was most prominently activated in the right frontal brain region (F4, FC4, Fz). This finding is consistent with related studies, suggesting that this region plays a crucial role in the allocation of attentional resources and the processing of emotional information.
The main effect of electrode position was significant, F(3.032, 178.298) = 7.503, p < 0.05, η² = 0.255, with the strongest P300 amplitude activation observed in the right frontal area. Interaction analyses revealed that the interactions between emotional motivational intensity and motivational direction, as well as between these factors and electrode position, were not significant (p>0.05).
In summary, emotional motivational direction and electrode position have a significant impact on the P300 amplitude, but their interaction is not significant, thus more attention should be paid to the effects of independent factors.
(2) P300 Latency
A three-factor repeated measures ANOVA on the latency of the P300 component revealed a significant main effect of emotional motivational direction, F(1,59) = 2.517, p < 0.05,η²=0.231.Specifically,the P300 latency was significantly longer for avoidance-motivated emotions than for approach-motivated emotions. This suggests that individuals require more time to process emotional information when in an avoidance state, reflecting a delayed response to potential threats or negative stimuli.
The main effect of emotional motivational intensity was not significant, F(1,59) = 0.022, p>0.05, suggesting that motivational intensity has a minimal impact on P300 latency. This may be because the P300 component primarily reflects processes related to attention resource allocation and memory updating, which are not directly modulated by the intensity of motivation.
The main effect of electrode position was significant, F(5.487, 325.712) = 7.145, p < 0.01,η²=0.238. Notably, the P300 latency was longest in the right frontal brain area (specifically at electrodes FCz, C4, and FC3), indicating that this region plays a crucial role in the allocation of emotional and attentional resources.
Interaction analyses revealed that the interactions between emotional motivational intensity and motivational direction, as well as between these factors and electrode position, were not significant (p > 0.05). Therefore, although emotional motivational direction and electrode position independently affect P300 latency, their combined effects are not significant. Future research should thus focus on the independent contributions of these factors.
3.2.5. LPP Components
(1) Average Amplitude of the LPP
A three-factor repeated measures ANOVA on the average amplitude of the LPP component revealed a significant main effect of emotional motivational direction, F(1,59) = 4.329, p<0.05,η²= 0.132. Specifically, the LPP amplitude elicited by avoidance-motivated emotions was significantly higher than that elicited by approach-motivated emotions. This finding suggests that under avoidance emotional motivation, individuals allocate more attentional resources to processing emotional information, thereby eliciting a stronger emotional response.
The main effect of emotional motivational intensity was not significant, F(1,59) = 2.437, p > 0.05, suggesting that motivational intensity exerts a relatively minor influence on the LPP amplitude. This indicates that motivational intensity primarily affects the sustained processing stage of emotional stimuli rather than the immediate attentional allocation.
The main effect of electrode position was significant, F(2.042, 118.498) = 7.912, p < 0.01,η²= 0.263. As illustrated in Figure 8, the LPP amplitude was most pronounced in the right frontal brain area (as indicated by electrodes F3, FC3, and FCz), suggesting that this region plays a key role in emotional processing and the allocation of attentional resources.
Interaction analyses revealed that the interactions between emotional motivational intensity, motivational direction, and electrode position were not significant (p > 0.05). Therefore, the focus should be on independently analyzing the main effects of emotional motivational direction and electrode position, rather than on their interactions.
(2) Latency of LPP
A three-factor repeated measures ANOVA was conducted on the average amplitude of the LPP component. The results revealed a significant main effect of emotional motivational direction, F(1,59) = 4.329, p < 0.05, η² = 0.132, with avoidance-motivated emotions eliciting a significantly higher LPP amplitude than approach-motivated emotions. This finding suggests that under avoidance emotional motivation, individuals allocate more attentional resources to processing emotional information, resulting in a stronger emotional response.
In contrast, the main effect of emotional motivational intensity was not significant, F(1,59) = 2.437, p > 0.05, indicating that motivational intensity has a relatively minor impact on the LPP amplitude and primarily affects the sustained processing stage of emotional stimuli.
Additionally, the main effect of electrode position was significant, F(2.042,118.498) = 7.912, p < 0.01, η² = 0.263, with the strongest LPP amplitude observed in the right frontal brain area (specifically at F3, FC3, and FCz). This suggests that the right frontal region plays a key role in emotional processing and the allocation of attentional resources.
Interaction analyses showed that the interactions between emotional motivational intensity and motivational direction, as well as with electrode position, were not significant (p > 0.05). Therefore, the focus should be on independently analyzing the main effects of emotional motivational direction and electrode position rather than on their interactions.
4. Discussion
4.1. Behavioral Decision Outcomes
4.1.1. Analysis of Behavioral Decision-Making Engagement
From the perspective of individual emotions, miners experiencing avoidance-motivated emotional states are more inclined to participate in coal mine emergencies. According to Isen and Partrick's (1983) mood maintenance hypothesis, emergencies may trigger negative emotions such as sadness or resentment. Driven by avoidance motivation, miners are more likely to alter the status quo through risky behavior. The theory of emotional motivation further suggests that in dangerous situations, the defense system is activated—manifesting as withdrawal, avoidance, or aggression. In this study, a miner's decision to participate in an emergency event can be interpreted as a self-protective measure aimed at avoiding potential losses.
In contrast, miners in a state of approach motivation tend to exhibit a lower willingness to participate in such events. Approach-related emotions evoke positive experiences that encourage individuals to maintain the status quo and avoid risks. According to the theory of emotional motivation, approach emotions activate the desire system, leading to survival behaviors. In the context of sudden emergencies in coal mines, miners may perceive the costs of taking action as high and the benefits as uncertain, prompting them to choose non-participation.
Overall, both the direction and intensity of emotional motivation significantly impact miners' decision-making participation level (DPL). High-intensity avoidance motivational emotions, for example, can stimulate a greater willingness to participate than low-intensity avoidance emotions, indicating that strong avoidance motivation more effectively activates miners' motivational systems. Conversely, high-intensity approach emotions tend to decrease miners' willingness to participate, leading them to opt for non-participation.
4.1.2. Behavioral Decision Response Time Analysis
According to the statistical results, response times (RT) under low-motivation approach emotions are significantly shorter than those under high-motivation approach emotions, indicating that low-motivation approach emotions facilitate the execution of decision-making tasks. Based on the BBT theory, positive emotions enhance cognitive flexibility; however, the emotional-motivational dimension model suggests that excessively high levels of motivational intensity can have negative effects. Under high approach motivational emotions, individuals tend to become overly focused on their goals, which narrows their attention span and adversely affects performance, whereas low-motivation approach emotions help to broaden attention, thereby aiding the processing of multiple stimuli and enhancing cognitive performance.
In contrast, high avoidance motivational emotions significantly increase response times. The PET theory, along with the emotional-motivational dimension model, indicates that avoidance emotions consume cognitive resources by channeling attention predominantly toward threat-related information and neglecting other stimuli, ultimately impairing decision-making.
In summary, the motivational aspects of emotions significantly affect individual decision-making response times, with the most efficient responses observed under conditions of low-motivation and approach emotions.
4.2. ERP Component Analysis Results
4.2.1. N1 Component Analysis
Studies suggest that emotional motivation influences early attention processing through several key mechanisms:
Attention Resource Allocation:
Low motivational intensity emotions elicit larger N1 amplitudes, which indicates that a greater allocation of attentional resources is required to process these emotional stimuli. This finding is in line with emotional motivation theory, which posits that less intense emotional states may demand increased processing effort to fully decode the emotional content.
Narrowing of Cognitive Processing:
High motivational intensity emotions are associated with prolonged N1 latency, suggesting that such emotions may narrow the scope of cognitive processing. According to the emotional motivation dimension model, high motivational emotions lead individuals to focus more intently on emotional stimuli, which in turn restricts the processing of other, non-emotional information.
Differential Effects of Approach and Avoidance Emotions:**
Approach emotions tend to enhance N1 amplitude and prolong N1 latency, indicating an increased early processing demand for emotionally relevant stimuli. In contrast, avoidance emotions are characterized by lower N1 amplitudes and shorter latencies, suggesting that they require less extensive early attentional processing.
Together, these mechanisms highlight how both the intensity and the nature (approach vs. avoidance) of emotional motivation modulate the early stages of attentional processing, affecting how cognitive resources are allocated and how broadly information is processed.
4.2.2. P2 Component Analysis
P2 is highly sensitive to dangerous information and can rapidly mobilize attentional resources to identify potential threats—a trait that is critically important from an evolutionary perspective. The analysis results indicate that although the main effect of emotional motivational direction on the amplitude of P2 was not significant (p > 0.05), the amplitude of P2 elicited by avoidance motivation (1.112 ± 0.483 μV) was higher than that elicited by approach motivation (0.295 ± 0.535 μV). Moreover, the main effect of emotional motivational intensity on P2 amplitude was significant (p < 0.05), with high-intensity emotional motivation producing a significantly greater amplitude (1.325 ± 0.480 μV) compared to low-intensity emotional motivation (0.645 ± 0.502 μV). Notably, under high-intensity avoidance motivation, miners exhibited a more pronounced P2 component, reflecting the brain's rapid response to significant threats and its prioritization in allocating attentional resources to process potential danger signals.
Analysis of P2 latency revealed a significant main effect of emotional motivational intensity: the latency of P2 under high-intensity emotional motivation (191.298 ± 3.456 ms) was significantly longer than that under low-intensity emotional motivation (182.752 ± 3.010 ms). In contrast, the direction of emotional motivation did not have a significant effect on P2 latency. Additionally, the main effect of electrode position was significant, with joint activation being particularly prominent in the frontal and central areas. This finding underscores the key role of these brain regions in emotional information processing. When confronted with dangerous stimuli, the increased activity in these areas reflects the allocation of more cognitive resources to enable a rapid and effective response to potential threats.
4.2.3. N2 Component Analysis
The N2 component exhibits a negative waveform between 260 and 350 milliseconds after stimulus presentation, playing a crucial role in monitoring and evaluating cognitive conflicts and decision-making processes. Its amplitude directly reflects the intensity of the conflict. In coal mine emergencies, which often trigger negative emotions, a mismatch between an individual’s emotional experience and the external emotional tone can provoke significant cognitive conflict.
Statistical analysis indicates that the main effect of emotional motivational direction is significant; approach-motivated emotions elicit a more pronounced negative N2 component than avoidance-motivated emotions. This suggests that under approach motivation, individuals experience a greater degree of cognitive and decision-making conflict—particularly in emergency situations such as coal mine incidents, where these conflicts may be even more intense.
Although the overall main effect of emotional motivational intensity is not significant, further analysis reveals that within the context of approach motivation, high motivational intensity induces a more negative N2 component. This finding indicates that while motivational intensity may not broadly impact the N2 component, its variations under specific motivational directions can still exert a meaningful influence.
Moreover, brain topography analysis shows significant activation in the frontal lobe during the processing of these stimuli, which aligns with the established role of the N2 component in cognitive conflict monitoring. This further emphasizes the importance of the frontal lobe in conflict processing and decision-making.
4.2.4. P300 Component Analysis
The P300 component, a prominent positive ERP waveform, typically peaks between 300 and 450 milliseconds after stimulus onset. Its activation spans a broad range of brain regions, beginning in the frontal lobe and extending posteriorly. Both the amplitude and latency of the P300 are modulated by several factors, including the experimental task design, attention allocation strategies, and the nature of the stimulus. Prior research has consistently demonstrated that emotional and motivational stimuli can significantly enhance P300 amplitude.
Statistical analyses reveal significant differences in P300 amplitude along the emotional-motivational dimension (p < 0.05). Specifically, avoidance-motivated emotions elicit significantly higher P300 amplitudes compared to approach-motivated emotions, which aligns with related studies in the field. Additionally, there is a negative correlation between the P300 amplitude and decision-making difficulty—indicating that as the difficulty of the decision-making task increases, the amplitude of the P300 decreases.
Regarding latency, under approach-motivated emotional conditions, the P300 latency is prolonged, suggesting that more processing time is required to handle emotional information. In contrast, motivational intensity does not appear to have a significant effect on P300 latency. Moreover, during the processing of emotional conflict, the right prefrontal lobe exhibits marked activation, further underscoring the pivotal role of the P300 component in emotional-motivational processing.
4.2.5. LPP Component Analysis
The LPP component is a late positive electrophysiological response that occurs between 500 and 900 milliseconds after stimulus presentation, similar to the P300, and is particularly sensitive to potential threat signals. When exposed to danger cues, the LPP amplitude increases markedly. Previous studies have demonstrated that the LPP amplitude elicited by risk stimuli is significantly higher than that elicited by safe stimuli, with high-risk stimuli further amplifying this effect. Moreover, the sustained late slow-wave activity of the LPP reflects the continuous allocation of attentional resources to the stimulus and is positively correlated with the arousal level of emotional stimuli.
In terms of emotional motivation orientation, the LPP component exhibits a significant main effect. Specifically, emotional stimuli characterized by an avoidance motivational orientation elicit a stronger LPP amplitude response, indicating that individuals allocate higher processing priority when encountering potential danger signals. Additionally, brain topography analysis reveals significant activation in the left frontal brain area, indicating an asymmetry between the left and right frontal regions. This finding further supports the crucial role of the frontal cortex in mediating emotion and attentional resource allocation.
5. Conclusions
This study explores how the direction and intensity of emotional motivation impact miners' decision-making during coal mine emergencies, revealing the underlying neural mechanisms through ERP component analysis. The results indicate that both the direction and intensity of emotional motivation significantly influence the decision-making process. Specifically, under avoidance motivational emotions, miners exhibit a higher willingness to participate in emergency responses but also demonstrate longer decision-making response times—suggesting that they are more cautious and invest more time in risk assessment when potential threats are perceived. Conversely, under approach motivational emotions, miners show a lower willingness to participate and faster decision-making speeds, which may reflect a lower sense of tension and a propensity for quicker decisions in emergencies.
Further ERP component analysis underscores the effect of emotional motivation on miners' cognitive processes. The study found that emotional motivation significantly affects early attention allocation—as evidenced by changes in the N1 and P2 components—and influences cognitive conflict processing, as indicated by variations in the N2, P300, and LPP components. Under avoidance motivational emotions, enhanced N1 and P2 amplitudes suggest that miners allocate greater attentional resources toward assessing potential threats. In contrast, under approach motivational emotions, miners appear to focus more on reward-related information, leading to different patterns of cognitive resource allocation. Moreover, the heightened cognitive conflict responses observed under avoidance motivational conditions indicate that miners are more vigilant and sensitive when facing high-risk situations.
In summary, the findings demonstrate that emotional motivation modulates miners' decision-making behavior during coal mine emergencies by affecting their attention allocation, cognitive conflict processing, and decision-making reaction times. These insights not only provide theoretical support for understanding the role of emotional motivation in decision-making but also offer practical guidance for enhancing coal mine safety management. Future research should explore how emotional regulation strategies can further optimize decision-making processes, ultimately improving safety management and reducing the risk of accidents in coal mines.
Author Contributions
Conceptualization, Y.Z. and S.T.; methodology, Y.Z.; software, Y.Z. and J.M.; validation, J.M. and G.S.; formal analysis, Y.Z. and G.S.; data curation, Y.Z.; writing—original draft, Y.Z. and S.T.; writing—review and editing, Y.Z., F.T., J.M. and G.S.; visualization, Y.Z. and J.M.; supervision, G.S.; project administration, S.T. and J.M. All authors have read and agreed to the published version of the manuscript.
Data Availability Statement
The data used to support the findings of this study are available from the corresponding author upon request(19120089020@stu.xust.edu.cn).
Conflicts of Interest
The authors declare that there are no conflicts of interest regarding the publication of this paper.
Ethical Statement
This study was conducted in accordance with the ethical principles outlined in the [Declaration of Helsinki/other relevant guidelines] and was approved by the [Ethics Committee of the 521 Hospital, China North Industries Group Corporation] (Approval Number: [2023-56490]). Written informed consent was obtained from all participants prior to their involvement in the study.
References
- Smith, J., Johnson, R., & Wang, T. (2020). The role of decision-making in coal mine emergency response. Journal of Mining Safety and Technology, 45(2), 112-125.
- Chen, X. (2021). Analysis of miners' behavioral decisions during mining accidents. Journal of Safety Research, 75, 80-89.
- Yang, H., Liu, P., & Zhao, X. (2018). Influence of high-pressure environments on decision-making under coal mine emergency conditions. Mining Engineering Review, 58(3), 45-53.
- Li, H., & Wang, J. (2017). The impact of emotional motivation on decision-making behavior in emergency situations. Journal of Behavioral Decision Making, 30(6), 543-550.
- Liu, X., & Zhang, P. (2022). Emotional intensity and direction in high-risk decision-making: Evidence from the coal mining industry. Applied Psychology in Mining Safety, 22(4), 333-340.
- Xu, G., & He, S. (2020). Theoretical perspectives on emotional motivation in crisis decision-making. Journal of Applied Psychology, 48(2), 200-212.
- Lerner, J. S., Li, Y., Valdesolo, P., & Kassam, K. S. (2015). Emotion and decision making. Annual Review of Psychology, 66, 799-823.
- Gray, J. A. (2004). Neuropsychology of emotion and personality. In L. F. Barrett & P. Salovey (Eds.), The wisdom in feeling: Psychological processes in emotional intelligence (pp. 78-100). New York: Guilford Press.
- Kuhnen, C. M., & Knutson, B. (2011). The influence of affective responses to financial decisions. Journal of Neuroscience, Psychology, and Economics, 4(4), 220-233.
- Bechara, A., Damasio, A. R., & Damasio, H. (2000). Emotion, decision making and the orbitofrontal cortex. Cerebral Cortex, 10(3), 295-307. [CrossRef]
- Pessoa, L. (2008). On the relationship between emotion and cognition. Nature Reviews Neuroscience, 9(2), 148-158. [CrossRef]
- Knutson, B., Fong, G. W., & Adams, C. M. (2008). Neural responses to monetary incentives in major depression. Biological Psychiatry, 63(8), 746-751.
- Gross, J. J. (2002). Emotion regulation: Affective, cognitive, and social consequences. Psychophysiology, 39(3), 281-291.
- Picton, T. W., & Hillyard, S. A. (2021). The neurophysiology of ERP: From perception to cognition. Trends in Neurosciences, 44(7), 487-498.
- Luck, S. J. (2021). Electrophysiology of cognition: The N1 wave and its role in early perceptual processing. Journal of Cognitive Neuroscience, 33(7), 1187-1204.
- Gonzalez, H. F., & Thomas, L. H. (2020). The P2 component: Mechanisms of cognitive processing and attention allocation. Neuropsychologia, 140, 107321.
- Dien, J., & Spencer, K. M. (2019). N2 and cognitive control: The role of conflict monitoring and adaptive regulation. Frontiers in Psychology, 10, 1592.
- Polich, J. (2022). P300: A retrospective review of its functional significance and recent developments. Biological Psychology, 162, 108050.
- Schupp, H. T., Cuthbert, B. N., & Bradley, M. M. (2021). The LPP as an index of emotional processing: A review of recent findings. Emotion, 21(4), 785-803.
- O'Reilly, J. X., Woolrich, M. W., Behrens, T. E., & Mars, R. B. (2013). Hierarchical cognitive control and the human brain. Journal of Neuroscience, 33(29), 11787-11793.
- Kappenman, E. S., & Luck, S. J. (2010). The effects of volume conduction and filtering on the fidelity of ERP scalp distributions. Psychophysiology, 47(4), 822-832.
- Polich, J. (2012). Clinical application of the P300 event-related potential. Pharmacology Biochemistry and Behavior, 101(2), 120-130. [CrossRef]
- Picton, T. W., & Hillyard, S. A. (2021). The neurophysiology of ERP: From perception to cognition. Trends in Neurosciences, 44(7), 487-498.
- Lerner, J. S., Li, Y., Valdesolo, P., & Kassam, K. S. (2015). Emotion and decision making. Annual Review of Psychology, 66, 799-823.
- Bradley, M. M., Cuthbert, B. N., & Lang, P. J. (2001). Emotion and motivation: Defensive and appetitive responses to motivationally salient stimuli. Psychological Science, 12(6), 408-413.
- Lang, P. J. (2000). Emotion, motivation, and the brain: Reflex foundations in animal and human research. International Journal of Psychophysiology, 35(2-3), 135-173.
- Carver, C. S., & Harmon-Jones, E. (2009). Anger is an approach-related emotion: Evidence and implications. Psychological Bulletin, 135(2), 183-204.
- Kanske, P., Heissler, J., Schönfelder, S., & Wessa, M. (2011). How to regulate emotion? Neural networks for reappraisal and distraction. Cognitive, Affective, & Behavioral Neuroscience, 11(2), 145-157. [CrossRef]
- Schupp, H. T., Cuthbert, B. N., Bradley, M. M., & Lang, P. J. (2000). Affective picture processing: The late positive potential is modulated by motivational relevance. Psychophysiology, 37(3), 211-218.
Figure 1.
Experimental flowchart.
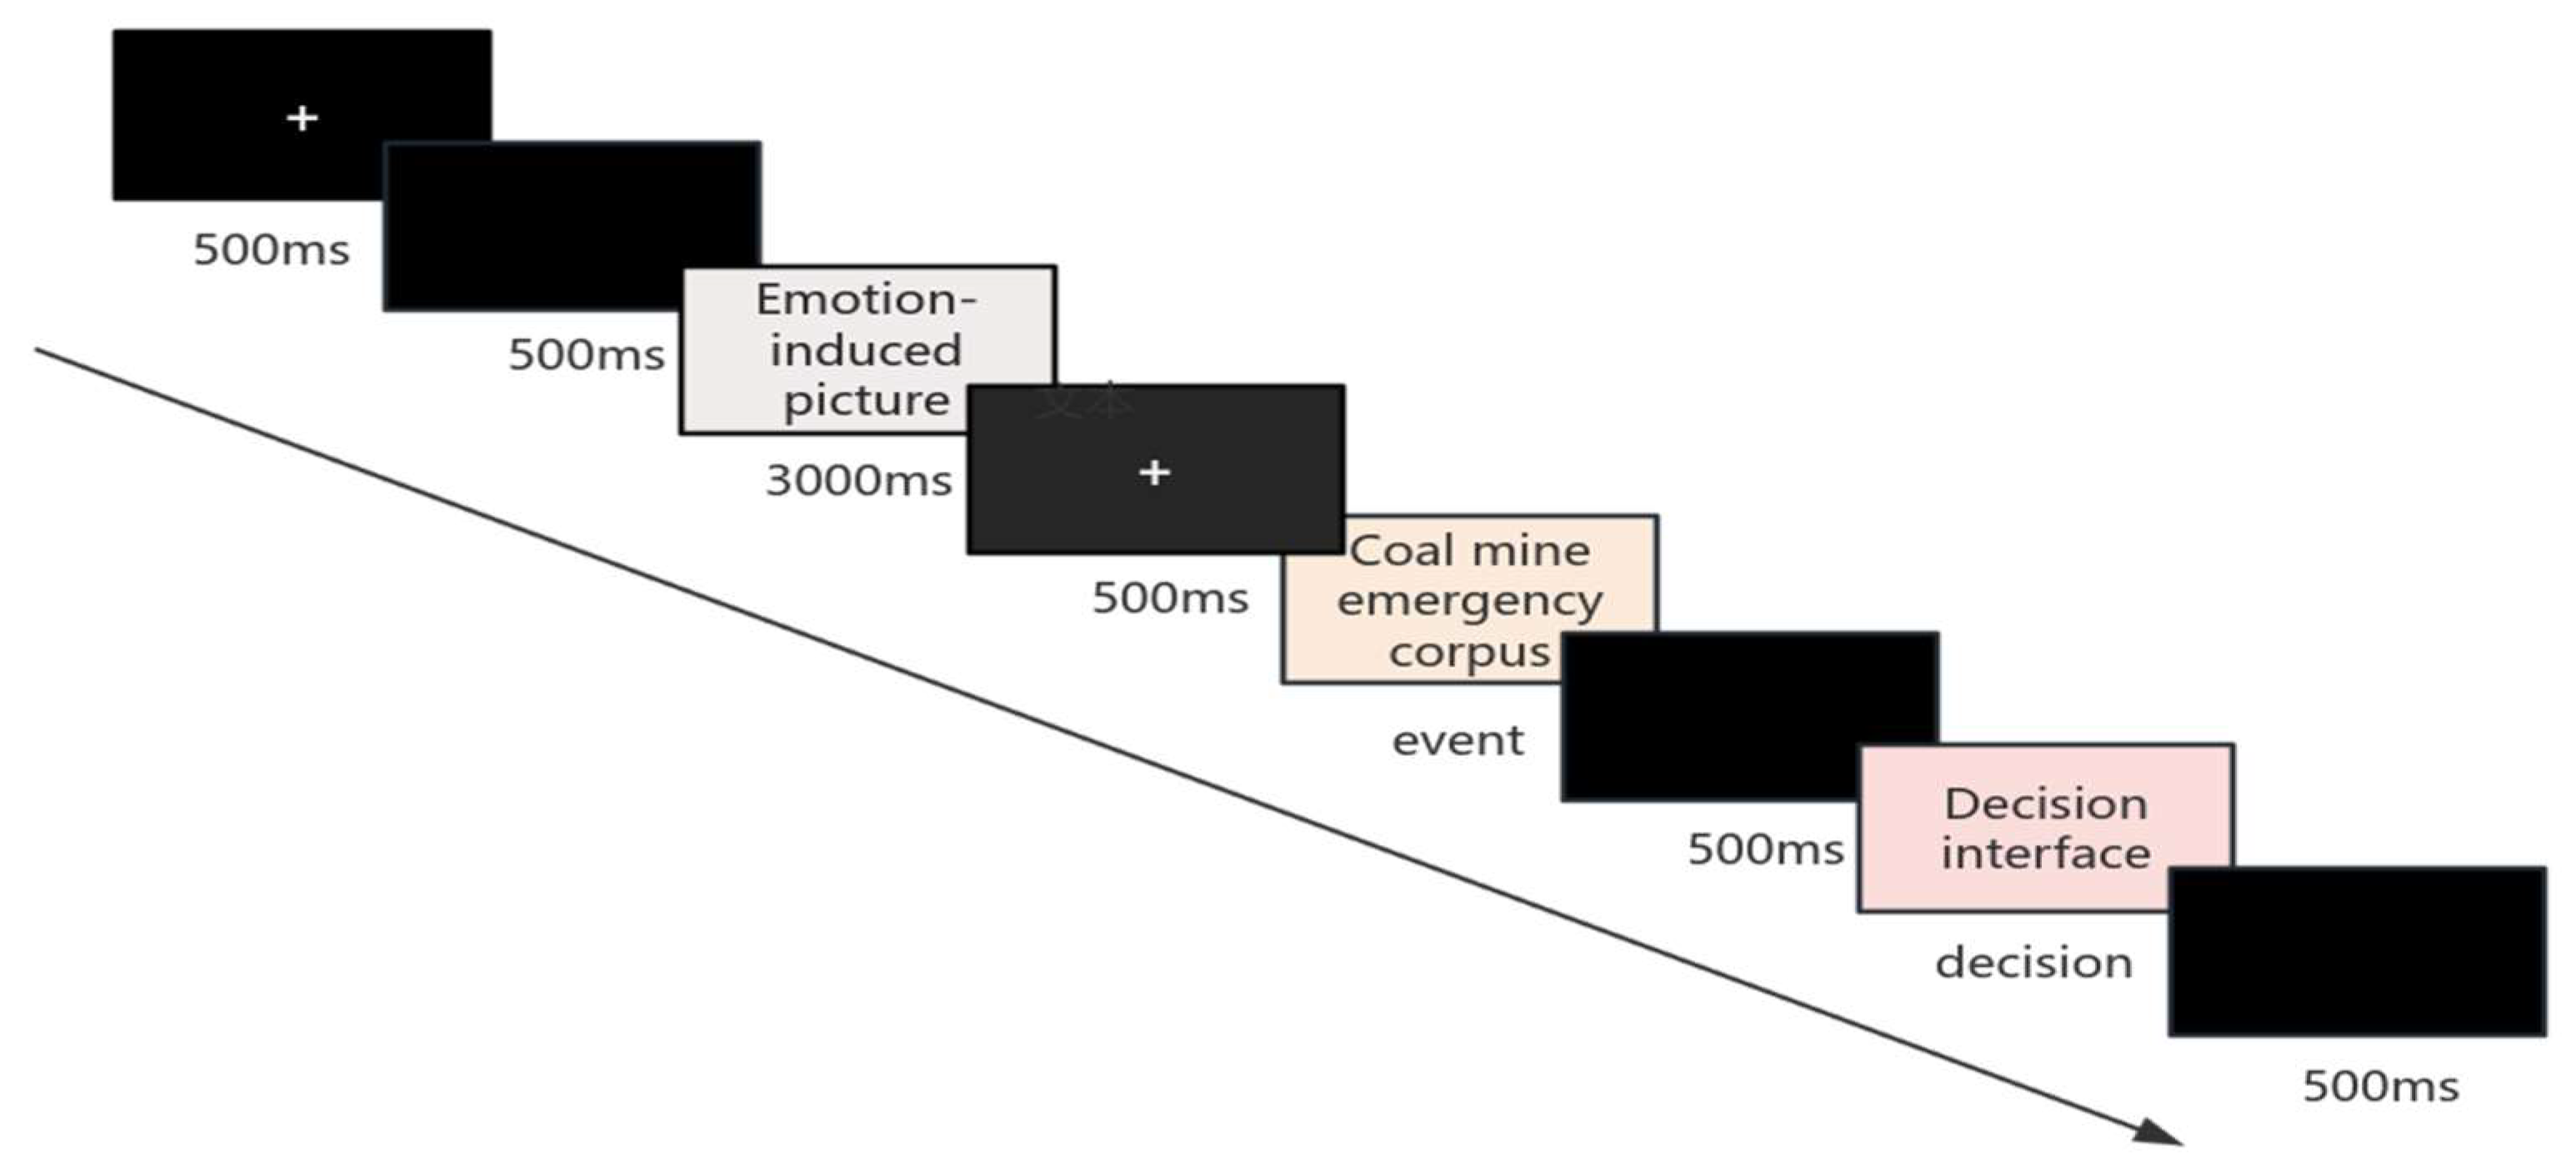
Figure 2.
PICME in Behavioral Decision-Making Across Different Emotional Types.
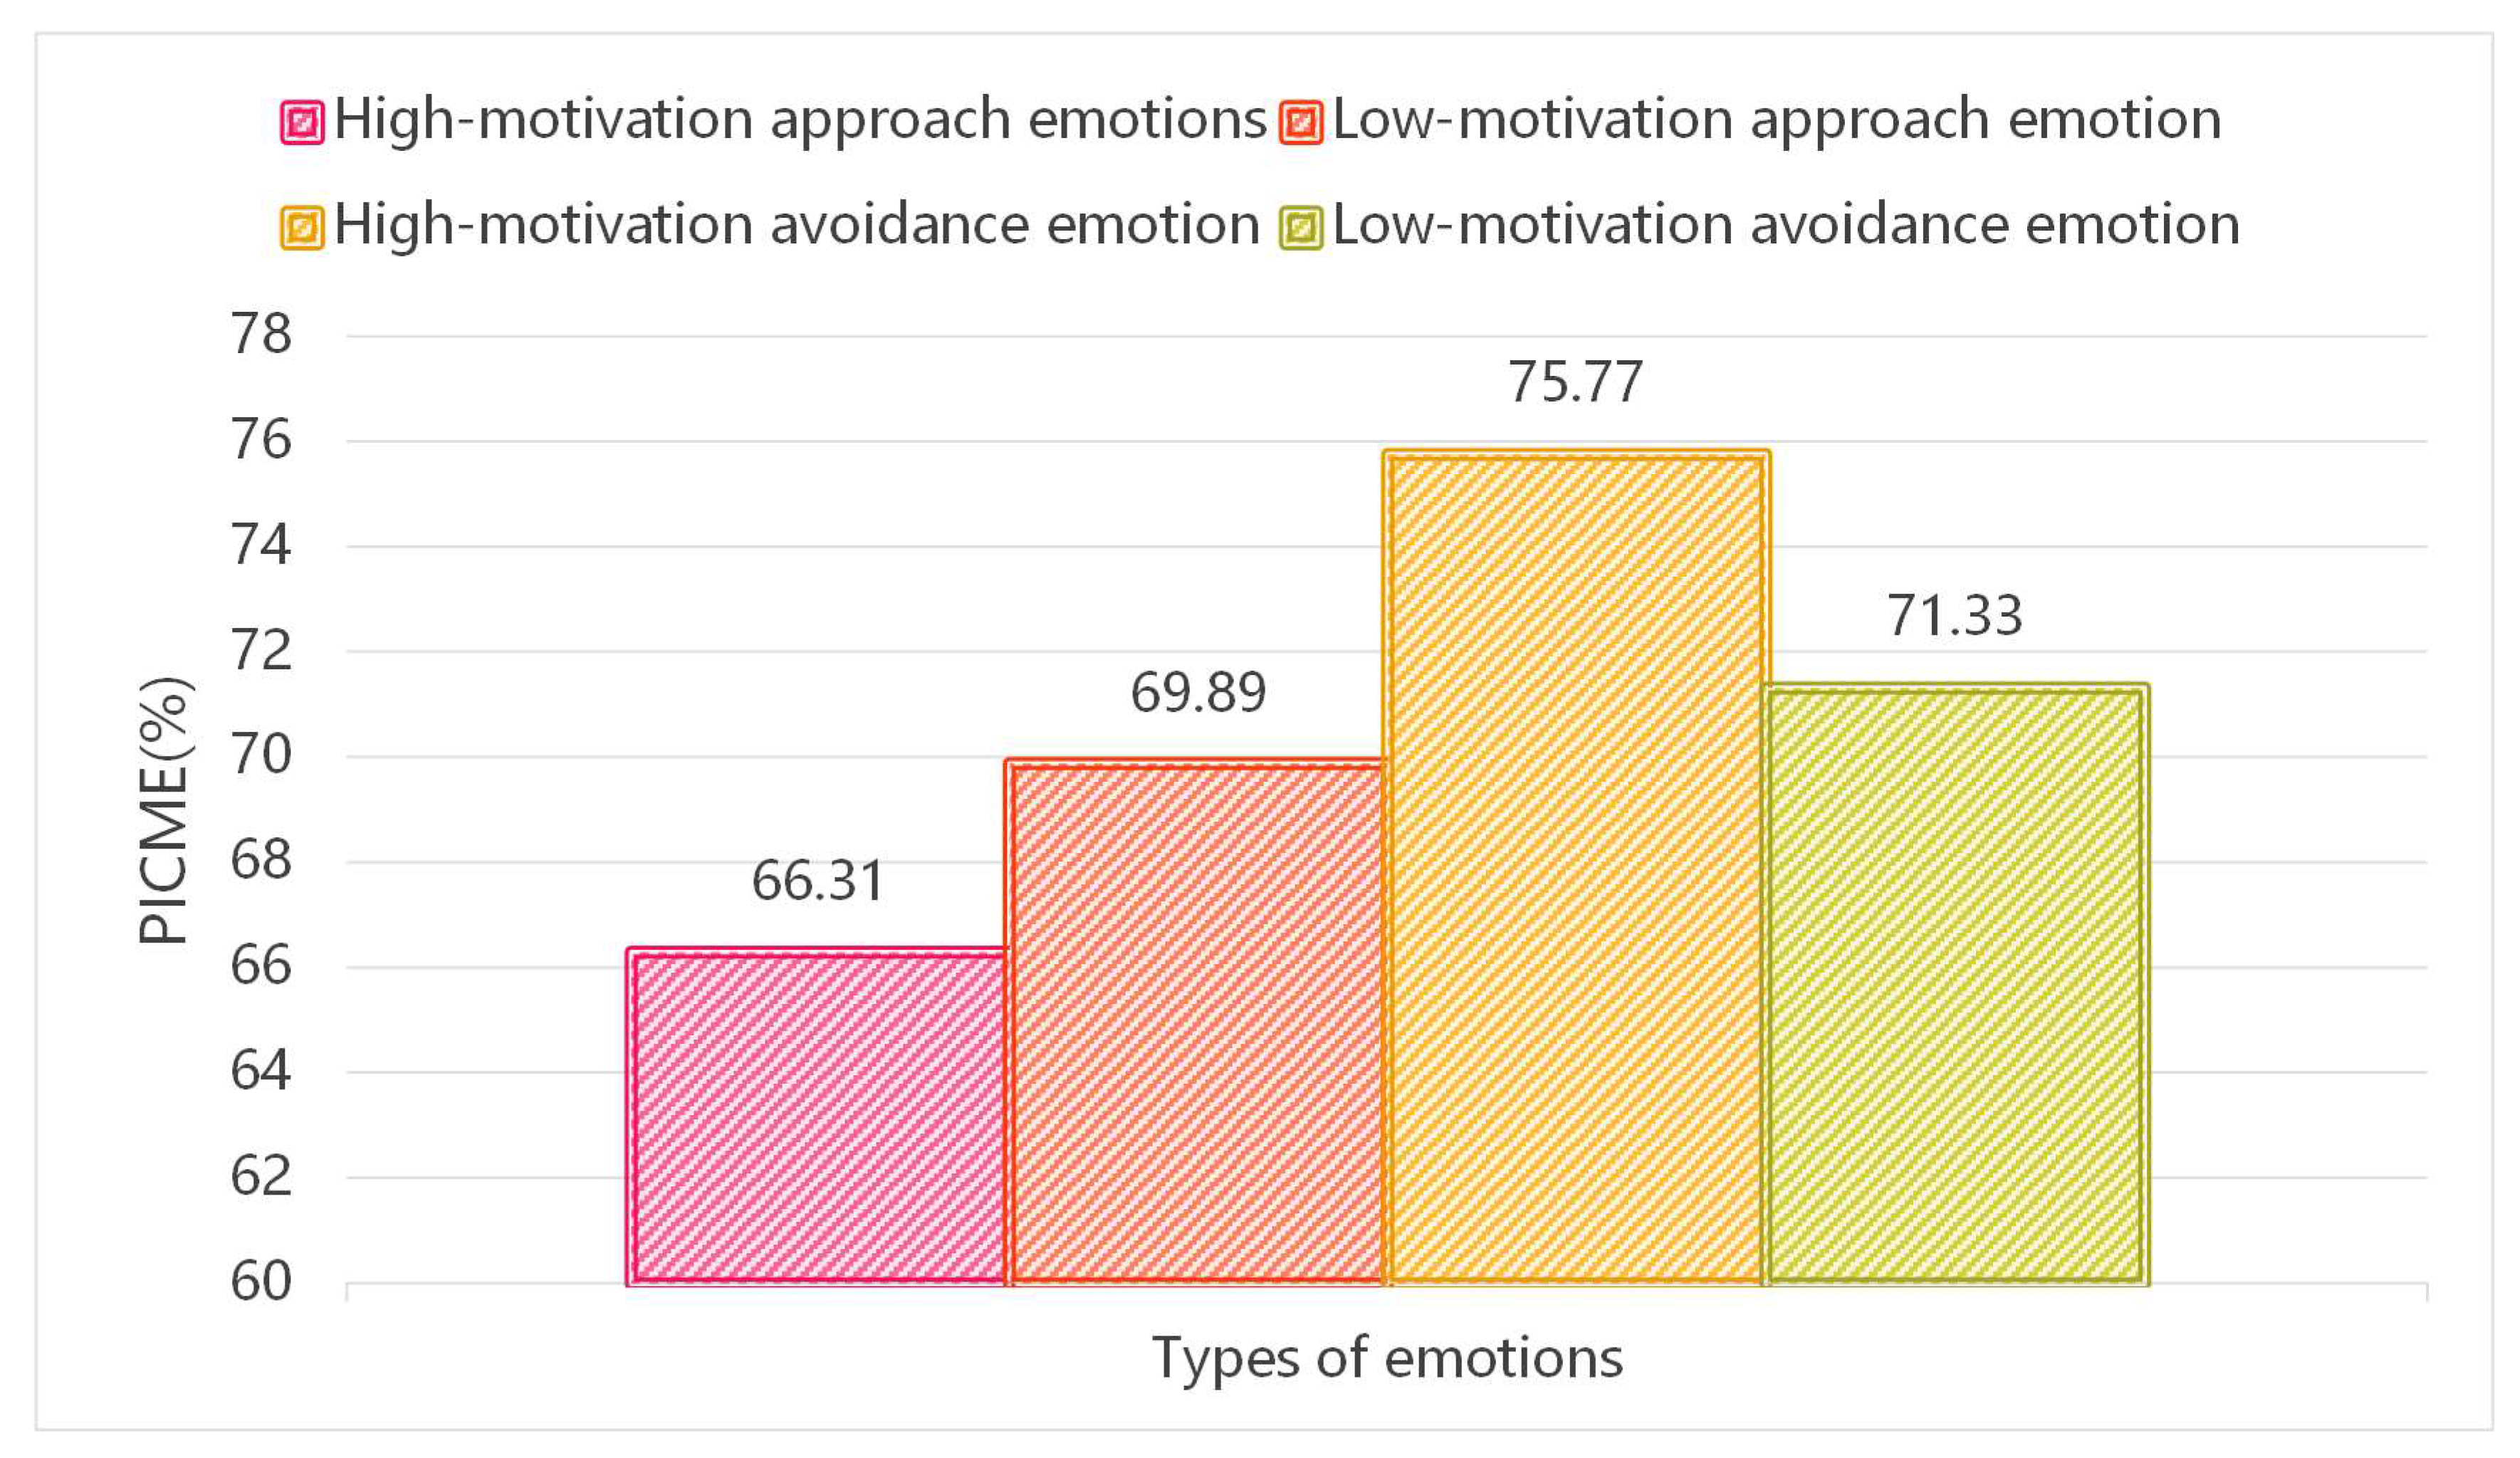
Figure 3.
Reaction time for behavioral decision-making under different emotional types.
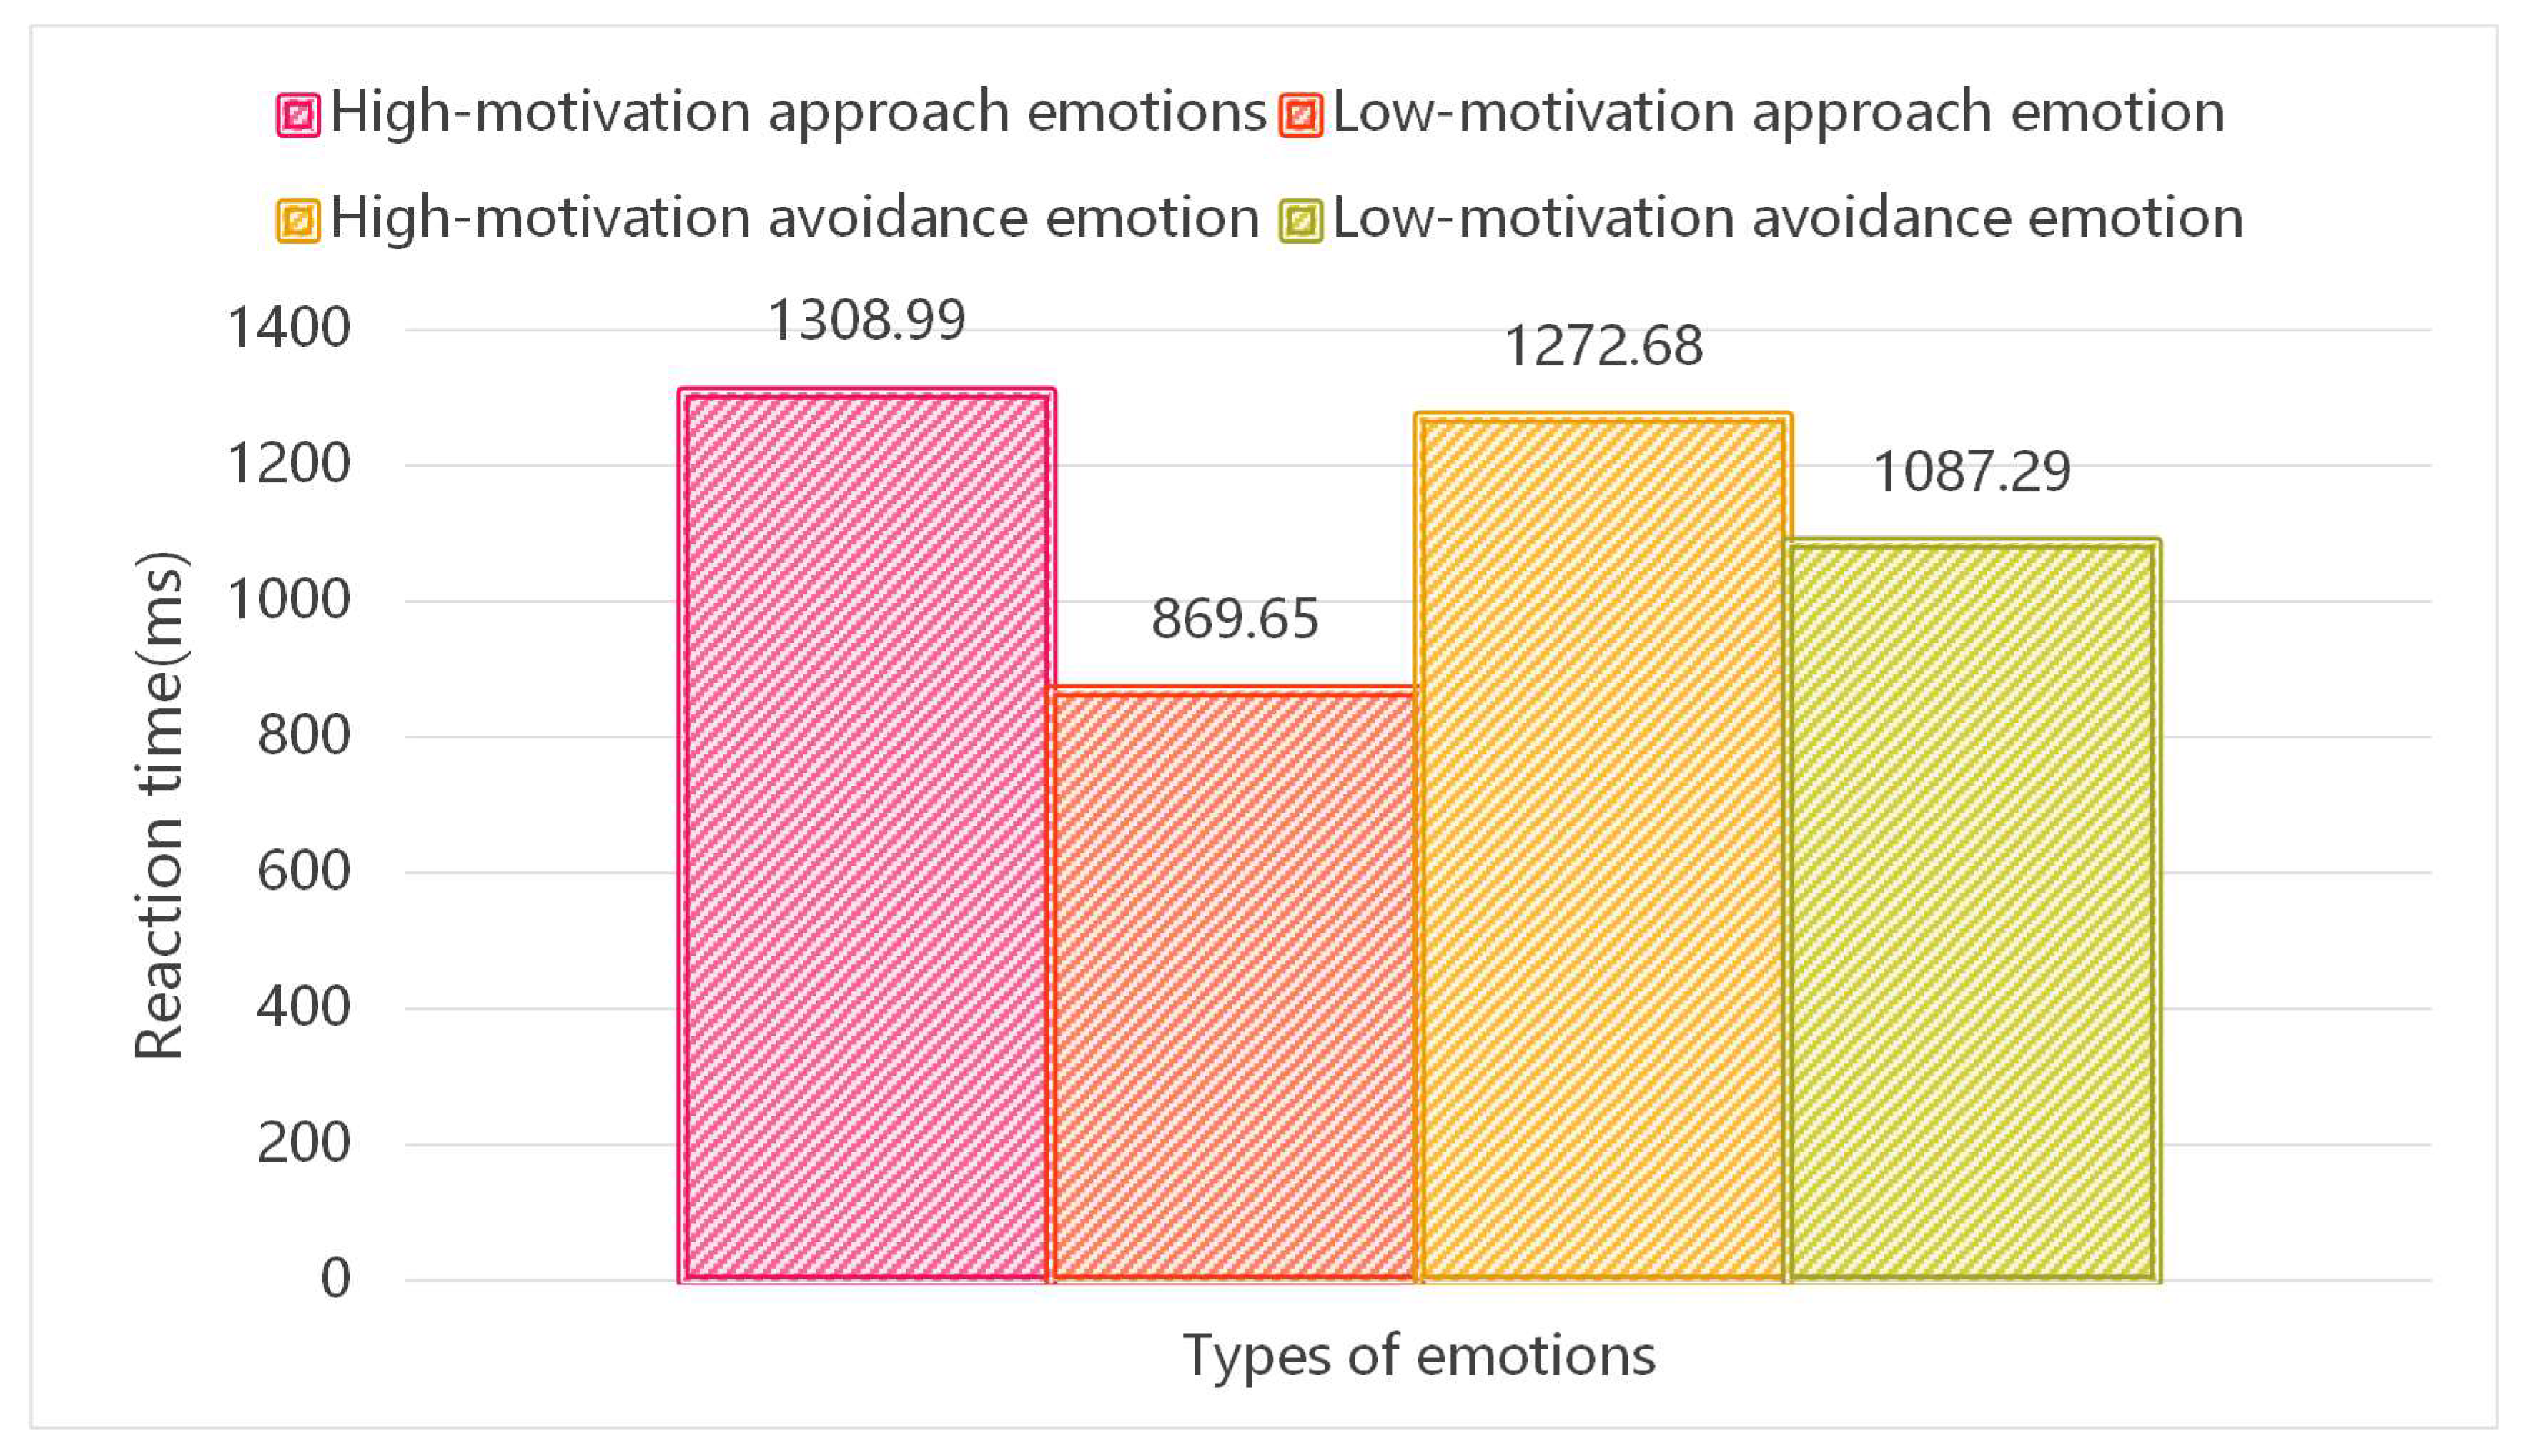
Figure 4.
Brain topography of N1 component.
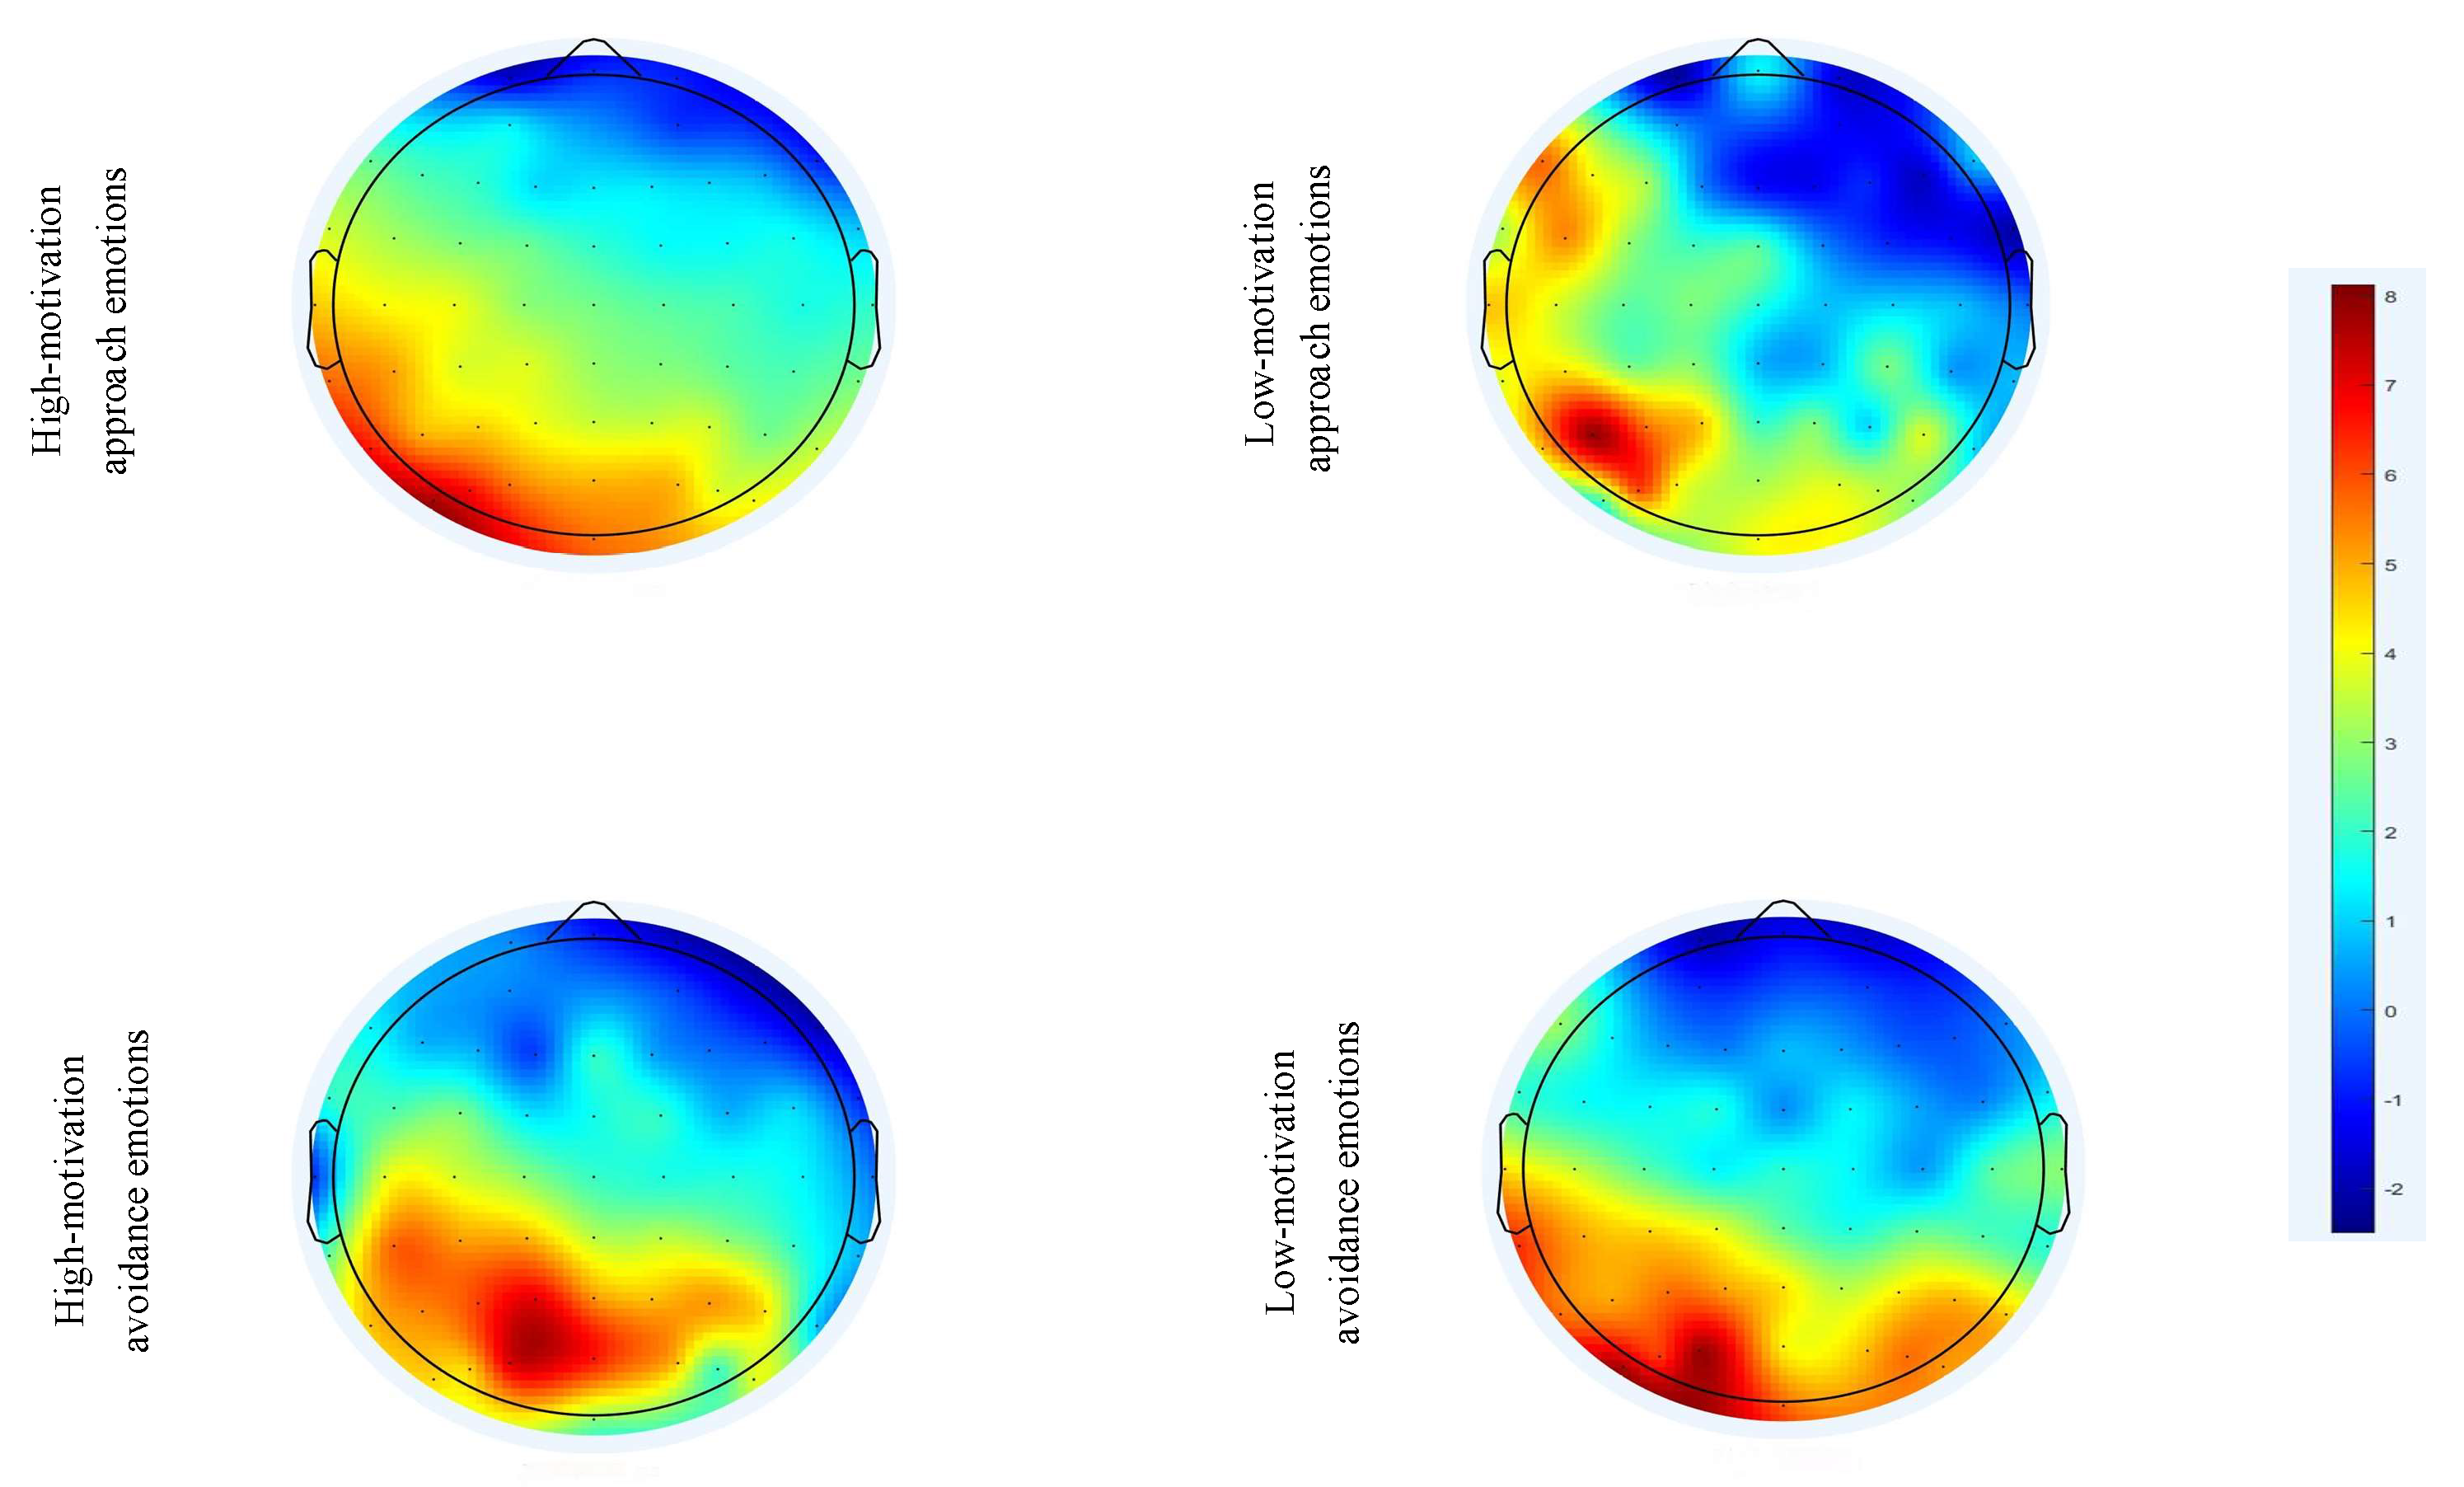
Figure 6.
Brain topography of N2 component.
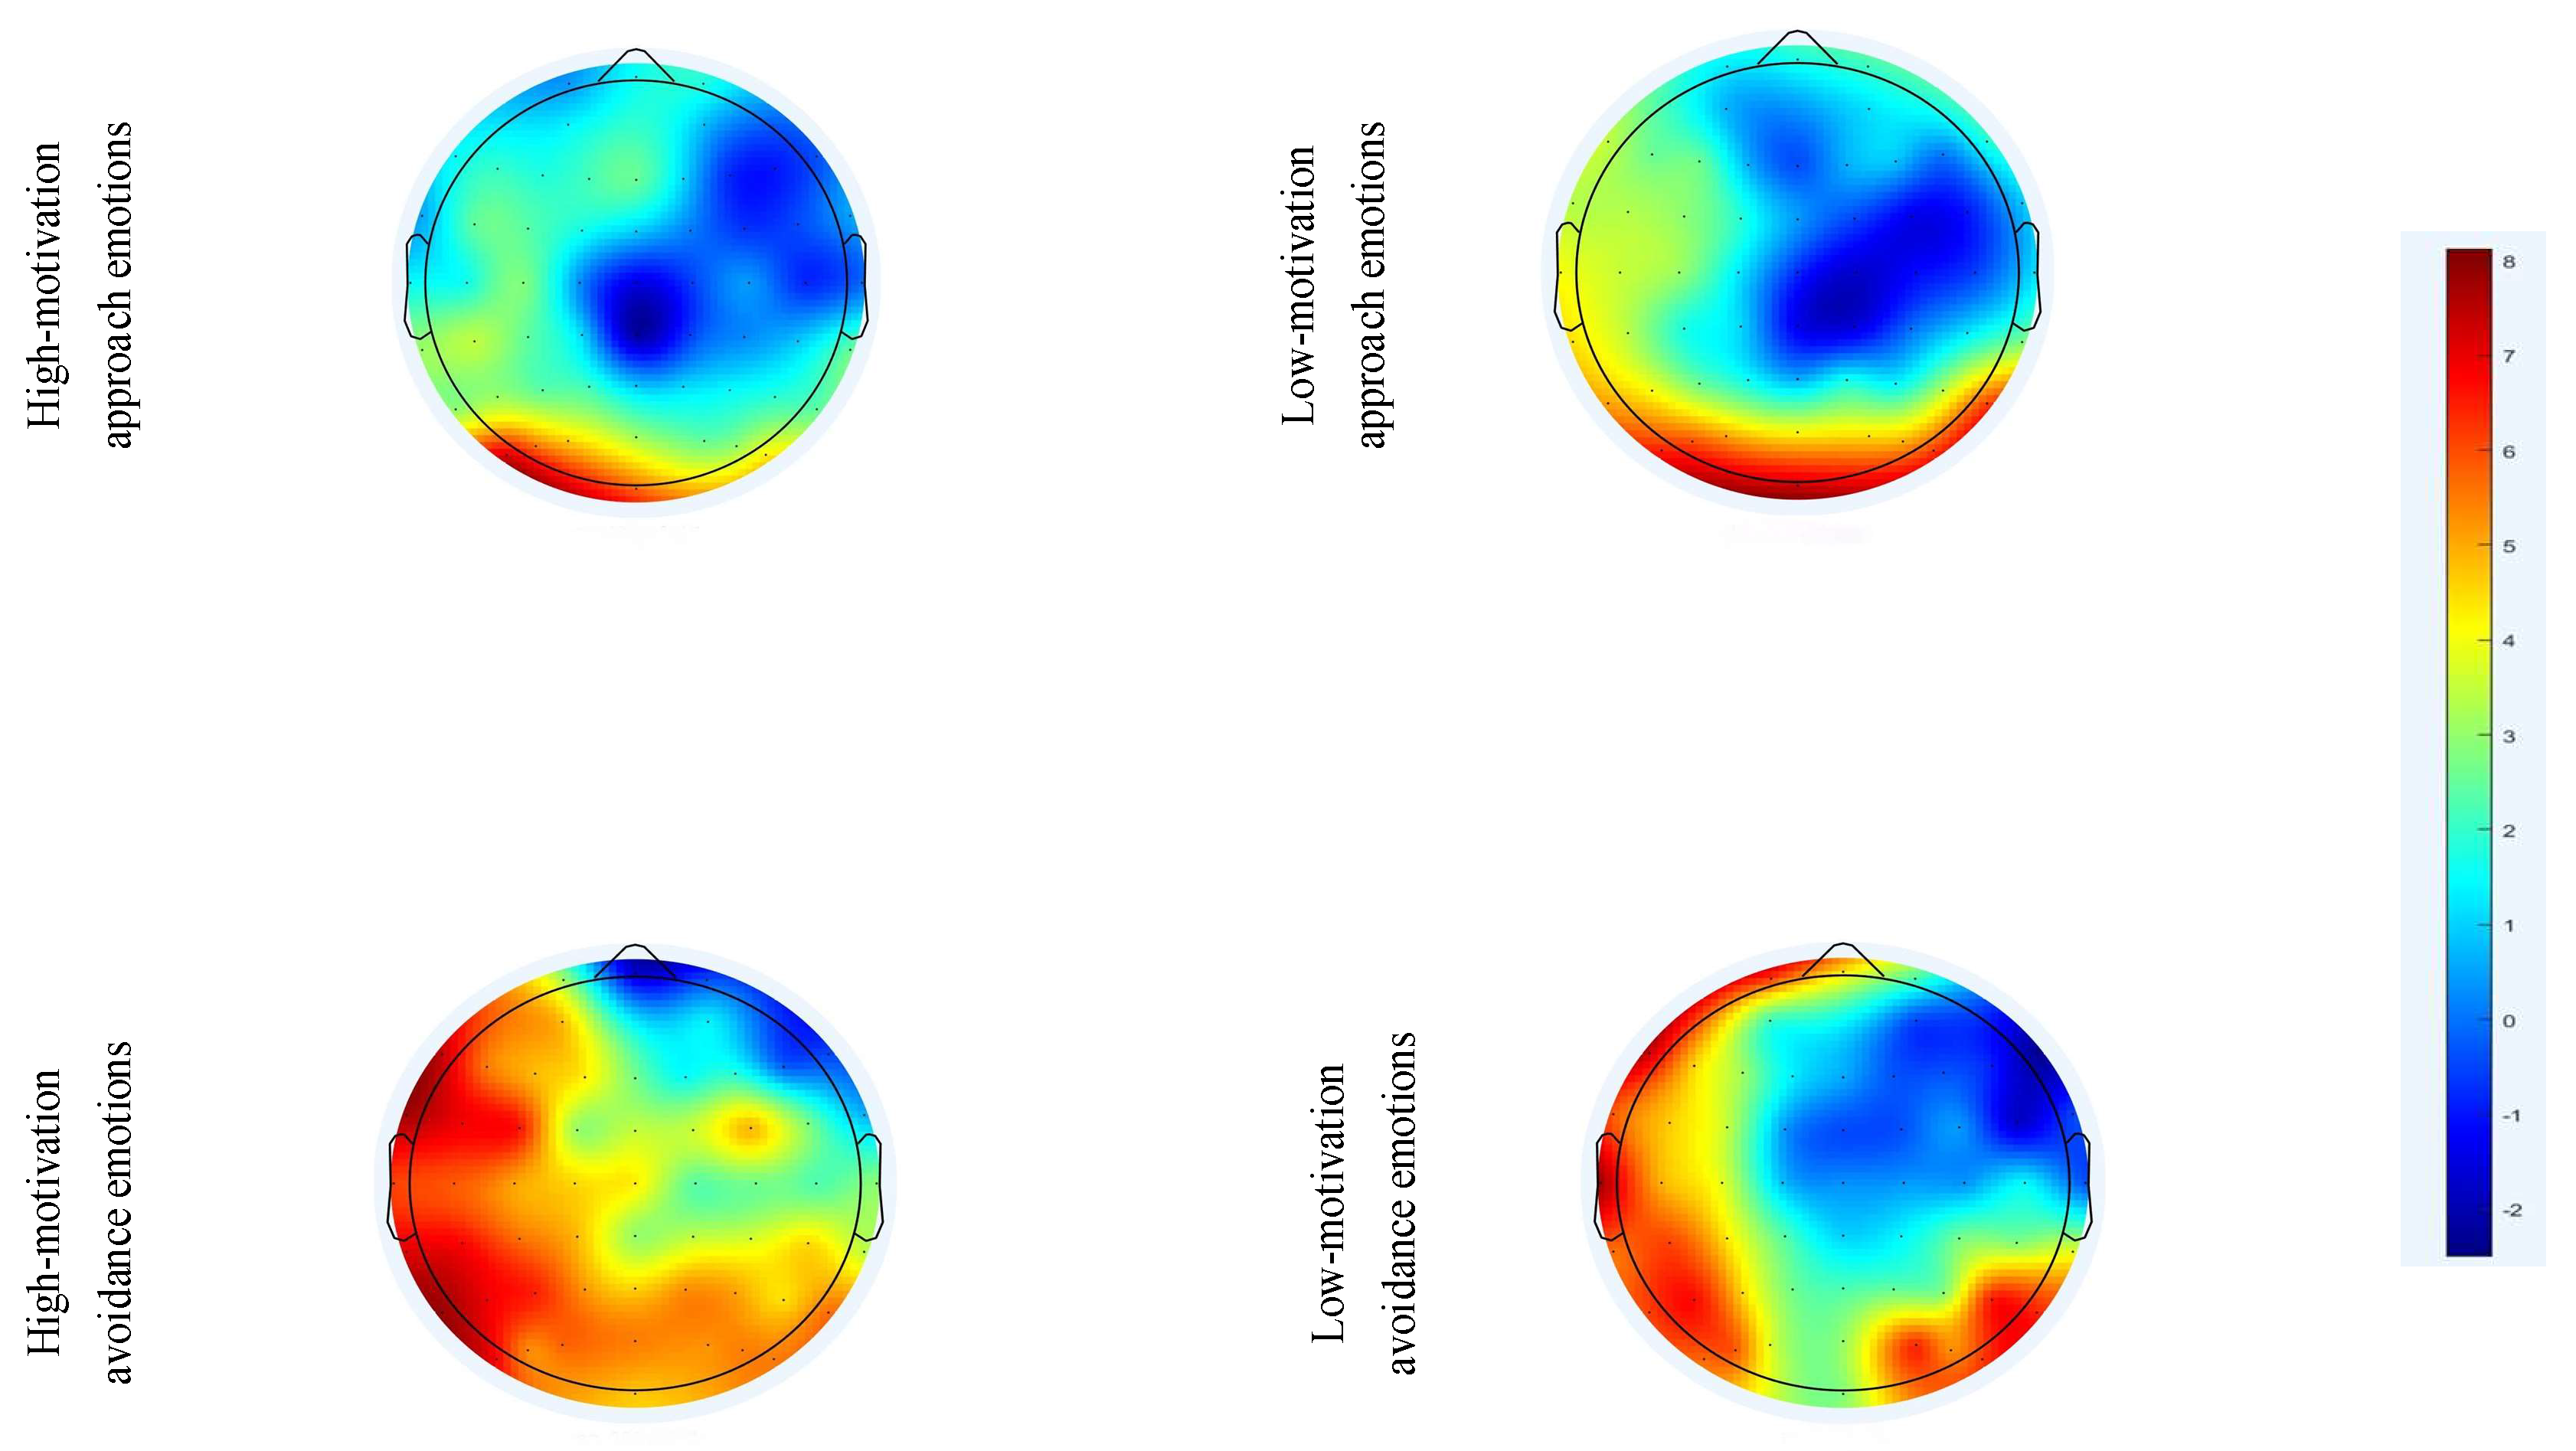
Figure 7.
Brain topography of P300 components.
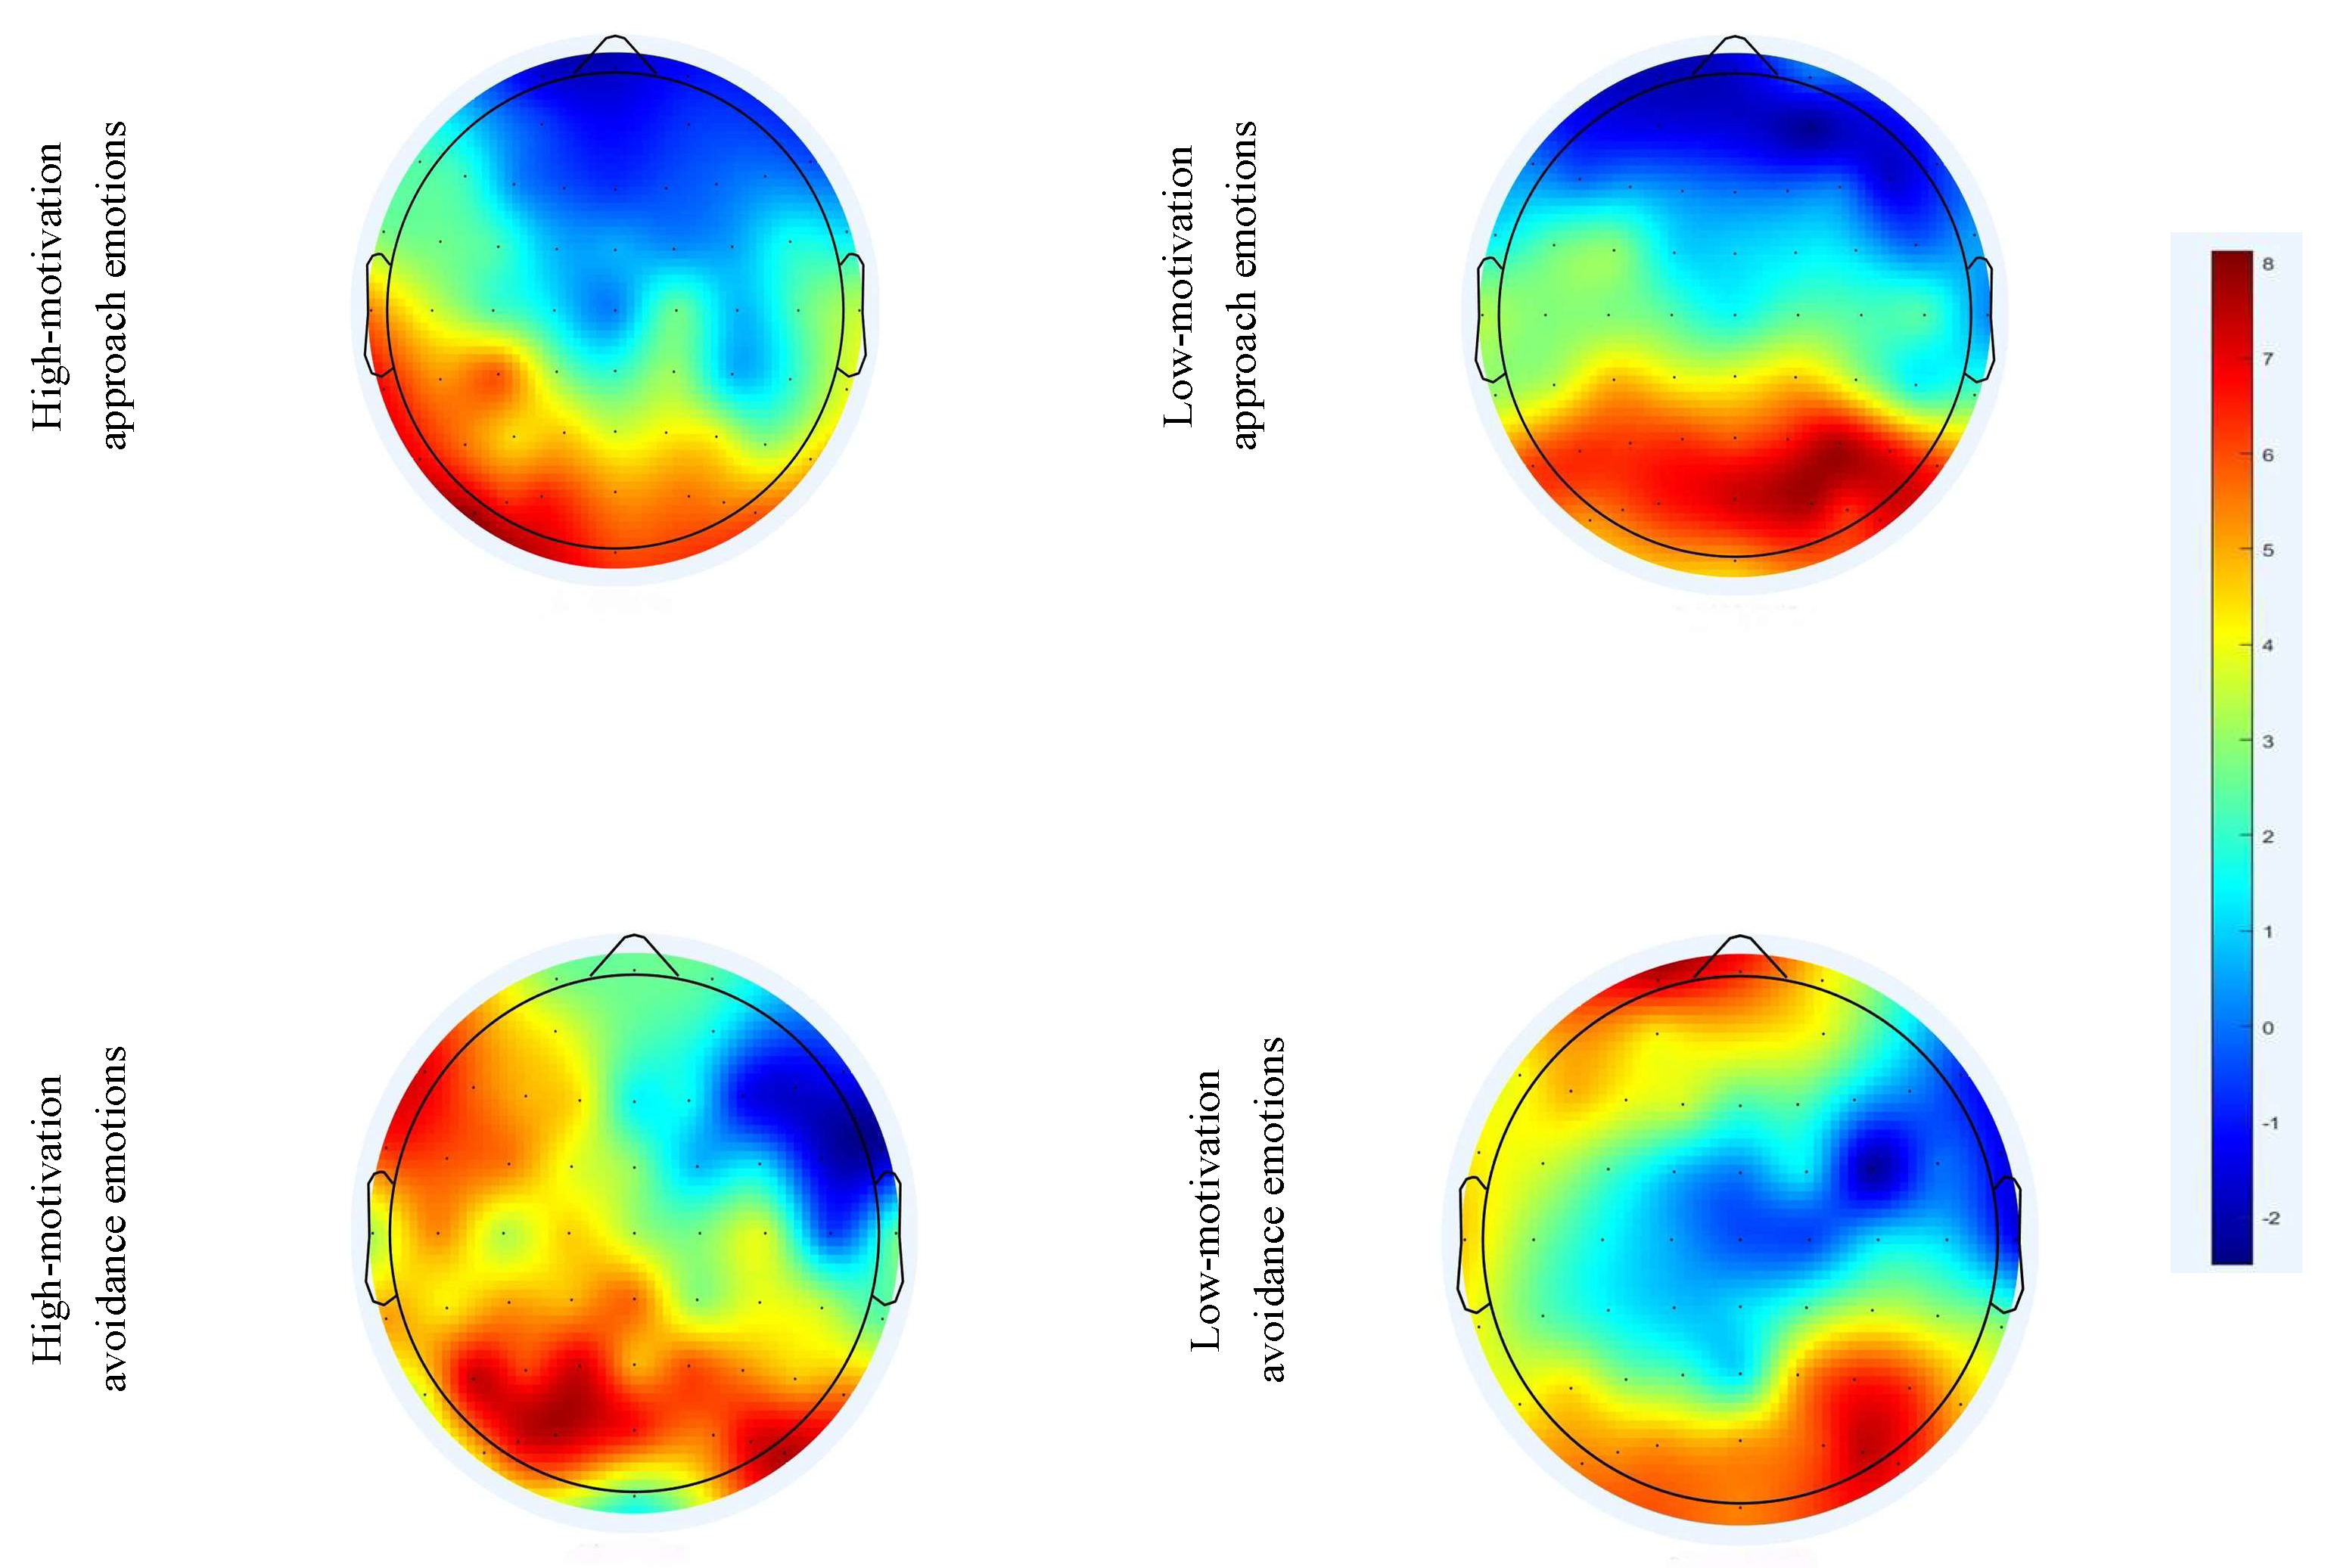
Figure 8.
LPP component brain topography map.
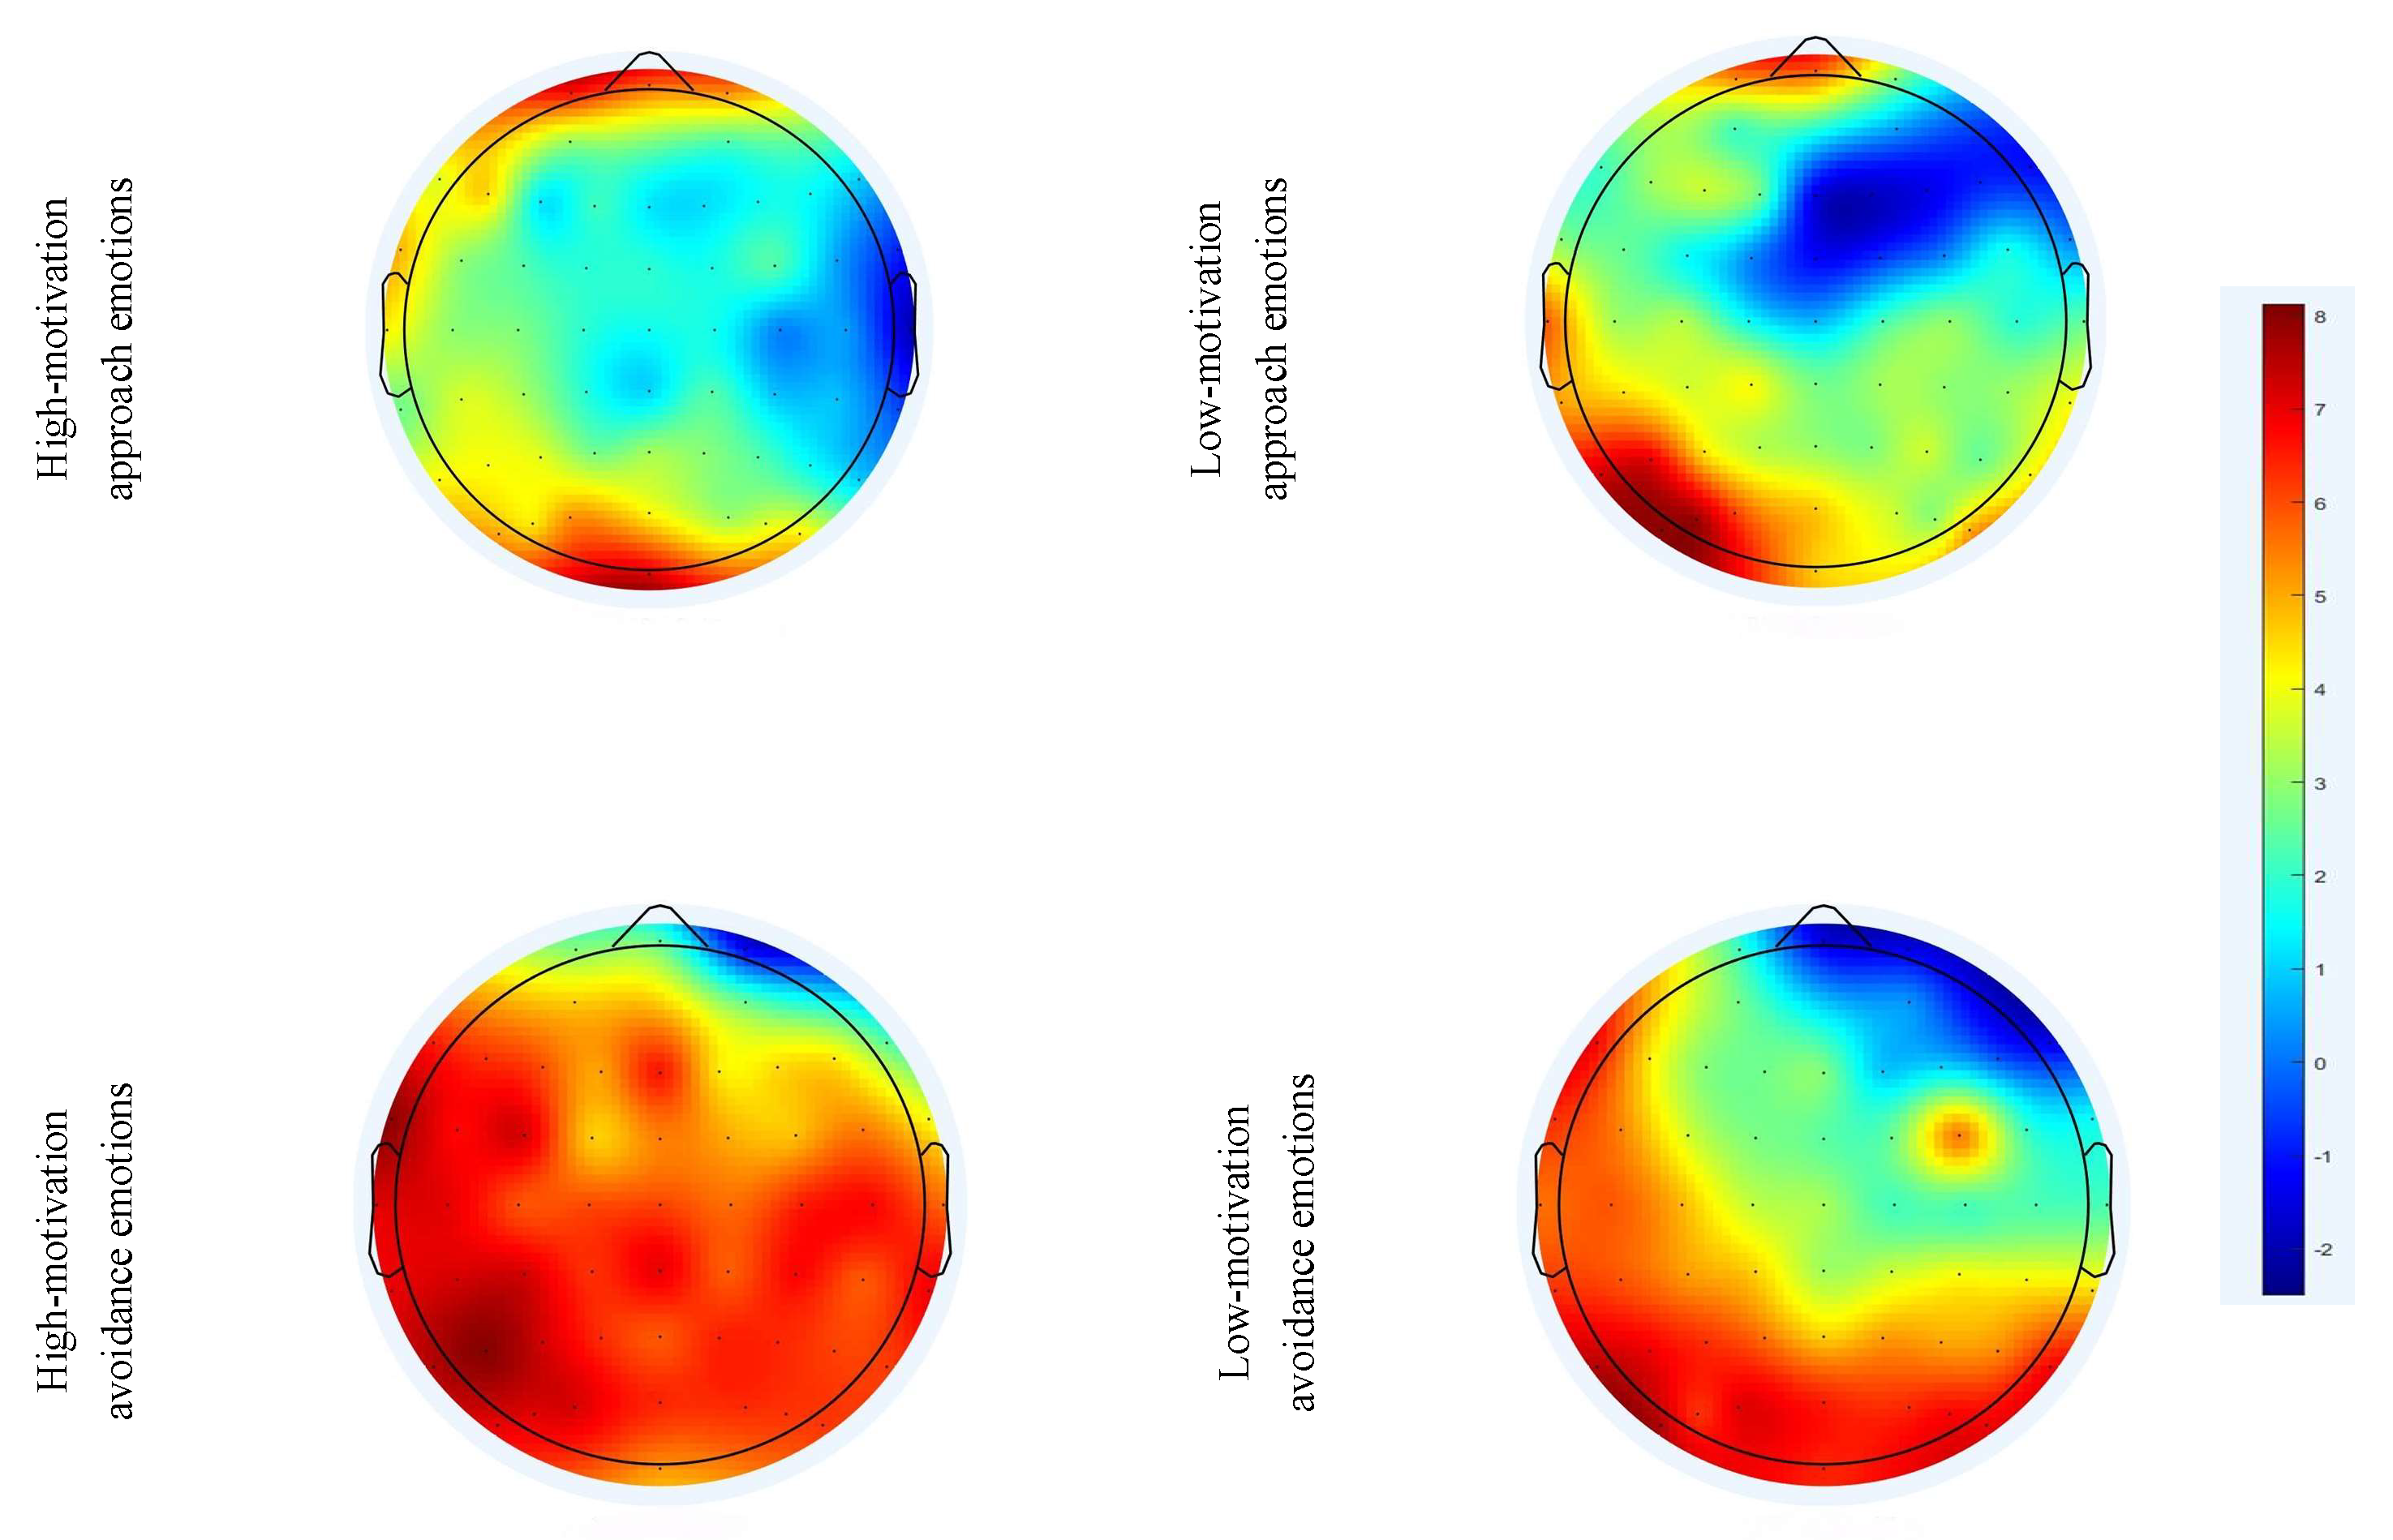

Table 1.
Level of participation in coal mine emergencies under different emotional states (M±SD).
| High-Motivation Approach Emotions | Low-Motivation Approach Emotion | High-Motivation Avoidance Emotion | Low-Motivation Avoidance Emotion | |
|---|---|---|---|---|
| PICME | 0.663±0.044 | 0.699±0.044 | 0.758±0.049 | 0.713±0.052 |
Table 2.
Miner's Behavior Decision Response Time.
| Types of Emotions | Approach Motivation Towards Emotion | Avoidance Motivation Directional Emotion | High Motivational Intensity Emotions | Low Motivational Intensity Emotions |
|---|---|---|---|---|
| Reaction time | 1089.274±267.567 | 1179.983±220.085 | 1290.790±192.509 | 978.468±193.825 |
| Types of emotions | High-motivation approach emotions | Low-motivation approach emotion | High-motivation avoidance emotion | Low-motivation avoidance emotion |
| Reaction time | 1308.903±196.564 | 869.645±84.978 | 1272.677±189.840 | 1087.290±211.408 |
Disclaimer/Publisher’s Note: The statements, opinions and data contained in all publications are solely those of the individual author(s) and contributor(s) and not of MDPI and/or the editor(s). MDPI and/or the editor(s) disclaim responsibility for any injury to people or property resulting from any ideas, methods, instructions or products referred to in the content. |
© 2025 by the authors. Licensee MDPI, Basel, Switzerland. This article is an open access article distributed under the terms and conditions of the Creative Commons Attribution (CC BY) license (http://creativecommons.org/licenses/by/4.0/).
Copyright: This open access article is published under a Creative Commons CC BY 4.0 license, which permit the free download, distribution, and reuse, provided that the author and preprint are cited in any reuse.


