
Submitted:
30 December 2025
Posted:
31 December 2025
You are already at the latest version
Abstract
Climate change and altered hydrological regimes are restructuring wetland habitats globally, triggering cascading effects on colonial waterbirds. This study investigates how environmental drivers, including thermal anomalies, water level fluctuations, and aqueous surface extent influence the distribution, size, and diversity of waterbird colonies in the Danube Delta Biosphere Reserve. We integrated colony census data (2016–2023) with remote sensing-derived habitat metrics, in-situ meteorological and hydrological measurements to model site occupancy dynamics using Generalized Linear Mixed Models. Our results indicate that elevated early spring temperatures and water level variability are the primary determinants of nesting success. Spatial analysis revealed a heterogeneous response to hydrological stress: while the westernmost colony exhibited high site fidelity due to its proximity to persistent aquatic surfaces, the central colonies suffered severe declines or local extirpation during extreme drought periods (2020–2022). A discernible eastward shift in bird assemblages was observed toward zones with superior hydrological connectivity and proximity to anthropogenic hubs, suggesting remarkable behavioral plasticity. We propose prioritizing the investigation of sustainable solutions for lacustrine threshold regulation to maintain critical shallow-water foraging zones. This integrative framework provides essential insights for the long-term conservation of deltaic ecosystems, highlighting the pivotal role of remote sensing.
Keywords:
Ardeidae
; Threskiornithidae and Phalacrocoracidae
; Danube Delta
; remote sensing
; adaptive management
; ecological resilience
; habitat dynamics
; climate change
1. Introduction
Wetland ecosystems and their associated biodiversity are experiencing a global decline due to the synergistic effects of climate change and anthropogenic pressure [1,2,3,4,5,6]. Colonial waterbirds (e.g., Ardeidae, Threskiornithidae, Phalacrocoracidae) serve as sensitive bioindicators of ecosystem health, reflecting changes in hydrological connectivity and trophic availability [1,7].
In the Danube Delta Biosphere Reserve (DDBR), the most importantly in terms of biodiversity and the second largest wetland in Europe, historical hydrotechnical interventions (e.g., meander cut-offs, polderization) have significantly altered natural water circulation [6]. These legacy effects are now exacerbated by 21st-century climate trends, characterized by higher thermal anomalies and increased frequency of extreme droughts (e.g., 2020, 2022). Recent studies indicate that water temperatures in the Danube are projected to rise by 2°C by 2050, potentially leading to hypoxia and altered phenology in fish and bird populations [6].
Currently, important changes are observed not only in the establishment of breeding sites, but also in the structure of mixed waterbird colonies. Birds in wetland colonies are sensitive to climate changes, water level and surface, increased hydrotechnical works, as well as available trophic resources [8,9]. Restoration efforts performed after 1990 in the Danube Delta have not yet reversed the decline in ecosystem services [6].
The spatial and numerical stability of waterbird colonies is increasingly compromised by stochastic environmental fluctuations. Site selection in colonial Ardeidae, Threskiornithidae and Phalacrocoracidae is a multi-hierarchical process driven by the trade-off between foraging efficiency and reproductive safety [10,11,12,13]. However, the 'safety-predictability' nexus of these sites is being undermined. While isolation from terrestrial predators remains a primary determinant of colony persistence, the increasing frequency of extreme hydrological events—ranging from spring floods to prolonged summer desiccation—is forcing rapid shifts in nesting phenology and location [14,15]. Hydrological variability, in particular, acts as a dual filter. High-magnitude spring floods trigger a significant dilution and dispersal of prey populations, while the increased water depth lowers physical barriers to human intrusion, allowing motorized vessels to penetrate deep into sensitive nesting sites [16,17,18] . Conversely, severe drought episodes reduce the shoreline length and connectivity of shallow-water foraging patches, effectively shrinking the 'trophic catchment area' available to the colony. Such desiccation not only limits food availability but also creates 'land bridges' that facilitate predator access to previously isolated nesting sites [14]. Furthermore, the intensification of anthropogenic disturbances, particularly unregulated motorized tourism and habitat fragmentation, creates a cumulative stressor that reduces the resilience of these bioindicators to climatic shifts [14,19].
Given that colonial waterbirds respond near-instantaneously to changes in the hydro-thermal regime, they provide a high-resolution biotic proxy for ecosystem health. The integration of traditional census data with advanced remote sensing metrics (e.g., NDVI-based habitat mapping and NDWI-derived lacustrine extent) allows for a robust quantification of these dynamics [20,21,22]. By evaluating the spatio-temporal fluctuations of five representative colonies within the north-western DDBR, this study elucidates how the interplay between landscape-scale hydrological connectivity and local-scale meteorological stressors determines the long-term viability of these avian assemblages.
Despite the importance of the DDBR, the specific environmental triggers that drive the establishment and relocation of mixed-species colonies remain under-researched. This study aims to bridge this gap by combining long-term field observations with high-resolution remote sensing. We test three hypotheses: (1) colony spatial dynamics have shifted significantly due to habitat fragmentation; (2) spring meteorological conditions dictate the timing and success of breeding; and (3) lacustrine surface extent, rather than absolute water levels, is the primary driver of colony persistence.
2. Materials and Methods
2.1. Study Area
The study focuses on five representative colonies (Purcelu, Nebunu, Martinca, Furtuna, Băclănești) located in the north-western fluvial-deltaic zone of the DDBR (Figure 1). These sites were selected for their long-term successional history; several have functioned as key breeding hubs since the 1990s, historically supporting some of the largest waterbird colonies in the region [23].
The region is characterized by a mosaic of willow (Salix alba) forests, extensive reed beds (Phragmites australis), and shallow lacustrine basins.
As a dynamic wetland ecosystem, the DDBR encompasses a diverse range of aquatic habitats, including lotic systems, stagnant freshwater lakes, and isolated brackish water bodies along the coast. The specific landscape surrounding the monitored colonies is characterized by a network of distributary channels, shallow lakes, marshes, and floodplains that provide critical nesting substrates, ranging from inundated willow galleries and scrublands (Salix spp.) to flooded reed beds.
From a hydrological perspective, the western sector of the delta is particularly sensitive to water level fluctuations. During high-discharge periods in spring, the expansion of the aqueous surface creates extensive shallow-water zones that serve as primary foraging grounds for colonial waterbirds. Conversely, the western marshes and lake margins are highly susceptible to desiccation during drought episodes, which significantly reduces the available trophic area and modifies habitat suitability for the nesting populations. While the DDBR is free from heavy industrialization, the study area is subject to intensifying anthropogenic pressures, including high-speed navigation, uncontrolled tourism, and legacy effects of agricultural polderization, all of which intersect with the natural hydro-climatic dynamics of the reserve [24].
2.2. Bird Census
The observations were made between the years 2016-2023, in the months of April and May. The monitoring focused on five historically and recently established colonies within the study area of the Danube Delta. The colonies of Martinca (since 1979), Purcelu (since 1986), and Nebunu (since 1993) are considered historic colonies and have been continuously monitored for decades. Conversely, the colonies of Băclănești (since 2018) and Furtuna (since 2013) appeared and were subsequently integrated into the existing monitoring system. The primary method for assessing the colonies involved a combination of direct nest counts and stationary observations for data calibration. Where physical access was possible, observers entered the colony for a limited time (15–30 minutes) to conduct direct nest counts. During this time, the nests were located, their coordinates were recorded using GPS points, and the plot (or extent) of the colony was established and the target breeding species present in each colony were determined during this phase. To calibrate the direct count data and accurately estimate the breeding were applied two stages:
Stage 1 (first half of April): Counting targeted early-nesting species, specifically the Great Cormorant (Phalacrocorax carbo), Grey Heron (Ardea cinerea), and Great Egret (Ardea alba).
Stage 2 (second half of May): Evaluation was conducted for the remaining seven colonial species: Eurasian Spoonbill (Platalea leucorodia), Glossy Ibis (Plegadis falcinellus), Pygmy Cormorant (Microcarbo pygmaeus), Squacco Heron (Ardeola ralloides), Night Heron (Nycticorax nycticorax), Cattle Egret (Bubulcus ibis), and Little Egret (Egretta garzetta).
Nesting pair estimates were made based on occupied nests and the observed movement of birds flying into or out of the colony (Table A1.1.).
Hydrological variables
For the collection of hydrobiological data, the water level of the Danube at the Tulcea station [25] was considered. The water level at Tulcea gives an image of the water influx entering the study area of the evaluated bird colonies. Data were also taken on the number of days until the maximum level of the water from the beginning of the year, as well as the water temperature (Table 1; Table A1.5.). The variables input into statistical analysis were considered as average between of April, May and June (Table A1.2.). These months overlap with breeding period of colonial birds.
2.3. Climate (Weather) Data
The climatological data utilized in this study were recorded by the official network of meteorological stations managed by the Romanian National Meteorological Administration (NMA), with data transmitted through the international synoptic reporting system [26]. For this analysis, climatological data from three stations (Tulcea, Gorgova, and Mahmudia) were used, as these stations are the closest to the study area, ensuring a homogeneous integration of the region within the broader meteorological-climatic framework for the period in question (Table A1.4.). Long-term climatic data required for analysis were extracted from the ROCADA climate dataset [27] for the period 1961–2013 and supplemented with data from the international synoptic network recorded by the NMA network. The meteorological variables of focus for the statistical analysis are monthly minimum, mean, and maximum air, as well as the total atmospheric precipitation for the months of February through June and from August to December (Table 1, Table A1.2, Table A1.3., Table A1.4).
2.4. Remote Sensing
The wetlands environmental variables were extracted using Sentinel 2 satellite images, using a 5 km buffer around the centre of waterbird colonies (Table 2, Table A1.4). The Sentinel-2 sensor, a multispectral instrument, was launched in 2015. It features 13 bands, with 8 covering the VNIR (Visible near Infra-Red) region and 2 covering the SWIR (Short Wave Infra-Red) region, offering spatial resolutions of 10, 20, and 60 metres. The sensor has a swath width of 290 kilometres. The Sentinel-2 system includes two satellites, Sentinel-2A and Sentinel-2B, which orbit at an altitude of 786 kilometres, positioned 180 degrees apart. Together, these satellites enable a complete survey of the Earth's surface every 5 days, this being one of the reasons why these sensors were chosen [28,29]. The use of Sentinel-2 satellite imagery in remote sensing is significant due to the high resolution of certain spectral bands, which facilitates detailed analysis of the Earth's surface. Unlike other remote sensing systems, Sentinel-2 offers a unique combination of spatial, spectral and temporal resolution. For example, the red edge (670-740 nm) and Near Infrared Red (NIR) bands at 10 metres spatial resolution is essential for vegetation monitoring, allowing better differentiation and estimation of vegetation condition.
The Normalized Difference Vegetation Difference Vegetation Index (NDVI) is a well-known and widely used tool in geosciences [30], agriculture [31,32] and bird ecology [33,34] providing essential information about habitat condition and dynamics. NDVI measures the chlorophyll activity of vegetation, which can provide information regarding vegetation health and density, critical factors for birds that depend on certain habitat types for breeding, foraging and migrating. For example, densely vegetated habitats such as forests and wetlands are essential for many bird species, and NDVI can be used to monitor changes in these habitats over time, providing clues about how climate change and human activities affect bird distribution and behaviour [35,36]. In addition, NDVI is a useful indicator for identifying critical areas for conservation, allowing rapid intervention in places where habitat degradation could have a negative impact on bird populations [37].
NDVI is obtained by using the reflectance values from two specific spectral bands: NIR and Red bands as in the following formula:
NDVI= (NIR-Red)/(NIR+Red)
NDWI (Normalized Difference Water Index) is widely used to detect and monitor water bodies by measuring the moisture content in vegetation and identifying water surfaces [38,39]. NDWI is calculated using the green and Near-Infrared (NIR) bands, which makes it particularly effective in distinguishing between water and land. In Sentinel-2 imagery, NDWI is typically derived from Band 3 (Green) and Band 8 (NIR) using the formula:
NDWI=Green-NIR/Green+NIR
Wetlands are essential habitats for many aquatic bird species. NDWI allows for the early detection of water loss or expansion, aiding in the conservation of these critical ecosystems [40,41]. Furthermore, NDWI is often used in combination with other indices like NDVI to provide a comprehensive picture of both vegetation health of habitats and water distribution [42].
2.5. Data Analysis
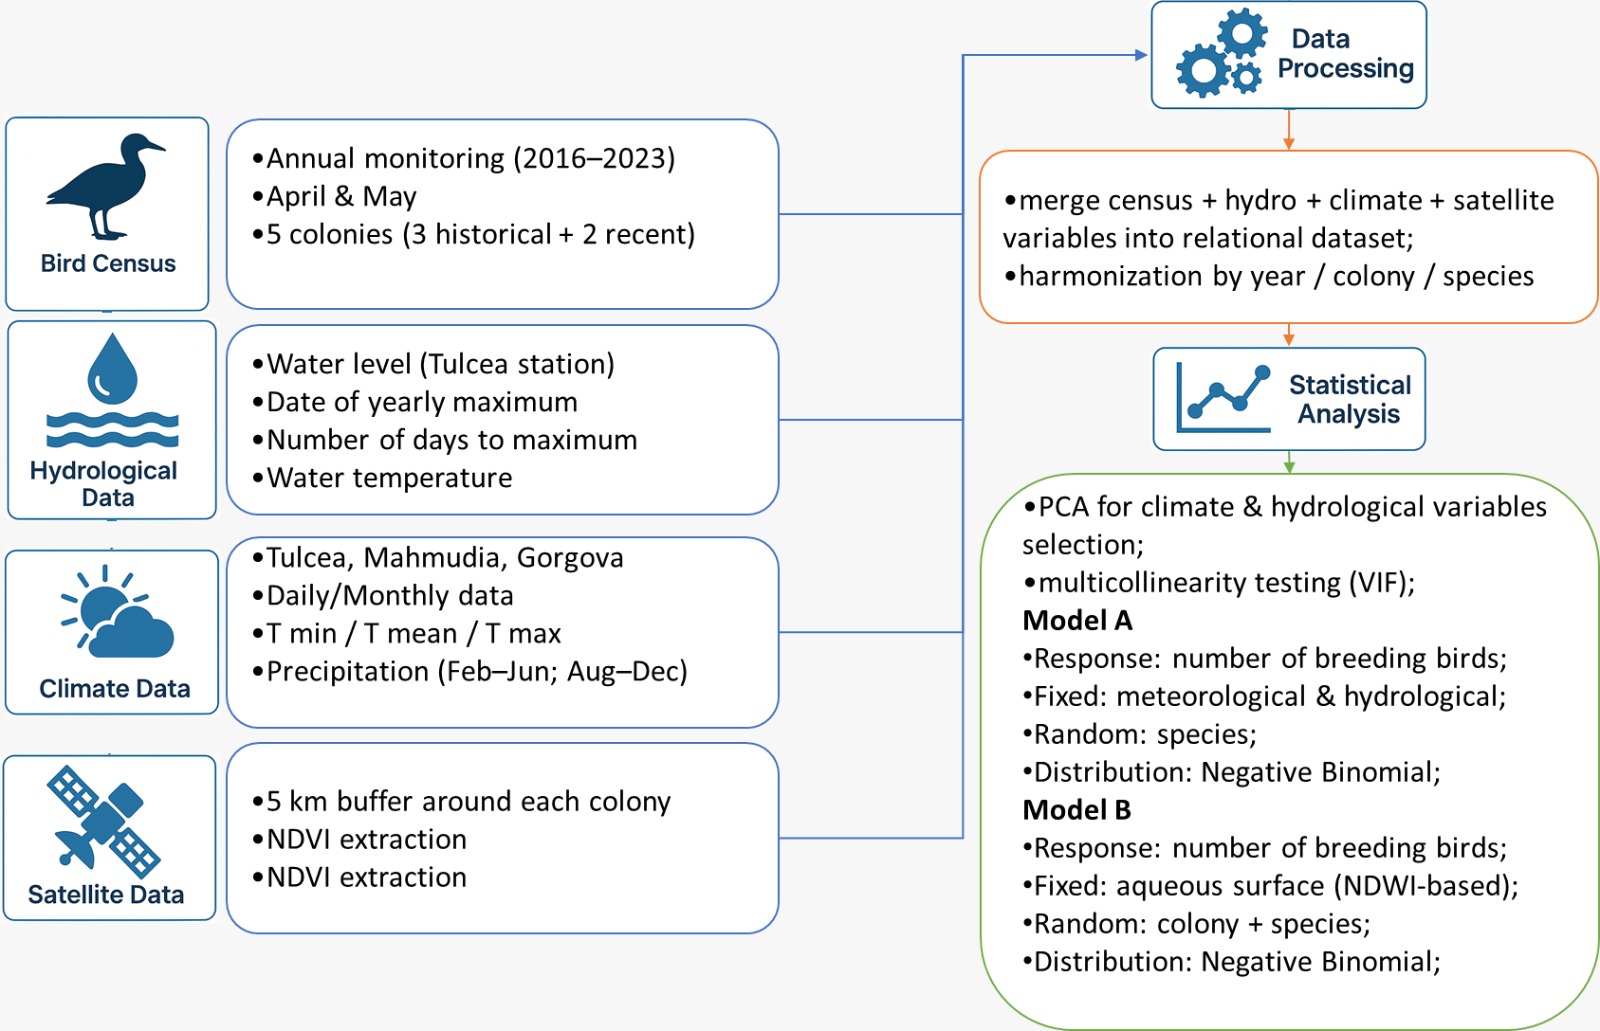
Statistical analysis was done in R (Rcore Development team), using the lme4 [43], flexplot [44], ggcorrplot [45], car [46] and factoextra packages [47].
Since the meteorological and hydrological variables used were not discriminant for each colony of birds, only for different years, as compared with those derived from satellite imagery, we used two analyses:
- Negative binomial generalised linear mixed models (NB GLMM) with number of breeding birds as response variable, meteorological and hydrological variables as fixed effects and species as random effects.
- NB GLMM with number of breeding birds as response variable, the surface of aqueous surfaces around the colonies as fixed effects and colonies and species were as random effects
To account for the overdispersion, for both analyses we used a Negative Binomial error distribution with a log link function [48].
The variables used in first analysis were selected using Principal Component Analysis [49]. Furthermore, the multicollinearity effects were tested using the VIF (Variance Inflation Factors) function from the “car” package (Figure 2).
It was also examined through a simple regression analysis whether the influence of predators, such as the white-tailed eagle, affects the presence of bird colonies (Table A1.6).
3. Results
3.1. Bird Observation
The wetlands within the western sector of the Danube Delta support substantial assemblages of colonial waterbirds. During the study period, the monitored colonies hosted an estimated mean of 6,000 breeding pairs per annum, with the following taxonomic composition: Microcarbo pygmaeus (28.02%), Phalacrocorax carbo (24.83%), Nycticorax nycticorax (16.8%), Ardeola ralloides (13.49%), and Egretta garzetta (12.01%). Species with lower relative abundance included Plegadis falcinellus (2.59%), Ardea cinerea (1.08%), Platalea leucorodia (0.6%), Ardea alba (0.16%), and Bubulcus ibis (0.19%). These multispecies assemblages were distributed across three to five active colonies situated within alluvial forests. The nesting architecture exhibited clear vertical stratification, typically correlated with body size, where larger species occupied the upper canopy layers. The development of these heronries followed a centrifugal pattern: growth initiated from a core area of high nest density until reaching saturation, subsequently triggering peripheral expansion. The spatial distribution of nests—both vertical and horizontal—appears to be a coordinated function of nesting phenology (timing of initiation), colony density, and intense intraspecific competition for optimal substrates.
3.2. Hydrological Data
In terms of seasonal water depth variability, water levels fluctuate much more than temperature. Some years as 2019 show high eater levels, especially in June. Other years, as 2020 show much lower level, especially in April and in May, followed by a severe drought in period 2020-2022. Concerning seasonal water temperature trend, generally increases from April to June each year. June has the warmest water and Aprile tends to be the coolest month (Figure 3, Table A1.2.). The increase in temperature from April to June in aquatic systems favors the development of aquatic plants, invertebrates, fish eggs, and food for colonial bird species.
3.3. Weather Data
According to the Köppen-Geiger climate classification, the region under analysis, including the three meteorological stations, is classified as a humid temperate-continental climate with hot summers (Cfa). The mean annual temperature ranges between 11.5°C and 11.6°C, characterized by hot summers during July and August, where temperatures exceed 22°C, and mild winters, with minimum temperatures remaining above -3°C (Figure 4). Annual precipitation varies from 359.6 mm to 420.8 mm, displaying a relatively uniform distribution throughout the year, with a marked increase during the May-July period. This precipitation pattern is typical of the mild temperate zone, where normally, along the time, no distinct dry season occurs and summers tend to be wetter. However, the drought phenomenon is increasingly frequent in southeastern Romania [50]. These thermic and pluviometric characteristics are indicative of a temperate regime influenced by the proximity to the Black Sea, typical of the lowland areas of the Danube Delta, reinforcing its classification within the Köppen-Trewartha system [51].

Figure 3 presents monthly temperature and precipitation anomalies for the Danube Delta from 2016 to 2023, compared to the reference period 1961-2023, highlighting significant climatic trends. A slight warming trend is observed, with positive temperature anomalies dominating, particularly during summer and winter, reflecting increasingly warmer conditions. Negative anomalies, representing cooler periods, occur sporadically, but are less frequent and less intense. On the precipitation side, a slight downward trend suggests reduced rainfall over time, with more frequent negative anomalies indicating drier conditions, particularly in the later years, very important for a negative trend of waterbirds. Positive precipitation anomalies are more common earlier in the period, with some peaks suggesting episodic heavy rainfall. These trends align with broader patterns of climate change, potentially impacting the Danube Delta’s ecosystems, biodiversity, and water resources. Further monitoring is necessary to understand the long-term consequences of these changes.
In terms of temperature, starting from April to June in Figure 3 show predominantly positive anomalies, particularly in May and June, indicating warmer than average conditions compared to the 1961-2023 reference period. The warming trend is especially notable in June, with several years exhibiting sharp temperature increases. For precipitation, these months show a more variable pattern: April tends to experience a mix of positive and negative anomalies, while May and June frequently display negative precipitation anomalies, suggesting drier-than-normal conditions during these critical growing months (Figure 5).
3.4. Satellite Data
The NDVI maps provided for the bird colonies in the Danube Delta over the years 2018, 2019, and 2022 reveal a clear pattern of vegetation degradation. We chose these representative years because in the period considered in 2018, 2019 there was an increasing trend in nesting pairs and in 2021 a decreasing trend, accompanied even by a disparity in numbers such as those in Martinca or Băclănești.
In 2018, the area exhibited extensive dense and very dense vegetation, as indicated by the large patches of dark green, with only minimal regions of bare or poor vegetation. By 2019, there was a noticeable increase in the areas of poor or no vegetation, represented by dark red and red patches, particularly in the central and right portions of the maps, while dense vegetation areas decreased. The situation worsened significantly in 2022, with the maps showing a dramatic rise in degraded or bare land (red and orange zones), accompanied by a substantial decline in dense and very dense vegetation. The NDVI data for 2022 reflects a significant loss of vegetative cover, with large portions of the area lacking substantial vegetation. This decline in vegetation over time could have serious implications for the bird colonies in the Danube Delta, as their habitats are directly dependent on the health and extent of the surrounding vegetation (Figure 6).
The NDWI maps provided for the bird colonies in the Danube Delta from 2018, 2019, and 2022 reveal a clear shift in water dynamics over time. In 2018, the area was predominantly dry, with extensive regions of drought and non-water surfaces and only scattered pockets of water, shown by small patches. By 2019, the images depict a noticeable increase in water presence, with more stable water bodies (dark blue) and shallow water or flooding (light blue) visible across the region. The dark brown areas of extreme drought decreased, though moderate drought (yellow) persisted in certain areas. The most significant change is seen in 2022, where the maps show widespread shallow water, and a further increase in stable water bodies, while drought areas were greatly reduced. This progression from dry conditions in 2018 to wetter environments by 2022 suggests the increasing influence of fluctuating climate conditions on the Danube Delta. In 2022, although there is an increase in the water level, towards the end of the period there is a pronounced drought, with negative effects on bird (Figure 7). The growing presence of water in the bird colonies' habitats has critical implications for the ecosystem, as water availability is essential for the survival and health of these populations.
In 2018, all colonies were characterized by smaller aqueous areas compared to the other reference periods. In 2019, a significant increase occurred, followed by a decline in the aqueous areas surrounding bird colonies in 2022, although not to levels as low as those observed in 2018 (Figure 8).
3.5. Statistical Analysis
We run several models to understand how meteorological, hydrological and aqueous cover factors affect the dynamic breeding of colonial waterbirds in study area. The best model was chosen based on the lowest AIC and BIC (Table 3). For our selected model, we get a VIF value lower than 5, an acceptable degree of correlation in our data [52] (Table 4)
The model with the best AIC indicates that the maximum temperature of April has the highest contribution (p = 1.22e-06, z = 4.853), followed by mean temperature of May (p = 0.00246, z = -3.028) and water level in May (p = 0.00301, z = 2.966). Other significant variables are water level in April (p = 0.01151, z = -2.527) and Standard Deviation of Water level in April (p = 0.04356, z =-2.018) (Table 4).
Regarding the influence of the aqueous surfaces around colonies together with hydrological and meteorological variables, the GLMM analysis indicates a positive effect on the species population (p< 2e-16, z= 25.310).
The availability of expansive aquatic foraging habitats during high-discharge hydrological periods emerged as a primary determinant of the spatial and numerical dynamics of tree-nesting waterbird assemblages (Figure 9). Despite intermittent recoveries, the overarching multi-decadal trend indicates a systemic decline in the total abundance of colonial individuals. Several colonies exhibited regressive trajectories, reaching local extirpation during the extreme drought events of 2021 and 2022. While subsequent increases in water levels facilitated a modest recolonization, these recovering assemblages typically displayed lower species richness and significantly reduced breeding pair densities compared to pre-drought baselines. The demographic dynamics revealed heterogenous responses among the monitored species. Statically stable populations were observed for Platalea leucorodia, Ardea cinerea, Ardea alba, and Bubulcus ibis, which maintained consistent breeding pair numbers throughout the study period. Conversely, both Phalacrocorax carbo and Microcarbo pygmaeus exhibited a pronounced and statistically significant downward trend within the northern fluvial-deltaic sector. In contrast, Nycticorax nycticorax, Ardeola ralloides, and Egretta garzetta demonstrated higher ecological resilience, showing a tendency to revert toward stable population equilibrium following hydrological disturbances (Figure 10). Notably, the spatial proximity of Haliaeetus albicilla (White-tailed eagle) eyries exerted no significant influence on colony site occupancy or nesting density (p > 0.05), suggesting that meso-predator avoidance or competition with apex raptors is not a primary driver of colony distribution in this sector.
4. Discussion
4.1. Spatio-Temporal Shifts and Anthropogenic Adaptation
Our findings reveal a heterogeneous spatial response to hydrological stress within the northwestern DDBR. While the westernmost colony, Purcelu (1), exhibited remarkable site fidelity by remaining in a relatively stable location, the assemblages most exposed to critical water deficits, specifically Nebunu (2) and Martinca (3)—underwent a distinct eastward migration.
Our analysis reveals a heterogeneous response to hydrological stress across the study area. Despite severe drought conditions, the westernmost colony, Purcelu (1), maintained its spatial stability, benefiting from its proximity to persistent aquatic surfaces that provided sufficient foraging grounds. In contrast, the centrally located colonies, Nebunu (2) and Martinca (3), experienced significant numerical declines and local extirpation as their surrounding habitats desiccated. Paradoxically, colonies situated at the eastern extremity of the study area demonstrated higher resilience, maintaining stable populations or even exhibiting numerical increases, likely due to more favorable localized hydrological conditions or the relocation of individuals from the compromised central sites.
During severe drought years, assemblages gravitated toward aquatic zones in closer proximity to anthropogenic hubs, such as Tulcea in the west and Maliuc in the east. While the westernmost and easternmost sites, notably the Purcelu (1) and Furtuna (4) colonies, intersect with active tourist and fishing routes, the resident species exhibited remarkable behavioral plasticity. This suggests that the availability of expansive, shallow water foraging patches outweighs the negative pressures of moderate human disturbance. This adaptation highlights a critical trade-off: birds may tolerate sub-optimal disturbance levels if the hydrological conditions provide superior trophic opportunities.
4.2. Hydro-Climatic Drivers and Trophic Phenology
The integration of in-situ measurements and remote sensing confirms that spring thermal anomalies and water level fluctuations are the primary environmental forcing factors for colony dynamics. We observed that lower spring temperatures induce a phenological delay in breeding initiation. Conversely, elevated temperatures in late spring accelerate the development of invertebrate and ichthyofauna larvae—the fundamental trophic base for both breeding adults and altricial chicks. However, this thermal benefit is often negated by the "drought-acceleration" effect; prolonged high temperatures during the spring-summer transition exacerbate evaporation rates, leading to the rapid desiccation of the shallow-water "buffer" zones identified in our GIS analysis. The remote sensing data validates this instability, showing that within a 5 km buffer of nesting sites, nearly 53% of suitable lacustrine habitat was lost during dry periods. This habitat fragmentation acts as a severe constraint on colony persistence, particularly for the Phalacrocoracidae guild, which exhibited the most dramatic declines due to their higher dependency on specific wetland depths.
4.3. Ecological Resilience and Taxon-Specific Responses
Despite a general regressive trend in total abundance, our study underscores a heterogenous pattern of ecological resilience. While Platalea leucorodia and Ardea cinerea maintained stable, albeit low, breeding densities, species like Nycticorax nycticorax and Ardeola ralloides showed a capacity for rapid recovery following the hydrological restoration of 2022. This suggests that while species diversity remains conserved, the "carrying capacity" of the deltaic landscape is diminishing at a rate that outpaces the adaptive capacity of these assemblages. Unlike the Liaohe River Estuary, where managed hydrological regimes have bolstered diversity [53], the DDBR currently mirrors the vulnerabilities of the Ebro Delta, where climate-driven habitat loss threatens long-term population viability [4].
4.4. Management Implications: Beyond Simple Connectivity
The observed shift in colony occupancy toward the eastern delta, triggered by the significant water influxes of 2018–2019 and 2022, emphasizes the need for a paradigm shift in deltaic management. Current hydrotechnical configurations, characterized by deepened inlet/outlet channels, often inadvertently function as drains during low-flow periods. This "drainage effect" induces hypoxia and harmful algal blooms, fundamentally altering the trophic structure of the lakes.
To mitigate these legacy effects, we emphasize the urgent need for an adaptive hydrological management framework. Future conservation efforts should prioritize the investigation of sustainable technical and ecological solutions aimed at maintaining the minimum water levels required to preserve essential foraging habitats [54,55]. Such interventions must be designed to buffer the impact of hydro-climatic extremes, ensuring that critical wetland functions are sustained without compromising the natural hydrological pulse of the Danube Delta. Such interventions must be guided by the long-term GIS-based monitoring of "aqueous surface extent," rather than absolute river levels alone [56,57,58].
4.5. Limitations and Future Directions
While our remote sensing models effectively compensated for limited physical access to colony interiors, certain data gaps remain. The statistically non-significant influence of Haliaeetus albicilla predation suggests that top-down pressure is not a primary driver of colony relocation; however, the role of diffuse pollution and unregulated high-speed navigation requires further empirical quantification. Future research should prioritize the integration of high-resolution climate projection models within a GIS framework to transition from reactive monitoring to predictive conservation management.
5. Conclusions
This study demonstrates that the spatio-temporal dynamics of colonial waterbird assemblages in the Danube Delta Biosphere Reserve (DDBR) are fundamentally governed by a complex interplay of hydro-climatic forcing and habitat availability. Based on our integrative analysis of long-term field observations, meteorological data, and remote sensing metrics, the following conclusions emerge:
Spring thermal anomalies and water level fluctuations are the primary determinants of nesting success. While optimal late-spring temperatures accelerate trophic resource availability (invertebrate and fish larvae), these benefits are increasingly negated by a "drought-acceleration" effect. Elevated evaporation rates, coupled with negative precipitation anomalies, lead to the rapid desiccation of shallow-water foraging buffer zones, which saw a nearly 53% reduction in suitable extent during critical periods.
Despite an overarching systemic decline in colonial abundance, species-specific responses reveal a gradient of ecological resilience. The Phalacrocoracidae guild exhibited the most significant vulnerability to wetland loss, whereas certain Ardeidae species (Nycticorax nycticorax, Ardeola ralloides) demonstrated a higher capacity for population recovery following hydrological restoration. This suggests that while taxonomic diversity is currently maintained, the overall carrying capacity of the deltaic landscape is diminishing.
Environmental stress, particularly severe drought, has triggered a distinct eastward migration of vulnerable colonies (e.g., Nebunu and Martinca) toward sites with more persistent aquatic surfaces. The observed site fidelity of the westernmost colony (Purcelu) and the gravitation of others toward anthropogenic hubs suggest that waterbirds prioritize stable hydrological conditions and trophic accessibility over the avoidance of moderate human disturbance, exhibiting significant behavioral plasticity.
Statistical modeling confirms that colony site occupancy is primarily driven by bottom-up factors (hydrology and temperature) rather than top-down pressures. The presence of apex predators, such as White-tailed Eagle, exerted no significant influence on colony distribution, reinforcing the premise that habitat quality and foraging connectivity are the paramount drivers of colony persistence in fluvial-deltaic systems.
The transition from reactive to proactive conservation requires an adaptive hydrological management framework. Our findings highlight that current hydrotechnical legacy effects—specifically deepened channels that act as drains during low-flow periods—compromise ecosystem health. Conservation priorities must shift toward maintaining minimum water levels in key lacustrine basins through sustainable, nature-based solutions that preserve the natural hydrological pulse while securing essential foraging habitats against a backdrop of intensifying climatic extremes.
The successful integration of NDVI/NDWI satellite metrics with in-situ data validates remote sensing as a robust tool for monitoring inaccessible wetland interiors. Future research must utilize these high-resolution spatial models to develop predictive frameworks, enabling managers to anticipate habitat fragmentation and implement targeted interventions before local extirpation occurs.
Author Contributions
Conceptualization, C.I , A.D., L.E.B., V.J., P.I. and.; methodology, C.I , A.D., L.E.B., V.J., P.I., V.A., M.M.; software, V.J., P.I., L.E.B., and C.I.; validation: C. I., L.E.B, V.J. and A.D.; formal analysis, L.E.B. V.A., M.M. V.J., P.I. and C.I.; investigation, C.I., V.J. and A.D.; resources, L.E.B., P.I., A.D. and C.I.; data curation, A.D., C.I., V.J. and L.E.B..; writing— C.I., V.J. and A.D.; writing—review and editing, C.I., V.J., V.A., M.M., L.E.B, P.I. and A.D.; visualization, C.I., A.D., L.E.B., P.I. and V.J.; supervision, A.D., L.E.B., V.J., C.I. and. All authors contributed equally and have equal rights to this research paper. All authors have read and agreed to the published version of the manuscript.
Funding
This research was funded by Ministry of Environment, Waters and Forests, Romania: Contract for the "Danube Delta" Core Program PN Code 16 28, Contract No. 47N/28.03.2016, implementation period 2016–2017; Contract for the "Danube Delta 2018" Core Program PN Code 18 14, Contract No. 14N/16.03.2018, implementation period 2018; Contract for the "Danube Delta 2022" Core Program PN Code 19 12, Contract No. 41N/14.02.2019, implementation period 2019–2022; Contract for the Core Program: Scientific research program for the development of research competencies and capabilities in the field of health and environmental protection of wetlands – "Danube Delta 2030" PN Code 23 13, Contract No. 35N/12.01.2023, implementation period 2023–2026.
Data Availability Statement
The data presented in this study, including those regarding remote sensing, are also available on request from the correspondence author.
Acknowledgments
We thank our colleagues from Danube Delta Institute for Research and Development technical staff for their help in the fieldwork. The authors have reviewed and edited the output and take full responsibility for the content of this publication.
Conflicts of Interest
The authors declare no conflict of interest.
Appendix A
Appendix A.1
Table A1. 1. Breeding pairs estimation in bird colonies.
| Year | Martinca | Nebunu | Purcelu | Furtuna | Baclanesti | Total |
| 2016 | 2390 | 2565 | 2620 | 165 | 0 | 7740 |
| 2017 | 1070 | 1760 | 1820 | 165 | 0 | 4815 |
| 2018 | 1366 | 1975 | 2241 | 260 | 1270 | 7112 |
| 2019 | 1668 | 2530 | 1749 | 700 | 1670 | 8317 |
| 2020 | 502 | 2456 | 1832 | 800 | 2608 | 8198 |
| 2021 | 0 | 561 | 1103 | 1200 | 1100 | 3964 |
| 2022 | 0 | 0 | 1706 | 1200 | 730 | 3636 |
| 2023 | 0 | 525 | 2500 | 450 | 0 | 3475 |
Table A1. 2. Hydrobiological variables per year and month of breeding period.
| Year | Month | Water level | W STEDV | W CV | T water | T STEDV | T CV | T min | T max |
| 2016 | April | 249.75 | 48.23346003 | 0.193127 | 13.59375 | 2.325072 | 0.17104 | 9.4 | 15.9 |
| May | 239 | 35.75658448 | 0.149609 | 17.075 | 1.074864 | 0.06295 | 15.5 | 19 | |
| June | 260.75 | 17.63519209 | 0.067633 | 22.8375 | 2.114986 | 0.09261 | 19.9 | 26 | |
| 2017 | April | 170.1875 | 32.56013667 | 0.191319 | 12.39375 | 0.934857 | 0.07543 | 11 | 13.9 |
| May | 220.9375 | 26.65200118 | 0.120631 | 17.1125 | 1.40232 | 0.081947 | 14.4 | 19.5 | |
| June | 163.26875 | 43.26903001 | 0.265017 | 24.7875 | 1.316498 | 0.053111 | 22.7 | 26.4 | |
| 2018 | April | 374.6875 | 22.18323316 | 0.059205 | 12.4625 | 3.582527 | 0.287465 | 7 | 18 |
| May | 256.4375 | 46.48866349 | 0.181287 | 20.41875 | 1.327262 | 0.065002 | 18.2 | 22.3 | |
| June | 174.6875 | 21.81045239 | 0.124854 | 24.7875 | 1.316498 | 0.053111 | 22 | 7 | |
| 2019 | April | 188.5625 | 20.97289918 | 0.111225 | 11.86875 | 1.526093 | 0.128581 | 10.2 | 15.4 |
| May | 238.625 | 62.3012841 | 0.261084 | 17.0375 | 1.013163 | 0.059467 | 15.9 | 19.2 | |
| June | 499.3125 | 86.93424239 | 0.174108 | 17.04375 | 1.01651 | 0.059641 | 15.9 | 19.2 | |
| 2020 | April | 104.375 | 28.35224859 | 0.271638 | 11.5875 | 2.491017 | 0.214975 | 8.1 | 15.5 |
| May | 83.375 | 5.690635583 | 0.068254 | 18.325 | 1.188557 | 0.06486 | 16 | 20 | |
| June | 140.625 | 58.26705759 | 0.414344 | 21.93125 | 1.90183 | 0.086718 | 19 | 24.7 | |
| 2021 | April | 212.0625 | 7.379871273 | 0.0348 | 10.4375 | 1.236595 | 0.118476 | 8.5 | 12.5 |
| May | 211.1875 | 24.32068735 | 0.115162 | 16.34375 | 2.079413 | 0.12723 | 12.5 | 20 | |
| June | 258.5 | 28.62399925 | 0.110731 | 20.59375 | 2.161934 | 0.10498 | 17.5 | 25 | |
| 2022 | April | 150.75 | 36.8754661 | 0.244613 | 11.51875 | 1.469339 | 0.127561 | 8.5 | 14 |
| May | 154.4375 | 14.87265388 | 0.096302 | 18.2 | 2.342363 | 0.128701 | 14.5 | 21.5 | |
| June | 127.875 | 9.507014954 | 0.074346 | 23.5625 | 1.093542 | 0.04641 | 21.5 | 25 | |
| 2023 | April | 246.8666667 | 31.16973502 | 0.126261 | 10.6 | 1.298351 | 0.122486 | 9 | 13 |
| May | 268.1875 | 18.06735085 | 0.067368 | 15.28125 | 1.632674 | 0.106842 | 13 | 18 | |
| June | 313.3125 | 12.39741236 | 0.039569 | 20.6875 | 1.558578 | 0.075339 | 18.5 | 23 |
Table A1. 3. The number of days until the maximum water level in Danube Delta.
| Year | 2016 | 2017 | 2018 | 2019 | 2020 | 2021 | 2022 | 2023 |
| The number of days until the maximum water level | 81 | 49 | 94 | 168 | 186 | 56 | 14 | 160 |
Table A1. 4. Meteorological data in north of Danube Delta Biosphere Reserve.
| Year | Month | |||||||
| 2016 | April | mean T. (ºC) | abs Max. T. (ºC) | mean Max. T. (ºC) | abs Min. T. (ºC) | mean Min. T. (ºC) | Sum of Preccipitation (mm) | mean of Wind speed (Km/h) |
| May | 13.92667 | 29.76667 | 19.02111 | 2.566667 | 8.831111 | 35.13333 | 15.74444 | |
| June | 16.45376 | 28.26667 | 21.21075 | 6.933333 | 11.70323 | 100.8667 | 12.86022 | |
| 2017 | April | 22.31778 | 33.7 | 27.05111 | 9.233333 | 17.57444 | 53.63333 | 13.6 |
| May | 9.746667 | 20.4 | 14.31444 | 0 | 5.177778 | 88.4 | 18.11111 | |
| June | 16.40108 | 27.86667 | 21.65161 | 5.5 | 11.14839 | 27.86667 | 13.49462 | |
| 2018 | April | 21.84444 | 33.7 | 26.93444 | 11.66667 | 16.74333 | 76.96667 | 14.33333 |
| May | 14.63444 | 27.46667 | 19.72 | 3.5 | 9.557778 | 1.566667 | 17.43333 | |
| June | 19.10323 | 30.26667 | 24.28387 | 9.4 | 13.92581 | 35.53333 | 13.60215 | |
| 2019 | April | 22.22444 | 32.23333 | 27.29333 | 10.1 | 17.15778 | 77.9 | 12.88889 |
| May | 10.74778 | 24.66667 | 15.71 | -1.86667 | 5.784444 | 38.96667 | 14.86667 | |
| June | 18.17312 | 30.4 | 23.21398 | 6.433333 | 13.1172 | 23.2 | 14.48387 | |
| 2020 | April | 24.92111 | 34.23333 | 30.51556 | 14.3 | 19.32778 | 18.83333 | 11.98889 |
| May | 11.34222 | 24.16667 | 17.67778 | -2.8 | 5.002222 | 3.666667 | 17.03333 | |
| June | 16.15161 | 30.4 | 21.30538 | 6.433333 | 11.0043 | 43 | 16.36559 | |
| 2021 | April | 21.93444 | 33.9 | 27.57333 | 9.3 | 16.30222 | 42.1 | 12.15556 |
| May | 9.948889 | 20.8 | 14.28444 | 0.3 | 5.595556 | 36.8 | 14.02222 | |
| June | 16.86667 | 26.83333 | 21.71613 | 6.066667 | 12.02473 | 49.73333 | 14.68817 | |
| 2022 | April | 20.97778 | 31.63333 | 25.30556 | 10.36667 | 16.66111 | 107.1 | 13.34444 |
| May | 11.86222 | 24.56667 | 17.03111 | 0.4 | 6.7 | 16.96667 | 17.94444 | |
| June | 17.63656 | 30.7 | 23.47849 | 5.066667 | 11.79032 | 29.5 | 12.77419 | |
| 2023 | April | 22.44222 | 33.83333 | 27.85333 | 13.33333 | 17.04889 | 32.4 | 12.38889 |
| May | 10.70778 | 19.66667 | 14.38778 | 1.366667 | 7.018889 | 74.06667 | 16.45556 | |
| June | 16.54032 | 27.33333 | 21.8786 | 5.266667 | 11.20419 | 28 | 12.63262 | |
| 21.61111 | 31.8 | 27.05778 | 10 | 16.17111 | 23.33333 | 13.06667 |
Table A1. 5. Aqueous surfaces extend (m2) in a buffer of 500 m around bird colonies.
| Aqueous surface extend (m2) | 2018 | 2019 | 2022 | |
| Purcelu | 9538584.329 | 17184668 | 13475764 | |
| Nebunu | 7684798.868 | 13895239 | 7157345 | |
| Martinca | 11952619.76 | 17413644 | 11305548 | |
| Furtuna | 20832840.1 | 28055384 | 26190169 | |
| Baclanesti | 11480368.78 | 30540212 | 28616716 | |
| Total | 12297842.37 | 21417830 | 17349108 |
Table A1. 6. Distance fom bird colonies to White-Tailed Eagle nests.
| Year | Month | Distance to White-Tailed Eagle nests |
| 2016 | April | 1318,59 |
| 2017 | April | 1318,59 |
| 2018 | April | 1318,59 |
| 2019 | April | 1318,59 |
| 2020 | April | 619,85 |
| 2021 | April | 734,15 |
| 2022 | April | 2468,41 |
| 2023 | April | 2468,41 |
References
- Wyman, K.E.; Wires, L.R.; Cuthbert, F.J. Colonial Waterbird Site Occupancy Dynamics Reflect Variation in Colony Site Environments in the U.S. Great Lakes. J Great Lakes Res 2014, 40, 956–963. [Google Scholar] [CrossRef]
- Francis, R.; Bino, G.; Inman, V.; Brandis, K.; Kingsford, R.T. The Okavango Delta’s Waterbirds – Trends and Threatening Processes. Glob Ecol Conserv 2021, 30, e01763. [Google Scholar] [CrossRef]
- Wen, L.; Rogers, K.; Saintilan, N.; Ling, J. The Influences of Climate and Hydrology on Population Dynamics of Waterbirds in the Lower Murrumbidgee River Floodplains in Southeast Australia: Implications for Environmental Water Management. Ecol Modell 2011, 222, 154–163. [Google Scholar] [CrossRef]
- De la Cruz, A.; Numa, C. Habitat Availability Decline for Waterbirds in a Sensitive Wetland: Climate Change Impact on the Ebro Delta. Ecol Modell 2024, 498, 110896. [Google Scholar] [CrossRef]
- Tockner, K.; Stanford, J.A. Riverine Flood Plains: Present State and Future Trends. Environ Conserv 2002, 29(3), 308–330. [Google Scholar] [CrossRef]
- Gómez-Baggethun, E.; Tudor, M.; Doroftei, M.; Covaliov, S.; Năstase, A.; Onără, D.F.; Mierlă, M.; Marinov, M.; Doroșencu, A.C.; Lupu, G.; et al. Changes in Ecosystem Services from Wetland Loss and Restoration: An Ecosystem Assessment of the Danube Delta (1960–2010). Ecosyst Serv 2019, 39, 100965. [Google Scholar] [CrossRef]
- Amat, J.A.; Green, A.J. Waterbirds as Bioindicators of Environmental Conditions. In Conservation Monitoring in Freshwater Habitats, A Practical Guide and Case Studies; Hurford, C., et al., Eds.; Springer: Berlin & Heidelberg, Germany, 2010; pp. 45–52. [Google Scholar]
- Giosan, L.; Coolen, M.J.L.; Kaplan, J.O.; Constantinescu, S.; Filip, F.; Filipova-Marinova, M.; Kettner, A.J.; Thom, N. Early Anthropogenic Transformation of the Danube-Black Sea System. Sci Rep 2012, 2(1), 582. [Google Scholar] [CrossRef]
- Platteeuw, M.; Kiss, J.B.; Zhmud, M.Y.; Sadoul, N. Colonial Birds in Large-Scale Wetlands: The Danube Delta as an Example for the Delta of Rhine and Meuse? Limosa 2004, 77(2), 79–92. [Google Scholar]
- Crick, H.Q.P. The Impact of Climate Change on Birds. Ibis 2004, 146, 48–56. [Google Scholar] [CrossRef]
- Tian, R.; Li, D.; Zhang, S.; Zhao, Y.; Yi, G. Colony Site Selection of Gray Heron (Ardea Cinerea) During the Breeding Period at Multiple Spatial Scales. Ecol Evol 2025, 15, e70937. [Google Scholar] [CrossRef]
- Samraoui, F.; Nedjah, R.; Boucheker, A.; El-Serehy, H.A.; Samraoui, B. Sky High or Grounded: Nest Site Selection of Herons and Egrets in a Mixed-Species Colony. Ecol Evol 2025, 15, e70761. [Google Scholar] [CrossRef] [PubMed]
- Arévalo Ayala, D.J. Within-Colony Nest Distribution of a Waterbird Mixed Colony in a Small Alluvial Forest at El Salvador. Neotrop Biodivers 2022, 8(1), 76–88. [Google Scholar] [CrossRef]
- Marinov, M.; Dorosencu, A.; Alexe, V.; Bolboaca, L.E.; Kiss, J.B.; Nanu, C.; Tosic, K.; Tudor, M. Recent Data Regarding Colonial Waterbirds in Danube Delta Biosphere Reserve (Romania). Journal of Environmental Protection and Ecology 2019, 20 1, 276–284. [Google Scholar]
- Fasola, M.; Merli, E.; Boncompagni, E.; Rampa, A. Monitoring Heron Populations in Italy, 1972-2010. Journal of Heron Biology and Conservation 2011, 1, 1–8. [Google Scholar]
- Tryjanowski, P.; Jankowiak; Czechowski, P.; Dulisz, B.; Golawski, A.; Grzywaczewski, G.; Indykiewicz, P.; Kwieciński, Z.; Mitrus, C.; Nowakowski, J.J.; et al. Summer Water Sources for Temperate Birds: Use, Importance, and Threats. European Zoological Journal 2022, 89(1), 913–926. [Google Scholar] [CrossRef]
- Francis, R.J.; Kingsford, R.T.; Brandis, K.J. Using Drones and Citizen Science Counts to Track Colonial Waterbird Breeding, an Indicator for Ecosystem Health on the Chobe River, Botswana. Glob Ecol Conserv 2022, 38, e02231. [Google Scholar] [CrossRef]
- Cezilly, F.; Boy, V.; Green, R.E.; Hirons, G.J.; Johnson, A.R. Interannual Variation in Greater Flamingo Breeding Success in Relation to Water Levels. Ecology 1995, 76, 20–26. [Google Scholar] [CrossRef]
- Ciolac, V.; Nistor, E.; Popescu, C.; Babuca, N.I.; Dirlea, A.; Birliba, L. Study of Flora and Birds Habitat in the Danube Delta: GIS Approach. In Proceedings of the International Multidisciplinary Scientific GeoConference Surveying Geology and Mining Ecology Management, SGEM; Albena, Bulgaria, 2013; 1, pp. 935–942. [Google Scholar]
- Swatantra, A.; Dubayah, R.; Goetz, S.; Hofton, M.; Betts, M.G.; Sun, M.; Simard, M.; Holmes, R. Mapping Migratory Bird Prevalence Using Remote Sensing Data Fusion. PLoS One 2012, 7, e28922. [Google Scholar] [CrossRef]
- Batbayar, N.; Yi, K.; Zhang, J.; Natsagdorj, T.; Damba, I.; Cao, L.; Fox, A.D. Combining Tracking and Remote Sensing to Identify Critical Year-Round Site, Habitat Use and Migratory Connectivity of a Threatened Waterbird Species. Remote Sens. 2021, 13, 4049. [Google Scholar] [CrossRef]
- Inglada, J.; Michel, J.; Hagolle, O. Assessment of the Usefulness of Spectral Bands for the Next Generation of Sentinel-2 Satellites by Reconstruction of Missing Bands. Remote Sens. 2022, 14, 2503. [Google Scholar] [CrossRef]
- Platteeuw, M.; Kiss, J.B.; Zhmud, M.Y.; Sadoul, N. Riza Report 2004.002; Colonial Waterbirds and Their Habitat Use in the Danube Delta as an Example of a Large-Scale Natural Wetland. 2024.
- Prejbeanu, I.; Rada, C. The Danube Delta - an Avian Paradise. Interdisciplinary Environmental Review 2007, 9(2), 210–220. [Google Scholar] [CrossRef]
- Danube Water Level - Tulcea Station. Available online: https://www.cotele-dunarii.ro/Tulcea (accessed on 4.04.2024).
- Weather Data SYNOPS/BUFR - GFS/ECMWF Forecast. Available online: http://www.meteomanz.com/index?l=1&pcou=6216 (accessed on 1.03.2024).
- Dumitrescu, A.; Birsan, M.V. ROCADA: A Gridded Daily Climatic Dataset over Romania (1961–2013) for Nine Meteorological Variables. Natural Hazards 2015, 78, 1045–1063. [Google Scholar] [CrossRef]
- Immitzer, M.; Vuolo, F.; Atzberger, C. First Experience with Sentinel-2 Data for Crop and Tree Species Classifications in Central Europe. Remote Sens. 2016, 8, 166. [Google Scholar] [CrossRef]
- Phiri, D.; Simwanda, M.; Salekin, S.; Nyirenda, V.R.; Murayama, Y.; Ranagalage, M. Sentinel-2 Data for Land Cover/Use Mapping: A Review. Remote Sens. 2020, 12, 2291. [Google Scholar] [CrossRef]
- Ayalew, D.A.; Deumlich, D.; Šarapatka, B.; Doktor, D. Quantifying the Sensitivity of NDVI-Based C Factor Estimation and Potential Soil Erosion Prediction using Spaceborne Earth Observation Data. Remote Sens. 2020, 12, 1136. [Google Scholar] [CrossRef]
- Jitariu, V.; Ichim, P.; Sfica, L.; Ursu, A. Climate Change Projections Regarding Apple Orchards in the North-Eastern Region of Romania. In Proceedings of the International Multidisciplinary Scientific GeoConference Surveying Geology and Mining Ecology Management, SGEM, Albena, Bulgaria, 30 June - 6 July 2019; pp. 915–924. [Google Scholar]
- Tenreiro, T.R.; García-Vila, M.; Gómez, J.A.; Jiménez-Berni, J.A.; Fereres, E. Using NDVI for the Assessment of Canopy Cover in Agricultural Crops within Modelling Research. Computers and Electronics in Agriculture 2021, 182, 106038. [Google Scholar] [CrossRef]
- Leveau, L.M.; Isla, F.I.; Bellocq, M.I. Predicting the Seasonal Dynamics of Bird Communities along an Urban-Rural Gradient Using NDVI. 2018, 177, 103–113. [Google Scholar] [CrossRef]
- Jitariu, V.; Dorosencu, A.; Ichim, P.; Ion, C. Severe Drought Monitoring by Remote Sensing Methods and Its Impact on Wetlands Birds Assemblages in Nuntași and Tuzla Lakes (Danube Delta Biosphere Reserve). Land 2022, 11, 672. [Google Scholar] [CrossRef]
- Bonthoux, S.; Lefèvre, S.; Herrault, P.-A.; Sheeren, D. Spatial and Temporal Dependency of NDVI Satellite Imagery in Predicting Bird Diversity over France. Remote Sens. 2018, 10, 1136. [Google Scholar] [CrossRef]
- Anderle, M.; Brambilla, M.; Hilpold, A.; Matabishi, J.G.; Paniccia, C.; Rocchini, D.; Rossin, J.; Tasser, E.; Torresani, M.; Tappeiner, U.; et al. Habitat Heterogeneity Promotes Bird Diversity in Agricultural Landscapes: Insights from Remote Sensing Data. Basic Appl Ecol 2023, 70, 38–49. [Google Scholar] [CrossRef]
- White, J.G.; Sparrius, J.; Robinson, T.; Hale, S.; Lupone, L.; Healey, T.; Cooke, R.; Rendall, A.R. Can NDVI Identify Drought Refugia for Mammals and Birds in Mesic Landscapes? Science of the Total Environment 2022, 851, 158318. [Google Scholar] [CrossRef]
- McFeeters, S.K. The Use of the Normalized Difference Water Index (NDWI) in the Delineation of Open Water Features. Int J Remote Sens 1996, 17(7), 1425–1432. [Google Scholar] [CrossRef]
- Gao, B.C. NDWI - A Normalized Difference Water Index for Remote Sensing of Vegetation Liquid Water from Space. Remote Sens Environ 1996, 58(3), 257–266. [Google Scholar] [CrossRef]
- Simioni, J.P.D.; Guasselli, L.A.; de Oliveira, G.; Mataveli, G.A.V.; dos Santos, T.V. A Remote Sensing-Based Method to Assess Water Level Fluctuations in Wetlands in Southern Brazil. GeoHazards 2020, 1, 20–30. [Google Scholar] [CrossRef]
- Ashok, A.; Rani, H.P.; Jayakumar, K. V. Monitoring of Dynamic Wetland Changes Using NDVI and NDWI Based Landsat Imagery. Remote Sens Appl 2021, 23. [Google Scholar] [CrossRef]
- Bates, D.; Maechler, M.; Bolker, B.; Walker, S. lme4: Linear Mixed-Effects Models Using Eigen and S4. R package version 1.1-7, 2014. Available online: https://CRAN.R-project.org/package=lme4 (accessed on 15.04.2025).
- Fife, D. Flexplot: Graphically Based Data Analysis. Psychol. Methods 2021, 27, 477–495. [Google Scholar] [CrossRef] [PubMed]
- Kassambara, A. ggcorrplot: Visualization of a Correlation Matrix Using “ggplot2”. R package version 0.1.1, 2019. Available online: https://CRAN.R-project.org/package=ggcorrplot (accessed on 15.04.2025).
- Fox, J.; Weisberg, S.; Price, B. carData: Companion to Applied Regression Data Sets. R package version 3.0-5, 2020. Available online: https://CRAN.R-project.org/package=carData (accessed on 15.04.2025).
- Kassambara, A.; Mundt, F. factoextra: Extract and Visualize the Results of Multivariate Data Analyses. [CrossRef]
- R package version 1.0.7, 2020. Available online: https://CRAN.R-project.org/package=factoextra (accessed on 15 April 2025).
- Hardin, J.W.; Hilbe, J.M. Analysis of Fit. In Generalized Linear Models and Extensions, 2nd ed.; Stata Press: College Station, TX, USA, 2008. [Google Scholar]
- King, J.R.; Jackson, D.A. Variable Selection in Large Environmental Data Sets Using Principal Components Analysis. Environmetrics 1999, 10, 66–77. [Google Scholar] [CrossRef]
- Bădăluță, C.A.; Haliuc, A.; Bădăluță, G.; Scriban, R.E. Spatiotemporal variability of drought in Romania during 1901-2021 using the Standardized Precipitation Evapotranspiration index (SPEI). Analele Universităţii din Oradea, Seria Geografie 2024, 33, 33–43. [Google Scholar] [CrossRef]
- Belda, M.; Holtanová, E.; Halenka, T.; Kalvová, J. Climate Classification Revisited: From Köppen to Trewartha. Clim Res 2014, 59, 1–13. [Google Scholar] [CrossRef]
- James, G.; Gareth, M.; Witten, D.; Hastie, T.; Tibshirani, R. An Introduction to Statistical Learning: With Applications in R. Statistical Theory and Related Fields 2021, 6(1), 1–1. [Google Scholar] [CrossRef]
- Li, X.; Anderson, C.J.; Wang, Y.; Lei, G. Waterbird Diversity and Abundance in Response to Variations in Climate in the Liaohe Estuary, China. Ecol Indic 2021, 132, 108286. [Google Scholar] [CrossRef]
- Craig, E.C.; Elbin, S.B.; Sparks, J.P.; Curtis, P.D. Identifying Important Foraging Habitat for Colonial Waterbirds in an Urban Estuary: A Stable Isotope Approach. Waterbirds 2015, 38(4), 330–338. [Google Scholar] [CrossRef]
- Nayak, A. Nesting Tree Selection by Scattered Heronry Birds of Drought Prone Northern Bankura, West Bengal, India: Preference of Phoenix Sylvestris near Wetland-Associated Habitats. Not Sci Biol 2021, 13(1), 10871. [Google Scholar] [CrossRef]
- Maleki, S.; Baghdadi, N.; Rahdari, V. Which Water Bird Groups Need Greater Habitat Conservation Measures in a Wetland Ecosystem? Ecol Eng 2020, 143, 105677. [Google Scholar] [CrossRef]
- Ozesmi, S.L.; Bauer, M.E. Satellite Remote Sensing of Wetlands. Wetl Ecol Manag 2002, 10, 381–402. [Google Scholar] [CrossRef]
- Aslam, R.W.; Shu, H.; Javid, K.; Pervaiz, S.; Mustafa, F.; Raza, D.; Ahmed, B.; Quddoos, A.; Al-Ahmadi, S.; Hatamleh, W.A. Wetland Identification through Remote Sensing: Insights into Wetness, Greenness, Turbidity, Temperature, and Changing Landscapes. Big Data Research 2024, 35, 2214–5796, 100416. [Google Scholar] [CrossRef]
Figure 1.
Location of studied waterbird colonies in Danube Delta (Purcelu -1, Nebunu – 2, Martinca – 3, Fortuna – 4, Băclănești – 5).
Figure 1.
Location of studied waterbird colonies in Danube Delta (Purcelu -1, Nebunu – 2, Martinca – 3, Fortuna – 4, Băclănești – 5).
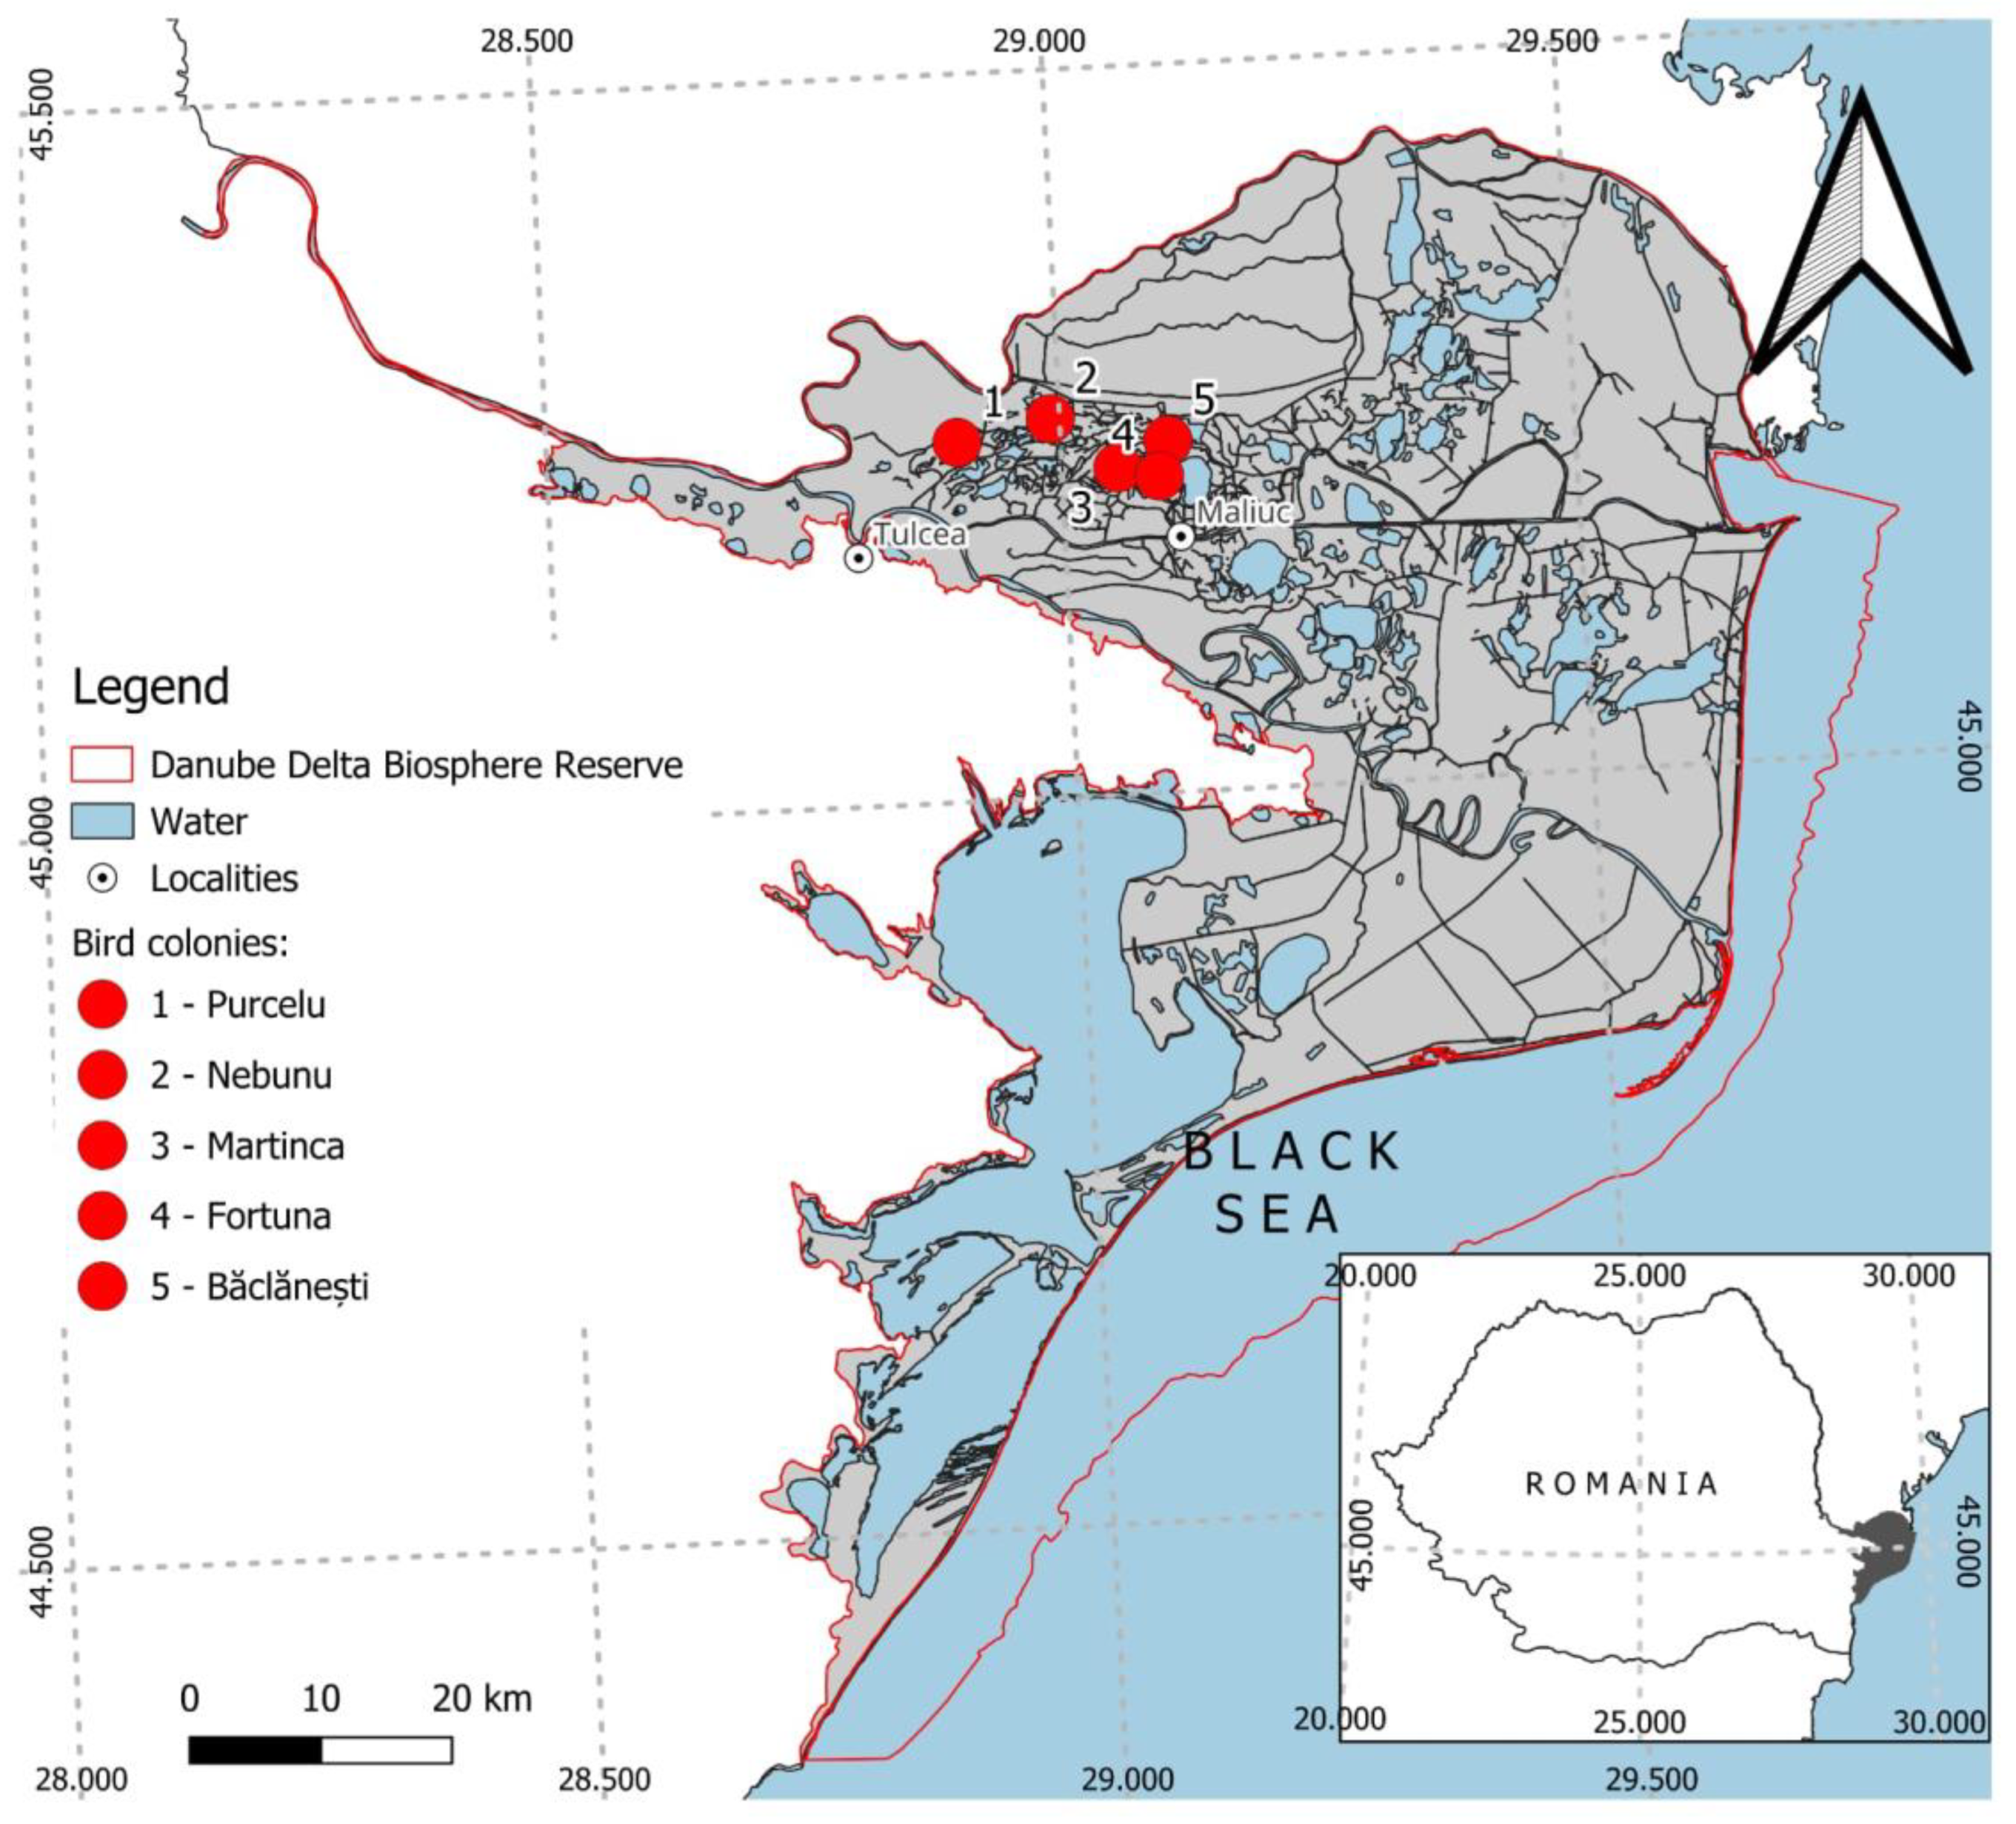
Figure 2.
Workflow of the analysis.
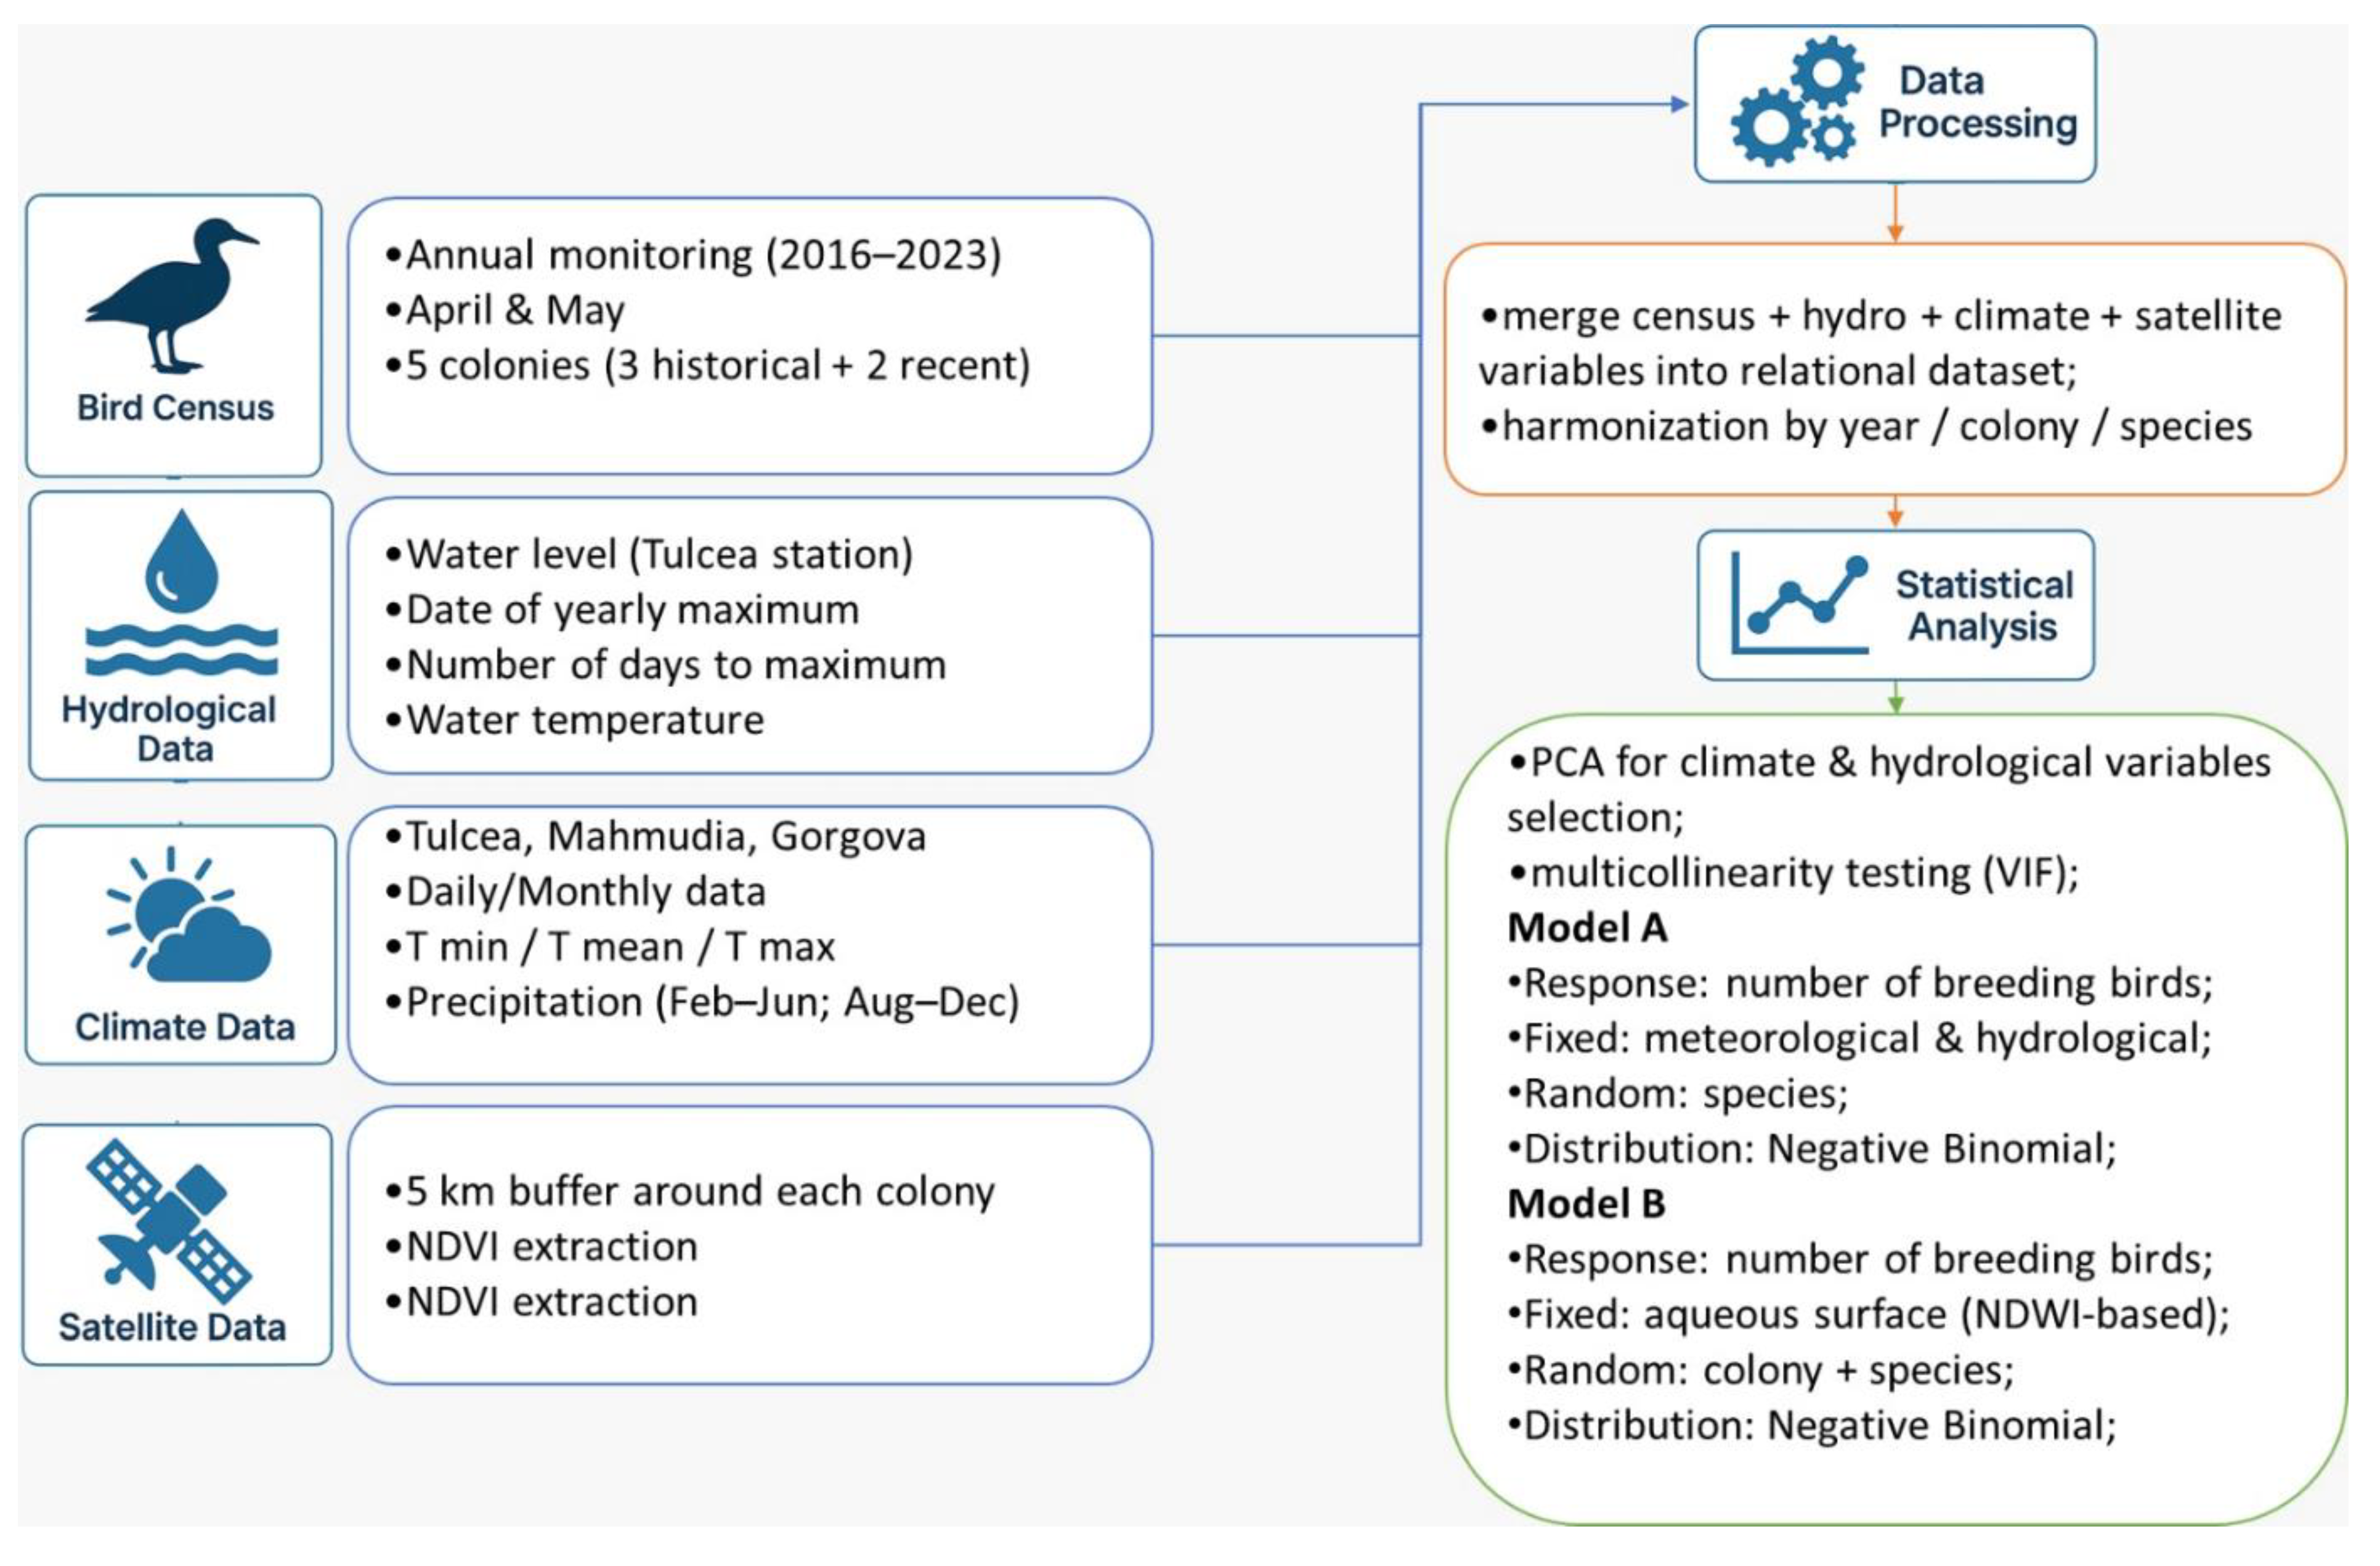
Figure 3.
Water levels fluctuate much more than temperature at the entrance in Danube Delta.
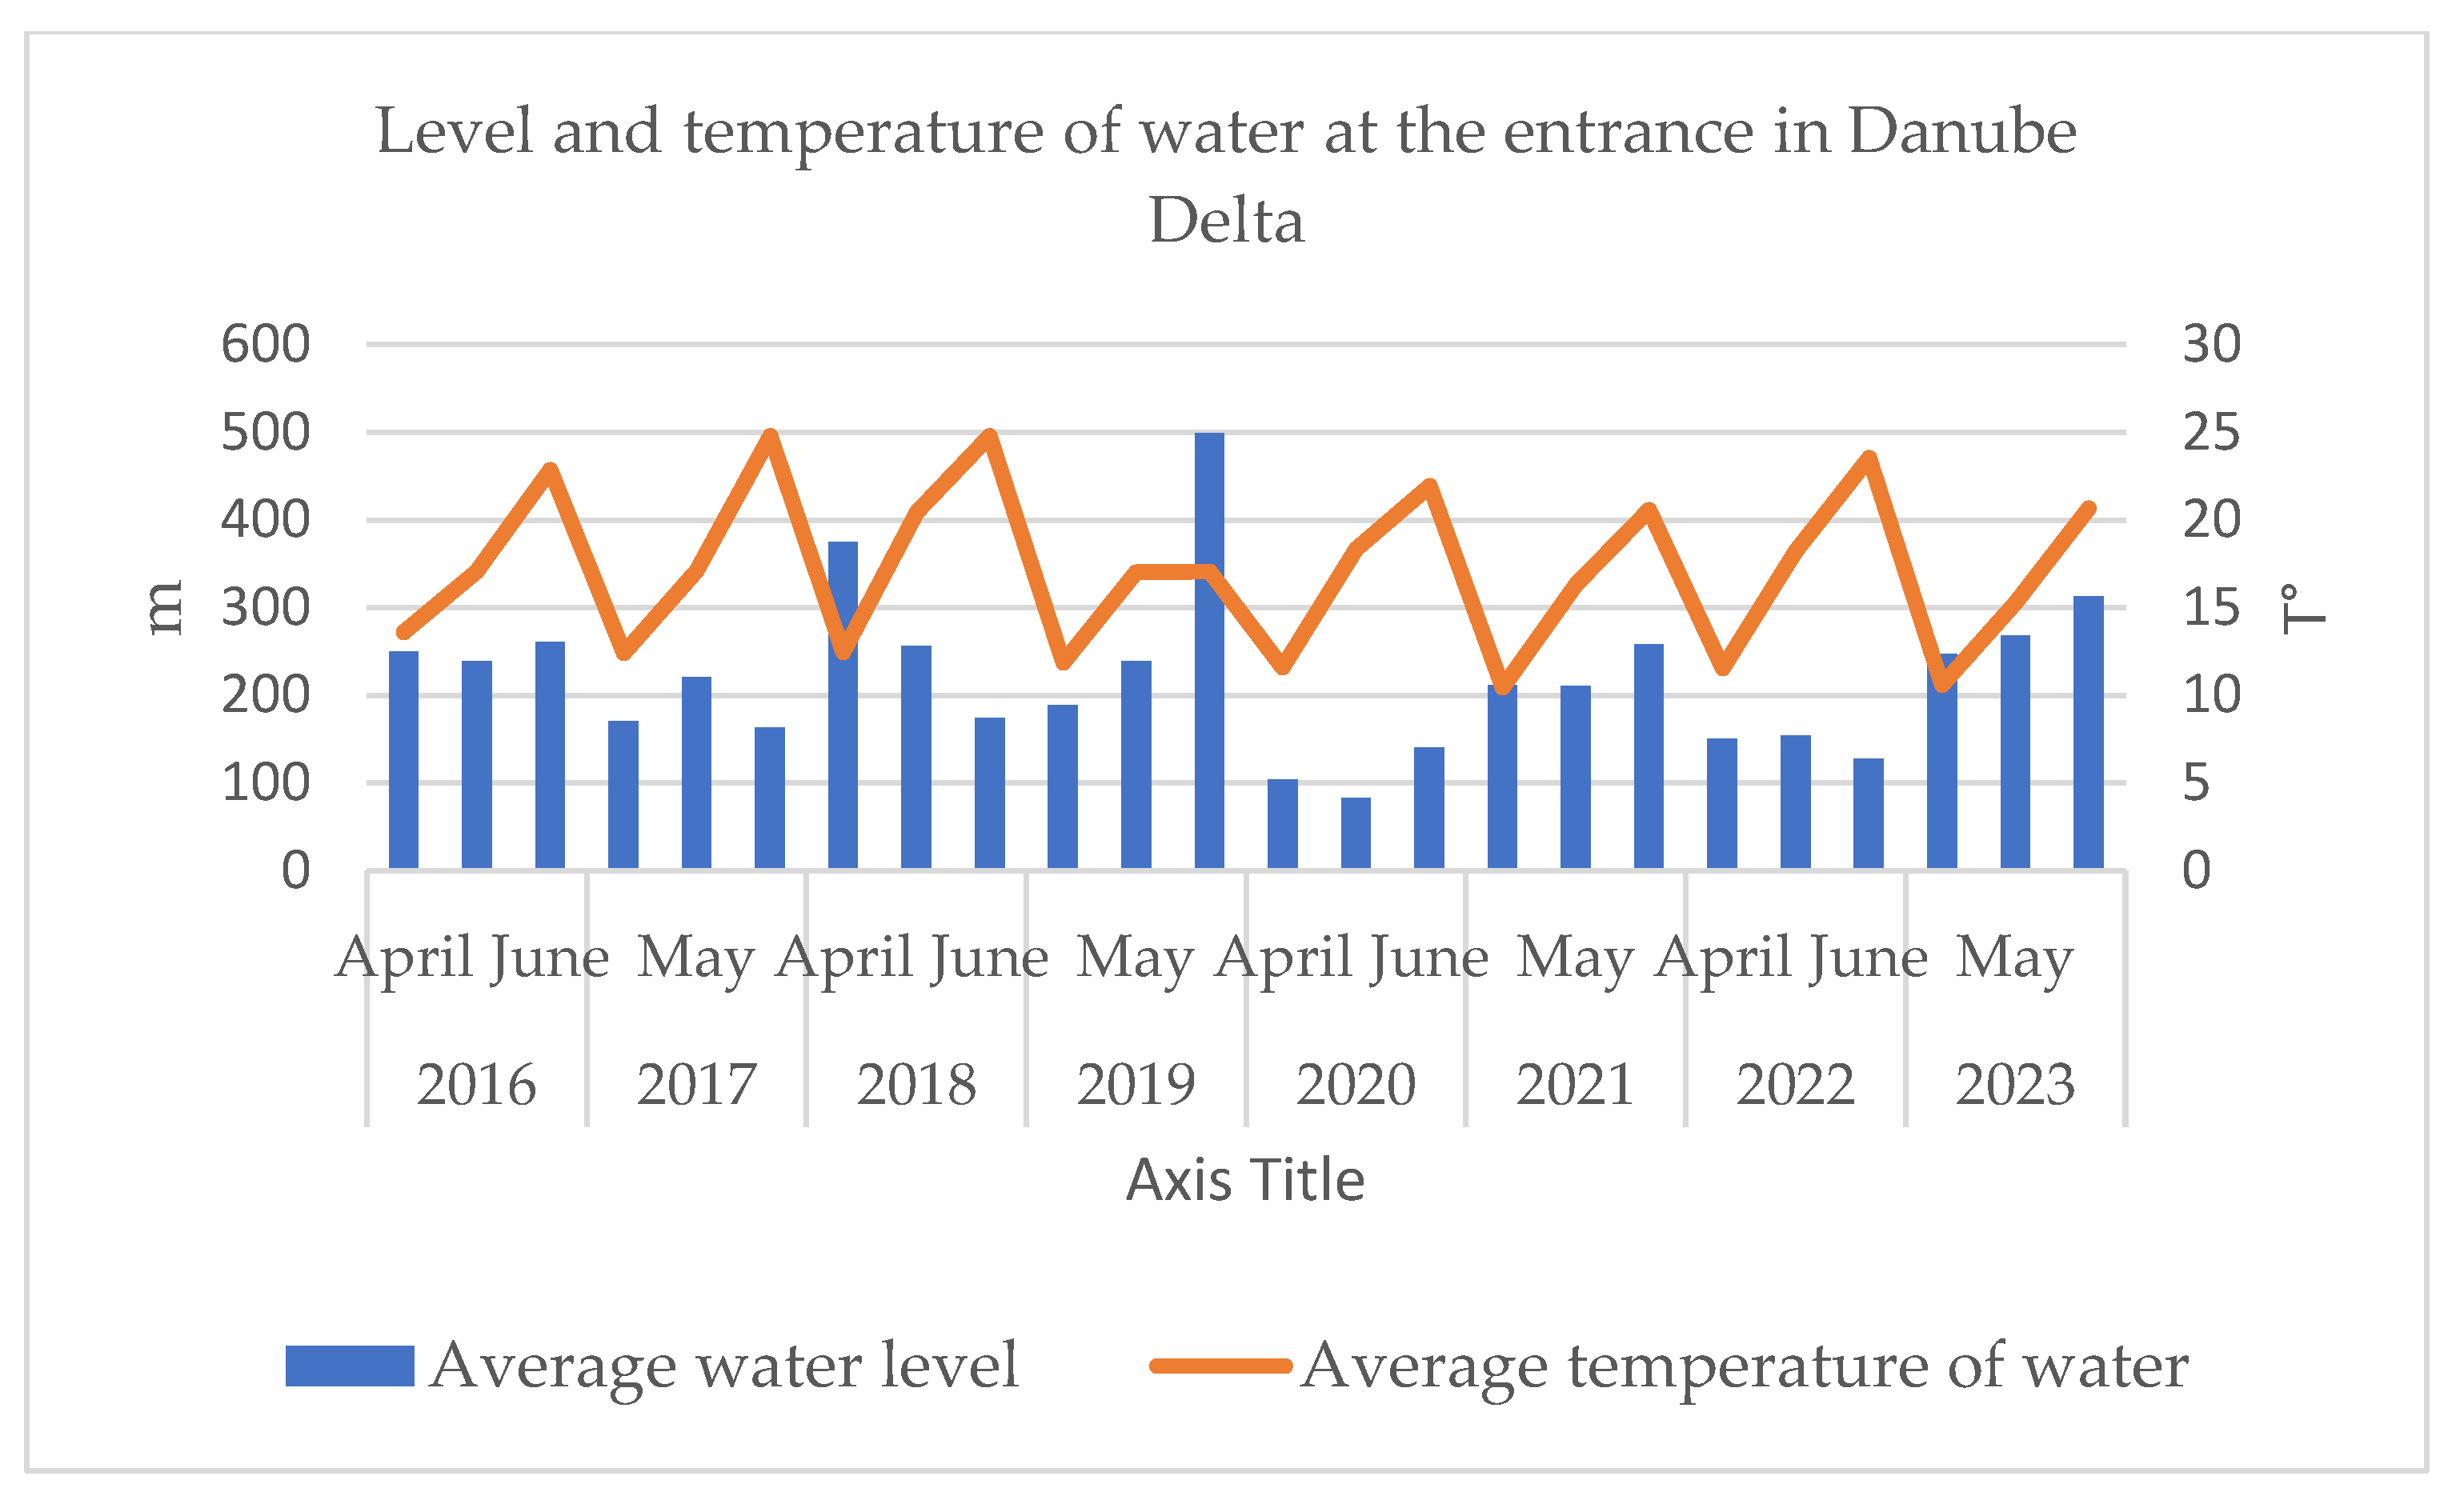
Figure 4.
Climatic characteristics in the Danube Delta (1961 – 2023) for the main meteorological stations – a) Tulcea; b) Gorgova and c) Mahmudia.
Figure 4.
Climatic characteristics in the Danube Delta (1961 – 2023) for the main meteorological stations – a) Tulcea; b) Gorgova and c) Mahmudia.
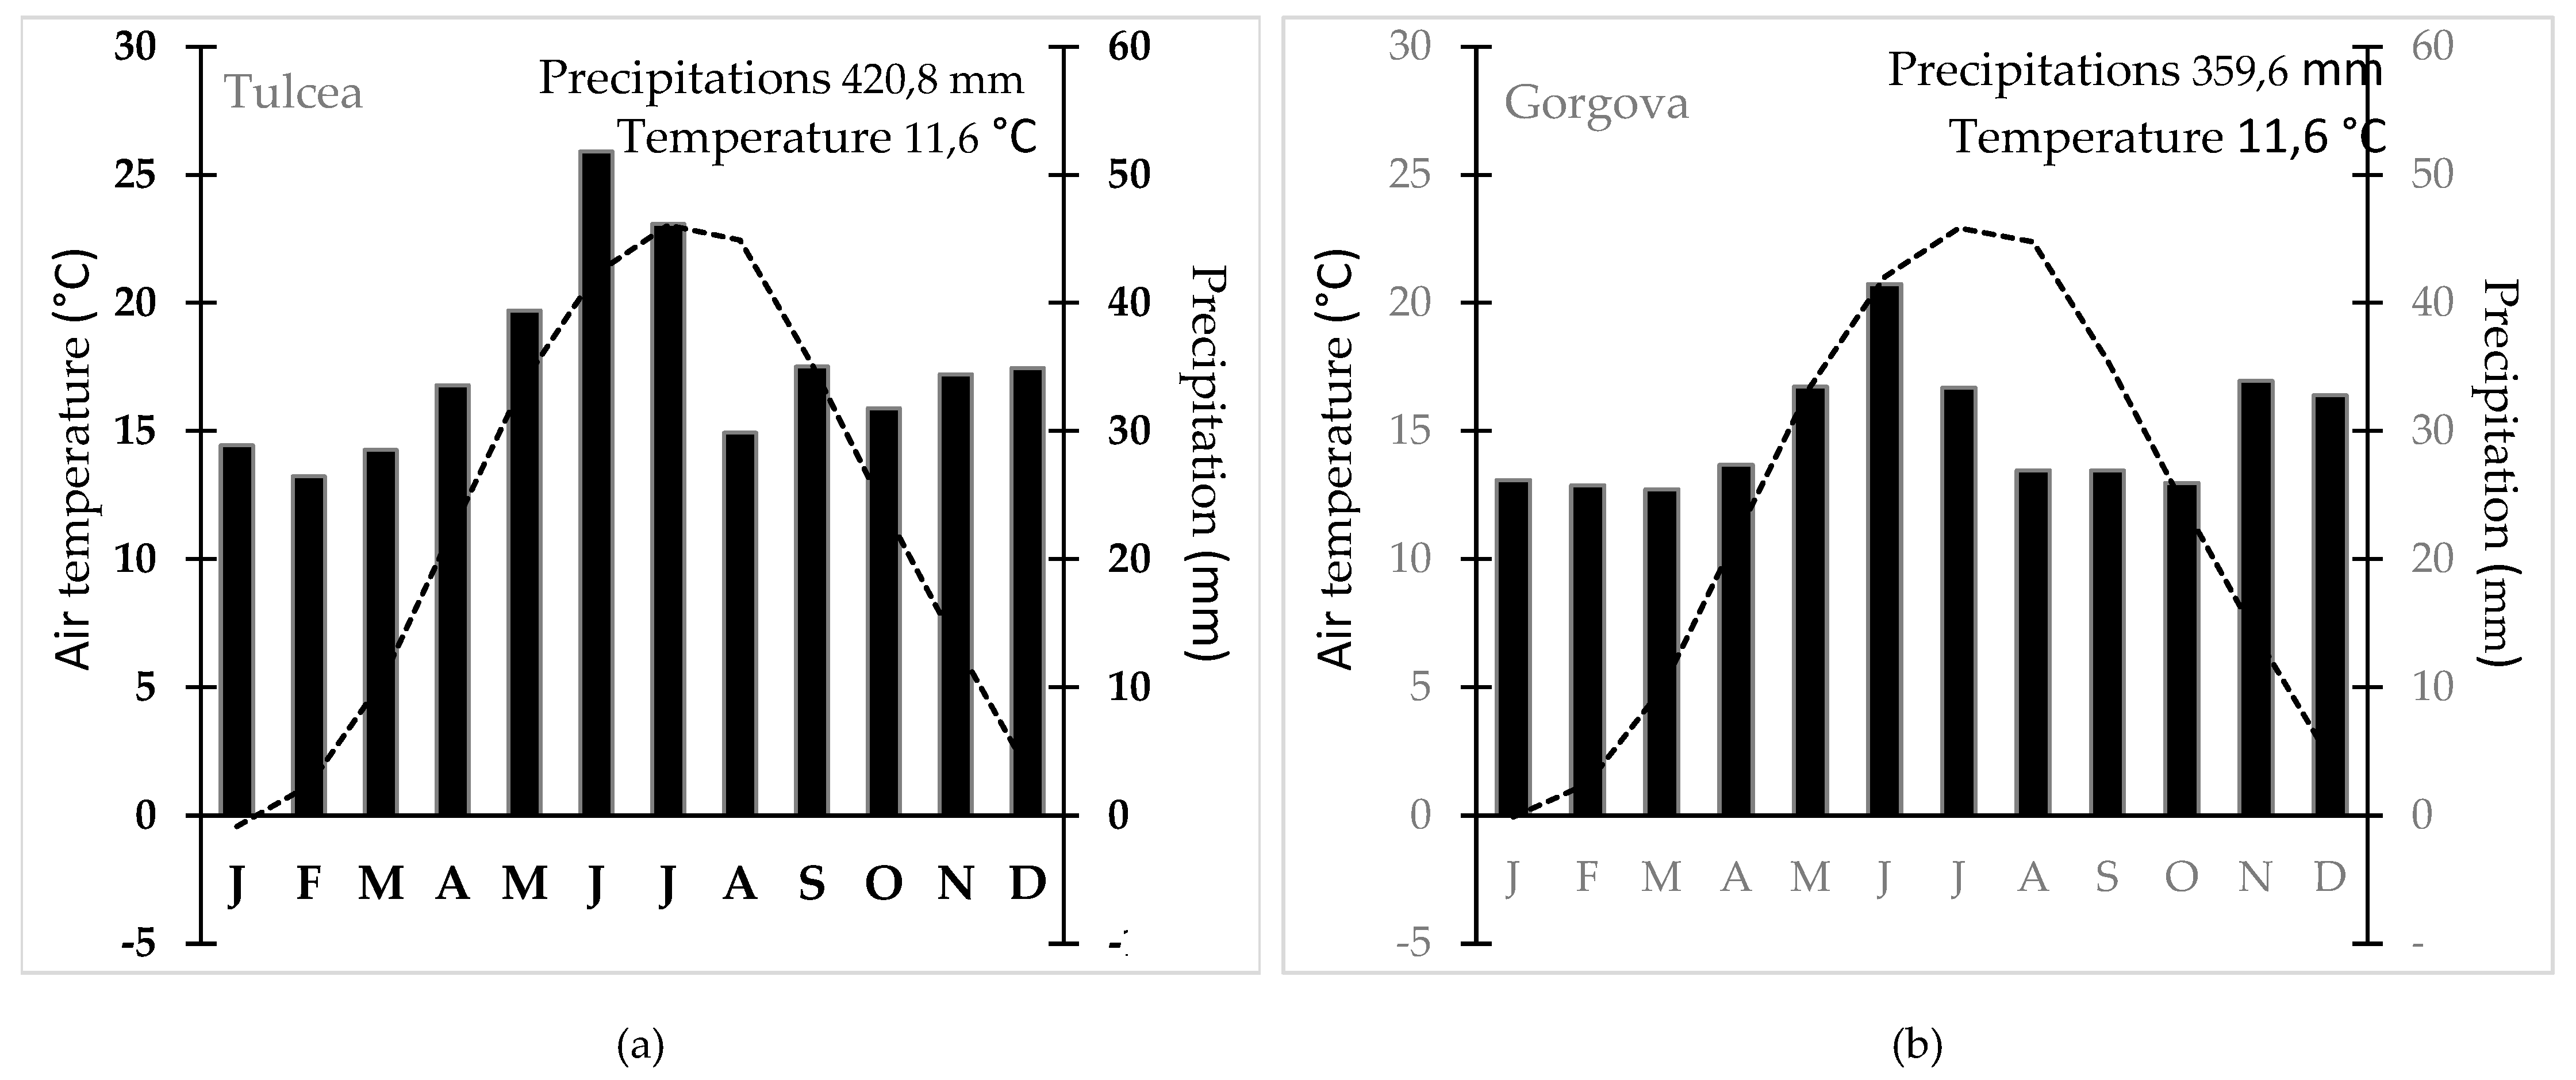
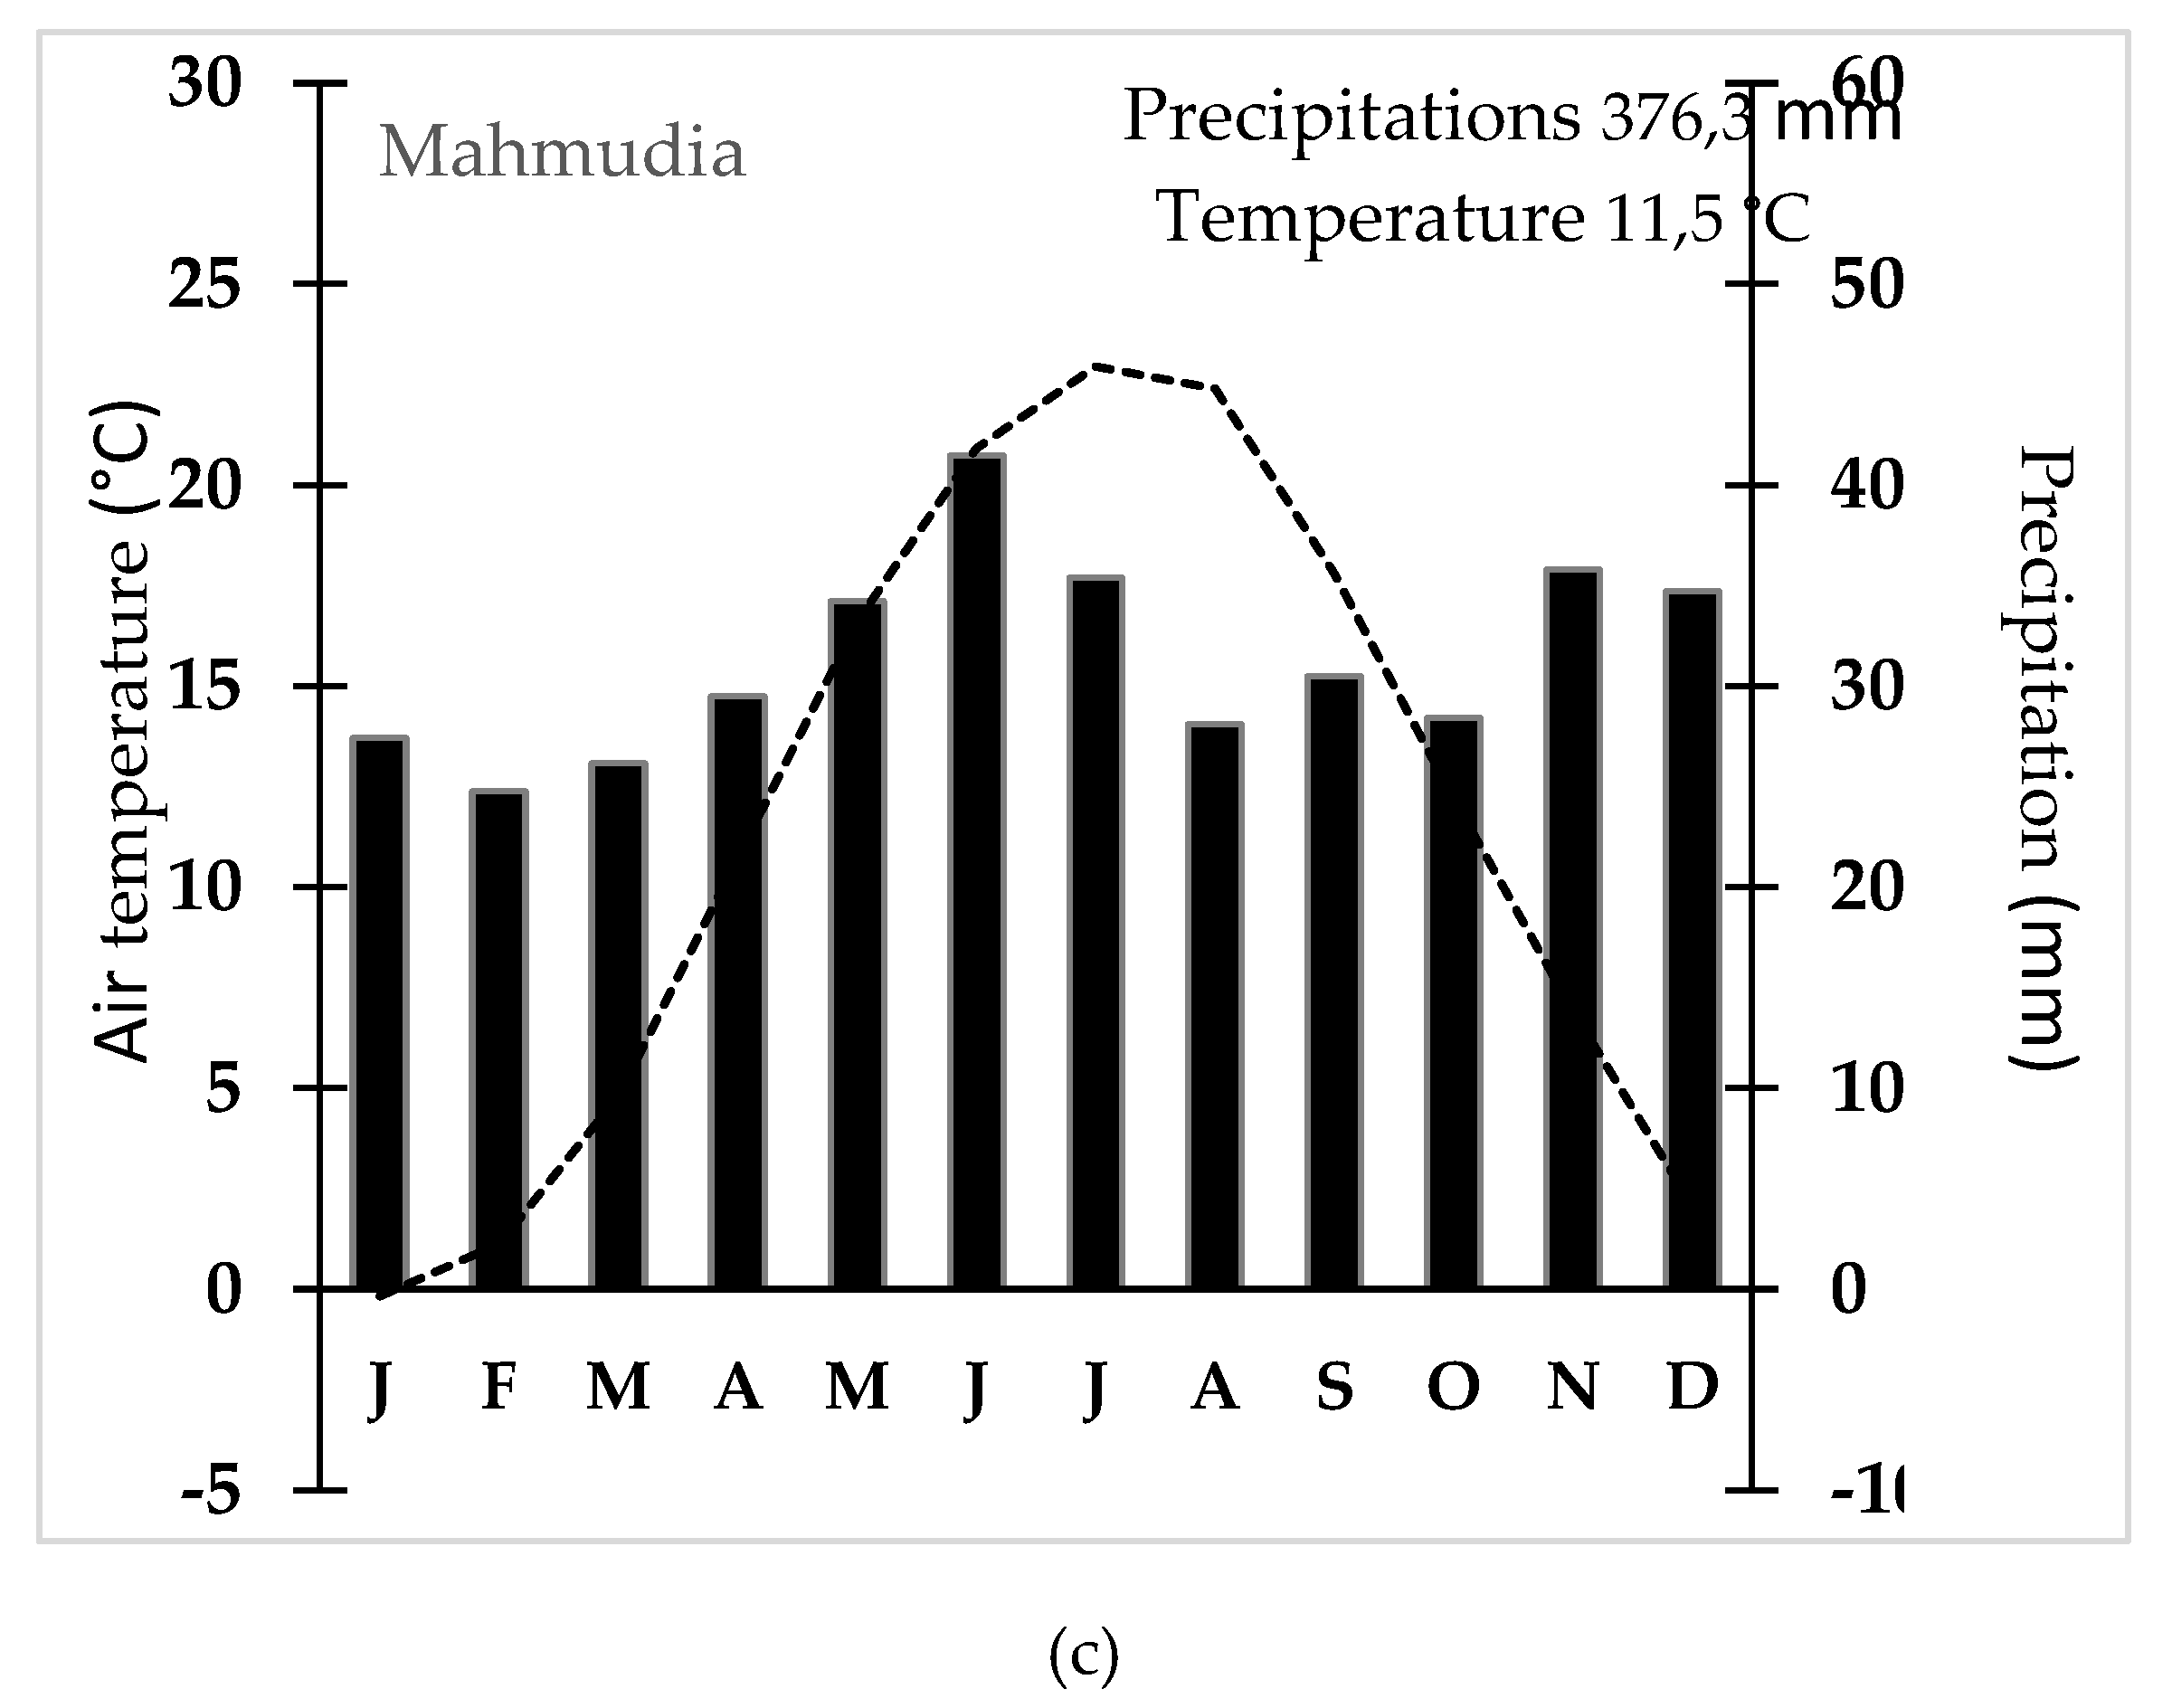
Figure 5.
Temperature and precipitation anomalies for 2016-2023. Black line represents the trends of temperature, respectively of precipitation during the years.
Figure 5.
Temperature and precipitation anomalies for 2016-2023. Black line represents the trends of temperature, respectively of precipitation during the years.
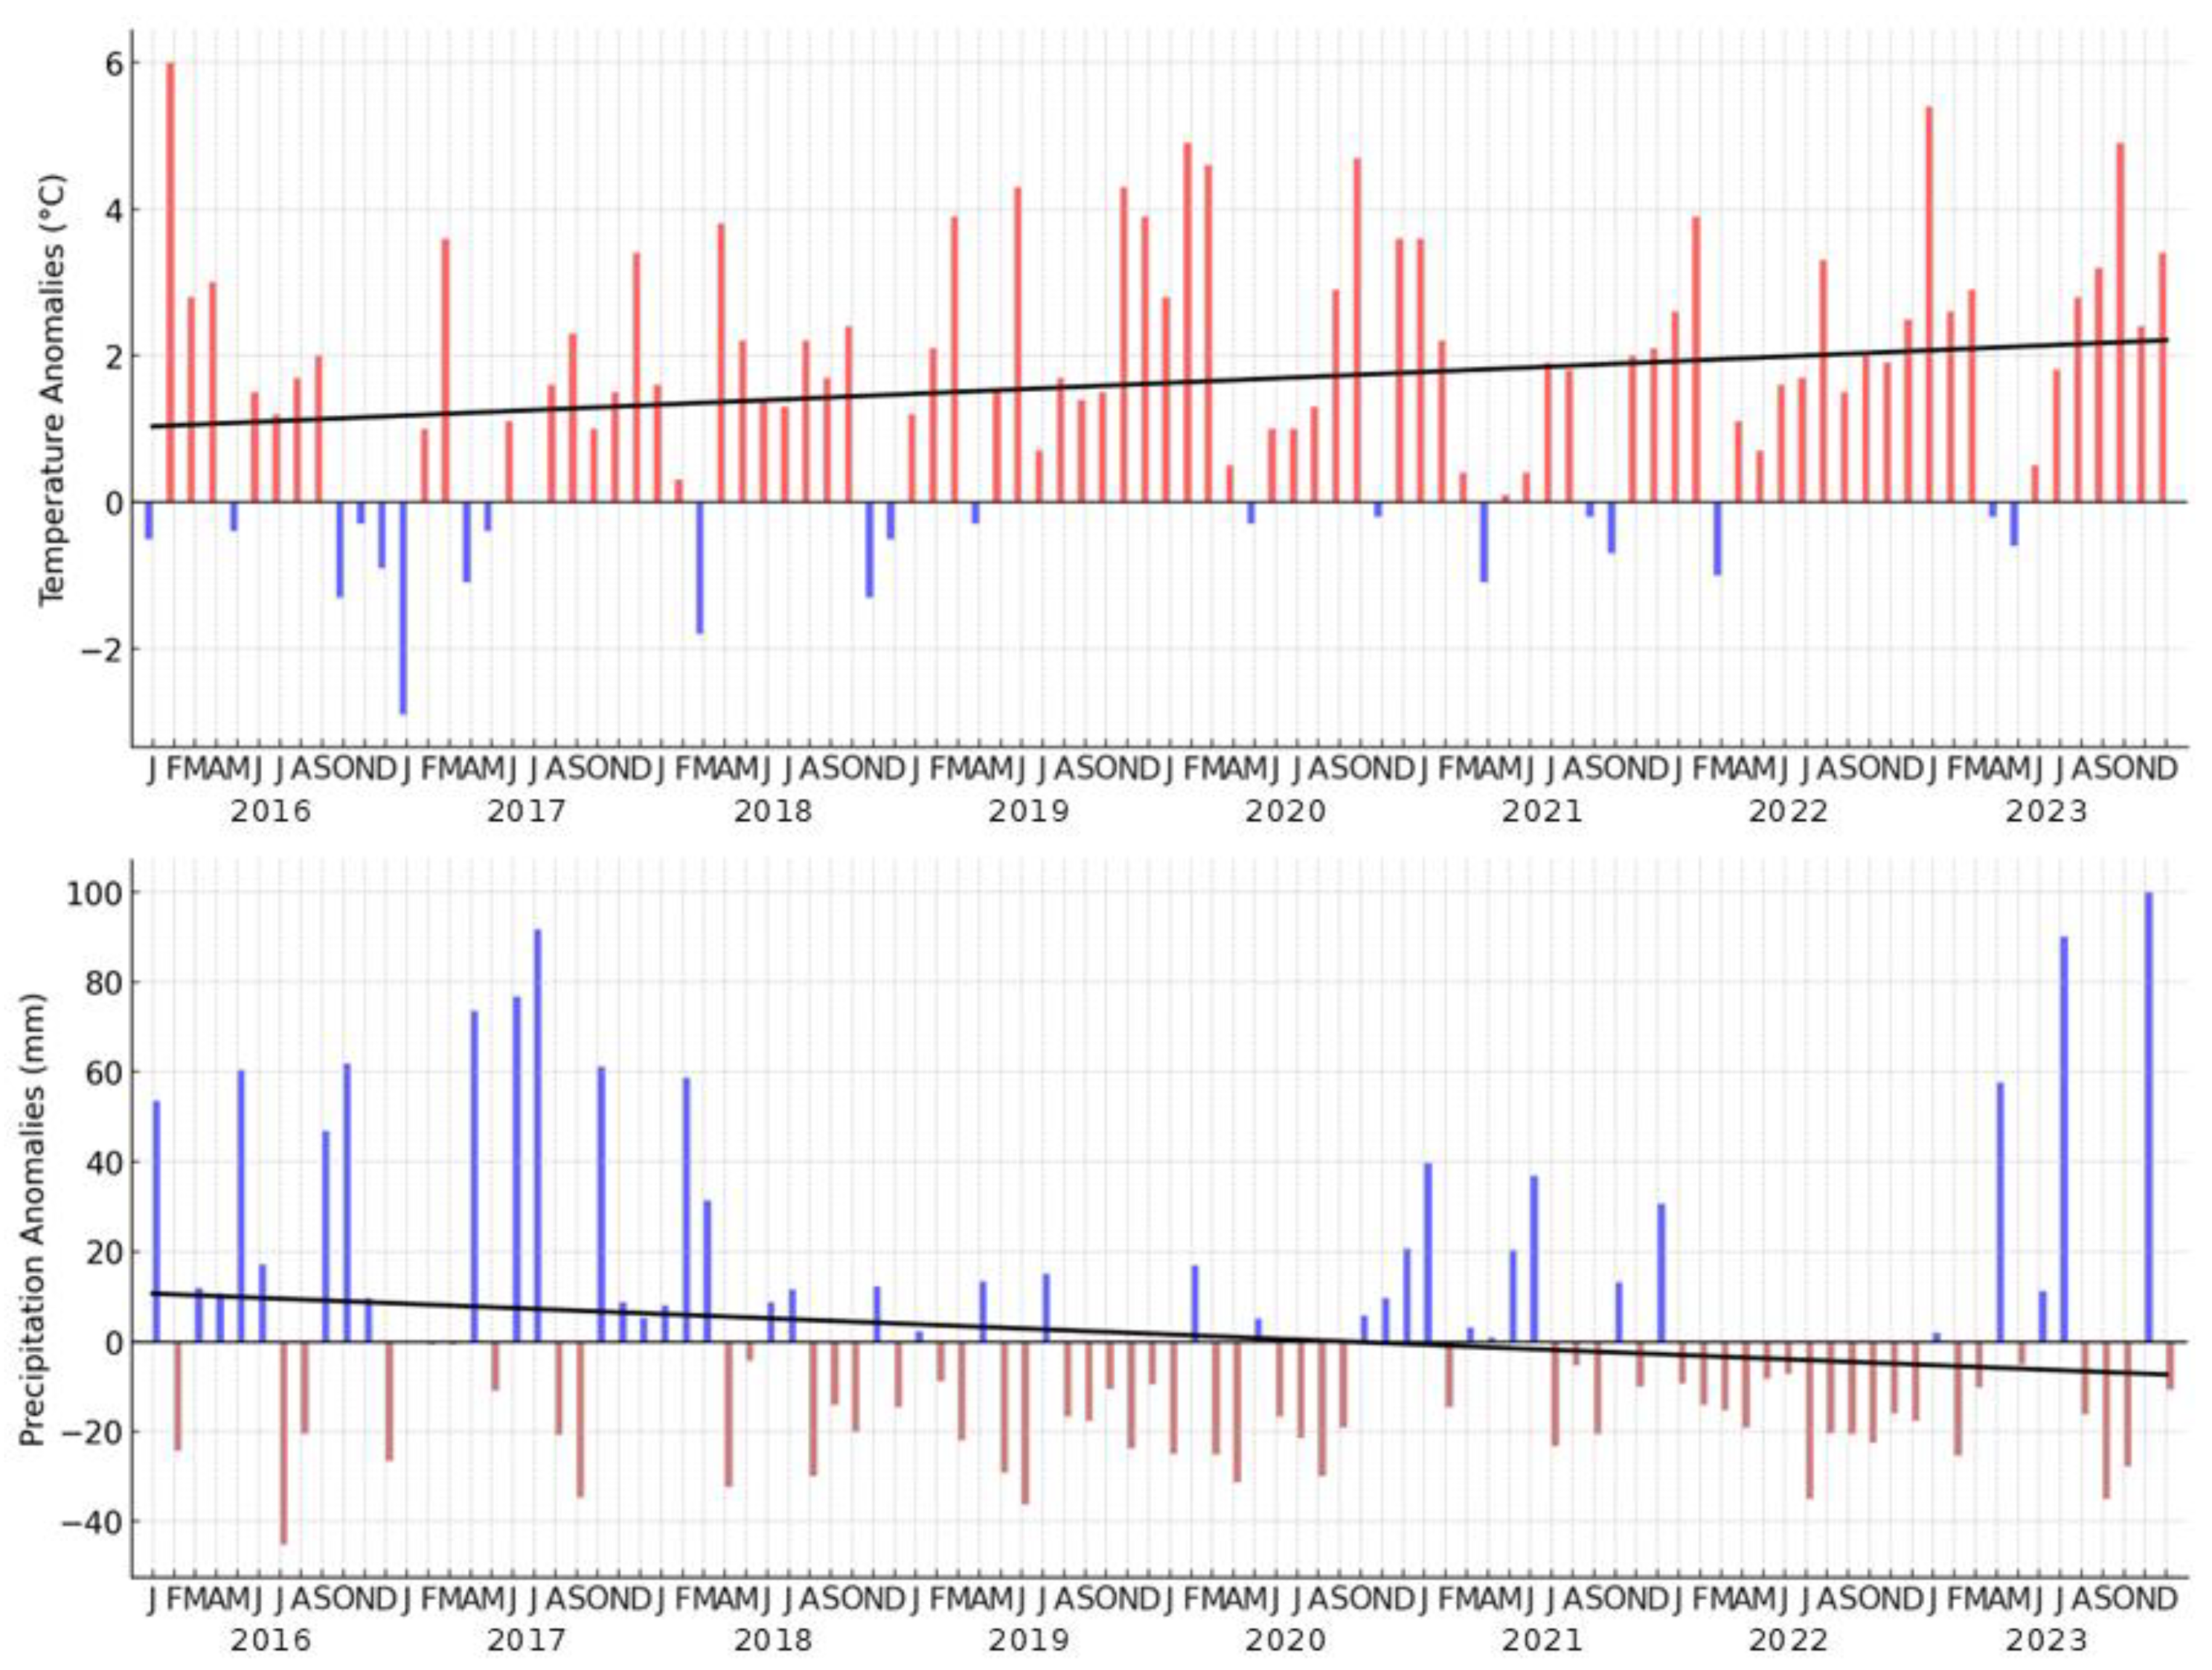
Figure 6.
NDVI situation in 5 km buffer around the centre of waterbird colonies, from left to right: Purcelu, Nebunu, Martinca, Fortuna, Băclănești.
Figure 6.
NDVI situation in 5 km buffer around the centre of waterbird colonies, from left to right: Purcelu, Nebunu, Martinca, Fortuna, Băclănești.
Figure 7.
NDWI situation in 5 km buffer around the centre of waterbird colonies, from left to right: Purcelu, Nebunu, Martinca, Fortuna, Băclănești.
Figure 7.
NDWI situation in 5 km buffer around the centre of waterbird colonies, from left to right: Purcelu, Nebunu, Martinca, Fortuna, Băclănești.
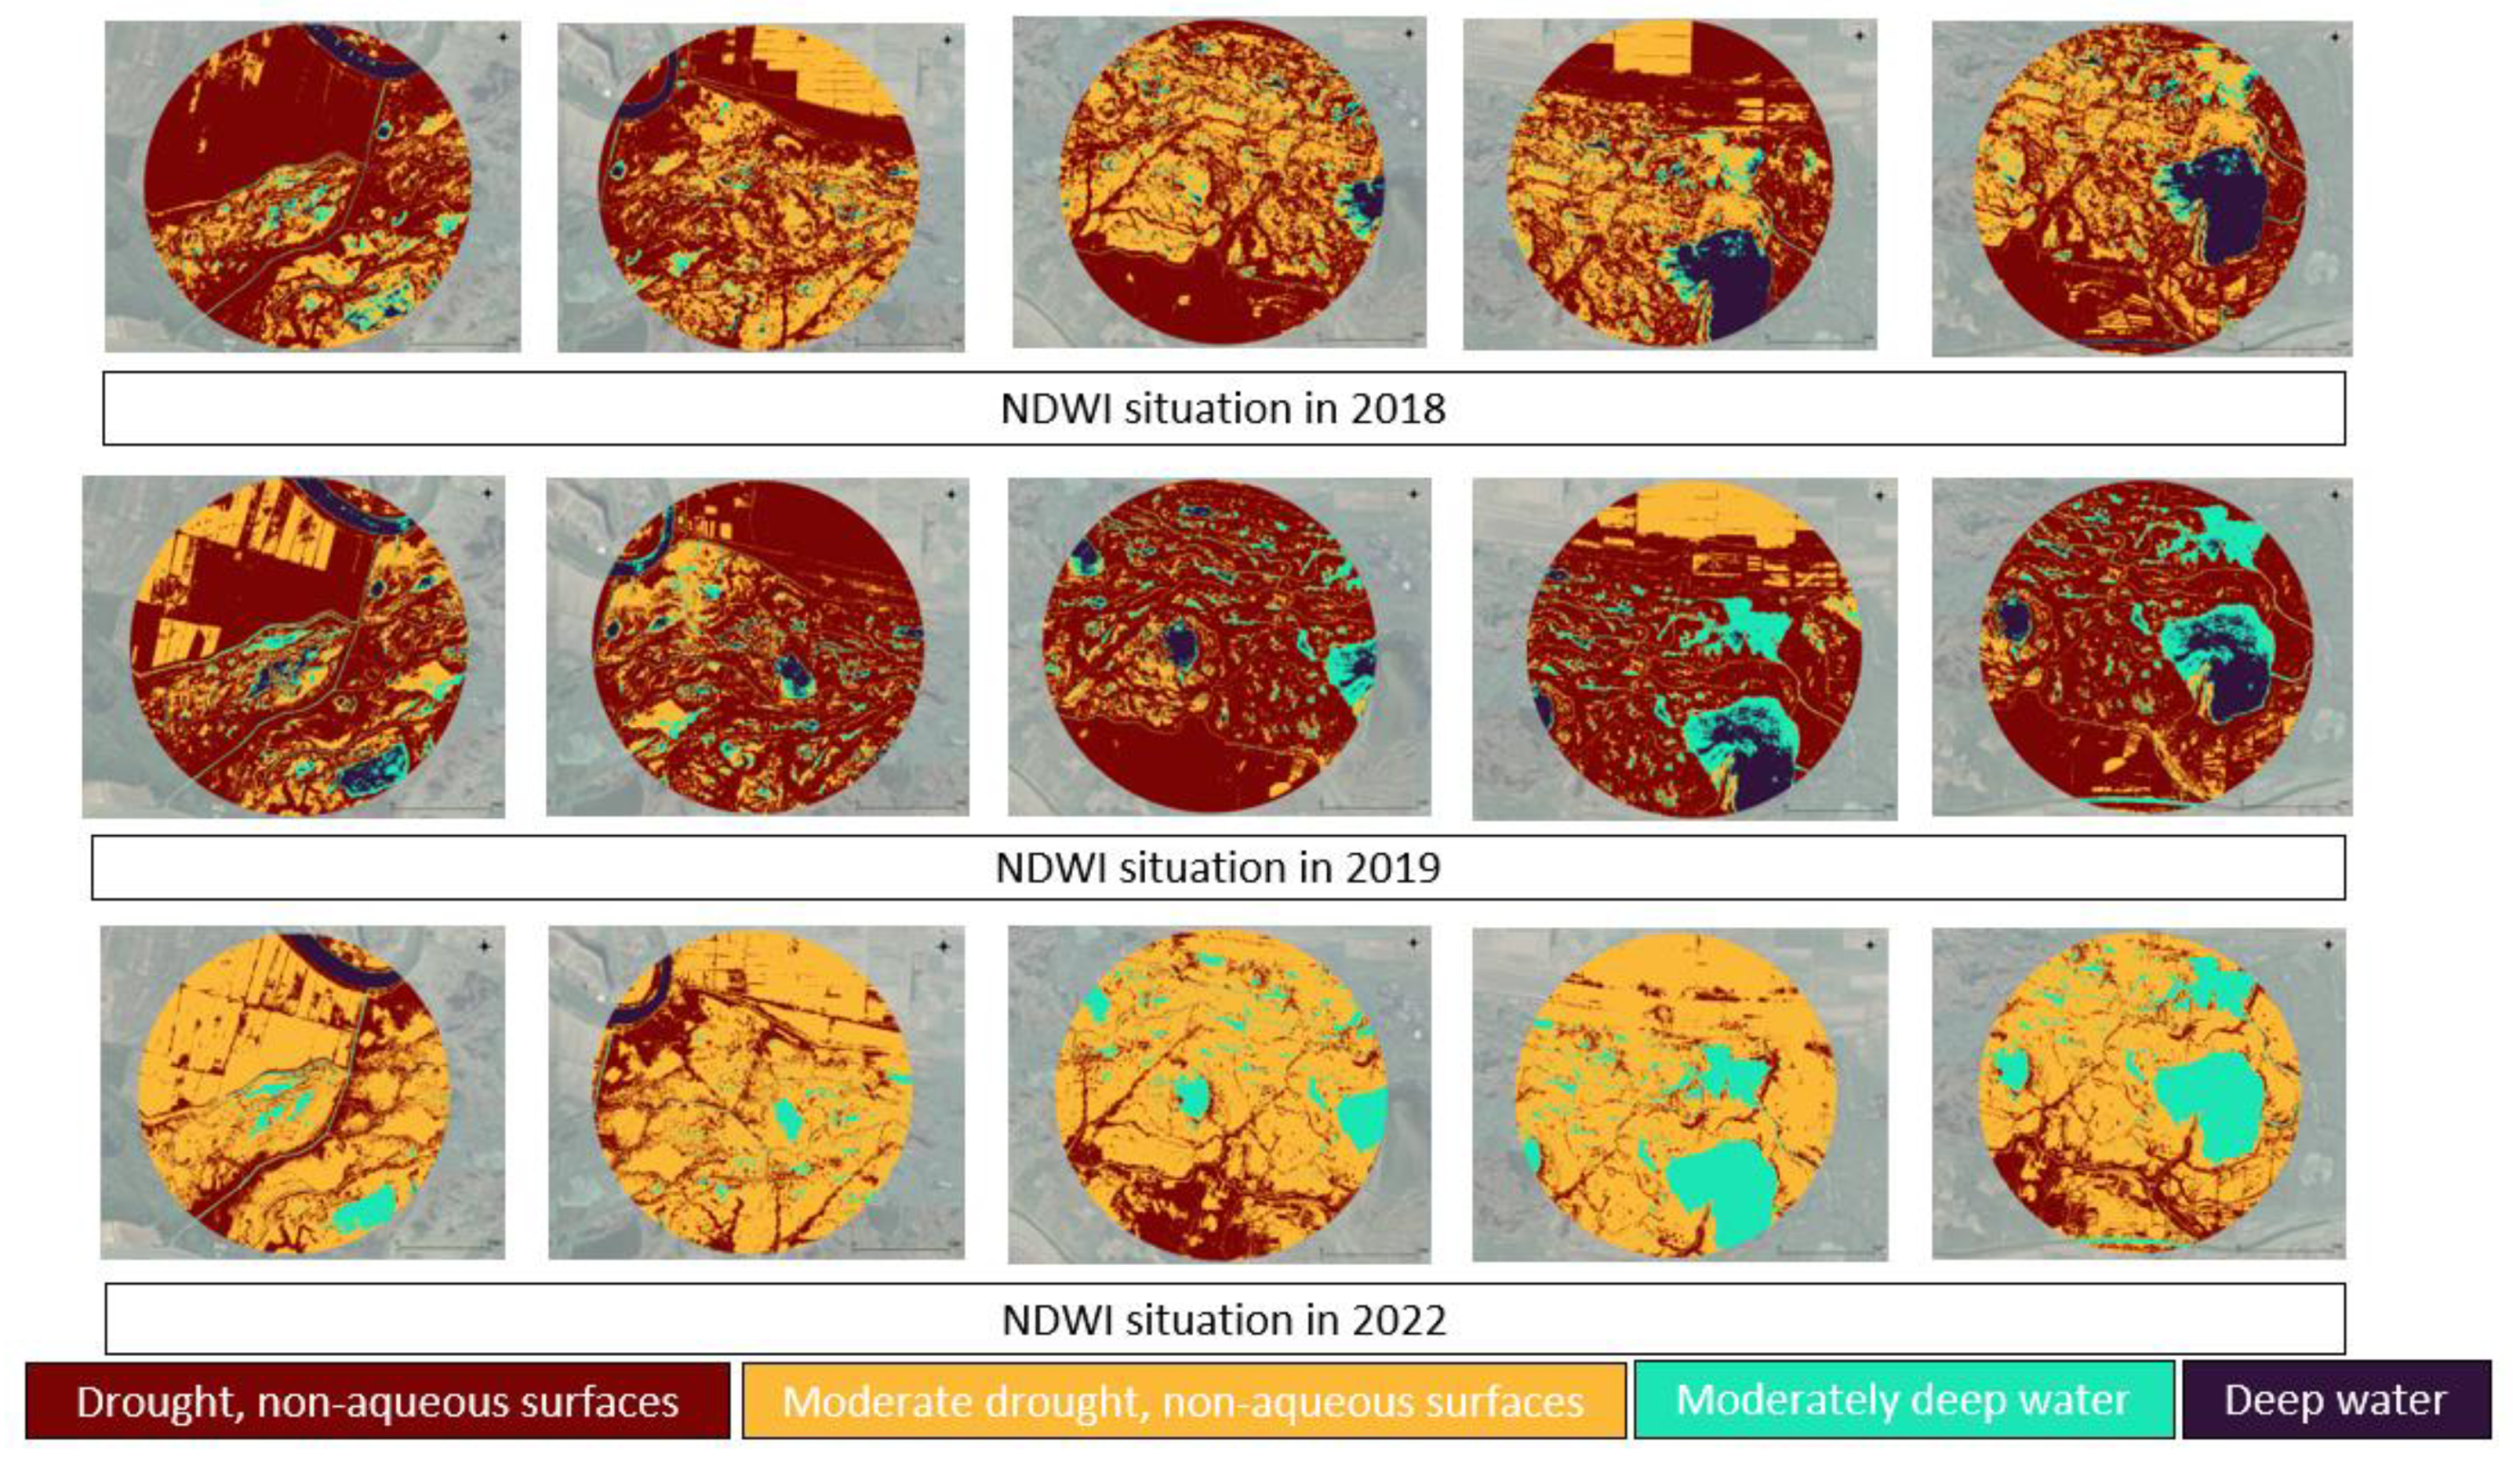
Figure 8.
Aqueous areas in 5 km buffer around bird colonies from the north of Danube Delta Biosphere Reserve (Romania).
Figure 8.
Aqueous areas in 5 km buffer around bird colonies from the north of Danube Delta Biosphere Reserve (Romania).
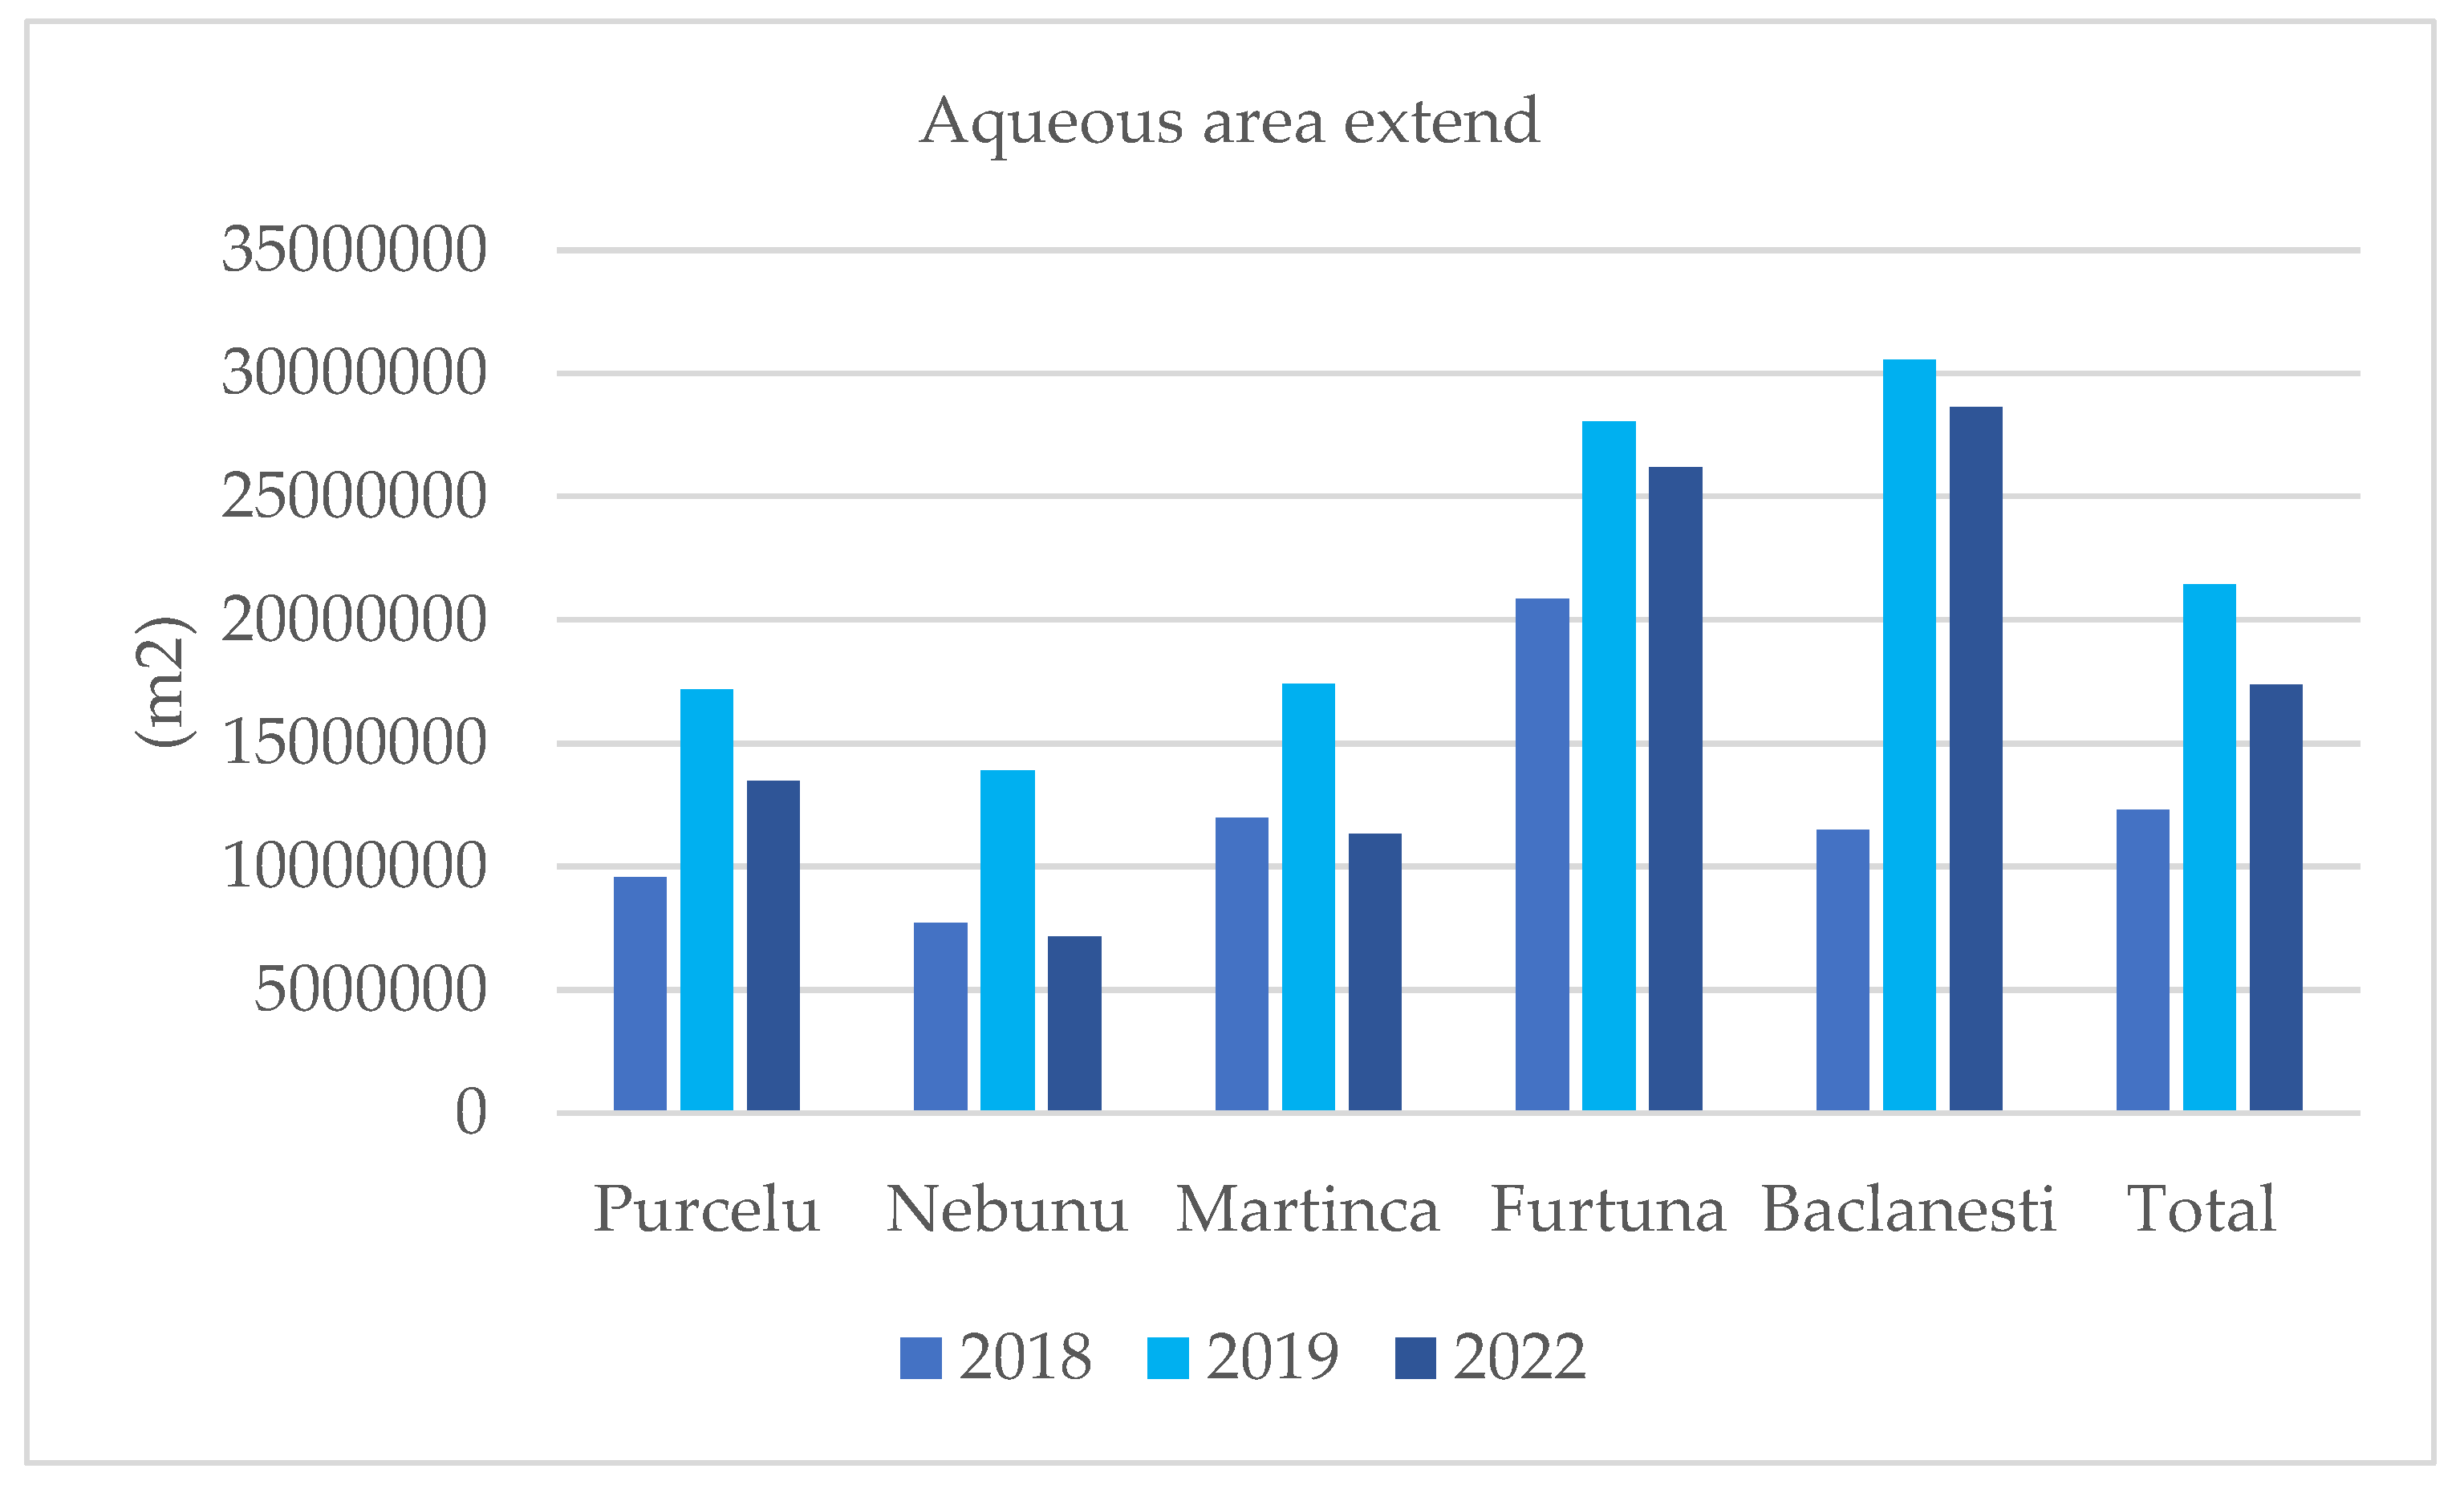
Figure 9.
The trends of waterbirds colonies related to water level in north of Danube Delta Biosphere Reserve.The width of each colour indicates the number of breeding pair inside each colony.
Figure 9.
The trends of waterbirds colonies related to water level in north of Danube Delta Biosphere Reserve.The width of each colour indicates the number of breeding pair inside each colony.
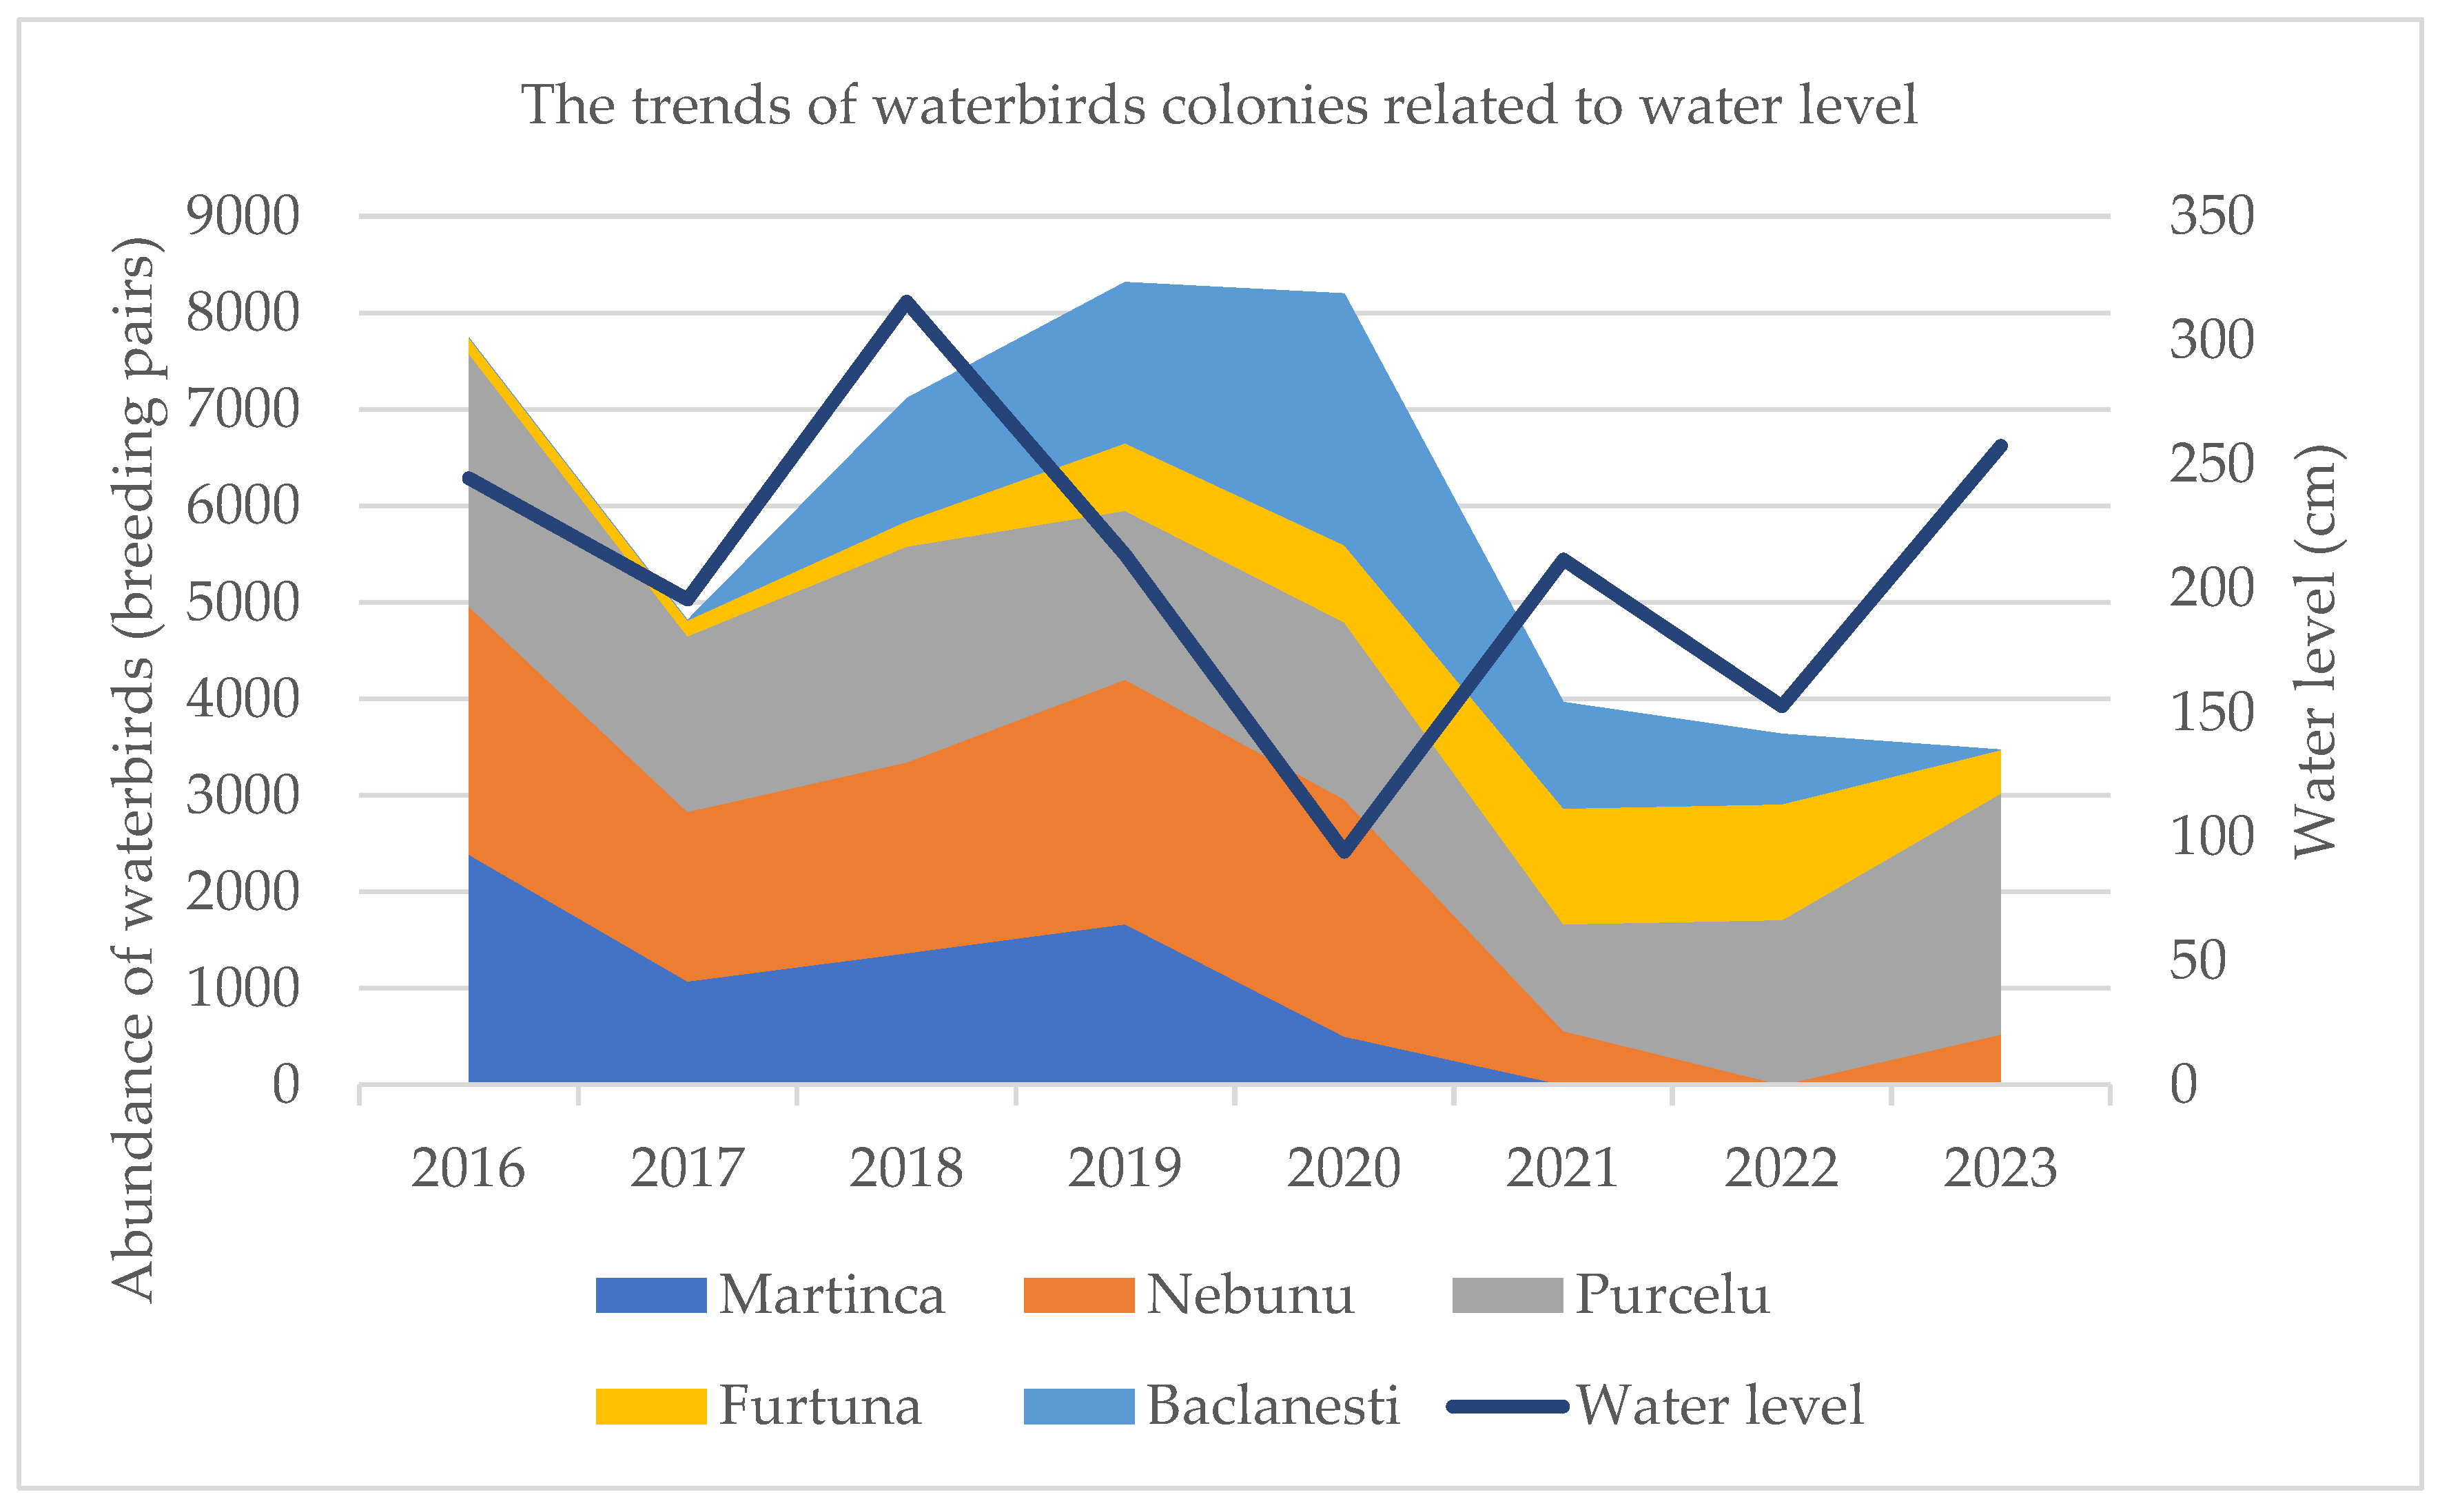
Figure 10.
Abundance of waterbird colonial species in the north of Danube Delta Biosphere Reserve (Romania).
Figure 10.
Abundance of waterbird colonial species in the north of Danube Delta Biosphere Reserve (Romania).
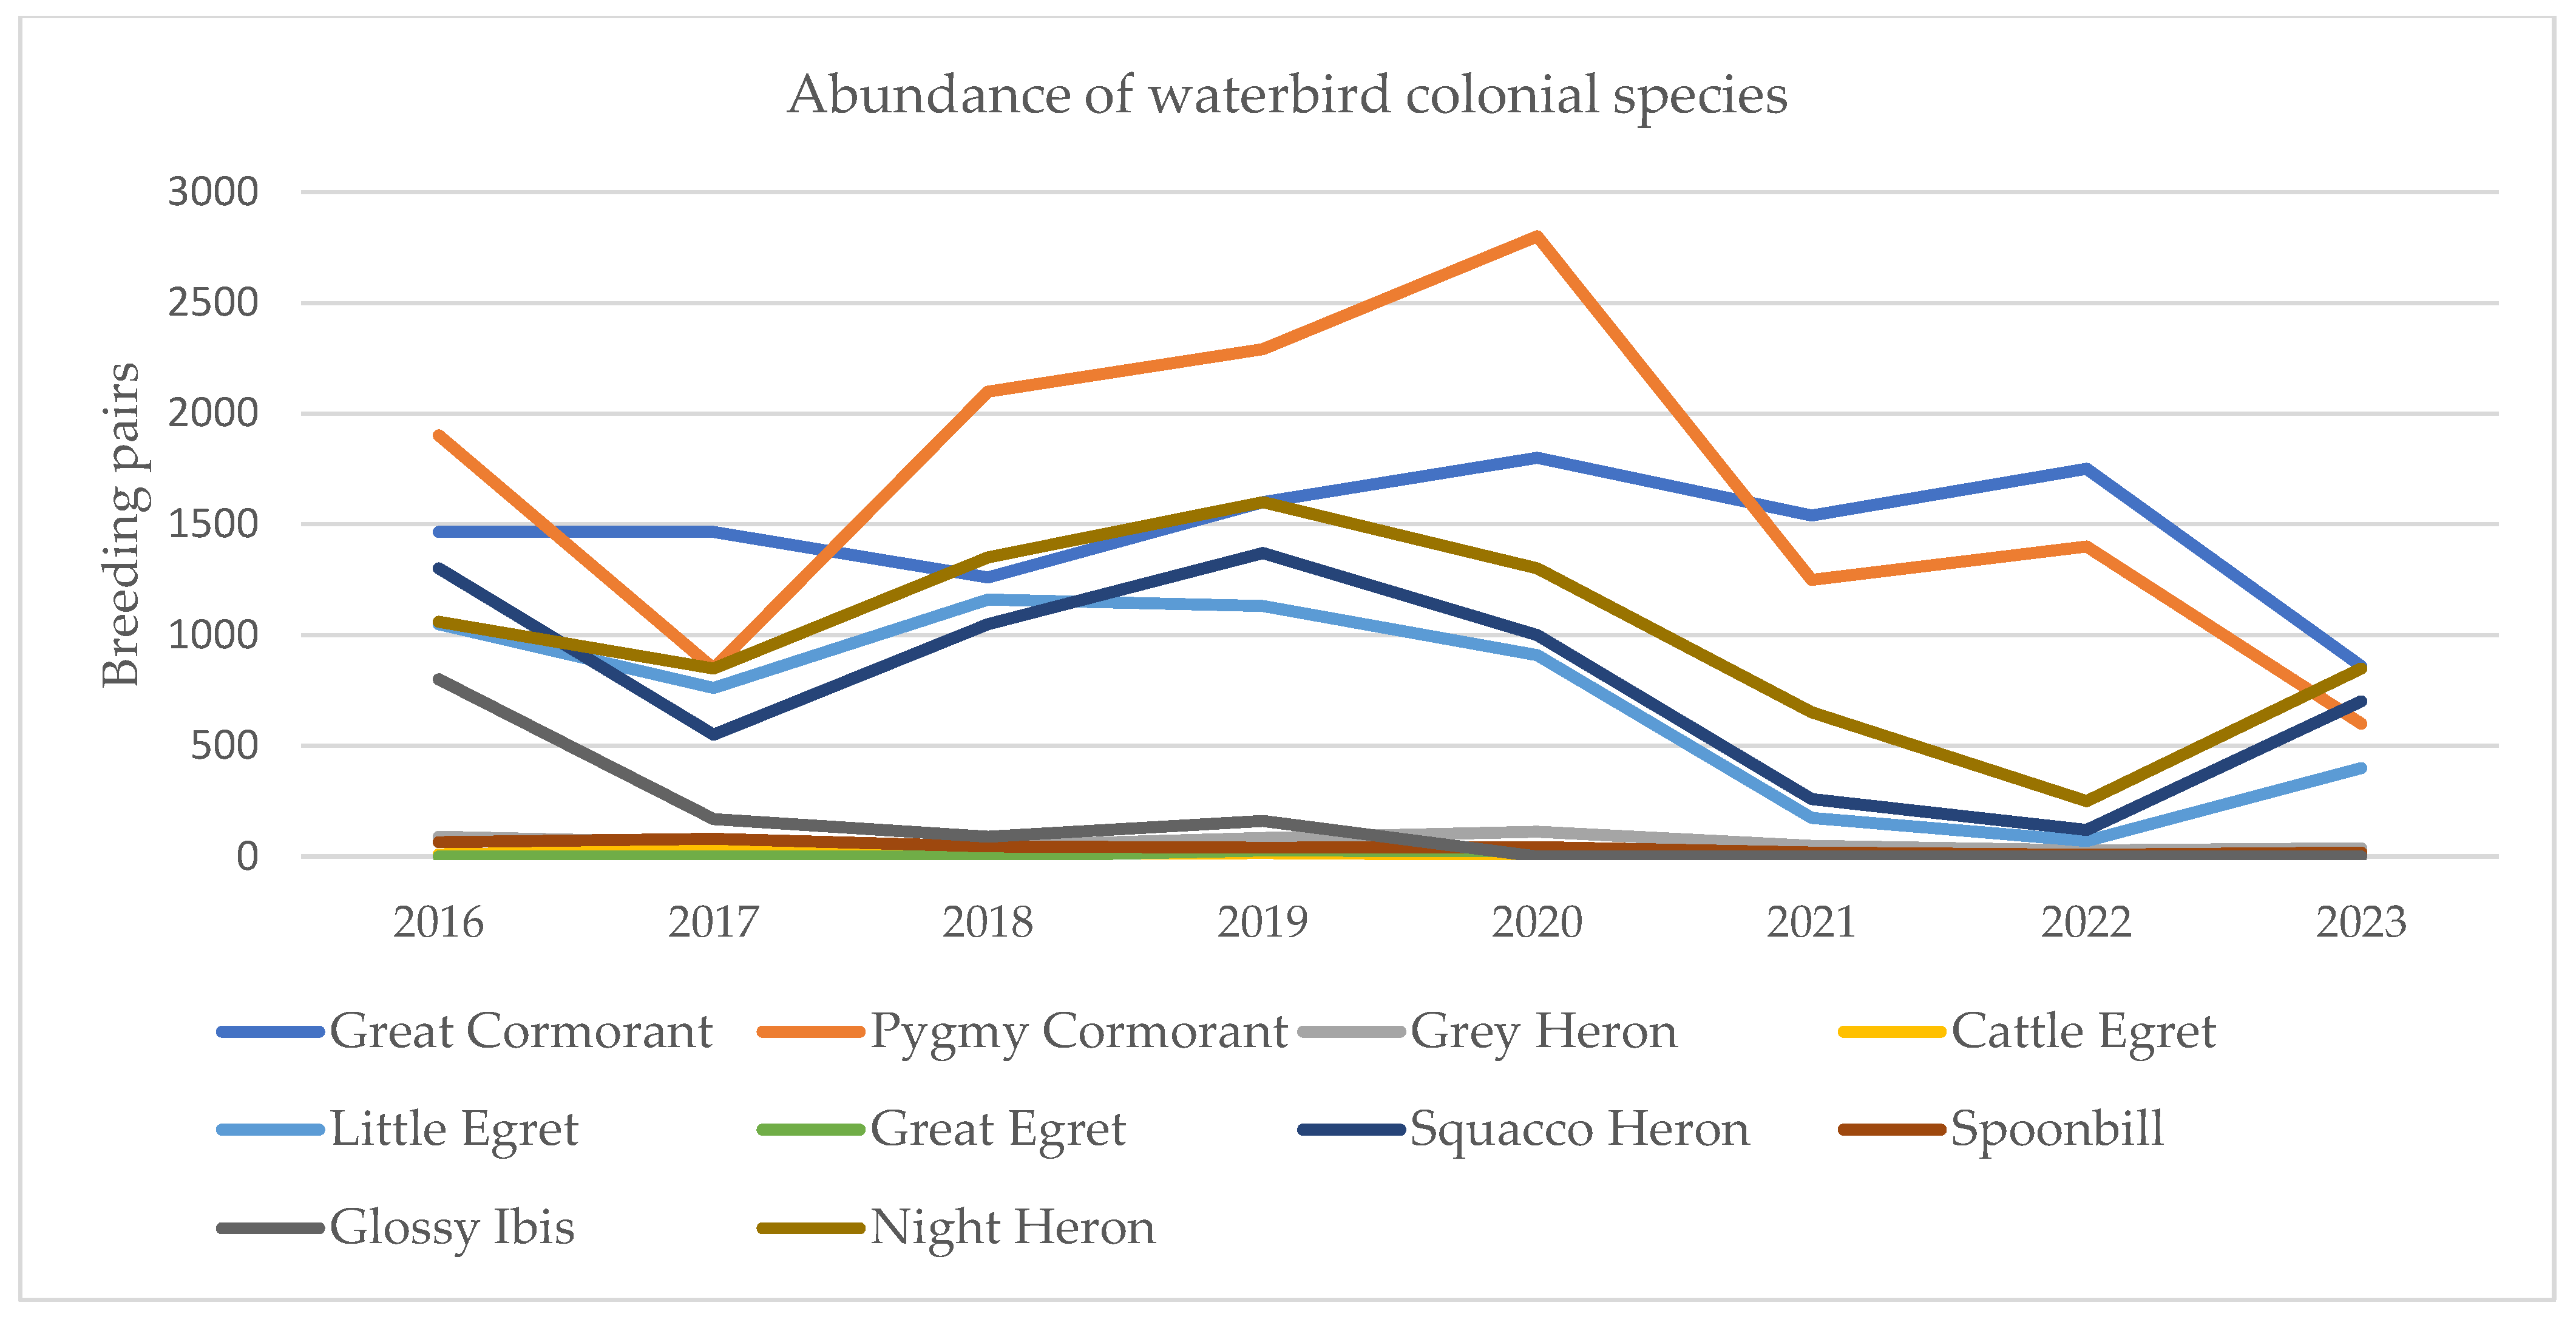

Table 1.
The hydrological and meteorological variables.
| Variables | Variable abbrevation | Unit measure |
| Level of the water in April | WlvlA | m |
| Level of the water in May | WlvlM | M |
| Standard deviation of the level of the water in April | WstdevA | m |
| Standard deviation of the level of the water in May | WstdevM | m |
| Variation Coefficient of the level of the water in April | WcVA | |
| Variation Coefficient of the level of the water in May | WCVM | |
| The number of days until the maximum level of the water from the begging of the year | Days_max | number |
| Minimum of temperature in April | TminA | 0C |
| Minimum of temperature in May | TminM | 0C |
| Maximum of temperature in April | TmaxA | 0C |
| Maximum of temperature in May | TmaxM | 0C |
| Mean of temperature in April | MeanTA | 0C |
| Mean of temperature in April | MeanTM | 0C |
| Precipitation in April | PPA | mm |
| Precipitation in May | PPM | mm |
Table 2.
The wetlands environmental variables.
| Variable Name | Variable Abbreviation | Unit measure |
| Drought, non-aqueous surfaces | D | m2 |
| Moderate drought, non-aqueous surfaces | MD | m2 |
| Flooding, humidity (Moderately deep- aqueous surfaces) | F | m2 |
| Water surface (Deep aqueous surfaces) | WS | m2 |
| No vegetation | NoV | m2 |
| Bare/ poor vegetation | PV | m2 |
| Medium vegetation | MV | m2 |
| Dense vegetation | DV | m2 |
| Very dense vegetation | VDV | m2 |
Table 3.
Statistical models meteorological, hydrological and aqueous cover factors related to presence of colonial waterbirds.
Table 3.
Statistical models meteorological, hydrological and aqueous cover factors related to presence of colonial waterbirds.
| Model | AIC | BIC | max VIF |
| Nr ~ WlvlA + WlvlM + TmaxA + MeanTM + WSTDEVA + (1 | Sp.) | 1040.4 | 1059.5 | 4.720541 |
| Nr ~ TmaxA + MeanTM + (1 | Sp.) | 1044 | 1055.9 | 1.473743 |
| Nr ~ WlvlM + TmaxA + MeanTM + (1 | Sp.) | 1044.7 | 1059 | 1.95182 |
| Nr ~ WlvlM + TmaxA + MeanTM + WSTDEVA + (1 | Sp.) | 1044.9 | 1061.6 | 2.602821 |
Table 4.
The best model according to AIC, GLM and maximum Variance Inflation Factor regarding meteorological, hydrological and aqueous cover factors related to presence of colonial waterbirds.
Table 4.
The best model according to AIC, GLM and maximum Variance Inflation Factor regarding meteorological, hydrological and aqueous cover factors related to presence of colonial waterbirds.
| Term | Estimate | Std. Error | z value | Pr(>|z|) |
| (Intercept) | 5.1397 | 0.6017 | 8.542 | < 2e-16 *** |
| WlvlA | -0.5472 | 0.2165 | -2.527 | 0.01151 * |
| WlvlM | 0.5756 | 0.194 | 2.966 | 0.00301 ** |
| TmaxA | 0.8751 | 0.1803 | 4.853 | 1.22e-06 *** |
| MeanTM | -0.4833 | 0.1596 | -3.028 | 0.00246 ** |
| WSTDEVA | -0.2501 | 0.1239 | -2.018 | 0.04356 * |
Legend: Significand codes *<0,05.
Disclaimer/Publisher’s Note: The statements, opinions and data contained in all publications are solely those of the individual author(s) and contributor(s) and not of MDPI and/or the editor(s). MDPI and/or the editor(s) disclaim responsibility for any injury to people or property resulting from any ideas, methods, instructions or products referred to in the content. |
© 2025 by the authors. Licensee MDPI, Basel, Switzerland. This article is an open access article distributed under the terms and conditions of the Creative Commons Attribution (CC BY) license (http://creativecommons.org/licenses/by/4.0/).
Copyright: This open access article is published under a Creative Commons CC BY 4.0 license, which permit the free download, distribution, and reuse, provided that the author and preprint are cited in any reuse.


