
Submitted:
28 August 2025
Posted:
29 August 2025
You are already at the latest version
Abstract
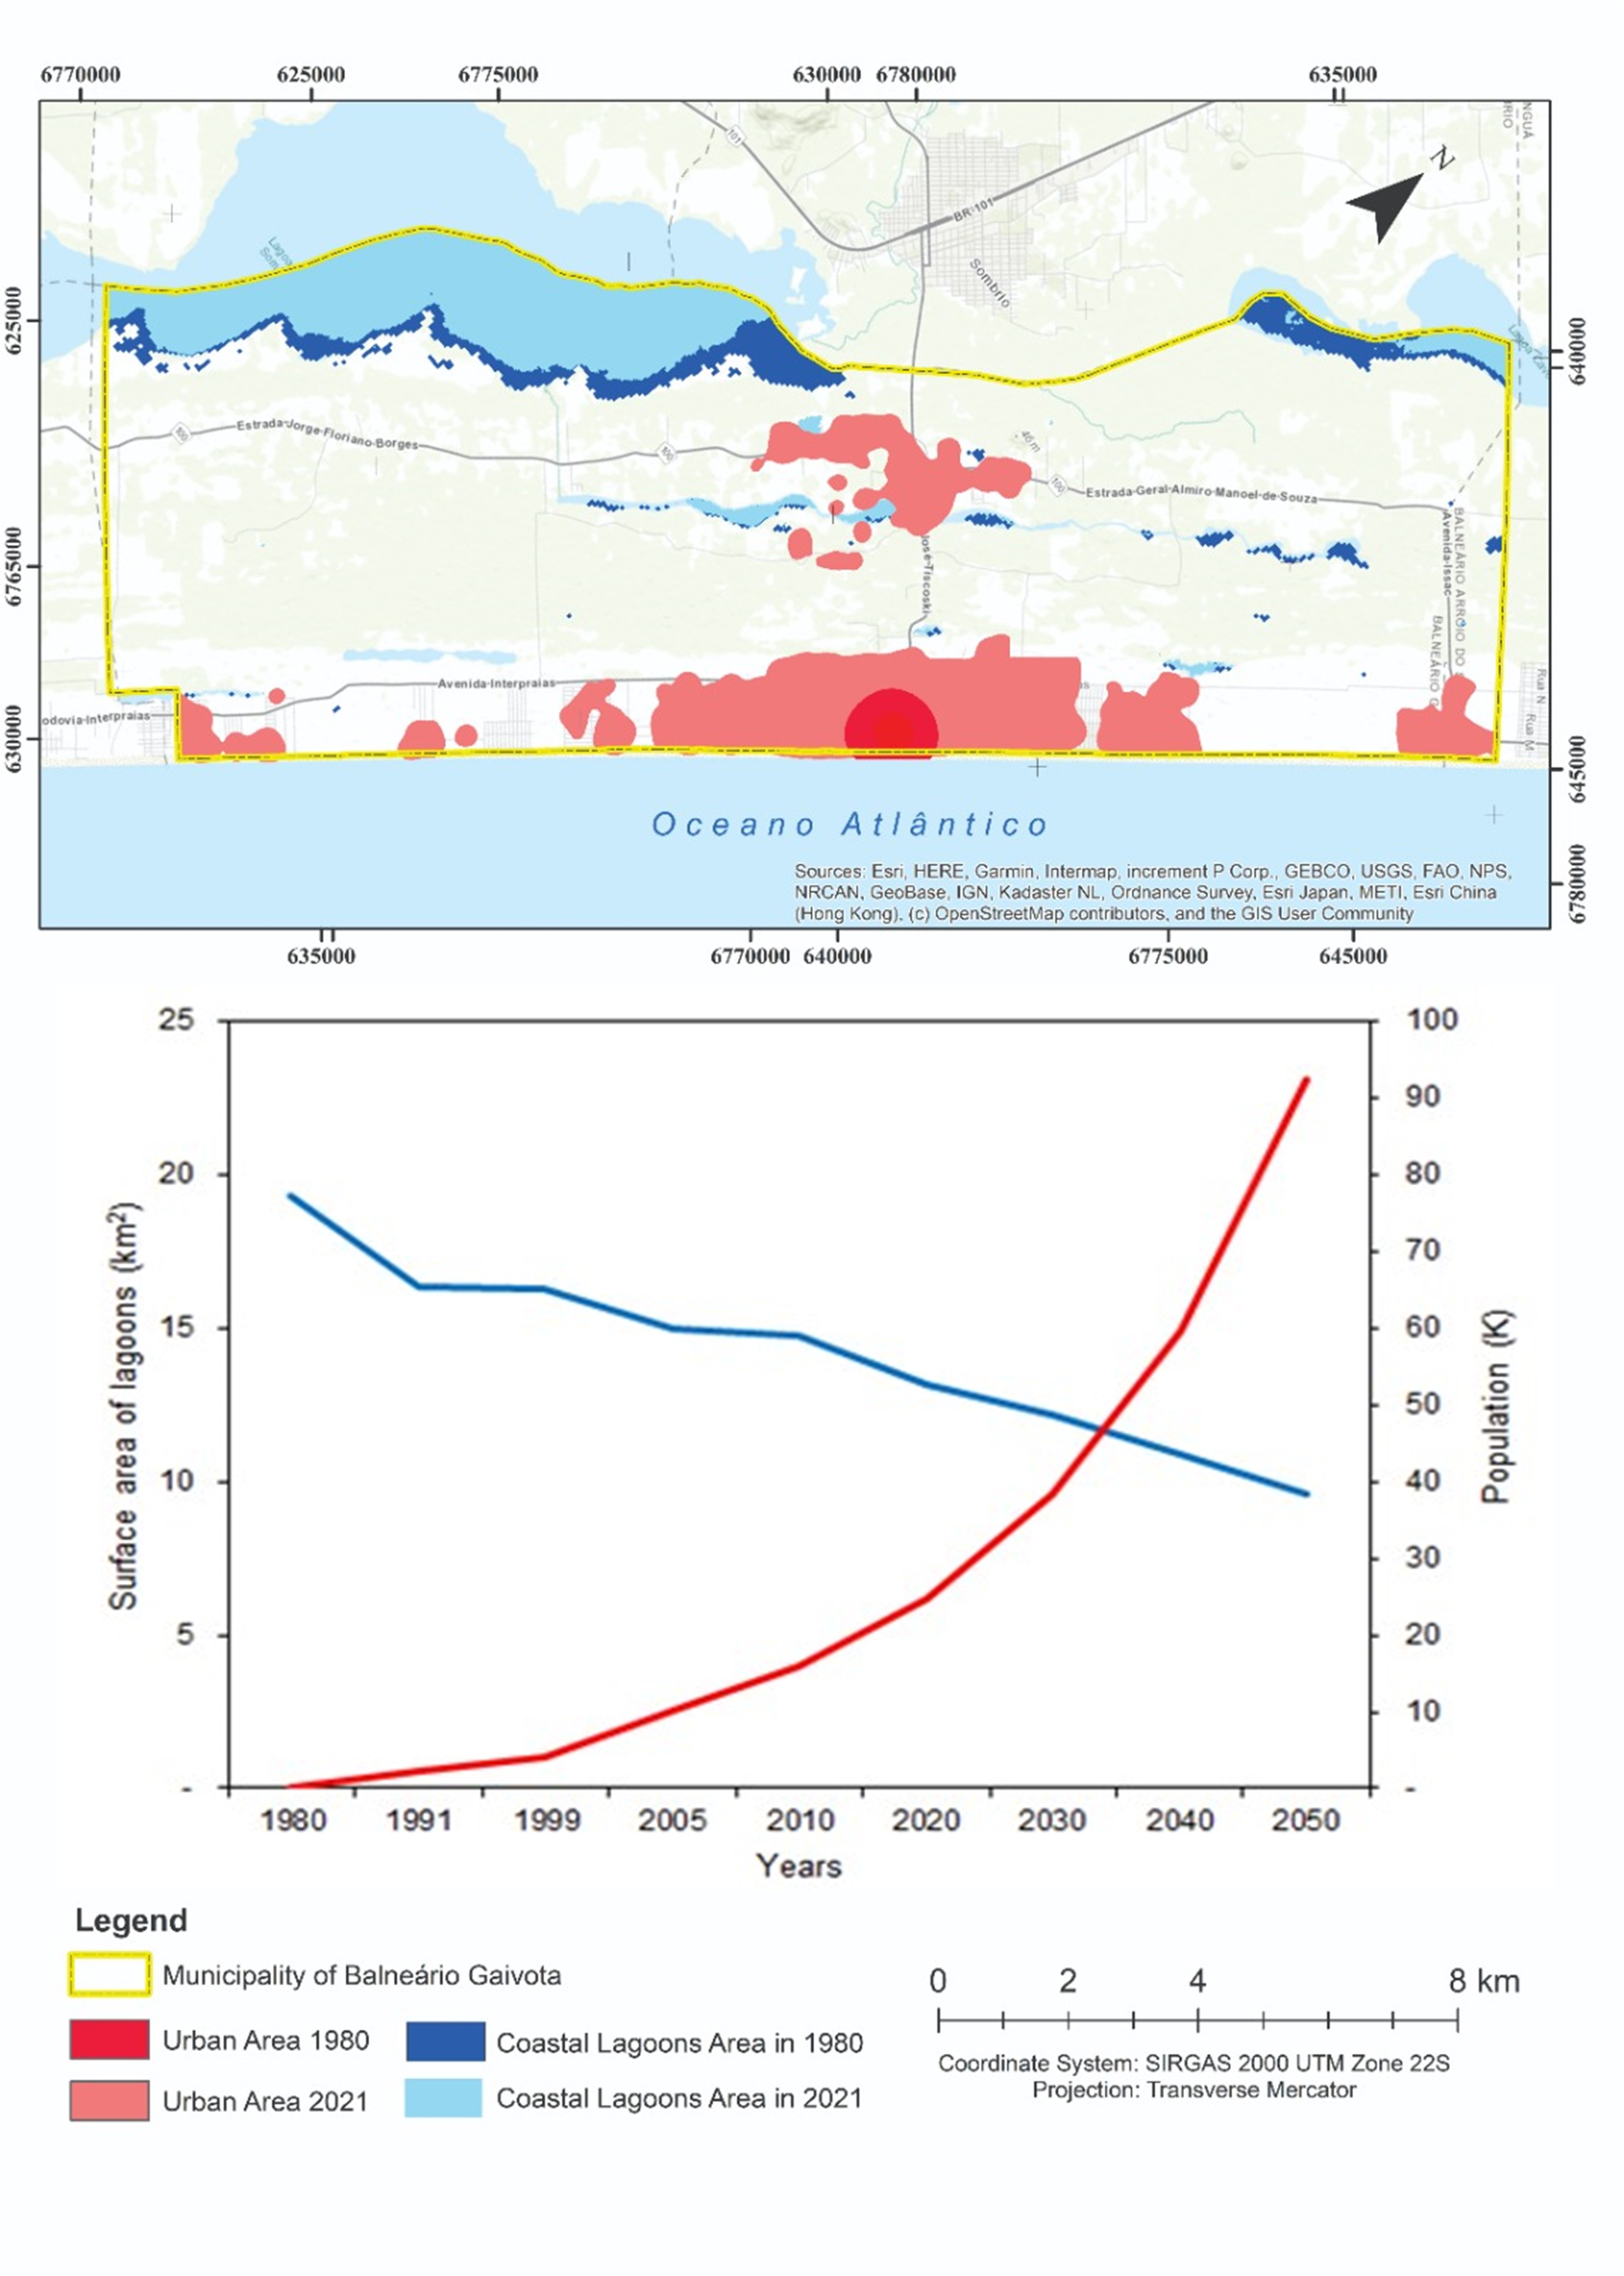
Predicting responses of ecological systems to anthropogenic modifications has been challenging in landscape management. This study aimed to analyze the socio-environmental dynamics and sustainability of coastal lagoons in the municipality of Balneário Gaivota, south of Santa Catarina state, Brazil. Based on geoprocessing techniques, we analyzed the evolution of post-colonial human occupation, and the spatiotemporal coastal lagoon hydrodynamics in the period 1980–2022, with the aim of predicting water use sustainability for the next three decades. The lagoons suffered a reduction of approximately 31.8% in surface area, from 19.3 km² in 1980 to 13.1 km² in 2021, with a projected reduction to 9.6 km² in 2050. However, the population showed geometric growth during the same period and in future projections. Currently, the total population in the study area is 15,600 inhabitants, and the water consumption is approximately 3,760 m³ day-1. By the year 2050, the estimated population will be 92,305 inhabitants, and the estimated water consumption will be 14,058 m³ day-1. The water balance, carried out with current availability and consumption data, points to the unsustainability of the public supply system, a trend that will worsen in the years 2030, 2040, and 2050, highlighting the need for better water consumption management.
Keywords:
environmental sustainability
; urban sprawl
; coastal lagoons
; landscape management
; GIS
; water demand
1. Introduction
Humans are currently facing several challenges caused by anthropogenic and natural stressors. Natural stressors include natural forest fires, earthquakes, sea level variations, permafrost, mud volcanoes, and volcanoes, whereas anthropogenic activities are predominantly related to energy production, industrial activities, agriculture, forestry, urban sprawl, and several other land-use activities [1]. These stressors result in the depletion of natural resources, the occurrence of droughts/floods, soil degradation, declines in crop production, freshwater scarcity, and biodiversity loss [2]. In addition, they cause climate change, which contributes directly and indirectly to the increase in global temperatures, rising levels, and acidification of the seas and oceans [3,4], primarily affecting coastal zones.
The implicit space of coastal zones is not universally defined, since the criteria adopted to delimitation depend on the approach or objective pursued [5]. In this study, they comprise a system that include ecosystem and socioeconomic characteristics, where the land and sea exchange processes take place, and where the economic activities associated with the marine environment are most present, namely the shoreland [6,7,8].
The costal zones encompass only 3% of the Earth’s surface [9], however, they contain disproportionately high populations, hosting approximately 30–60% of the world population (a figure set to increase to 80% by 2050), and are among the most diverse and disturbed environments on Earth [6,8,10,11,12]. They have experienced profound changes over the last 100 years [13]. Coastal zones are home to a mosaic of ecosystems with high fragility and environmental relevance, marked by the transition between terrestrial and marine environments [6,14,15,16], which require special attention because the health, wellness, and survival of coastal populations depend on the health of the coastal and marine ecosystems [11,17]. They provide valuable ecosystem services, including climate regulation, soil formation, and stabilization support [18], fish and wildlife resources [14,19], and an abundant supply of subsistence, such as water resources, tourism, and recreational and cultural services [13,20].
Coastal ecosystems are among the most productive on the planet; they are diversely populated and disturbed [8,11,21,22] owing to the disorderly occupation and use of environmental resources, making their management a challenge [10]. The pressures caused by the human occupation of coastal areas are of concern, mainly because of the mismatch between the speed at which anthropogenic activities occur, the carrying out of scientific studies on the impacts caused, and the environmental restoration carried out [23].
The current occupation of coastal ecosystems needs to be urgently replanned to develop other management models for coastal areas [6,13,24]. Faced with the need to sustainably manage the natural resources of the Brazilian coastal systems, a National Coastal Management Plan (PNGC) [25] was instituted in 1988, which is a set of actions, procedures, and instruments that allow the management of natural resources in an integrated and participatory manner, aiming at improving the quality of life of local resident and floating populations, protecting the natural, historical, ethnic, and cultural heritage, as well as environmental sustainability [26].
Among the environments present in the Brazilian coastal zone, lagoons, which are sources of drinking water and habitats with high biodiversity, are in a state of fragility. The southern sector of southern Brazilian, which extends from Cabo de Santa Marta, in Santa Catarina state, to Arroio Chuí, in Rio Grande do Sul state, is the Coastal Plain of Rio Grande do Sul (CPRS) [27] and houses the Lagoon-Barrier IV System [28]. Over time, in this system, southern Brazilian coastal lagoons developed near the Atlantic Ocean, which are distributed along plains characterized by the richness of lagoon environments, including the presence of dunes, marshes, sandy forests, fields, and an abundance of fresh water [28,29,30,31].
Changes in water and, consequently, the environmental sustainability of coastal lagoons in the CPRS are indeed a serious problem [32,33,34,35,36,37]. It is important to mention that the process of siltation of coastal lagoons occurs naturally over geological time scales, that is, over long periods [29], and that the CPRS emerged around 5000 years BP as a result of the maximum transgressive range of the sea during the last glaciation [38]. However, human activities have accelerated this natural process [39].
The municipality of Balneário Gaivota and its immediate surroundings, located in the south of Santa Catarina state, are part of a complex and fragile lagoon region located in the hydrographic region 10 (HR10) of the state [37]. Data on water conservation at HR10 show that it is already in critical condition, both in quantitative and qualitative terms, revealing the need for urgent action by 2027, such as reducing water consumption, discovering water resources in locations beyond the territory of the municipality, and even the desalination of seawater and brackish environments [37]. Such critical conditions result from socio-environmental problems characteristic of coastal environments, such as the occupation of environmentally fragile areas for agriculture and livestock, forestry of exotic species, sand extraction for civil construction, housing (urban expansion), real estate speculation, and predatory tourism [32,33,34,40].
Thus, this study aimed to analyze the evolution of post-colonial human occupation in the municipality of Balneário Gaivota and the spatiotemporal hydrodynamics of coastal lagoons in the period 1980–2022, intending to predict water use sustainability for the next three decades.
2. Materials and Methods
2.1. Study Area Natural Characteristics
The municipality of Balneário Gaivota which extends from 29°5′4″ S to 29°14′45″ S latitude and 49°30′39″ W to 49°39′8″ W longitude, in the south of Santa Catarina state, southern Brazil (Figure 1), occupies a territorial extension of 145.7 km2, with 20.3 km in the North–South direction, represented by the coastal line, and 7.2 km in the East–West direction.
The study area, according to the Köppen climate classification, is located within a humid subtropical climate zone, with a mean annual precipitation range of 1,200–1,600 mm and a mean annual temperature range of 17–19.3 °C [41]. The mean hottest temperatures range from 23.4 to 25.9 °C in January, and the mean coldest temperatures range from 12 to 15 °C in July [41].
The southern coastal plain of Santa Catarina state, located in the southern sector of southern Brazil, is very similar to the coastal plain of Rio Grande do Sul state in terms of its physical characteristics [31,38]. Its origin and development were greatly influenced by erosional and depositional phenomena that occurred during marine transgressions and regressions during the Pleistocene (400,000–11,000 years BP) and Holocene (11,000 years–present) [31]. The study area is based mainly on the Laguna-Barreira IV System (aged 5,000 years BP). The coastline retreated by approximately 5 m relative to the current sea level, originating from regressive coastal ridges (beach and foredune ridges) that gave rise to Barreira IV [38]. Currently, Barreira IV is well developed, with a variable width between 2 and 8 km, and is characterized by the presence of large lagoon bodies, including lagoons with and without sea contact, meandering rivers and inter-lagoon channels, and swamps and peat bogs [31,38].
The Balneário Gaivota municipality is located in the Mampituba River basin (MRB), a transboundary basin that covers parts of the extreme northeast territory of Rio Grande do Sul state (709 km2) [42], and parts of the extreme southeast territory of Santa Catarina state (1,249 km2), totaling a drainage area of approximately 1,958 km2 [43]. According to Law no. 10,949 of November 9, 1998 [44], 10 hydrographic regions are recognized for the purposes of planning and management of water resources in the Santa Catarina state. The Santa Catarina state region of the MRB belongs to the Hydrographic Region of the Extreme South of Santa Catarina state (HR10); although the municipality of Balneário Gaivota is fully inserted in HR10, it does not have any rivers in its territory. Water flows mainly through streams and spillways that cross the municipality from the west to the east, interconnecting the lagoon system of the region to the Atlantic Ocean [45]. The HR10 lagoon system comprises 12 main lagoons: Urussanga Velha, Freitas, Jacaré, Rincão, Faxinal, Esteves, Mãe Luzia, Dourada, Serra, Caverá, Sombrio, and Braço Morto, and a set of smaller lagoons, called lagoa de Fora, formed by the de Fora, Rodeio, and Terneira lagoons [37]. The territory of Balneário Gaivota is bathed by the Fora, Rodeio, and Terneira lagoons, and partly by the Caverá and Sombrio lagoons.
2.2. Post-Colonial Occupation of the Southern Coastal Region of Santa Catarina State, Intensity of Occupation of the Balneário Gaivota Municipality, and Regional Urban Sprawl
The post-colonial historical human occupation rescue of the southern coastal region of Santa Catarina state was based on regional classical historical literature. The process of occupation intensity of the Balneário Gaivota municipality was evaluated for four years (1956, 1978, 2010, and 2020) based on aerial photographs. For the years 1956 and 1978, in the entire municipality territory, and the years 2010 and 2020, only in the urban perimeter, which is where the highest density of residences is observed. The images from the years of 1956, 1978, and 2010 were made available by the Secretary of Sustainable Development of Santa Catarina State, and the images for 2020 were obtained using Remotely Piloted Aircraft (RPA) technology. The process entails the following steps:
1. The digital processing (DP) of historical aerial images was performed according to Meneses and Almeida [46] and was adopted as a source of information. The aerial image, with a resolution of 0.39 m, was orthorectified and georeferenced, and dated from 2010. The digital processing was carried out using ArcGIS® software version 10.2.1 (ESRI, Redlands, CA, US), reference system SIRGAS 2000, and time zone Universal Transverse Mercator (UTM) #22S.
2. The acquisition of images through RPA technology and the DP of images were performed according to Silva et al. [47] and Ladwig et al. [48]. The final product, with the geometric fidelity accuracy (ground sample distance [GSD]) of the buildings being 5 cm, was achieved through planning, flight execution, and image processing (post-flight), as described by Ladwig et al. [48].
3. The determination of occupation intensity was performed using kernel density analysis, by defining the georeferenced position of all buildings for 2020, and including building location points in aerial photos from 2010 (spatial resolution 0.39 m), 1978, and 1956 (spatial resolution 1.0–1.5 m), with good clarity for building identification. The kernel density analysis was applied to point data files to create sampling intensity surfaces, as described by Câmara and Carvalho [49]. In the sequence, the intensity classes were defined through the range of values of unequal sizes such that the number of values was the same in each class; therefore, the classes at the extremes and in the middle had the same number of values. Because the intervals were generally wider at extremes, this option was useful for highlighting changes in the intermediate values of the distribution, which, in this case, was the edge of territorial expansion. Values of > 0 < 70 buildings km−2, > 70 < 300 buildings km−2, > 300 < 900 buildings km−2, and > 900 buildings km−2 were defined as low-, medium-, medium-to-high-, and very high-intensity constructions, respectively. Occupational intensity maps were created for the years 1956, 1978, 2010, and 2020.
In addition to these data sources, the thematic maps provided by the MapBiomas Project for the period 1985–2019 were analyzed according to Souza Jr. et al. [50], employing routines of geoprocessing in the ArcGIS® software version 10.2.1 (ESRI, Redlands, CA, US), with the purpose of obtaining data on the regional urban sprawl across the entire length of the CPRS, over the Laguna-Barreira IV System, from Cabo de Santa Marta, Santa Catarina state to Arroio Chuí, Rio Grande do Sul state.
2.3. Human Population Growth Estimates for 2030, 2040, and 2050
The population growth projection of the municipality of Balneário Gaivota for 2030, 2040, and 2050, in line with the Sustainable Development Goals [51], was based on the population censuses of 2000, 2010, and 2020 from the Instituto Brasileiro de Geografia e Estatistica (IBGE) [52] for the period 2000–2020. This period is justified by the fact that Balneário Gaivota was emancipated from Sombrio in 1995 [53].
2.4. Coastal Lagoon Dynamics
Time-series data from Landsat 5, 7, and 8 sensors were used to analyze the spatiotemporal dynamics of the lagoons from 1980 to 2021, and the observed trends were used to obtain projections for the years 2030, 2040, and 2050. In southern Brazil, the summer months are historically those with the highest rainfall, and the occurrence of rain 30 days before image acquisition influences the variation in the water depth of the lagoons. Thus, image acquisition was based on standardization at the intersection of three pieces of information: The imaging period was between November and January, the accumulated rainfall was between 80 and 150 mm 30 days prior to image acquisition, and the absence of atmospheric noise such as clouds in the images.
Based on this set of variables, six periods that combined the three aforementioned characteristics were November 1980 (accumulated precipitation of 109.8 mm), January 1991 (accumulated precipitation of 102.2 mm), January 1999 (accumulated precipitation of 83.1 mm), November 2005 (accumulated precipitation of 128.9 mm), December 2013 (accumulated precipitation of 98.7 mm), and January 2021 (accumulated precipitation of 140.5 mm). Rainfall data were obtained from a historical series collected by a rainfall station in the municipality of Sombrio, which is 12 km from the center of the urban area of Balneário Gaivota City, and 13 km from the Atlantic Ocean.
The geomorphological variation in the water level of the lagoons was evaluated using the modified normalized difference water index (MNDWI), developed by McFeeters [54], with modifications proposed by Xu [55], who recommended the use of the mid infrared (MIR) and green bands. The MNDWI algorithm is expressed in Equation (1):
The MNDWI has good accuracy in relation to variations in the delineation of water bodies, which favors the monitoring of these resources. The value obtained by the index varies between -1 and 1; that is, the type of cover is water if the NDWI value is > 0, and is not water if the NDWI value is < 0 [54]. Following the recommendations of Xu [55] has the following main advantages: 1. The water appears with more positive values than in the NDWI, considering the higher absorption rate of electromagnetic radiation in the mid-infrared region compared with the near-infrared region, and 2. urban areas, areas of vegetation, and exposed soil have negative values, considering the higher reflectance in the mid-infrared region than in the near-infrared region. Therefore, a positive value indicates the existence of water, and a negative value indicates the predominance of exposed soil and vegetation [55].
2.5. Water Consumption Projections for 2030, 2040, and 2050
Based on population growth estimates for 2030, 2040, and 2050, the population numbers obtained were multiplied by the current water consumption per capita in Santa Catarina, that is, 152.3 L day−1 [56]. The obtained value was multiplied by 365 days and divided by 1000 L (converted into m3 year−1). Thus, the consumption estimates for 2030, 2040, and 2050 were established.
3. Results
3.1. Post-Colonial Occupation of the Southern Coastal Region of Santa Catarina State, Intensity of Occupation of the Balneário Gaivota Municipality, and Regional Urban Sprawl
According to the literature, the occupation of the southern coastal region of Santa Catarina state, particularly the Balneário Gaivota territory, can be broadly described in four main periods: The first, until 1920; the second, from 1920 to1950; the third, from 1950 to 1980; and the fourth, from 1980 to the present [34,57].
Based on the analysis of aerial photographs, it was possible to verify the presence of 92 buildings in 1956, whose distribution was concentrated mainly in the interior areas of the current municipality, close to the Sombrio and Caverá lagoons (Figure 2A). In 1978, 821 buildings were recorded, representing an increase of 892% over 22 years and an average annual growth of approximately 36.02%. A high increase in the density of buildings in the urban center of Praia da Gaivota (Figure 2B) was also observed, which in December 1995, was emancipated from the municipality of Sombrio [53], and became the seat of the current municipality of Balneário Gaivota.
Between 1978 and 2010, a period of 32 years, the number of buildings grew by 376%, representing a growth rate of approximately 11.76% per year in this period, with a more concentrated distribution in the central region of Praia da Gaivota (Figure 3A,B). In 2010 (Figure 3A), there were approximately 3,910 buildings in the municipality. In 2020 (Figure 3B), buildings totaled 7,755 units, an increase of 98% over 10 years, with an annual growth rate close to 9.83%.
The distribution of building intensity based on the kernel density estimate is presented in Figure 4 and Figure 5. The values for 1956 and 1978 (Figure 4A,B) represent a uniform distribution among the low-intensity classes of buildings km−2 (> 0 at 70 buildings km−2). In 1956, 100% of the municipality’s territory contained between > 0 and 70 buildings km−2. In contrast, in 1978, this class of intensity started to occupy 90% of the current territory of the municipality, showing a 10% reduction, and was occupied by the middle-to-high intensity construction classes located in the central region of Balneário Gaivota City.
In 2010 (Figure 5A) and 2020 (Figure 5B), a significant increase in building density was observed. In 2010, 2.77 km2, representing 5.42% of the municipality’s area, were in the highly built-up class (> 900 buildings km−2), while in 2020 the highly built-up class corresponded to 5.64 km2 (11.05%) of the territory’s municipality. The variation from 2010 to 2020 represents an increase of 103.83% over the ten-year period, or a high built-up patch growth rate of approximately 10.38% per year. The advancement of the medium-to high-intensity class (301–900 buildings km−2) in the area is equally important, which occupied 3.29 km2 in 2010, amounting to 6.45% of the municipality’s territory. However, in 2020, the area occupied by this class increased to 6.32 km2, representing 12.38% of the territory and an increase of 92% in the period 2010–2020.
The increase in the number of buildings in the municipality of Balneário Gaivota in the period 1956–2020 shows high adherence (R2 = 0.998) and exponential growth behavior, as shown in Figure 6.
The regional urban sprawl in the CPRS over the Laguna-Barreira IV System is shown in Figure 7. It can be seen that there has been constant growth in the urban area over time. In 1985, the urban area was 157.37 km2, which increased to 317.59 km2 in 2019, representing a territorial expansion of 160.22 km2 (101.81%) in 35 years.
3.2. Human Population Growth and Growth Estimates for 2030, 2040, and 2050
According to the IBGE data [52], in 1996, the resident population of Balneário Gaivota was 4,344 inhabitants; in 2000, the municipality had 5,450 inhabitants; in 2010, this number grew to 8,234 inhabitants; and in 2022, the number of inhabitants was 15,353. The estimates of human growth for 2030, 2040, and 2050, based on geometric growth, are shown in Figure 8.
3.3. Coastal Lagoon Dynamics and Water Consumption Projections for 2030, 2040, and 2050
The spatiotemporal dynamics of the lagoons present in the municipality of Balneário Gaivota were evaluated using the NMDWI, as illustrated in Figure 9.
Table 1 shows the spatial dynamics of the surface water table of coastal lagoons in the municipality of Balneário Gaivota in the period 1980–2021.
The data showed a decrease in the surface area of the lagoons by 31.8% over 41 years (2008–2021), demonstrating a linear projection behavior (y = -0.1274x + 270.8) with an adherence of R2 = 0.8378 for 2030, 2040, and 2050 (Figure 10).
The Figure 11 illustrates the estimated progression of water consumption flow demand for human supply for 2030, 2040, and 2050.
4. Discussion
4.1. Post-Colonial Occupation of the Southern Coastal Region of Santa Catarina State, Intensity of Occupation of the Balneário Gaivota Municipality, and Regional Urban Sprawl
The settlement of human population and the consequent development of the coastal cities in southern Brazil, as well as in other parts of the world, have always been directly linked to water resources. European colonization marked the beginning of the historic occupation of the southern coastal region of Santa Catarina. In 1801, Portuguese rule over the region was registered with the Treaty of Badajoz, creating a process of interest in the occupation of the territory south of Laguna City [57]. On the lagoon margins of the Sombrio region, small towns began to develop, as they were paths for production to be transported to the capitals of Santa Catarina and Rio Grande do Sul states, located to the north and south, respectively [58]. Until 1920, there was practically no occupation; the land belonged to farms and ranches that bordered the Atlantic Ocean to the east and the Sombrio Lagoon to the west [32].
However, between 1920 and 1950, the inhabitants of the so-called Parish of Sombrio, installed in 1938 [59], began to notice the potential of the land close to the sea for fishing and leisure [60]. Thus, in the mid-1920s, Balneário Gaivota gained its first fishing community, made up of families that settled on the coast, such as the family of Mister Gildo, who was named Arroio do Gildo [60]. The dynamism of the southern region of Santa Catarina was greatly driven by Tropeirismo, whose route left the province of São Pedro in Rio Grande do Sul towards Sorocaba City in São Paulo, making the south of Santa Catarina a stopping point [57]. It lasted for approximately 100 years, giving rise to the original BR 101 road [34].
The period 1950–1980 was marked by urban territorial expansion in the coastal environment that began in the 1960s [61,62,63]. During this period, there was an intensification in the irregular occupation of urban land in the actual territory of Balneário Gaivota, as in other Brazilian coastal areas, many of which are located in legally protected areas, and is a socio-environmental problem that persists until the present day. In the rural zone, this period was marked by the presence of small properties, originating from the division of land surrounding the lagoon bodies over the years [34]. Here, human occupation is characterized by the presence of permanent residents who mainly subsist on agriculture and livestock [34].
The last period, from 1980 to the present day, is marked by the migratory movement of the human population from neighboring cities and the interior region of the extreme south of the Santa Catarina [34] and Rio Grande do Sul states to the coastal cities, in search of a better quality of life [64]. This movement is accentuated during the summer season, and the urban sprawl in the coastal areas is strongly related to summer school holidays as well as the annual paid vacation of workers [64]. This allows workers and their families to enjoy leisure activities away from their residences, promoting the occurrence of a second home and contributing to the elevation of fluctuating populations in coastal areas. In the last three decades, population growth in coastal areas has intensified significantly [61,62], as indicated by population surveys during the 2000–2020 censuses [52].
As a corollary, environmental degradation accompanies population growth as a result of real estate speculation, precarious sanitary sewage systems, the removal of sand from dunes for civil construction, biological contamination by exotic species, and the destruction of natural habitats around the lagoons. All these anthropogenic activities contribute to poor management, resulting in the scarcity of water resources.
4.2. Coastal Lagoons Dynamics, Human Population Growth Estimates, and Water Consumption Projections for 2030, 2040, and 2050
The coastal plain of the extreme south of Brazil is composed of diverse environments, such as dune fields, wetlands, lagoons, bays, estuaries, and swamps, which have been degraded and fragmented by various natural and anthropogenic activities [31]. The Balneário Gaivota territory and its surroundings are a region of increasing urban expansion that has undergone several transformations due to urban occupation and growth throughout history [33,34,40]. Since the first occupations by ranches and farms in the mid-1920s, the beginning of urbanization in the 1940–1960s and intensification from the 1980s to the current predominantly touristic arrangements, Balneário Gaivota, as well as other municipalities in this region, underwent a series of changes in the land-use forms [64], whose impacts are reflected in the quality and volume of water in the lagoons.
In November 1980, the analyzed set of lagoons in the territory of Balneário Gaivota occupied a total surface area of 19.27 km2, and in January 1991, this value decreased to 16.4 km2, indicating a reduction of 15.1% in the surface area occupied by the water blade. In January 1999, the total surface area of the lagoons was 14.9 km2 (a 22.4% loss compared to 1980). In November 2005, in turn, the surface area of the lagoons was 16.2 km2 (evidencing an increase compared to 1999 and very close to 1991, but still showing a loss of 15.8% compared to 1980). In December 2013, the total water blade area of the lagoons was 14.8 km2 (a reduction of 23.4% compared to 1980) and, finally, in January 2021, the area of the municipality’s coastal lagoons corresponded to 13.1 km2, evidencing losses of 31.8% of its surface area compared to 1980.
Applying the equation obtained in Figure 10, which assumes a linear projection behavior, it is observed that in 2030, the lagoon resources of Balneário Gaivota will be 12.2 km2, 36.8% less area than in 1980. Further, in 2040, this area could be reduced to 10.9 km2, representing a decrease of 43.4% of its original area from 1980, and in 2050, surface water resources will occupy only 9.6 km2; that is, more than half of the lagoon areas may cease to exist, a reduction that represents around 50.0% compared to 1980.
The coastal lagoons of the CPRS are mostly shallow (less than 2 m) [29,65,66]. Therefore, by multiplying the area obtained by the projections of reduction to the set of lagoons in the Balneario Gaivota territory, we arrived at an estimate of water availability for consumption. Currently, this resource has 17,607,600 m3 of surface water. In 2030, it will be 16,318,520 m3; in 2040, the volume will be 14,611,630 m3; and in 2050, a reserve volume of 12,904,200 m3 may remain.
The population number projection for 2030 using the geometric projection method is 21,610 inhabitants; for 2040, the number of people should be 33,541; and for 2050, the estimated number is 52,060 inhabitants and permanent residents. Considering that 43.6% of the population are permanent residents in the municipality, if we apply the floating population rate, the total number of inhabitants will be 38,315 in 2030, 59,470 in 2040, and 92,305 in the high season of 2050. Considering that the water consumption per capita in Santa Catarina is 152.3 L day−1 [56], the permanent population will consume 3,291 m3 day−1 of water in 2030, 5,108 m3 day−1 in 2040, and 7,929 m3 day−1 in 2050. The consumption data of the total population (including resident and floating population) are concerning, which demonstrates that consumption could reach 5,835 m3 day−1 in 2030, increase to 9,057 m3 day−1 in 2040, and reach a maximum peak of consumption of 14,058 m3 day−1 in 2050; that is, in 2050, the water supply system will collapse.
Coastal areas are experiencing rapid population growth, which affects coastal and marine ecosystems [10,16,21,67]. More than one-third of the global human population occupies coastal areas, and the population density in such areas is increasing exponentially [10,12,61], which makes water resources have become increasingly fragile [67]. Consequently, recognizing the model of coastal city development is of great importance for coastal management [6,11].
Land cover is continually transformed by land-use changes caused by environmental, biotic, and socioeconomic factors. Understanding the spatiotemporal dynamics of land use, land cover, and their drivers is fundamental for synthesizing knowledge for natural resource management, planning, and decision-making [68]. Ballut-Dajud et al. [20] conducted a literature review of international databases, analyzed a sample of 134 research studies from 37 countries, and concluded that the anthropogenic activities that most affected natural wetlands were agriculture (25%), urbanization (16.8%), aquaculture (10.7%), and industry (7.6%). These are direct impacts or pressures exerted by human beings, implying that increasing population growth will be an important determining factor of damage in the future if this trend is followed. However, the most affected types of wetlands were mangroves (25.7%), lagoons (19.1%), and marine waters (11.7%) [20]. Nevertheless, after summing the marine-coastal and continental wetlands, Ballut-Dajud et al. [20] found that these systems were affected by 35.7% and 64.3%, respectively. This confirms that more effective environmental management and control measures are urgently needed to conserve and preserve these ecosystems, given their multiple ecological functions.
Among the environments explored in coastal zones, continental aquatic systems are fundamental for the maintenance of biodiversity and biogeochemical and hydrological cycles [69]. Nevertheless, anthropogenic pressure and pollution have caused problems related to the eutrophication of lagoons, resulting in the impossibility of their use [14]. The coastal lagoons studied are in a state of eutrophication and have similar environmental conditions to those studied by Schwarzbold and Schäfer [66] and Schäfer et al. [29] in the coastal region of Rio Grande do Sul State, southern Brazil, resulting in socio-environmental challenges that are yet to be solved.
In addition to causing direct habitat loss, urbanization affects the structure and function of coastal wetlands by affecting the hydrological and sedimentation regimes and the dynamics of nutrients and pollutants [8,14,20]. Even after treatment, sewage effluents contain toxic metals and are high in nutrients, particularly nitrogen and phosphorus [14,21]. In addition, bioactive substances, such as drug residues and endocrine-disrupting substances, are not eliminated through the conventional treatment of urban domestic effluents [14,70]. These are a major concern, as they result in eutrophication, which is the major driver of coastal lagoon dynamics [8,14,20].
Socio-environmental sustainability problems have assumed a central role in reflections on human impacts on the forms of economic development established so far. An important and permanent tension regarding the planet’s environmental conditions relates to the balance between the demand (need) for water for human consumption and the supply (availability) of water resources [67,70,71]. The balance between supply and demand has reached a point of unsustainability [67,72]. While demand grows, driven by geometric growth in the occupation of coastal areas [9], surface water reserves responsible for human supply decrease [73]. The data obtained in this study lead to the conclusion that the studied area underwent changes characteristic of the Anthropocene, where geologically significant conditions, such as the water cycle, were profoundly altered by human activities, as pointed out by [74]. Current development models have contributed to the disappearance of centuries-old traditional activities that are non-economically profitable [75]. One way to achieve a sustainable development model is through an ecosystem-based approach that interrelates society with nature [51].
It should be noted that to improve the way of maintaining the sustainability of coastal environments, mainly related to surface water resources in lagoons, it is important to reduce water waste and to promote the preservation of the environments in which this natural source is located. Environmental planning decisions depend on an understanding of how the preservation or degradation process has progressed over time and, consequently, on how to define strategies that will be conducive to environmental conservation [61]. Maintaining wetlands and aquifer recharge regions can improve water availability for future generations [14,76]. In addition to improving demand and consumption conditions, the solution to problems related to water management lies in the development of adequate management systems, a permanent search for technological innovations, and the adoption of structural and non-structural measures for the integrated and predictive management of water resources [76].
Historical processes and current and future trends in the occupation of coastal environments are of concern. The data point to the continuation of accelerated population growth due to the unsustainable use of natural resources, especially water, which is essential for the sustenance of human activities [14,67,70,72,73]. We conclude that the current form and future trends of human occupation of coastal environments impact coastal ecosystems, especially coastal lagoons, which are natural sources of water for human consumption. Therefore, it is necessary to consider short-term alternatives for the integrated management of lagoons and their immediate surroundings and to search for alternative water supply resources for human consumption. Despite being essential to human life and the economy of all regions on the planet, there are permanent threats to the hydrological cycle and the quantity and quality of water [67,70,72,73]. These threats arise from unsustainable consumption and excessive use of water for various human activities [70]. The exploited water resources include surface water and groundwater, which are important and constitute substantial water reserves in some regions of the planet [71]. In this sense, it is essential that the current forms of consumption, through the most diverse uses, be reduced, as future generations will need this resource to meet their basic needs.
5. Conclusions
This study analyzed the socio-environmental sustainability of coastal lagoons in the south of the Santa Catarina state using Balneário Gaivota as a case study on a local scale. The consumption and availability of good-quality water follow opposite trajectories, which tend to meet at a point that represents the balance between these two variables. Exceeding this balance represents socio-environmental unsustainability.
Current land use and future trends, as well as current population numbers and forecasts of geometric growth for the coming decades, point to unsustainability in the processes of obtaining and consuming natural resources, especially water resources, which are an invaluable source for human development.
Even with the maintenance of regional climate trends towards wetter environments in the coastal zone, regional characteristics include a decrease in surface area and water volume in lagoons and rivers in coastal environments. Our data indicate the extinction of 50% of coastal lagoon areas by 2050. These losses resulted from human activities that had been occurring for a long time and became more pronounced from the 1980s onwards, represented by inadequate occupation of environmentally protected areas; rectification, straightening, and dredging of watercourses; landfills; and drainage of wetland areas for agriculture and urban expansion.
The current form of human occupation and its future expansion trends are impacting coastal environments, especially coastal lagoons, which are a source of water for human consumption. The scenarios for 2030, 2040, and 2050 are unsustainable in terms of the demand for and availability of high-quality water. A continuous model of environmental and hydrological monitoring of these lagoons is recommended for future work to improve our understanding and suggest recommendations for sustainable use.
Author Contributions
Conceptualization, J.R.P. and J.J.Z.; methodology, J.R.P. and J.J.Z.; validation, J.R.P.; formal analysis, J.R.P. and J.J.Z.; investigation, J.R.P.; resources, J.R.P. and J.J.Z.; data curation, J.R.P.; writing—original draft preparation, J.R.P. and J.J.Z.; writing—review and editing, J.J.Z.; visualization, J.R.P. and J.J.Z.; supervision, J.J.Z.; project administration, J.J.Z.; funding acquisition, J.R.P. and J.J.Z. All authors have read and agreed to the published version of the manuscript.
Funding
This research was funded by Universidade do Extremo Sul Catarinense (UNESC, Brazil), Coordenação de Aperfeiçoamento de Pessoal de Nível Superior (CAPES, Brazil), Conselho Nacional de Desenvolvimento Científico e Tecnológico (CNPq, Brazil) and Fundação de Amparo à Pesquisa e Inovação do Estado de Santa Catarina (FAPESC, Brazil). The APC was funded by Jairo José Zocche.
Institutional Review Board Statement
Not applicable.
Informed Consent Statement
Not applicable.
Data Availability Statement
All data sources were referenced in the text. Data generated exclusively in this study will be made available upon request to the corresponding author.
Acknowledgments
Jori Ramos Pereira (J.R.P.) thanks the Universidade do Extremo Sul Catarinense (UNESC) for doctoral fellowship.
Conflicts of Interest
The authors declare no conflicts of interest.
Abbreviations
The following abbreviations are used in this manuscript:
| GIS | Geographic Information System |
| PNGC | National Coastal Management Plan |
| CPRS | Coastal Plain of Rio Grande do Sul |
| BP | Before Present |
| HR10 | Hydrographic Region 10 |
| MRB | Mampituba River Basin |
| RPA | Remotely Piloted Aircraft |
| DP | Digital Processing |
| ESRI | Environmental Systems Research Institute |
| SIRGAS 2000 | Geocentric Reference System for South America |
| UTM | Universal Transverse Mercator |
| GSD | Ground Sample Distance |
| MNDWI | Modified Normalized Difference Water Index |
| IBGE | Instituto Brasileiro de Geografia e Estatística |
References
- Fawzy, S., Osman, A.I., Doran, J., Rooney, D.W. Strategies for mitigation of climate change: a review. Environ Chem Lett 2020, 18, 2069-2094. [CrossRef]
- Abbass, K., Qasim, M.Z., Song, H., Murshed, M., Mahmood, H., Younis, I. A review of the global climate change impacts, adaptation, and sustainable mitigation measures. Environ Sci Pollut R 2022, 29, 42539-42559. [CrossRef]
- Benítez, S., Navarro, J.M., Mardones, D., Villanueva, P.A., Ramirez-Kushel, F., Torres, R., Lagos, N.A., 2023. Direct and indirect impacts of ocean acidification and warming on algae-herbivore interactions in intertidal habitats. Marine Pollution Bulletin, 195, 115549. [CrossRef]
- Shivanna, K.R., 2022. Climate change and its impact on biodiversity and human welfare. Proceedings of the Indian National Science Academy 88(2), 160-171. [CrossRef]
- Andrés, M. de., Muñoz, J.M.B., 2022. The limits of coastal and marine areas in Andalusia (Spain). A socio-ecological approach for ecosystem-based management. Land Use Policy 120, 106250. [CrossRef]
- Andrés, M. de., Barragán, J.M., Scherer, M., 2018. Urban centers and coastal zone definition: Which area should we manage? Land Use Policy 71, 121-128. [CrossRef]
- Cohen, J., Small, C., 1998. Hypsographic demography: the distribution of human population. Proc. Natl. Acad. Sci. U.S.A. 95, 14009–14014 https://www.pnas.org/doi/epdf/10.1073/pnas.95.24.14009.
- Crossland, C.J., Baird, D., Ducrotoy, J-P., Lindeboom H., 2005. The Coastal Zone—a Domain of Global Interactions. In: Crossland, C.J., Kremer, H.H., Lindeboom, H.J., Marshall Crossland, J.I., Le Tissier, M.D.A. (Eds.), Coastal Fluxes in the Anthropocene. Springer, Berlin, Heidelberg, pp. 1-37. [CrossRef]
- Ritzema, H.P., 2008. Coastal lowland development: coping with climate change: examples from the Netherlands. In: Proceedings of the International Workshop on Sustainable paddy farming and healthy environment. Korean INWERF Committee and ICID WG-SDTA, Changwon City, pp. 1-12. https://research.wur.nl/en/publications/coastal-lowland-development-coping-with-climate-change-examples-f (accessed 24 April 2025).
- Bazant-Fabre, O., Bonilla-Moheno, M., Martínez, M.L., Lithgow, D., Muñoz-Piña, C., 2022. Land planning and protected areas in the coastal zone of Mexico: Do spatial policies promote fragmented governance? Land Use Policy 121, 106325. [CrossRef]
- Barragán Muñoz, J.M., 2020. Progress of coastal management in Latin America and the Caribbean. Ocean & Coastal Management 105009. [CrossRef]
- Skinner L.F., 2020. Oceano, humanidade e regiões tropicais: nosso futuro depende da nossa reconexão. Journal of Human and Environment of Tropical Bays 1, 1-8. [CrossRef]
- Viaud, V., Legrand, M., Squividant, H., Parnaudeau, V., André, A., Bera, R., Dupé, S., Marie Pot, M., Marianne Cerf, M., Revelin, F., Toffolini, Q., Levain, A., 2023. Farming by the sea: A qualitative-quantitative approach to capture the specific traits of coastal farming in Brittany, France. Land Use Policy 125, 106493. [CrossRef]
- Lee, S.Y., Dunn, R.J.K., Young, R.A., Connolly, R.M., Dale, P.E.R., Dehayr, R., Lemckert, C.J., Mckinnon, S., Powell, B., Teasdale, P.R., Welsh, D.T., 2006. Impact of urbanization on coastal wetland structure and function. Austral Ecol 31, 149-163. [CrossRef]
- Varnell, L.M., Evans, D.A., Havens, K.J., 2003. A geomorphological model of intertidal cove marshes with application to wetland management. Ecol Eng 19(5), 339–347. [CrossRef]
- Watywarawan, A., Zenere, J.L., Touguinha, G.C., da Silva, L.P., Bilhalva, D.N., Dias, J.F., Zocche, J.J., 2025. Toxic trace elements in wild mussels Perna perna (Linnaeus, 1758) in two Brazilian rocky shores of the South Atlantic Ocean. Mar Pollut Bull 216:118012. [CrossRef]
- Pereira, F.C., Oliveira, M.R.L., 2015. Plano nacional de gerenciamento costeiro: 25 anos do gerenciamento costeiro no Brasil. Ministério do Meio Ambiente, Brasília. https://gerenciamentocosteiro.furg.br/images/Materiais/PNGC-25-anos.pdf (accessed 24 April 2025).
- Brouwer, R., van Ek, R., 2004. Integrated ecological, economic and social impact assessment of alternative flood control policies in the Netherlands. Ecol Econ 50(1-2), 1-21. [CrossRef]
- Gibbs, J.P., 2000. Wetland loss and biodiversity conservation. Conserv Biol 14(1), 314-317. [CrossRef]
- Ballut-Dajud, G.A., Sandoval Herazo, L.C., Fernández-Lambert, G., Marín-Muñiz, J.L., López Méndez, M.C., Betanzo-Torres, E.A., 2022. Factors affecting wetland loss: A review. Land 11(3), 434. [CrossRef]
- Kominoski, J.S., Gaiser, E.E.; Castaneda-Moya, E.; Davis, S.E.; Dessu, S.B.; Julian II, P.; Lee, D.Y.; Marazzi, L.; Rivera-Monroy, V.H.; Sola, A.; Stingl, U.; Stumpf, S.; Surratt, D.; Travieso, R.; Troxler, T.G., 2020. Disturbance legacies increase and synchronize nutrient concentrations and bacterial productivity in coastal ecosystems. Ecology 101(5), e02988. [CrossRef]
- Zhao, L., Zhang, C., Wang, V., Yang, C., Zhou, W., 2025. Spatio-temporal variations of land use carbon emissions and its low carbon strategies for coastal areas in China with nighttime lighting data. J Environ Manage 385, 125651. [CrossRef]
- Gianuca, K. de S., Tagliani, C.R.A., 2012 Análise em um sistema de informação geográfica (SIG) das alterações na paisagem em ambientes adjacentes a plantios de pinus no Distrito do Estreito, município de São José do Norte, Brasil. Revista de Gestão Costeira Integrada—Journal of Integrated Coastal Zone Management 12(1), 43-55. [CrossRef]
- Santinhos, A.J., Martinho, A.P., Caeiro, S., 2014. Perceção das populações locais face à sustentabilidade dos serviços das zonas costeiras: o caso da Lagoa de Santo André, Portugal. Revista de Gestão Costeira Integrada—Journal of Integrated Coastal Zone Management 14(3), 413-427. [CrossRef]
- Asmus, M.L., Kitzmann, D., Laydner, C., Tagliani, C.R.A., 2006. Gestão costeira no Brasil: Instrumentos, fragilidades e potencialidades. Gerenciamento Costeiro Integrado 1, 52-57. https://repositorio.furg.br/bitstream/handle/1/2053/GEST%C3O%20COSTEIRA%20NO%20BRASIL.pdf?sequence=1 (accessed 23 April 2025).
- Lei, 1988. Lei Nacional de Gerenciamento Costeiro. Presidência da República. (7.661/88). http://www.planalto.gov.br/ccivil_03/leis/l7661.htm (accessed 23 April 2025).
- Rosa, M.L.C. da C., Barboza, E.G., Abreu, V. dos. S., Tomazelli, L.J., Dillenburg, S.R., 2017. High-frequency sequences in the Quaternary of Pelotas Basin (coastal plain): a record of degradational stacking as a function of longer-term base-level fall. Braz J Geol 47(2), 183-207. [CrossRef]
- Tomazelli, L., Villwock, J., 1991. Geologia do sistema lagunar holocênico do litoral norte do Rio Grande do Sul, Brasil. Pesquisas em Geociências 18(1), 13-24. [CrossRef]
- Schäfer, A.E., Marchett, C.A., Schuh, S.M., Ahlert, S., Lanzer, R.M., 2014. Morphological characterization of eighteen lakes of the north and middle coast of Rio Grande do Sul, Brazil. Acta Limnologica Brasiliensia 26(2), 199-214. [CrossRef]
- Tomazelli, L., Villwock, J., 1992. Considerações sobre o ambiente praial e à deriva litorânea de sedimentos ao longo do litoral norte do Rio Grande do Sul, Brasil. Pesquisas em Geociências 19(1), 3-12. [CrossRef]
- Tomazelli, L.J., Villwock, J.A., 2005. Mapeamento geológico de planícies costeiras: o exemplo da costa do Rio Grande do Sul. Gravel 3(1), 109-115. https://www.ufrgs.br/gravel/3/Gravel_3_11.pdf (accessed 23 April 2025).
- Bitencourt, N. de L. da R., Lalane, H. de C., Rocha, I. de O., 2011. O processo de ocupação dos espaços costeiros do extremo sul de Santa Catarina, Brasil. Revista Geográfica de América Central (Número Especial EGAL), 1-15. https://www.revistas.una.ac.cr/index.php/geografica/article/view/2531/2420 (accessed 23 April 2025).
- Bitencourt, N. de L. da R.; Soriano-Sierra, E.J.; Ernandorena, P.R., 2013. Ações para conter impactos ambientais na orla marítima: Caso do município de Balneário Gaivota. OLAM-Ciência e Tecnologia 1(1), 183-203. https://www.periodicos.rc.biblioteca.unesp.br/index.php/olam/article/view/7535/5609 (accessed 23 April 2025).
- Cohenca, D., Scherer, M.E.G., Vieira, C.A.O., 2017. Ocupação na zona costeira do sul de Santa Catarina: uma análise histórica de vetores e processos. Geosul 32(64), 47-65. [CrossRef]
- Lopes, A.R.S., Nodari, E.S., 2012. “O que é da natureza não se mexe”: memória e degradação ambiental na Lagoa de Sombrio SC (1960-2010). História Oral 15(1), 55-80. [CrossRef]
- Porcher, L.C.F., Poester, G., Lopes, M., Schonhofen, P., Silvano, R.A.M., 2010. Percepção dos moradores sobre os impactos ambientais e as mudanças na pesca em uma lagoa costeira do litoral sul do Brasil. Bol Inst Pesca 36(1), 61-72. https://institutodepesca.org/index.php/bip/article/view/903/884 (accessed 24 April 2025).
- Secretaria de Estado do Desenvolvimento Econômico Sustentável, 2017. Plano estadual de recursos hídricos de Santa Catarina—PERH/SC. Santa Catarina: Prognóstico das demandas hídricas de Santa Catarina. https://www.aguas.sc.gov.br/jsmallfib_top/DHRI/Plano%20Estadual/etapa_c/PERH_SC_Recomendacoes_enquadramento_CERTI-CEV_2017_final.pdf (accessed 24 April 2025).
- Villwock, J.A., 1984. Geology of the coastal Province of Rio Grande do Sul, Southern Brazil. A synthesis. Pesquisas em Geociências 16(16), 5-49. [CrossRef]
- Schäfer, A.E., Pereira, R., Lanzer, R., 2009. Atlas socioambiental dos Municípios de Mostardas, Tavares, São José do Norte e Santa Vitoria do Palmar. Educs. Caxias do Sul. https://www.ucs.br/educs/arquivo/ebook/atlas-socioambiental-dos-municipios-de-mostardas-tavares-sao-jose-do-norte-santa-vitoria-do-palmar/ (accessed 24 April 2025).
- Klein, A.H. da F., Short, A.D., Bonetti, J., 2016. Santa Catarina beach systems. In: Klein, A.H. da F., Short, A.D., Bonetti, J. (Eds.), Brazilian beach systems, Springer, Switzerland pp. 465–506. [CrossRef]
- Alvares, C.A., Starpe, J.L., Sentelhas, P.C., Gonçalves, J.L.M., Sparovek, G., 2013. Köppen’s climate classification map for Brazil. Meteorol Z 22(6), 711-728. [CrossRef]
- Secretaria do Meio Ambiente e Infraestrutura, 2018. L050—Bacia Hidrográfica do Rio Mampituba. https://www.sema.rs.gov.br/l050-bh-mampituba (accessed 24 April 2025).
- Sistema de Informações de Recursos Hídricos de Santa Catarina, 2018. Bacias Hidrográficas do Estado. https://www.aguas.sc.gov.br/jsmallfib_top/DHRI/bacias_hidrograficas/bacias_hidrograficas_sc.pdf (accessed 24 April 2025).
- Lei, 1998. Dispõe sobre a caracterização do Estado em 10 Regiões Hidrográficas. (10.949). https://www.aguas.sc.gov.br/jsmallfib_top/DHRI/Legislacao/Lei-Estadual-10949-1998.pdf (accessed 24 April 2025).
- Bitencourt, N. de L. da R., Rocha, I. de O., 2014. Percepção das populações costeiras sobre os efeitos dos eventos adversos no extremo sul de Santa Catarina, Brasil. Revista de Gestão Costeira Integrada—Journal of Integrated Coastal Zone Management 14(1), 15-25. [CrossRef]
- Meneses, P.R., Almeida, T. de., 2012. Distorções e correções dos dados da imagem. In: Meneses, P.R., Almeida, T. de. (Orgs.), Introdução ao processamento digital de imagens de sensoriamento remoto. UnB/CNPq, Brasília, pp. 81-102. https://memoria.cnpq.br/documents/10157/56b578c4-0fd5-4b9f-b82a-e9693e4f69d8 (accessed 24 April 2025).
- Silva, C.A. da., Duarte, C.R., Souto, M.V.S., Santos, A.L.S. dos., Amaro, V.E., Bicho, P.B., Sabadia, J.A.B., 2016. Avaliação da acurácia do cálculo de volume de pilhas de rejeito utilizando VANT, GNSS e LIDAR. Bol Ciênc Geod 22(1), 73–94. [CrossRef]
- Ladwig, N.I.; Pereira, J.R.; Neves, G.R., 2021. Qualidade posicional planimétrica de ortomosaico obtido com uso de aeronave remotamente pilotada—RPA. Geografía y Sistemas de Información Geográfica 21, 1–14. https://87538a9a-4129-4498-961e-1bc765cd62c3.filesusr.com/ugd/79758e_b21dea93fe884b7f8c2a19d8ffca7ca0.pdf (accessed 23 April 2025).
- Câmara, G., Carvalho, M.S., 2004. Análise espacial de eventos. In: Druck, S., Carvalho, M.S., Câmara, G., Monteiro, A.V.M. (Eds.), Análise Espacial de Dados Geográficos. EMBRAPA, Brasília, pp. 1-15. http://www.dpi.inpe.br/gilberto/livro/analise/cap2-eventos.pdf (accessed 23 April 2025).
- Souza Jr, C.M., Shimbo, J.Z, Rosa, M.R., Parente, L.L., Alencar, A.A., Rudorff, B.F.T, Hasenack, H., Matsumoto, M., Ferreira, L.G., Souza-Filho, P.W.M., Oliveira, S.W., Rocha, W.F., Fonseca, A.V., Marques, C.B. Diniz, C.G., Costa, D., Monteiro, D., Rosa, E.R., Vélez-Martin, E., Weber, E.J., Lenti, F.E.B., Paternost, F.F., Pareyn, F.G.C., Siqueira, J.V., Viera, J.L., Ferreira Neto, L.C., Saraiva, M.M., Sales, M.H., Salgado, M.P.G., Vasconcelos, R., Galano, S., Mesquita, V.V., Azevedo, T., 2020. Reconstructing three decades of land use and land cover changes in Brazilian biomes with Landsat archive and earth engine. Remote Sens 12(17), 2735. [CrossRef]
- UN United Nations, 2015. Department of Economic and Social Affairs. Sustainable Development. The 17 Goals. https://sdgs.un.org/goals (accessed 24 April 2025).
- IBGE Instituto Brasileiro de Geografia e Estatística, 2022. Censo Demográfico. Panorama do senso 2022. https://censo2022.ibge.gov.br/panorama/ (accessed 23 April 2025).
- Lei, 1995. Cria o Município de Balneário Gaivota, e adota outras providências. (10.054). http://leis.alesc.sc.gov.br/html/1995/10054_1995_Lei.html (accessed 23 April 2025).
- McFeeters, S.K., 1996. The use of the normalized difference water index (NDWI) in the delineation of open water features. Int J Remote Sensing 17(7), 1425-1432. [CrossRef]
- Xu, H., 2006. Modification of normalized difference water index (NDWI) to enhance open water features in remotely sensed imagery. International journal of remote sensing 27(14), 3025-3033. [CrossRef]
- Ministério do Desenvolvimento Regional, 2020. Sistema Nacional de Informações sobre Saneamento: 25º Diagnóstico dos Serviços de Água e Esgoto–2019. SNS/MDR, Brasilia. https://www.gov.br/mdr/pt-br/assuntos/saneamento/snis/diagnosticos-anteriores-do-snis/agua-e-esgotos-1/2019/2-Diagnstico_SNIS_AE_2019_Republicacao_31032021.pdf (accessed 23 April 2025).
- Lopes, A.R.S., 2011. A Lagoa do Sombrio corre que desaparece: uma história ambiental da degradação e o atual debate sobre a preservação da Lagoa de Sombrio. (Master Degree) Universidade Federal de Santa Catarina (UFSC). http://repositorio.ufsc.br/xmlui/handle/123456789/95285 (accessed 23 April 2025).
- Holanda, S.B. de., 1994. Caminhos e fronteiras. Companhia das Letras, São Paulo, 374p.
- Reitz, R., 1988. Paróquia de Sombrio: ensaio de uma monografia paroquial. Paróquia Santo Antonio de Pádua, Sombrio, 194 pp.
- Farias, V.F. de., 2000. Sombrio 85 anos: natureza, história e cultura para o ensino fundamental. Ed. do autor, Sombrio, 326 pp.
- Bertolo, L.S., Lima, G.T.N.P., Santos, R.F., 2012. Identifying change trajectories and evolutive phases on coastal landscapes. Case study: São Sebastião Island, Brazil. Landscape Urban Plan 106(1), 115-123. [CrossRef]
- Moraes, A.C.R., 2007. Contribuições para a gestão da zona costeira do Brasil: elementos para uma geografia do litoral brasileiro. Annablume, São Paulo, 232 pp.
- Pereira, R.M.F. do A., 2003. Formação sócio-espacial do litoral de Santa Catarina (Brasil): gênese e transformações recentes. Geosul, 18(35), 99–129. https://periodicos.ufsc.br/index.php/geosul/article/view/13604/12471 (accessed 24 April 2025).
- Lopes, E.B., Ruiz, T.C.D., Anjos, F.A.D., 2018. A ocupação urbana no Litoral Norte do Rio Grande do Sul, Brasil, e suas implicações no turismo de segunda residência. Urbe. Revista Brasileira de Gestão Urbana—Brazilian Journal of Urban Management 10 (2), 426-441. [CrossRef]
- Marchett, C.A., 2017. Caracterização morfológica das lagoas de Osório, norte da planície costeira do Rio Grande do Sul. (Master Degree), Universidade de Caxias do Sul (UCS). https://repositorio.ucs.br/xmlui/bitstream/handle/11338/3378/Dissertacao%20Cassiano%20Alves%20Marchett.pdf?sequence=1&isAllowed=y (accessed 24 April 2025).
- Schwarzbold, A.; Schäfer, A., 1984. Gênese e morfologia das lagoas costeiras do Rio Grande do Sul-Brasil. Amazoniana 9(1), 87-104. https://archive.org/details/amazoniana-9-001-087-104 (accessed 24 April 2025).
- Wang, Z., Lu, Z., Ma, J., Huang, G., An, C., 2024. Assessing the water metabolism of coastal urban areas based on the water mass balance framework across time periods: A case study of Cape Town, South Africa. Ocean Coasta Manage, 259, 107434. [CrossRef]
- Gebeyehu, A.K., Snelder, D., Sonneveld, B., 2023. Land use-land cover dynamics, and local perceptions of change drivers among Nyangatom agro-pastoralists, Southwest Ethiopia. Land Use Policy 131, 106745. [CrossRef]
- Barbosa, C.C.F., Novo, E.M.L.M., Martins, V.S., 2019. Introdução ao sensoriamento remoto de sistemas aquáticos: Princípios e aplicações. Instituto Nacional de Pesquisas Espaciais, São José dos Campos, 178 pp. http://www.dpi.inpe.br/labisa/livro/res/conteudo.pdf (accessed 23 April 2025).
- Gomes, M.P., 2024. The convergence of antibiotic contamination, resistance, and climate dynamics in freshwater ecosystems. Water 16(18), 2606. [CrossRef]
- Heller, L., Pádua, V.L. de., 2010. Abastecimento de água para consumo humano. Editora UFMG, Belo Horizonte, 859 pp.
- Chen, N., Hong, H., Gao, X., 2021. Securing drinking water resources for a coastal city under global change: scientific and institutional perspectives. Ocean Coast Manag. 207, 104427. [CrossRef]
- Rogers, B.C., Dunn, G., Hammer, K., Novalia, W., de Haan, F.J., Brown, L., Brown, R.R., Lloyd, S., Urich, C., Wong, T.H.F., Chesterfield, C., 2020. Water Sensitive Cities Index: a diagnostic tool to assess water sensitivity and guide management actions. Water Res. 186, 116411. [CrossRef]
- Lozoya, J.P., 2022. As zonas costeiras no antropoceno. In: Polette, M., Bombana, B., Longarete, C., Conde, D. (Eds.), Praias: Princípios e diretrizes para Gestão. Autor e editor, Itajaí, pp. 12-19. http://www.profagua.uerj.br/livros/Praias_pricipios%20e%20diretrizes%20para%20gestao.pdf (accessed 24 April 2025).
- Hariram, N.P., Mekha, K.B., Suganthan, V., Sudhakar, K. 2023). Sustainalism: An integrated socio-economic-environmental model to address sustainable development and sustainability. Sustainability 15(13), 10682. [CrossRef]
- Tundisi, J.G., 2006. Novas perspectivas para a gestão de recursos hídricos. Revista USP 70, 24-35. [CrossRef]
Figure 1.
Location of the municipality of Balneário Gaivota in the south of Santa Catarina state, southern Brazil.
Figure 1.
Location of the municipality of Balneário Gaivota in the south of Santa Catarina state, southern Brazil.
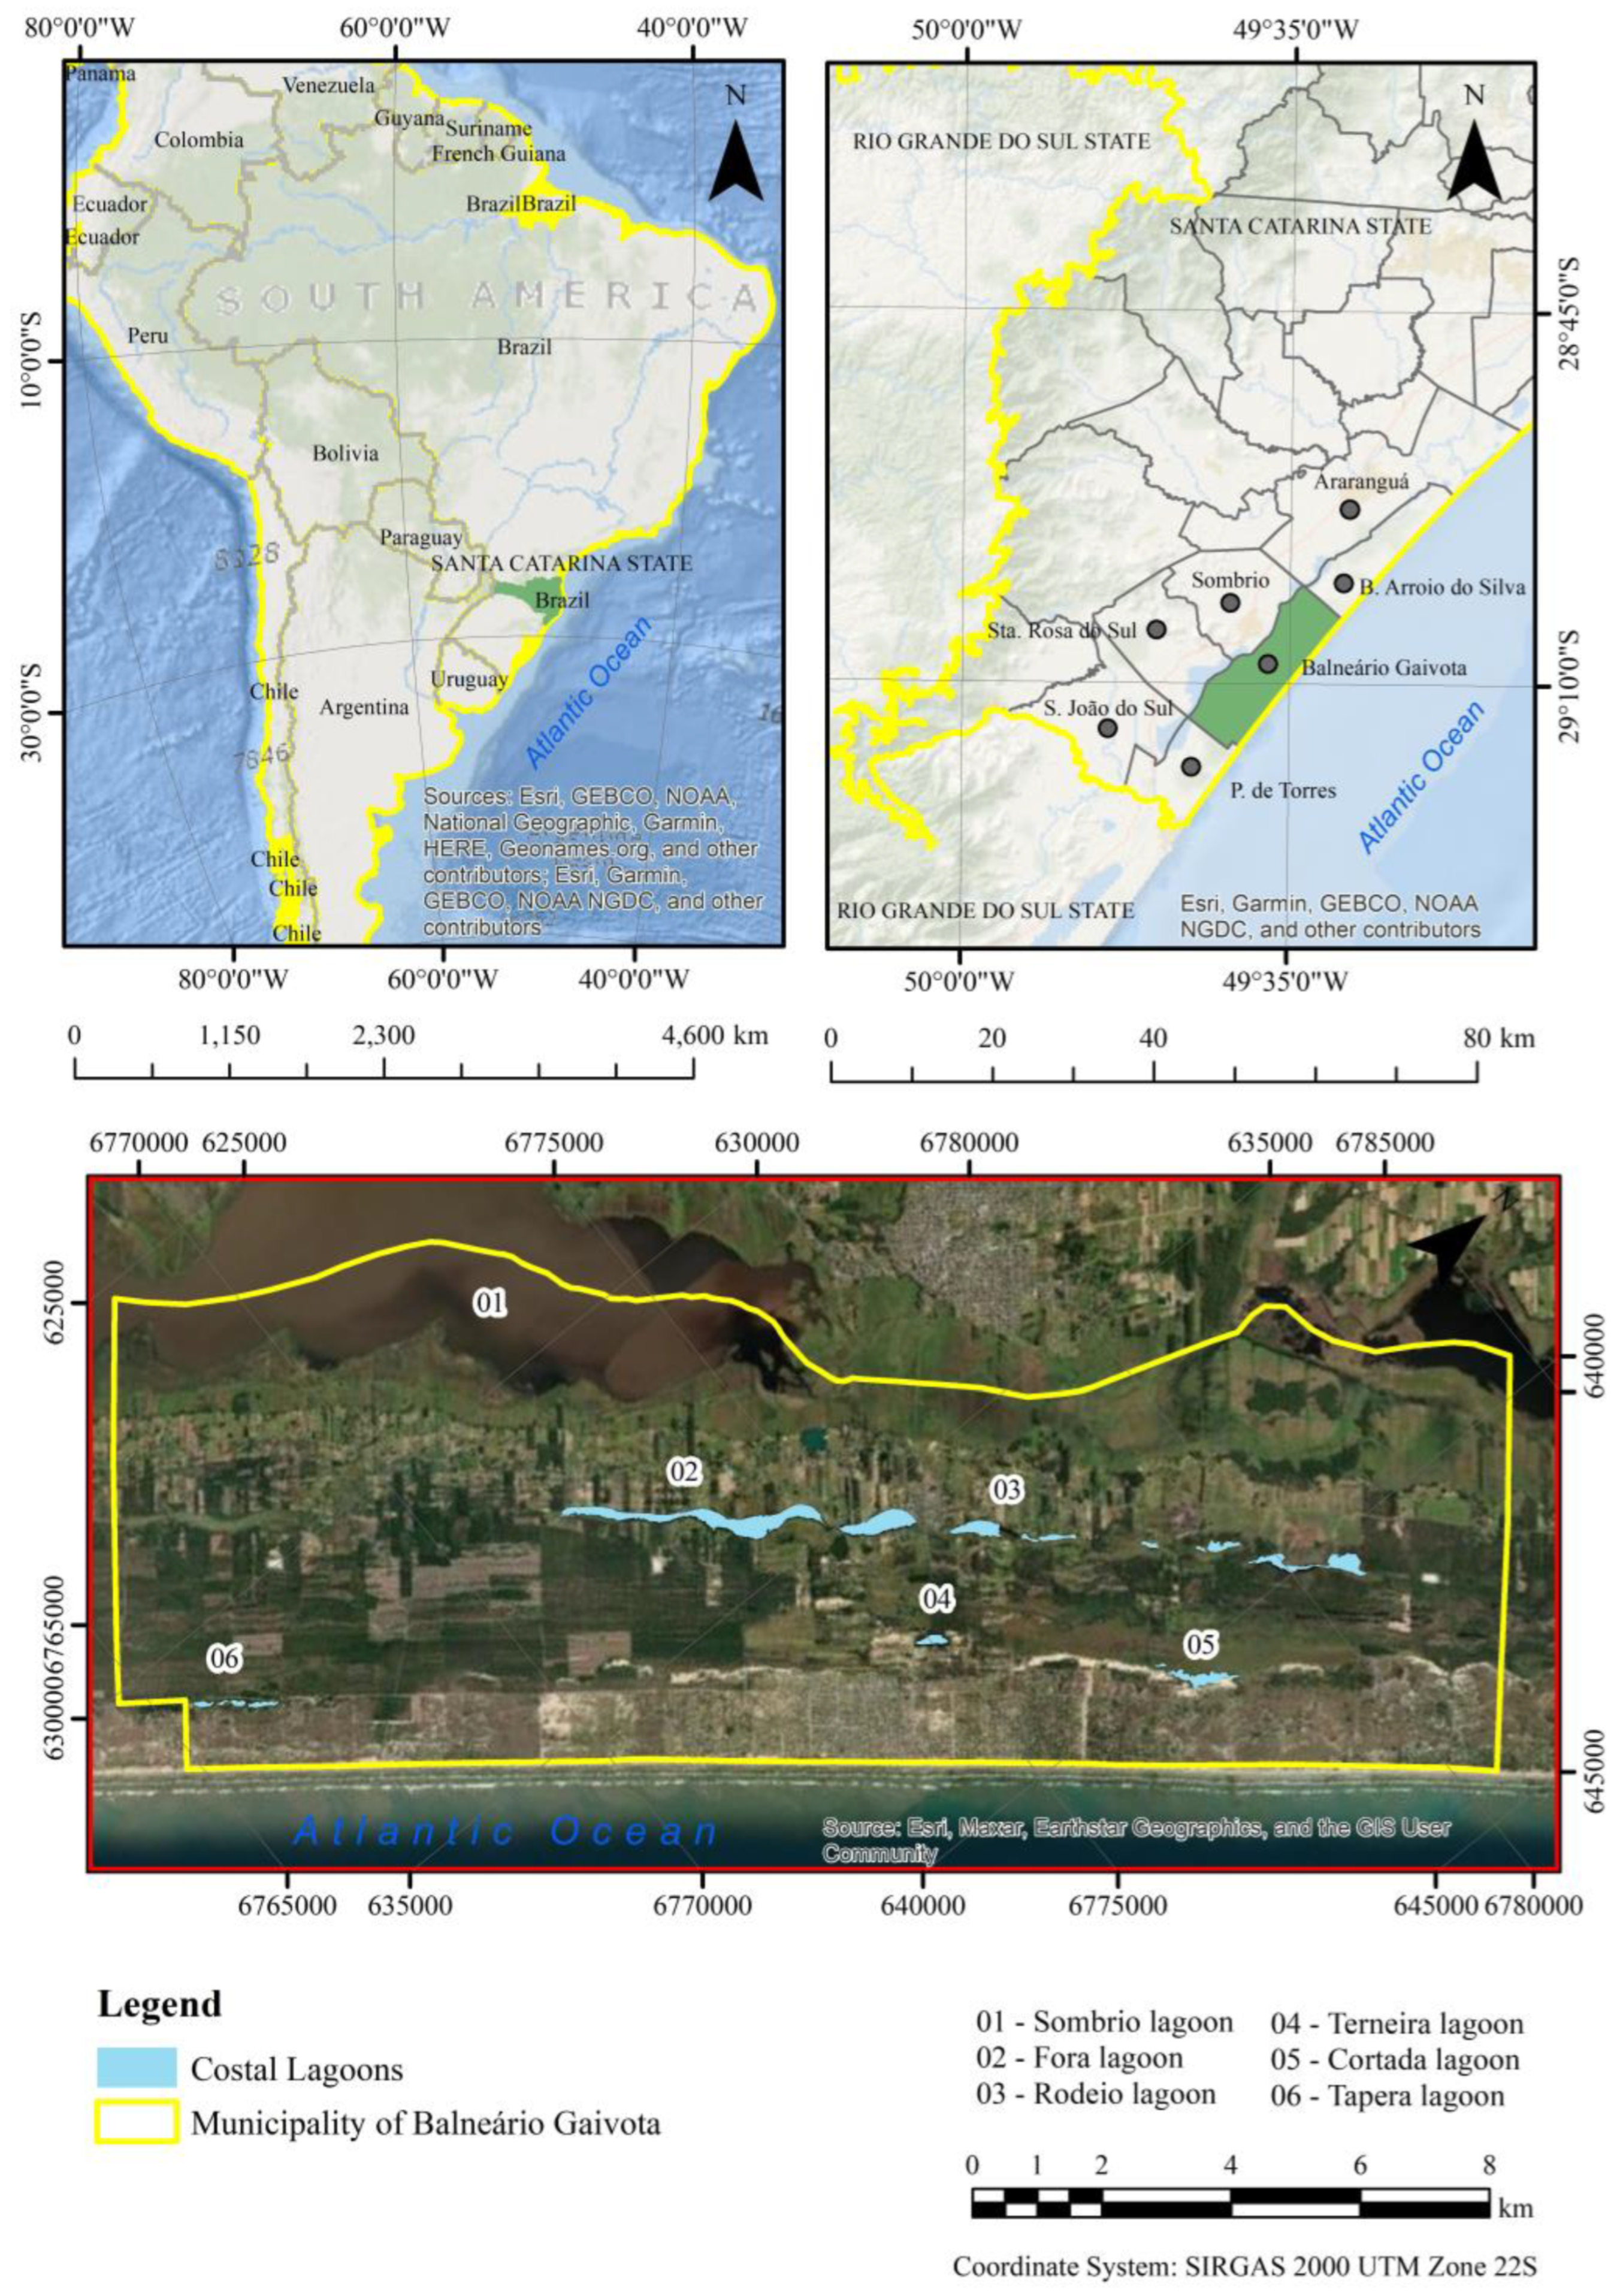
Figure 2.
Number and distribution of buildings in the years 1956 (A) and 1978 (B) in the municipality of Balneário Gaivota, south of Santa Catarina State, southern Brazil.
Figure 2.
Number and distribution of buildings in the years 1956 (A) and 1978 (B) in the municipality of Balneário Gaivota, south of Santa Catarina State, southern Brazil.
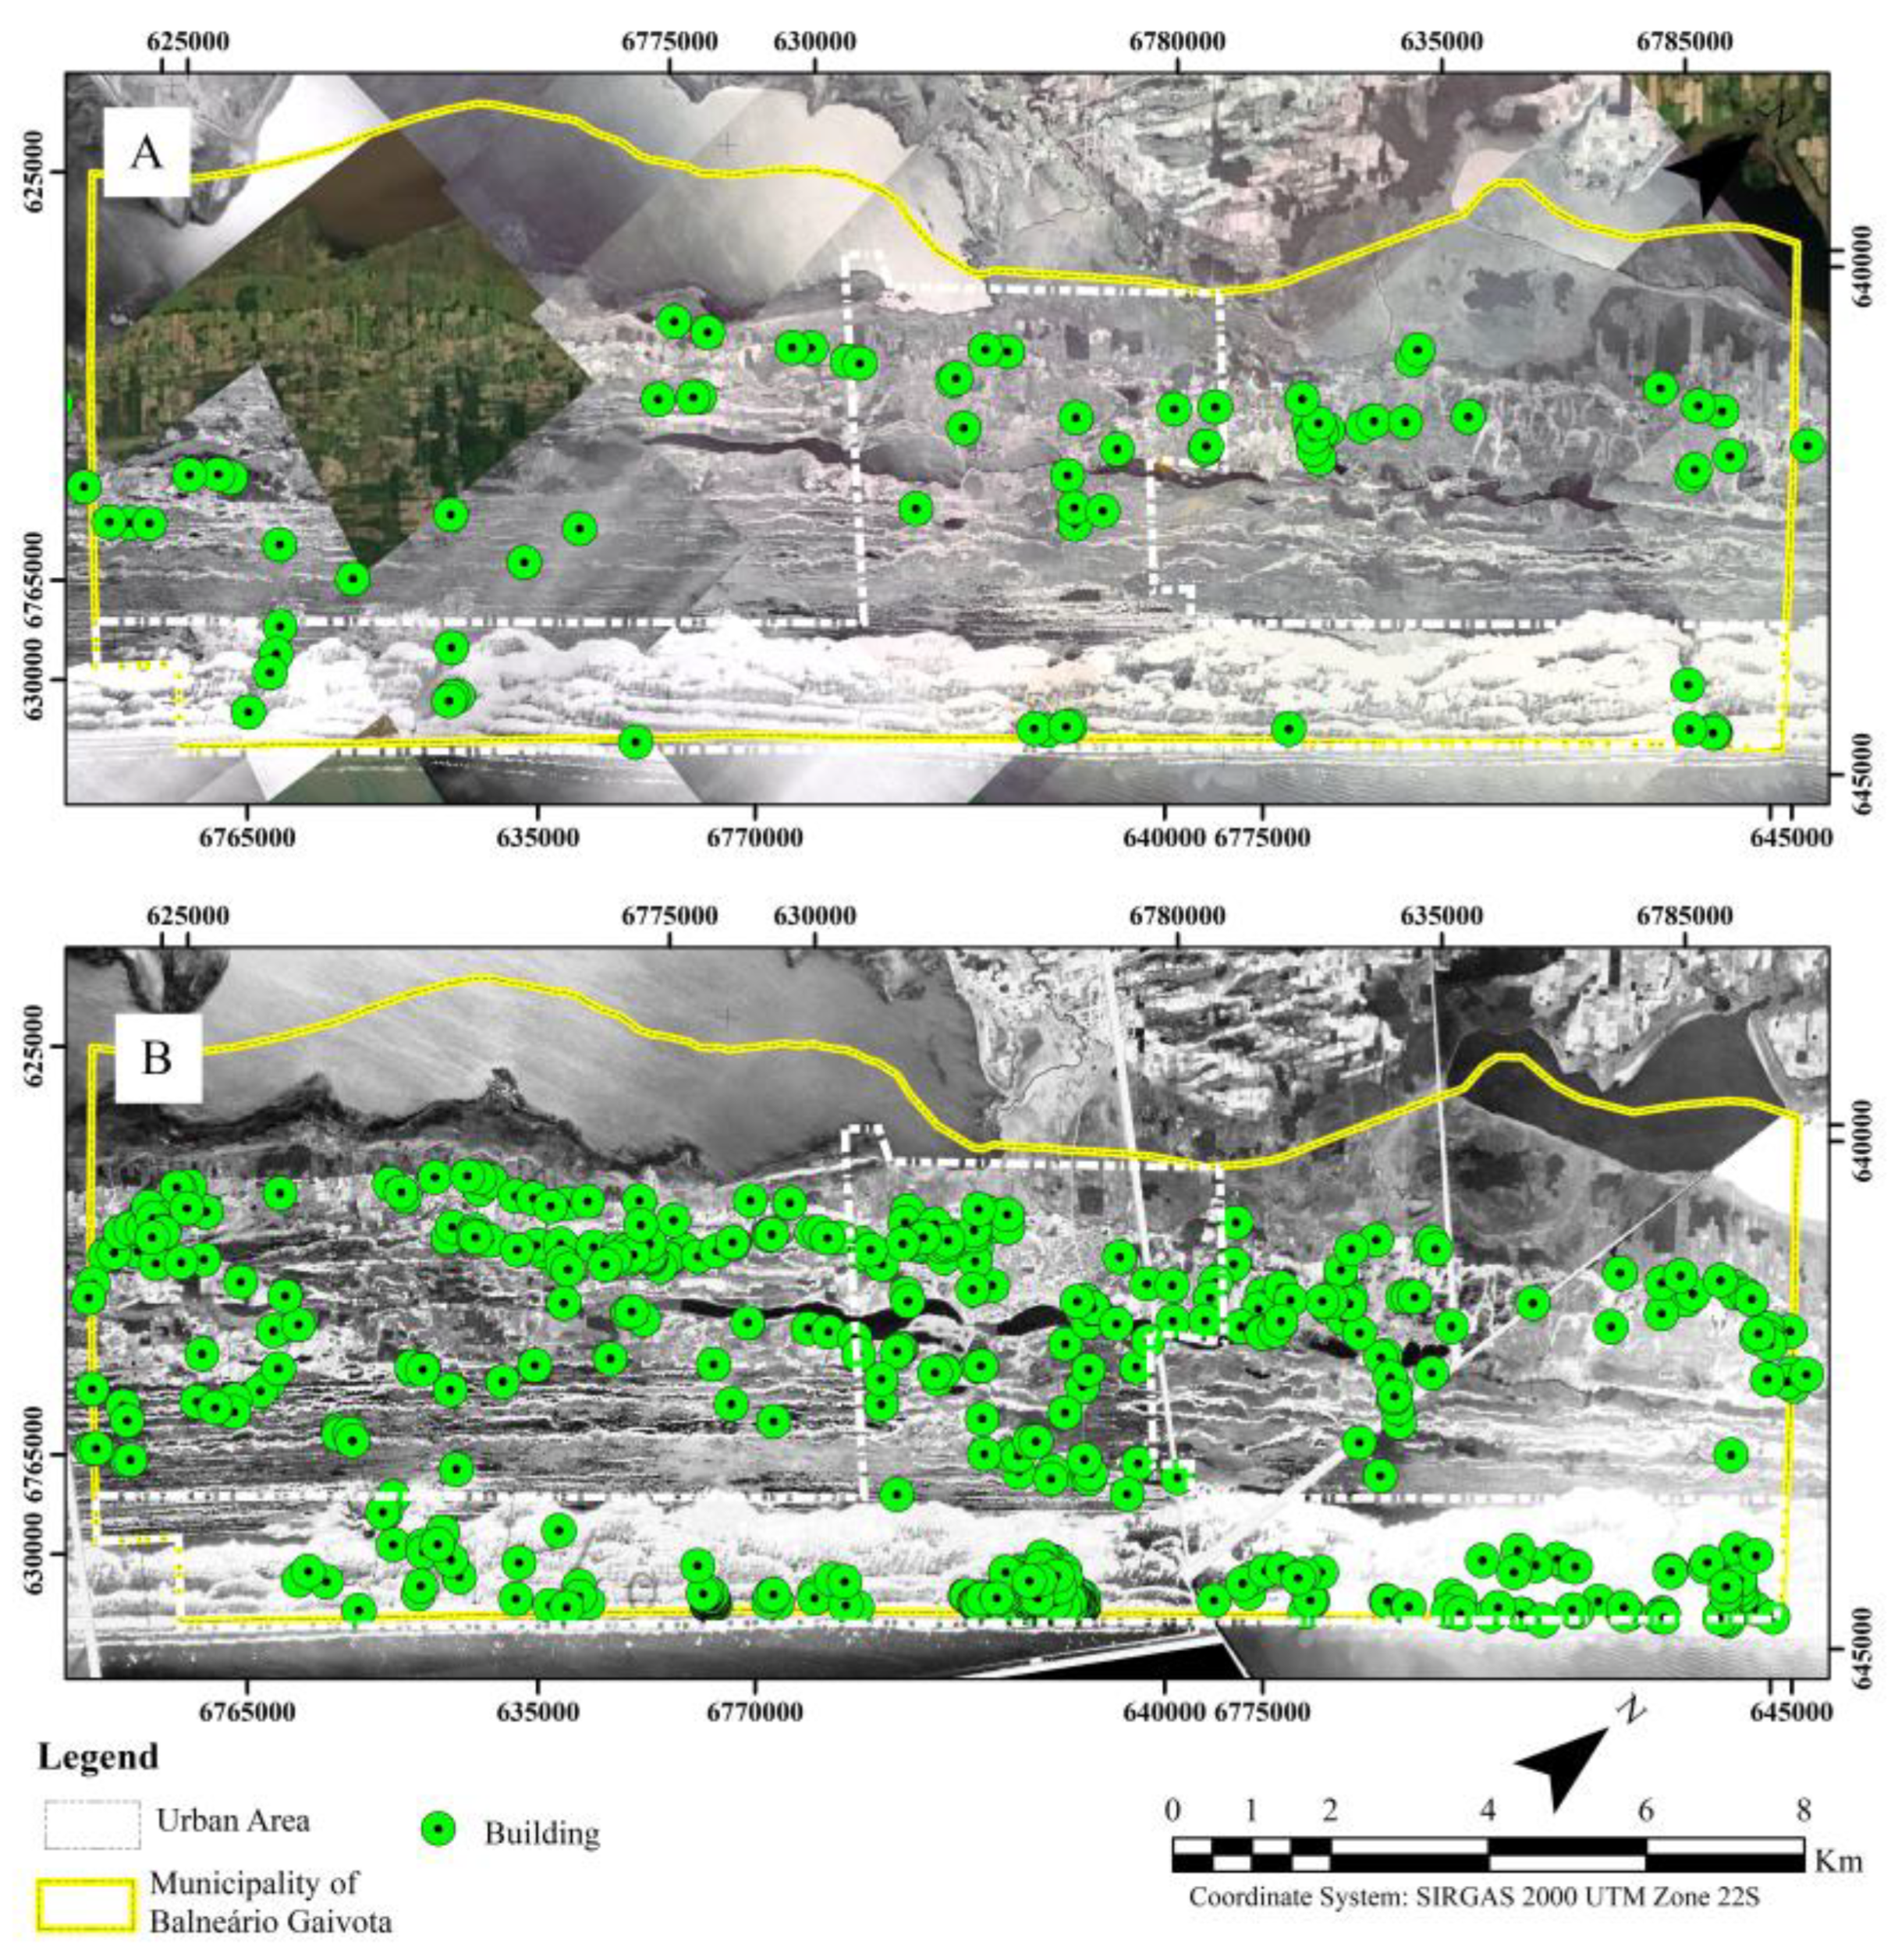
Figure 3.
Number and distribution of buildings in the years 2010 (A) and 2020 (B) in the urban area of the municipality of Balneário Gaivota, south of Santa Catarina state, southern Brazil.
Figure 3.
Number and distribution of buildings in the years 2010 (A) and 2020 (B) in the urban area of the municipality of Balneário Gaivota, south of Santa Catarina state, southern Brazil.
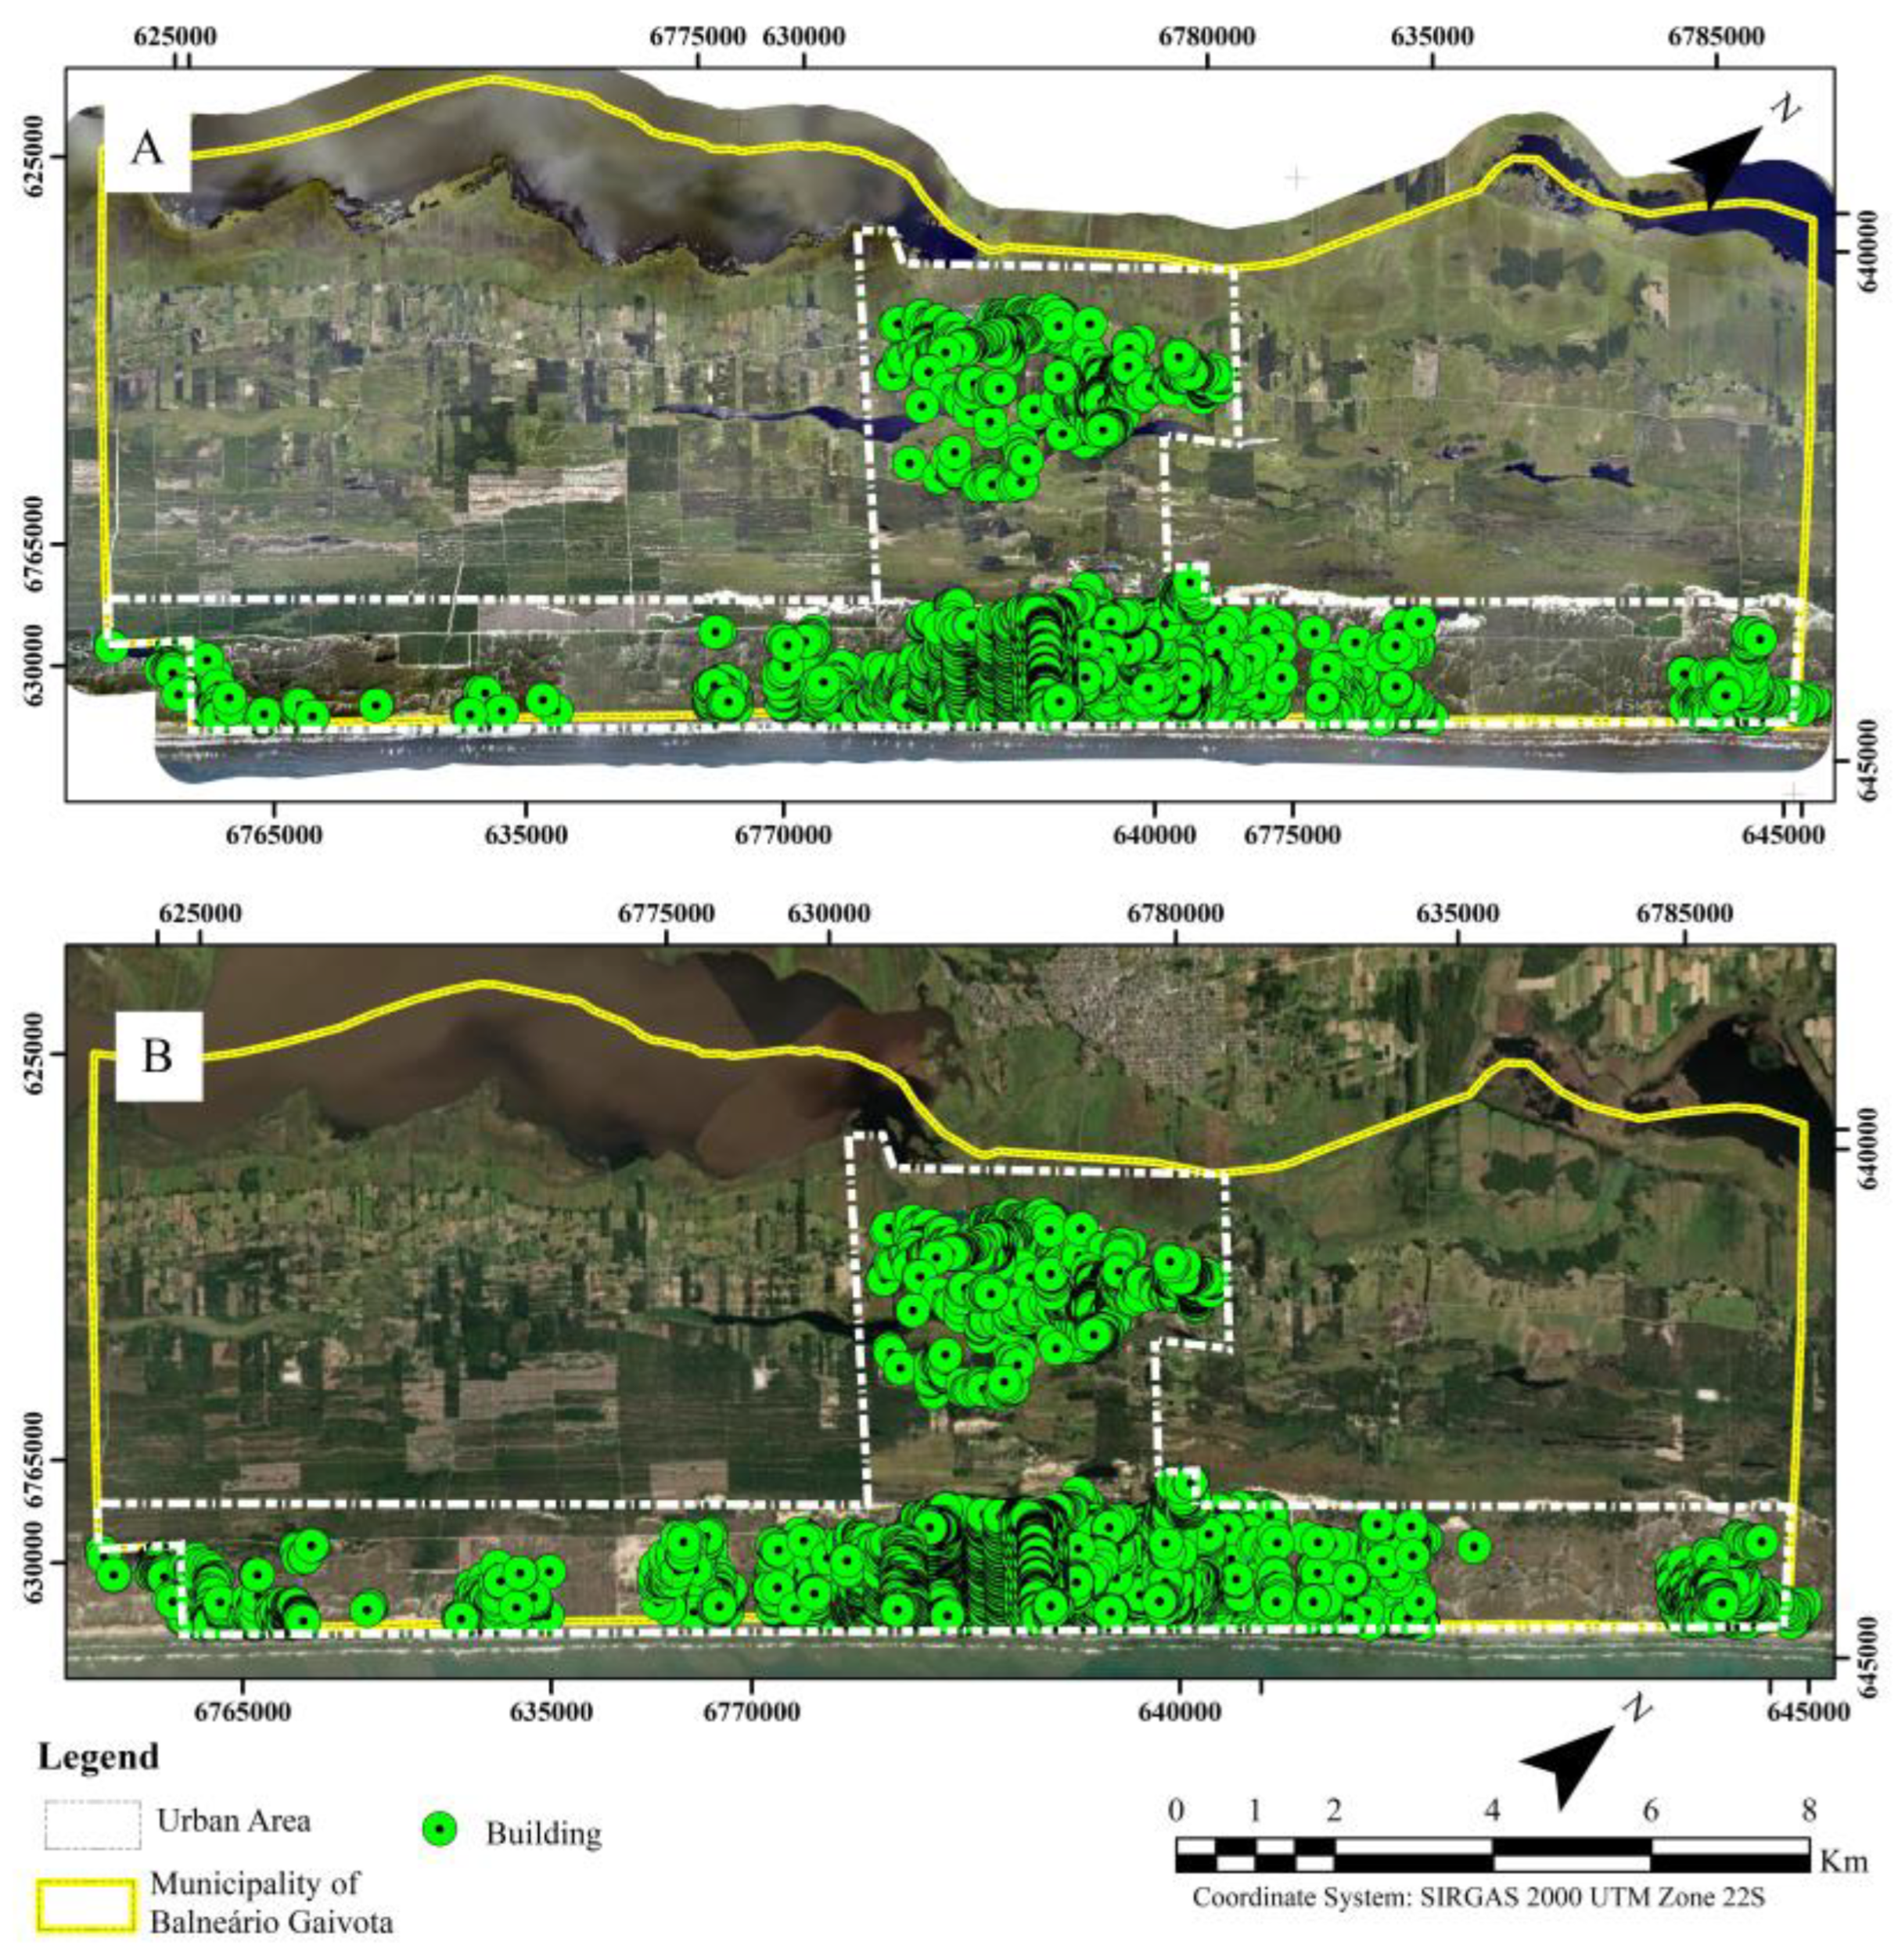
Figure 4.
Distribution and intensity of distribution of buildings km−2 in 1956 (A) and 1978 (B) in the actual urban area of the municipality of Balneário Gaivota, south of Santa Cataria state, southern Brazil.
Figure 4.
Distribution and intensity of distribution of buildings km−2 in 1956 (A) and 1978 (B) in the actual urban area of the municipality of Balneário Gaivota, south of Santa Cataria state, southern Brazil.
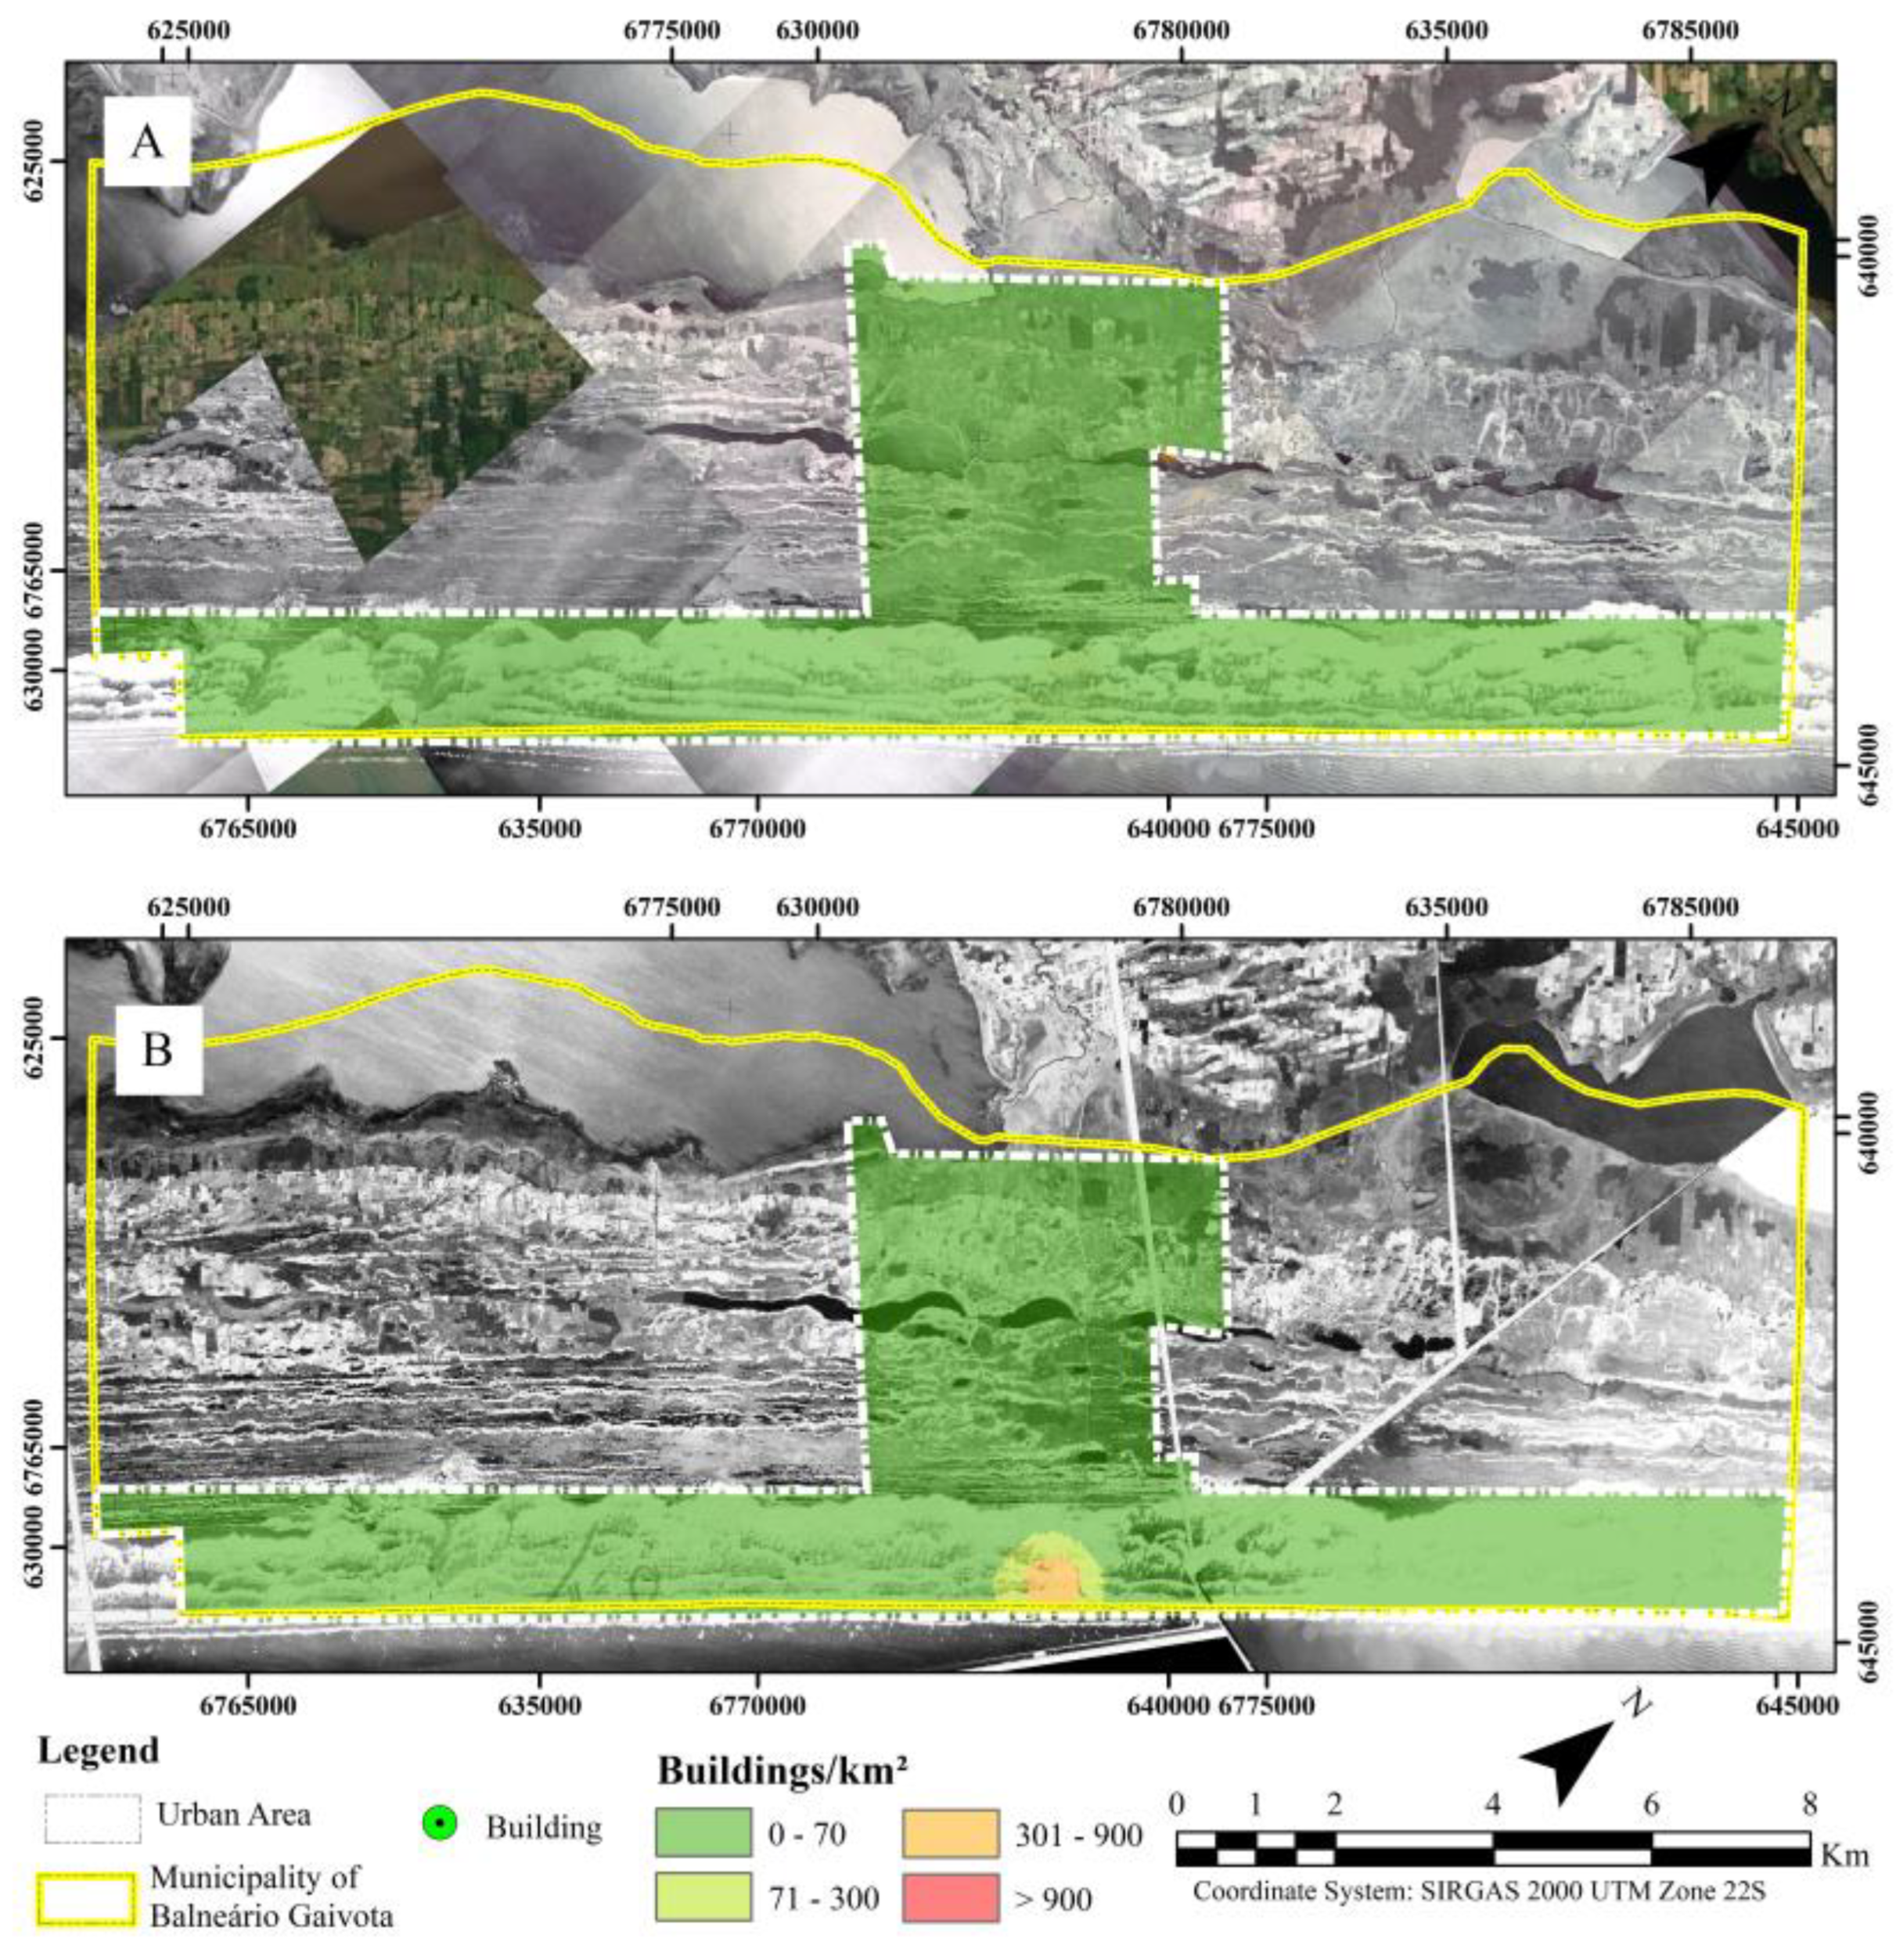
Figure 5.
Distribution and intensity of distribution of buildings km−2 in 2010 (A) and 2020 (B) in the urban area of the municipality of Balneário Gaivota, south of Santa Cataria state, southern Brazil.
Figure 5.
Distribution and intensity of distribution of buildings km−2 in 2010 (A) and 2020 (B) in the urban area of the municipality of Balneário Gaivota, south of Santa Cataria state, southern Brazil.
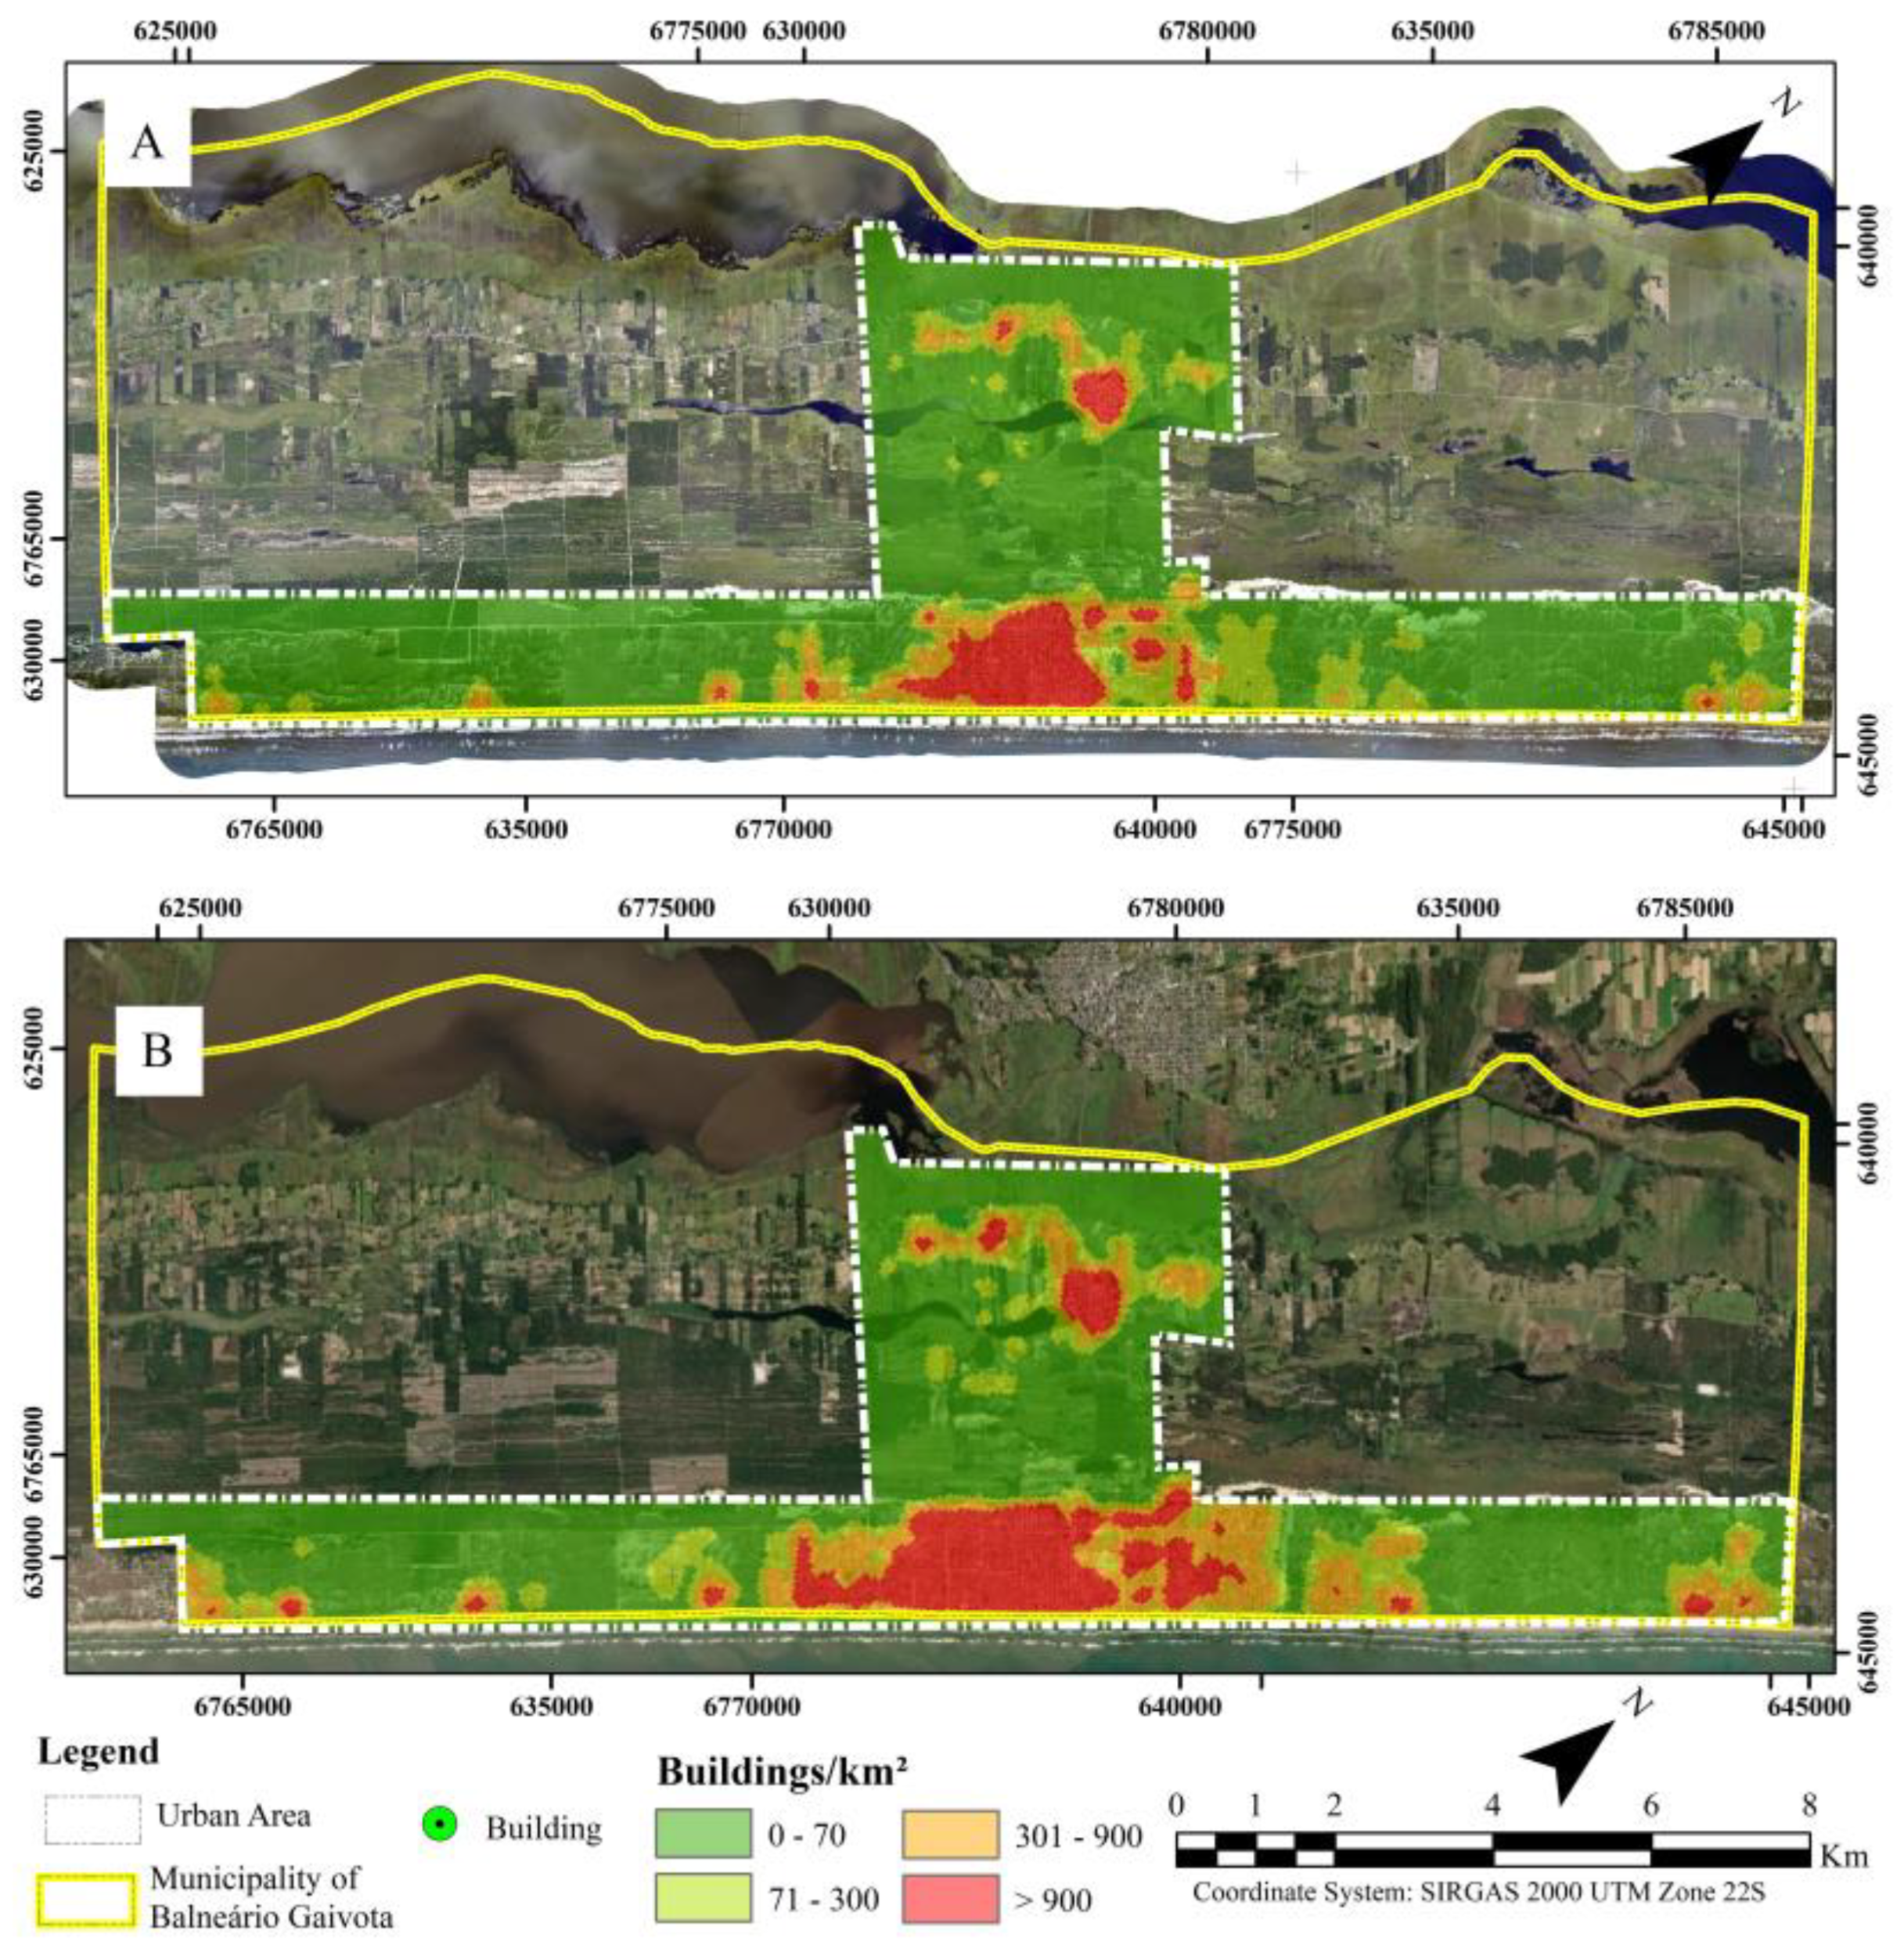
Figure 6.
Increase in the number of buildings in the municipality of Balneário Gaivota obtained by counting buildings in aerial images from 1956, 1978, 2010, and 2020.
Figure 6.
Increase in the number of buildings in the municipality of Balneário Gaivota obtained by counting buildings in aerial images from 1956, 1978, 2010, and 2020.
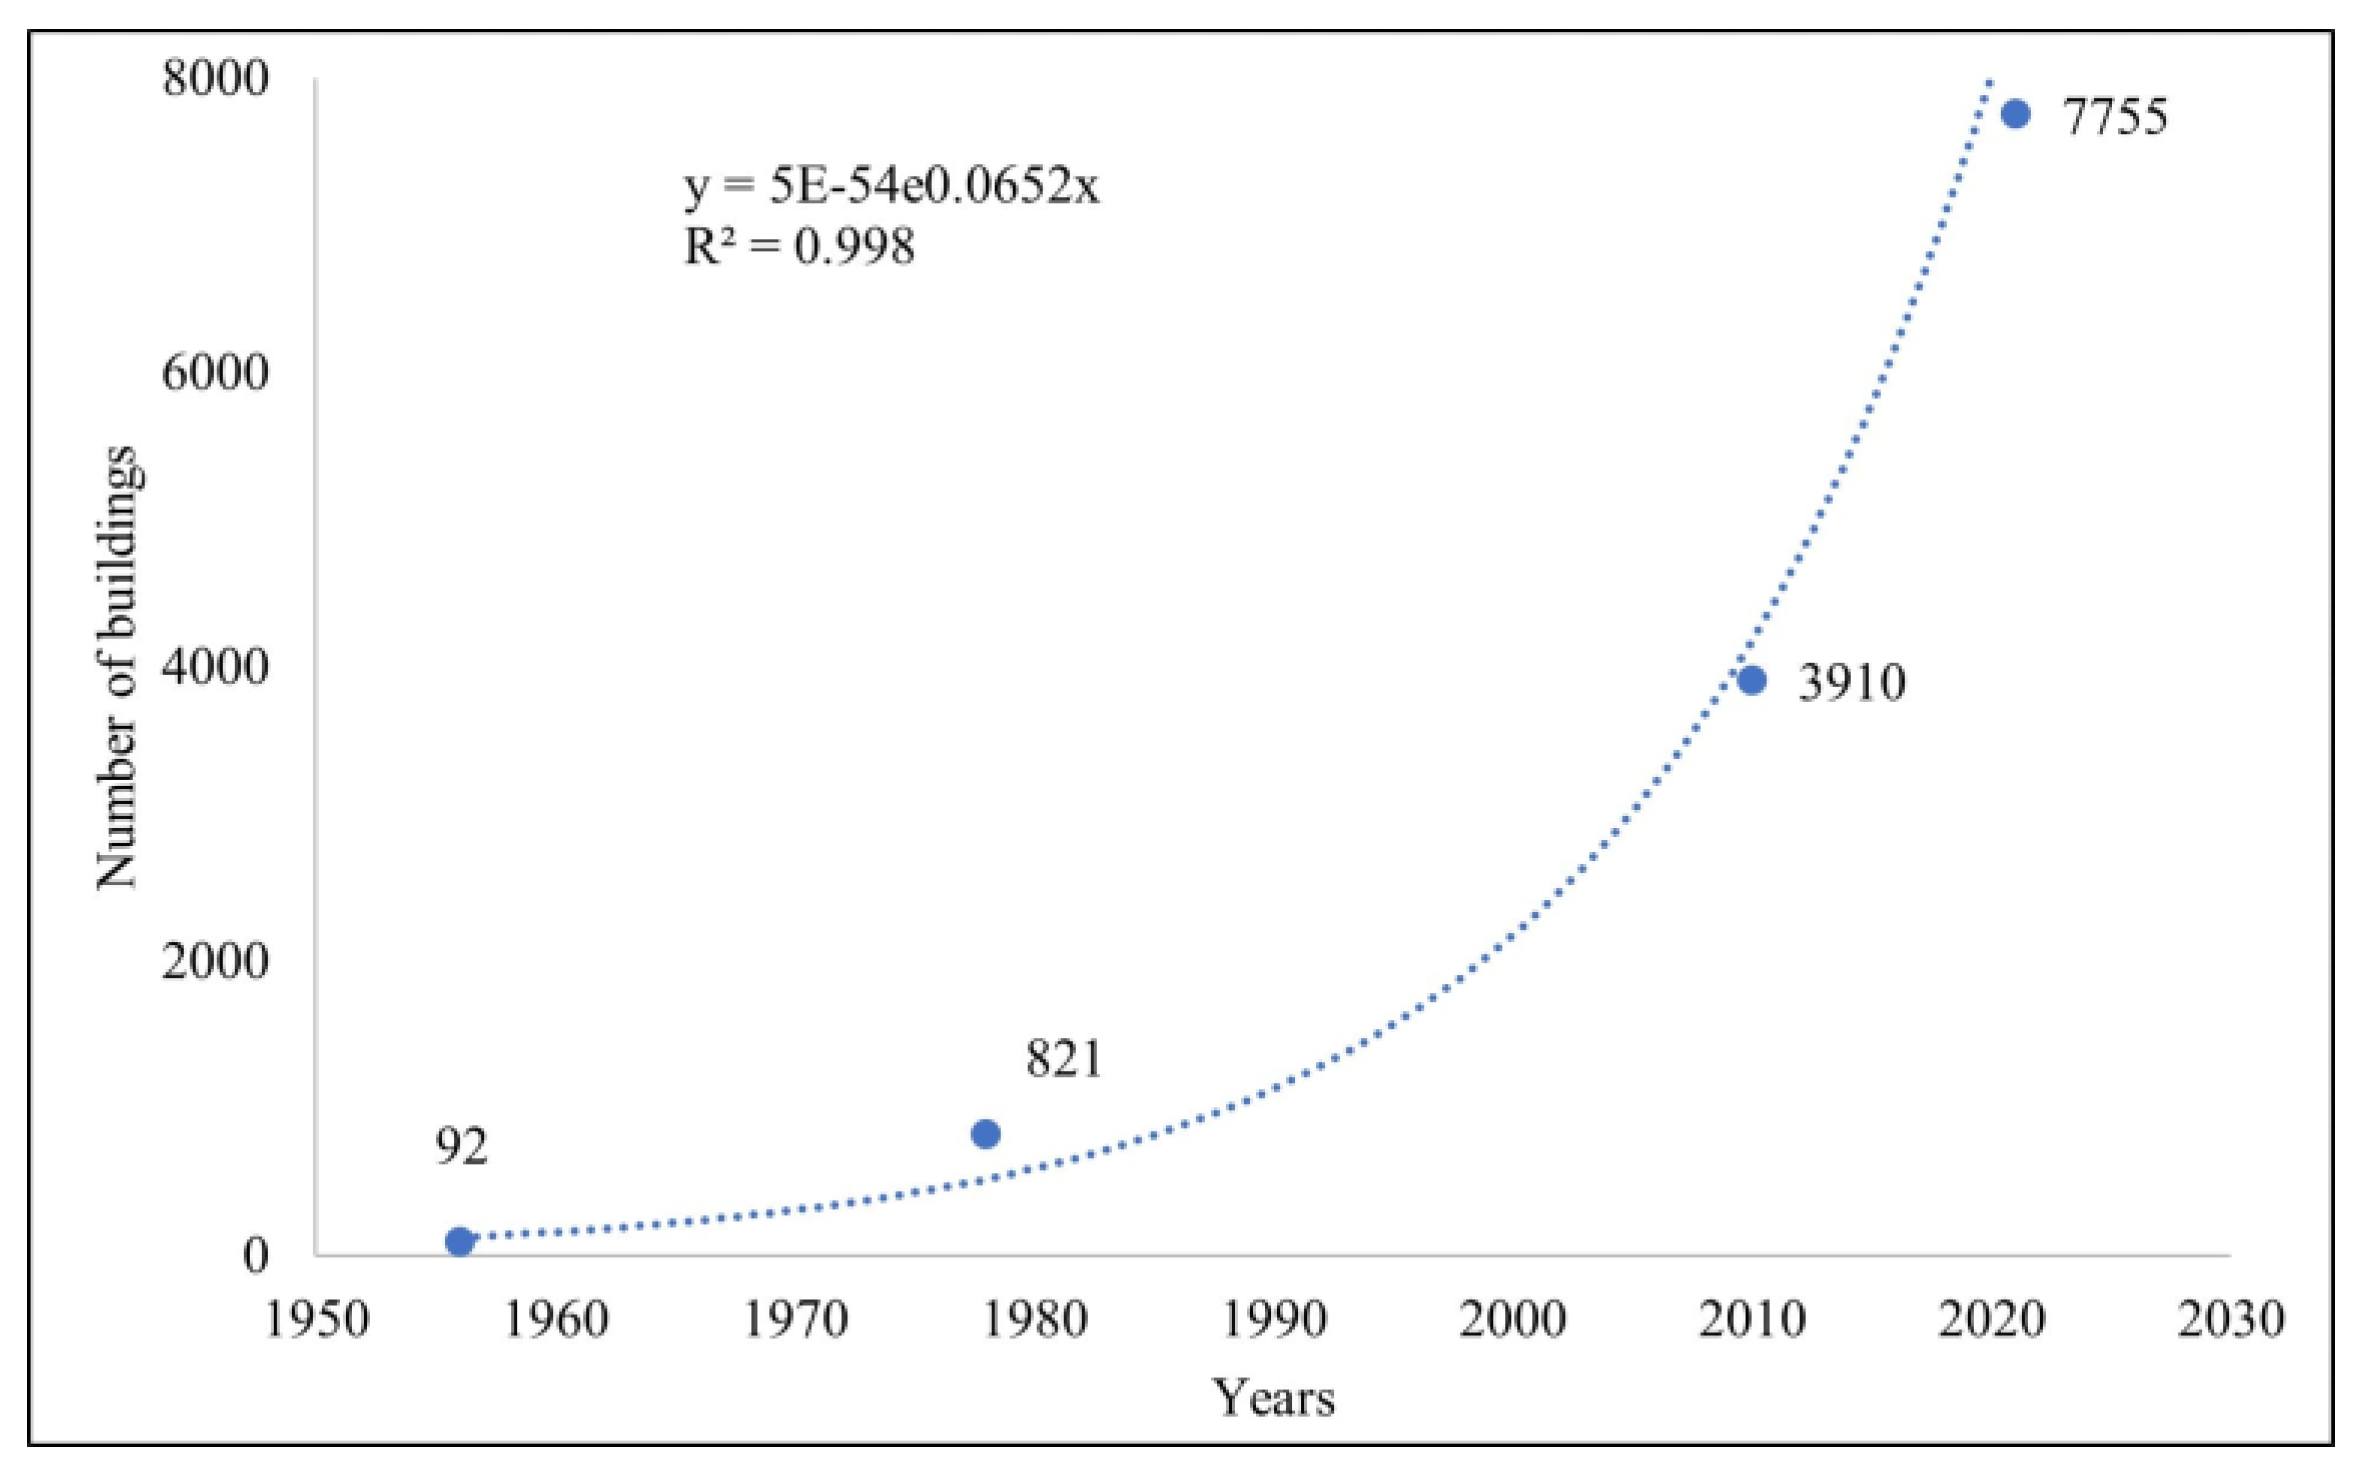
Figure 7.
The regional urban sprawl in the coastal plain of Rio Grande do Sul (CPRS) in the period 1985–2019.
Figure 7.
The regional urban sprawl in the coastal plain of Rio Grande do Sul (CPRS) in the period 1985–2019.
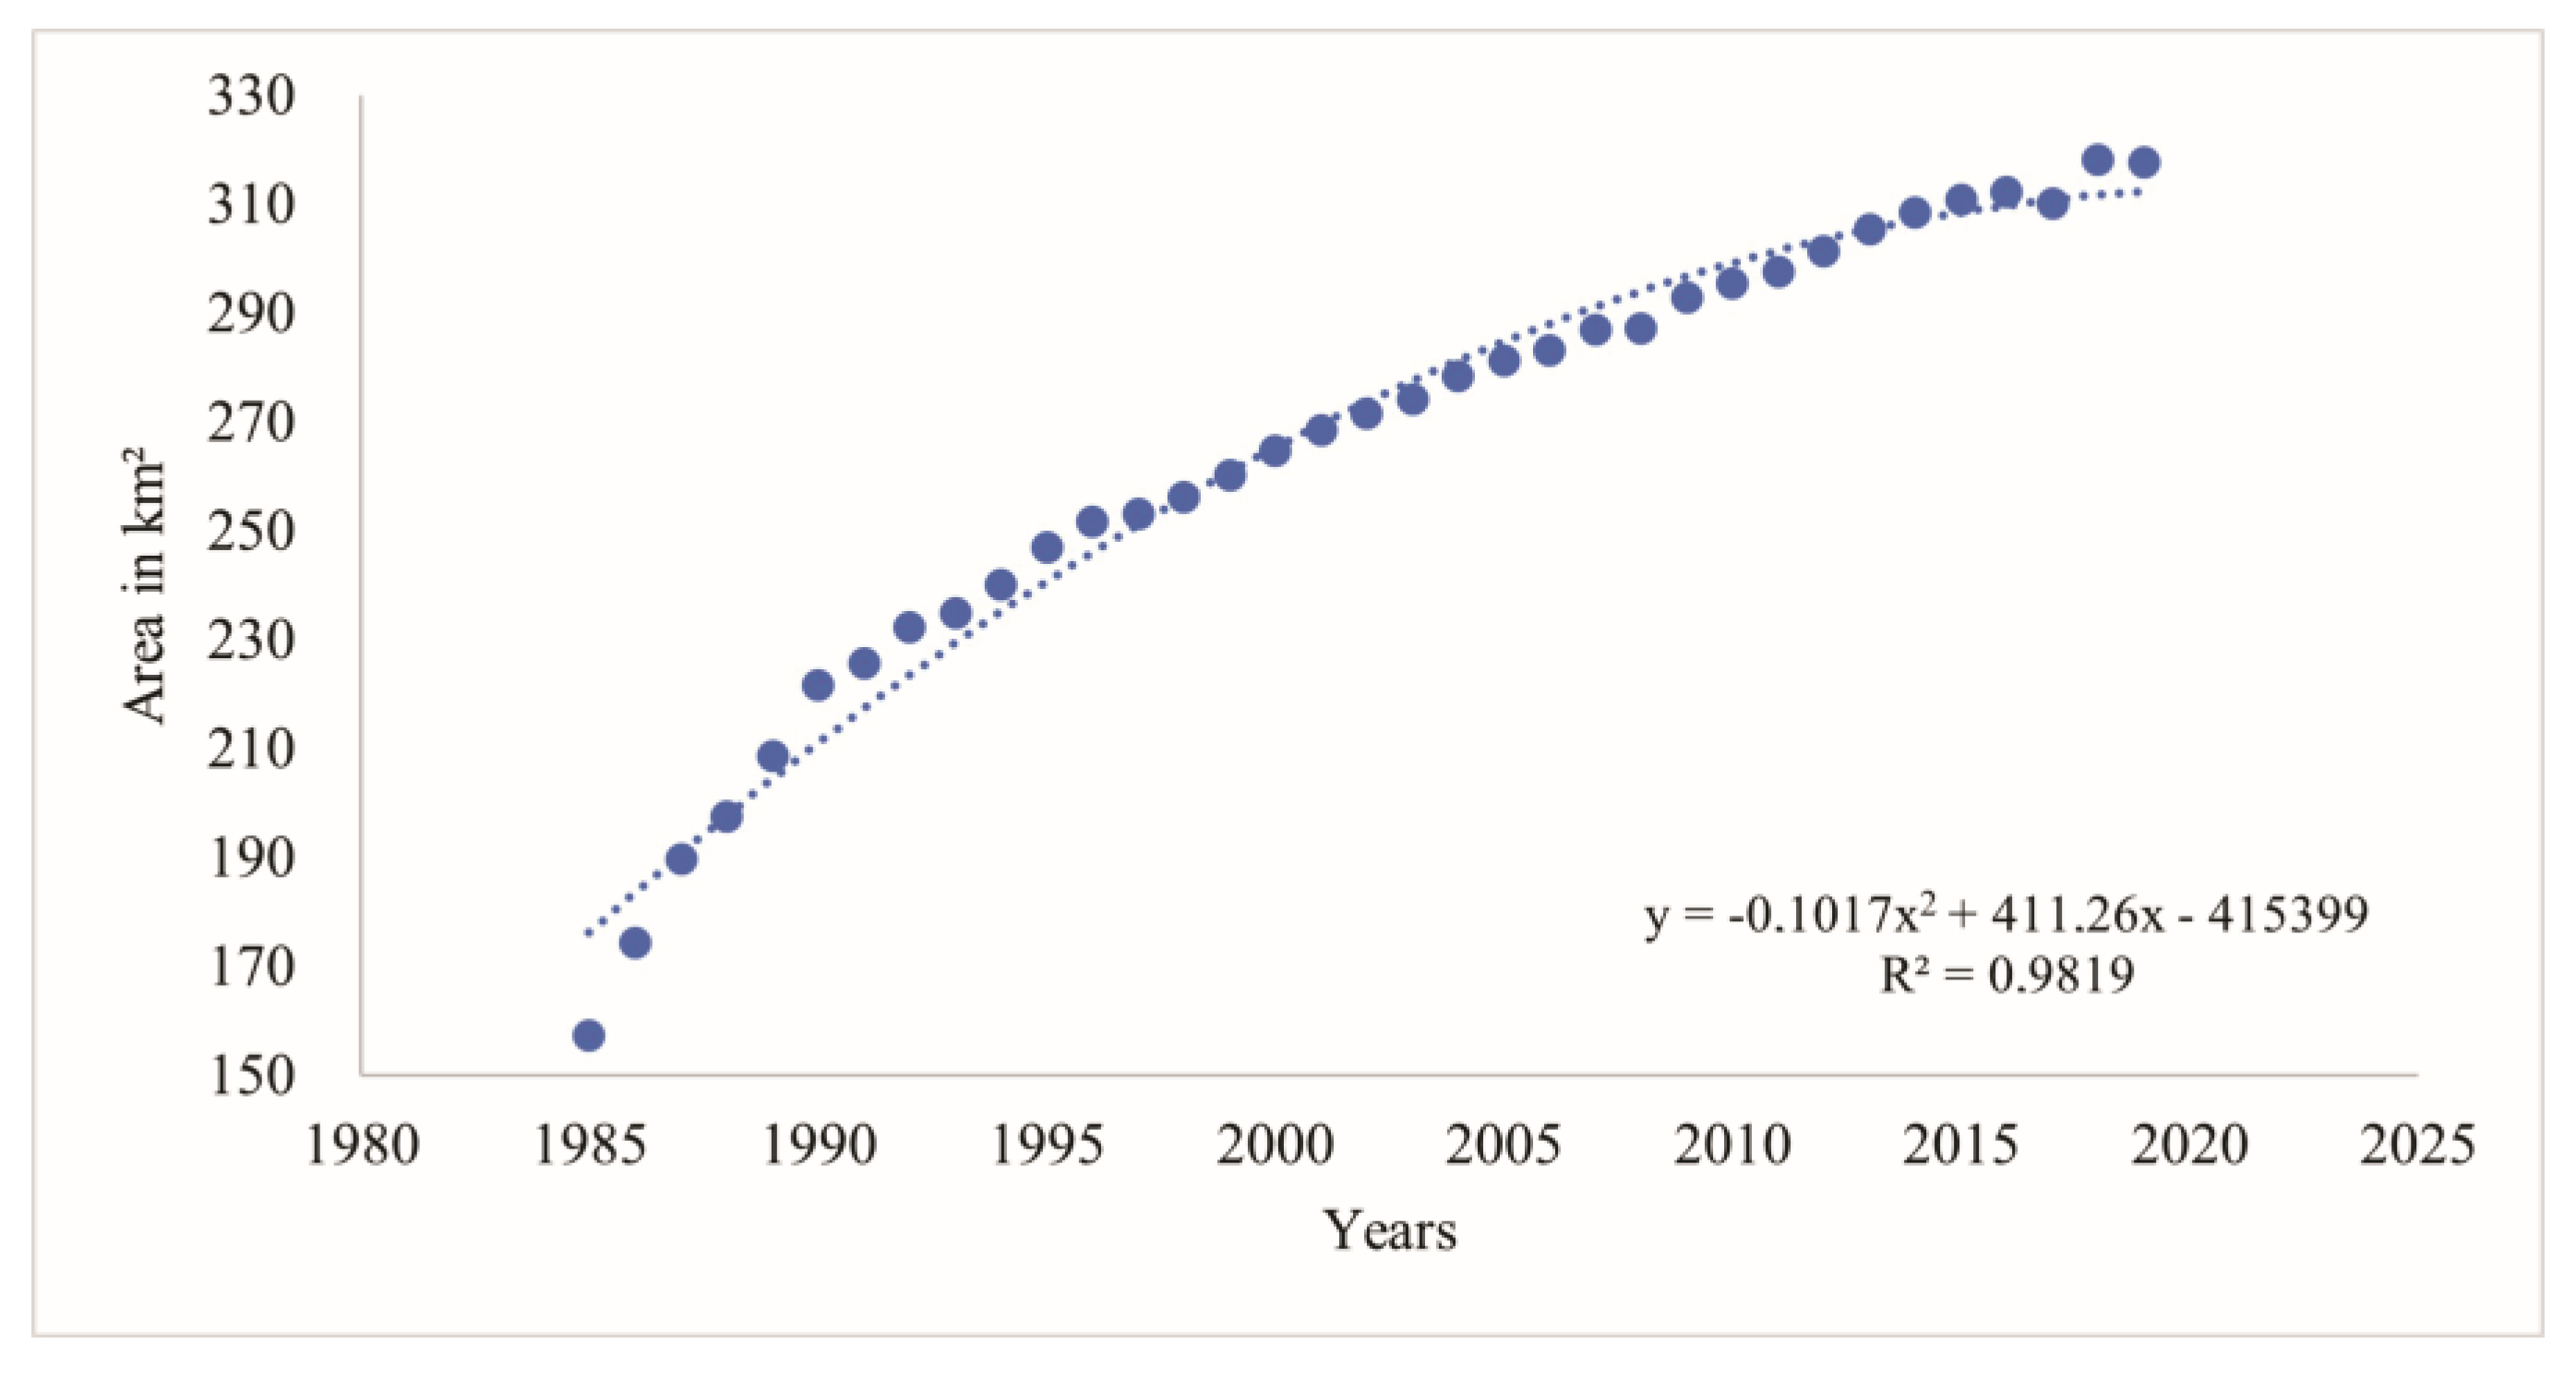
Figure 8.
Human population of Balneário Gaivota from 1996 to 2020 and population geometric growth projections for 2030, 2040, and 2050.
Figure 8.
Human population of Balneário Gaivota from 1996 to 2020 and population geometric growth projections for 2030, 2040, and 2050.
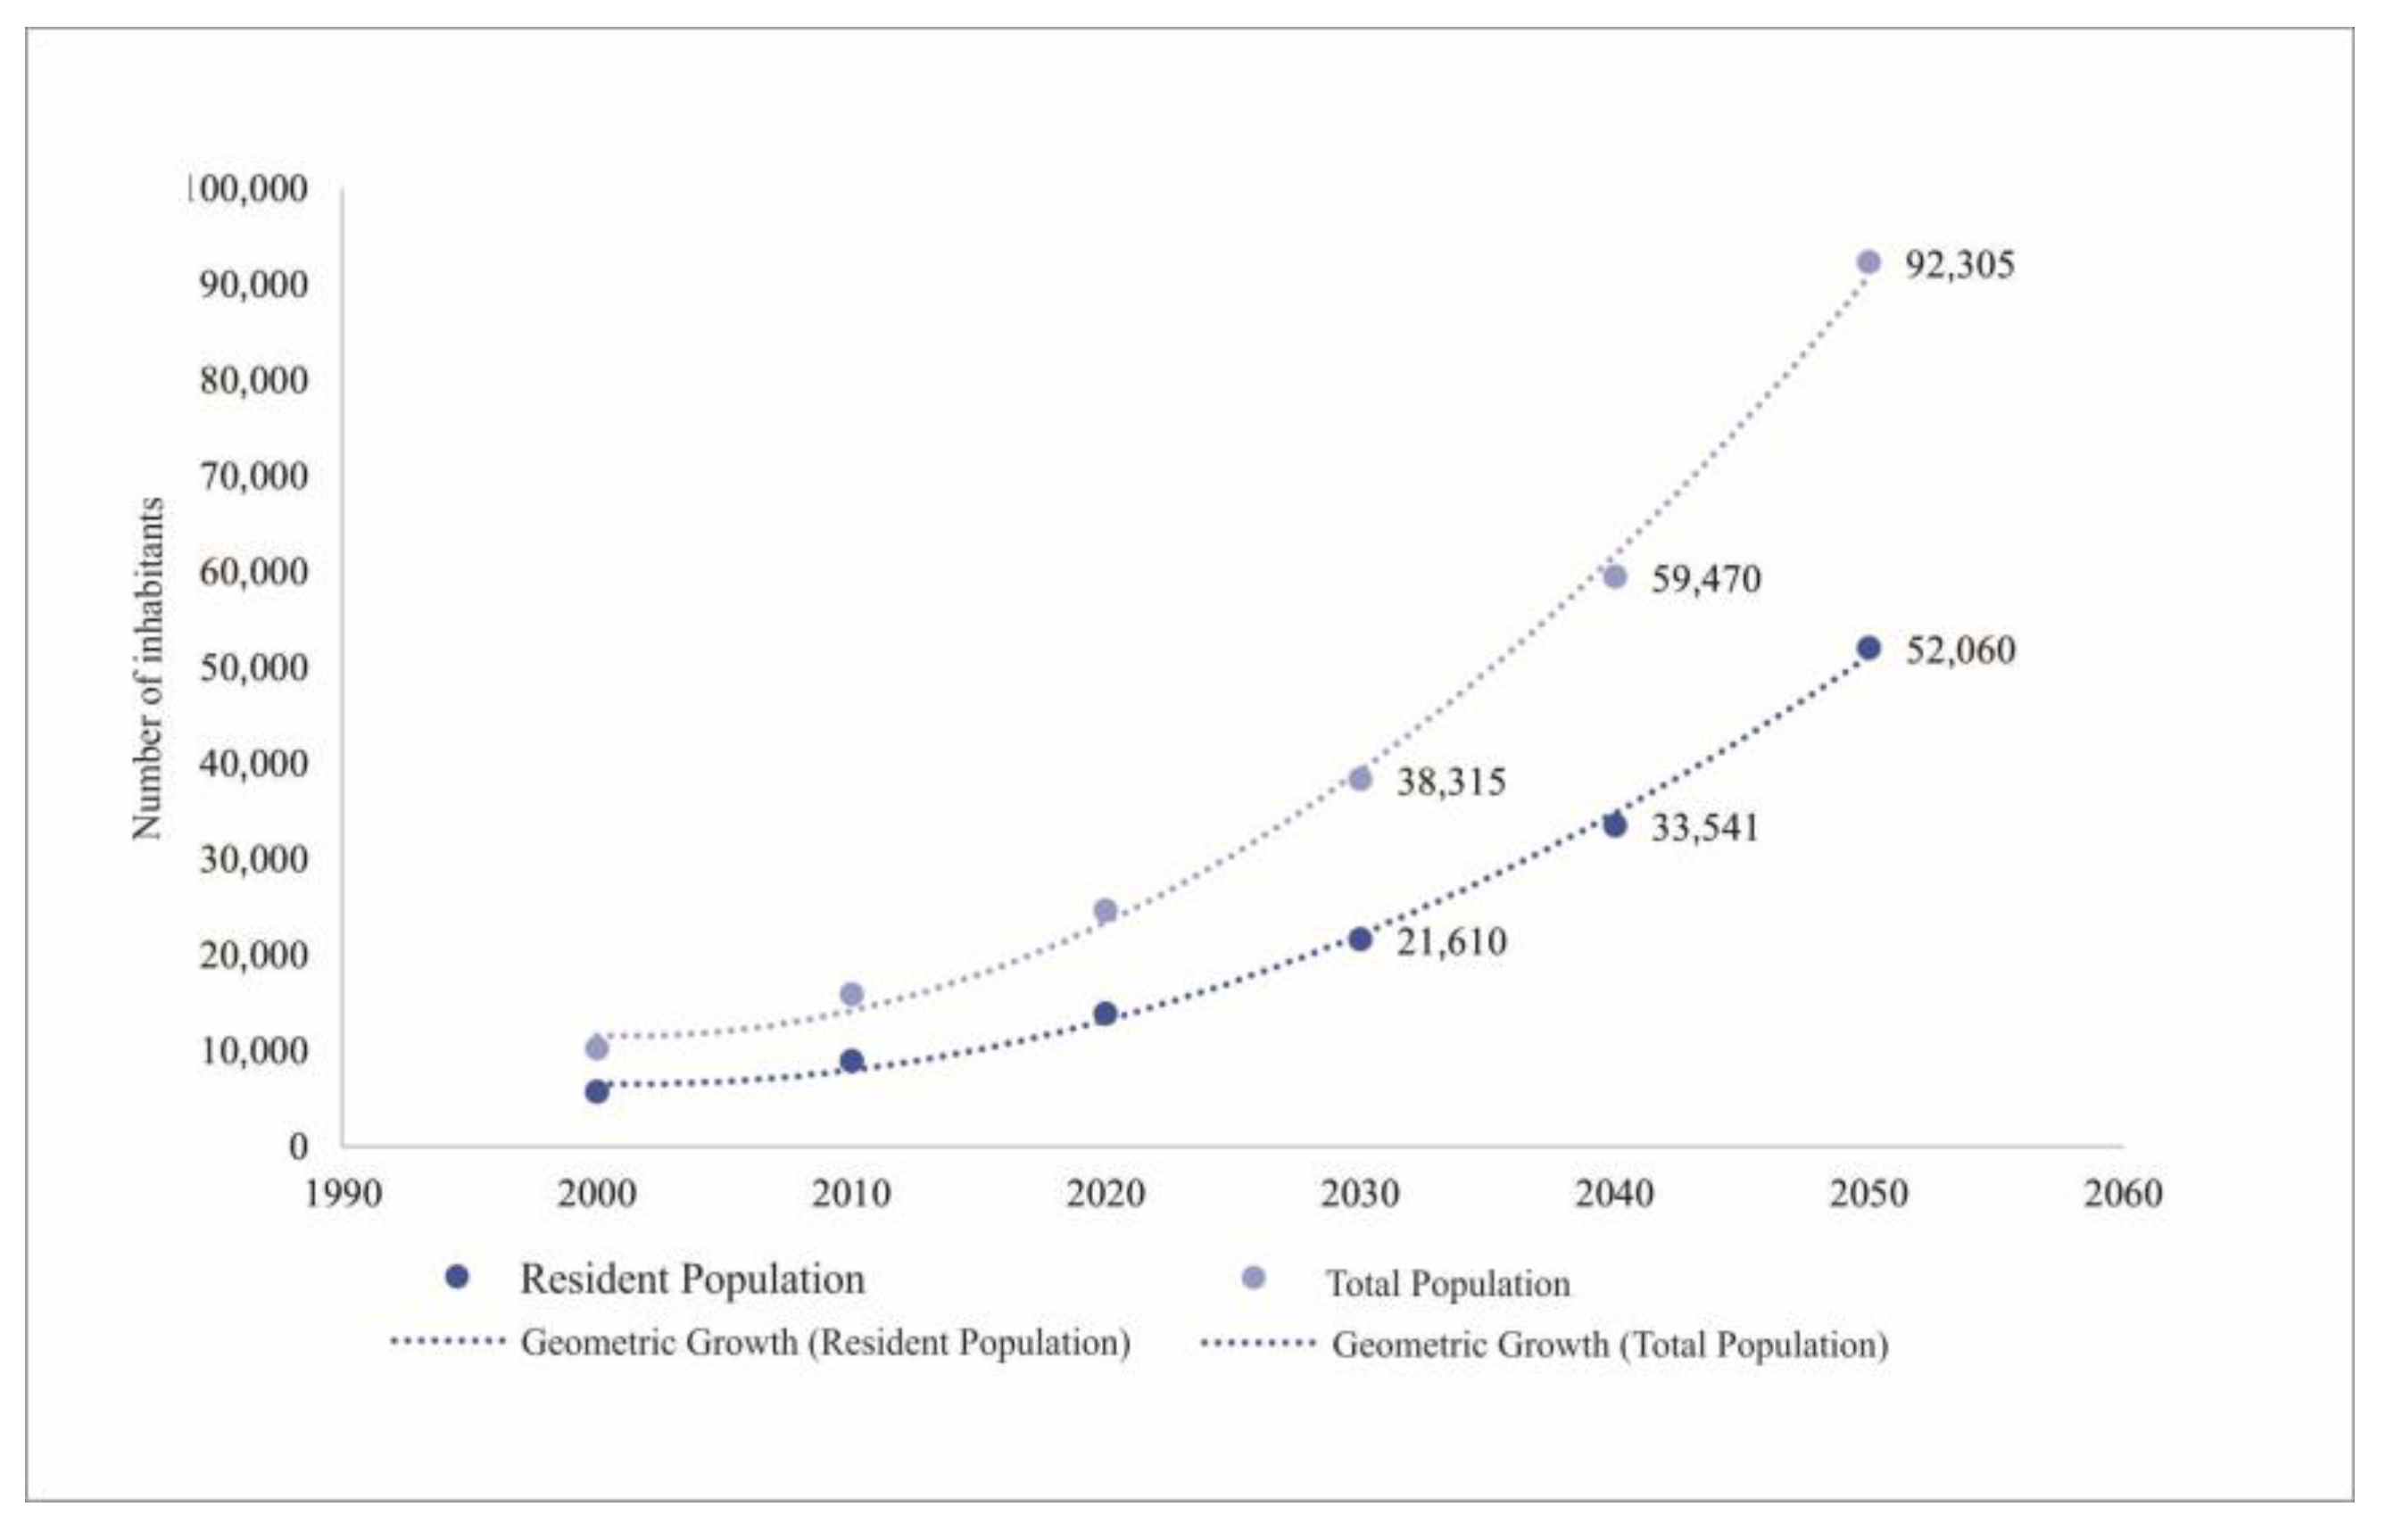
Figure 9.
Variations in the areas occupied by the water blade of the lagoons present in the municipality of Balneário Gaivota, south of Santa Catarina state, southern Brazil, during 1980–2021.
Figure 9.
Variations in the areas occupied by the water blade of the lagoons present in the municipality of Balneário Gaivota, south of Santa Catarina state, southern Brazil, during 1980–2021.
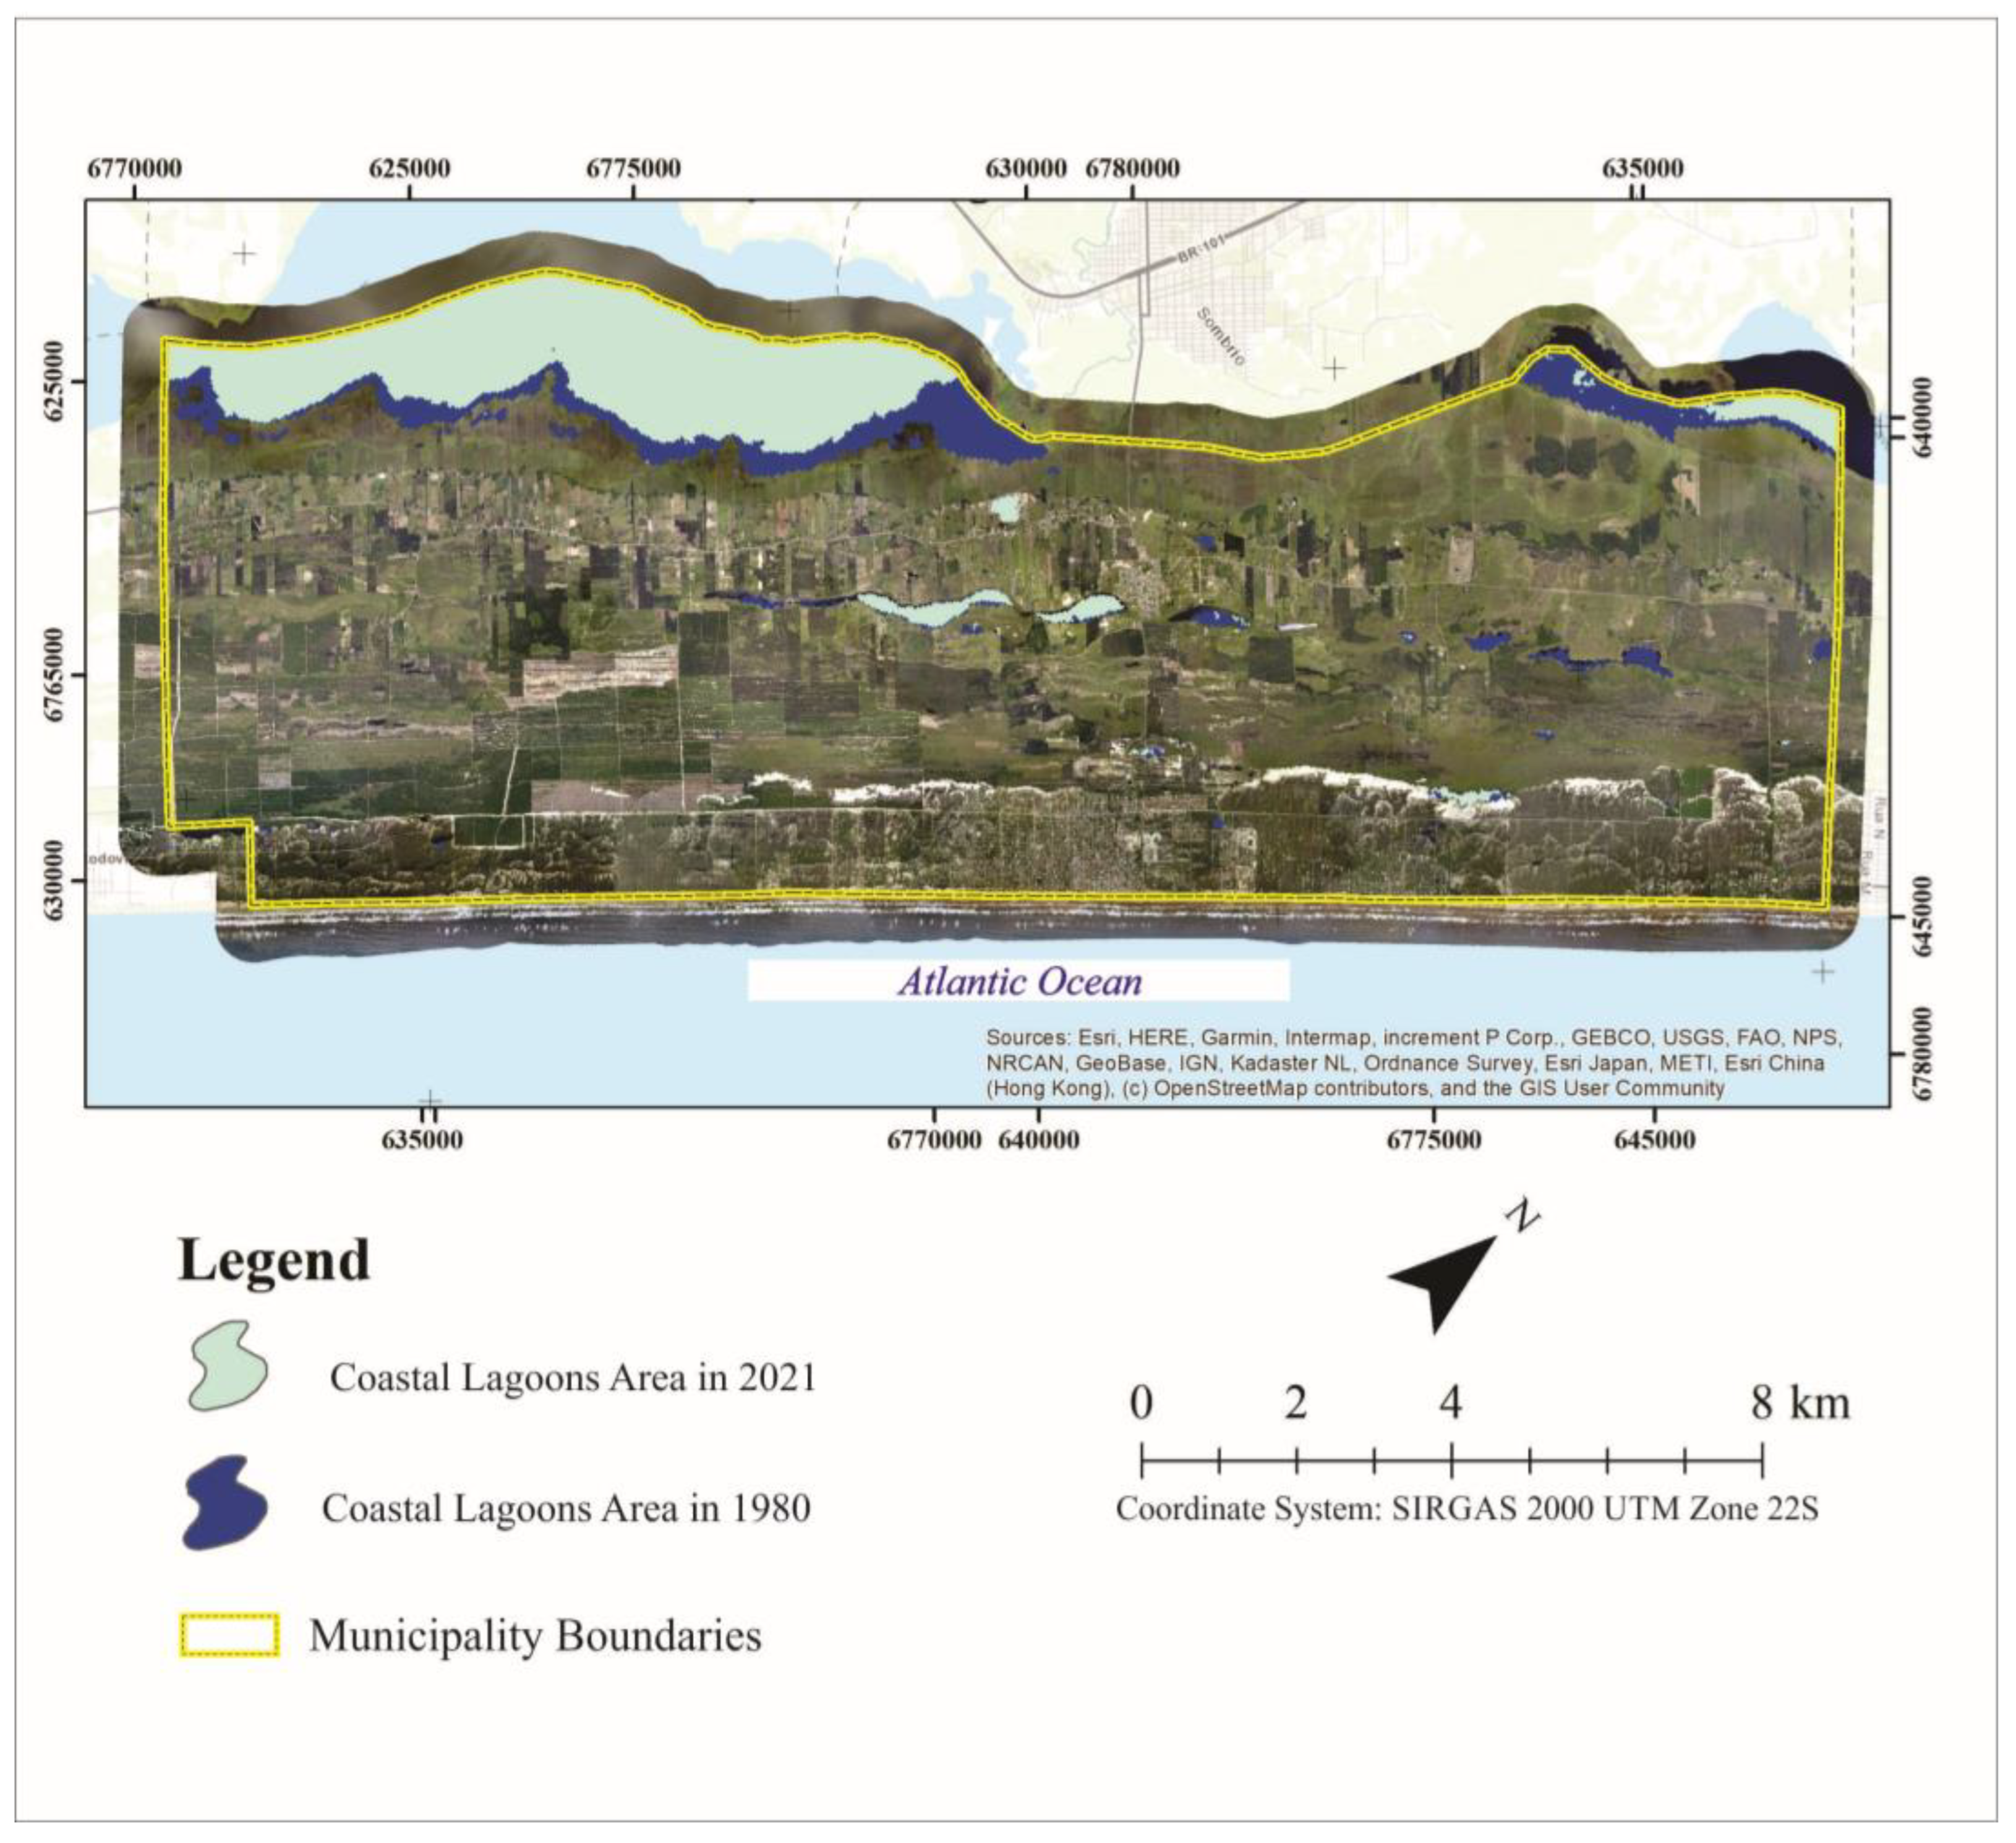
Figure 10.
Projections of the surface reduction of coastal lagoons in the municipality of Balneário Gaivota, south of Santa Catarina state, southern Brazil for 2030, 2040, and 2050.
Figure 10.
Projections of the surface reduction of coastal lagoons in the municipality of Balneário Gaivota, south of Santa Catarina state, southern Brazil for 2030, 2040, and 2050.
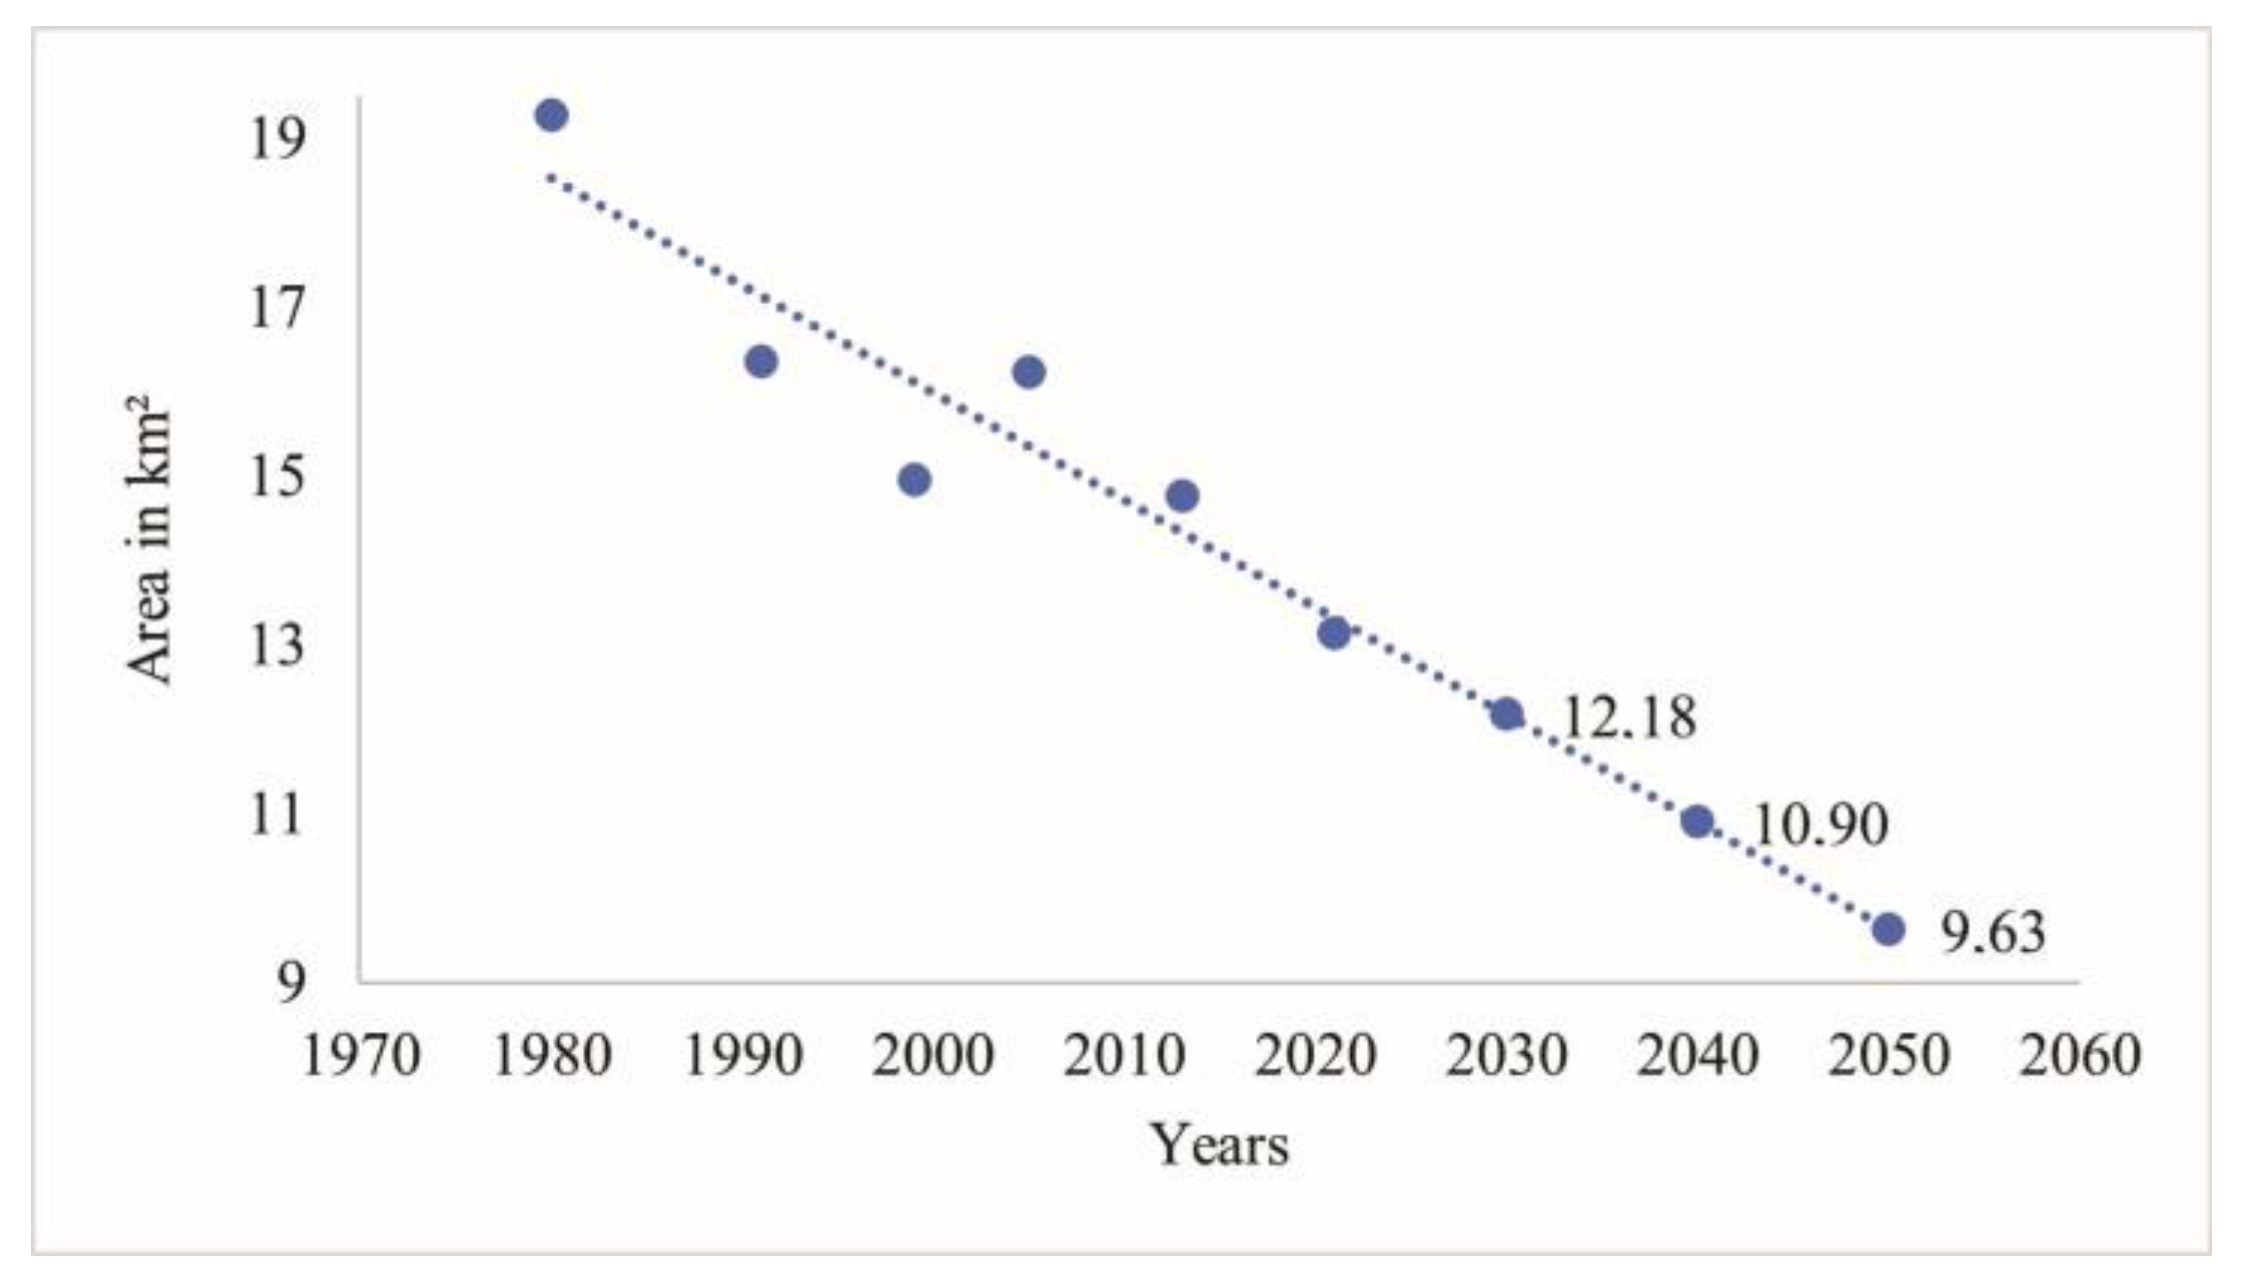
Figure 11.
Estimated progression of water consumption flow for supply of human demand in the municipality of Balneário Gaivota, south of Santa Catarina State, southern Brazil, for 2030, 2040 and 2050.
Figure 11.
Estimated progression of water consumption flow for supply of human demand in the municipality of Balneário Gaivota, south of Santa Catarina State, southern Brazil, for 2030, 2040 and 2050.
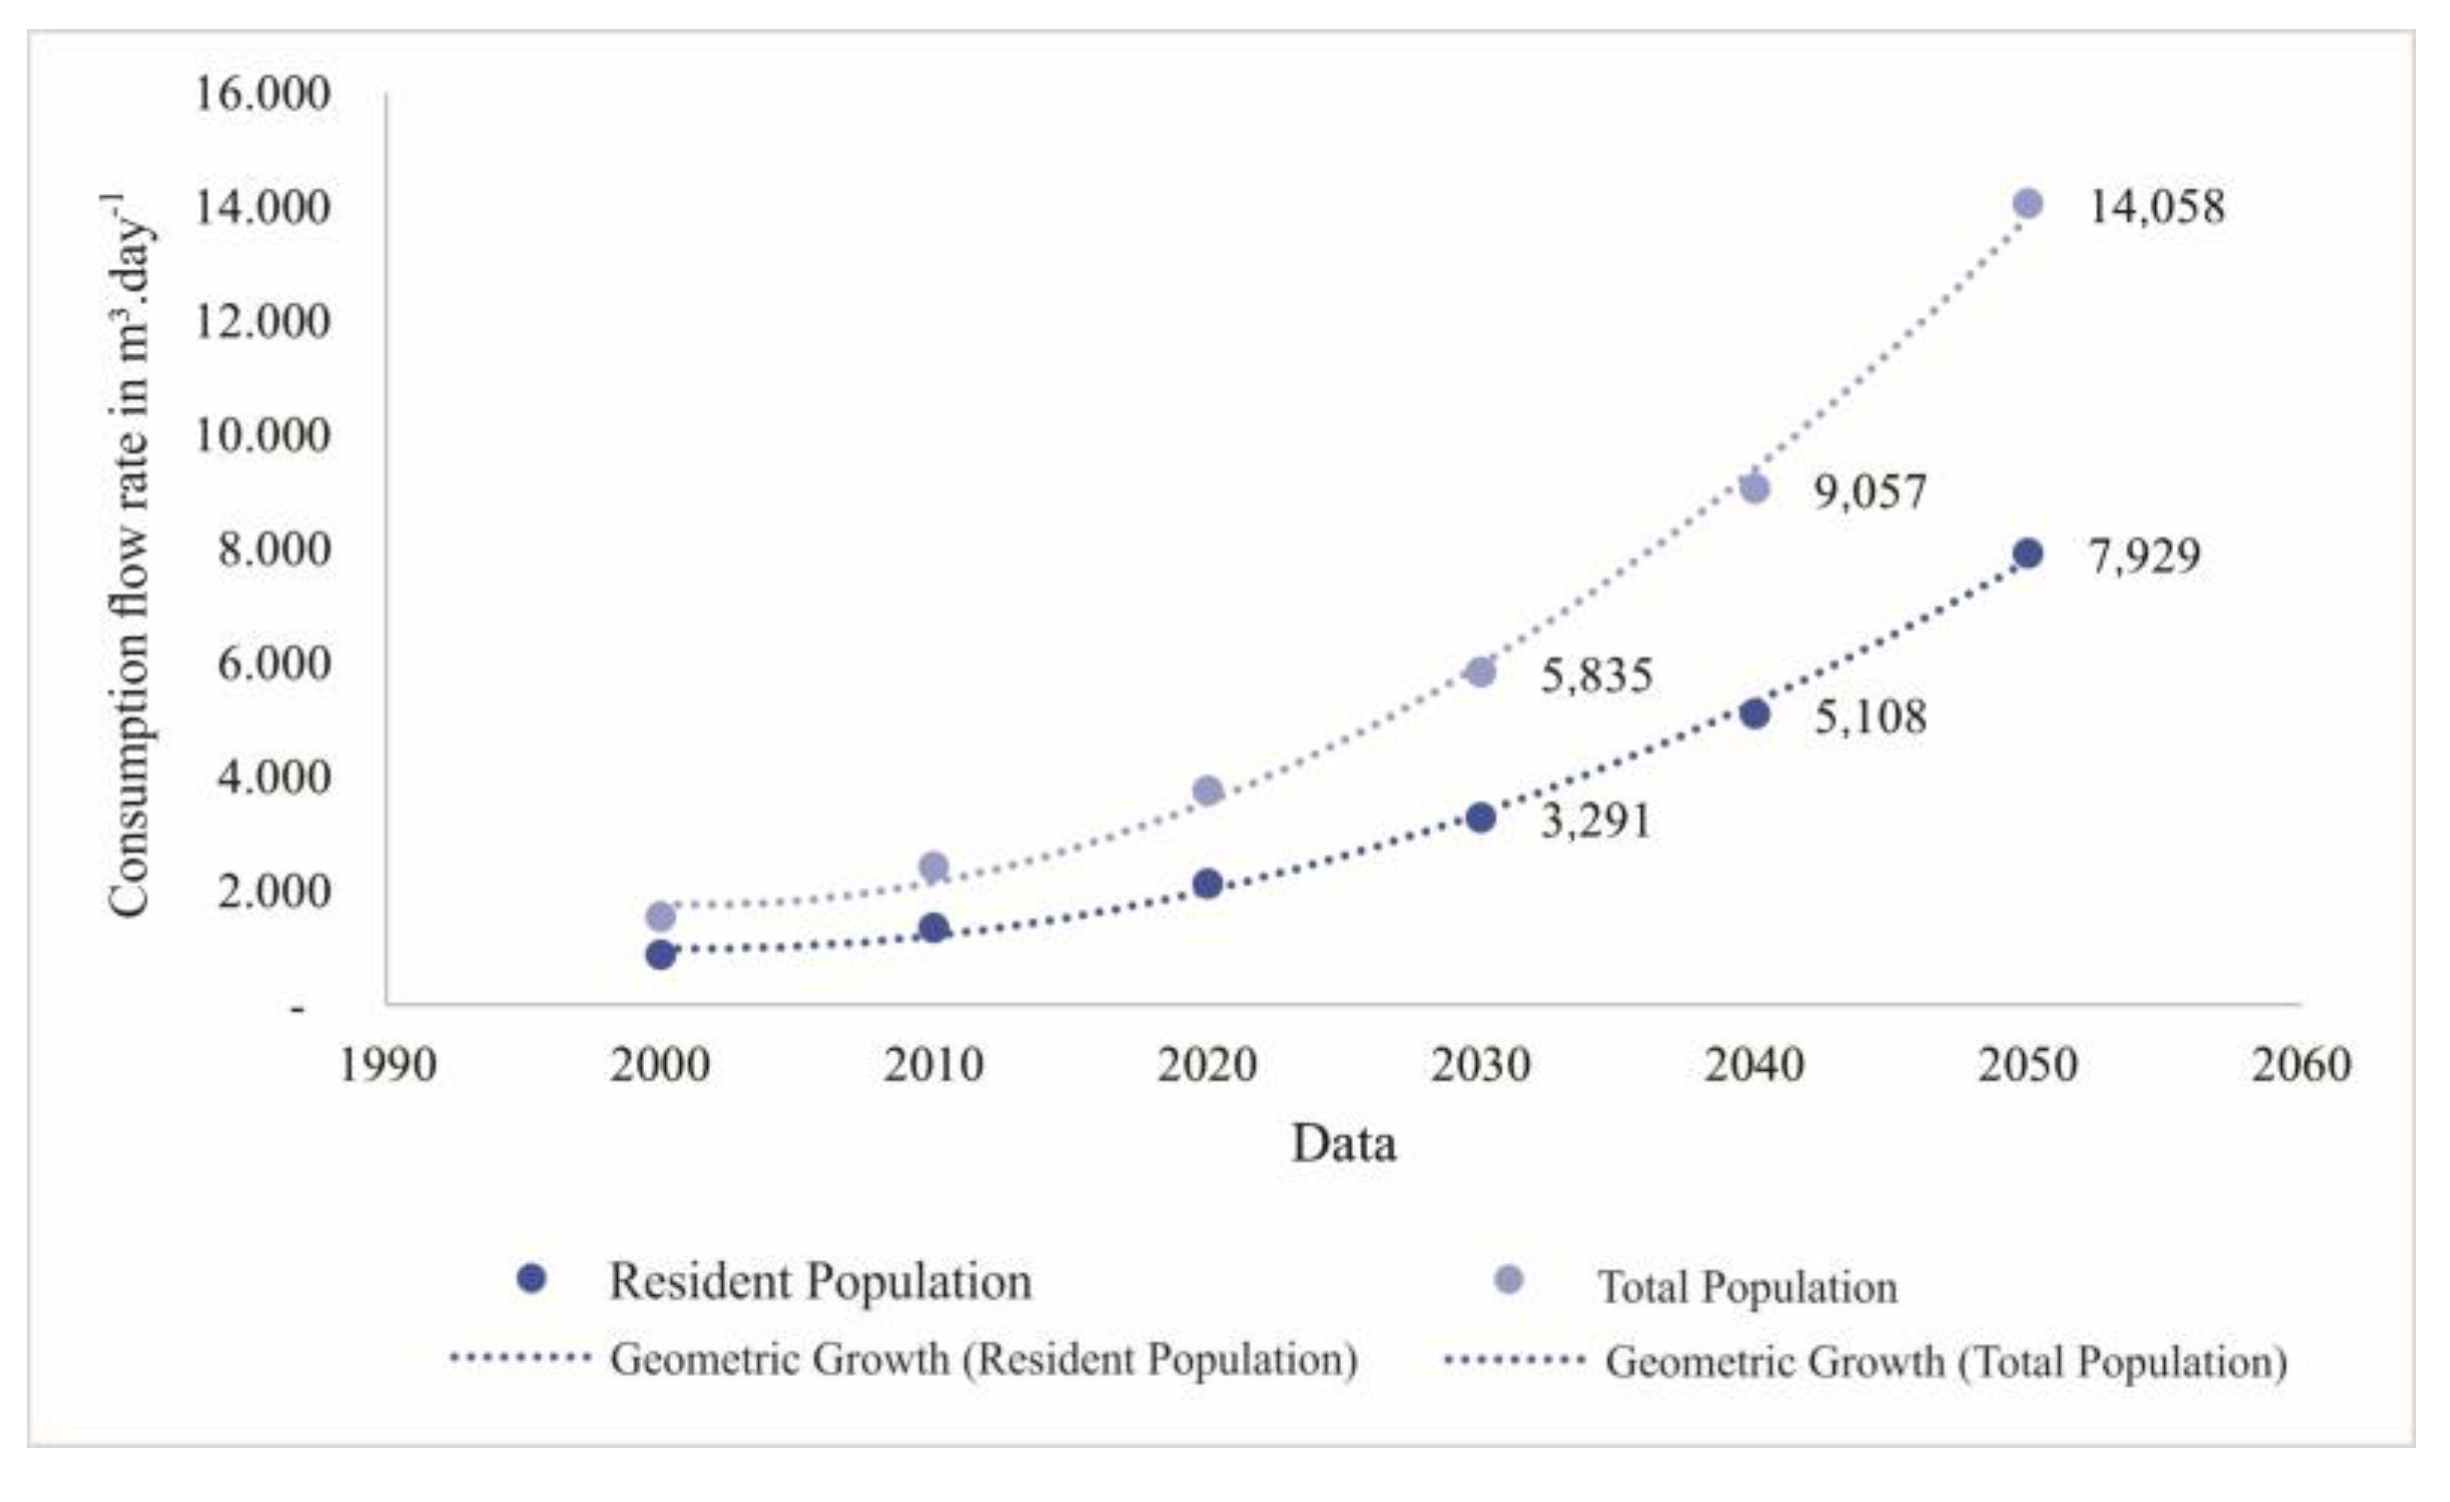

Table 1.
Spatial dynamics of the surface water blade of coastal lagoons present in the municipality of Balneário Gaivota, south of Santa Catarina state, southern Brazil, in the period 1980–2021.
Table 1.
Spatial dynamics of the surface water blade of coastal lagoons present in the municipality of Balneário Gaivota, south of Santa Catarina state, southern Brazil, in the period 1980–2021.
| Years | Months | Rainfall (mm) | Area (km2) | Percentage of Reduction |
|---|---|---|---|---|
| 1980 | November | 109.8 | 19.3 | 0 |
| 1991 | January | 102.2 | 16.4 | 15.1 |
| 1999 | January | 83.1 | 14.9 | 22.4 |
| 2005 | November | 128.9 | 16.2 | 15.8 |
| 2013 | December | 98.7 | 18.8 | 23.4 |
| 2021 | January | 140.5 | 13.1 | 31.8 |
Disclaimer/Publisher’s Note: The statements, opinions and data contained in all publications are solely those of the individual author(s) and contributor(s) and not of MDPI and/or the editor(s). MDPI and/or the editor(s) disclaim responsibility for any injury to people or property resulting from any ideas, methods, instructions or products referred to in the content. |
© 2025 by the authors. Licensee MDPI, Basel, Switzerland. This article is an open access article distributed under the terms and conditions of the Creative Commons Attribution (CC BY) license (http://creativecommons.org/licenses/by/4.0/).
Copyright: This open access article is published under a Creative Commons CC BY 4.0 license, which permit the free download, distribution, and reuse, provided that the author and preprint are cited in any reuse.


