
Submitted:
26 December 2025
Posted:
29 December 2025
You are already at the latest version
Abstract
Eletromobility is increasingly recognized as a cornerstone of sustainable transport, yet its adoption remains uneven across regions. Addressing these challenges requires planning approaches that extend beyond urban centers and operate at the national scale to ensure equitable and coordinated deployment of fast-charging networks. This study develops an integrated framework that combines geospatial analysis, multi-criteria decision-making (MCDM), and power system evaluation to identify and prioritize fast-charging sites. The framework incorporates spatial suitability, socioeconomic and demand-driven priorities, and grid readiness under projected electric vehicle (EV) penetration scenarios. Its applicability is demonstrated through a national-scale case study of Costa Rica, encompassing the country’s socioeconomic conditions, electric grid, and national road network (NRN). The results demonstrate that such a strategy is both feasible and essential to supporting inclusive EV adoption across diverse territorial contexts, from metropolitan corridors to peripheral regions. While grounded in Costa Rica, the framework is designed to be transferable, providing a practical tool for other countries seeking to align EV infrastructure planning with short-, mid-, and long-term sustainability and decarbonization objectives in the private transport sector.
Keywords:
electric vehicles (EVs)
; fast-charging stations
; GIS-based spatial distribution
; hosting capacity
; distributed generation
; Technique for Order Preference by Similarity to Ideal Solution (TOPSIS)
; Pareto principle
; multi-criteria decision-making (MCDM)
; annual average daily traffic
; national road network
1. Introduction
The global transition to electromobility has advanced unevenly. In many emerging and developing economies, limited charging infrastructure and weak political commitment have constrained widespread adoption [1]. By contrast, in countries where electric mobility has gained momentum, the shift has accelerated in recent years, with electric vehicles (EVs) becoming a central element of national decarbonization strategies [2]. Paradoxically, however, this progress is often tempered by hesitation, underscoring the urgent need for a more decisive and coordinated rollout of fast-charging infrastructure [3]. Such urgency is equally pressing in contexts where electromobility remains a low priority, as the absence of political will continues to delay meaningful progress.
Beyond policy ambition and infrastructure deployment, a persistent behavioral challenge continues to shape adoption patterns: range anxiety [4,5,6,7]. The slow, or stalled, advancement of electromobility, particularly in the private transport sector, is frequently attributed to this concern. Although environmental policies and transport incentives seek to accelerate the shift, the strategic and reliable siting of fast-charging stations remains a critical barrier. For many current and prospective EV users, the fear of being stranded mid-journey without immediate access to recharging is not a hypothetical inconvenience but a decisive deterrent.
The literature identifies two primary strategies to mitigate range anxiety. As noted by Pevec et al. [4], the concern can be addressed either by extending EV autonomy or by improving the availability and spatial coverage of charging infrastructure, with a strong emphasis on user perceptions of accessibility and adequacy. Complementing this, Shrestha et al. [5] propose three mitigation measures, reinforcing the importance of infrastructure expansion while stressing optimized siting. Taken together, these studies highlight that expanding the spatial distribution of charging points not only enhances user confidence but also reduces battery degradation, thereby extending battery lifespan.
While advances in EV batteries, enabling higher energy density and extended driving ranges, continue, it remains timely and essential to examine how and, more importantly, where fast-charging stations should be deployed [8], with particular attention to public accessibility and unrestricted availability. Yet despite more than fifteen years of research on charging infrastructure siting, a fundamental question persists: how far have current approaches progressed, and are they adequately addressing the most critical dimensions of the problem?
Although the body of literature on charging infrastructure siting is extensive, most studies address these dimensions in isolation, focusing on spatial suitability, user preferences, grid readiness, or limited combinations such as spatial suitability with grid readiness, spatial suitability with user preferences, or user preferences with grid readiness, rather than integrating them into a unified decision-making framework. This fragmentation risks overlooking critical interactions between geographic, behavioral, and technical factors that jointly determine the feasibility and long-term effectiveness of deployment strategies [9,10,11].
To address this gap, this study reviews three dominant methodological streams that have guided efforts to identify optimal locations for fast-charging infrastructure. The review examines how the problem has been conceptualized and approached to date, providing the foundation for charting a more strategic and impactful path forward. In doing so, the objective is not only to reflect on previous contributions and their influence on this work but also to underscore how the present study offers a distinct and valuable perspective on a challenge of enduring importance.
The structure of this study is as follows. The first part reviews the literature, organizing existing contributions into three main methodological streams: geospatial and optimization-based siting models, multi-criteria decision-making (MCDM) frameworks, and power system analysis and grid readiness evaluation. Building on this foundation, the methodology section introduces the proposed framework, detailing the data sources, the selection of MCDM criteria, the refinement of analytical procedures, and the modeling of Costa Rica’s national electric system (NES).
The third part applies the framework in a national-scale case study of Costa Rica, presenting both the geospatial prioritization of fast-charging sites and the outcomes of power system simulations under mid-term scenarios. The discussion then interprets these findings in relation to previous studies, emphasizing their significance for nationwide-scale planning. Finally, the study concludes by synthesizing its main results, underscoring its contributions, acknowledging its limitations, and identifying avenues for future research.
2. Literature Review
2.1. Geospatial and Optimization-Based Siting Models
In infrastructure planning, the application of geospatial tools, particularly GIS, has considerably broadened the scope of spatial analysis [12]. Their ability to generate tailored cartographic outputs and to reveal hidden patterns and relationships within spatial datasets has made them indispensable in contemporary decision-making processes [13]. In the specific context of fast-charging infrastructure, GIS functions not only as a robust decision-support tool but also as a framework through which the siting problem can be structured and dimensioned.
Within this literature, Bayram et al. [14] present a GIS-based coverage optimization of urban fast-charging networks, leveraging the spatial distribution of existing petrol stations. Using a maximum coverage location problem (MCLP) formulation, they compared the performance of petrol stations and existing EV chargers in maximizing demand coverage across five U.S. cities. In their approach, GIS was used primarily for preprocessing spatial data and visualizing results, rather than as the direct mechanism for determining siting decisions.
In parallel, Liu et al. [15] emphasized the spatial characteristics of charging station deployment by modeling the road network as a directed graph, in which vehicle agents traverse from origin to destination subject to battery and demand constraints. They formulated the location problem as a Markov decision process (MDP) and implemented a reinforcement learning (RL) framework enhanced with an attention mechanism. Although GIS was not explicitly integrated, the network’s spatial typology and the interactions between agents and infrastructure remained central to their siting strategy, thereby positioning the study firmly within the category of geospatially informed optimization models.
2.2. MCDM Frameworks
Decision-making, by definition, is an evaluative process in which one option is selected from two or more alternatives. Importantly, this process does not necessarily guarantee the identification of the "correct" or "most optimal" solution [16]. While such "uncertainty" might be perceived as a limitation, it also provides a strategic opportunity, particularly in siting decisions, to navigate complex trade-offs in alignment with contextual objectives, policy priorities, and implementation constraints.
An illustrative example is offered by Choi et al. [17] and Bayram et al. [14], who propose repurposing existing gas station sites for EV charging infrastructure. This strategy prioritizes resource efficiency by reducing the need for additional land acquisition and mitigating potential land-use conflicts. To operationalize their approach, the authors applied a two-stage methodology: a fuzzy analytic hierarchy process (FAHP) was used to assign weights to key siting criteria, followed by a genetic algorithm (GA) to optimize the placement of charging stations according to these weighted priorities.
In a related contribution, Alrifaie et al. [18] adopt a user-centric approach by developing the personalized charging station selection scheme (PC3S) model for charging station selection. This framework incorporates multiple user-defined criteria, including travel distance, waiting time, charging duration, and price, to rank stations according to individual preferences. To account for the uncertainty and subjectivity inherent in user input, FAHP was employed once again to weigh each criterion. These weights were then incorporated into TOPSIS, which ranks alternatives according to their relative closeness to the ideal solution. This approach likewise illustrates a dual-stage process, combining qualitative and quantitative dimensions into a structured, transparent, and replicable decision-making framework.
The deliberate limitation to two criteria, as shown in Table 1, reflects a strategic emphasis on methodological parsimony without sacrificing analytical rigor. While other studies employ more complex multi-criteria frameworks or fuzzy logic approaches, the two-criterion TOPSIS implementation maximizes transparency, ensures replicability across different geographical contexts, and focuses the analysis exclusively on the fundamental drivers of EV fast-charging infrastructure demand: where vehicles travel and where they require recharging operationally.
2.3. Power System Analysis and Grid Readiness Evaluation
Anticipating the technical implications of fast-charging infrastructure on distribution networks (DNs) is essential and should not be overlooked in planning efforts. A well-established approach to demand forecasting involves estimating load profiles before running network simulations. In the context of fast-charging infrastructure, Lopes et al. [21] examined optimal connection points and the reinforcements required in DNs to accommodate electromobility demand. Their study integrated transport simulation, state-of-charge (SoC) dynamics, and EV adoption forecasts to estimate peak demand, simultaneity, diversity, and load factors in multiple penetration scenarios.
Complementing this perspective, Keramati et al. [22] proposed a grid-oriented methodology in which candidate sites were initially filtered through GIS-based multi-criteria analysis, and subsequently evaluated using detailed power system simulations. In the second stage, they applied a mixed-integer nonlinear programming (MINLP) model to assess a 162-node DN in Kabul, optimizing for active power losses, voltage deviation, and installation costs. Their findings highlight the importance of moving beyond spatial suitability alone and explicitly incorporating grid-level constraints when planning high-capacity charging infrastructure.
As summarized in Table 2, existing studies have made valuable contributions to EV fast-charging infrastructure planning, yet most remained constrained by geographic scope, methodological focus, or limited integration across planning dimensions. The present framework addresses the gap by combining national-scale spatial analysis, transparent multi-criteria prioritization, and comprehensive grid-readiness evaluation within a unified methodology applicable across diverse geographic contexts.
Although numerous studies have proposed methods for siting fast-charging stations and quantifying their impacts, a standard limitation persists: none have been conducted at a nationwide scale. Most research has focused on individual cities, often large metropolitan areas [14,15,16,18,21,22], and has tended to overlook broader national-level dynamics. This gap provided a unique opportunity to develop and apply a framework explicitly designed to address the challenge, with Costa Rica as the application context.
Adopting a countrywide perspective, particularly one that accounts for socioeconomic contrasts between highly urbanized and less developed regions, enables a more equitable and realistic vision for the future of electric mobility. The goals of sustainable transportation cannot be confined to levels of urban development [25]; where such development is limited, thoughtful infrastructure planning must compensate for those disparities to ensure inclusive outcomes.
Another recurring shortcoming across the literature is the absence of a national EV database. In most cases, analyses rely on a single representative vehicle model to estimate energy consumption or driving range, which then informs charger location decisions [26]. While this simplification reduces data demands, it fails to capture the real-world diversity of EV fleets, each with distinct charging capabilities and energy-use profiles. Without such detail, assessments of charging infrastructure performance under actual operating conditions remain incomplete.
Although fast chargers are intended to reduce recharging times, their effectiveness is ultimately constrained by the maximum input power each vehicle can accept [27,28]. Incorporating the full range of EV models into siting analyses therefore, adds a necessary layer of realism, clarifying how vehicle-specific charging constraints interact with infrastructure deployment strategies. At the same time, this integrated perspective ensures that the power grid’s capacity to sustain simultaneous high-demand charging events is fully accounted for.
Ultimately, the siting problem must be approached from a holistic perspective, one that not only captures these dynamics but also prioritizes solutions at the national scale.
3. Multi-Criteria and Grid-Based Framework for EV Charging Siting
The methodology outlined in Figure 1 corresponds to the second phase of this study, which focuses on identifying the prioritized locations of fast-charging stations. This phase builds upon a set of preliminary locations derived from a previously developed four-step methodology, as detailed in [29]. The primary objective of that earlier phase was to establish a foundational structure based on estimated energy consumption for multiple EV brands and models, observed travel behavior within a GIS-based spatial context, and the combined influence of vehicle characteristics and route typologies on recharging demand.
However, due to the preliminary nature of those results, a considerable degree of spatial redundancy was identified: the distances between candidate locations ranged from as little as 100 meters to as much as 50 kilometers. From an energy consumption standpoint, and considering elevation profiles and terrain variability along the corresponding segments of the NRN, these variations were deemed negligible. Consequently, the initial set of proposed locations required refinement to eliminate spatial overlaps and support a more strategic and technically coherent siting process.
To guide this refinement, several algorithmic approaches were considered, including Voronoi tessellations, graph-based models, and clustering techniques such as k-means and density-based spatial clustering of applications with noise (DBSCAN). In some instances, refinement was also attempted through power system analysis alone. Nonetheless, it became clear that a certain degree of subjectivity was necessary, as optimal siting must address not only technical feasibility but also practical accessibility and alignment with real-world EV user behavior [30]. Furthermore, the inherently complex and multidimensional nature of this planning challenge, characterized by multiple, often competing objectives, could not be adequately resolved through single-objective optimization methods.
In this context, the use of MCDM algorithms provided a more robust analytical framework capable of balancing technical, behavioral, and socioeconomic considerations. To complement this approach, a resource allocation perspective was introduced to support a more balanced and operationally coherent prioritization of candidate locations. Although the initial four-step methodology effectively addressed the foundational question of technical viability, the emphasis at this stage shifted from identifying where fast-charging stations could be installed to determining which locations should be prioritized. The integration of an MCDM algorithm with empirical filtering techniques enabled a more structured selection of those NRN segments most representative of projected recharging demand.
The final stage of the methodology involved performing a power flow analysis based on national mid-term projections of EV adoption. This step was essential for evaluating both the technical feasibility and operational performance of the proposed recharging infrastructure, as well as for assessing its potential impact on the electric grid through load flow simulations and the integration of distributed generation (DG). While hosting capacity remains a key metric for assessing the grid’s ability to support additional load under normal operating conditions, it was treated in this study as a complementary indicator, not to dictate siting decisions or impose rigid thresholds, but to provide insight into how the grid might respond to realistic recharging demand scenarios.
The following subsections detail the specific configuration used for each algorithm, acknowledging that tailored parameter settings, variable selection, and expected outputs were required. The overall methodology followed a sequential workflow, with each step building upon the outputs of the previous one. In addition, all phases were geospatially referenced using GIS tools, which enabled a more comprehensive understanding of spatial relationships that would otherwise be obscured in purely tabular formats.
3.1. Initial Prioritization of Fast-Charging Locations via TOPSIS
Rather than identifying a single, definitive solution, the application of an MCDM approach enabled the evaluation of multiple viable alternatives under varying conditions. This reflects the understanding that infrastructure siting decisions are rarely resolved through a singular "best" option. Instead, they are shaped by trade-offs, constraints, and competing priorities [31]. In this context, MCDM provided a more adaptable and comprehensive framework for integrating socioeconomic, spatial, and behavioral dimensions into technically coherent and operationally relevant decisions.
Among the various MCDM techniques, TOPSIS was selected for its methodological simplicity, versatility, and demonstrated effectiveness in complex spatial decision-making contexts. As illustrated in Figure 2, TOPSIS demonstrates superior performance in key evaluation criteria, particularly in ease of use, ranking, clarity, and data requirements, when compared to methods such as analytic hierarchy process (AHP), élimination et choix traduisant la realité (ÉLECTRE), viekriterijumsko kompromisno rangiranje (VIKOR), and preference ranking organization method for enrichment evaluation (PROMETHEE). Unlike pairwise comparison methods such as AHP, which require extensive subjective judgments that may introduce inconsistencies when evaluating large sets of alternatives, TOPSIS operates through direct quantitative assessment of criteria performance.
Furthermore, while methods such as ÉLECTRE and PROMETHEE excel at handling conflicting criteria through outranking relations, they often yield partial rankings or require threshold parameters that may lack clear theoretical justification in spatial planning contexts. In contrast, TOPSIS produces a complete ranking through a transparent geometric logic: it measures how close each alternative is to the ideal solution while also being distant from the worst-case scenario [32,33]. This dual-distance mechanism aligns naturally to identify locations that simultaneously maximize recharging accessibility while minimizing potential deployment constraints. This dual-distance mechanism aligns naturally, intending to identify locations that simultaneously maximize recharging accessibility while minimizing potential deployment constraints.
Guided by this rationale, TOPSIS was applied to refine the candidate locations identified in the preliminary GIS-based siting analysis presented in [29]. The results revealed considerable spatial clustering within certain NRN segments, many of which corresponded to segments of elevated projected recharging demand. To enhance the robustness of the prioritization process, each candidate segment was cross-referenced with its corresponding annual average daily traffic (AADT) value and stratified by the NRN’s hierarchical classification. This integration of traffic pattern with energy demand established the empirical foundation for the multi-criteria evaluation that follows.
The selection of criteria for the TOPSIS implementation required careful theoretical consideration of the factors that drive the effective deployment of fast-charging infrastructure. Two criteria emerged as both necessary and sufficient for the prioritization framework: AADT and specific charging demand. The deliberate limitation to two criteria, rather than expanding to include additional factors such as land cost, proximity to amenities, or demographic variables, reflects a strategic focus on the fundamental drivers of EV infrastructure utilization. AADT represents the underlying mobility patterns that determine potential user access and serves as a proxy for vehicle travel. At the same time, specific recharging demand captures the technical necessity for charging due to vehicle range limitations and energy consumption along specific route segments. Together, these criteria address the core question: where do EVs need to recharge, and where are there enough vehicles traveling to justify infrastructure investments?
These two criteria were weighted asymmetrically in the TOPSIS analysis: AADT at 40% and specific recharging demand at 60%. This weighting structure reflects a theoretically grounded distinction between general mobility patterns and EV-specific operational constraints. While AADT indicates where traffic flows concentrate and thus where fast-charging infrastructure might serve the most significant potential user base, recharging demand captures a more critical dimension: where EVs operationally require recharging to complete their journeys. This distinction is not trivial. Unlike internal combustion engine (ICE) vehicles, which benefit from widespread refueling infrastructure and typically operate with substantial reserve capacity, EVs face narrower autonomy windows constrained by battery capacity and the practice of limiting fast-charging to the 20-80% SoC range to preserve battery longevity [34]. Consequently, recharging demand represents not merely user preference or convenience, but operational necessity as the difference between completing a trip or being stranded mid-route. The heavier weight assigned to recharging demand, therefore, reflects its status as a binding constraint on EV adoption. At the same time, AADT serves as a complementary indicator of broader accessibility and potential utilization rates. This weighting scheme acknowledges that infrastructure must first be positioned where it is technically essential and, secondarily, optimized for maximum accessibility [35].
Having established the theoretical foundation for criteria selection and weighting, the implementation of TOPSIS required adaptation to the specific characteristics of spatial infrastructure planning. The method’s strength lies in its systematic translation of subjective priorities, such as the relative importance of demand versus traffic, into a quantitative ranking mechanism that remains transparent and reproducible. This transparency is particularly valuable in public infrastructure contexts, where decision-making processes must be defensible to multiple stakeholders with potentially conflicting interests. The standard TOPSIS framework was therefore configured to accommodate the geospatial and operational requirements of national-scale fast-charging network design, as detailed in the following procedural steps.
To ensure methodological rigor and contextual relevance, the implementation of TOPSIS followed the six standard steps of the algorithm [36], adapted to reflect the specific characteristics of the study’s criteria and objectives. These steps are outlined below:
- Data normalization: To enable fair comparison across criteria with different units of measurement, all values were normalized using vector normalization. This process eliminates the influence of scale differences and ensures a consistent basis for evaluation. Each normalized value in the decision matrix was calculated as:where represents the original value of criterion j for alternative i, and is its normalized counterpart.
-
Weight assignment: Each criterion was then assigned a weight reflecting its relative importance. In this study, the specific charging demand received a higher weight due to its critical role in ensuring adequate spatial coverage and addressing the autonomy constraints of EVs. This step introduces a subjective component into the TOPSIS algorithm, distinguishing it from more deterministic MCDM methods.The weights were normalized to ensure that their sum is equal to one:The weighted normalized matrix was then calculated as:where is the weight assigned to criterion j, and represents the weighted normalized value for alternative i.
-
Determination of ideal and anti-ideal solutions: The ideal () and anti-ideal () solutions serve as benchmarks for the evaluation of all alternatives. They are defined based on the most and least favorable values for each criterion:
- −
- For benefit criteria (where higher values are preferable), the ideal solution uses the maximum value, while the anti-ideal uses the minimum.
- −
- For cost criteria (where lower values are preferable), the ideal solution uses the minimum value, while the anti-ideal uses the maximum.
These benchmark solutions provide a systematic reference to assess the relative performance of each alternative. - Calculation of separation measures: The Euclidean distance from each alternative to both the ideal and anti-ideal solutions was calculated using the following equations:where (in Equation 1) is the distance from the ideal solution and (in Equation 2) is the distance from the anti-ideal solution for alternative i.
- Calculation of the relative closeness to the ideal solution: The relative closeness coefficient indicates how close each alternative is to the ideal solution. This value always falls within the range , with alternatives closer to 1 considered more desirable. It is calculated as:
- Ranking of alternatives: Alternatives were ranked from best to worst based on their values. The alternative with the highest relative closeness was considered the most suitable and was assigned the highest priority in the list of candidate locations of fast-charging stations.
Since multiple segments yielded high relative closeness values, the resulting set of prioritized segments was ranked in descending order according to their scores. Only those segments with scores equal to or above the median were retained. This thresholding approach ensured a balanced outcome, preserving geographic representativeness while limiting the number of alternatives to a manageable set for subsequent analysis, including power system modeling and DG planning.
3.2. Stage-Two Prioritization Using Pareto Efficiency
Although the results obtained through TOPSIS provided a clearer and more refined outlook, subsequent geospatial analysis revealed the presence of excessively long road corridors ranging from 20 to 40 kilometers, where a greater degree of spacing between segments along the same route was initially expected. In other words, while TOPSIS improved the characterization of electric mobility by aligning the recharging needs with the AADT, redundancies remained among the selected road segments, as many were consecutive or extended beyond what was strategically necessary.
To address this issue and provide a more tailored and operational representation of prioritized fast-charging locations at the national level, the Pareto principle was implemented by constructing a Pareto chart. This approach enabled the reduction of selected segments without disregarding those contributing and significant values, thus preserving the quality and relevance of the final selection process.
According to Grosfeld-Nir et al. [37], the Pareto principle, commonly known as the 20/80 rule, suggests that a small proportion of factors (typically 20%) are often responsible for a large share of the results (approximately 80%). Originally formulated by the economist Vilfredo Pareto in the late 19th century, based on his observation that 20% of the Italian population owned 80% of the wealth, the principle has since been widely adopted in various fields, as it is recognized as a fundamental tool for prioritizing actions and optimizing resource allocation in complex decision-making processes.
In the context of the study, the principle was applied through a Pareto chart to identify those road segments which, although representing a relatively small fraction of all evaluated locations, accounted for approximately 80% of the cumulative impact. These segments emerged as strategic priorities, as they were better positioned to address the majority of the projected demand in the recharging infrastructure.
To further refine the results, it was necessary to consolidate all types of trips and collectively evaluate locations, shifting from the typology-based approach previously used in Section 3.1. For this second stage, the analysis adopted a regional perspective, requiring the application of the Pareto principle in two complementary steps:
- Step 1: the routes that cumulatively accounted for approximately 80% of the total recharging demand within each geographic area were identified. In line with the Pareto principle, priority was given to those routes which—despite representing only nearly 20% of the total number of routes where EVs required charging—were capable of covering 80% or more of each regional recharging demand.
- Step 2: each of the routes selected in Step 1 was composed of multiple segments spanning various districts within the main administrative divisions of the geographic areas. Many of these segments were spatially adjacent or consecutive, which, if left unfiltered, would have hindered the optimality of the final results, as they lacked distinctive or representative features—contradicting the overarching methodological goal.
Therefore, individual segments were re-evaluated using a Pareto chart to identify the top 20% of the segments that accounted for 80% or more of the recharging demand within the previously selected roads. The combined application of the TOPSIS and Pareto stages ensured that there were no overlaps between segments along the same road or between roads within the same geographical area. Furthermore, each selected segment would contribute meaningfully to the coverage of its broader regional context.
The transition from demand-driven prioritization to grid readiness evaluation is intentional and sequential. By first identifying the most strategically relevant segments of the NRN through MCDM and Pareto filtering, the framework ensures that subsequent grid simulations concentrate on locations with the greatest projected impact, thereby preventing the misallocation of modeling resources to sites of minimal impact.
The strength of this approach lies in its flexibility: when significant discrepancies arise between priorities and technical feasibility, the process can iterate selectively between the two stages, refining the final set of prioritized locations without requiring a complete methodological reset.
3.3. Recharging Projection and DG Assessment for a National Electric Grid Framework
The integration of power system analysis into EV fast-charging infrastructure planning represents a necessary complement to demand-driven siting strategies. Yet, its role must be carefully positioned within the broader methodological framework. While MCDM-based prioritization identifies where fast-charging infrastructure should be deployed based on user demand and spatial equity, power system modeling evaluates whether the existing electrical network can accommodate the projected loads without compromising voltage stability or operational reliability. This distinction is critical: demand analysis determines strategic priority, while grid analysis validates technical feasibility. The temporal charging distribution, specifically the assumption that 35% of the EV fleet charges on the peak-demand day, distributed across the 24-hour cycle, is a key parameter that links user behavior patterns to engineering constraints and directly influences peak-load estimates and hosting-capacity assessments.
Following the prioritization of candidate locations using the methods detailed in Section 3.1 and Section 3.2, the subsequent phase of the study focused on evaluating the potential impact of installing fast-charging stations in a national electric grid framework, placing particular emphasis on DNs, which are generally more sensitive to rapid load increases and less robust than transmission systems [38]. This analysis aimed not only to characterize the expected response of the electric grid to projected recharging demand but also to anticipate and mitigate potential instabilities, such as voltage deviations or local overloads, that could arise from widespread EV adoption. Additionally, the study sought to determine the infrastructure upgrades and DG required to maintain voltage stability and ensure system reliability across the most affected nodes. To this end, a conservative approach was adopted by simulating recharging activity during the peak day of national electricity demand, offering a rigorous test of the resilience of representative DNs.
The following subsections detail the modeling assumptions, simulation parameters, and step-by-step approach used to assess the integration of new EV loads. This process included estimating hourly load profiles for each prioritized segment and evaluating the extent to which DG could alleviate potential system stress. The overarching goal was to inform mid-term planning efforts, recognizing that national-scale electric mobility, particularly the expansion of fast-charging infrastructure, is no longer a distant possibility, but an imminent transition that demands proactive grid readiness.
The power system evaluation adopted in this study addresses a critical methodological gap identified in the literature: many EV charging infrastructure siting studies propose locations based exclusively on spatial optimization criteria related to traffic flows, accessibility, and land use, without verifying whether existing electrical infrastructure can support the additional loads imposed by fast-charging operations [14,15,22]. Such approaches risk recommending installations at locations where grid reinforcement costs would be prohibitively high, or where voltage instability could compromise both charging reliability and broader network operation. To address this gap, power flow simulations are integrated not as a final constraint filter applied after site selection, but as a diagnostic tool embedded within the planning methodology. This integration enables the assessment of operational feasibility under realistic loading conditions, providing visibility into voltage stability, thermal loading, and potential infrastructure bottlenecks before capital investments are committed. The approach recognizes that the value of a candidate charging location depends not only on its accessibility to EV users but also on the readiness of the underlying electrical network to accommodate rapid, concentrated load increases characteristic of DC fast-charging operations.
The selection of steady-state power flow analysis as the primary evaluation method reflects a pragmatic balance between computational complexity and planning relevance. While dynamic stability simulations or transient analysis would provide greater technical resolution, steady-state modeling offers sufficient fidelity for mid-term infrastructure planning while remaining computationally tractable at the national scale. This approach aligns with established practices in distribution network planning, in which voltage stability and thermal loading under peak-demand conditions serve as primary indicators of system adequacy [11,39].
3.3.1. Evaluation of Regional Recharging Demand
To estimate anticipated recharging demand, a power-flow analysis was performed using a national grid model that represents the typical structure and operational characteristics of the electric power system. The simulation incorporated mid-term projections of EV adoption, combining national fleet growth trends with region-specific driving patterns. In particular, this projection framework is not limited to a fixed five-year interval; instead, it remains adaptable to any planning horizon considered relevant for the analysis.
As part of the modeling framework, the country was subdivided into main geographic regions, classified by socioeconomic relevance, an approach consistently applied throughout the earlier stages of the methodology. Within each region, the expected recharging power was estimated by aggregating the projected energy consumption of EVs at the selected road segments. This regional disaggregation was not intended to simulate regional grid dynamics per se, but to support a more structured and manageable estimation of national-level demand. Although recharging events are distributed across different regions, each exhibiting distinct energy profiles, the national electric grid typically operates as a unified, interconnected grid in which local disturbances can propagate beyond regional boundaries. Therefore, national-level modeling was essential to capture the grid’s holistic behavior under projected recharging scenarios. At the same time, retaining regional disaggregation enabled more precise validation and calibration before aggregation.
In parallel with the spatial allocation of recharging demand, a mid-term forecast of the national EV fleet was required. To this end, and in line with the case study context, the projection developed in [40] was adopted as the primary reference. That study demonstrated that the Gompertz model more effectively captures the asymmetric growth patterns characteristic of early-stage EV adoption, offering greater numerical stability and realism than alternative approaches such as the Bass diffusion model or Markov chains.
Based on these national EV fleet projections, the estimated number of EVs was spatially distributed across the selected NRN segments. For each segment, the vehicle count was disaggregated by brand and model, using distributions previously identified through GIS-based demand analysis. This enabled a detailed, segment-level estimation of the number of EVs likely to require fast charging. The corresponding power demand for each brand and model was then calculated based on its maximum allowable charging capacity, acknowledging that even when fast-charging stations deliver high output, the available intake is ultimately constrained by each vehicle’s technical specifications. Finally, the share of trips attributed to each segment, expressed as a percentage of the total trips within its respective region, was used to scale the projected fleet and estimate the aggregate recharging power required at each prioritized location, expressed in megawatts.
3.3.2. Projections of Hourly Load Profiles
To complement the estimation of aggregated recharging power, and acknowledging that EV recharging demand is inherently nonuniform over a 24-hour period, hourly load profiles were developed to simulate the temporal distribution of recharging activity. The model assumed that 35% of the projected EV fleet in each segment would charge on the peak-demand day, distributed across the 24-hour cycle according to typical user behavior patterns. This distribution recognizes that not all EVs require daily charging and that users distribute their charging activities temporally based on individual travel patterns and vehicle range. This conservative planning assumption was intended to reflect a plausible upper-bound scenario while reducing the likelihood of underestimating peak system stress.
The 35% temporal charging distribution merits elaboration, as it fundamentally shapes the magnitude of projected grid impacts. This value represents a conservative technical assumption for power system modeling rather than a simultaneity factor; it reflects the percentage of the EV fleet that charges on the peak-demand day, with this charging distributed across the full 24-hour period according to observed patterns in national electricity consumption. Peak recharging activity was concentrated during existing system peak demand periods: approximately 5% of daily charging demand per hour during the intervals from 11:00 a.m. to 01:00 p.m. and from 06:00 p.m. to 07:00 p.m., with lower hourly allocations (0-1% per hour) during off-peak periods. International planning frameworks consistently emphasize the importance of integrating realistic hourly load-allocation models to accurately capture EV charging dynamics in power-system analysis [39]. Regional studies of EV integration into distribution networks have adopted comparable conservative assumptions about charging distribution to evaluate grid hosting capacity under peak loading conditions [39,41]. The 35% assumption therefore represents a methodologically defensible planning scenario: conservative enough to serve as an upper-bound estimate of peak system stress, yet informed by the understanding that actual charging behavior exhibits substantial temporal dispersion across the 24-hour cycle rather than concentrated peak-hour loading.
This alignment of projected EV charging patterns with existing peak demand periods enabled a more representative characterization of the system’s hosting capacity, recognizing that power networks are particularly sensitive not only to the magnitude of incremental loads but also to their temporal overlap with established peak periods [39].
Table 3 summarizes how the present study’s charging distribution model compares to approaches adopted in related literature. The 35% temporal distribution differs from concentrated charging assumptions by explicitly accounting for the dispersed nature of user charging behavior across the 24-hour cycle, with peak-hour concentrations aligned to national electricity demand patterns. This approach aligns with international best practices for grid integration studies while remaining conservative enough to serve as a robust planning scenario for mid-term infrastructure development.
As described previously in Section 3.3.1, the usable battery capacities reported by manufacturers for each EV brand and model were used to define the maximum recharging intake per vehicle. This ensured that the simulated load profiles captured both realistic operating behaviors and a technically robust representation of grid conditions. Consequently, the projections developed in this stage not only contribute to a deeper understanding of recharging demand dynamics but also serve as a critical input for DG resource planning and the identification of potential overloads, shortfalls, or over-dimensioning in regional fast-charging infrastructure.
4. Integrated Results: Optimal Siting and Grid Simulation for EV Fast-Charging Infrastructure
The following results are presented through two distinct yet complementary components. While the siting of fast-charging stations is primarily guided by systematic MCDM algorithms and prioritization frameworks, the assessment of grid impacts is governed by the operational dynamics and technical constraints of the electric power system. In this context, power system analysis does not determine where stations should be located; rather, it evaluates the feasibility and potential implications of integrating new, potentially substantial loads into the existing grid infrastructure.
Accordingly, the proposed methodology was applied to the case study of Costa Rica, an exemplary context for testing sustainable mobility strategies due to the country’s long-standing commitment to a modern, green, resilient, and equitable low-carbon economy. This vision is formalized in the National Decarbonization Plan 2018-2050 [42], which identifies the progressive electrification of the national vehicle fleet as a central pillar of the country’s long-term climate strategy.
The simulation of Costa Rica’s NES builds on the foundational work of [43], which translated the country’s official transmission and distribution system model, originally developed in PSS/E, into the ETAP environment, thereby making it more broadly accessible for planning and research. At the time, the official RES model was available only upon request and operable exclusively within PSS/E. In response to increasing research needs, the ETAP-based model offered a timely and validated alternative.
This robust modeling framework enabled the simulation of multiple operational scenarios under conditions of widespread, simultaneous EV charging. As a result, it provided a realistic basis for assessing the implications of integrating fast-charging infrastructure into both the transmission and distribution systems. The following subsections present the two central outcomes of the study: (i) the GIS and MCDM-based identification of selected segments along the NRN, and (ii) the simulation-based analysis of NES operability under projected national fast-charging demand.
4.1. National-Level Results of the Fast-Charging Station Siting Strategy in Costa Rica
A total of 60 segments, highlighted in yellow in Figure 3, were identified as priority candidates for the installation of fast-charging stations. These segments were selected based on their potential to ensure equitable and accessible recharging infrastructure, considering both the national road hierarchy and projected traffic volumes in Costa Rica’s NRN. According to [44], the paved portion of the NRN comprises 1,385 control segments. Thus, the selected 60 segments represent approximately 4.33% of the total network, accentuating the theoretical efficiency of the prioritization strategy.
This relatively small share illustrates the methodological effectiveness of the approach: despite covering only a fraction of the NRN, the identified segments are, based on model assumptions, sufficient to meet projected fast-charging demand. Furthermore, the selection spans multiple road hierarchies, with a majority consisting of primary corridors, complemented by critical secondary and tertiary segments, as summarized in Table 4.
To facilitate interpretation, Table 5 presents the ten highest-ranked segments from the national prioritization exercise. The ranking was derived by selecting the most prominent segment within each of the six socioeconomic regions. To complete the list of ten, the four additional slots were assigned to the highest-ranked corridors in the Región Central, which contains the largest share of NRN segments.
Taken together, these selections capture the heterogeneity of the country’s fast-charging needs, ranging from high-volume metropolitan corridors to port-access routes and interregional connectors, and provide a concise yet comprehensive overview of the most critical candidates for deployment. In doing so, they ensure that both metropolitan and peripheral priorities are incorporated into a coherent national-scale strategy.
From both a geographic and functional perspective, the prioritized segments demonstrate well-distributed coverage across Costa Rica’s six socioeconomic planning regions. They capture not only the most heavily traveled daily commuting corridors, primarily in the Región Central, but also strategic routes that connect key touristic destinations (e.g., Chorotega and Pacífico Central), international trade and border crossings (e.g., Chorotega and Brunca), and major logistics hubs (e.g., Huetar Norte and Huetar Caribe). In this way, the proposed network supports both regional and interregional EV mobility within a cohesive national framework.
It should be emphasized, however, that these results are not intended as fixed prescriptions. The ranking criteria embedded in the MCDM framework were deliberately designed to remain adaptable, enabling the prioritization to evolve with future changes in EV adoption, grid expansion, or shifting transport needs. This flexibility ensures that additional segments can be incorporated as new traffic data, demand projections, or policy objectives become available.
4.2. Comprehensive Simulation in ETAP
The ETAP model developed in [43] provided the foundation for a comprehensive simulation of the Central American interconnected power system. Given Costa Rica’s role within this regional network, the model was adapted using the country’s NES single-line diagram, as presented in [45]. This diagram outlines the structural configuration of major system components, including transmission lines, substations, and voltage levels of 230 kV, 138 kV, and 34.5 kV.
Further refinements were made based on the studies in [40,41], which examined the impact of EV penetration on Costa Rica’s NES using advanced simulation techniques and mathematical modeling. These references allowed for a high-fidelity representation of system interdependencies, ensuring that the model parameters closely matched real-world operational conditions. Although the simulation methodologies were aligned, the studies differed in their temporal scope. For this reason, the present analysis adopts the 2030 projection horizon, consistent with the scope of [41], which extends to 2040.
Based on the assumptions described in Section 3.3, the simulation incorporated the national load profile for the highest-demand day of 2024, reported in [45] as approximately 1,929.51 MW. Under this scenario, it was assumed that 35% of the EV fleet associated with the prioritized road segments would require fast charging within a representative 24-hour period. This resulted in an estimated additional charging demand of 52.02 MW, which was added to the ETAP model alongside other EV-related loads, including Level 1 (ranging from 1.4 to 2.4 kW) and Level 2 chargers (ranging from 3.3 to 22 kW).
Simulation results show that EV recharging demand peaks at around 284 MW near midday, coinciding with the system’s existing peak demand period, as shown in Figure 5. The EV load curve exhibits a steady increase from early morning, reaching a maximum at noon, and gradually decreasing into the evening. Overnight demand stabilizes at low levels, primarily driven by Level 1 charging, which requires extended connection times, typically between 20 and 40 hours, to achieve a full charge, sustaining recharging activity for up to eight hours before morning usage resumes.
In terms of system stability, the voltage levels observed in Figure 4a,b for the 230 kV and 138 kV transmission networks remain within acceptable operational bounds (typically between 0.95 and 1.05 % p.u.). However, DNs operating at 34.5, 24.9, and 13.8 kV, shown in Figure 4c, exhibit signs of voltage deterioration. These lower-voltage systems appear to have limited capacity to accommodate additional EV loads. Notably, nodes 53508, 53010, and 53758 recorded voltages of 0.8988, 0.9435, and 0.9484 % p.u., respectively, which fall below the recommended thresholds and indicate emerging vulnerabilities in the distribution infrastructure under rising EV demand.
As shown in Table 6, the voltage stability challenges observed in the present study reflect critical infrastructure constraints that emerge under aggressive EV penetration scenarios in Latin America distribution networks. While González et al. [46] reported minimal voltage impact in Cuenca’s distribution system, their conservative scenario (4 fast-charging stations serving 11,500 EVs at 10% penetration) demonstrated adequate system headroom under low simultaneous loading conditions, with voltages remaining above 0.97 p.u. In contrast, the present study’s 2030 higher-penetration projection reveals voltage drops at critical distribution nodes that fall below ANSI C84.1-2020 [47] Range B emergency limits for systems above 600 V (minimum 0.95 p.u.). This severity aligns with findings from Gómez et al. [41], who similarly identified critical infrastructure problems emerging after 2030 in Costa Rica’s transmission system (voltages below 0.9 p.u. at 138 kV level) under comparable high-penetration scenarios. These results underscore that voltage stability challenges are not unique to individual networks, but reflect systemic vulnerabilities common to developing grids that integrate rapid EV adoption without concurrent infrastructure reinforcement, which remain latent under conservative penetration assumptions but become critical as EV fleets scale toward projected 2030 levels.
While this scenario was being evaluated, the role of DG, specifically through PV systems, was also explored, with penetration levels ranging from the current 5% to a potential 20%. As seen in Figure 5, PV-based DG currently accounts for approximately 5% of the NES’s total installed capacity. Though meaningful as a starting point, this level remains insufficient to accommodate the projected growth in electricity demand by 2030. The 5% penetration curve reveals only modest reductions during peak periods and is not sufficient to mitigate the broader structural pressures on the NES.
At a 10% penetration level, system resilience begins to showcase notable improvements in its capacity to absorb additional loads, with the 20% scenario offering the most comprehensive benefits in terms of coverage and grid stability over the next five years. These findings underscore the urgency of strategic investments in renewable DG to prevent congestion and reliability issues during peak demand.
Importantly, EVs will not be the only consumers dependent on a robust and flexible power grid; other sectors will likewise require adequate energy supply to sustain Costa Rica’s ongoing socioeconomic development. In this context, achieving a PV integration target of at least 15% could represent a viable and strategic milestone to meet the country’s growing energy demands in the coming years.
5. Bridging Demand and Grid Constraints in Fast-Charging Infrastructure Planning
The effectiveness and long-term impact of a fast-charging network depend on the careful integration of multiple, often competing, planning dimensions. A central aim of this study was to reframe how the siting of such infrastructure is conceptualized, introducing the notion of prioritized siting as a means to structure and balance diverse technical, spatial, and socioeconomic criteria. Rather than striving for a singularly “optimal” solution, this framework identifies a range of high-priority candidate locations that reflect a more holistic understanding of infrastructure demand.
In this context, the siting of fast-charging infrastructure is more effectively guided by MCDM frameworks, particularly when integrated with the spatial capabilities of GIS [19,48,49,50]. These tools allow planners to integrate critical factors such as demand distribution, user travel patterns, accessibility gaps, and socioeconomic conditions. Power system analysis, though essential, should be positioned as a supporting instrument, used to validate whether candidate sites identified through demand-driven analysis are also technically feasible from a grid capacity standpoint.
Throughout the design process, however, a persistent counterquestion emerged: what risks might arise if this planning sequence were reversed? In essence, what happens if the readiness of the electric grid is prioritized while demand-side insights are deferred?
Such an approach risks producing an infrastructure system that is technically sound, but disconnected from actual usage. Grid-resilient zones can overlap with areas of low EV adoption, sparse population density, or restricted accessibility, leading to underutilized charging stations and ultimately hindering equitable EV uptake. This misalignment could be particularly harmful in regions already facing structural disadvantages, where well-intentioned investments may fail to generate consequential impact.
Planning efforts must therefore acknowledge that transportation demand is not merely a function of vehicle ownership or road density. Rather, it is fundamentally shaped by the spatial organization and socioeconomic fabric of society. As Rodrigue [12] observes, "the planning and expansion of transport infrastructure, particularly road-based networks, must be grounded in a thorough understanding of the underlying demographic and economic dynamics that shape mobility". Put simply: infrastructure must follow demand, not the other way around.
This perspective reinforces the central claim of this study: that equitable and effective EV infrastructure planning must be guided, first and foremost, by demand-centered insights [51]. Grid constraints, though critical, should complement rather than dominate the planning process. In the context of EV charging infrastructure, user adoption is not only a prerequisite for short-, mid-, or long-term impact but also a defining measure of system effectiveness and accessibility.
5.1. Implications for Spatial Equality and Planning
To date, few studies have examined fast-charging infrastructure planning at the national level [20,23,52]. Most existing research tends to focus on metropolitan or high-density urban areas, often overlooking spatial equity by disregarding the needs of less-populated or infrastructurally constrained regions [46]. As Guerrero et al. [53] point out, this narrow scope has frequently resulted in the exclusion of peripheral areas from EV infrastructure initiatives, thereby reinforcing existing disparities in accessibility and adoption. In contrast, the framework proposed in this study places spatial equity at its core, explicitly accounting for demand patterns in both urban and rural contexts.
As detailed in Section 4.1, Costa Rica (51,100 km2) is a geographically compact country, comparable in size to a single metropolitan area in larger nations such as the United States (9.867 million km2), Germany (357,592 km2), or China (9.597 million km2). Although its small territorial scale might initially be perceived as a limitation, it presents a compelling case for international audiences. The country’s distinct spatial and economic structure, coupled with its strong national commitment to net-zero emissions across sectors [54], positions it as a valuable and replicable model for national-scale EV infrastructure planning.
Even studies that implement multi-stage MCDM frameworks, such as the one proposed by Ademulegun et al. [20] for EV siting across border regions, tend to focus primarily on technical-operational feasibility, including grid connectivity, equipment headroom, and monitoring infrastructure. Although their approach considers sociotechnical factors, it does not explicitly address territorial cohesion or spatial justice. In contrast, the present study incorporates equity considerations from the outset, ensuring that less-central regions with lower socioeconomic prominence are not deprioritized due to logistical or infrastructural constraints.
In general, the results showed that the prioritized segments enabled equitable connectivity throughout the national territory, without excluding any region based on limited economic, social, or infrastructure prominence. The spatial distribution supports meaningful links between Costa Rica’s most densely populated zones, such as the GMA, and regions with comparatively lower socioeconomic influence. This inclusive planning approach contributes to the country’s functional cohesion and underscores the importance of infrastructure in promoting balanced territorial development.
Nonetheless, it is essential to acknowledge that these findings remain theoretical. The true strength of the proposed methodology will only be revealed through real-world implementation and iterative calibration. Local conditions, operational feedback, and evolving travel behaviors will inevitably shape how the framework performs in practice. Ultimately, it is not models but practice that will determine the robustness, relevance, and short-, mid-, or long-term impact of this approach.
5.2. Grid Readiness and Operational Implications for EV Fast-Charging Integration
The simulation results presented in Section 4.2 provide critical insight into the operability of Costa Rica’s NES under mid-term projections of EV charging demand. Although the proposed siting strategy promotes spatial equity and aims to accommodate a wide range of demand-responsive locations, the power system analysis reveals that these benefits cannot be fully realized in practice without targeted grid reinforcement, particularly at the distribution level.
Voltage drops observed at nodes 53508, 53010, and 53758 point to localized vulnerabilities that may compromise the feasibility of fast-charging deployment in rural or infrastructure-limited areas. Importantly, urban zones are not exempt from such constraints. This underscores a fundamental asymmetry: although the framework prioritizes geographic equity, the existing grid is not yet uniformly equipped to support equitable integration, singularly under mid-term scenarios and even less so in the context of long-term national or international decarbonization roadmaps.
This tension reflects a broader and recurring challenge in EV infrastructure planning. As emphasized in previous studies [20,24], national-scale rollout must consider both demand-side indicators, such as traffic volumes and EV adoption, and supply-side limitations, including voltage stability, substation loading, and DG hosting potential. Although end users may not consciously consider whether the grid can support their charging behavior, system reliability must be guaranteed by default. Technical readiness is not optional; it is a foundational requirement for any meaningful infrastructure expansion.
In this regard, the inclusion of PV-based DG in the simulations revealed a partial mitigation pathway. However, meaningful improvements in grid performance were only observed at penetration levels of 15% or higher. This finding reinforces the importance of coordinated planning: siting strategies for fast-charging infrastructure must be developed in tandem with renewable energy deployment and grid reinforcement guidelines.
Ultimately, the proposed framework extends beyond geographic feasible locations—it bridges the gap between spatial prioritization and operational viability. The integration of ETAP-based simulations equips the planning process with a forward-looking diagnostic tool to anticipate and proactively address technical constraints, should implementation move forward. For countries like Costa Rica, this dual-perspective approach offers a robust pathway to designing resilient, inclusive, and future-ready EV infrastructure systems.
Conclusions
Practical Implications
Electric mobility and its integration into national infrastructure remain a topic of ongoing debate, explored through a range of theoretical models and quantitative approaches. Yet, no matter how robust a methodology may appear on paper, its true test lies in practice. The deployment of fast-charging infrastructure exemplifies this reality: it is not solely a matter of calculations, but of aligning infrastructure with the lived behaviors of EV users and the technical readiness of the power grid.
The methodology developed in this study aims to bridge the gap by bringing infrastructure planning closer to real-world conditions. Rather than offering a single abstract "optimal" solution, it integrates user behavior, energy requirements, and mobility patterns to identify high-priority locations that reflect both demand and system constraints. While any segment of the road network may be technically eligible, effective infrastructure must go beyond validity, it must be context-sensitive, spatially equitable, and grounded in actual usage. The goal is not perfection, but relevance.
At the same time, this study highlights that no siting strategy, regardless of its inclusivity, can succeed without concurrent efforts to reinforce the electric grid. Even under moderate projections of EV adoption, Costa Rica’s current electricity system is not adequately prepared to absorb the additional load without targeted upgrades. These findings underscore the importance of anticipatory planning: grid operability must stay ahead of evolving mobility patterns and emerging socio-technical demands.
Essentially, the proposed framework provides a replicable and scalable foundation for national-level EV infrastructure deployment, especially in small and mid-sized countries navigating the transition to electrified transport. Still, its full value will only be realized through real-world implementation, iterative refinement, and institutional capacity to synchronize infrastructure, demand, environmental sustainability, and policy over time.
Limitations and Future Work
Although the proposed methodology provides a structured approach, it is not without limitations. Rather than putting forward a one-size-fits-all-solution, it is intended as a flexible framework, a foundation that can be tailored and adapted to different geographical contexts, recognizing the uniqueness of each setting. In the case of Costa Rica, the methodology was shaped by the availability and resolution of local data, which inevitably influenced its structure and scope.
That said, the country presents a valuable opportunity to further refine and expand the framework, particularly within the TOPSIS component. Future iterations could incorporate additional criteria directly related to estimated emissions reductions by area or the carbon intensity of specific road segments. After all, while EVs are often considered "zero-emissions", the broader environmental impact, especially that linked to the production and energy supply chains of transitional technologies, remains relevant and should not be overlooked.
In parallel, the power system analysis conducted in this study provided meaningful insight into the operability of Costa Rica’s electric grid under mid-term EV adoption scenarios. However, several limitations remain. The current framework focused primarily on steady-state power flow simulations under conservative load assumptions, emphasizing hourly load profiles, voltage monitoring, and DG integration through PV penetration scenarios. Although this approach was sufficient to identify preliminary vulnerabilities, such as voltage drops at key distribution nodes—it does not encompass the full range of operational challenges posed by widespread EV integration.
Future research could build on this foundation by incorporating more advanced and granular power system studies. Notably, the present work did not include:
- Contingency analysis (N-1 or N-k) to evaluate system resilience under unexpected failures (e.g., line or transformer outages);
- Short-circuit analysis, essential for assessing protection coordination and equipment limits under high-load scenarios;
- Harmonic distortion assessments, particularly relevant for fast chargers relying on power electronic converters;
- Dynamic or transient stability simulations to characterize the system’s response to sudden load variations or generation disturbances;
- Protection system modeling or islanding scenarios, which are critical when integrating renewable-based microgrids or autonomous charging infrastructure.
Incorporating these types of studies would provide a more comprehensive diagnostic of the grid’s technical readiness and support the development of a truly resilient and future-proof EV charging ecosystem. As electric mobility scales, so too must the depth and sophistication of planning tools, ensuring that infrastructure siting decisions are not only spatially strategic but also technically viable under real-world operating conditions.
Acknowledgments
This work was supported by project VIE-1341028, titled Análisis del Futuro Energético de Costa Rica: Estrategias para la Integración de Vehículos Eléctricos, Generación Distribuida y Almacenamiento Electroquímico en el Sistema Eléctrico Nacional. The authors gratefully acknowledge the Vice-Rectorate for Research and Outreach at the Instituto Tecnológico de Costa Rica for funding this research. The authors also thank ETAP for providing the data and academic software licenses used in the simulations presented in this study. Additional support was provided by the Universidad de Costa Rica through research project C1467, titled Detección de Fallas, Control e Integración de Sistemas de Energías Renovables No Convencionales con Almacenamiento Energético para Redes Inteligentes.
Conflicts of Interest
The authors declare no conflicts of interest.
Abbreviations
The following abbreviations are used in this manuscript:
| AHP | Analytic Hierarchy Process |
| AADT | Annual Average Daily Traffic |
| DBSCAN | Density-Based Spatial Clustering of Applications with Noise |
| DG | Distributed Generation |
| DN(s) | Distribution Network(s) |
| DoD | Depth of Discharge |
| ÉLECTRE | ÉLimination Et Choix Traduisant la REalité |
| ES | Electrochemical Storage |
| ETAP | Electrical Transient Analyzer Program |
| EV(s) | Electric Vehicle(s) |
| FAHP | Fuzzy Analytic Hierarchy Process |
| FCS(s) | Fast-Charging Station(s) |
| GA | Genetic Algorithm |
| GMA | Greater Metropolitan Area |
| GVWR | Gross Vehicle Weight Rating |
| IEA | International Energy Agency |
| ICE | Internal Combustion Engine |
| MCDM | Multi-Criteria Decision-Making |
| MCLP | Maximum Coverage Location Problem |
| MDP | Markov Decision Process |
| MINLP | Mixed-Integer Nonlinear Programming |
| MILP | Mixed-Integer Linear Programming |
| N-1 | Loss of a single component (e.g., line or transformer) |
| N-k | Loss of multiple components (e.g., k components within the power system) |
| NES | National Electric System |
| NRN | National Road Network |
| PC3S | Personalized Charging Station Selection Scheme |
| PPO | Proximal Policy Optimization |
| PROMETHEE | Preference Ranking Organization Method for Enrichment Evaluation |
| PSS/E | Power System Simulation for Engineering |
| RL | Reinforcement Learning |
| SER | Sistema Eléctrico Regional (Regional Electric System) |
| SIEPAC |
Sistema de Interconexión Eléctrica para Países de América Central (Central American Electrical Interconnection System) |
| SoC | State of Charge |
| TOPSIS | Technique for Order Preference by Similarity to Ideal Solution |
| VIKOR | VIekriterijumsko KOmpromisno Rangiranje |
References
- International Energy Agency. Global EV Outlook 2023: Catching Up with Climate Ambitions. Technical report, IEA, 2023. Licence: CC BY 4.0. Available online: https://www.iea.org/reports/global-ev-outlook-2023.
- Malik, M.A.I.; Kalam, M.A.; Ikram, A.; Zeeshan, S.; Zahidi, S.Q.R. Energy transition towards electric vehicle technology: Recent advancements. Energy Reports 2025, 13, 2958–2996. [Google Scholar] [CrossRef]
- Tsakalidis, A.; Krause, J.; Julea, A.; Peduzzi, E.; Pisoni, E.; Thiel, C. Electric light commercial vehicles: Are they the sleeping giant of electromobility? Transportation Research Part D: Transport and Environment 2020, 86, 102421. [Google Scholar] [CrossRef] [PubMed]
- Pevec, D.; Babic, J.; Carvalho, A.; Ghiassi-Farrokhfal, Y.; Ketter, W.; Podobnik, V. A survey-based assessment of how existing and potential electric vehicle owners perceive range anxiety. Journal of cleaner Production 2020, 276, 122779. [Google Scholar] [CrossRef]
- Shrestha, S.; Baral, B.; Shah, M.; Chitrakar, S.; Shrestha, B.P. Measures to resolve range anxiety in electric vehicle users. International Journal of Low-Carbon Technologies 2022, 17, 1186–1206. [Google Scholar] [CrossRef]
- Chakraborty, P.; Parker, R.; Hoque, T.; Cruz, J.; Du, L.; Wang, S.; Bhunia, S. Addressing the range anxiety of battery electric vehicles with charging en route. Scientific reports 2022, 12, 5588. [Google Scholar] [CrossRef]
- Thorhauge, M.; Rich, J.; Mabit, S.E. Charging behaviour and range anxiety in long-distance EV travel: an adaptive choice design study. Transportation 2024, 1–23. [Google Scholar] [CrossRef]
- Gnann, T.; Funke, S.; Jakobsson, N.; Plötz, P.; Sprei, F.; Bennehag, A. Fast charging infrastructure for electric vehicles: Today’s situation and future needs. Transportation Research Part D: Transport and Environment 2018, 62, 314–329. [Google Scholar] [CrossRef]
- Zhao, A.P.; Li, S.; Li, Z.; Wang, Z.; Fei, X.; Hu, Z.; Alhazmi, M.; Yan, X.; Wu, C.; Lu, S.; et al. Electric vehicle charging planning: a complex systems perspective. IEEE Transactions on Smart Grid 2024. [Google Scholar] [CrossRef]
- Tilly, N.; Yigitcanlar, T.; Degirmenci, K.; Paz, A. Systems-Based Approach to Public Electric Vehicle Supply Equipment Expansion: An International Policy Analysis. Sustainable Cities and Society 2025, 106739. [Google Scholar] [CrossRef]
- Sachan, S.; Deb, S.; Singh, P.P.; Alam, M.S.; Shariff, S.M. A comprehensive review of standards and best practices for utility grid integration with electric vehicle charging stations. Wiley Interdisciplinary Reviews: Energy and Environment 2022, 11, e424. [Google Scholar] [CrossRef]
- Rodrigue, J.P. The Geography of Transport Systems; Routledge, 2020; Available online: https://transportgeography.org. [CrossRef]
- D’Amico, F.; Calvi, A.; Schiattarella, E.; Di Prete, M.; Veraldi, V. BIM and GIS data integration: a novel approach of technical/environmental decision-making process in transport infrastructure design. Transportation Research Procedia 2020, 45, 803–810. [Google Scholar] [CrossRef]
- Bayram, I.S.; Zafar, U.; Bayhan, S. Could petrol stations play a key role in transportation electrification? a GIS-based coverage maximization of fast EV chargers in urban environment. IEEE Access 2022, 10, 17318–17329. [Google Scholar] [CrossRef]
- Liu, J.; Sun, J.; Qi, X. Optimal placement of charging stations in road networks: a reinforcement learning approach with attention mechanism. Applied Sciences 2023, 13, 8473. [Google Scholar] [CrossRef]
- Majumder, M. Multi criteria decision making. Impact of urbanization on water shortage in face of climatic aberrations 2015, 35–47. [Google Scholar] [CrossRef]
- Choi, M.; Van Fan, Y.; Lee, D.; Kim, S.; Lee, S. Location and capacity optimization of EV charging stations using genetic algorithms and fuzzy analytic hierarchy process. Clean Technologies and Environmental Policy 2024, 1–14. [Google Scholar] [CrossRef]
- Alrifaie, M.F.; Habbal, A.; Kim, B.S. A fuzzy-multi attribute decision making scheme for efficient user-centric EV charging station selection. IEEE Access 2024. [Google Scholar] [CrossRef]
- Guler, D.; Yomralioglu, T. Suitable location selection for the electric vehicle fast charging station with AHP and fuzzy AHP methods using GIS. Annals of GIS 2020, 26, 169–189. [Google Scholar] [CrossRef]
- Ademulegun, O.O.; MacArtain, P.; Oni, B.; Hewitt, N.J. Multi-stage multi-criteria decision analysis for siting electric vehicle charging stations within and across border regions. Energies 2022, 15, 9396. [Google Scholar] [CrossRef]
- Lopes, J.C.; Sousa, T.; Melo, J.D. Demand estimation for electric vehicle charging infrastructure: an extensive approach method. IEEE Access 2024. [Google Scholar] [CrossRef]
- Keramati, F.; Mohammadi, H.R. Optimal Placement of Plug-in Electric Vehicles Fast-Charging Stations Using Geographic Information System and Considering Power Distribution Network Indexes: A Case Study in Kabul. International Journal of Industrial Electronics Control and Optimization 2024, 7, 313–325. [Google Scholar] [CrossRef]
- Csiszár, C.; Csonka, B.; Földes, D.; Wirth, E.; Lovas, T. Location optimisation method for fast-charging stations along national roads. Journal of Transport Geography 2020, 88, 102833. [Google Scholar] [CrossRef]
- Asna, M.; Shareef, H.; Achikkulath, P.; Mokhlis, H.; Errouissi, R.; Wahyudie, A. Analysis of an Optimal Planning Model for Electric Vehicle Fast-Charging Stations in Al Ain City, United Arab Emirates. IEEE Access 2021, 9, 73678–73694. [Google Scholar] [CrossRef]
- Abouelela, M.; Stamos, I.; Chaniotakis, M.E.; Antoniou, C. Disentangling the relationships between the SDGs and transportation. Research in Transportation Business & Management 2025, 62, 101447. [Google Scholar] [CrossRef]
- Yi, Z.; Bauer, P.H. Energy consumption model and charging station placement for electric vehicles. In Proceedings of the International Conference on Smart Grids and Green IT Systems; SciTePress, 2014; Vol. 2, pp. 150–156. [Google Scholar] [CrossRef]
- Memon, M.; Rossi, C. A Review of EV Adoption, Charging Standards, and Charging Infrastructure Growth in Europe and Italy. Batteries 2025, 11, 229. [Google Scholar] [CrossRef]
- U.S. Environmental Protection Agency. Plug-In Electric Vehicle Charging, 2023. Accessed: 08-05-2025. Available online: https://www.epa.gov/greenvehicles/plug-electric-vehicle-charging-details.
- Selva-López, C.; Gómez-Ramírez, G.A.; Núñez-Mata, O.; Calderón-Obaldía, F.; Siles-Canales, F. Preliminary Location of Fast Charging Stations for EVs Along National Corridors: A Case Study. In Proceedings of the 2024 IEEE 42nd Central America and Panama Convention (CONCAPAN XLII); IEEE, 2024; pp. 1–6. [Google Scholar] [CrossRef]
- Xing, Q.; Chen, Z.; Zhang, Z.; Xu, X.; Zhang, T.; Huang, X.; Wang, H. Urban electric vehicle fast-charging demand forecasting model based on data-driven approach and human decision-making behavior. Energies 2020, 13, 1412. [Google Scholar] [CrossRef]
- Thakkar, J.J. Multi-criteria decision making; Springer, 2021; Vol. 336. [Google Scholar] [CrossRef]
- Panapakidis, I.P.; Christoforidis, G.C. Optimal Selection of Clustering Algorithm via Multi-Criteria Decision Analysis (MCDA) for Load Profiling Applications. Applied Sciences 2018, 8, 237. [Google Scholar] [CrossRef]
- Hajduk, S. Multi-Criteria Analysis in the Decision-Making Approach for the Linear Ordering of Urban Transport Based on TOPSIS Technique. Energies 2022, 15. [Google Scholar] [CrossRef]
- International Energy Agency. Global EV Outlook 2025. Technical report, IEA, 2025. Available online: https://www.iea.org/reports/global-ev-outlook-2025/electric-vehicle-charging.
- Woo, J.; Magee, C.L. Forecasting the value of battery electric vehicles compared to internal combustion engine vehicles: The influence of driving range and battery technology. International Journal of Energy Research 2020, 44, 6483–6501. [Google Scholar] [CrossRef]
- Papathanasiou, J.; Ploskas, N.; Papathanasiou, J.; Ploskas, N. Topsis; Springer, 2018. [Google Scholar] [CrossRef]
- Grosfeld-Nir, A.; Ronen, B.; Kozlovsky, N. The Pareto managerial principle: when does it apply? International Journal of Production Research 2007, 45, 2317–2325. [Google Scholar] [CrossRef]
- Deb, S.; Tammi, K.; Kalita, K.; Mahanta, P. Review of recent trends in charging infrastructure planning for electric vehicles. WIREs Energy and Environment 2018, 7, e306. [Google Scholar] [CrossRef]
- International Energy Agency. Global Energy and Climate Model Documentation. Technical report, IEA. 2024. Available online: https://www.iea.org/reports/global-ev-outlook-2025/outlook-for-energy-demand#electricity-demand.
- Gómez-Ramírez, G.A.; Solis-Ortega, R. Electric vehicle penetration modelling for Costa Rica power system. In Proceedings of the 2021 IEEE CHILEAN Conference on Electrical, Electronics Engineering, Information and Communication Technologies (CHILECON); IEEE, 2021; pp. 1–6. [Google Scholar] [CrossRef]
- Gómez-Ramírez, G.A.; Solis-Ortega, R.; Ross-Lépiz, L.A. Impact of electric vehicles on power transmission grids. Heliyon 2023, 9. [Google Scholar] [CrossRef] [PubMed]
- Ministerio de Ambiente y Energía (MINAE). Plan Nacional de Descarbonización: Costa Rica 2018–2050, 2019. San José, Costa Rica. Gobierno de la República de Costa Rica. Available online: https://cambioclimatico.minae.go.cr/plan-nacional-de-descarbonizacion/#doc-general.
- Gómez-Ramírez, G.A.; Mora-Jiménez, G.; Meza, C. Simulación del sistema de interconexión eléctrica de los países de América Central usando ETAP. Revista Tecnología en Marcha 2023, 36, 50–58. [Google Scholar] [CrossRef]
- Laboratorio Nacional de Materiales y Modelos Estructurales (LanammeUCR). Informe de Evaluación de la Red Vial Nacional Pavimentada de Costa Rica, Años 2022-2023. Technical report, Universidad de Costa Rica, San Pedro de Montes de Oca, San José, Costa Rica, 2024. EIC-Lanamme-INF-1532-2023. Available online: https://www.lanamme.ucr.ac.cr/repositorio/handle/50625112500/2728.
- División Operación y Control del Sistema Eléctrico, Área de Análisis del SEN y Gestión de Agentes. El Estado del Sistema Eléctrico Nacional (SEN). Technical report. Grupo ICE; San José, Costa Rica, 2024. Available online: http://www.grupoice.com/CenceWeb.
- González, L.; Siavichay, E.; Espinoza, J. Impact of EV fast charging stations on the power distribution network of a Latin American intermediate city. Renewable and Sustainable Energy Reviews 2019, 107, 309–318. [Google Scholar] [CrossRef]
- American National Standard. ANSI C84.1-2020. 2020. Available online: https://webstore.ansi.org/standards/nema/ANSIC842020.
- Banegas, J.; Mamkhezri, J. A systematic review of geographic information systems based methods and criteria used for electric vehicle charging station site selection. In Environmental Science and Pollution Research; 2023. [Google Scholar] [CrossRef]
- Sani, G.; Abas, A.; Yusoff, N.; Said, M. Site selection for electric vehicle charging stations using GIS with MCDM AHP FAHP and TOPSIS techniques. A Review. In Proceedings of the IOP Conference Series: Earth and Environmental Science; IOP Publishing, 2023; Vol. 1274, p. 012019. [Google Scholar] [CrossRef]
- Rashmitha, Y.; Sushma, M.; Roy, S. A novel multi-criteria framework for selecting optimal sites for electric vehicle charging stations from a sustainable perspective: evidence from India. Environment, Development and Sustainability 2024, 1–27. [Google Scholar] [CrossRef]
- Li, J.; Chew, A.; Wang, H. Investigating state-of-the-art planning strategies for electric vehicle charging infrastructures in coupled transport and power networks: A comprehensive review. Progress in Energy 2024. [Google Scholar] [CrossRef]
- Csiszár, C.; Csonka, B.; Földes, D.; Wirth, E.; Lovas, T. Urban public charging station locating method for electric vehicles based on land use approach. Journal of Transport Geography 2019, 74, 173–180. [Google Scholar] [CrossRef]
- Guerrero-Silva, J.A.; Romero-Gelvez, J.I.; Aristizábal, A.J.; Zapata, S. Optimization and Trends in EV Charging Infrastructure: A PCA-Based Systematic Review. World Electric Vehicle Journal 2025, 16, 345. [Google Scholar] [CrossRef]
- Serrano Olea, Pablo Andrés. Almost Perfect: Challenges and Opportunities for Reaching Net Zero in Electricity Generation in Costa Rica, 2024. Student paper. Available online: https://lup.lub.lu.se/student-papers/search/publication/9164428.
Figure 1.
Strategic approach to EV fast-charging siting based on multi-criteria analysis and grid integration.
Figure 1.
Strategic approach to EV fast-charging siting based on multi-criteria analysis and grid integration.
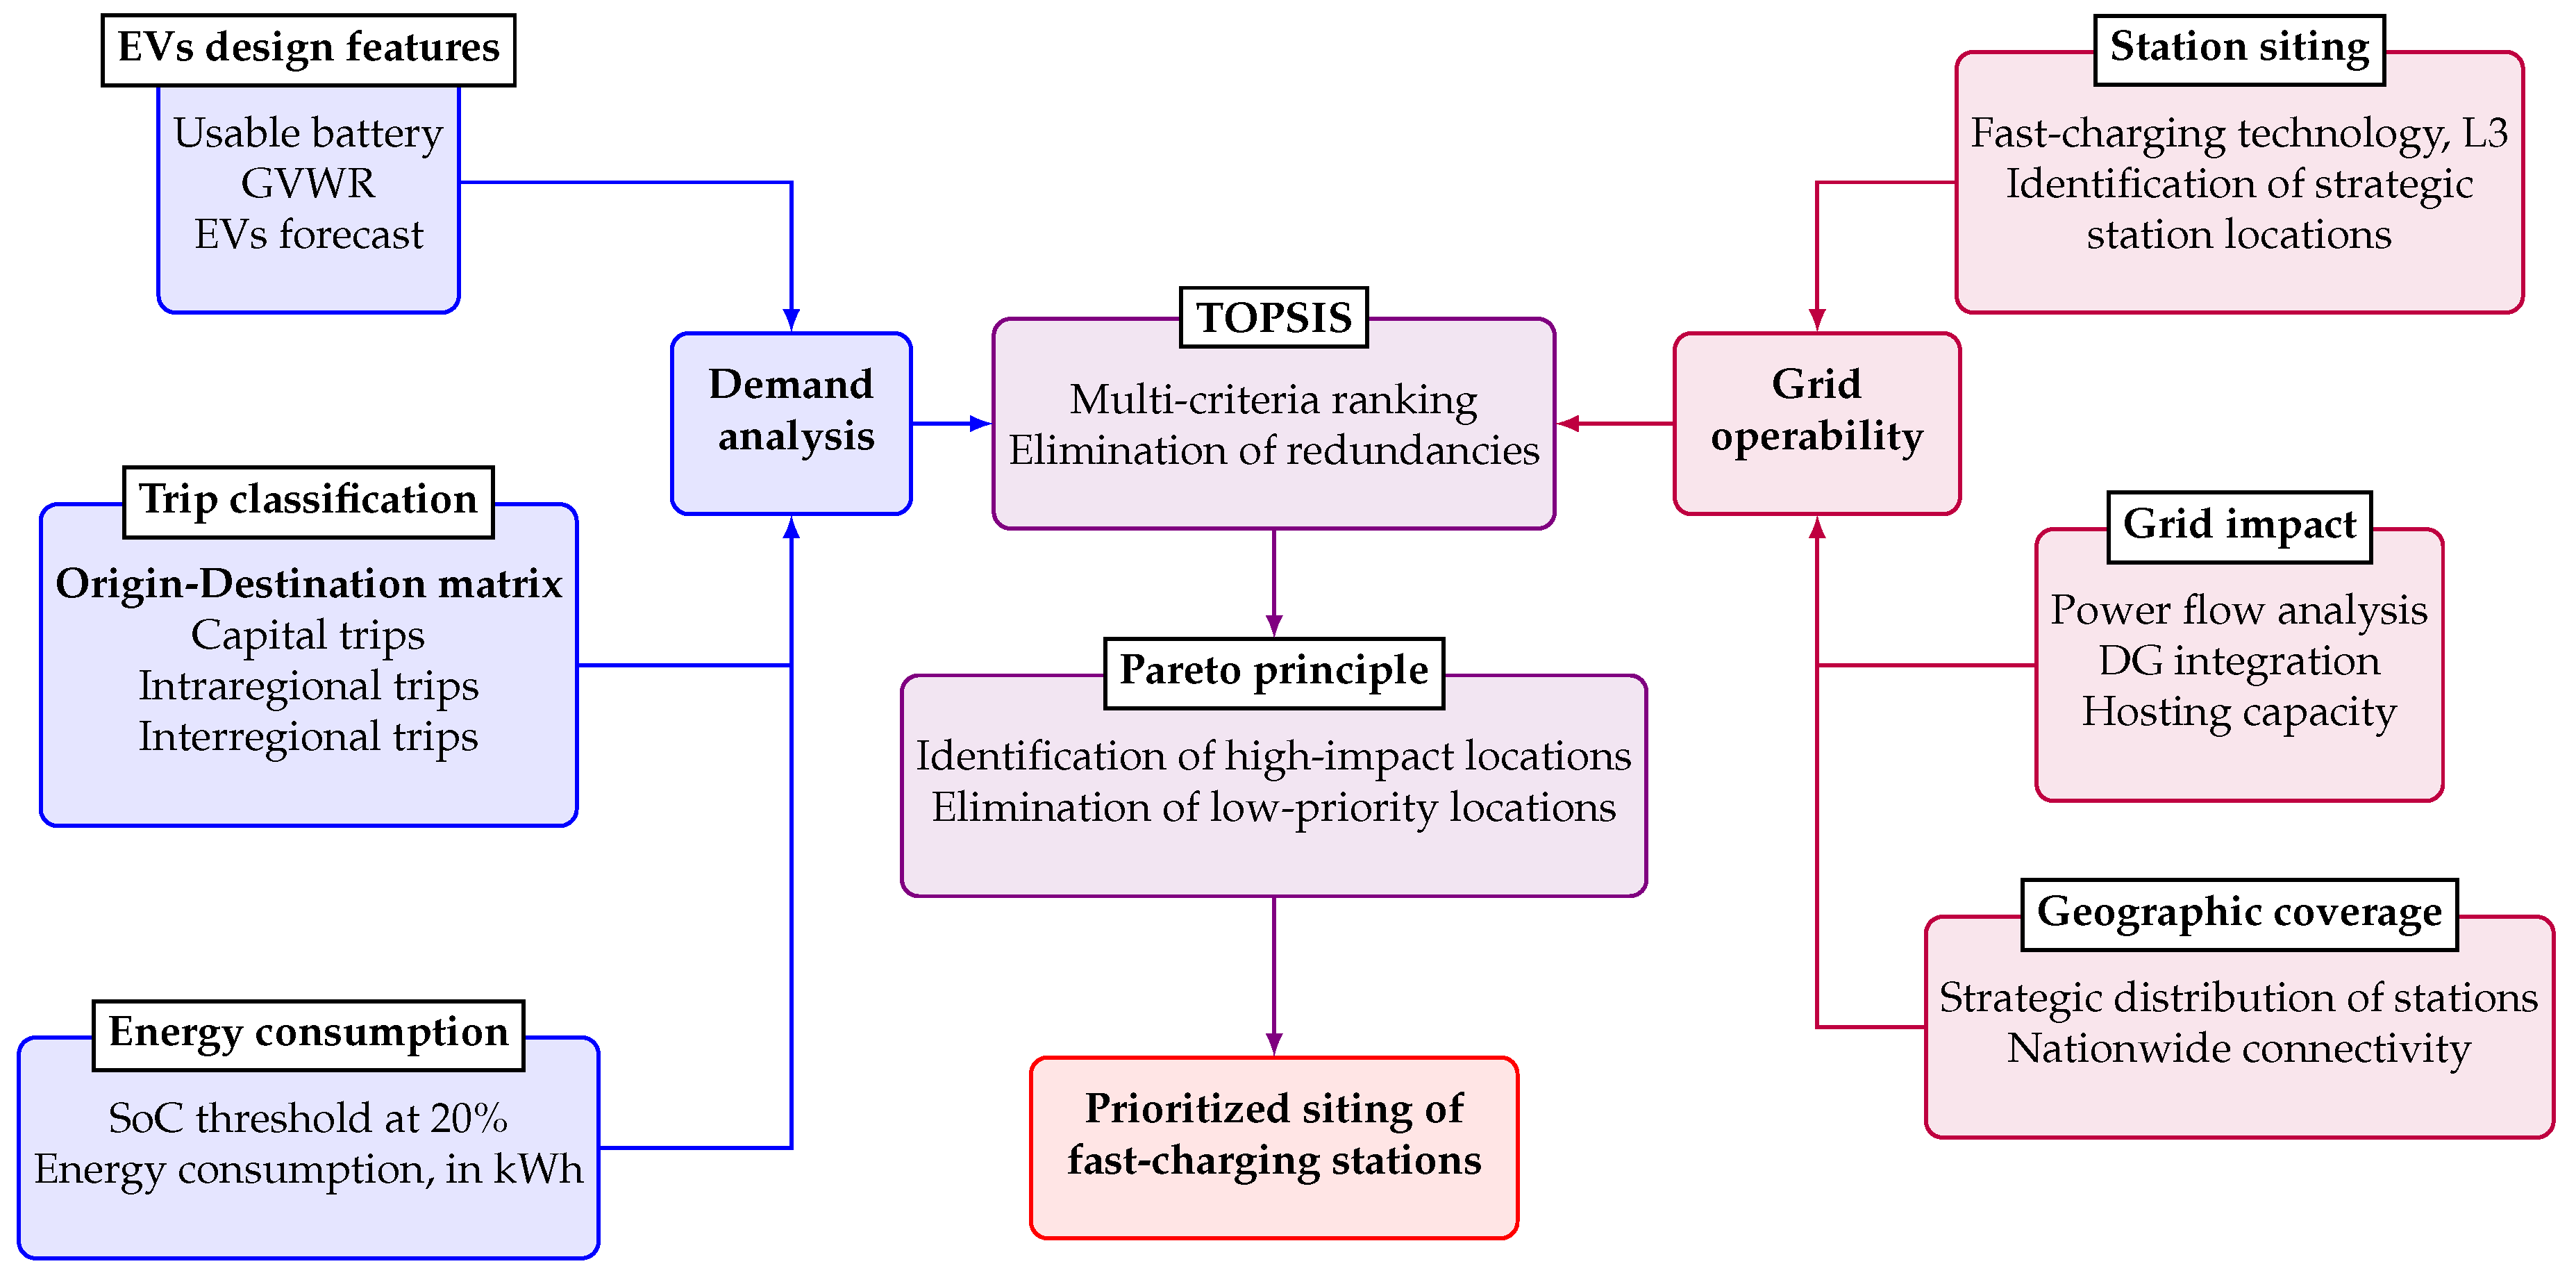
Figure 2.
Comparative radar chart of five MCDM methods, AHP, TOPSIS, ÉLECTRE, VIKOR, and PROMETHEE, assessed across five qualitative criteria: handling uncertainty, ease of use, ranking clarity, data requirements, and interpretability. Scores (0-10) show TOPSIS as the best-performing method, leading in four of the five criteria, followed by VIKOR and AHP, while PROMETHEE and ÉLECTRE recorded the lowest overall scores.
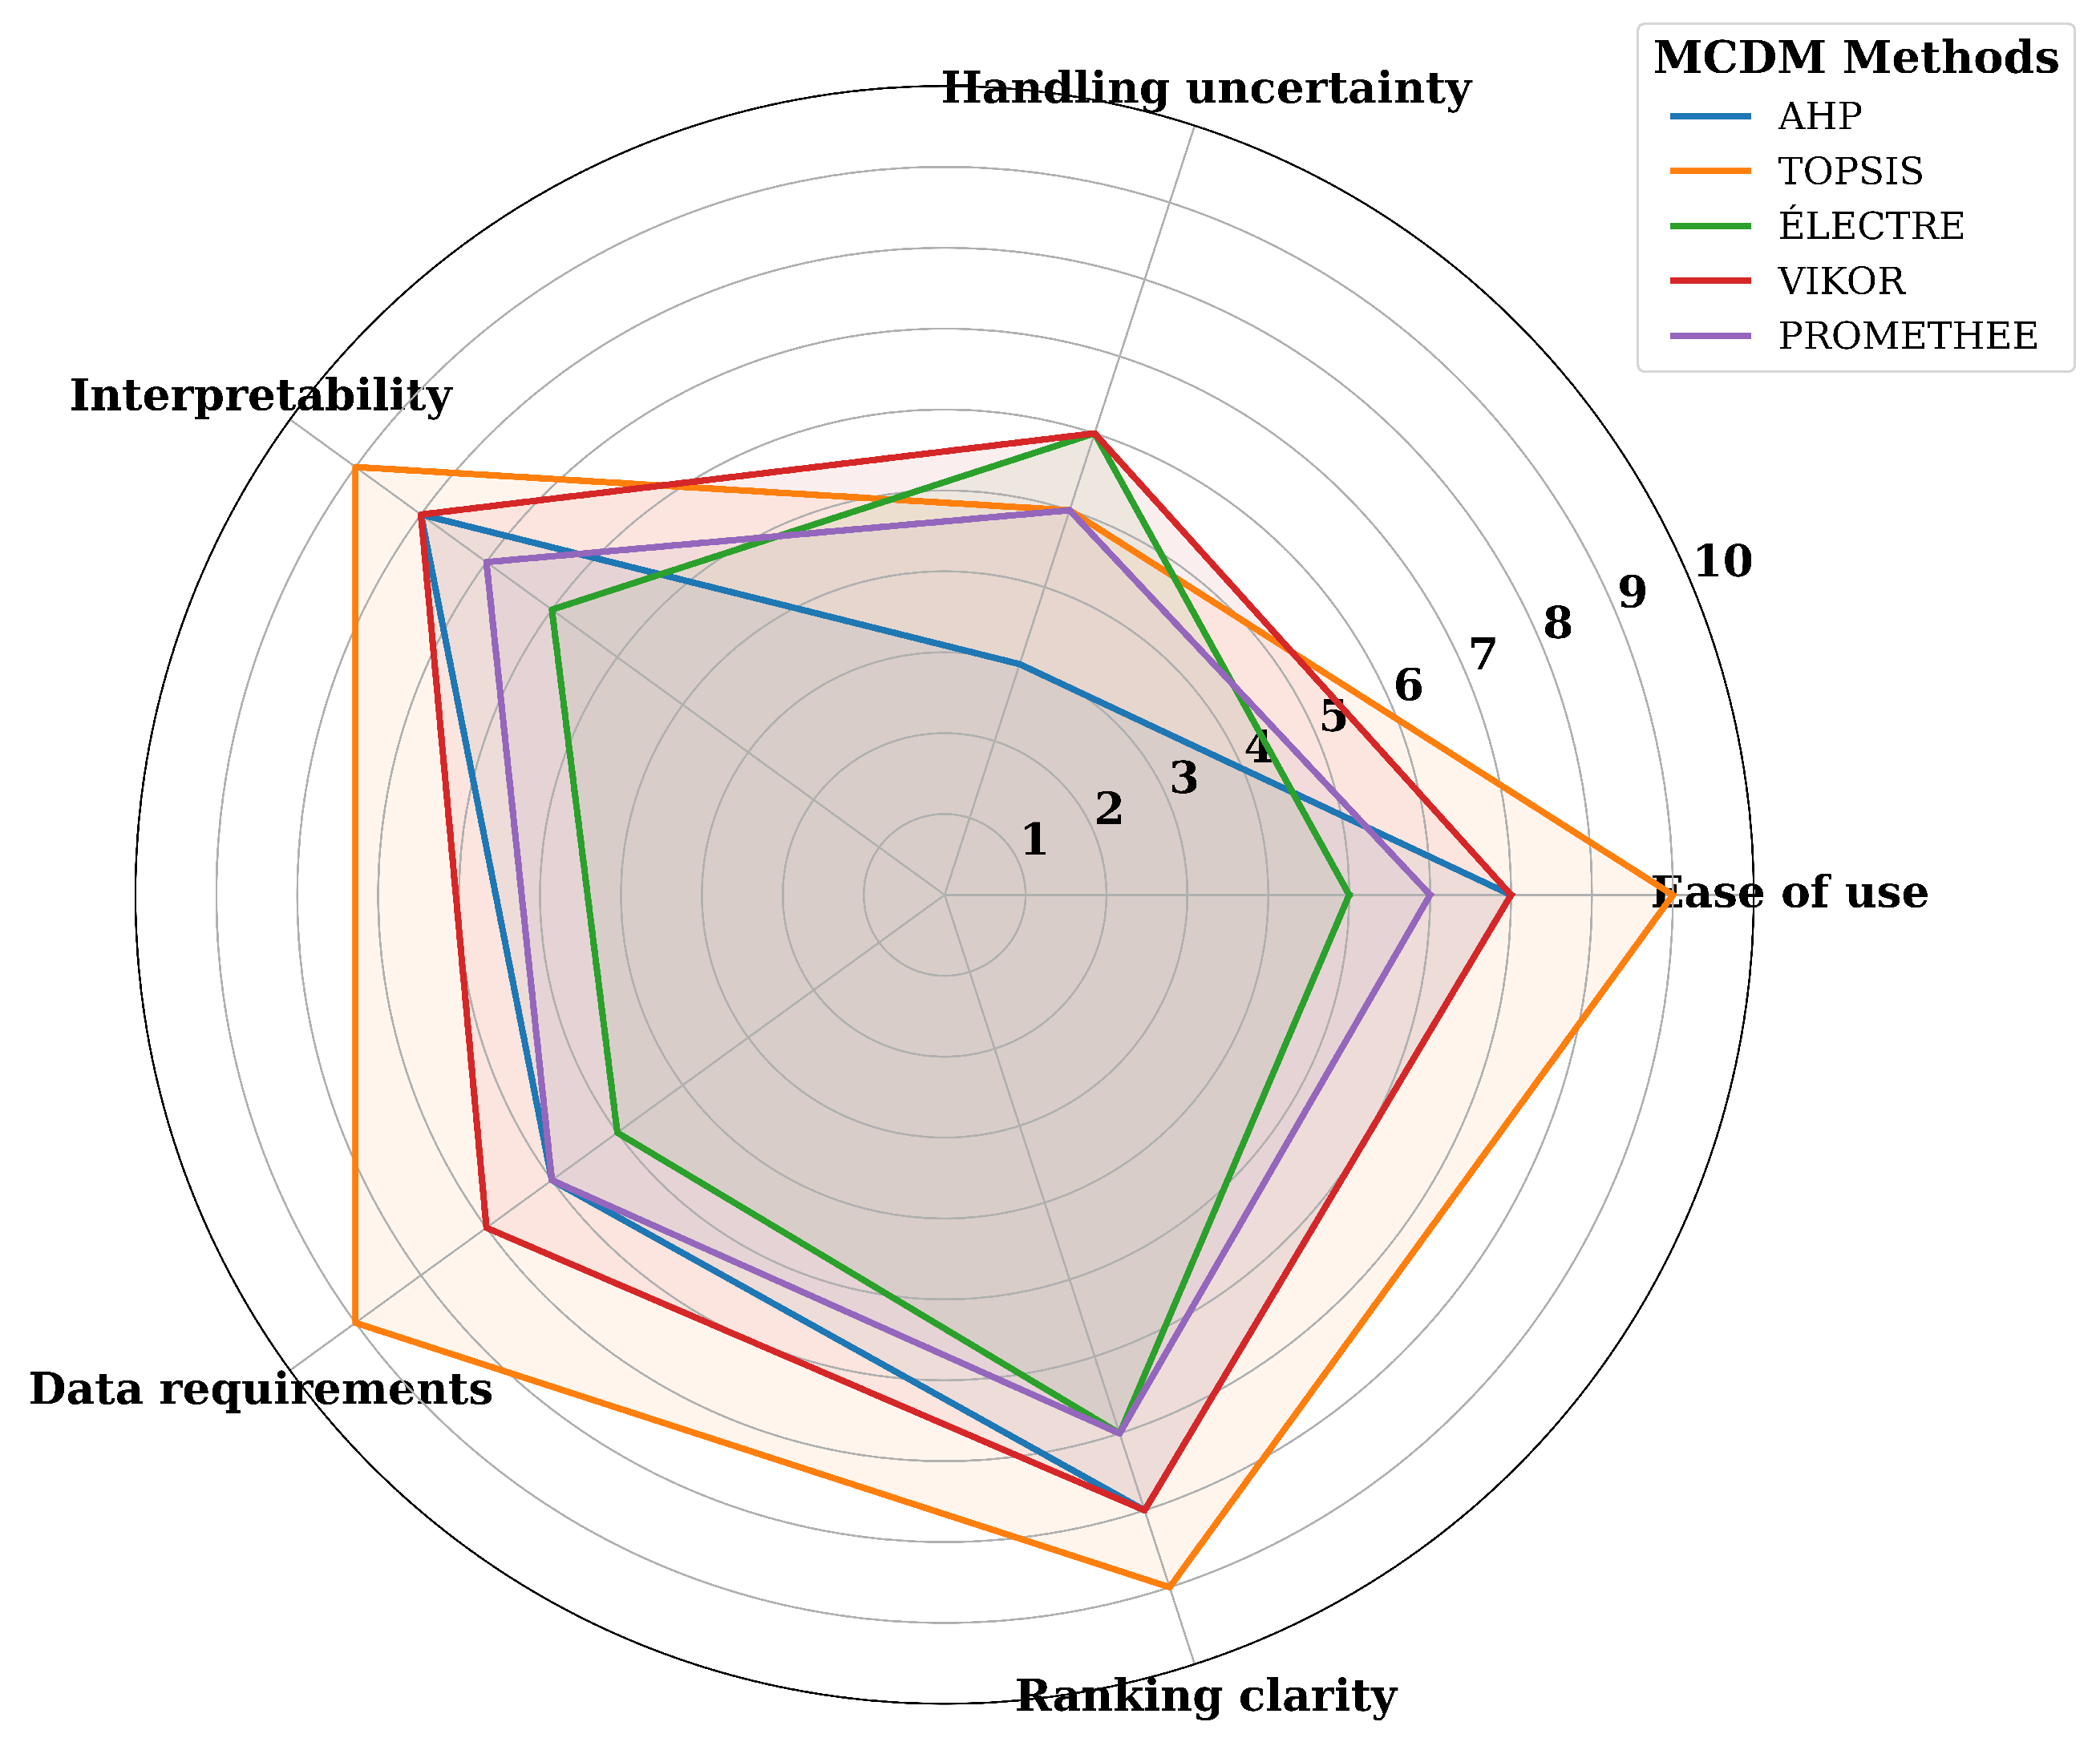
Figure 3.
Prioritized segments of Costa Rica’s NRN for the siting of fast-charging stations. The highlighted segments indicate the final prioritized corridors, identified according to traffic demand, connectivity, and regional coverage. The base map shows the NRN by road hierarchy—primary, secondary, and tertiary—together with the six socioeconomic regions of the country. Major urban centers are labeled to provide spatial context for infrastructure deployment.
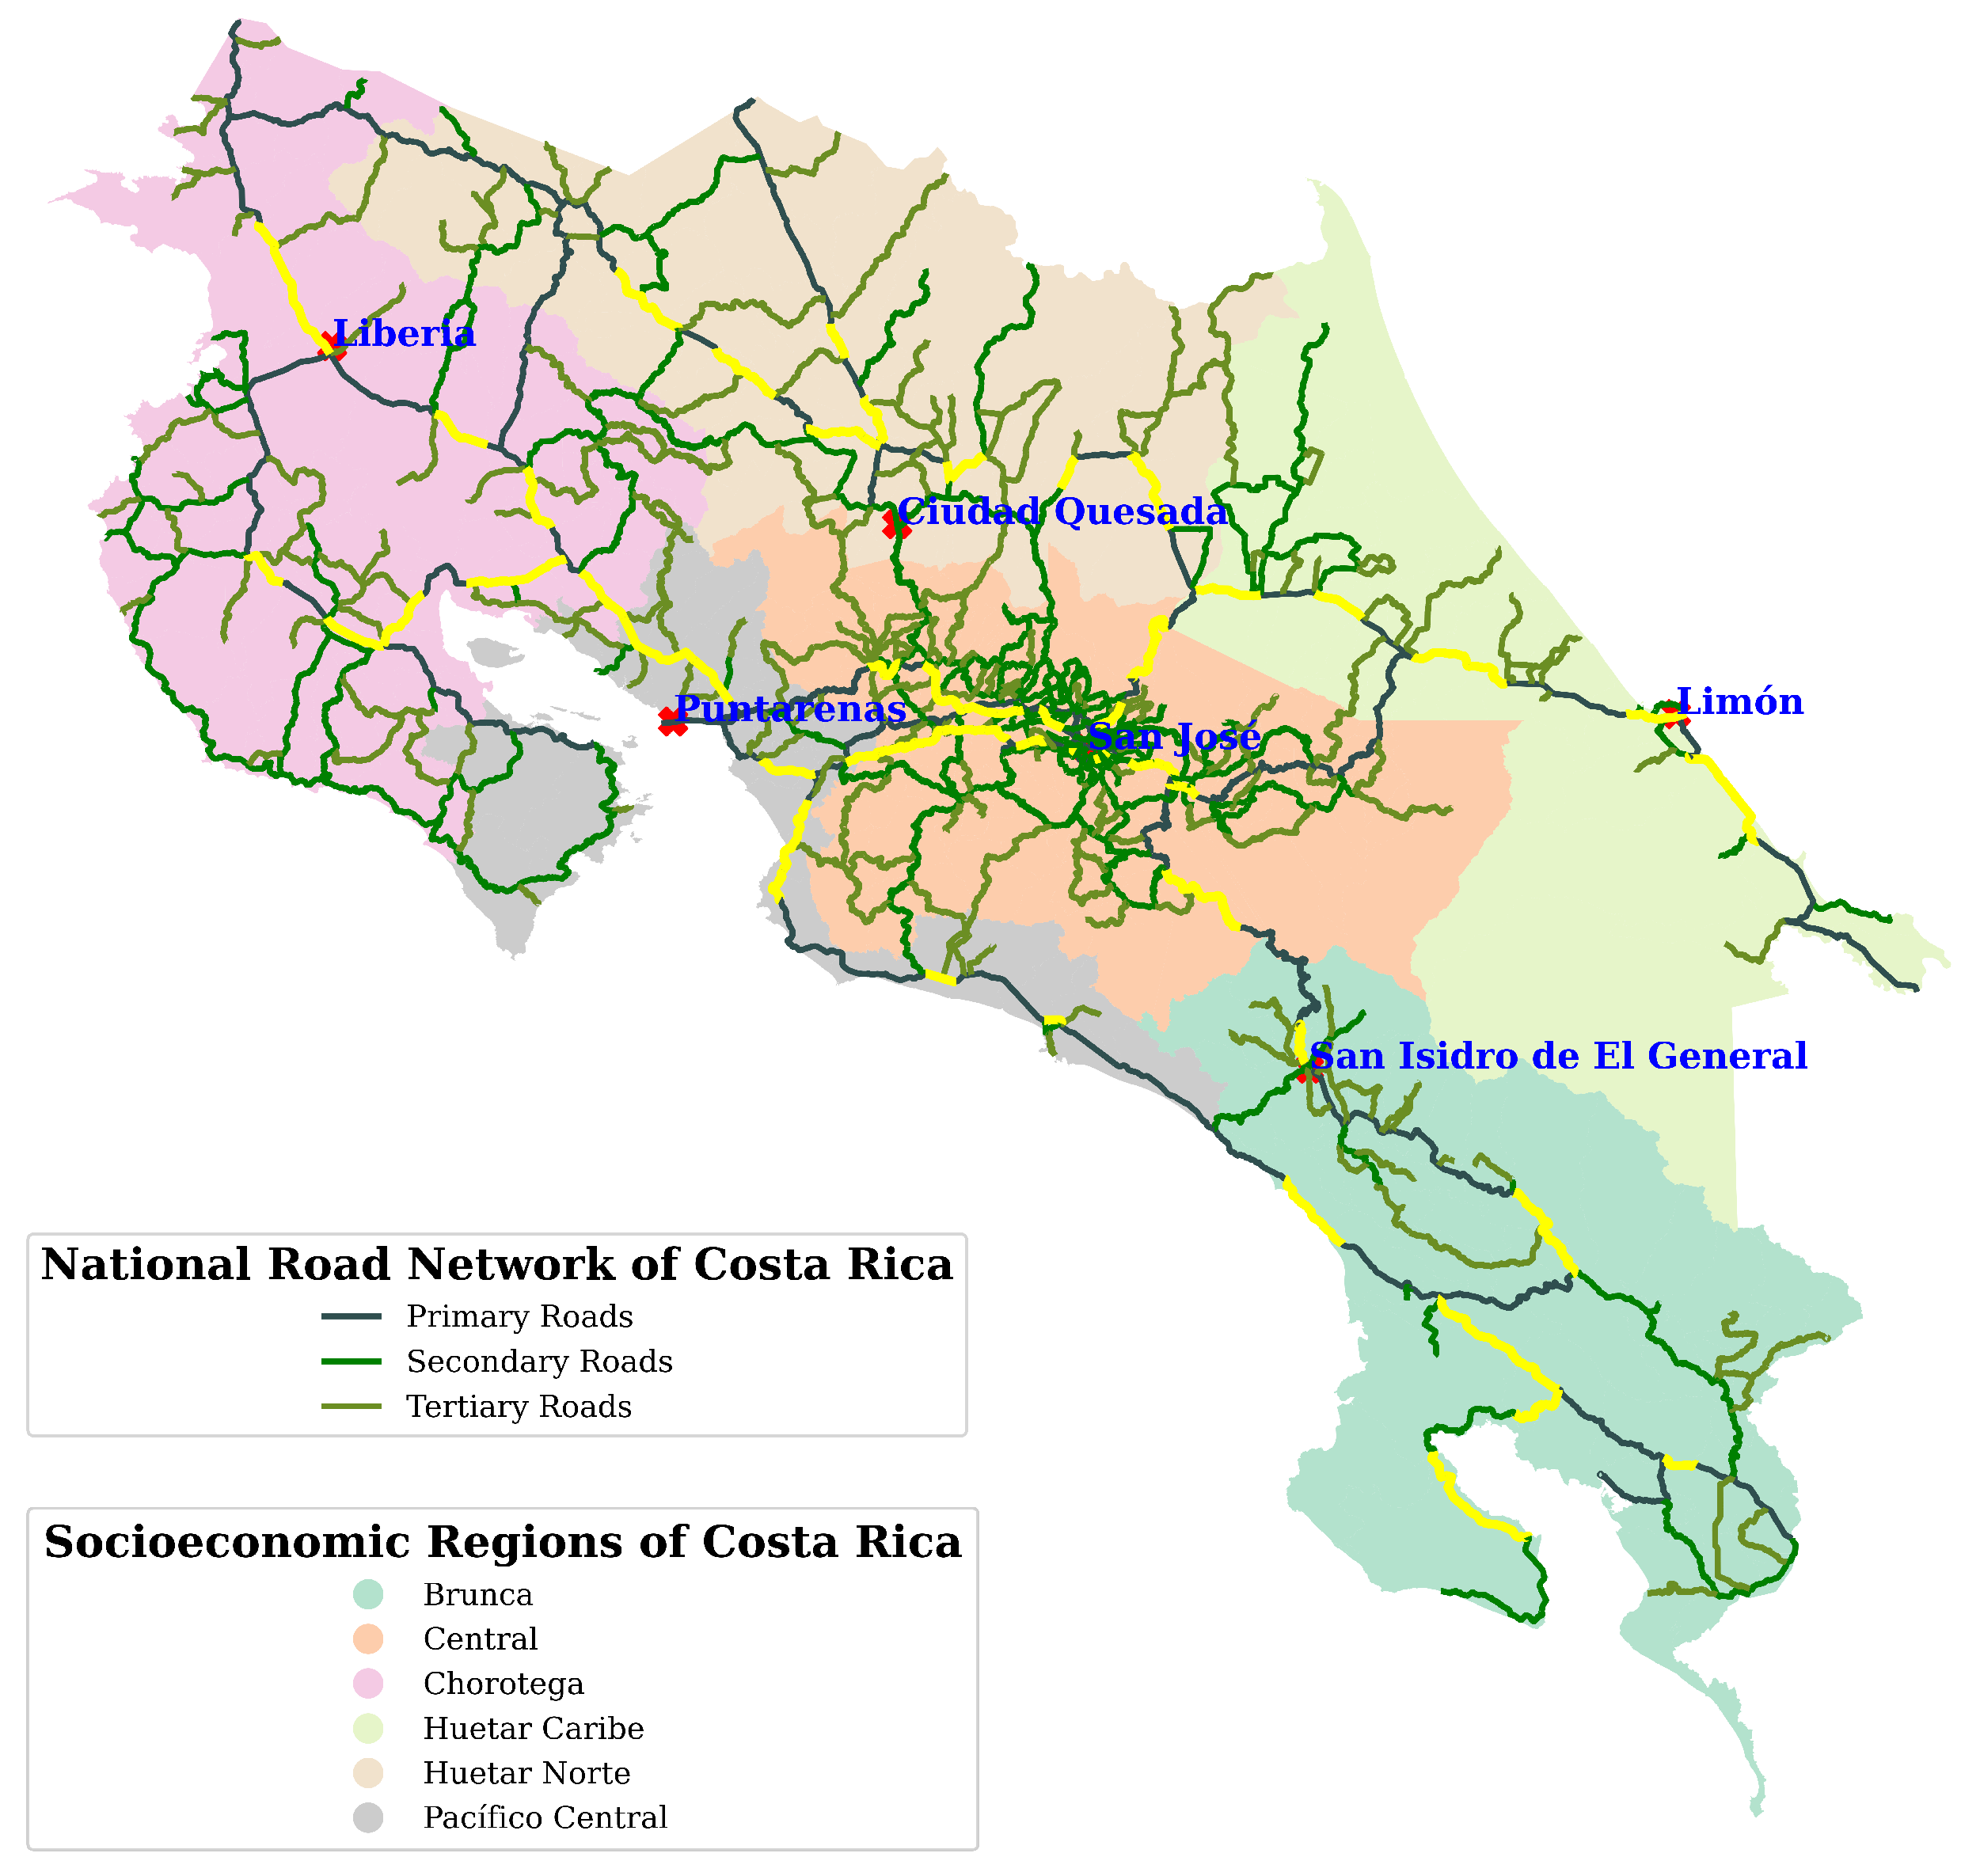
Figure 4.
Voltage levels and load profile simulations for Costa Rica’s NES under projected EV charging demand and photovoltaic (PV) penetration scenarios. The subfigures present hourly voltage levels across transmission and distribution nodes: (a) 230 kV buses, (b) 138 kV buses, and (c) 13.8 kV, 24.9 kV, and 34.5 kV buses, expressed in per-unit (% p.u.) values relative to nominal voltage over a 24-hour horizon.
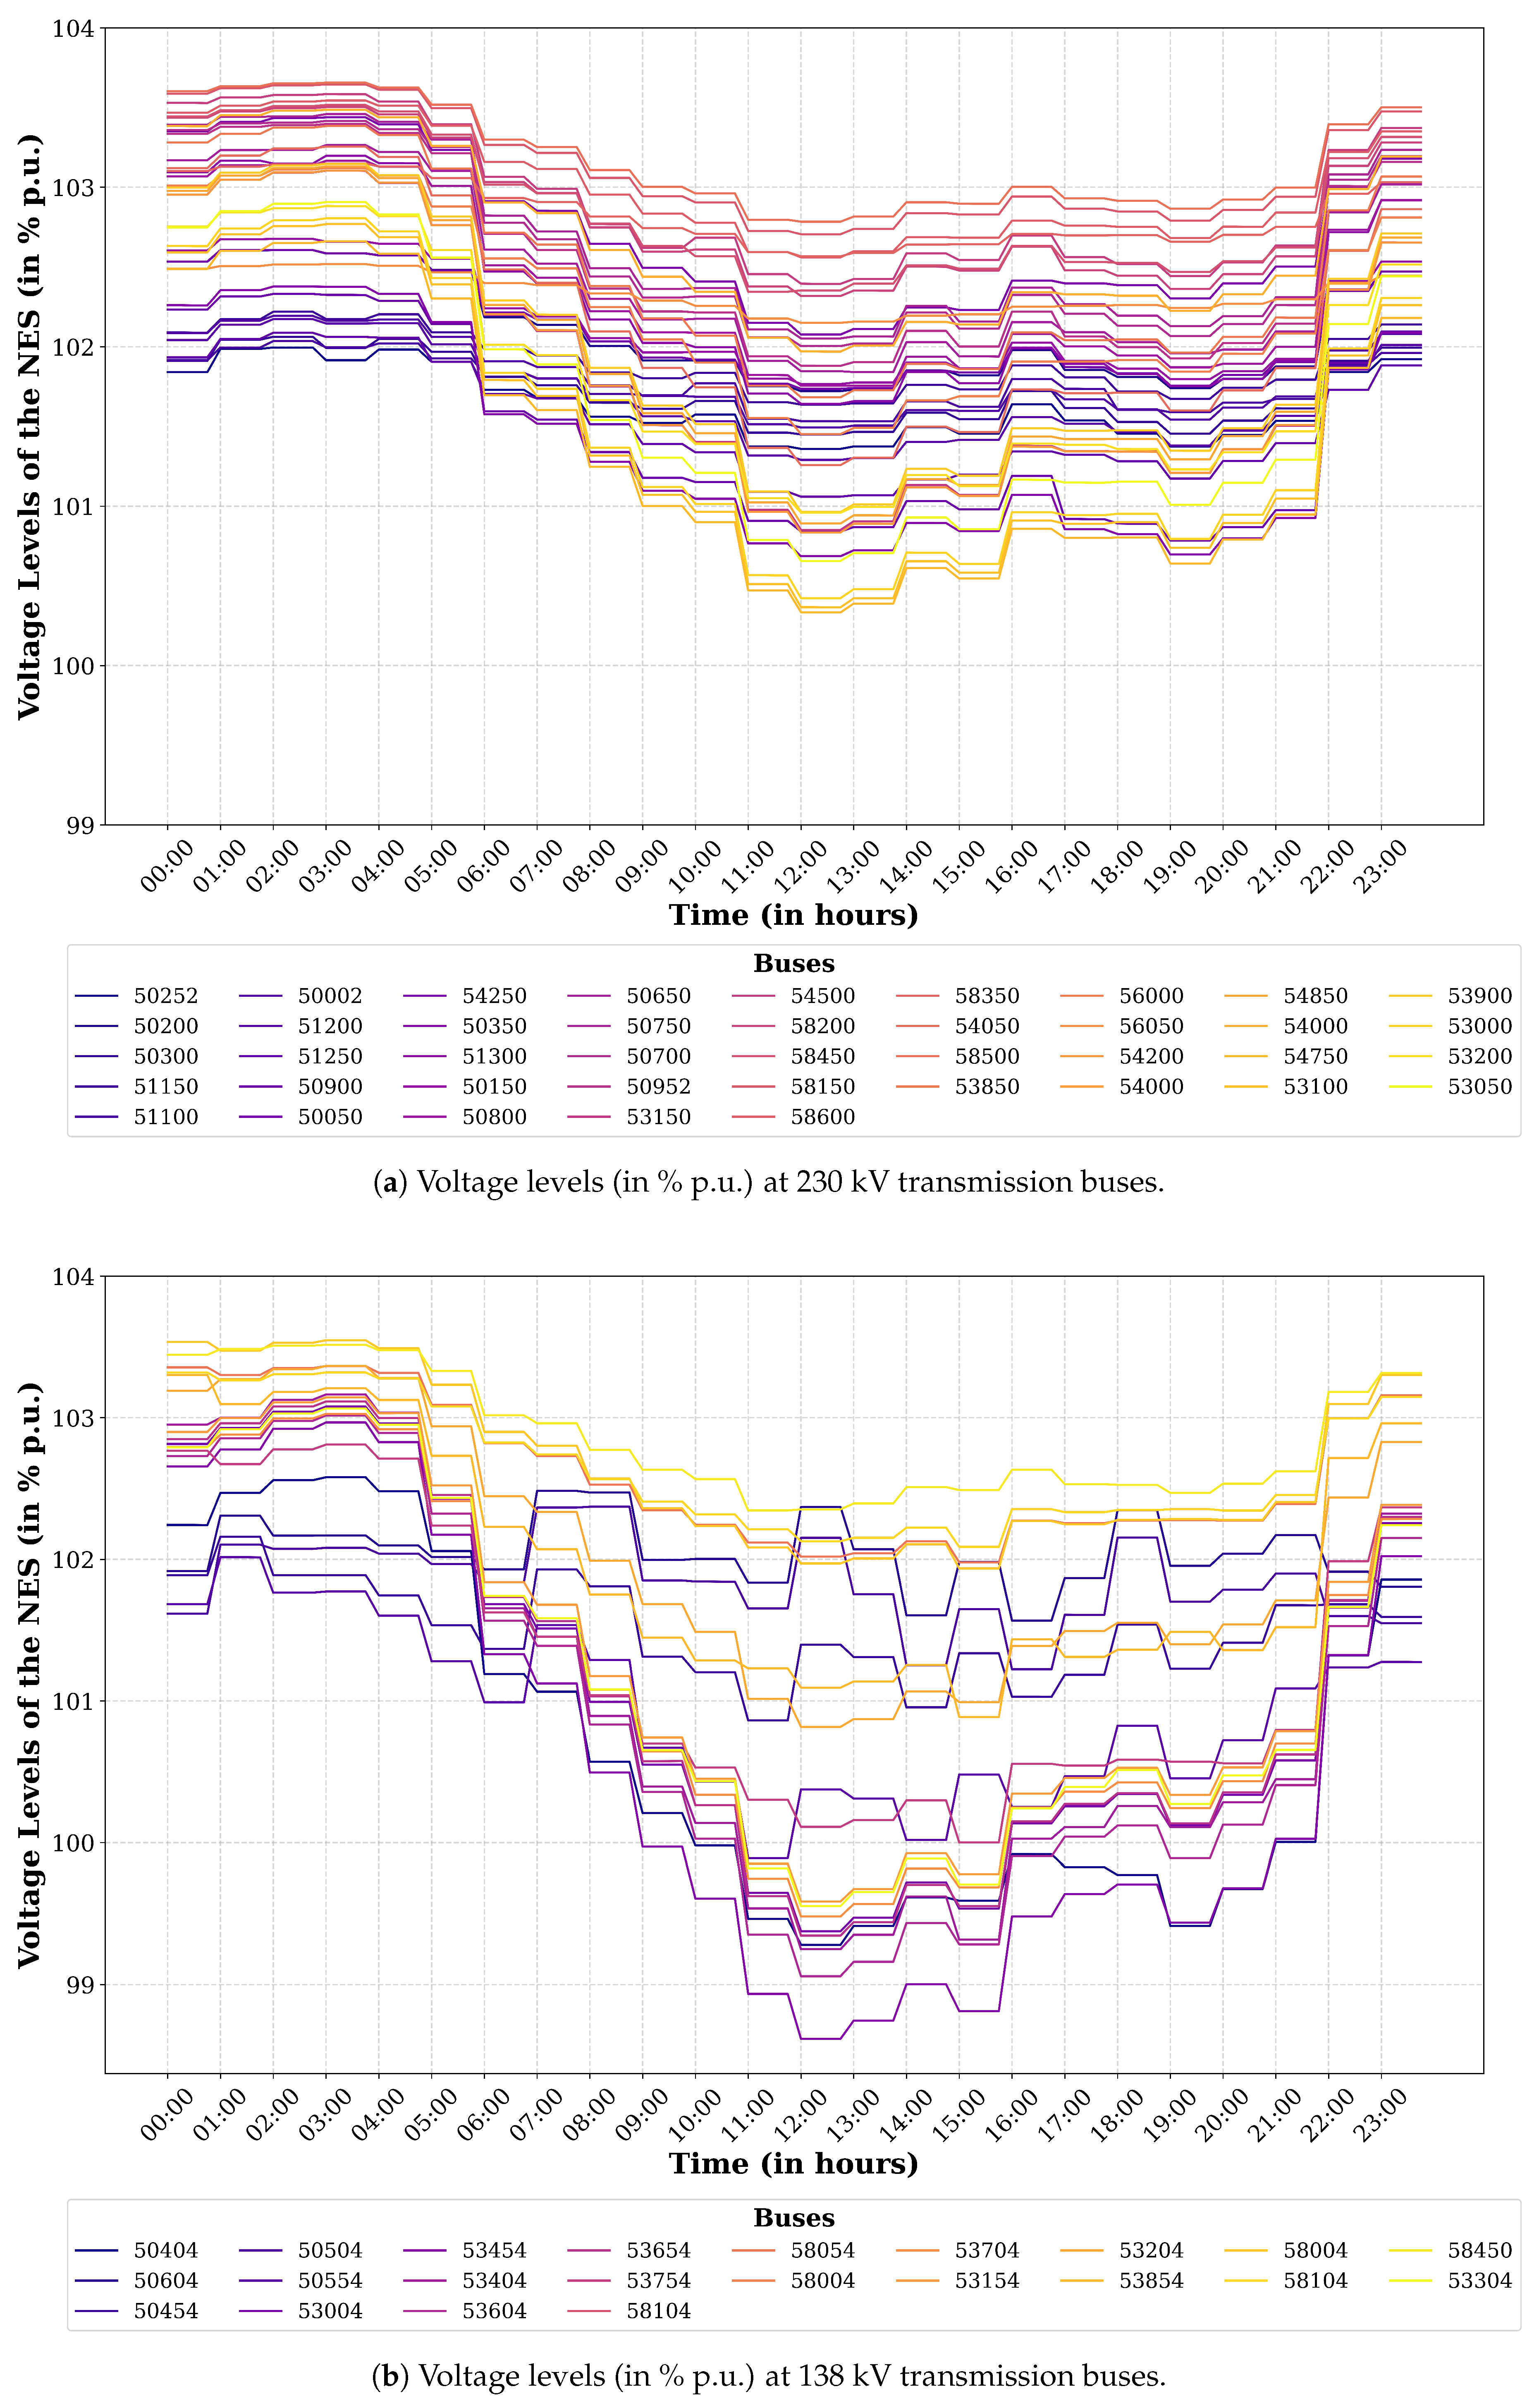
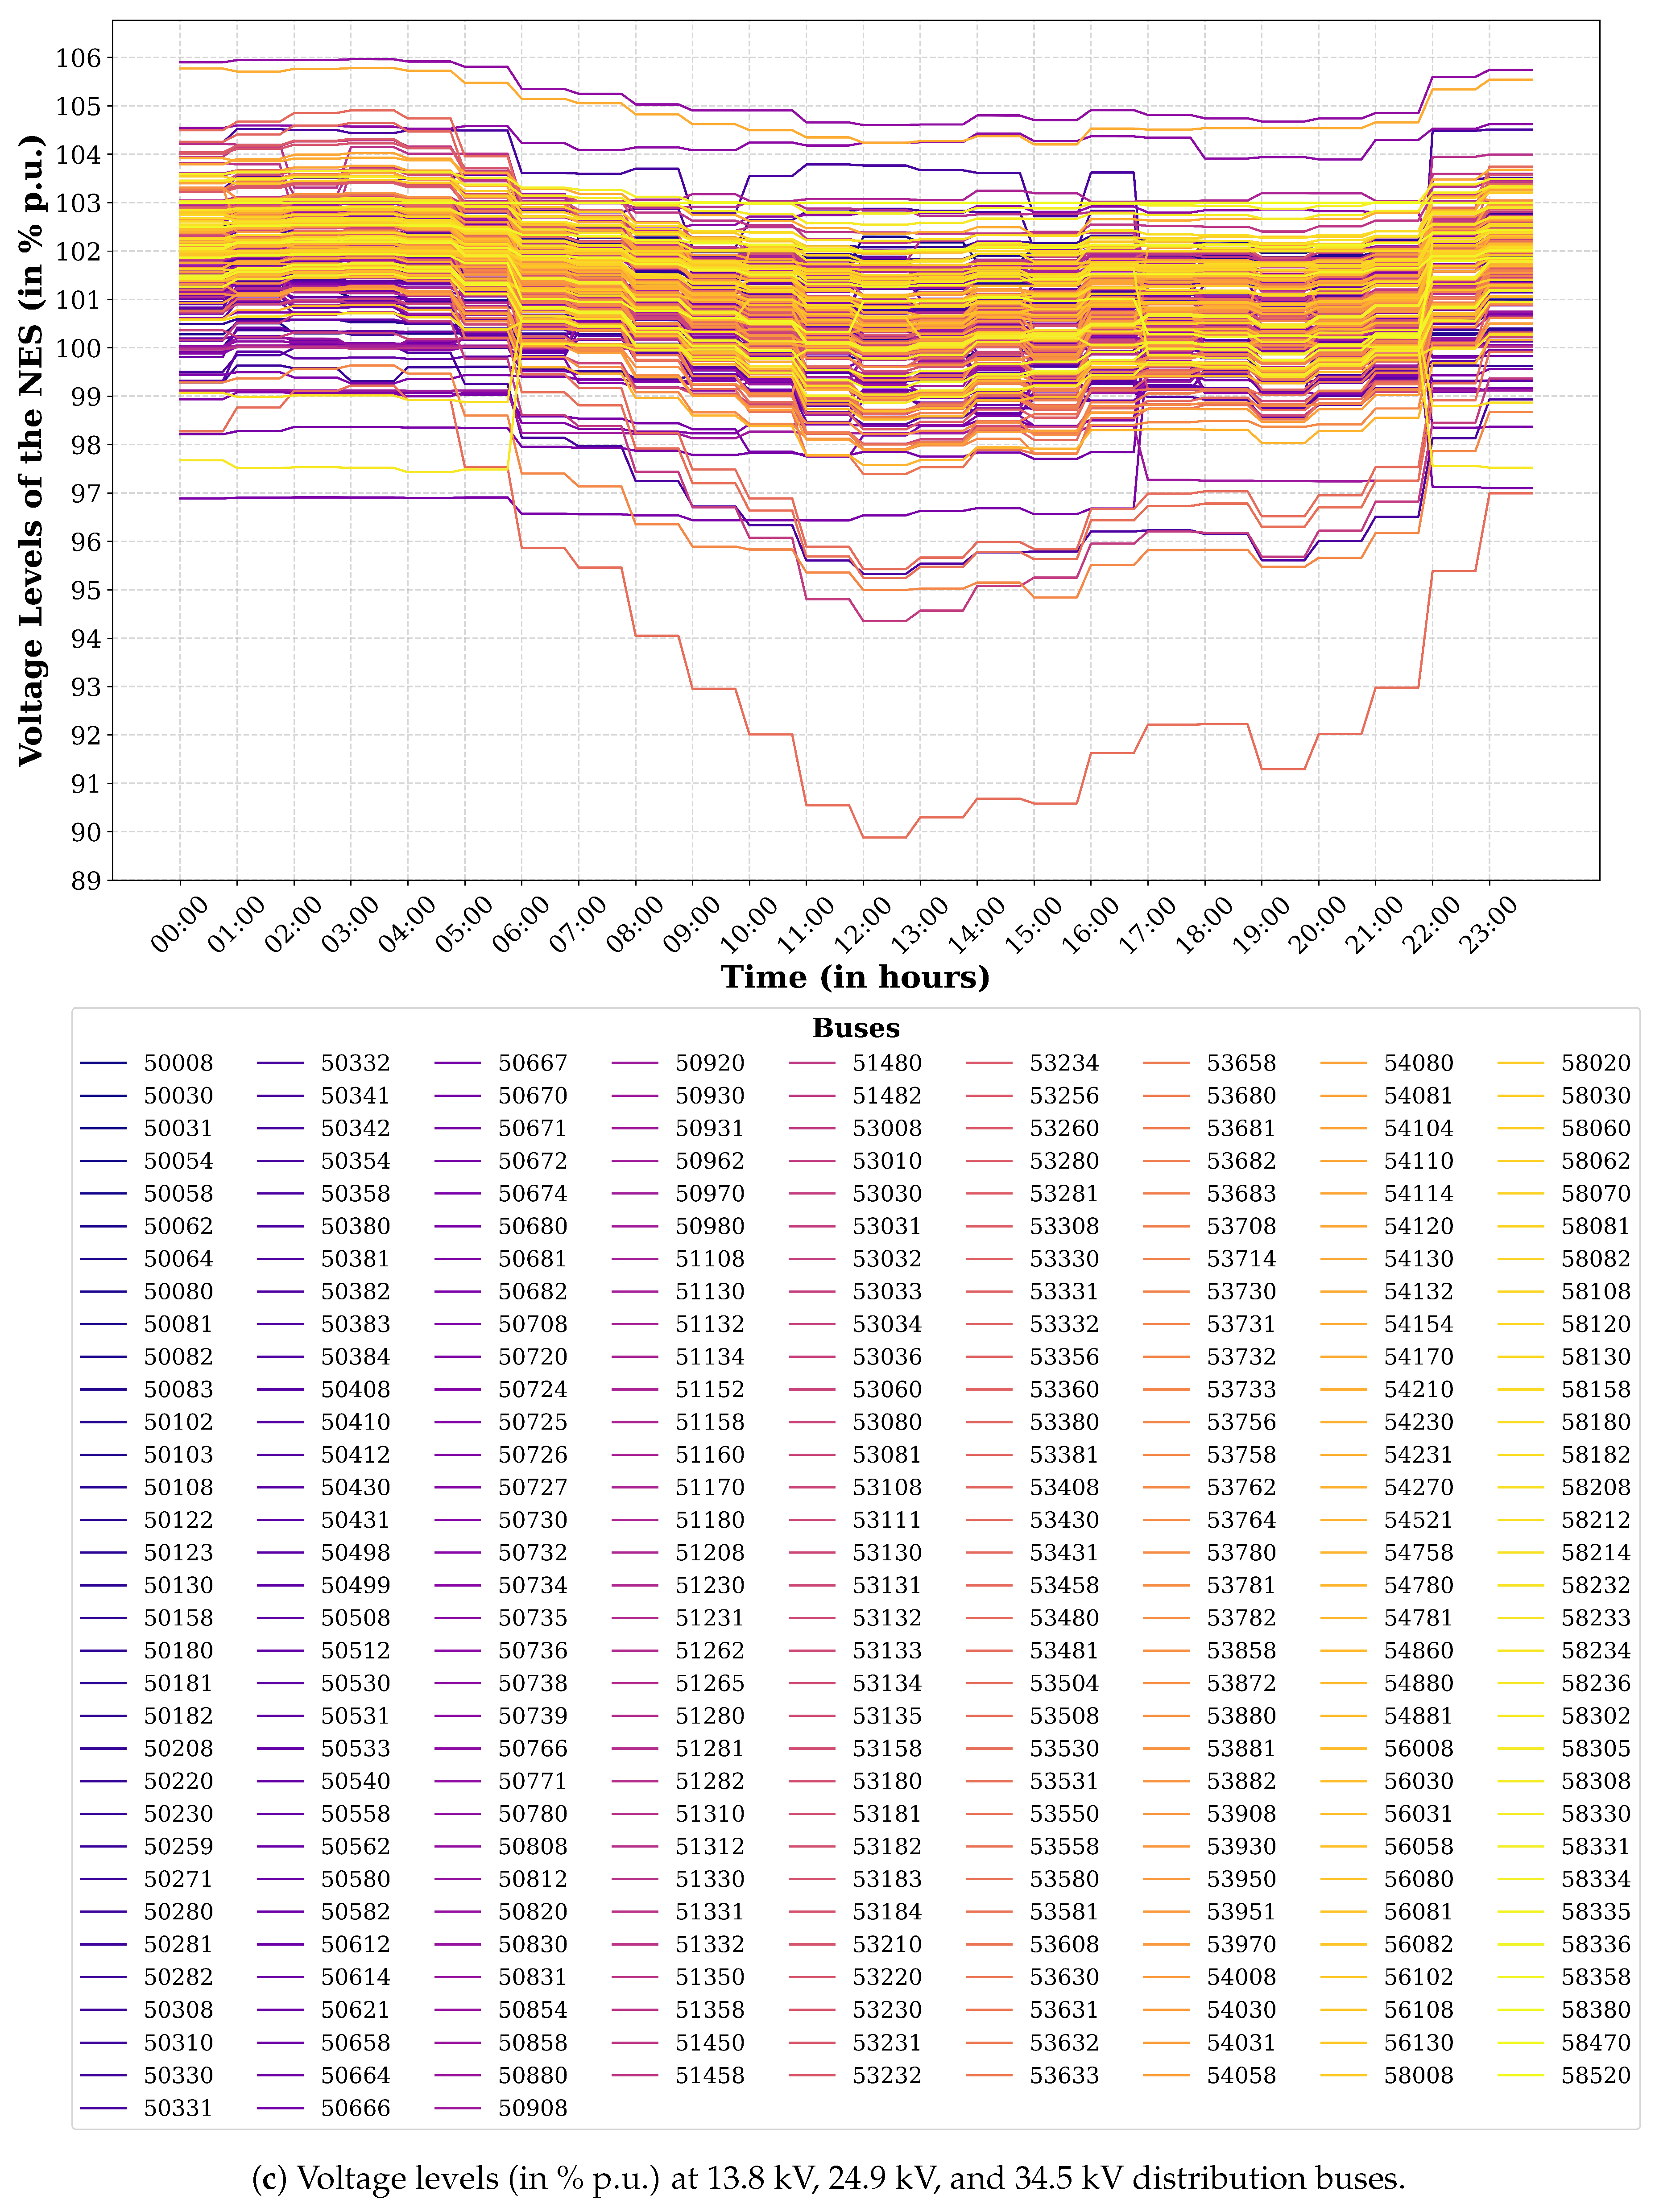
Figure 5.
Hourly load demand profile comparing base load (without EVs), additional EV charging load, and total load with EVs, along with PV contributions at 5%, 10%, 15%, and 20% penetration levels.
Figure 5.
Hourly load demand profile comparing base load (without EVs), additional EV charging load, and total load with EVs, along with PV contributions at 5%, 10%, 15%, and 20% penetration levels.
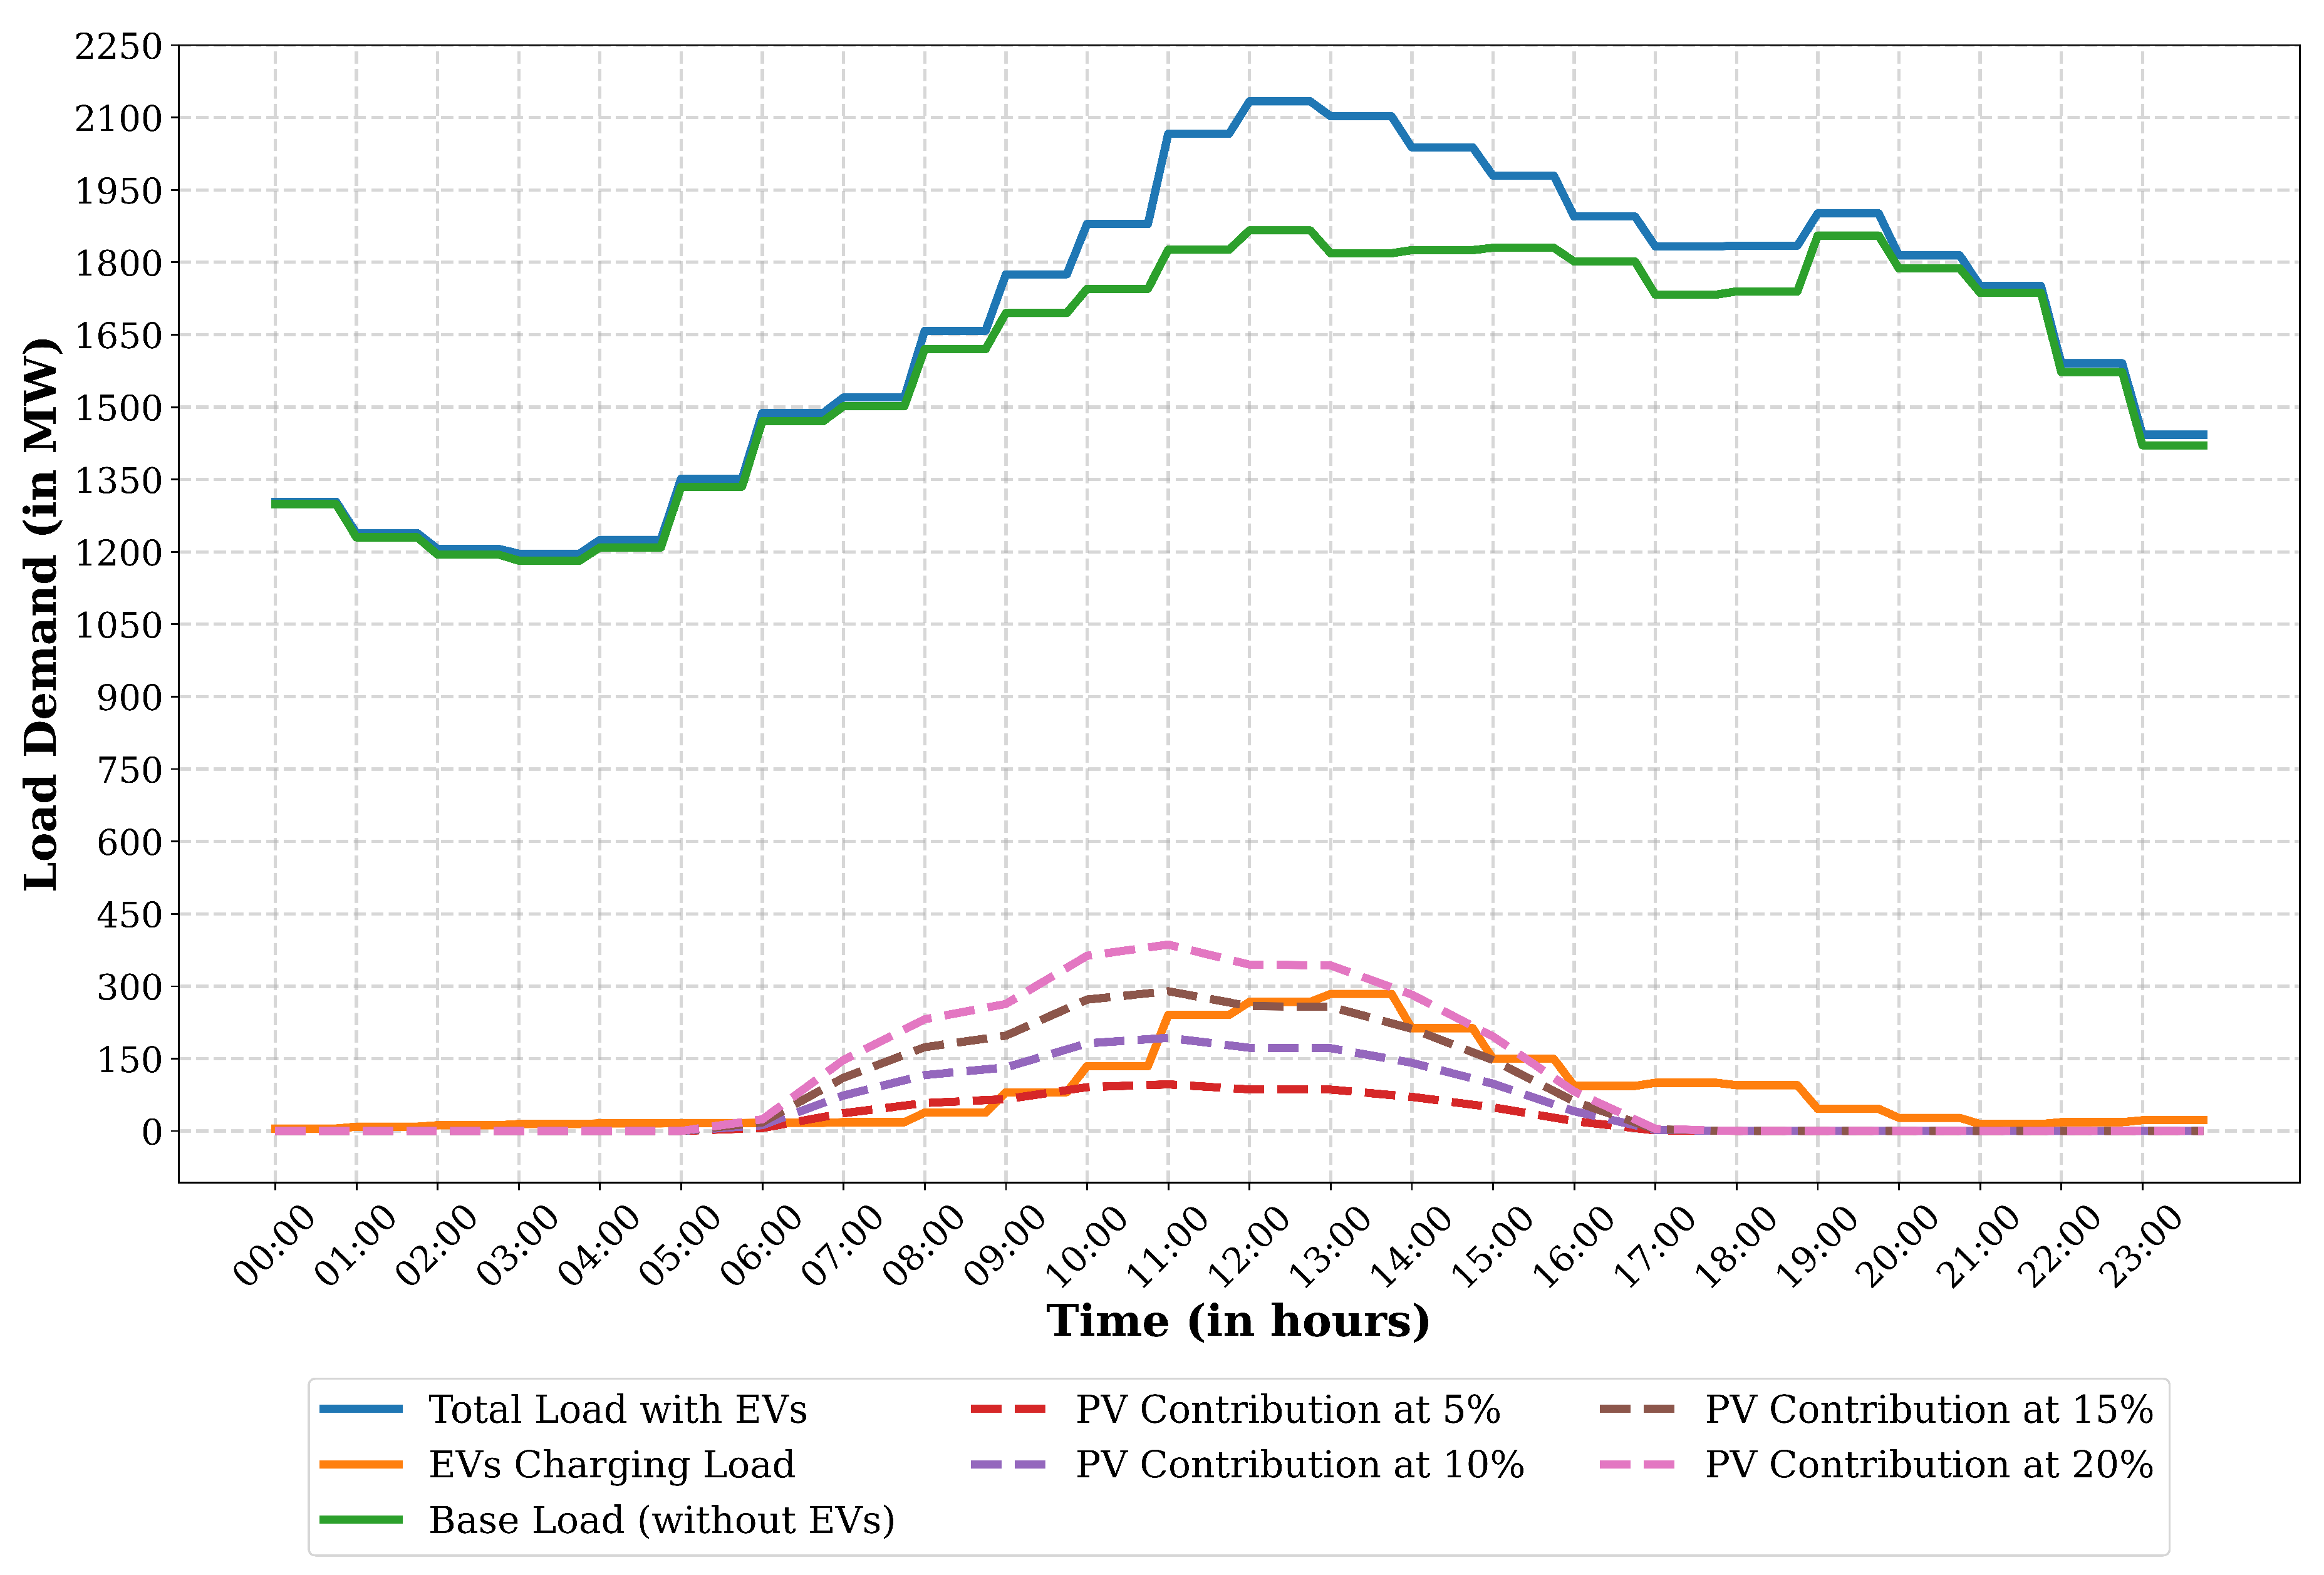

Table 1.
Comparison of MCDM approaches in EV fast-charging infrastructure siting: methodological complexity versus analytical transparency.
Table 1.
Comparison of MCDM approaches in EV fast-charging infrastructure siting: methodological complexity versus analytical transparency.
| Study | MCDM Method | Methodological Approach | Complexity Trade-off |
|---|---|---|---|
| Choi et al. [17] | Genetic Algorithm + Fuzzy AHP | Six-criterion optimization with fuzzy weighting | Higher complexity; multiple parameter tuning required |
| Alrifaie et al. [18] | Fuzzy AHP + TOPSIS | User-centric selection framework | Moderate complexity; focuses on post-installation choice |
| Guler & Yomralioglu [19] | AHP + FAHP | GIS-integrated multi-criteria suitability analysis | Moderate complexity; pairwise comparison demands |
| Ademulegun et al. [20] | Multi-stage MCDM | Sequential filtering across technical and spatial criteria | High complexity; multi-stage calibration |
| Present study | TOPSIS (2 criteria) | Parsimony-focused approach: AADT (40%) + specific recharging demand (60%) | Low complexity; maximum transparency and replicability; focus on fundamental demand drivers |
Table 2.
Comparative analysis of EV fast-charging infrastructure siting studies: methodological approaches and scope.
Table 2.
Comparative analysis of EV fast-charging infrastructure siting studies: methodological approaches and scope.
| Study | Region | Scale | Primary Method | Key Limitation | Present Study Contribution |
|---|---|---|---|---|---|
| Bayram et al. [14] | USA | Urban (5 cities: San Clara, CA, Salt Lake City, UT, Raleigh, NC, Denver, CO, and Los Angeles, CA) | GIS + MCLP coverage maximization | Urban focus; petrol station candidates only; no grid validation | National scale; diverse location types; integrated grid analysis |
| Liu et al. [15] | Multi-city (USA, Singapore, UK, France) | Urban | Reinforcement learning (PPO-Attention) | High computational cost; no grid validation; opaque decision-making | National scale; integrated grid analysis; transparent MCDM |
| Keramati et al. [22] | Kabul City, Afghanistan | Urban | GIS + multi-criteria + power constraints | Single-city scope; limited scalability | National framework; replicable methodology |
| Csiszár et al. [23] | Hungary | National roads | Multi-level optimization | Limited grid integration analysis | Integrated demand + grid validation |
| Ademulegun et al. [20] | UK-Ireland | Cross-border | Multi-stage MCDM + grid analysis | Technical focus; limited behavior insights | Demand-first approach; user behavior integration |
| Asna et al. [24] | Al Ain, UAE | Urban (city) | Multi-objective optimization + queuing theory | Queuing-based approach requires detailed arrival rate data; limited to urban scale | National framework; grid analysis without detailed arrival modeling |
Table 3.
Comparison of EV charging demand modeling approaches for grid integration studies.
| Study | Region | Charging Distribution Assumption | Peak Period Definition | Grid Analysis Method |
|---|---|---|---|---|
| Present study | Costa Rica | 35% of fleet charges on peak day, distributed across 24 hours with 5% per hour concentration during system peaks | 11:00 a.m.—1:00 p.m., 6:00 p.m.—7:00 p.m. (aligned with national peak demand) | Steady-state power flow + hosting capacity assessment |
| Gómez-Ramírez et al. [41] | Costa Rica | User-based charging distribution (50% rapid/0.5 hours, 25% fast/2 hours, 25% slow/7 hours) aligned to daily consumption patterns | Two daily peaks: 11:00 a.m.—1:00 p.m. and 5:00 p.m.—9:00 p.m. | Transmission + distribution network analysis (ETAP, 15-year horizon: power flow, voltage stability, loadability) |
| Lopes et al. [21] | Salvador, Brazil | Dynamic modeling via mesoscopic traffic simulation and state-of-charge algorithm (no fixed percentage assumed) | 5:00—7:00 p.m. peak identified in case study | Traffic simulation (Aimsun) + spatial econometrics + demand estimation |
| Keramati et al. [22] | Kabul, Afghanistan | Fixed EV fleet assumption (250 vehicles, 5% of taxi fleet, 0.15 kWh/km consumption) | Peak hour at 1:00 p.m. identified (limited temporal analysis) | MINLP with AC power flow + reactive power compensation (162-bus network, 24-hour voltage/loss optimization) |
Table 4.
Selected segments for the prioritized location of fast-charging stations for EVs in Costa Rica, classified by road hierarchy, AADT level, and segment length.
Table 4.
Selected segments for the prioritized location of fast-charging stations for EVs in Costa Rica, classified by road hierarchy, AADT level, and segment length.
| Segment | Light-Duty AADT | Route | Hierarchy | AADT Category | Length (in km) |
|---|---|---|---|---|---|
| Región Brunca | |||||
| 60030 | 1,650 | 2 | Primary | Low | 32.28 |
| 60052 | 1,064 | 2 | Primary | Low | 24.15 |
| 60011 | 6,476 | 2 | Primary | Moderate | 7.56 |
| 10010 | 4,449 | 2 | Primary | Moderate | 10.29 |
| 60092 | 2,854 | 34 | Primary | Moderate | 18.17 |
| 60411 | 778 | 245 | Secondary | Low | 14.95 |
| 60420 | 1,538 | 245 | Secondary | Low | 29.80 |
| Región Huetar Caribe | |||||
| 70150 | 5,965 | 32 | Primary | Moderate | 13.26 |
| 70070 | 6,927 | 32 | Primary | High | 12.04 |
| 70090 | 4,445 | 32 | Primary | Moderate | 12.92 |
| 70472 | 3,803 | 32 | Primary | Moderate | 9.87 |
| 70141 | 5,952 | 32 | Primary | Moderate | 10.63 |
| 70040 | 2,588 | 36 | Primary | Low | 25.02 |
| Región Huetar Norte | |||||
| 40522 | 3,030 | 4 | Primary | Moderate | 18.03 |
| 21012 | 1,516 | 4 | Primary | Low | 16.14 |
| 21352 | 1,087 | 4 | Primary | Low | 18.40 |
| 20722 | 2,331 | 4 | Primary | Low | 18.62 |
| 21060 | 2,646 | 35 | Primary | Moderate | 11.35 |
| 21072 | 3,010 | 35 | Primary | Moderate | 7.64 |
| 40482 | 2,913 | 126 | Primary | Moderate | 7.44 |
| 20671 | 2,791 | 250 | Secondary | Moderate | 8.96 |
| 20994 | 1,898 | 751 | Tertiary | Low | 3.76 |
| Región Pacífico Central | |||||
| 60240 | 4,507 | 1 | Primary | Moderate | 19.15 |
| 60230 | 6,692 | 1 | Primary | Moderate | 11.08 |
| 21900 | 9,874 | 27 | Primary | High | 7.43 |
| 21441 | 13,501 | 27 | Primary | High | 11.51 |
| 60162 | 7,714 | 34 | Primary | Moderate | 8.09 |
| 60081 | 4,387 | 34 | Primary | Moderate | 6.25 |
| 60112 | 6,201 | 34 | Primary | Moderate | 4.09 |
| 60170 | 6,118 | 34 | Primary | Moderate | 17.14 |
| Región Chorotega | |||||
| 51120 | 3,722 | 1 | Primary | Moderate | 12.74 |
| 50110 | 4,838 | 1 | Primary | Moderate | 14.42 |
| 50040 | 2,800 | 1 | Primary | Moderate | 30.77 |
| 50000 | 5,454 | 1 | Primary | Moderate | 12.82 |
| 50850 | 3,262 | 18 | Primary | Moderate | 20.42 |
| 50742 | 3,252 | 18 | Primary | Moderate | 14.05 |
| 50132 | 5,423 | 21 | Primary | Moderate | 12.68 |
| 50120 | 4,719 | 21 | Primary | Moderate | 10.01 |
| Región Central | |||||
| 20010 | 31,160 | 1 | Primary | High | 12.11 |
| 20031 | 14,191 | 1 | Primary | High | 7.99 |
| 20020 | 19,135 | 1 | Primary | High | 7.06 |
| 40710 | 50,478 | 1 | Primary | High | 3.05 |
| 40040 | 48,270 | 1 | Primary | High | 3.43 |
| 20040 | 12,360 | 1 | Primary | High | 4.37 |
| 20050 | 13,585 | 1 | Primary | High | 4.57 |
| 30690 | 1,781 | 2 | Primary | Low | 25.07 |
| 30730 | 19,550 | 2 | Primary | High | 3.09 |
| 30110 | 41,229 | 2 | Primary | High | 2.36 |
| 30600 | 34,584 | 2 | Primary | High | 5.17 |
| 30040 | 19,881 | 10 | Primary | High | 2.99 |
| 30061 | 33,375 | 10 | Primary | High | 1.51 |
| 30062 | 33,232 | 10 | Primary | High | 2.11 |
| 21430 | 19,798 | 27 | Primary | High | 14.01 |
| 21890 | 11,332 | 27 | Primary | High | 15.16 |
| 10080 | 41,697 | 27 | Primary | High | 6.11 |
| 10990 | 4,436 | 32 | Primary | Moderate | 20.41 |
| 40500 | 26,146 | 32 | Primary | High | 8.67 |
| 19094 | 57,957 | 39 | Primary | High | 1.00 |
| 19100 | 66,474 | 39 | Primary | High | 1.16 |
| 19102 | 44,540 | 39 | Primary | High | 0.77 |
Table 5.
Illustrative set of ten strategically prioritized NRN segments for fast-charging infrastructure, ensuring representation across all socioeconomic regions while incorporating the highest national AADT values. Strategic notes highlight each segment’s role within the national mobility network.
| Rank | Segment | Region | Light-Duty AADT | Strategic Notes |
|---|---|---|---|---|
| 1 | 19100 | Central | 66,474 | Beltway section with predominantly urban and peri-urban traffic, yet significant interregional and heavy-freight flows. Suitable for high-throughput fast-charging stations serving mainly pass-through users. |
| 2 | 21441 | Pacífico Central | 13,501 | Mid-to-lower section linking the GMA to Caldera Port, the Pacific coast’s main freight terminal. Heavy mixed traffic makes it ideal for high-throughput fast-charging stations serving both long-distance and local travelers. |
| 3 | 60011 | Brunca | 6,476 | Mid-to-lower link to the logistical and touristic corridors toward Panama, oriented more to interregional trips than to local urban demand, serving primarily through-traffic. |
| 4 | 70070 | Huetar Caribe | 6,927 | Key freight and container corridor linking the Caribbean with the GMA and providing access to the ports of Moín and Limón. Alongside freight, it also supports tourism and local urban traffic, making it a strategic site for a high-throughput fast-charging hub of national significance. |
| 5 | 40522 | Huetar Norte | 3,030 | Regional connector supporting agricultural flows and linking rural and urban communities, with potential to serve local and inter-district demand. |
| 6 | 50110 | Chorotega | 4,838 | A critical section of Ruta 1 in Guanacaste, it supports long-distance freight and tourism flows alongside regional and local demand. Its role in linking local, national, and international traffic makes it a highly strategic location for fast-charging infrastructure. |
| 7 | 19094 | Central | 57,957 | Short beltway segment that carries substantial urban and peri-urban traffic while also channeling interregional freight flows that bypass the city center. This dual role positions it as a strategic location for high-throughput fast-charging infrastructure. |
| 8 | 40710 | Central | 50,478 | High-volume segment that carries some of the country’s highest traffic volumes, linking the GMA with industrial zones and international corridors. Its role in serving urban, regional, and long-distance users makes it a strategic site for high-throughput fast-charging infrastructure. |
| 9 | 40040 | Central | 48,270 | Similar to section 40710, this segment forms one of the most congested corridors of the GMA, functioning as a primary gateway between San José and Heredia/Alajuela, particularly toward the airport, industrial parks, and the western GMA. Its location enables it to simultaneously serve airport-related users, industrial logistics, and regional connectors. |
| 10 | 30110 | Central | 41,229 | This section represents one of the most congested and critical bottlenecks in Costa Rica’s NRN, serving both metropolitan commuter and national interregional demand. As a gateway corridor, it is highly visible and accessible, making it an optimal site for high-throughput infrastructure. |
Table 6.
Comparison of observed-voltage levels under EV integration scenarios: present study results versus regional studies and international standards.
Table 6.
Comparison of observed-voltage levels under EV integration scenarios: present study results versus regional studies and international standards.
| Study/Standard | Region | Voltage Range (p.u.) | System Level (kV DN) | Context/Observations |
|---|---|---|---|---|
| Present study (2030 projection) | Costa Rica | 0.8988—0.9484 | 13.8—34.5 | Voltage drops violate ANSI C84.1-2020 [47] Range B emergency limits (0.95 p.u. minimum for systems > 600 V); critical infrastructure reinforcement required |
| Gómez-Ramírez et al. [41] | Costa Rica | V < 0.9 (138 kV); V < 0.97 (distribution) | 138 kV transmission; 13.8—34.5 kV distribution | Infrastructure problems starting 2030; severe voltage drops at 138 kV transmission level |
| González et al. [46] | Cuenca, Ecuador | 0.970—0.995 | 6.3 kV distribution | Low EV penetration scenario (4 fast-charging stations, 11,500 EVs); minimal voltage impact demonstrates adequate headroom under conservative loading |
| ANSI C84.1-2020 [47] | North America standard | 0.95—1.05 | Range B | Abnormal operating limit; Range A minimum is 0.975 p.u. |
Disclaimer/Publisher’s Note: The statements, opinions and data contained in all publications are solely those of the individual author(s) and contributor(s) and not of MDPI and/or the editor(s). MDPI and/or the editor(s) disclaim responsibility for any injury to people or property resulting from any ideas, methods, instructions or products referred to in the content. |
© 2025 by the authors. Licensee MDPI, Basel, Switzerland. This article is an open access article distributed under the terms and conditions of the Creative Commons Attribution (CC BY) license.
Copyright: This open access article is published under a Creative Commons CC BY 4.0 license, which permit the free download, distribution, and reuse, provided that the author and preprint are cited in any reuse.


