
Submitted:
27 December 2025
Posted:
29 December 2025
You are already at the latest version
Abstract
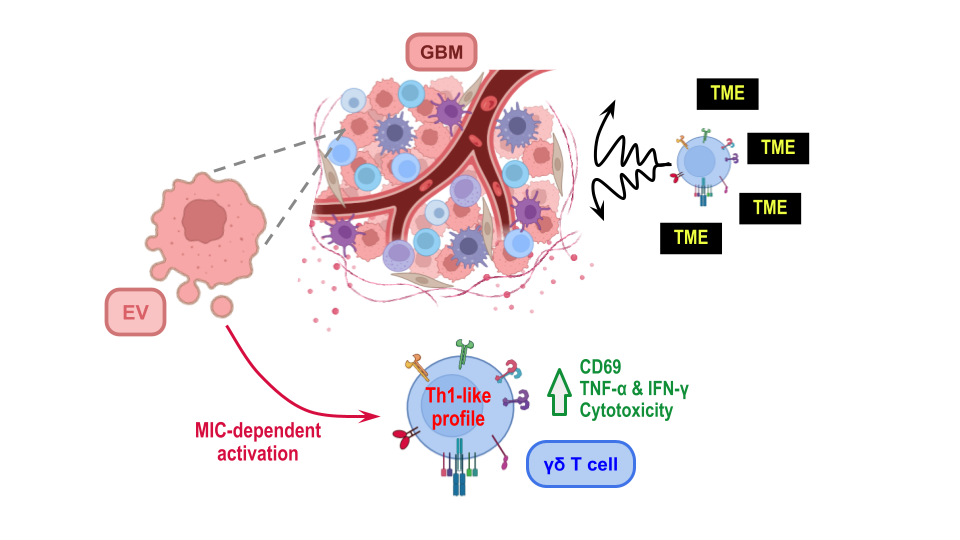
Glioblastoma multiforme (GBM) is the most aggressive and common primary brain tumor, with a median survival of less than a year after diagnosis. γδ T lymphocytes are immune cells that can migrate to tumors and induce malignant cells’ apoptosis. Our previous in silico studies showed that higher γδ T cell infiltrate in GBM correlates with better patient survival, and in vitro experiments showed that GMB´s supernatants promote an anti-tumoral profile in γδ T cells. Extracellular vesicles (EVs) play a critical role in cell communication, particularly in tumor microenvironment modulation. Here we studied the mechanisms responsible for γδ T lymphocytes activation by GBM-derived EVs, together with the effect of these EVs on γδ T cells from GBM patients. For that, γδ T cells were purified from peripheral blood, and EVs were obtained from U251 cell supernatants by differential centrifugation. After EVs characterization, we evaluated γδ T cell–EVs interaction and γδ T cell modulation by EVs. Results showed that EVs induced an increase in CD69 expression, cytotoxicity, and TNF–α and IFN–γ production in γδ T cells in a MIC dependent mechanism. These results provide valuable insights for developing targeted immunotherapies in GBM patients.
Keywords:
γδ T cells
; glioblastoma
; extracellular vesicles
1. Introduction
Glioblastoma multiforme (GBM) is an adult-type diffuse glioma, and the most frequent and aggressive primary brain tumor. It is defined by rapid progression and an immunosuppressive microenvironment that undermines effective antitumor immunity. Histopathologically, GBM is characterized by tissue necrosis and abnormal endothelial proliferation, features that contribute to its exceptionally high lethality [1,2,3]. As GBM cells proliferate rapidly and infiltrate diffusely into adjacent healthy brain tissue, they make it difficult to achieve complete remission and a median survival of less than one year after diagnosis [4]. At present, GBM treatment relies primarily on surgical removal of the tumor, typically followed by the conventional treatment including radiation therapy, temozolomide and bevacizumab, that gives modest benefit. Emerging strategies aim to improve outcomes by combining immunotherapies, advanced drug delivery and gene editing technologies, and targeted inhibitors [2,5]. Despite advances in diagnostic imaging and therapeutic strategies, these approaches provide only temporary and limited benefits [6] and clinical outcomes remain unfavorable for highly malignant and invasive forms [7,8]. The marked biological and genetic heterogeneity of GBM tumors promotes continued proliferation [9] and contributes to their aggressiveness and therapeutic resistance [5,10,11,12]. More recently, cancer immunotherapy, successful in extracranial malignancies such as melanoma, non-small cell lung cancer, and non-Hodgkin lymphoma; has been explored in GBM. The disappointing results of clinical trials highlight the urgent need for novel therapeutic strategies [13].
Intercellular communication within the tumor microenvironment is a major determinant of immune evasion and therapeutic resistance; and tumor–derived extracellular vesicles (EVs) have emerged as potent modulators of the immune landscape within the tumor microenvironment. EVs are released by all cellular organisms [14], and are classified according to their cellular origin, biogenesis pathways, and cargo composition [15]. Two principal EVs groups are widely recognized: small EVs, which mainly originate as intraluminal vesicles within endosomal multivesicular bodies that fuse with the plasma membrane to release their contents, and their size range from 30 to 100 nm; and medium/large EVs, which form by direct outward budding and fission of the plasma membrane and measure 100–1,000 nm. The distinct biogenesis routes underlie differences in EVs composition and function, with important implications for intercellular signaling and disease biology [14]. Moreover, EVs constitute a widespread intercellular communication system operating across diverse cell types and pathological contexts. They either mediate biological effects after uptake by recipient cells or through direct engagement of EVs’ surface ligands with receptors and membrane components on target cells [16,17,18,19]. Dysregulated release of specific EVs subpopulations has been implicated in numerous diseases, including cancer, neurological disorders, and immune pathologies, where EV–driven signaling can reprogram recipient cells and promote disease progression [18,19]. EVs carry a complex and functionally diverse cargo: proteins (including cytokines, chemokines, and regulators of signaling and migration), lipids, glycoconjugates, and nucleic acids such as mRNAs and microRNAs [20]; that enables them to modify cells both within the tumor microenvironment and at distant sites. By delivering these molecular signals, tumor derived EVs reshape innate and adaptive immunity, driving natural killer cells (NK), CD4⁺ and CD8⁺ T cells, dendritic cells, macrophages, and myeloid derived suppressor cells toward immunosuppressive phenotypes [21]. EVs surfaces also can display key immunoregulatory molecules such as CTLA–4, PDL–1 and FASL [22,23], as well as the ectoenzymes CD39 and CD73 [24], thus, they can convey stress-induced ligands and other modulators of immune response, thereby contributing to immune escape and therapeutic resistance, collectively reinforcing immune evasion.
Of note, human GBM cells exhibit markedly increased EV release in vivo [18]. GBM derived EVs have been shown to influence tumor invasion, angiogenesis, and immune modulation, acting as small messengers that reshape the tumor microenvironment and alter immune cell phenotypes and functions [25].
Within the GBM tumor microenvironment, the infiltrating immune populations are diverse; there are tumor-associated macrophages, immunosuppressive myeloid-derived suppressor cells, and regulatory T cells. These cell types establish a suppressive milieu that fosters tumor growth and undermines cytotoxic T–cell activity [26]. Despite their reduced frequency among GBM-infiltrating leukocytes, T lymphocytes constitute a pivotal component of antitumor immunity and are therefore critical targets for therapeutic modulation [25]. Interestingly, γδ T cells are non–conventional T lymphocytes with potent cytotoxic activity against transformed cells and show a capacity to respond to stress–induced ligands, and to migrate into tumors [27]. γδ T lymphocytes, originally described in 1986 [28], arise during ontogeny from double–negative thymocytes (CD4⁻CD8⁻) and, express a clonally distributed T cell receptor (TCR) composed of γ and δ chains with a relatively restricted repertoire [29,30]. In peripheral blood, the Vγ9Vδ2 subset accounts for approximately 5–10% of CD3⁺ cells and represents the predominant circulating γδ population in healthy humans [31]. Unlike conventional αβ T cells, γδ T cells do not rely on classical peptide presentation by MHC molecules; this MHC–independent recognition underlies their potential as candidates for antitumor immunotherapy [32]. γδ T cells exert tumor immunosurveillance by detecting stressed or transformed cells. A central activating axis for this process occurs which involves the activating receptors shared with natural killer cells, such as the NKG2D receptor, which recognizes the stress–induced ligands MICA/MICB [33,34]. Notably, GBM cells express several stress–associated, MHC class I like ligands, including MICA/B, that can be engaged by γδ T cells via NKG2D or the TCR, facilitating recognition of malignant cells [33,34,35]. Since γδ T cells do not depend on classical peptide presentation by MHC molecules, they can target tumors in a MHC–independent manner; and this distinctive recognition mode underpins their promise as candidates for antitumor cell therapy [32,36]. Thus, in the last few years, adoptive transfer of γδ T lymphocytes have arisen as an immunotherapeutic strategy for GBM. As noted above, GBM derived EVs can reshape the tumor microenvironment; consequently, they may directly perturb γδ T cell behavior and thereby facilitate immune evasion by GBM. Although accumulating evidence indicates that GBM EVs modulate various immune populations, the specific effects of GBM derived EVs on γδ T cell activation, receptor engagement, and effector function remain poorly defined. We therefore hypothesize that GBM EVs modulate γδ T lymphocyte responses by modifying ligand availability and receptor signaling. Demonstrating such a mechanism would directly connect EV–mediated intercellular communication to a defined immune-recognition pathway and could reveal novel targets to restore or enhance γδ–mediated antitumor activity in GBM.
2. Materials and Methods
The experimental protocols performed were approved by the Biosafety and Research Review Board of Instituto de Medicina Experimental – CONICET – Academia Nacional de Medicina and the Ethical Committee of the Institutos of the Academia Nacional de Medicina. The methods were carried out following the approved guidelines. The number of samples from healthy donors employed in this study was 22 and for GBM patients 4.
Reagents and antibodies: Ficoll–Hypaque was from GE Healthcare Bio–Sciences AB (Uppsala, Sweden). Anti–TCR γδ MicroBead kit was obtained from Miltenyi Biotec (Germany). The fetal bovine serum (FBS) was from Invitrogen (Carlsbad, CA, USA). Dulbecco’s Modified Eagle’s Medium (DMEM), Trypsin–EDTA, sodium pyruvate, L-glutamine and penicillin/streptomycin were from Gibco, Thermo Fisher Scientific (Waltham, MA, USA). PE mouse anti-human CD69, CD63, TCRγδ, EGFR and MICA/B antibodies, PerCP mouse anti–human CD69 and CD45, PE/Cy7 mouse anti–human PD–1, APC mouse anti–human CD63, FITC mouse anti–human CD81, PerCP/Cy5.5 mouse anti-human CD9 and perforin antibodies, purified and biotin anti-human TNF-α and IFN–γ antibodies, purified anti–human MIC and PD–L1 antibodies were from BioLegend (San Diego, California, USA). PE mouse anti-human PD-L1 was from eBioscience, Thermo Fisher Scientific (San Diego, California, USA). HMBPP was obtained from Cayman Chemical (Ann, MI, USA).
Peripheral blood γδ T lymphocyte isolation: γδ T cells were isolated from heparinized human blood from healthy donors and GBM patients, who gave written informed consent, by centrifugation on Ficoll–Hypaque and positive selection using magnetic microspheres covered with anti–TCR γδ antibodies, according to the manufacturer´s instructions (Miltenyi Biotec, Order No. 130-050-701). After purification, cells were resuspended in DMEM supplemented with 10% heat-inactivated FBS, penicillin (100 U/ml)/streptomycin (100 µg/ml) (supplemented DMEM) and used to perform the assays. Cells were analyzed by flow cytometer (FACSCalibur, Becton Dickinson, San Jose, CA, USA) to guarantee that γδ T cell purity was >98% and monocyte contamination <2%, as previously described [37,38,39]. The purification procedure did not affect cell activation.
U251 cell culture: GBM cell line U251 was cultured in DMEM supplemented with 10% of heat-inactivated FBS, L–glutamine (2 mM), sodium pyruvate (1 mM), penicillin (100 U/ml)/streptomycin (100 µg/ml), at 37°C with 5% CO2 atmosphere, in culture flasks.
GBM samples disaggregation: The samples were obtained after surgical removal of the tumor from a patient with GBM, who gave written informed consent at the División Neurocirugía Instituto de Investigaciones Médicas A. Lanari and Clínica or at Maternidad Santa Isabel. The biopsy was incubated with collagenase (2 mg/mL) and DNAse (1000 IU) for 30 min at 37°C, then inactivated with 10% FBS and 2 mM EDTA. Afterward, the cells were recovered and stained for CD45 and TCRγδ according to standard protocols and analyzed by flow cytometry.
GBM-derived EVs separation: GBM–derived EVs were obtained from confluent monolayers of U251 cell line. When cells were in 80–90% of confluence, their medium was replaced by supplemented DMEM previously depleted from EVs (centrifugated at 100,000 x g, overnight (O.N.)). 24 h later, the cell lines’ conditioned medium was collected and EVs were obtained following the protocol described by Fraser et al [40] Briefly, the conditioned medium was centrifugated at 300 x g for 5 min at 4ºC. The resulting supernatant was then centrifugated at 2,000 x g for 10 min at 4ºC to discard cell debris. The obtained supernatant was centrifugated at 10,000 x g for 30 min at 4ºC. Finally, pellets were recovered and washed with PBS, and then resuspended in depleted supplemented DMEM or PBS, and stored at −80°C. Meanwhile, U251 cells were trypsinized and counted, in order to determine the amount of source cells for the EVs sample.
GBM-derived EV’ transmission electron microscopy (TEM): Samples were negatively stained for electron microscopy following the protocol described by Théry et al [41]. Briefly, samples obtained at 10,000 x g were fixed with PFA 2%, and then applied to Formvar–carbon coated grids and allowed to adsorb for 20 min in a dry environment. Grids were subsequently washed with PBS and fixation was completed with an incubation in 1% glutaraldehyde (EMS, Hatfield, PA) for 5 min. After eight washes in distilled water, grids were first incubated for 5 min in neutral uranyl oxalate, then transferred to a mixture of 4% uranyl acetate and 2% methyl cellulose for 10 min. Excess embedding medium was carefully blotted to generate a thin and uniform methyl–cellulose film, and then grids were air–dried for 5–10 min and stored until imaging. Samples were examined by TEM with a LEO–906 microscope (ZEISS, Oberkochen, Baden–Württemberg, Germany) at 80 kV.
GBM-derived EV’ nanoparticle tracking analysis: Nanoparticle Tracking Analysis (NTA) and zeta potential measurements were performed using a ZetaView PMX–120 instrument (Particle Metrix GmbH; software v8.06.01) with a 488–nm laser. Samples obtained at 10,000 × g were resuspended in PBS and analyzed at 25°C. Acquisition settings were: sensitivity 80, shutter 100, and 30 fps.
GBM-derived EV’ flow cytometry: EVs were stained with DAPI or fluorochrome–conjugated antibodies in buffer PBS containing 0.5% BSA and 2 mM EDTA (staining buffer). Finally, they were fixed with PFA 1%. All buffers were filtered with 200 nm filters before use. Samples were acquired using a Cytek Northern Lights 3000 full-spectrum flow cytometer (Cytek Biosciences, CA, USA).
To confirm that fluorescent signals originate from EVs, assay controls were included, as described by Welsh et al [42] (Supplementary Figure S1). To differentiate EVs from contaminant particles and antibody aggregates, a buffer with reagents control was used. Detergent treatment with Triton X–100 was included to verify that signals originate from membrane enclosed particles.
GBM–derived EV’ RNA quantification: EVs obtained from U251 cells were lysed with TRIzol (Thermo Fisher Scientific, MA, USA) and stored at –20°C, O.N. Chloroform was added to the suspension, and it was incubated for 5 min before centrifugation at 12,000 x g (15 min, 4°C). The topper phase was recovered in a new tube and RNA was precipitated adding isopropanol, incubating for 10 min at room temperature (RT) and centrifugating at 12,000 x g (10 min, 4°C). The resulting supernatant was discarded and the pellet was resuspended in ethanol 75%, and then centrifuged at 7,500 x g (5 min, 4°C). The supernatant was again discarded and the pellet was left to dry for 10–15 min. Finally, ARN samples were resuspended in 20 µl of RNAse–free distilled water and incubated at 60°C for 10 min. They were quantified with a DS–11 Series UV–visible spectrophotometer (DeNovix, DE, USA).
Western blotting: Samples were lysed with Tris-HCl (60 mM, pH 6.8) / SDS 1% using EDTA-free protease inhibitor cocktail (Thermo Scientific, MA, USA). 15 μg of protein samples– quantified by UV–visible spectrophotometry, were loaded onto 12% SDS–PAGE under non-reducing conditions and transferred to a polyvinylidene difluoride membrane (Amersham Hybond-P. Cytiva, MA, USA). Membranes were blocked in PBS with 0.1% BSA, 0.4% Tween and 1 mM EDTA, for 1 h at RT and incubated with primary anti–human CD63 antibodies (BD Pharmingen, NJ, USA) (2 μg/ml, O.N., 4°C). Afterwards, they were incubated with anti-species secondary antibodies conjugated to HRP (horseradish peroxidase) during 4 h at RT. Blots were detected by chemiluminescence using a solution containing luminol and hydrogen peroxide.
Interaction studies: EVs obtained from 6x10⁶ U251 cells were labeled with the lipophilic fluorescent dye PKH26 (Sigma Aldrich, St. Louis, MO, USA) (2 µM) following the manufacturer’s instructions, with the modification that centrifugation steps were performed at 10,000 x g for 30 min at 4°C. Purified γδ T cells were activated or not with HMBPP (1 µM), and 6x10⁴ cells were incubated during 3 h or O.N. with labeled EVs in depleted medium, in 96 U–bottom well plates. After incubation, γδ T cells were collected and stained with 4′,6–diamidino–2–phenylindole (DAPI: 1 µ/ml) for nucleus visualization, and then observed with a fluorescent confocal microscope Olympus FV-1000 (Tokyo, Japan). Twenty 60X-images per condition were analyzed with ImageJ2 software (University of Wisconsin–Madison, Madison, WI, USA). Z–stack acquisition was performed to capture three-dimensional interactions.
Treatment of γδ T cells with GBM-derived EVs: 6x10⁴ purified γδ T cells were cultured in depleted supplemented DMEM, with or without U251–derived EVs, in 96 U-bottom well plates. EVs samples from different amounts of U251 cells (2–8x10⁶) were tested. After O.N. incubation at 37°C, γδ T cells were recovered for immunostaining and supernatants for ELISA analysis.
Cells immunestaining and flow cytometry: Recovered γδ T cells were immunostained with anti–CD69 and anti–PD–1 monoclonal mouse antibodies in PBS containing 0.5% BSA and 2 mM EDTA for 30 min at 4°C. Then, cells were washed, fixed with paraformaldehyde (PFA) 1%, and analyzed by flow cytometry.
Cytokine production assay: IFN–γ and TNF–α production by cells were quantified by ELISA following conventional protocols provided by the manufacturer.
Cytotoxicity assay: Purified γδ T cells were co–cultured with U251 cell lines monolayers in a 1:1 ratio, with or without U251–derived EVs, in depleted supplemented DMEM. As a control, γδ T cells were cultured alone. After 48 h incubation at 37°C, cells were trypsinized and stained with propidium iodide (PI) (1 µg/ml) for flow cytometry analysis. The percentage of PI+ cells was determined excluding lymphocytes population, in order to analyse U251 cells.
Blocking assays: EVs obtained from 6x10⁶ U251 cells were incubated for 1 h with purified anti-human MIC or PD–L1 antibodies (10 µg/ml). Afterwards, EVs and ligand-blocking antibodies were added to cultures of 6x10⁴ γδ T cells and left to incubate O.N. Mouse IgG antibody (10 µg/ml) was used as control. γδ T cells’ activation was assessed by CD69 immunostaining and flow cytometry.
Informatic and Statistical Analysis: For experimental approaches, statistical analysis was performed using GraphPad Prism 8.0.2 for Windows, GraphPad Software (La Jolla, CA, USA). Statistical significance was defined as p<0.05.
To perform in silico studies, data repository from The Cancer Genome Atlas (TCGA) was used, and then analyzed using TIMER3.0 software (https://compbio.cn/timer3/) [43]. TIMER3 employed RNA–Seq expression data of Vγ9 TCR, NKG2D, PD-1, EGFR, MICA/B and PD-L1 from GBM samples, n=287.
3. Results
3.1. Characterization of EVs Derived from GBM Cell Line U251
The material isolated from the supernatants of the GBM cell line U251 via differential centrifugation was analyzed to determine the presence of structures compatible with EVs [44]. To this end, we evaluated morphology using transmission electron microscopy (TEM), size, solubility, and concentration via NTA, and the presence of EV markers through spectral flow cytometry and western blot analysis. As shown in Figure 1a, the isolated material exhibits a well–defined structure, with morphology and size compatible with medium/large EVs, as expected given the employed isolation methodology. The NTA analysis showed a size of 184.0±6.1 nm (Figure 1b and c), which correlates with TEM observations. Additionally, we assessed the zeta potential (Figure 1d and Table 1), that indicates the strength of the electrostatic repulsion between particles; values more negative than −30 mV are generally associated with lower risk of aggregation. Finally, we determined the concentration by NTA that was 2.1x10¹¹±0.3x10¹¹ (Figure 1e and Table 1). Moreover, the particles express EV−associated tetraspanins CD9 and CD81, along with the classical marker CD63, as confirmed by both spectral flow cytometry (Figure 1f) and western blot (Figure 1g). It is well known that EVs reflect the characteristics of their precursor cells, interestingly, the material obtained in this work expresses the epidermal growth factor receptor (EGFR) (figure 1h), a recognized GBM tumor marker [40]. We also confirmed the presence of nucleic acids within the vesicles through DAPI staining (Figure 1i), and RNA quantification by UV−visible spectrophotometry (Table 1). Taken together, these results allow us to classify the material obtained from the U251 cell line as medium/large EVs.
- Table 1. Characterization of EVs derived from GBM cell line U251. EVs were obtained from confluent monolayers of 6x10⁶ U251 cells after differential centrifugations. They were resuspended either in PBS for NTA analysis or in TRIzol for RNA quantification. Results are shown as mean ± SEM of the diameter, Z potential, particle concentration (n=4) and RNA concentration of EVs samples (n=3).
3.2. GBM−Derived EVs Interact with γδ T Cells
To explore whether GBM−derived EVs engage γδ T cells, we performed confocal microscopy analysis of co−cultures and quantified the frequency of cell–EVs contact, their spatial distribution, and the kinetics of EV internalization (Figure 2). For that purpose, EVs were fluorescently labeled with PKH26 and added to primary human γδ T cells, for 3 h or O.N. (with or without HMBPP). Confocal images reveal frequent close location of PKH26+ EVs to γδ T cell membranes, with vesicles appearing to overlap the plasma membrane and extend into the cytoplasm (Figure 2a). EVs were observed in distinct morphological states consistent with sequential steps of engagement: surface adhesion, uptake, and intracellular localization. Orthogonal projections of z-stacks confirmed that PKH26 signal localized beneath the cell surface, supporting bona fide internalization rather than surface-restricted fluorescence (Figure 2b). Quantitative readouts corroborated the imaging observations. Moreover, PKH26 mean fluorescence intensity per cell increased progressively over the time (Figure 2c), indicating accumulation of EV–derived material. The percentage of PKH26–positive γδ T cells increased from baseline to approximately 50% at 3 h, and continued to increase at later time points until the majority of cells were positive (Figure 2d), similar results were observed in γδ T cell activated or not with the specific agonist HMBPP. Together, these results indicate that the PKH26 signal reflects genuine EV–cell interactions and uptake.
3.3. GBM-Derived EVs Activate γδ T Cells
The observed EV and γδ T cell contact and subsequent internalization prompted us to evaluate whether this interaction was associated with γδ T−cell activation; accordingly, we measured activation markers and cytokine production by cells after EV exposure. For that purpose, freshly isolated γδ T lymphocytes obtained from peripheral blood of donors were cultured with EVs derived from GBM cell line U251. First, and to determine the quantity of EVs to be employed in those experiments, we perform an EVs titration in which γδ T cells were incubated with EVs obtained from different numbers of U251 cells. We found that the statistically significant modulation of γδ T cells by EVs was observed when using EVs obtained from 6x10⁶ cells (Supplementary Figure S2).
Based on these results, we employed that quantity of EVs throughout this study. Once the optimal conditions were set, we performed an O.N. incubation between γδ T cells and EVs. The activation state of γδ T cells was analyzed through the expression of CD69 and PD−1, and the production of the inflammatory cytokines. Figure 3 shows an increase in the percentage of expression of CD69 in γδ T cells (Figure 3a), and no changes in PD−1 expression (Figure 3b), accordingly with the activation state triggered by EVs, there was an increase in the production of TNF−α (Figure 3c) and IFN−γ (Figure 3d). Notably, γδ T cells from GBM patients’ peripheral blood displayed the same behavior as cells from healthy donors upon exposure to U251−derived EVs (Figure 3e and f). The phenotypic and functional changes induced in γδ T lymphocytes by exposure to U251−derived EVs, could be compatible with the acquisition of an antitumor and cytotoxic profile. To determine whether these EV driven alterations translate into increased tumor−cell killing, we therefore evaluated γδ T lymphocyte mediated cytotoxicity against U251 target by propidium iodide staining and flow cytometry analysis (Figure 3g). Figure 3 h shows that in the presence of EVs, γδ T cells showed an increased capacity to induce cytotoxicity in tumor cells, even higher compared to γδ T cells alone.
3.4. γδ T Cell Activation by GBM−Derived EVs Is Dependent on the Presence of MICA/B on the EVs
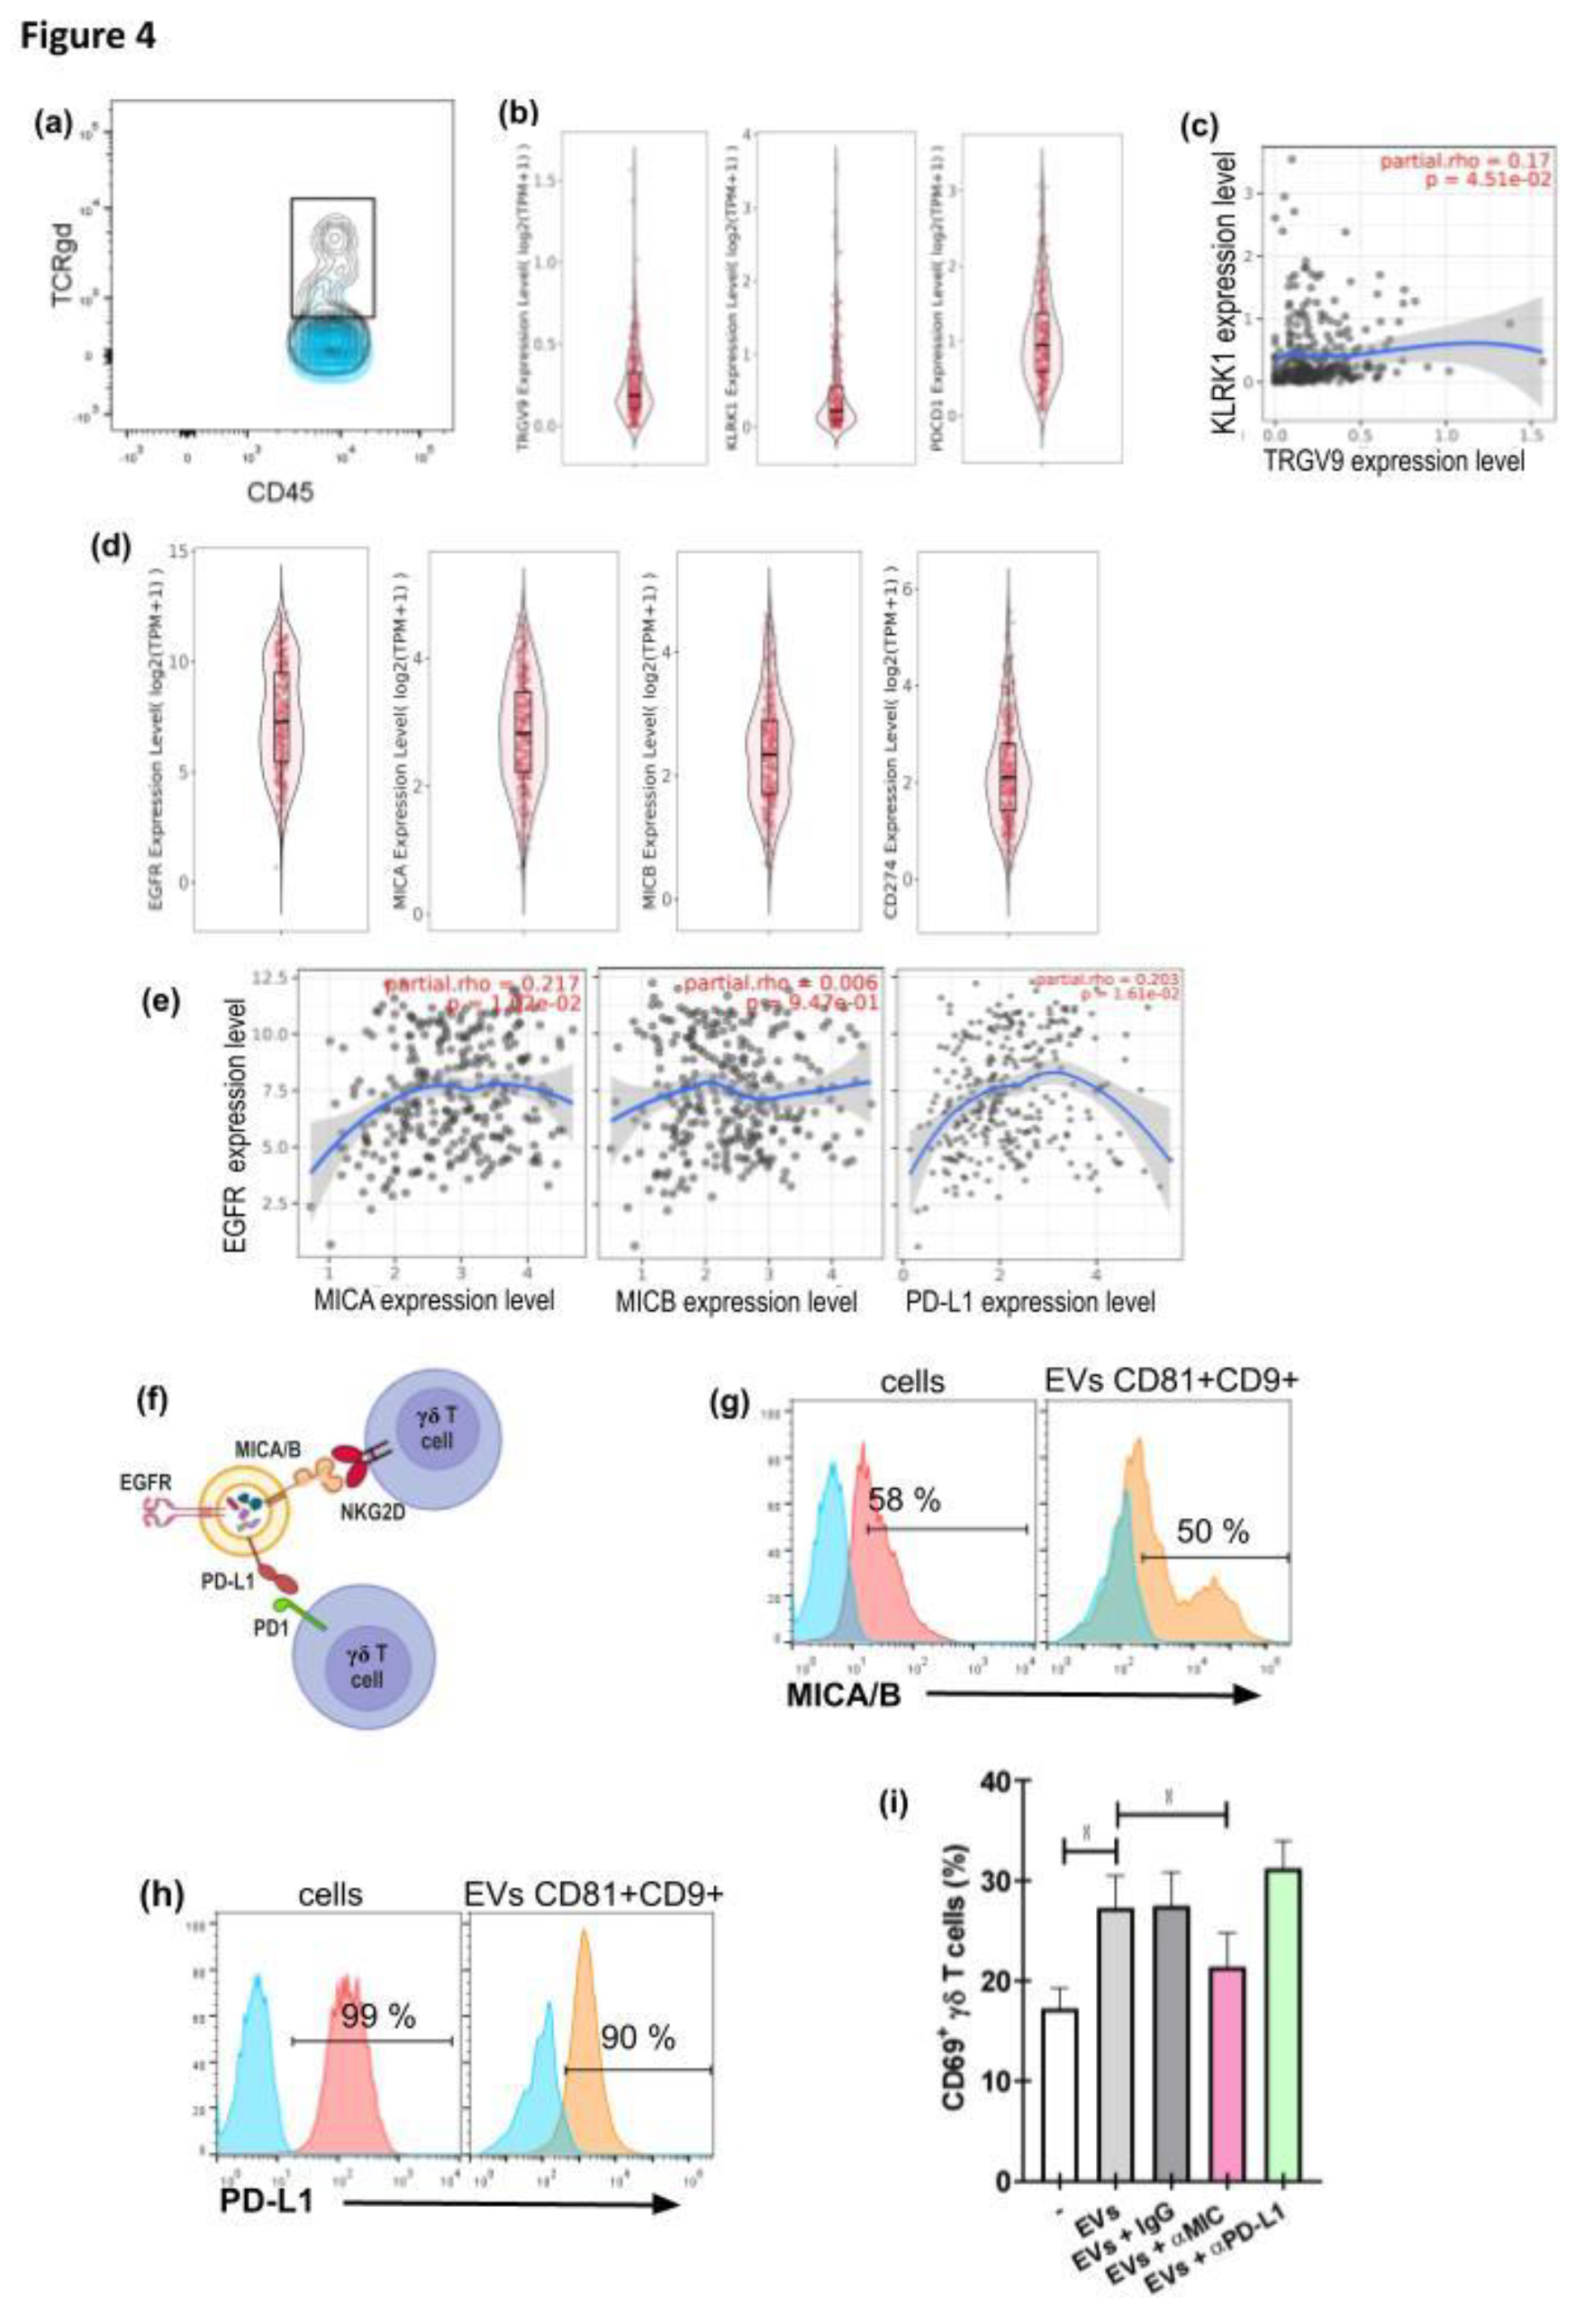
EV−associated ligands are particularly relevant for γδ T cells that recognize stress−induced molecules via germline encoded receptors and can rapidly exert effector programs including cytokine secretion and direct cytotoxicity in situ. Thus, EVs bearing ligands recognized by γδ T cells represent a plausible mechanism for tumor driven modulation of γδ T cell activity. Figure 4a shows the accumulation of γδ T cells in a disaggregated GBM biopsy, according to our previous in silico studies (39). To go further in the study of molecules involved in γδ T cell and GBM interactions, by using the public datasets TCGA and TIMER3.0 platform [43], we evaluate transcripts for gene encoding the main γδ TCR subtype represented in peripheral blood (Vγ9+ TCR): TRGV9 (Figure 4b, left panel), NKG2D: KLRK1 (Figure 4b, middle panel), and PDCD1: PD-1 (right panel) within the GBM tumor. A Spearman analysis showed a positive correlation between TRGV9 and KLRK1, consistent with cytotoxic γδ T cell presence (partial rho= 0.17, p-value= 0.045)(Figure 4c). In contrast, we found no correlation between TRGV9 and PDCD1 (data not shown). GBM samples also contain transcripts for EGFR, as well as MICA, MICB and PD-L1 (CD274), which play key roles in regulating the immune response against tumors [8] (Figure 4d). There is a positive correlation between EGFR and MICA (partial rho= 0.217, p-value= 0.01) (Figure 4e left panel), and with PD-L1 (partial rho= 0.203, p-value= 0.016) (Figure 4e right panel), suggesting associations between tumor oncogenic phenotype and NKG2D and PD-L1 ligands’ expression in the GBM microenvironment. Of note, this analysis was performed using tumor databases rather than databases of EVs because no information was available on MICA/B expression in GBM−derived EVs.
With these in silico results in mind, we therefore sought to determine whether U251−derived EVs express MICA/B and PD−L1 (Figure 4f). Interestingly, the isolated EVs express MICA/B (Figure 1g) and PD−L1 (Figure 1h), like their source cells. Blocking experiments showed that the activation of γδ T cells was MIC−dependent, since the preincubation of EVs with neutralizing antibodies markedly reduced γδ T cell activation, supporting a role for MIC as an important activating pathway. In contrast, blockage of PD−L1 on U251 EVs did not alter γδ T cell activation under the conditions tested, suggesting that PD−L1 is not a dominant regulator of γδ T cell responses to U251 EVs in our model system (Figure 4i).
4. Discussion
In this work we characterized EVs isolated from the GBM cell line U251 and showed that the preparation corresponds to medium/large EVs by transmission electron microscopy, nanoparticle tracking analysis, spectral flow cytometry and Western blot. These vesicles carry canonical tetraspanins (CD9, CD63, CD81), tumor-associated proteins such as EGFR, the immune modulator molecule PD−L1, and stress ligands MICA/B, and they also contain nucleic acids. The combined morphological, biophysical and molecular evidence supports classification of the isolated material as bona fide EVs derived from U251 cells. Confocal imaging and colour spatial and intensity heterogeneities revealed frequent and dynamic contacts between PKH26−labeled GBM EVs and primary human γδ T cells, in which vesicles are observed in states related with surface interaction and uptake. The kinetics of EVs interaction suggest that vesicle engagement is dynamic and influenced by the activation status of the lymphocyte. EVs uptake increased over time and was quite heterogeneous at the single-cell level, consistent with activation−driven modulation of EVs binding and internalization. Of note, orthogonal projections and three dimensional construction confirmed that a substantial fraction of the PKH26 signal localized beneath the plasma membrane, indicating genuine uptake rather than artifactual surface overlap. Because internalized EVs can deliver membrane−bound ligands and soluble cargo to recipient cells, these interactions provide a plausible mechanism by which GBM EVs modulate γδ T cell activation and effector function, as explored in subsequent functional assays we have done. Nevertheless, the relative contributions of membrane receptor engagement versus intracellular signaling after EVs internalization remain to be dissected.
Exposure to U251−derived EVs induced an activation program in γδ T cells that involved the upregulation of CD69, increased secretion of IFN−γ and TNF−α, and enhanced cytotoxicity against U251 targets. This is consistent with our previous finding that factors released by GBM cells promote a Th1−like functional profile [39]. Remarkably, the phenotypic changes were observed in γδ T cells from healthy donors and from GBM patients, indicating that the EV−driven response is robust across donor sources, and that γδ T cells from patients are able to respond to GBM derived EVs. Blocking experiments implicate MIC on the EVs surface as the principal mediator of γδ T cell activation. These data argue for a causal role of EV−associated MICA/B in triggering γδ T cell effector programs. Although PD−L1 was detectable on U251 EVs, neutralization of this immune checkpoint molecule did not measurably alter γδ T cell activation in our in vitro assays. This suggests that, within the constraints of our model system and experimental conditions, the activating signal delivered by MICA/B predominates over PD−L1 mediated inhibition. Nevertheless, PD−L1 may exert context-dependent effects in vivo or in combination with other suppressive factors present in the tumor microenvironment; the coexistence of activating and inhibitory molecules on tumor EVs highlights the complex and potentially tunable nature of EVs−mediated immune modulation. Thus, these negative results do not exclude context dependent roles for PD−L1 in other settings, but they indicate that MICA/B is the primary determinant of EVs mediated γδ T cell stimulation in our model. The MICA/B participation identifies a specific mechanism by which tumor EVs influence γδ T cell responses and suggests potential strategies to enhance γδ T cell−mediated antitumor activity by targeting EV−associated stress ligands. Interestingly, the bioinformatic analysis has supported the results we obtained in vitro, showing a positive correlation between TRGV9 and NKG2D, and MICA/B with EGFR in GBM tumors.
Future work should validate these observations using EVs from primary GBM specimens and patient plasma, test the in vivo relevance of EVs−mediated γδ T cell activation, and distinguish surface signaling from cargo−dependent intracellular effects using targeted perturbations of endocytic pathways and compartment−specific reporters.
In summary, U251−derived EVs are medium/large particles that carry tumor and stress markers, physically interact with and are internalized by γδ T cells, and drive a functional activation program that enhances cytokine production and cytotoxicity. The stimulatory effect is mediated primarily by EVs carrying MICA/B. However, this activation and differentiation can occur in an inappropriate spatial and temporal context within the tumor, and the resulting γδ T lymphocytes are functionally misdirected and so unable to mount an effective cytotoxic response against tumor cells. Instead of promoting tumor clearance, these activated lymphocytes may contribute to a dysfunctional immune milieu that permits tumor persistence and progression. These results identify a specific EV mediated pathway by which GBM cells can engage γδ T lymphocytes and suggest avenues to harness or modulate EV−ligand interactions for immunotherapeutic benefit.
Supplementary Materials
The following supporting information can be downloaded at the website of this paper posted on Preprints.org.
Author Contributions
Material preparation, experiments, and data analysis: Micaela Rosato, Paula Saibene Velez, Alejandra Infante Cruz, Federico Fuentes, and Matías Pibuel. GBM sample obtention: Juan Iturrizaga, Pablo Espil and Silvia Berner. Contributions to the manuscript writing: Micaela Rosato and Carolina Jancic. Critical revision of the manuscript: Gabriela Salamone, Silvia Berner and Mónica Vermeulen. Data interpretation and results discussion: Micaela Rosato, Gabriela Salamone and Carolina Jancic. Experimental design and manuscript writing: Micaela Rosato and Carolina Jancic. The authors read and approved the manuscript.
Funding
This work was supported by grant from Agencia Nacional de Promoción Científica y Tecnológica (PICT2019/255), Instituto Nacional del Cáncer, Fundación Florencio Fiorini and Consejo Nacional de Investigaciones Científicas y Técnicas.
Institutional Review Board Statement
The experimental protocols performed were approved by the Biosafety and Research Review Board of Instituto de Medicina Experimental − CONICET − ANM and the Ethical Committee of the Institutes of the Academia Nacional de Medicina. The procedures used in this study adhere to the tenets of the Declaration of Helsinki.
Informed Consent
Informed consent was obtained from participants included in the study.
Data Availability Statement
The datasets generated for this study are available on request to the corresponding author. The datasets employed for the transcriptomic meta-analysis in GBM samples were obtained from The Cancer Genome Atlas (TCGA): https:// portal. gdc. cancer. gov.
Acknowledgments
The authors thank Dr. Marianela Candolfi for providing the U251 cell lines. We are grateful to Dr. Matías Ostrowski and his team for their expert advice and for generously providing reagents used in this work. Authors thanks Drs Analía Trevani, Florencia Sabbione and Irene Ketelman for their support and timely assistance.
Conflicts of Interest/Competing Interests
The authors have no conflicts of interest to declare.
Abbreviations
CTLA–4: cytotoxic T−lymphocyte associated protein 4, EGFR: epidermal growth factor receptor, EVs: extracellular vesicles, FASL: FAS ligand, GBM: glioblastoma, HMBPP: (E)–4–hydroxy–3–methyl–but–2–enyl pyrophosphate, IFN–γ: interferon gamma, KLRK1: killer cell lectin-like receptor subfamily K member 1, MHC: major histocompatibility complex, MICA/B: MHC class I chain-related A/B, NTA: nanoparticle tracking analysis, NKG2D: natural killer group 2 member D, PD–1: Programmed cell death 1, PD–L1: Programmed death-ligand 1, TCGA: The Cancer Genome Atlas, TCR: T–cell receptor, Th1: T helper 1, TNF−α: tumor necrosis factor alpha, TRGV9: T cell receptor gamma variable 9.
References
- Louis, D.N.; Perry, A.; Wesseling, P.; Brat, D.J.; Cree, I.A.; Figarella-Branger, D.; et al. The 2021 WHO classification of tumors of the central nervous system: a summary. Neuro Oncol 2021, 23, 1231–51. [Google Scholar] [CrossRef]
- Liang, J.; Li, T.; Zhao, J.; Wang, C.; Sun, H. Current understanding of the human microbiome in glioma. Front Oncol 2022, 12, 781741. [Google Scholar] [CrossRef] [PubMed]
- Rafii, S.; Ghouzlani, A.; Naji, O.; Ait Ssi, S.; Kandoussi, S.; Lakhdar, A.; et al. A2AR as a prognostic marker and a potential immunotherapy target in human glioma. Int J Mol Sci 2023, 24, 6688. [Google Scholar] [CrossRef] [PubMed]
- Ostrom, Q.T.; Patil, N.; Cioffi, G.; Waite, K.; Kruchko, C.; Barnholtz-Sloan, J.S. CBTRUS statistical report: primary brain and other central nervous system tumors diagnosed in the United States in 2013–2017. Neuro Oncol 2020, 22 Supplement_1, iv1–96. [Google Scholar] [CrossRef]
- Fariah, R.; Pallavi, P.; Khush, J. Unlocking glioblastoma: breakthroughs in molecular mechanisms and next-generation therapies. Med Oncol 2025, 42(7), 276. [Google Scholar] [CrossRef]
- Ito, N.; Hasegawa, R.; Imaida, K.; Hirose, M.; Asamoto, M.; Shirai, T. Concepts in multistage carcinogenesis. Crit Rev Oncol Hematol 1995, 21(1–3), 105–33. [Google Scholar] [CrossRef]
- Boulhen, C.; Ssi, S.A.; Benthami, H.; Razzouki, I.; Lakhdar, A.; Karkouri, M.; et al. TMIGD2 as a potential therapeutic target in glioma patients. Front Immunol 2023, 14, 1173518. [Google Scholar] [CrossRef]
- Ghouzlani, A..; Lakhdar, A.; Rafii, S.; Karkouri, M.; Badou, A. The immune checkpoint VISTA exhibits high expression levels in human gliomas and associates with a poor prognosis. Sci Rep 2021, 11, 21504. [Google Scholar] [CrossRef] [PubMed]
- Vieira de Castro, J.; Gonçalves, C.S.; Hormigo, A; Costa, B.M. Exploiting the complexities of glioblastoma stem cells: Insights for cancer initiation and therapeutic targeting. Int J Mol Sci 2020, 21(15), 5278. [Google Scholar] [CrossRef]
- Lassman, A.B.; Joanta-Gómez, A.E.; Pan, P.C.; Wick, W. Current usage of tumor treating fields for glioblastoma. Neurooncol Adv 2020, 2(1), vdaa069. [Google Scholar] [CrossRef]
- Rong, Y.; Durden, D.L.; Van Meir, E.G.; Brat, D.J. “Pseudopalisading” necrosis in glioblastoma: a familiar morphologic feature that links vascular pathology, hypoxia, and angiogenesis. J Neuropathol Exp Neurol 2006, 65, 529–39. [Google Scholar] [CrossRef] [PubMed]
- Mills, B.N.; Albert, G.P.; Halterman, M.W. Expression profiling of the MAP kinase phosphatase family reveals a role for DUSP1 in the glioblastoma stem cell niche. Cancer Microenviron 2017, 10, 57–68. [Google Scholar] [CrossRef]
- Weenink, B.; French, P.J.; Sillevis Smitt, P.A. E.L.; Debets, R.; Geurts, M. Immunotherapy in glioblastoma: current shortcomings and future perspectives. Cancers (Basel) 2020, 2(3), 751. [Google Scholar] [CrossRef]
- Buzas, E.I. The roles of extracellular vesicles in the immune system. Nat Rev Immunol 2023, 23(4), 236–250. [Google Scholar] [CrossRef]
- Yáñez-Mó, M.; Siljander, P.R-M.; Andreu, Z.; Bedina Zavec, A.; Borràs, F.E.; Buzas, E.I.; et al. Biological properties of extracellular vesicles and their physiological functions. J Extracell Vesicle 2015, 4, 27066. [Google Scholar] [CrossRef]
- Skog, J.; Würdinger, T.; van Rijn, S.; Meijer, D.H.; Gainche, L.; Curry, W.T.; et al. Glioblastoma microvesicles transport RNA and proteins that promote tumour growth and provide diagnostic biomarkers. Nat Cell Biol 2008, 10, 1470–6. [Google Scholar] [CrossRef] [PubMed]
- Mathieu, M.; Martin-Jaular, L.; Lavieu, G.; Théry, C. Specificities of secretion and uptake of exosomes and other extracellular vesicles for cell-to-cell communication. Nat Cell Biol 2019, 21, 9–17. [Google Scholar] [CrossRef]
- Yates, A.G.; Pink, R.C.; Erdbrügger, U.; Siljander, P.R.; Dellar, E.R.; Pantazi, P.; et al. In sickness and in health: The functional role of extracellular vesicles in physiology and pathology in vivo: Part II: Pathology. J Extracell Vesicle 2022, 11, e12190. [Google Scholar] [CrossRef]
- Tankov, S.; Walker, P.R. Glioma-derived extracellular vesicles – far more than local mediators. Front Immunol 2021, 12, 679954. [Google Scholar] [CrossRef]
- Camussi, G.; Deregibus, M.C.; Bruno, S.; Cantaluppi, V.; Biancone, L. Exosomes/microvesicles as a mechanism of cell-to-cell communication. Kidney Int 2010, 78, 838–48. [Google Scholar] [CrossRef] [PubMed]
- Marar, C.; Starich, B.; Wirtz, D. Extracellular vesicles in immunomodulation and tumor progression. Nat Immunol 2021, 22(5), 560–570. [Google Scholar] [CrossRef]
- Wieckowski, E.U.; Visus, C.; Szajnik, M.; Szczepanski, M.J.; Storkus, W.J.; Whiteside, T. L. Tumor-derived microvesicles promote regulatory T cell expansion and induce apoptosis in tumor-reactive activated CD8+ T lymphocytes. J Immunol 2009, 183, 3720–3730. [Google Scholar] [CrossRef] [PubMed]
- Huber, V.; Fais, S.; Iero, M.; Lugini, L.; Canese, P.; Squarcina, P.; Zaccheddu, A.; et al. Human colorectal cancer cells induce T-cell death through release of proapoptotic microvesicles: role in immune escape. Gastroenterology 2005, 128, 1796–1804. [Google Scholar] [CrossRef]
- Whiteside, T.L. The role of tumor-derived exosomes (TEX) in shaping anti-tumor immune competence. Cells 2021, 10, 3054. [Google Scholar] [CrossRef]
- Qi, Z.; Long, X.; Liu, J.; Cheng, P. Glioblastoma microenvironment and its reprogramming by oncolytic virotherapy. Front Cell Neurosci 2022, 16, 819363. [Google Scholar] [CrossRef]
- Ghazi, B.; Harmak, Z.; Rghioui, M.; Kone, A-S.; El Ghanmi, A.; Badou, A. Decoding the secret of extracellular vesicles in the immune tumor microenvironment of the glioblastoma: on the border of kingdoms. Front Immunol 2024, 15, 1423232. [Google Scholar] [CrossRef]
- Lv, J.; Liu, Z.; Ren, X.; Song, S.; Zhang, Y.; Wang, Y. γδT cells, a key subset of T cell for cancer immunotherapy. Front Immunol 2025, 16, 1562188. [Google Scholar] [CrossRef]
- Brenner, M.B.; McLean, J.; Dialynas, D.P.; Strominger, J.L.; Smith, J.A.; Owen, F.L.; et al. Identification of a putative second T-cell receptor. Nature 1986, 322(6075), 145–9. [Google Scholar] [CrossRef]
- Wang, C.Q.; Lim, P.Y.; Tan, A.H-M. Gamma/delta T cells as cellular vehicles for anti-tumor immunity. Front Immunol 2024, 14, 1282758. [Google Scholar] [CrossRef] [PubMed]
- Subhi-Issa, N.; Manzano, D.T.; Pereiro Rodríguez, A.; Sanchez Ramon, S.; Perez Segura, P.; Ocaña, A. γδ T Cells: Game changers in immune cell therapy for cancer. Cancers (Basel) 2025, 17(7), 1063. [Google Scholar] [CrossRef] [PubMed]
- Silva-Santos, B.; Serre, K.; Norell, H. γδ T cells in cancer. Nat Rev Immunol 2015, 15(11), 683–91. [Google Scholar] [CrossRef]
- Puan, K.J.; Jin, C.; Wang, H.; Sarikonda, G.; Raker, A.M.; Lee, H.K.; Samuelson, M.I.; Märker-Hermann, E.; Pasa-Tolic, L.; Nieves, E.; Giner, J. L.; Kuzuyama, T.; Morita, C.T. Preferential recognition of a microbial metabolite by human Vγ2Vδ2 T cells. Int Immunol 2007, 19(5), 657–73. [Google Scholar] [CrossRef]
- Correia, D.V.; Lópes, A.C.; Silva-Santos, B. Tumor cell recognition by γδ T lymphocytes: T-cell receptor vs. NK-cell receptors. OncoImmunology 2013, 2(1), e22892. [Google Scholar] [CrossRef]
- Chitadze, G.; Lettau, M.; Luecke, S.; Wang, T.; Janssen, O.; Fürst, D.; et al. NKG2D- and T-cell receptor-dependent lysis of malignant glioma cell lines by human γδ T cells: modulation by temozolomide and A disintegrin and metalloproteases 10 and 17 inhibitors. OncoImmunology 2016, 5(4), e1093276. [Google Scholar] [CrossRef]
- Friese, M.A.; Platten, M.; Lutz, S.Z.; Naumann, U.; Aulwurm, S.; Bischof, F.; et al. MICA/NKG2D-mediated immunogene therapy of experimental gliomas. Cancer Res 2003, 63(24), 8996–9006. [Google Scholar] [PubMed]
- Fisch, P.; Malkovsky, M.; Kovats, S.; Sturm, E.; Braakman, E.; Klein, B.; et al. Recognition by human Vγ9/Vδ2 T cells of a GroEL homolog on Daudi Burkitt’s lymphoma cells. Science 1990, 250(4985), 1269–73. [Google Scholar] [CrossRef] [PubMed]
- Towstyka, N.Y.; Shiromizu, C.M.; Keitelman, I.A.; Sabbione, F.; Salamone, G.V.; Geffner, J.R.; Trevani, A.S.; Jancic, C.C. Modulation of γδ T-cell activation by neutrophil elastase. Immunology 2018, 153, 225–237. [Google Scholar] [CrossRef]
- Sabbione, F.; Gabelloni, M.L.; Ernst, G.; Gori, M.S.; Salamone, G.V.; Oleastro, M.; Trevani, A.S.; Geffner, J.R.; Jancic, C.C. Neutrophils suppress γδ T-cell function. Eur J Immunol 2014, 44, 819–830. [Google Scholar] [CrossRef]
- Rosso, D.A.; Rosato, M.; Iturrizaga, J.; González, N.; Shiromizu, C.M.; Keitelman, I.A.; Coronel, J.V.; Gómez, F.D.; Amaral, M.M.; Rabadan, A.T.; Salamone, G.V.; Jancic, C.C. Glioblastoma cells potentiate the induction of the Th1-like profile in phosphoantigen-stimulated γδ T lymphocytes. J Neurooncol 2021, 153(3), 403–415. [Google Scholar] [CrossRef] [PubMed]
- Fraser, K.; Jo, A.; Giedt, J.; Vinegoni, C; Yang, K.S.; Peruzzi, P.; Chiocca, E.A.; Breakefield, X.O.; Lee, H.; Weissleder, R. Characterization of single microvesicles in plasma from glioblastoma patients. Neuro Oncol 2019, 21(5), 606–615. [Google Scholar] [CrossRef]
- Théry, C.; Amigorena, S.; Raposo, G.; Clayton, A. Isolation and characterization of exosomes from cell culture supernatants and biological fluids. Curr Protoc Cell Biol 2006, Chapter 3, Unit 3.22. [Google Scholar] [CrossRef] [PubMed]
- Welsh, J.A.; Arkesteijn, G. J.A.; Bremer, M.; Cimorelli, M.; Dignat-George, F.; Giebel, B.; Görgens, A.; Hendrix, A.; Kuiper, M.; Lacroix, R.; Lannigan, J.; van Leeuwen, T.G.; Lozano-Andrés, E.; Rao, S.; Robert, S.; de Rond, L.; Tang, V.A.; Tertel, T.; Yan, X.; Wauben, M.; et al. A Compendium of single extracellular vesicle flow cytometry. J Extracell Vesicles 2023, 12(2), e12299. [Google Scholar] [CrossRef]
- Cui, H.; Zhao, G.; Lu, Y.; Zuo, S.; Duan, D.; Luo, X.; Zhao, H.; Li, J.; Zeng, Z.; Chen, Q.; Li, T. TIMER3: an enhanced resource for tumor immune analysis. Nucleic Acids Res 2025, 53(W1), W534–W541. [Google Scholar] [CrossRef] [PubMed]
- Welsh, J.A.; Goberdhan, D.C.I.; O’Driscoll, L.; Buzas, E.I.; Blenkiron, C.; Bussolati, B.; Cai, H.; Di Vizio, D.; Driedonks, T.A.P.; Erdbrügger, U.; et al. Minimal information for studies of extracellular vesicles (MISEV2023): From basic to advanced approaches. J Extracell Vesicles Erratum in: J Extracell Vesicles. 2024, 13(5):e12451. doi: 10.1002/jev2.12451. 2024, 13(2), e12404. [Google Scholar] [CrossRef] [PubMed]
Figure 1.
Characterization of EVs derived from GBM cell line U251. (a) Representative images, obtained by transmission electron microscopy, of EVs derived from U251 cells (U251 EVs). Scale bar=200nm. (b) Representative histogram of U251 EVs’ size distribution in one sample, measured by NTA. Mean diameter (c), Z potential (d), and concentration values (e) of U251 EVs samples measured by NTA, n=4. (f) Representative histogram showing the percentage of CD9+/CD81+ U251 EVs expressing CD63, measured by flow cytometry. (g) Representative western blot for CD63 expression both in U251 cells and EVs. (h−j) Representative histograms showing the percentage of U251 cells (left panel) and CD9+/CD81+ U251 EVs (right panel) expressing EGFR (h), PD−L1 (i) and MICA/B (j), evaluated by flow cytometry. (k) Representative histogram showing the percentage of DAPI+ particles in samples.
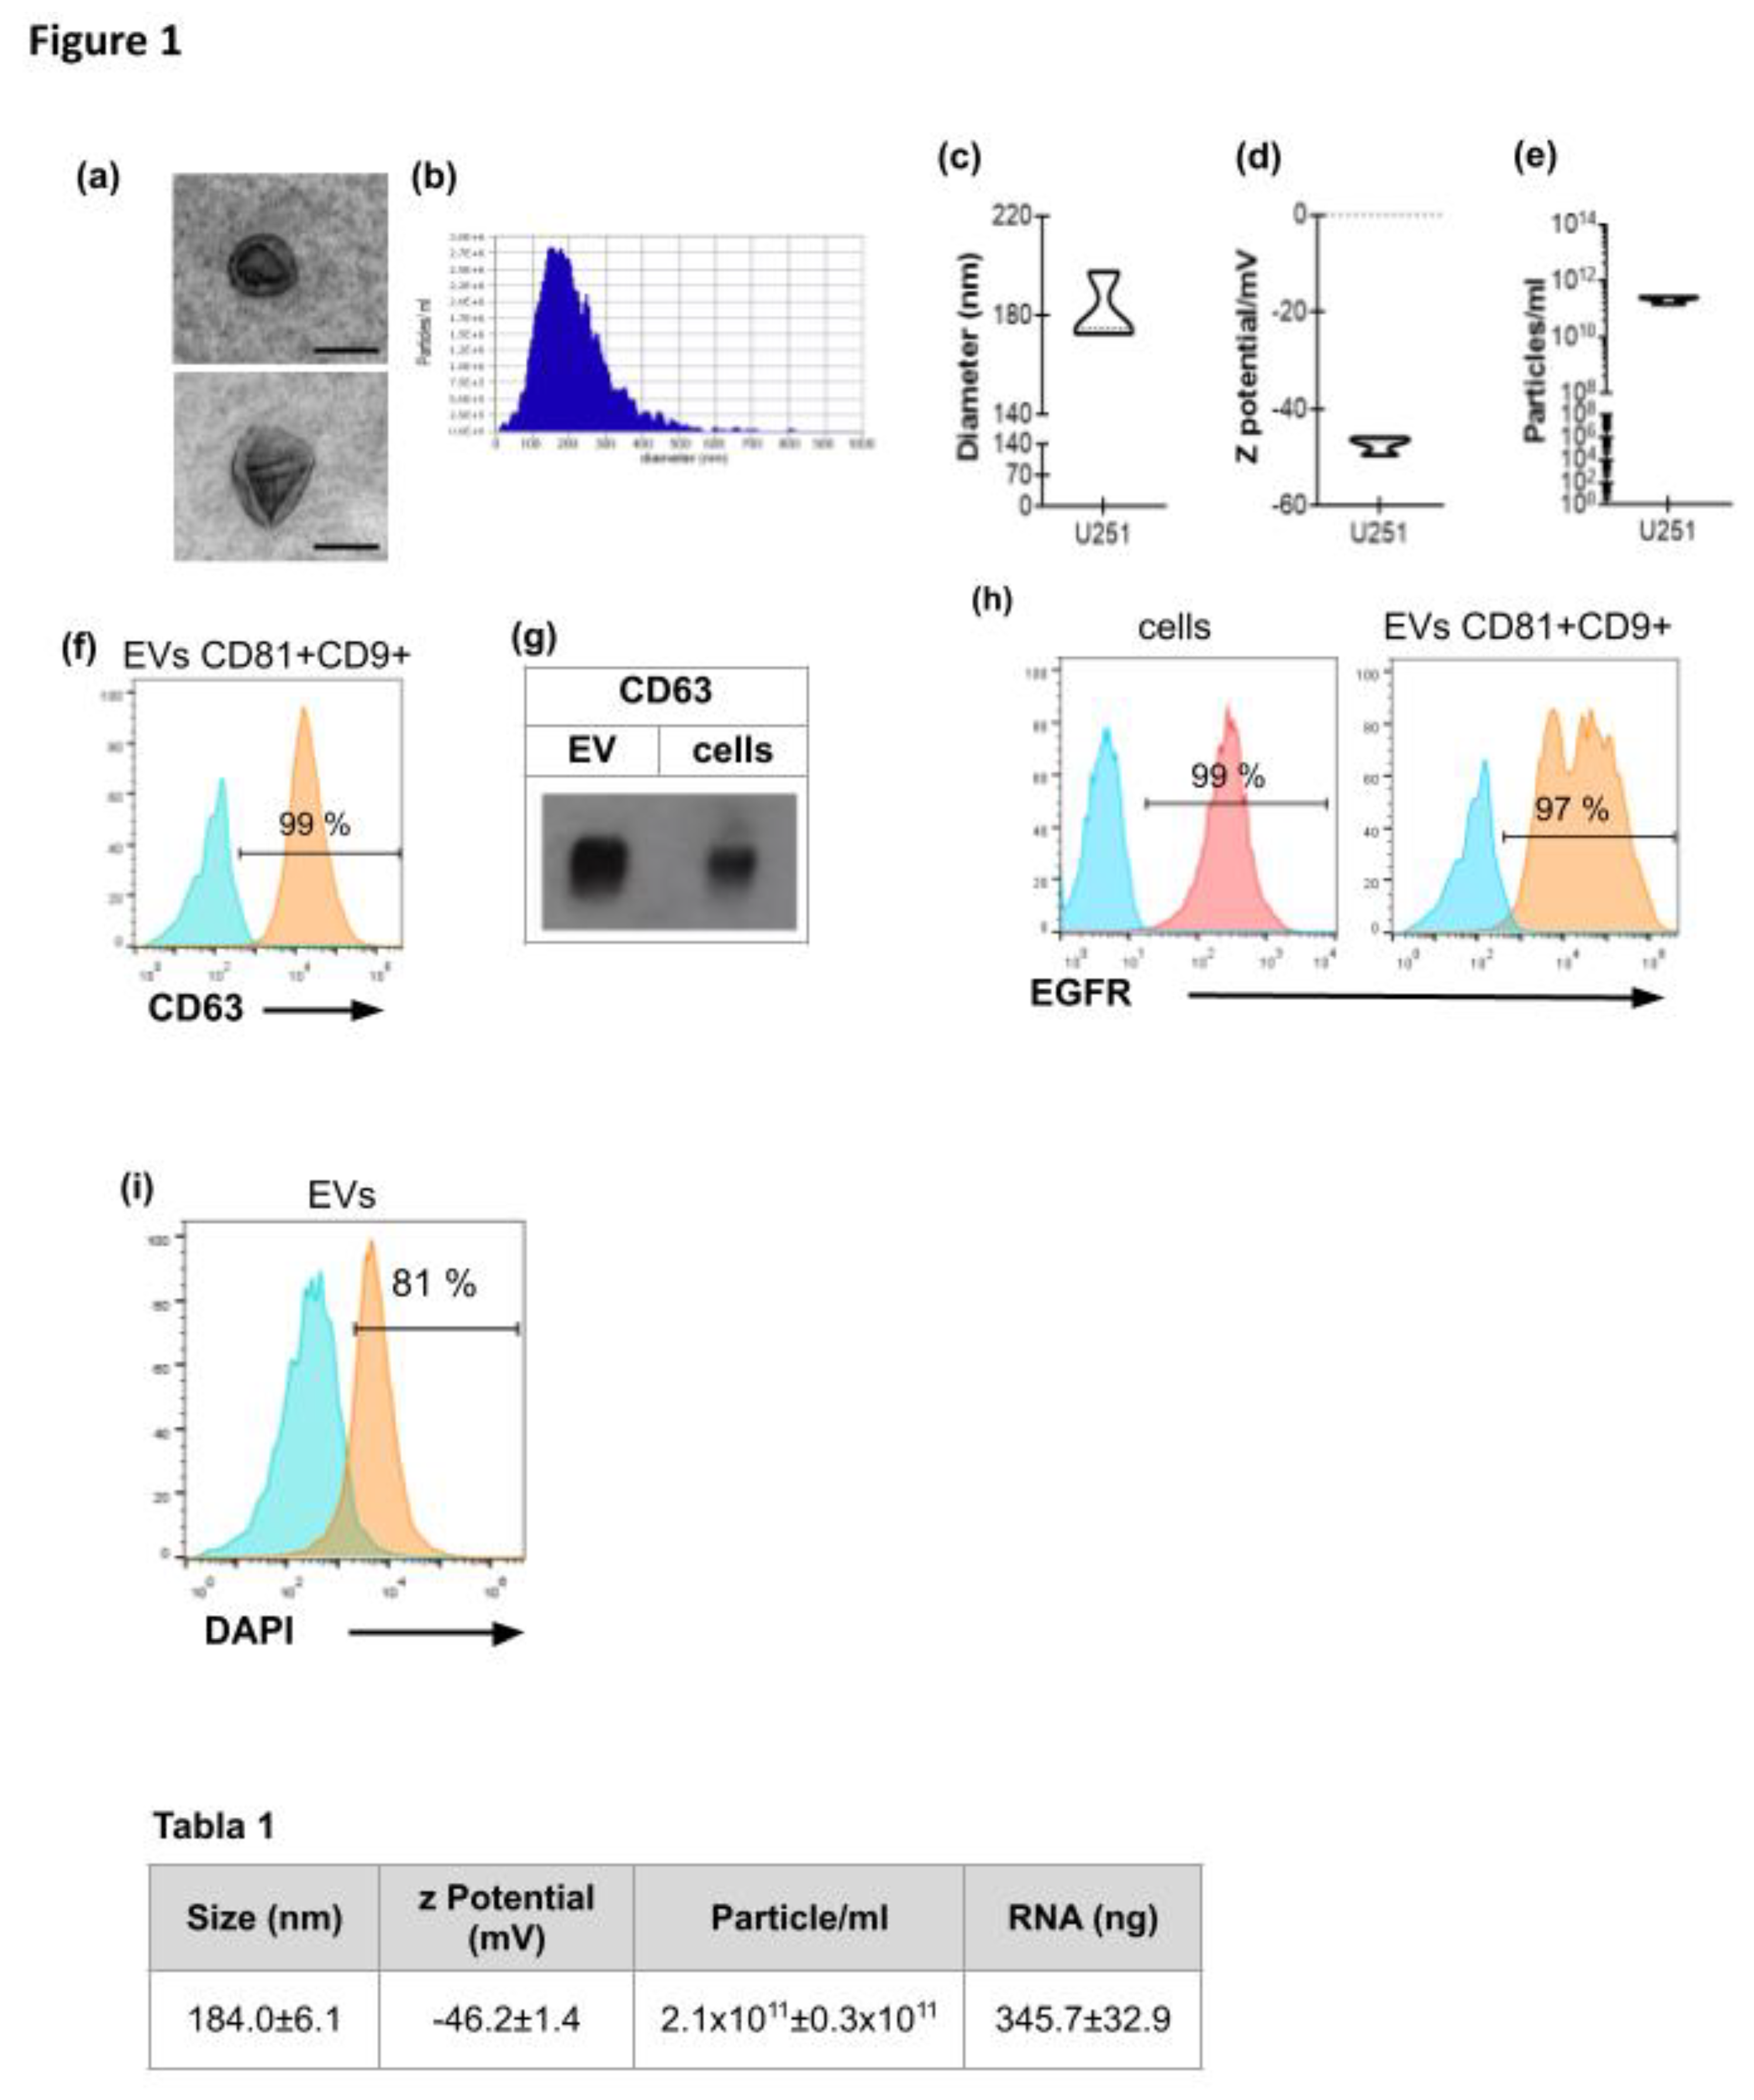
Figure 2.
Figure 2. GBM−derived EVs interact with γδ T cells. (a−d) After purification, γδi T cells were activated or not with HMBPP 1 µM and incubated during 3 h or O.N. with U251-derived EVs, previously stained with PKH26 (red). γδ T cells were then collected and observed by confocal microscopy. (a) Representative images of PKH26+ γδ T cells. Nucleus were stained with DAPI (blue). Magnification: 60X. (b) Diagram (left panel) and representative images (right panel) of orthogonal views of a z−stack of one single cell of HMBPP O.N. condition. (c) Mean colour intensity of PKH26 in γδ T cells. ***p<0.001, ****p<0.0001, Kruskal Wallis and Dunn’s multiple comparisons test. (d) Percentage of PKH26+ and PKH26− γδ T cells for each condition.
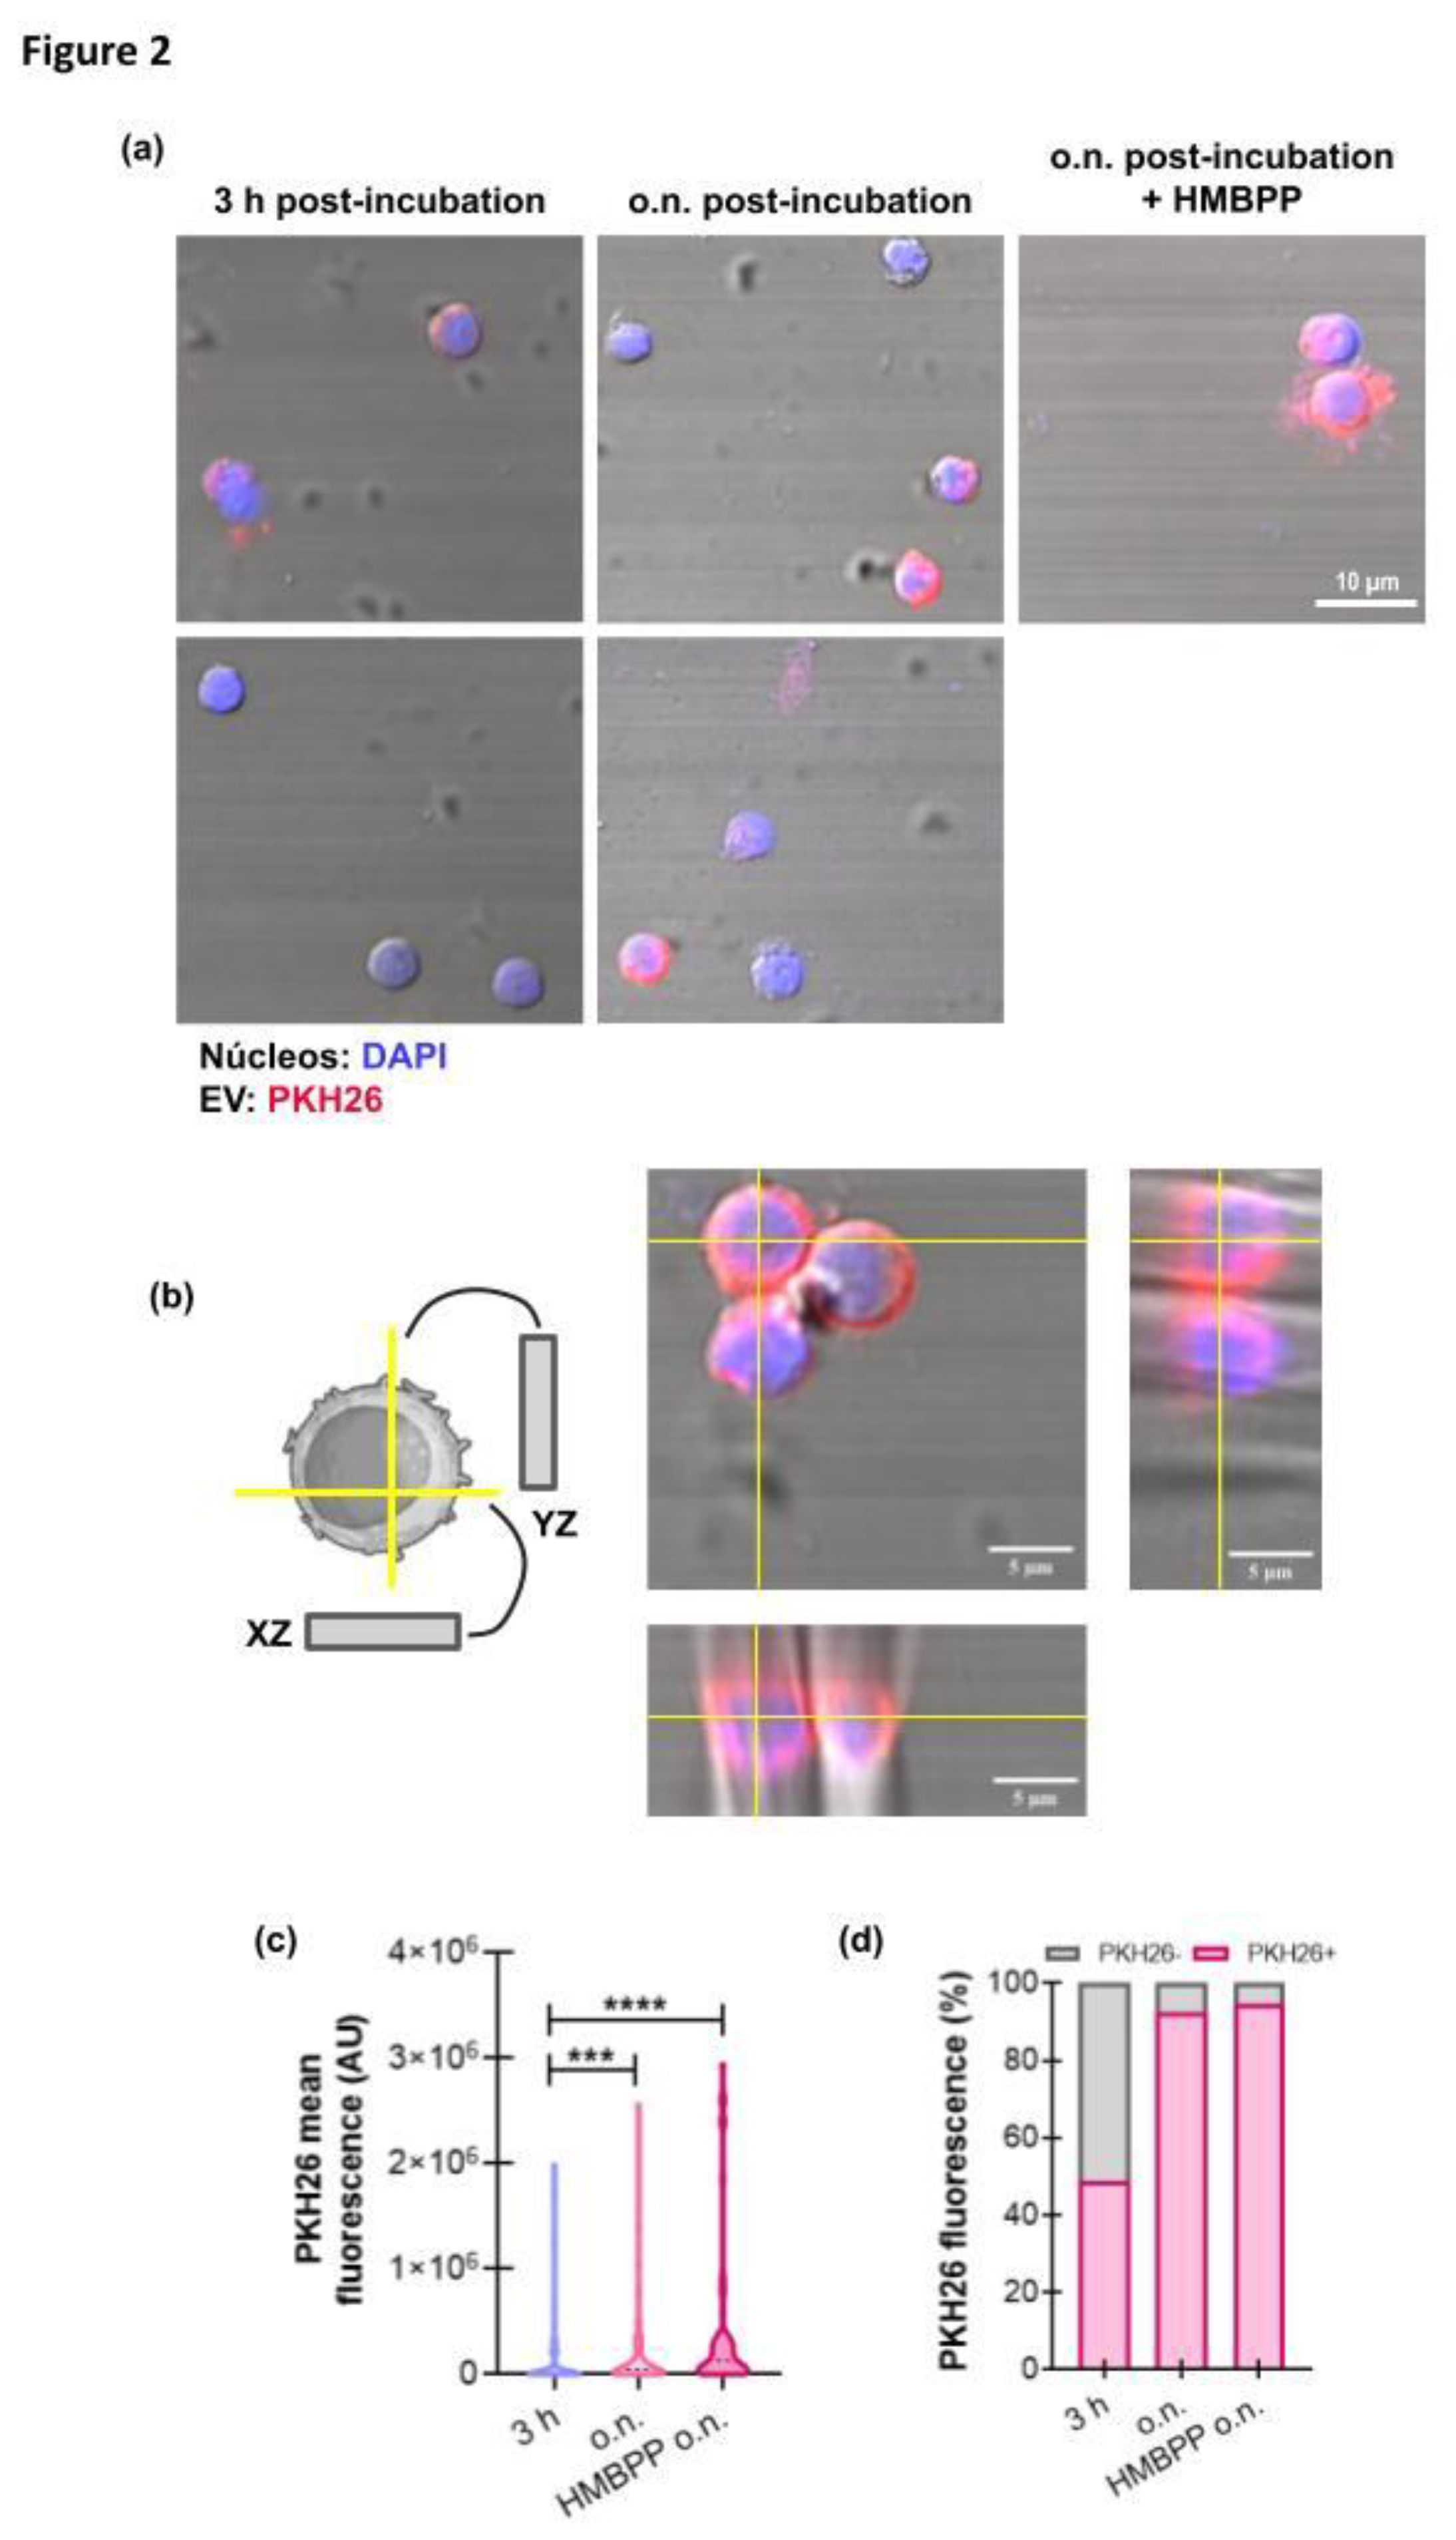
Figure 3.
Figure 3. GBM−derived EVs modulate γδ T cells’ function. (a−f) γδ T cells were incubated O.N. with or without U251−derived EVs. Afterwards, the activation state of γδ T cells was analyzed by measuring the expression of CD69 and PD−1 by flow cytometry, and the release of TNF−α and IFN−γ by ELISA. (a−b) Percentage of (a) CD69+ and (b) PD−1+ γδ T cells from healthy donors. One-tailed Wilcoxon test. (c−d) Concentration of (c) TNF−α and (d) IFN−γ in culture supernatants, One-tailed Mann-Whitney test. (e−f) Percentage of CD69+ γδ T cells from (e) healthy donors and (f) GBM patients. One-tailed paired t test. (g) Schematic diagram of propidium iodide (PI) labelling of apoptotic cells. (h) PI+ U251 cells after co-culture with γδ T cells, with (gray bar) or without (white bar) U251−derived EVs, measured by flow cytometry. Pink bar: U251 alone. Results are shown as the mean ± SEM. *p<0.05, ***p<0.001. Illustration (b) designed in BioRender.
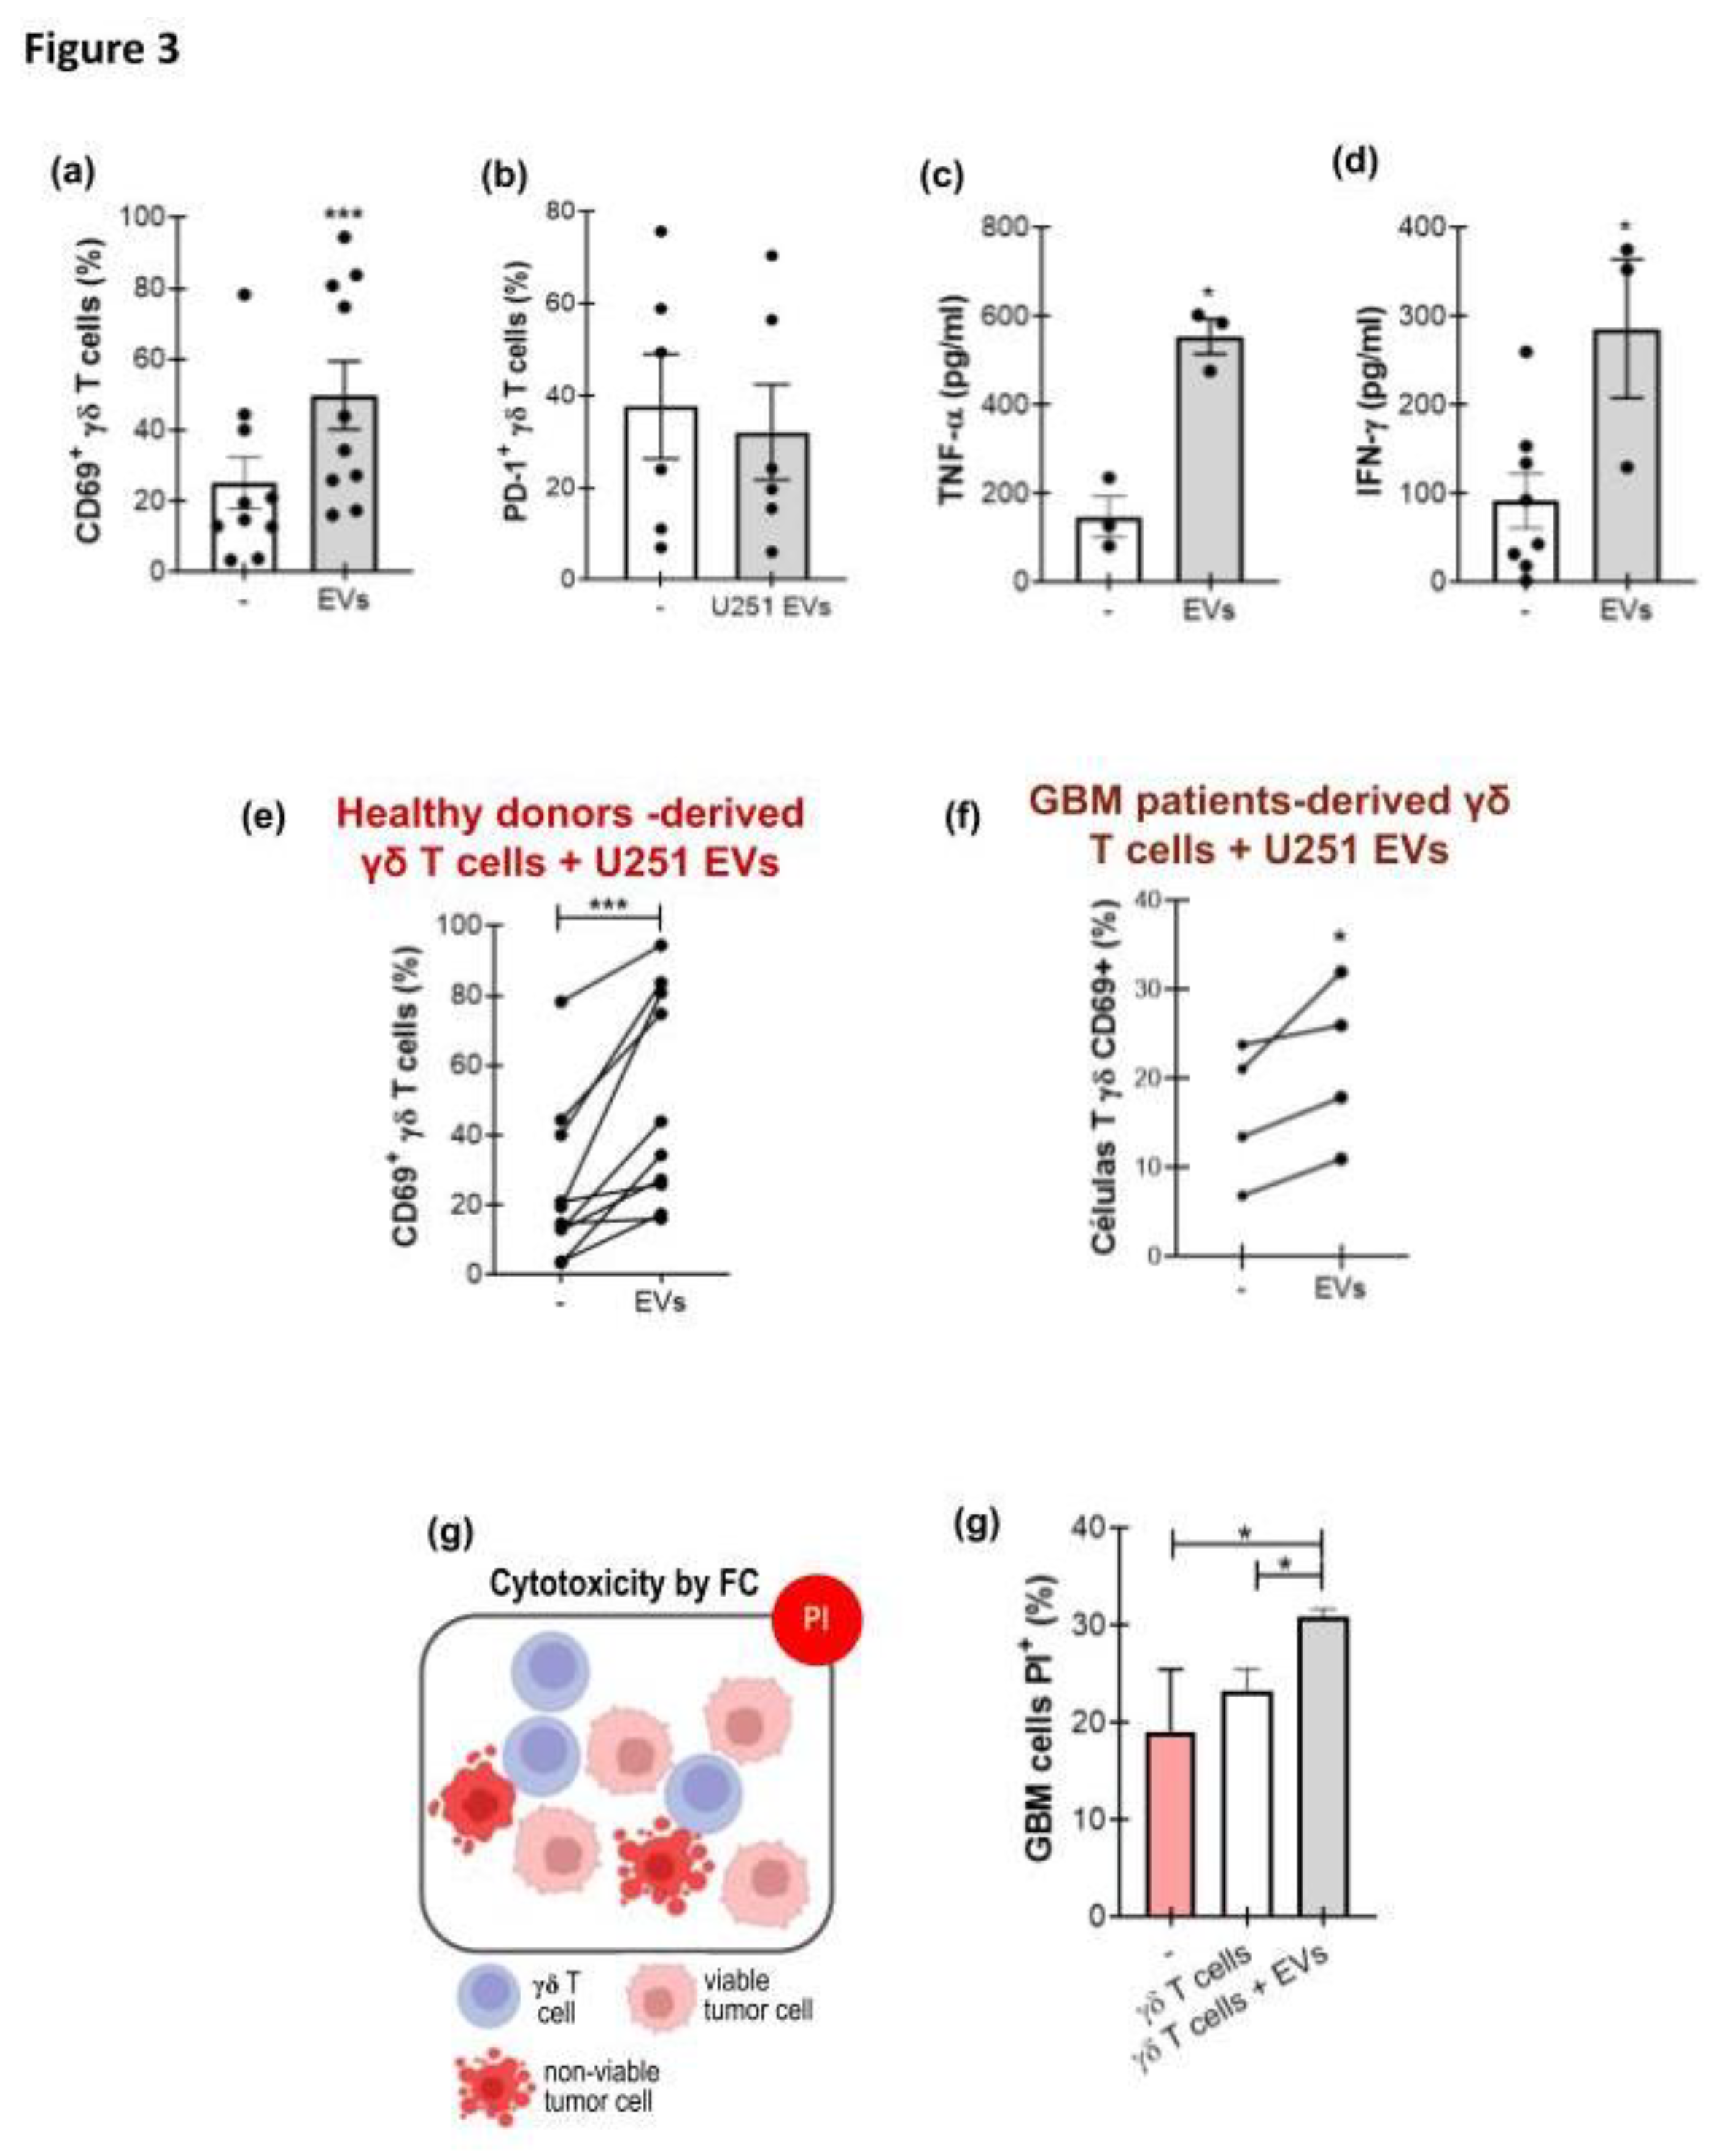
Figure 4.
GBM−derived EVs modulate γδ T cells’ activation by a MIC−dependent mechanism. (a) Dot−plot of CD45+/γδTCR+ expression in a disaggregated GBM biopsy, analyzed by flow cytometry. (b-h) Transcripts expression in GBM samples (from TCGA data base) were analyzed using TIMER 3.0. (b) Violin plots of TRGV9 (left panel), KLRK1 (middle panel), and PDCD1 (right panel) expression in GBM samples. (c and d) Scatter plot showing the Spearman correlation between KLRK1 (c) and TRGV9 expression, adjusted for tumor purity. (d) Violin plots of EGFR, MICA, MICB, and CD274 expression in tumor samples (e) Scatter plot showing the Spearman correlation between EGFR and MICA (left panel), MICB (middle panel), and CD274 (right panel), adjusted for tumor purity. Blue curves represent smoothed trend lines with 95% confidence intervals. Correlation coefficients and corresponding p values are indicated. (f) Diagram of surface molecules present in U251−derived EVs and γδ T cells, and their possible interactions. (g and h) Representative histograms showing the percentage of U251 cells expressing PD−L1 (g) or MICA/B (h). (i) Percentage of CD69+ γδ T cells when incubated O.N. with or without (white bar) U251−derived EVs and with IgG, anti−MIC or anti-PD-L1 antibodies. Friedman and Dunn’s multiple comparisons tests. Results are shown as the mean ± SEM. *p<0.05.
Disclaimer/Publisher’s Note: The statements, opinions and data contained in all publications are solely those of the individual author(s) and contributor(s) and not of MDPI and/or the editor(s). MDPI and/or the editor(s) disclaim responsibility for any injury to people or property resulting from any ideas, methods, instructions or products referred to in the content. |
© 2025 by the authors. Licensee MDPI, Basel, Switzerland. This article is an open access article distributed under the terms and conditions of the Creative Commons Attribution (CC BY) license (http://creativecommons.org/licenses/by/4.0/).
Copyright: This open access article is published under a Creative Commons CC BY 4.0 license, which permit the free download, distribution, and reuse, provided that the author and preprint are cited in any reuse.


