
Submitted:
03 June 2025
Posted:
03 June 2025
You are already at the latest version
Abstract
Glioblastoma multiforme (GBM) is a highly aggressive brain tumor with an overall poor prognosis due to its immunosuppressive tumor microenvironment (TME). Microglia and tumor-associated macrophages (TAMs) with pro-tumorigenic properties are dominant populations of immune cells in the GBM TME. To date, several studies targeting TAMs to fight tumor progression in different tumor entities have been initiated. However, the impact of standard therapy schemes of glioblastoma cells on macrophage polarization, activation, and phagocytosis remains controversial. The same applies to the relevance of PD-1/PD-L1 blockade in macrophage and tumor cell interaction. Our study therefore investigated patient-oriented treatment of GBM on the phagocytic capacity of polarized M1- and M2-like macrophages with GL261-luc2 tumor cells as preclinical model system. In addition, we analyzed the expression of activation and immune checkpoint markers on these macrophage subtypes after contact with tumor cells and their microenvironment. These factors were also determined after PD-1 blockade. The analyses revealed that the immunoregulatory M2-like macrophages generally exhibited a higher phagocytosis rate than the pro-inflammatory M1-like macrophages, which was however not influenced by pretreatment of glioblastoma cells with chemo- or radiotherapy. This could not be improved by blocking the PD-1 receptor. Furthermore, there were no modulations in the expression of differentiation, activation, or immune checkpoint molecules of M1- and M2-like macrophages after cell-to-cell contact with glioblastoma cells. But, the medium conditioned by tumor cells strongly altered M1-like macrophages towards a more activated state, whereas M2-like cells were only mildly influenced. This was further enhanced by tumor cell treatment, with the most prominent effect after irradiation. These results suggest an impact of conventional GBM tumor cell treatment on the immunogenic status of macrophage subtypes, which is of relevance for increasing anti-tumor immune response in brain tumors.
Keywords:
glioblastoma
; chemoradiation
; macrophages
; TAM
; immune checkpoint molecule
; PD-1
; PD-L1/L2
1. Introduction
Glioblastoma multiforme (GBM) is a highly malignant grade IV astrocytoma with an overall survival rate of only about 15 months and a particularly high risk of relapse, despite long-term research and innovative treatment strategies. To date, conventional fractionated radiotherapy combined with chemotherapy (temozolomide) is still the standard of care, as it has been for decades. This is despite years of clinical studies and investigations. The therapy is complicated by factors such as the tumor localization, its heterogeneity, the overall low mutational burden, and its immunosuppressive character [1]. Immunotherapy is one promising tool in fighting cancer that has been successful in many tumor entities in subgroups of patients. One key option is the targeting of immune checkpoints. Immune checkpoints naturally function as regulatory feedback mechanisms following immune activation to prevent immune overstimulation and the uncontrolled proliferation of reactive lymphocytes, thereby maintaining physiological homeostasis after infection or inflammation [2]. Tumors exploit these mechanisms to limit the function of anti-tumor effector cells and evade immune surveillance. Cytotoxic T Lymphocyte Antigen 4 (CTLA-4) and Programmed Cell Death Protein 1 (PD-1)/Programmed Death Ligand 1 (PD-L1) are two prominent immune checkpoints known to impact the outcome of several tumor entities. The ligand PD-L1 can be expressed by activated T and B cells, but also by glioblastoma cells themselves [3], as well as microglia and TAMs. Additionally, standard radiotherapy (RT) has been shown to have unwanted side effects on tumor cells concerning the expression of the immune checkpoint molecules programmed death ligand 1 (PD-L1) and PD-L2 [4]. Its receptor, PD-1, is mainly found on activated T cells. The interaction between this receptor-ligand pair inhibits the proliferation and cytolytic function of effector T cells, which subsequently has an immunosuppressive effect on a potential T-cell response and thus is beneficial to the tumor. Therefore, one immunotherapeutic approach has been to target the PD-1/PD-L1 axis with inhibitory antibodies to block counter-regulatory signaling in T cells and promote anti-tumor immune responses, which has been very successful for a subgroup of patients in many tumor entities such as lung cancer. However, no breakthrough has been achieved for glioblastoma yet.
Under healthy conditions, the major immune sentinels of the central nervous system (CNS) inside the brain are microglia and astrocytes [5]. As such, they manage immune surveillance, contribute to maintaining the blood-brain barrier (BBB), and obtain homeostasis. Yet, pathological conditions foster the escape of immune surveillance. Glioblastomas can evade the immune system through several suppressive mechanisms, such as the expression and/or secretion of immune checkpoint molecules, cytokines, or chemokines, and the subsequent recruitment and activation of suppressive immune cells such as regulatory T cells (Treg), myeloid-derived suppressor cells (MDSCs) or tumor-associated macrophages (TAMs). TAMs comprise about half of the GBM microenvironment [6,7], including infiltrating macrophages and resident microglia. The recruitment and polarization of these immune cells are especially influenced by the tumor microenvironment (TME). A study by Kvisten et al. investigated the localization of TAMs within GBM tissue and found them primarily in the central tumor area rather than in the infiltration zone. In addition, they confirmed that TAMs in glioblastoma differ in morphologies that correspond to different activation states [8]. Furthermore, the population of TAMs seems to vary between slow- and fast-growing glioblastoma. These findings give evidence for a role of TAMs in the therapy resistance of GBM. In general, the mechanisms of action of TAMs associated with tumor progression in other cancer entities include modulation of the immune response, modification of the TME, and direct support of tumor cells. Thus, several therapeutic approaches to target TAMs were suggested, from TAM depletion [9] to blocking particular TAM functions in immunosuppression or angiogenesis [10], enhancing phagocytosis [11], or reprogramming TAM polarization [12]. The polarization of macrophages into M1- and M2-type is essential for their immunological function. M1 macrophages are considered to be pro-inflammatory and anti-tumorigenic, while M2 macrophages, designated as TAMs, may contribute to tumor progression through several regulatory mechanisms as described above [12].
TAMs also promote tumor growth by suppressing anti-tumor immunity through immune checkpoint molecules, such as the PD-1/PD-L1 axis. Using a CT26 colon carcinoma model, Gordon et al. discovered that TAMs expressing PD-1 correlate negatively with the phagocytic potency of tumor cells. They also found that blocking PD-1/PD-L1 increases macrophage phagocytosis, reduces tumor growth, and enhances survival [13].
The high volume of TAMs in the immunosuppressive tissue of glioblastoma, as well as the inhibitory function of immune checkpoints, led us to investigate the regulatory function of PD-1/PD-L1 in polarized M1- and M2-like macrophages concerning the phagocytic capacity of glioblastoma cells. Additionally, we sought to decipher the impact of glioblastoma treatment on the activation and immunogenic status of M1- and M2-like macrophages by analysing the expression of activation and immune checkpoint molecules. The overall goal is to improve our understanding of the ongoing cellular and molecular mechanisms involved in standard glioblastoma therapy in order to identify weak points for targeted treatment.
2. Results
2.1. Neither Chemoradiation of Glioblastoma Cells nor PD-1 Blockade Affects the Differentiation Status or Immune Checkpoint Expression of M1- and M2-Like Cells
Various preclinical studies have demonstrated the role of PD-1 on myeloid cells in tumor treatment [13,14,15], providing evidence for studies on PD-1 receptor/ligand blockade on TAMs in glioblastoma. To investigate the impact of chemoradiation on glioblastoma cells as well as PD-1/PD-L1 blockade on TAM differentiation and activation, we prepared syngeneic co-culture assays using GL261-luc2 glioblastoma cells with M1-like and M2-like macrophages. M1- (classically activated) and M2-like (alternatively activated) macrophages were differentiated from the bone marrow of C57BL/6 mice via cytokine stimulation. Their immunogenic status was then determined using flow cytometry by determining various surface markers to detect differentiation, activation, and expression of immune checkpoint molecules. The tumor cells were treated with temozolomide (TMZ) as chemotherapy (CT), fractionated radiotherapy (RT), or a combination of the two (RCT) in a patient-oriented manner. Mock-treated cells served as controls.
Major Histocompatibility Complex II (MHC II) molecules, important for antigen presentation and thus induction of adaptive immune responses, are induced by factors such as lipopolysaccharide (LPS) and interferon-gamma (IFN-γ) and found to be more highly expressed on M1-like than M2-like cells [16]. Their differential expression results in a more efficient antigen presentation in M1-like macrophages, whereas the lower MHC II level in M2-like cells plays a role in resolving inflammation and fostering tissue repair [17]. Cellular contact of M1-like cells with treated glioblastoma cells resulted in a small, though not statistically significant, up-regulation of MHC II after treatment with the most prominent effect occurring after chemoradiation (RCT). This effect was reduced in M2-like cells (Figure 1A). CD11b is an integrin expressed on both M1- as well as M2-like cells. However, it is activated differently in each cell type and results in different downstream effects. However, no impact on its surface expression could be detected in dependence of tumor cell treatment (Figure 2B). To evaluate the impact of cell-cell contact between M1- or M2-like cells and tumor cells on the differentiation status of macrophages, we chose to determine CD206 as a marker to identify M2 macrophages. Although we found it to be expressed on both subtypes, it was much more prevalent on M2-like cells. But again, no significant alterations were detected after tumor cell treatment. Interestingly, contact with treated tumor cells enhanced the expression of CD206 on M1-like cells, although this was not significant (Figure 1C). CD80 and CD86 are costimulatory molecules expressed on both macrophage subtypes, whereby CD80 is more associated with M1 macrophages and pro-inflammatory responses. Both molecules are found on tumor-infiltrating lymphocytes (TILs) and TAMs [18,19]. In the glioblastoma TME, higher expression of CD80 and CD86 was associated with shorter progression-free survival (PFS) [19]. Our experiments revealed the expression of both molecules CD80 and CD86 on both macrophage subtypes (Figure 1D,E). Although no significant differences were detected depending on treatment, a slight increase in CD80 expression on M1-like cells was measured after cell-to-cell contact with CT and RCT-treated tumor cells.
Since no modulation of activation or differentiation markers on M1- and M2-like cells was detected upon tumor cell contact, we further evaluated the expression of immune checkpoint molecules to determine the immunogenic profile of these macrophages after tumor cell contact. The expression of PD-1 and PD-L1 on TAMs was associated with a response to PD-1 blockade in different tumor models [15,20]. High levels of T cell immunoglobulin and mucin-domain containing-3 (TIM-3) on tumor-reactive CD8+ T cells also correlate with an overall positive response to anti-PD-1 therapy [20]. In the context of TAMs, TIM-3 has been associated with the polarization towards the M2 subtype, e.g. in anaplastic thyroid [21] and colorectal cancer [22]. Additionally, a poor prognosis regarding overall survival (OS) in various solid tumor entities was described [23,24]. In our analyses, all of the described factors were found to be expressed on M1- and M2-like cells (Figure 1F-H). However, neither of these factors was found to be significantly regulated depending on tumor cell treatment. CD275, also known as Inducible costimulator-ligand (ICOS-L), is expressed by DCs, macrophages, and tumor cells and interacts with its receptor ICOS on T cells, thereby crucial for the modulation of immune responses inside the TME. Depending on the context, both anti-tumor T cell activation and pro-tumor regulatory T cell function are possible [25]. A study from 2022 showed a correlation of higher ICOS with more malignancy in gliomas [26], which is why we also analyzed CD275 expression on macrophage subtypes. OX40L is another immune checkpoint with therapeutic implications due to its dual role in immune modulation [27]. OX40L expression modulates adaptive immune responses depending on the TME in GBM [28]. In the context of tumor cell treatment, no alterations of OX40L and CD275 expression were detected between M1- and M2-like cells. The expression was also independent of the tumor cell treatment (Figure 1I, J). Of note, in all conditions, the addition of anti-PD-1 antibodies did not influence the surface expression of either of the investigated molecules (Figure 1).
2.2. M2-Like Macrophages Have a Higher Capacity to Phagocytize Tumor Cells Than M1-Like Macrophages, Regardless of Tumor Cell Treatment
Since the cellular contact of tumor cells with macrophages had no great impact on their activation, differentiation, or immune checkpoint expression, we sought to analyze the phagocytosis of glioblastoma cells in dependence on treatment and macrophage subtype. Murine bone marrow-derived monocytes were polarized into M1- and M2-like macrophages via stimulation with cytokines. GL261-luc2 glioblastoma cells that were differentially treated were used as bait. We further tested the effect of PD-L1 expression on phagocytic capacity by adding an anti-PD-1 therapeutic antibody.
Notably, the phagocytosis rate of polarized M2-like macrophages was higher than that of M1-like macrophages (Figure 2). Furthermore, while there were no differences in the phagocytic capacity of M2-like cells among the treatment conditions (Figure 2B), M1-like macrophages exhibited a significant decrease in tumor cell uptake following chemoradiation. Single treatments revealed that RT was most likely responsible (Figure 2A). In contrast to findings in a colorectal tumor model [13], we could not detect a PD-1/PD-L1-dependent phagocytosis of glioblastoma cells.
2.3. The Altered Micromilieu of Treated Tumor Cells Significantly Impacts M1-Like Macrophage Activation and Immune Checkpoint Surface Expression
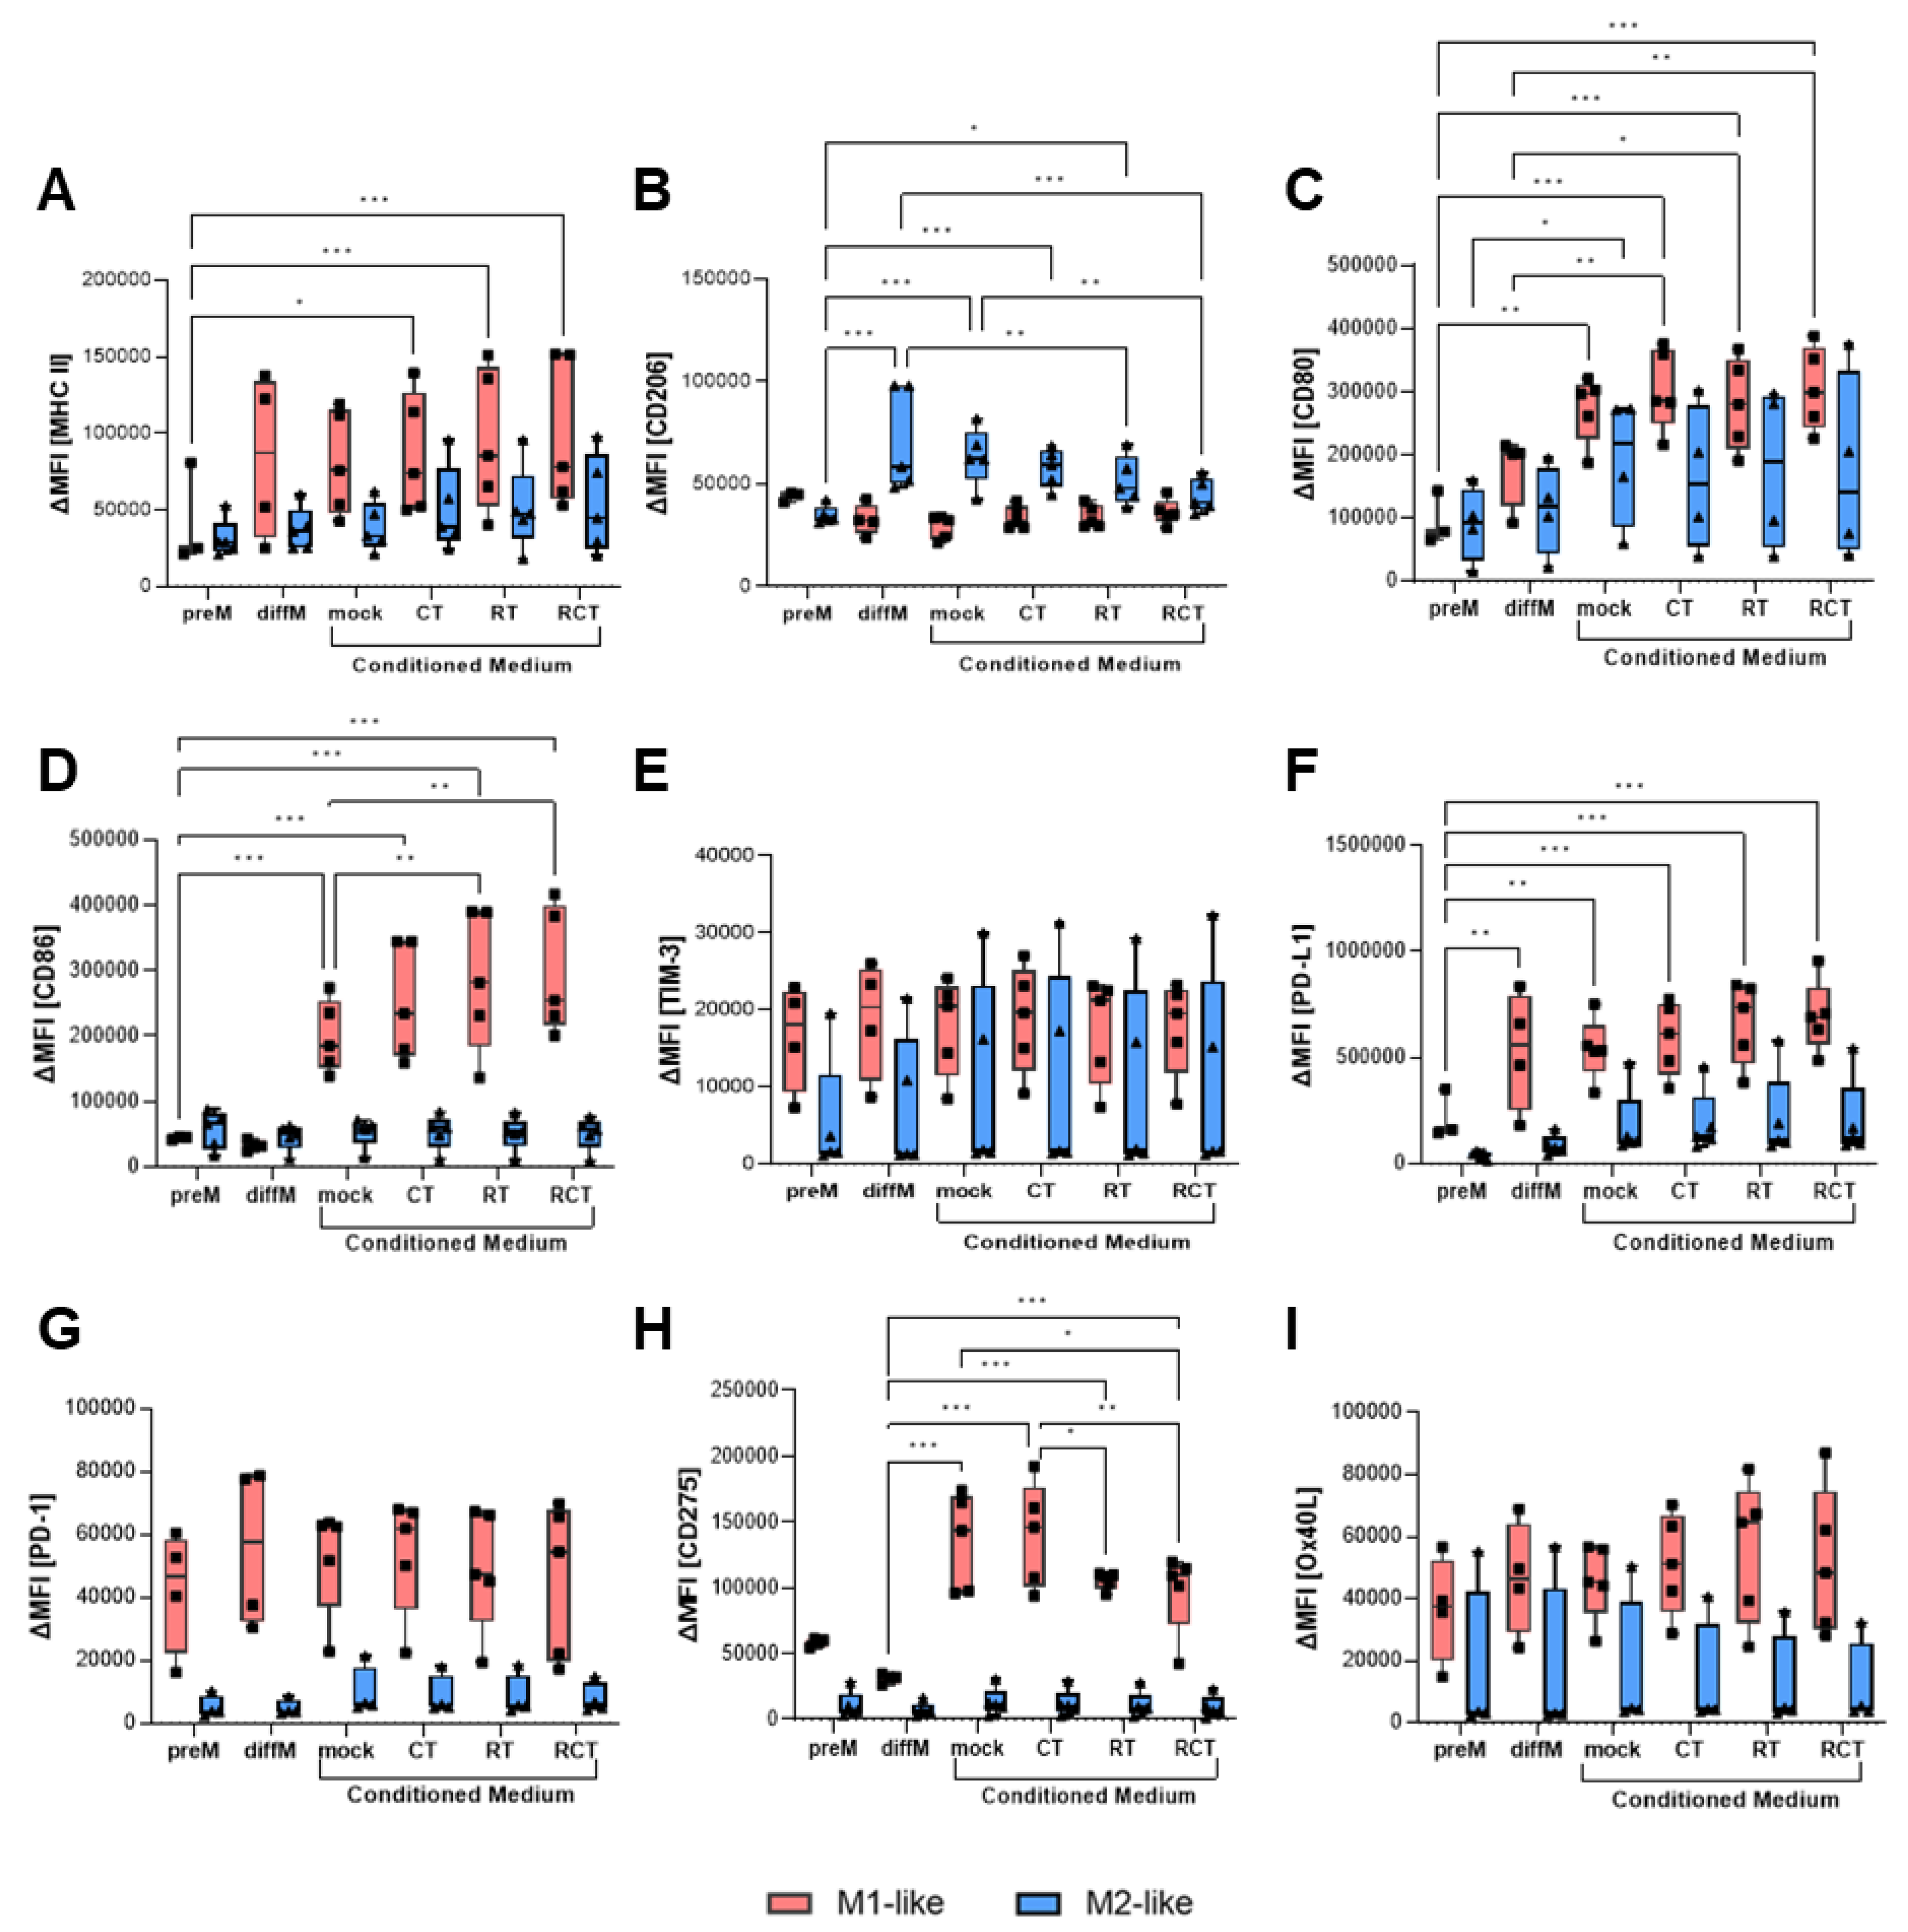
Thus far, our analyses have not revealed a substantial influence of glioblastoma treatment on macrophage activation, immune checkpoint expression, or phagocytosis. Since most of the tumor cells were taken up by the macrophages in less than two hours, these can be considered short-term effects. To evaluate how tumor treatment might affect the surrounding TME, especially its TAMs, long-term, we performed conditioned medium assays. Therefore, we treated GL261-luc2 glioblastoma cells over five consecutive days with different conditions, as described above, with an additional 24h incubation time. The supernatant was then collected and added to polarized M1- and M2-like macrophages. After another 24h, the macrophages were collected, and differentiation, activation, and immune checkpoint marker expression were evaluated via flow cytometry. MHC II expression on M1-like cells was significantly increased when the conditioned medium from treated glioblastoma cells was added, with the most prominent effect occurring after chemoradiation (Figure 3A). As expected, the mannose receptor CD206, a marker that identifies M2-like cells, was expressed at significantly higher levels on polarized M2-like cells than on M1-like cells. Interestingly, incubation with conditioned medium from treated tumor cells significantly reduced CD206 surface expression, shifting it to the level observed in M1-like cells (Figure 3B). Prominent alterations could be observed regarding the costimulatory molecules CD80 and CD86. CD80 expression on M1-like macrophages was induced by tumor cell medium itself, regardless of treatment conditions. For M2-like cells, only a tendency toward increased expression due to treatment conditions was detected (Figure 3C). Induction of CD86 on M1-like cells was even stronger and could be enhanced by RT or combination treatment. No alterations were measured on M2-like cells (Figure 3D).
Next, we analyzed the impact of the microenvironment of treated tumor cells on the surface expression of immune checkpoint molecules. Neither mock tumor nor treated tumor cell medium influenced TIM-3 and OX40L expression (Figure 3E,I). PD-1 receptor expression was higher expressed on M1-like than on M2-like cells, though no modifications were found depending on the treatment condition of tumor cells (Figure 3G). In contrast, PD-L1 ligand expression was significantly higher on M1-polarized macrophages and increased further when tumor cells underwent treatment, especially irradiation (Figure 3F). M2-like cells expressed PD-L1 at lower levels than M1-like cells and showed only slight increases with tumor treatment. Further, expression of CD275 is strongly induced on M1-like macrophages by conditioned tumor cell medium (Figure 3H). Interestingly, irradiation of tumor cells (RT and RCT) significantly reduces this, albeit the expression levels remain high. By contrast, the expression of CD275 on M2-like cells was not affected by the conditioned medium.
3. Discussion
Under physiological conditions, microglia are the primary immune cells responsible for surveillance within the brain. In malignancies, up to half of the tumor tissue consists of microglia and macrophages [29]. Macrophages are a heterogeneous cell type with two main subtypes: M1 and M2. These two subtypes exhibit a range of activation patterns. M1 macrophages are considered pro-inflammatory and function to remove bacteria and injured cells. In the context of tumors, they are considered anti-tumorigenic. In contrast, M2 cells promote tissue repair and are often described as pro-tumorigenic due to tumor proliferation [19,30].
Within gliomas, TAMs can acquire both phenotypes, even though their effector function is mostly suppressive [31], which is one reason why they are often regarded as M2. This results from the immunosuppressive environment created by the tumor, which modifies the attracted macrophages to support tumor growth and keep immunosuppression [32,33]. Targeting chemotaxis pathways to attenuate TAM infiltration into glioblastomas is under current investigation [34]. A study from 2014 investigated the correlation between macrophage subtype and glioma grade, where a lower expression of M1-type and a higher expression level of M2-type macrophages were associated with high-grade glioma [35]. These and other studies demonstrate the presence and correlation of both TAM subtypes (and perhaps others) within glioma tissue and grade. This information provides insight into the prevailing conditions of the suppressive TME that modulates infiltrating TAMs, and vice versa.
Investigations to date have focused on the infiltration and distribution of TAMs in tumor tissue and strategies for targeting these cells. However, one must consider that tumor cell treatment not only impacts the phenotype of the tumor cells and their TME, but also modifies infiltrating immune cells. The standard of care for GBM is a combination of CT (TMZ) with fractionated RT. The impact of TMZ seems to vary depending on the context: A working model for TMZ was proposed in which TMZ-treated GBM cells activate secretory autophagy, releasing HMGB1. This, in turn, promotes the polarization of TAMs toward the M1 phenotype [36]. In another study, TMZ increased the size of tumor spheres and induced polarization toward M2 [37]. Also, the resistance against TMZ of GBM might result from M2-type TAMs [38]. It appears that these observations contradict each other. One explanation might be that even supposedly small changes in the treatment regimen have a major impact on the immunogenic phenotype of the tumor. The same applies to the impact of irradiation. RT in a head and neck squamous cell carcinoma (HNSCC) model increased the polarization of both M1 and M2, but shifted towards an immunosuppressive phenotype [39]. Irradiation of lung tumor cells led to the secretion of exosomes that activated macrophages and M2 polarization [40]. A systematic review analyzed 29 summary articles regarding the role of M1 and M2 macrophages in response to the radiation dose: high-dose irradiation (classified as more than 10 Gy) resulted in more angiogenesis and tumor growth through early M2-polarized TAMs, whereas moderate-dose irradiation (between 1 and 10 Gy applied) stimulated phagocytosis [41]. Low doses (2 Gy) appeared to promote an M1 phenotype [42].
With these changes in mind, we analyzed the impact of a patient-oriented treatment scheme to establish more clinically relevant results. First, we detected no significant alteration in the activation or differentiation of pre-polarized macrophages after tumor cell contact, regardless of the treatment (Figure 1). This was true for both M1- and M2-like cells. Second, blocking PD-1 had no impact. Anti-PD-1 treatment also did not influence the phagocytosis of treated tumor cells (Figure 2). Other studies have revealed the role of PD-1 on myeloid cells. For example, Gordon et al., found a negative correlation between PD-1 expression on TAMs and phagocytic potency in a CT26 colon carcinoma model [13]. In that study, blocking the PD-1/PD-L1 axis increased the macrophage phagocytosis, reduced tumor growth, and increased survival. However, this could not be observed in our in vitro glioblastoma cell studies. This suggests a subordinate role of the PD-1/PD-L1 interaction in GBM, particularly concerning the function of TAMs. It is most likely that one or more other immunosuppressive factors cover or prevent the activation of PD-1 signaling in glioblastoma TAMs. Additionally, the phagocytosis rate of M1 is supposed to be higher than that of M2 and is thought to promote anti-tumor immunity [43]. Although the phagocytic range is rather broad, we observed a higher phagocytosis rate of M2- than M1-like cells (Figure 2A,B). Presumably, these differences result from deviations in the protocol of macrophage polarization, such as cytokine selection, dose, and incubation time. Further, the kind of tumor cell treatment influenced the uptake by M1-like, but not M2-like macrophages (Figure 2). Temozolomide (CT) treatment enhanced the phagocytosis rate, whereas the combination with RT significantly reduced it. These results indicate a treatment-dependent impact of macrophage phagocytosis that needs to be investigated for its biological relevance in vivo. Additionally, this assay only detects phagocytosis and does not analyze successful antigen presentation. Further research is needed to address this issue.
Most interestingly, we discovered that the activation, differentiation, and immunogenicity status of M1 and M2 macrophage is impacted by conditioned tumor medium (Figure 3). The most significant influence was observed for M1-like macrophages, for which tumor cell medium alone strongly induced the expression of the costimulatory molecules CD80 and CD86, as well as MHC II. This effect was further enhanced by treatment; RT and RCT had the greatest impact. The changes in immune checkpoint expression of PD-L1 and CD275 were similar. Overall, these alterations indicate tumor cell and treatment-dependent activation of M1-like macrophages, which could be beneficial for glioblastoma therapy. However, the prominent induction of ICOS-L could be controversial. Upregulation of ICOSLG (in mesenchymal glioma stem cells) in GBM tissue was associated with poor prognosis in patients [44]. In this study, the expression of ICOS-L mediated the expansion of Tregs and IL-10 production, thereby fostering an immunosuppressive environment.
In contrast, the regulatory impact of tumor cells, either alone or depending on their treatment, on M2-like macrophage activation, which most likely mimics TAMs, was rather small, with a significant induction of CD80. Interestingly, we detected a significant downregulation of CD206 in polarized M2-like macrophages after RT alone or the combination of RCT. This could give a hint towards a shift from M2-like to M1-like macrophages.
Taken together, the association of M1-like and M2-like macrophages with pro- and anti-tumorigenic responses to glioblastoma is highly context-dependent. Its polarization state is not fixed and is influenced by its environment and vice versa. Further increasing this complexity is the fact that treatment, especially chemoradiation, impacts macrophage polarization and phagocytosis. This has to be investigated further to evaluate real (TAM) targets for successfully combining standard and novel anti-glioblastoma therapies.
4. Materials and Methods
4.1. Cell Line Culture and Treatment of Glioblastoma Cells
The murine glioblastoma cell line GL261-luc2 (Caliper LifeSciences) was used in all experiments as model system. The cell line was cultured in a humidified chamber at 37°C and 5% CO2 in Dulbecco's Modified Eagle Medium (DMEM, Gibco™) supplemented with 10% heat-inactivated fetal calf serum (FCS, Sigma-Aldrich) and 0.5% geneticin (GibcoTM). For long-term culture, cells were harvested at approximately 80-90 % confluence and passaged in a 1 to 10 ratio in fresh medium, and reseeded into culture flasks. To analyze treatment-related effects, GL261-luc2 cells were seeded in T75 cell culture flasks and incubated overnight. The cells were then treated for five consecutive days with either chemotherapy (temozolomide, TMZ) (Sigma-Aldrich), fractionated radiotherapy (RT, 5x2Gy), chemoradiotherapy (combined RCT, chemoradiation), or left untreated as a negative control, depending on their condition. Cells were harvested 24 hours after the last treatment and used for further analysis.
4.2. Animals
C57BL/6 mice were used for macrophage isolation and differentiation. The mice were purchased from JANVIER LABS at an age of six to eight weeks and maintained under sterile conditions at the Preclinical Laboratory Animal Facility (PETZ) of the University of Erlangen-Nuremberg. Only male mice were used in all experiments. All experiments were approved by the local ethics committee.
4.3. Generation of M1-Like and M2-Like Macrophages
All macrophages were bone marrow-derived monocytic progenitors. Briefly, femora and tibia of C57BL/6 mice were prepared, joints were cut, and bone marrow was washed from the bones with macrophage medium (MC medium; DMEM (GibcoTM) supplemented with 10% FCS (Sigma-Aldrich), 5% horse serum (X), 1% penicillin/streptomycin and 50µM β-mercaptoethanol (both GibcoTM)) via a 27G syringe. A single cell suspension was prepared by gently pipetting cell aggregates. Bone marrow cells were seeded into a petri dish and incubated overnight in a humidified chamber at 37°C and 5%CO2. Then, cells were collected, cell number determined and seeded at a of 1,5-2*106 cells/2 ml MC medium per well. For differentiation of monocytes into M1-like macrophages, cells were stimulated with 4 ng/ml rmGM-CSF (recombinant murine Granulocyte-Macrophage Colony Stimulating Factor) (Miltenyi), for differentiation into M2 macrophages 5ng/ml rmM-CSF (recombinant murine Macrophage Colony Stimulating Factor) (Miltenyi). Three day later 0.5mL of MC medium supplemented with fresh cytokines was added. On day seven, the supernatant from the pre-stimulated macrophages was discarded and fresh MC medium including the respective cytokine cocktail was added: 4ng/ml rmGM-CSF, 1µg/ml LPS (lipopolysaccharide) and 20ng/ml rmIFN-γ (ImmunoTools) were used to polarize M1-like macrophages; 5ng/ml M-CSF (Miltenyi) and 20ng/ml rmIL-4 (recombinant murine interleukin 4) (ImmunoTools) were used to polarize M2-like macrophages.
4.4. Conditioned Medium Assay of M1-Like and M2-Like Macrophages
One day after polarization, the conditioned medium assay of M1-like and M2-like macrophages was prepared. For this, the cell culture supernatant was collected from the differentially treated GL261-luc2 cells, and 1 ml of conditioned medium was added to the corresponding assay wells of either M1- or M2-like macrophages. The conditioned medium assay was incubated in a humidified chamber at 37°C and 5% CO2 for 24 to 48 hours. Polarized macrophages were then washed with ice-cold phosphate-buffered saline (PBS, GibcoTM), detached by accutase treatment (GibcoTM) (first at 37°C, then at 4°C), harvested, and transferred to a canonical tube for flow cytometric analysis.
4.5. Phagocytosis Assay
For the phagocytosis assay of glioblastoma cells by M1- and M2-like macrophages, first, treated tumor cells were harvested by trypsinization, collected, and centrifuged. The cell number was determined, and the cell concentration was adjusted to 1x10⁶ cells/ml in TC medium. Subsequently, 3.5 µl of labeling solution (Cell Brite® Green, Biotium) was added per ml of medium, the cell suspension was vortexed briefly and incubated at 37°C for 30 min.. Stained tumor cells were washed three times by centrifugation and resuspension in TC medium, and finally resuspended in MC medium at a density of 2*106 tumor cells/ml. In a second step, the supernatant was removed from the polarized macrophages, the cells were washed with ice-cold PBS, and detached by accutase treatment at 4°C. The number of cells was determined and adjusted to 1x10⁶ cells/ml. Next, the phagocytosis assay was set up by adding 1 ml of the macrophage cell suspension to the corresponding treated tumor cell suspension. The assay was incubated for one hour in a humidified chamber at 37°C and 5% CO2. To stop cellular activity, the assay plates were then placed on ice, and cells were harvested by transferring supernatant as well as cells into a corresponding tube. To collect cells already attached to the plates, they were washed with PBS, gently removed with a cell scraper, and combined with the cells and supernatant from the appropriate wells. Cells were analyzed by flow cytometric analysis.
4.6. Flow Cytometric Analyses
Cells harvested from conditioned medium and phagocytosis assays were washed with cold FACS buffer (PBS containing 10% FCS and 2%NaN3) and centrifuged. The cell pellet was resuspended in Fc blocking buffer (FACS buffer with anti-CD16/32 antibody), incubated at 4°C for 30 min, and centrifuged. Cells were then stained with different multicolor staining panels. For M1/M2 differentiation and phagocytosis: anti-CD11b, anti-CD206, and ZOMBIE NIR (viability dye) (BioLegend); anti-F4/80, anti-MHCII and anti-CD274 (ThermoFisher Scientific); anti-CD80 and anti-CD11c (BD Biosciences); anti-CD86 (Miltenyi Biotec). For M1/M2 activation: anti-Ox40L, anti-TIM-3 and anti-PD-1 (ThermoFisher Scientific); anti-CD275 and ZOMBIE NIR (BioLegend); anti-CD11c (BD Biosciences). Flow cytometry was performed using a CytoFlex and a DxFlex cytometer (Beckmann Coulter Life Sciences). Data analyses were done using Kaluza (2.1). The ∆MFI (MFI of target-of-interest minus background fluorescence) was calculated.
4.7. Statistical Analysis
Statistical analyses were performed using GraphPad Prism 8. Data were tested for statistical significance using a Two-Way ANOVA or Mixed Effects Model with Tukey or Bonferroni correction for multiple comparisons. A fitting mixed-effects analysis was used when values were missing. P values were set as follows: 0.12 (ns), 0.033 (*), 0.002 (**), <0.001 (***).
Author Contributions
Conceptualization, A.D. and US.G.; methodology, M.S. and A.D.; software, M.S. and A.D; validation, M.S., B.F., US.G. and A.D.; formal analysis, investigation and visualization, M.S. and A.D; resources, R.F., US.G. and A.D.; writing—original draft preparation, A.D.; writing—review and editing, M.S., B.F., US.G. and A.D.; supervision and project administration, US.G. and A.D.; funding acquisition, A.D. All authors have read and agreed to the published version of the manuscript.
Funding
This research was funded by the Deutsche Forschungsgemeinschaft (DFG, German Research Foundation, grant number DE 2503/2-1).
Institutional Review Board Statement
The animal study protocol was approved by the local Ethics Committee of the Regierung of Unterfranken (protocol code 55.2.2-2532-2-1650).
Data Availability Statement
All data sets and statistical analyses generated and used in this study are available upon request.
Acknowledgments
The authors would like to thank the DFG for funding this project. The authors declare that they did not use AI-generated work in this manuscript.
Conflicts of Interest
The authors declare no conflicts of interest.
Abbreviations
The following abbreviations are used in this manuscript:
| BBB | blood brain barrier |
| C57BL/6 | wildtype mouse strain |
| CD | cluster of differentiation |
| CNS | central nervous system |
| CT | chemotherapy |
| CTLA4 | Cytotoxic T Lymphocyte Antigen 4 |
| DC | dendritic cell |
| GBM | glioblastoma multiforme |
| ICOS-L | Inducible costimulator-ligand |
| IFN-γ | interferon-gamma |
| LPS | lipopolysaccharide |
| MDSC | myeloid-derived suppressor cell |
| MFI | mean fluorescence intensity |
| MHC II | Major Histocompatibility Complex II |
| OS | overall survival |
| OX40L | CD252 |
| PD-1 | Programmed Cell Death Protein 1 |
| PD-L1 | Programmed Cell Death Protein Ligand 1 |
| PFS | progression-free survival |
| RCT | combination of RT and CT/ chemoradiation |
| RT | radiotherapy |
| TAM | tumor-associated macrophage |
| TIM-3 | T cell immunoglobulin and mucin-domain containing-3 |
| TME | tumor microenvironment |
| TMZ | temozolomide |
| Treg | regulatory T cell |
References
- Politis, A.; Stavrinou, L.; Kalyvas, A.; Boviatsis, E.; Piperi, C. Glioblastoma: molecular features, emerging molecular targets and novel therapeutic strategies. Crit Rev Oncol Hematol 2025, 104764. [Google Scholar] [CrossRef]
- Waterhouse, P.; Penninger, J.M.; Timms, E.; Wakeham, A.; Shahinian, A.; Lee, K.P.; Thompson, C.B.; Griesser, H.; Mak, T.W. Lymphoproliferative disorders with early lethality in mice deficient in Ctla-4. Science 1995, 270, 985–988. [Google Scholar] [CrossRef]
- Derer, A.; Spiljar, M.; Baumler, M.; Hecht, M.; Fietkau, R.; Frey, B.; Gaipl, U.S. Chemoradiation Increases PD-L1 Expression in Certain Melanoma and Glioblastoma Cells. Front Immunol 2016, 7, 610. [Google Scholar] [CrossRef] [PubMed]
- Schatz, J.; Ladinig, A.; Fietkau, R.; Putz, F.; Gaipl, U.S.; Frey, B.; Derer, A. Normofractionated irradiation and not temozolomide modulates the immunogenic and oncogenic phenotype of human glioblastoma cell lines. Strahlenther Onkol 2023, 199, 1140–1151. [Google Scholar] [CrossRef] [PubMed]
- Bhardwaj, J.S.; Paliwal, S.; Singhvi, G.; Taliyan, R. Immunological challenges and opportunities in glioblastoma multiforme: A comprehensive view from immune system lens. Life Sci 2024, 357, 123089. [Google Scholar] [CrossRef]
- Chen, Z.; Feng, X.; Herting, C.J.; Garcia, V.A.; Nie, K.; Pong, W.W.; Rasmussen, R.; Dwivedi, B.; Seby, S.; Wolf, S.A.; et al. Cellular and Molecular Identity of Tumor-Associated Macrophages in Glioblastoma. Cancer Res 2017, 77, 2266–2278. [Google Scholar] [CrossRef]
- Cai, X.; Beumer-Chuwonpad, A.; Westerman, B.; Garcia Vallejo, J. P02.05.A COMPREHENSIVE ANALYSIS OF TUMOR-ASSOCIATED MACROPHAGES IN GLIOBLASTOMA. Neuro-Oncology 2024, 26, v35–v35. [Google Scholar] [CrossRef]
- Kvisten, M.; Mikkelsen, V.E.; Stensjoen, A.L.; Solheim, O.; Van Der Want, J.; Torp, S.H. Microglia and macrophages in human glioblastomas: A morphological and immunohistochemical study. Mol Clin Oncol 2019, 11, 31–36. [Google Scholar] [CrossRef] [PubMed]
- Qian, B.Z.; Pollard, J.W. Macrophage diversity enhances tumor progression and metastasis. Cell 2010, 141, 39–51. [Google Scholar] [CrossRef]
- Guo, Q.; Jin, Z.; Yuan, Y.; Liu, R.; Xu, T.; Wei, H.; Xu, X.; He, S.; Chen, S.; Shi, Z.; et al. Corrigendum to "New Mechanisms of Tumor-Associated Macrophages on Promoting Tumor Progression: Recent Research Advances and Potential Targets for Tumor Immunotherapy". J Immunol Res 2018, 2018, 6728474. [Google Scholar] [CrossRef]
- Lecoultre, M.; Dutoit, V.; Walker, P.R. Phagocytic function of tumor-associated macrophages as a key determinant of tumor progression control: a review. J Immunother Cancer 2020, 8. [Google Scholar] [CrossRef]
- Boutilier, A.J.; Elsawa, S.F. Macrophage Polarization States in the Tumor Microenvironment. Int J Mol Sci 2021, 22. [Google Scholar] [CrossRef]
- Gordon, S.R.; Maute, R.L.; Dulken, B.W.; Hutter, G.; George, B.M.; McCracken, M.N.; Gupta, R.; Tsai, J.M.; Sinha, R.; Corey, D.; et al. PD-1 expression by tumour-associated macrophages inhibits phagocytosis and tumour immunity. Nature 2017, 545, 495–499. [Google Scholar] [CrossRef]
- Lim, T.S.; Chew, V.; Sieow, J.L.; Goh, S.; Yeong, J.P.; Soon, A.L.; Ricciardi-Castagnoli, P. PD-1 expression on dendritic cells suppresses CD8(+) T cell function and antitumor immunity. Oncoimmunology 2016, 5, e1085146. [Google Scholar] [CrossRef]
- Xu, S.; Wang, C.; Yang, L.; Wu, J.; Li, M.; Xiao, P.; Xu, Z.; Xu, Y.; Wang, K. Targeting immune checkpoints on tumor-associated macrophages in tumor immunotherapy. Front Immunol 2023, 14, 1199631. [Google Scholar] [CrossRef]
- Hagemann, T.; Lawrence, T.; McNeish, I.; Charles, K.A.; Kulbe, H.; Thompson, R.G.; Robinson, S.C.; Balkwill, F.R. "Re-educating" tumor-associated macrophages by targeting NF-kappaB. J Exp Med 2008, 205, 1261–1268. [Google Scholar] [CrossRef] [PubMed]
- Cutolo, M.; Campitiello, R.; Gotelli, E.; Soldano, S. The Role of M1/M2 Macrophage Polarization in Rheumatoid Arthritis Synovitis. Front Immunol 2022, 13, 867260. [Google Scholar] [CrossRef] [PubMed]
- Melichar, B.; Nash, M.A.; Lenzi, R.; Platsoucas, C.D.; Freedman, R.S. Expression of costimulatory molecules CD80 and CD86 and their receptors CD28, CTLA-4 on malignant ascites CD3+ tumour-infiltrating lymphocytes (TIL) from patients with ovarian and other types of peritoneal carcinomatosis. Clin Exp Immunol 2000, 119, 19–27. [Google Scholar] [CrossRef] [PubMed]
- Ahmed, M.H.; Hernández-Verdin, I.; Bielle, F.; Verreault, M.; Lerond, J.; Alentorn, A.; Sanson, M.; Idbaih, A. Expression and Prognostic Value of CD80 and CD86 in the Tumor Microenvironment of Newly Diagnosed Glioblastoma. Can J Neurol Sci 2023, 50, 234–242. [Google Scholar] [CrossRef]
- Gabrilo, J.; Velde, S.V.; Henin, C.; Denanglaire, S.; Azouz, A.; Boon, L.; Van den Eynde, B.J.; Moser, M.; Goriely, S.; Leo, O. Interferon-γ driven differentiation of monocytes into PD-L1+ and MHC II+ macrophages and the frequency of Tim-3+ tumor-reactive CD8+ T cells within the tumor microenvironment predict a positive response to anti-PD-1-based therapy in tumor-bearing mice. bioRxiv, 2024. [Google Scholar] [CrossRef]
- Palacios, L.M.; Peyret, V.; Viano, M.E.; Geysels, R.C.; Chocobar, Y.A.; Volpini, X.; Pellizas, C.G.; Nicola, J.P.; Motran, C.C.; Rodriguez-Galan, M.C.; et al. TIM3 Expression in Anaplastic-Thyroid-Cancer-Infiltrating Macrophages: An Emerging Immunotherapeutic Target. Biology (Basel) 2022, 11. [Google Scholar] [CrossRef]
- Katagata, M.; Okayama, H.; Nakajima, S.; Saito, K.; Sato, T.; Sakuma, M.; Fukai, S.; Endo, E.; Sakamoto, W.; Saito, M.; et al. TIM-3 Expression and M2 Polarization of Macrophages in the TGFbeta-Activated Tumor Microenvironment in Colorectal Cancer. Cancers (Basel) 2023, 15. [Google Scholar] [CrossRef]
- Zhang, Y.; Cai, P.; Liang, T.; Wang, L.; Hu, L. TIM-3 is a potential prognostic marker for patients with solid tumors: A systematic review and meta-analysis. Oncotarget 2017, 8, 31705–31713. [Google Scholar] [CrossRef]
- Qin, S.; Dong, B.; Yi, M.; Chu, Q.; Wu, K. Prognostic Values of TIM-3 Expression in Patients With Solid Tumors: A Meta-Analysis and Database Evaluation. Front Oncol 2020, 10, 1288. [Google Scholar] [CrossRef] [PubMed]
- Solinas, C.; Gu-Trantien, C.; Willard-Gallo, K. The rationale behind targeting the ICOS-ICOS ligand costimulatory pathway in cancer immunotherapy. ESMO Open 2020, 5. [Google Scholar] [CrossRef]
- Wang, J.; Shi, F.; Shan, A. Transcriptome profile and clinical characterization of ICOS expression in gliomas. Front Oncol 2022, 12, 946967. [Google Scholar] [CrossRef]
- Leibowitz-Amit, R.; Feldman, S.; Daana, B.; Elkis, L.; Mendelovic, S.; Avraham, A. 188P Expression of the co-stimulatory checkpoint protein OX40L (TNFSF4) in the melanoma micro-environment. Immuno-Oncology and Technology 2023, 20, 100647. [Google Scholar] [CrossRef]
- Shibahara, I.; Saito, R.; Zhang, R.; Chonan, M.; Shoji, T.; Kanamori, M.; Sonoda, Y.; Kumabe, T.; Kanehira, M.; Kikuchi, T.; et al. OX40 ligand expressed in glioblastoma modulates adaptive immunity depending on the microenvironment: a clue for successful immunotherapy. Molecular Cancer 2015, 14, 41. [Google Scholar] [CrossRef]
- Badie, B.; Schartner, J.M. Flow cytometric characterization of tumor-associated macrophages in experimental gliomas. Neurosurgery 2000, 46, 957–961; discussion 961-952. [Google Scholar] [CrossRef]
- Gordon, S. Alternative activation of macrophages. Nat Rev Immunol 2003, 3, 23–35. [Google Scholar] [CrossRef]
- da Fonseca, A.C.; Badie, B. Microglia and macrophages in malignant gliomas: recent discoveries and implications for promising therapies. Clin Dev Immunol 2013, 2013, 264124. [Google Scholar] [CrossRef]
- Charles, N.A.; Holland, E.C.; Gilbertson, R.; Glass, R.; Kettenmann, H. The brain tumor microenvironment. Glia 2012, 60, 502–514. [Google Scholar] [CrossRef]
- Komohara, Y.; Ohnishi, K.; Kuratsu, J.; Takeya, M. Possible involvement of the M2 anti-inflammatory macrophage phenotype in growth of human gliomas. J Pathol 2008, 216, 15–24. [Google Scholar] [CrossRef]
- Lee, C.; Lee, J.; Jeong, M.; Nam, D.; Rhee, I. Emerging strategies for targeting tumor-associated macrophages in glioblastoma: A focus on chemotaxis blockade. Life Sci 2025, 376, 123762. [Google Scholar] [CrossRef]
- Ding, P.; Wang, W.; Wang, J.; Yang, Z.; Xue, L. Expression of tumor-associated macrophage in progression of human glioma. Cell Biochem Biophys 2014, 70, 1625–1631. [Google Scholar] [CrossRef]
- Li, Z.; Fu, W.J.; Chen, X.Q.; Wang, S.; Deng, R.S.; Tang, X.P.; Yang, K.D.; Niu, Q.; Zhou, H.; Li, Q.R.; et al. Autophagy-based unconventional secretion of HMGB1 in glioblastoma promotes chemosensitivity to temozolomide through macrophage M1-like polarization. J Exp Clin Cancer Res 2022, 41, 74. [Google Scholar] [CrossRef]
- Lombardi, F.; Augello, F.R.; Artone, S.; Ciafarone, A.; Topi, S.; Cifone, M.G.; Cinque, B.; Palumbo, P. Involvement of Cyclooxygenase-2 in Establishing an Immunosuppressive Microenvironment in Tumorspheres Derived from TMZ-Resistant Glioblastoma Cell Lines and Primary Cultures. Cells 2024, 13. [Google Scholar] [CrossRef]
- Zhang, G.; Tao, X.; Ji, B.; Gong, J. Hypoxia-Driven M2-Polarized Macrophages Facilitate Cancer Aggressiveness and Temozolomide Resistance in Glioblastoma. Oxid Med Cell Longev 2022, 2022, 1614336. [Google Scholar] [CrossRef]
- Meng, W.; Li, L.; Hao, Y.; Tang, M.; Cao, C.; He, J.; Wang, L.; Cao, B.; Zhang, Y.; Li, L.; et al. NAD+ Metabolism Reprogramming Mediates Irradiation-Induced Immunosuppressive Polarization of Macrophages. Int J Radiat Oncol Biol Phys 2025, 121, 176–190. [Google Scholar] [CrossRef]
- Chen, X.; Wang, L.; Yu, H.; Shen, Q.; Hou, Y.; Xia, Y.X.; Li, L.; Chang, L.; Li, W.H. Irradiated lung cancer cell-derived exosomes modulate macrophage polarization by inhibiting MID1 via miR-4655-5p. Mol Immunol 2023, 155, 58–68. [Google Scholar] [CrossRef]
- Becherini, C.; Lancia, A.; Detti, B.; Lucidi, S.; Scartoni, D.; Ingrosso, G.; Carnevale, M.G.; Roghi, M.; Bertini, N.; Orsatti, C.; et al. Modulation of tumor-associated macrophage activity with radiation therapy: a systematic review. Strahlenther Onkol 2023, 199, 1173–1190. [Google Scholar] [CrossRef] [PubMed]
- Prakash, H.; Klug, F.; Nadella, V.; Mazumdar, V.; Schmitz-Winnenthal, H.; Umansky, L. Low doses of gamma irradiation potentially modifies immunosuppressive tumor microenvironment by retuning tumor-associated macrophages: lesson from insulinoma. Carcinogenesis 2016, 37, 301–313. [Google Scholar] [CrossRef]
- Zhang, M.; Hutter, G.; Kahn, S.A.; Azad, T.D.; Gholamin, S.; Xu, C.Y.; Liu, J.; Achrol, A.S.; Richard, C.; Sommerkamp, P.; et al. Anti-CD47 Treatment Stimulates Phagocytosis of Glioblastoma by M1 and M2 Polarized Macrophages and Promotes M1 Polarized Macrophages In Vivo. PLOS ONE 2016, 11, e0153550. [Google Scholar] [CrossRef]
- Iwata, R.; Hyoung Lee, J.; Hayashi, M.; Dianzani, U.; Ofune, K.; Maruyama, M.; Oe, S.; Ito, T.; Hashiba, T.; Yoshimura, K.; et al. ICOSLG-mediated regulatory T-cell expansion and IL-10 production promote progression of glioblastoma. Neuro Oncol 2020, 22, 333–344. [Google Scholar] [CrossRef]
Figure 1.
Surface expression of activation and immune checkpoint molecules on M1-like (red and dark grey columns) and M2-like (blue and light grey columns) macrophages after co-culture with treated glioblastoma cells. GL261-luc2 glioblastoma cells were treated with temozolomide (CT), irradiation (RT), the combination (RCT), or left untreated (mock). Bone marrow-derived murine myeloid cells were differentiated and polarized towards M1-like and M2-like macrophages and then co-cultured with treated tumor cells. The surface expression of (A) MHCII, (B) CD11b, (C) CD206, (D) CD80, (E) CD86, (F) TIM-3, (G) PD-L1, (H) PD-1, (I) CD275, and (J) OX40L were analyzed via flow cytometry. In addition, anti-PD1 (light and dark grey columns) and anti-IgG2a as isotype control (red and blue columns) were added. Normalized data are shown for better comparability. Data from five independent experiments are shown as Mean ±SEM. Statistical analysis was done with 2way ANOVA with Tukey correction for multiple comparisons.
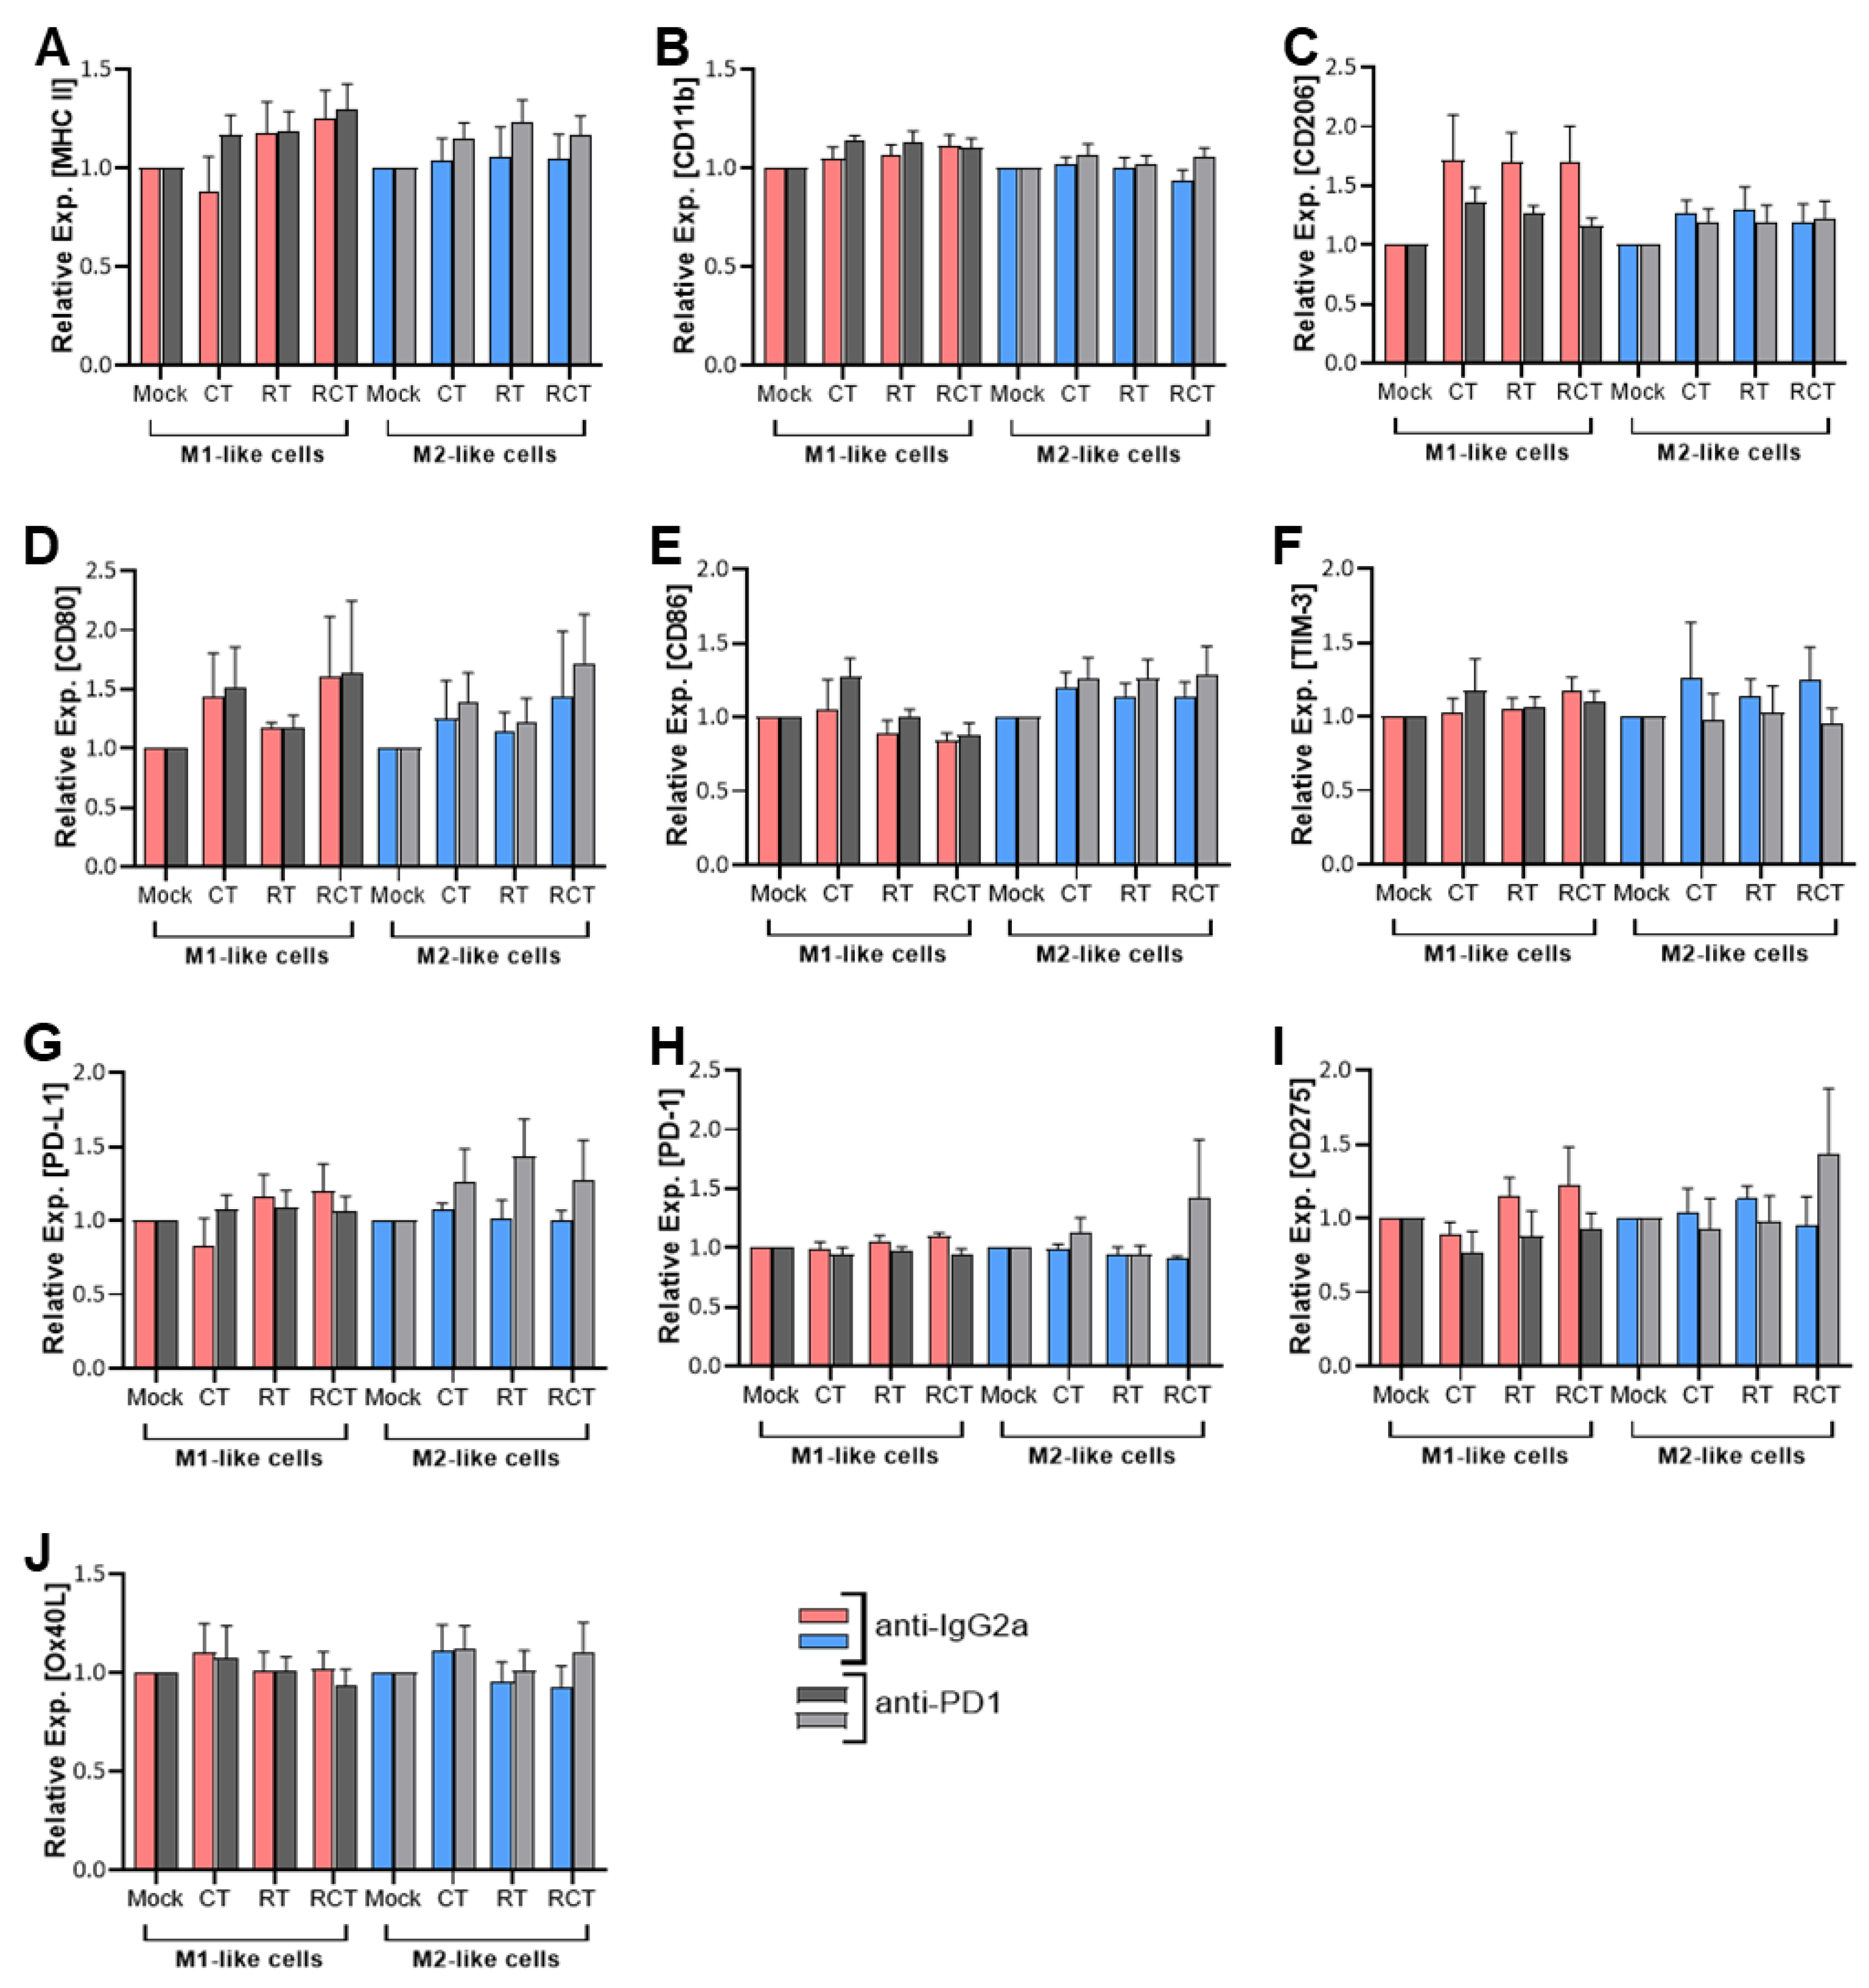
Figure 2.
Phagocytosis of GL261-luc2 glioblastoma cells by M1-like (A) and M2-like (B) macrophages. Tumor cells were treated with temozolomide (CT), irradiation (RT), the combination (RCT), or left untreated (mock). Then, tumor cells were harvested and stained with CellBrite. Bone marrow-derived murine myeloid cells were differentiated and polarized towards either M1-like (A) or M2-like (B) macrophages. Phagocytosis assays were prepared. To determine the relevance of the PD-1/PD-L1 interaction, anti-PD-1 (light and dark grey columns) or anti-IgG2a as an isotype control (red and blue columns) were added. The phagocytosis rate was determined by the percentage of CellBrite-positive macrophages. Data are presented as Min to Max; Points represent independent experiments, for (A) n=5 and (B) n=4. Statistical analysis was done with 2-way ANOVA with Bonferroni correction for multiple comparisons, asterisks indicate significant differences as follows: ns: 0.12, *p<0.033, **p<0.002, ***p<0.001.
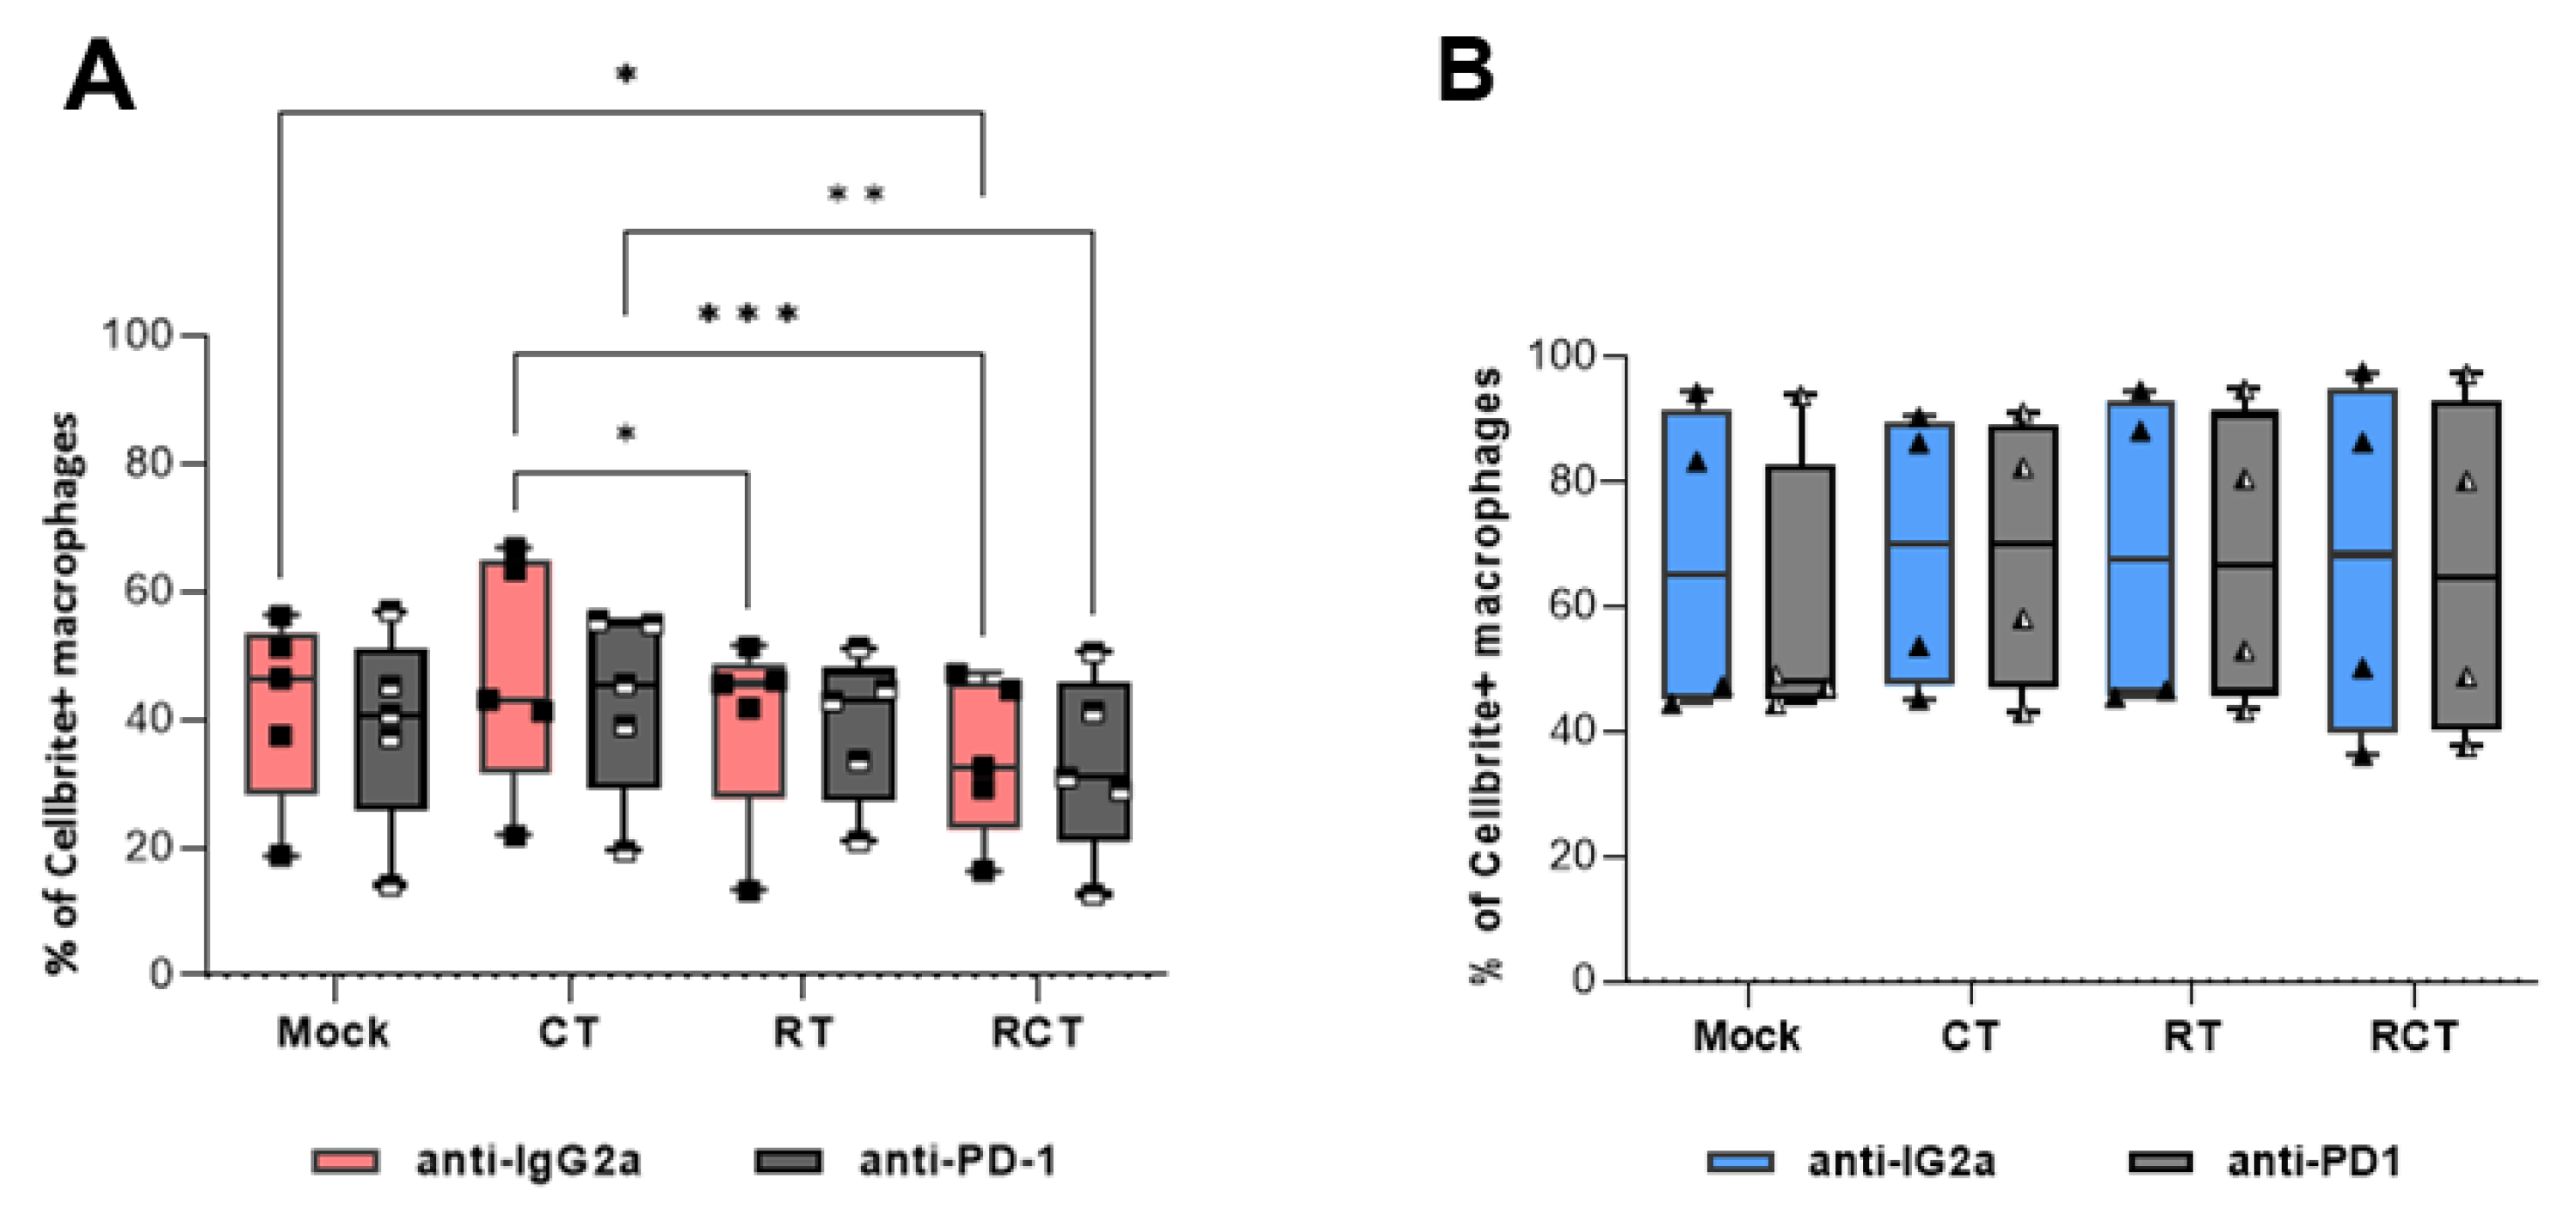
Figure 3.
Surface expression of activation and immune checkpoint molecules on M1-like (red boxes) and M2-like (blue boxes) macrophages after incubation with conditioned medium of treated glioblastoma cells. GL261-luc2 cells were treated with temozolomide (CT), irradiation (RT), the combination (RCT), or left untreated (mock), then the supernatant was collected. Bone marrow-derived murine myeloid cells were differentiated and polarized towards M1-like and M2-like macrophages, and incubated with tumor cell medium. The surface expression of (A) MHC II, (B) CD206, (C) CD80, (D) CD86, (E) TIM-3, (F) PD-L1, (G) PD-1, (H) CD275, and (I) OX40L was analyzed via flow cytometry. Data from five independent experiments are shown as Points. Statistical analysis was done with Mixed-effects analysis with Tukey correction for multiple comparisons. Asterisks indicate significant differences as follows: ns: 0.12, *p<0.033, **p<0.002, ***p<0.001.
Disclaimer/Publisher’s Note: The statements, opinions and data contained in all publications are solely those of the individual author(s) and contributor(s) and not of MDPI and/or the editor(s). MDPI and/or the editor(s) disclaim responsibility for any injury to people or property resulting from any ideas, methods, instructions or products referred to in the content. |
© 2025 by the authors. Licensee MDPI, Basel, Switzerland. This article is an open access article distributed under the terms and conditions of the Creative Commons Attribution (CC BY) license (http://creativecommons.org/licenses/by/4.0/).
Copyright: This open access article is published under a Creative Commons CC BY 4.0 license, which permit the free download, distribution, and reuse, provided that the author and preprint are cited in any reuse.


